Self-Service Data Science in Healthcare with Automated Machine Learning


Department of Information and Computing Sciences, Utrecht University, 3512 JE Utrecht, The Netherlands
*
Author to whom correspondence should be addressed.
Appl. Sci. 2020, 10(9), 2992; https://0-doi-org.brum.beds.ac.uk/10.3390/app10092992
Submission received: 3 March 2020
/
Revised: 20 April 2020
/
Accepted: 21 April 2020
/
Published: 25 April 2020
(This article belongs to the Special Issue Medical Artificial Intelligence)
Abstract
:(1) Background: This work investigates whether and how researcher-physicians can be supported in their knowledge discovery process by employing Automated Machine Learning (AutoML). (2) Methods: We take a design science research approach and select the Tree-based Pipeline Optimization Tool (TPOT) as the AutoML method based on a benchmark test and requirements from researcher-physicians. We then integrate TPOT into two artefacts: a web application and a notebook. We evaluate these artefacts with researcher-physicians to examine which approach suits researcher-physicians best. Both artefacts have a similar workflow, but different user interfaces because of a conflict in requirements. (3) Results: Artefact A, a web application, was perceived as better for uploading a dataset and comparing results. Artefact B, a Jupyter notebook, was perceived as better regarding the workflow and being in control of model construction. (4) Conclusions: Thus, a hybrid artefact would be best for researcher-physicians. However, both artefacts missed model explainability and an explanation of variable importance for their created models. Hence, deployment of AutoML technologies in healthcare remains currently limited to the exploratory data analysis phase.
1. Introduction
After reviewing the literature on the state of data analysis in healthcare, it becomes evident that there is still significant progress to be made in the application of analytics in healthcare [1,2]. One of the ways to progress, is the automation of the knowledge discovery process in healthcare [1]. Automation of the knowledge discovery process can increase the adoption of analytics by enabling domain experts to contribute to the knowledge discovery in the field using state-of the art techniques in adaptive analytic systems, especially with the amount of data that is available in healthcare. The introduction of the Electronic Health Record (EHR) accelerated the digitalisation of this formerly unavailable dataset. Combining this available EHR data with analytics provides great potential to improve the healthcare industry by making the data available for automatic processing [3].
The concept of self-service data science was first described in [4] and has been defined as “the engineering discipline in which analytic systems are designed and evaluated to empower domain professionals to perform their own data analyses on their own data sources without coding in a reliable, usable and transparent manner within their own daily practices” [5]. Figure 1 visualises self-service data science research in the context of adjacent data science research disciplines. Bridging purely foundational and purely applied research processes, both applied data science [6] and self-service data science studies pursue a translational (e.g., application-oriented) research process, often including CRISP-DM as the knowledge discovery process of choice [7].
The Machine Learning (ML) community has noticed the need to enable access for non-expert users to ML techniques. The need to enable non-experts to use machine learning is one of the drivers that gave birth to the fast-paced research area of AutoML [8,9]. The AutoML community aims to automate all steps in the process of creating a machine learning pipeline. However, to the best of our knowledge, no AutoML applications were tested in real-world situations with non-expert users in the healthcare domain. Hence our research question is: How can we support the knowledge discovery process of domain experts in healthcare using automated machine learning? To answer this question, we answer three sub-research questions in Section 4:
- Which AutoML method performs best on a benchmark test, given medical datasets?
- What are the requirements of healthcare professionals for starting to use AutoML in their daily practice?
- How does the selected AutoML method suit healthcare professionals in their knowledge discovery process?
Each question is answered in a subsection of Section 4.
2. Overview of AutoML Methods
In this section, we summarize and categorize the AutoML methods that we found during the literature review. In our analysis we only consider the newest versions of the methods and only include non-commercial AutoML methods. First, we compare two AutoML methods that are developed for the healthcare domain. Second, we discuss methods with a fixed pipeline length. Third, we discuss the AutoML methods that build neural nets. Fourth, we discuss evolutionary methods. Fifth, we discuss distributed methods. Finally, we provide a detailed overview of the AutoML methods discussed in this chapter.
2.1. Healthcare
FLASH [10] and AutoPrognosis [11] have both been developed for healthcare or with funds for healthcare, but with different incentives. FLASH was developed to improve the efficiency of creating and evaluating pipelines. It proposes a two-layer Bayesian Network approach to improve search efficiency. AutoPrognosis has recently been developed with the practitioner in mind. It follows a principled Bayesian approach in all components. AutoPrognosis uses Bayesian model averaging for pipeline construction. Meta-learning is used to find similar groups of patients. Both clinical and statistical features of datasets are used for Warm-starting. FLASH is a black-box tool, as most AutoML tools are. In contrast, AutoPrognosis is the only AutoML method that contains an explainer to justify its recommendations to a clinician.
We cannot compare the performances of both methods, as there is no benchmark test available featuring both methods at the time of writing. FLASH tested its performance on a medical dataset with the binary classification task of predicting drug non-responders. In this case, it outperformed other methods based on TPE and SMAC using error rate as the performance metric [10]. AutoPrognosis outperformed Auto-WEKA, Auto-Sklearn, and TPOT on multiple datasets in its own comparison with other methods [11].
2.2. Fixed Pipelines
Auto-WEKA [8,12], Hyperopt-Sklearn [13], Auto-Sklearn [14], PoSH Auto-Sklearn [15], and ML-Plan [16] are all methods that have a fixed pipeline length. Auto-WEKA searches the search space by a tree-based BO method: SMAC [8,17]. Hyperopt-Sklearn searches the search space is using Hyperopt, which makes use of either random search or Tree Parzen Estimators (TPE) with BO [18]. To improve efficiency in search, Hyperopt-Sklearn makes a distinction between conditional and non-conditional hyperparameters. Conditional parameters always need to be assigned, and non-conditional parameters depend on the chosen algorithm in the pipeline [13]. PoSH-Auto-Sklearn is an extension of Auto-Sklearn method described above and builds on the scikit-learn library. Successive halving was introduced in the search process to improve the efficiency of the method. In addition to this, they build a portfolio based on OpenML datasets [19], which contained meta-information to warm-start the search process. Finally, the ensemble technique of Auto-Sklearn was altered to exclude poor performing models. In PoSH Auto-Sklearn a model is not added to the ensemble if it performs over 3% worse than the best model. ML-plan uses a hybrid approach to construct pipelines. It combines the ideas and concepts from two different approaches: the idea of evaluating candidates at runtime [8] and the idea of using hierarchical task networks [20] for pipeline planning [16]. ML-Plan contributes to the existing knowledge base by proposing a two-phase search with HTN and a dedicated system to prevent overfitting. The authors of ML-Plan claim to have invented the first AutoML technique that prevents overfitting [16].
PoSH Auto-Sklearn outperforms all other methods as it is the winner of the latest AutoML competition at the time of writing [9]. Auto-WEKA, Hyperopt-Sklearn, and Auto-Sklearn were the first three methods that were developed to tackle the CASH problem. What is noteworthy to observe is that Auto-Sklearn has served as a basis for multiple other AutoML systems, whereas the other two methods have not. We assume that this is due to the warm-start procedure that is built into Auto-Sklearn.
2.3. Neural Networks
The first version of AutoNet [21] was the first to automate the configuration of a Neural Network. It laid the groundwork for its successor and the inception of AlphaD3M [22] and Auto-Keras [23]. Besides laying the groundwork for these applications, it incentivised the inception of a lot of commercial applications. Most commercial applications that automatically tune Neural Networks are inspired by the first version of Auto-Net [9]. This is because Auto-Net was the first AutoML program to beat human experts in configuring a pipeline [9,21].
AlphaD3M is the only AutoML method that makes use of reinforcement learning and is much faster than any other method in the field. In one case, it was 32 times faster than TPOT. However, AlphaD3M does not outperform other AutoML methods. In comparison with three other methods, its average rank is third, based on mean scores. As AlphaD3M ranks first on some datasets, it is still competitive [22]. It is striking to see if reinforcement learning gets widely adopted as a search strategy for pipeline configuration.
2.4. Evolutionary Methods
Evolutionary methods can create pipelines of flexible length. These are TPOT [24], LTPOT [25], RECIPE [26], and Autostacker [27]. They can do so due to their search strategy. The downside of evolutionary algorithms is that they can produce invalid pipelines and get stuck at local optima. RECIPE and LTPOT have independently overcome these downsides. RECIPE uses grammar to overcome this whereas LTPOT uses a maximum evaluation time for a pipeline.
TPOT was a reaction to the fixed-length pipeline methods discussed above. TPOT uses Gaussian Processes (GP) to construct pipelines; the building blocks of a pipeline are GP primitives to build a tree. These trees are an arbitrary representation of the ML pipeline, consisting of multiple datasets, pre-processors, and classification operators. Each node uses the output of its preceding node as input. Layered TPOT [25] is the successor of TPOT with a focus on improving the efficiency of the pipeline generation. It improves efficiency by implementing the idea of an Age Layered Population Structure [28] in addition to the original TPOT algorithm. RECIPE [26] is an evolutionary method based on GP that makes use of grammar to improve its efficiency compared to other GP methods. RECIPE uses grammar to prevent the creation of invalid pipelines and focusses on classification tasks. Autostacker is an AutoML method that focusses on providing a set of potential useful pipelines for users without any pre-processing steps based on the scikit-learn and the XGBoost library. Pipelines are built using a stacking mechanism based on an evolutionary algorithm and should generalize well to new data [27].
2.5. Distributed Methods
Two AutoML methods can process data in a distributed matter: Autostacker [27] and ATM [29]. It is remarkable, that there are only two systems that can run in a distributed manner, when taking the computing cost of creating a pipeline in mind. Autostacker can use parallel processing as it proposes the best pipelines to its user. Hence it needs the performance scores of the pipelines. ATM is the only method which can run in parallel on different machines and is set up to be distributed and scalable. ATM is developed to support a multi-user machine learning platform in a cloud or cluster. The aim is to provide standardized abstractions in a library to become as influential for the AutoML community with a library as scikit-learn is to the machine learning community [29]. The development of ATM and integration with the methods described above is one of the most attractive developments in AutoML. An incentive to spur this development could be having a separate performance challenge for distributed AutoML methods.
2.6. Overview of Methods
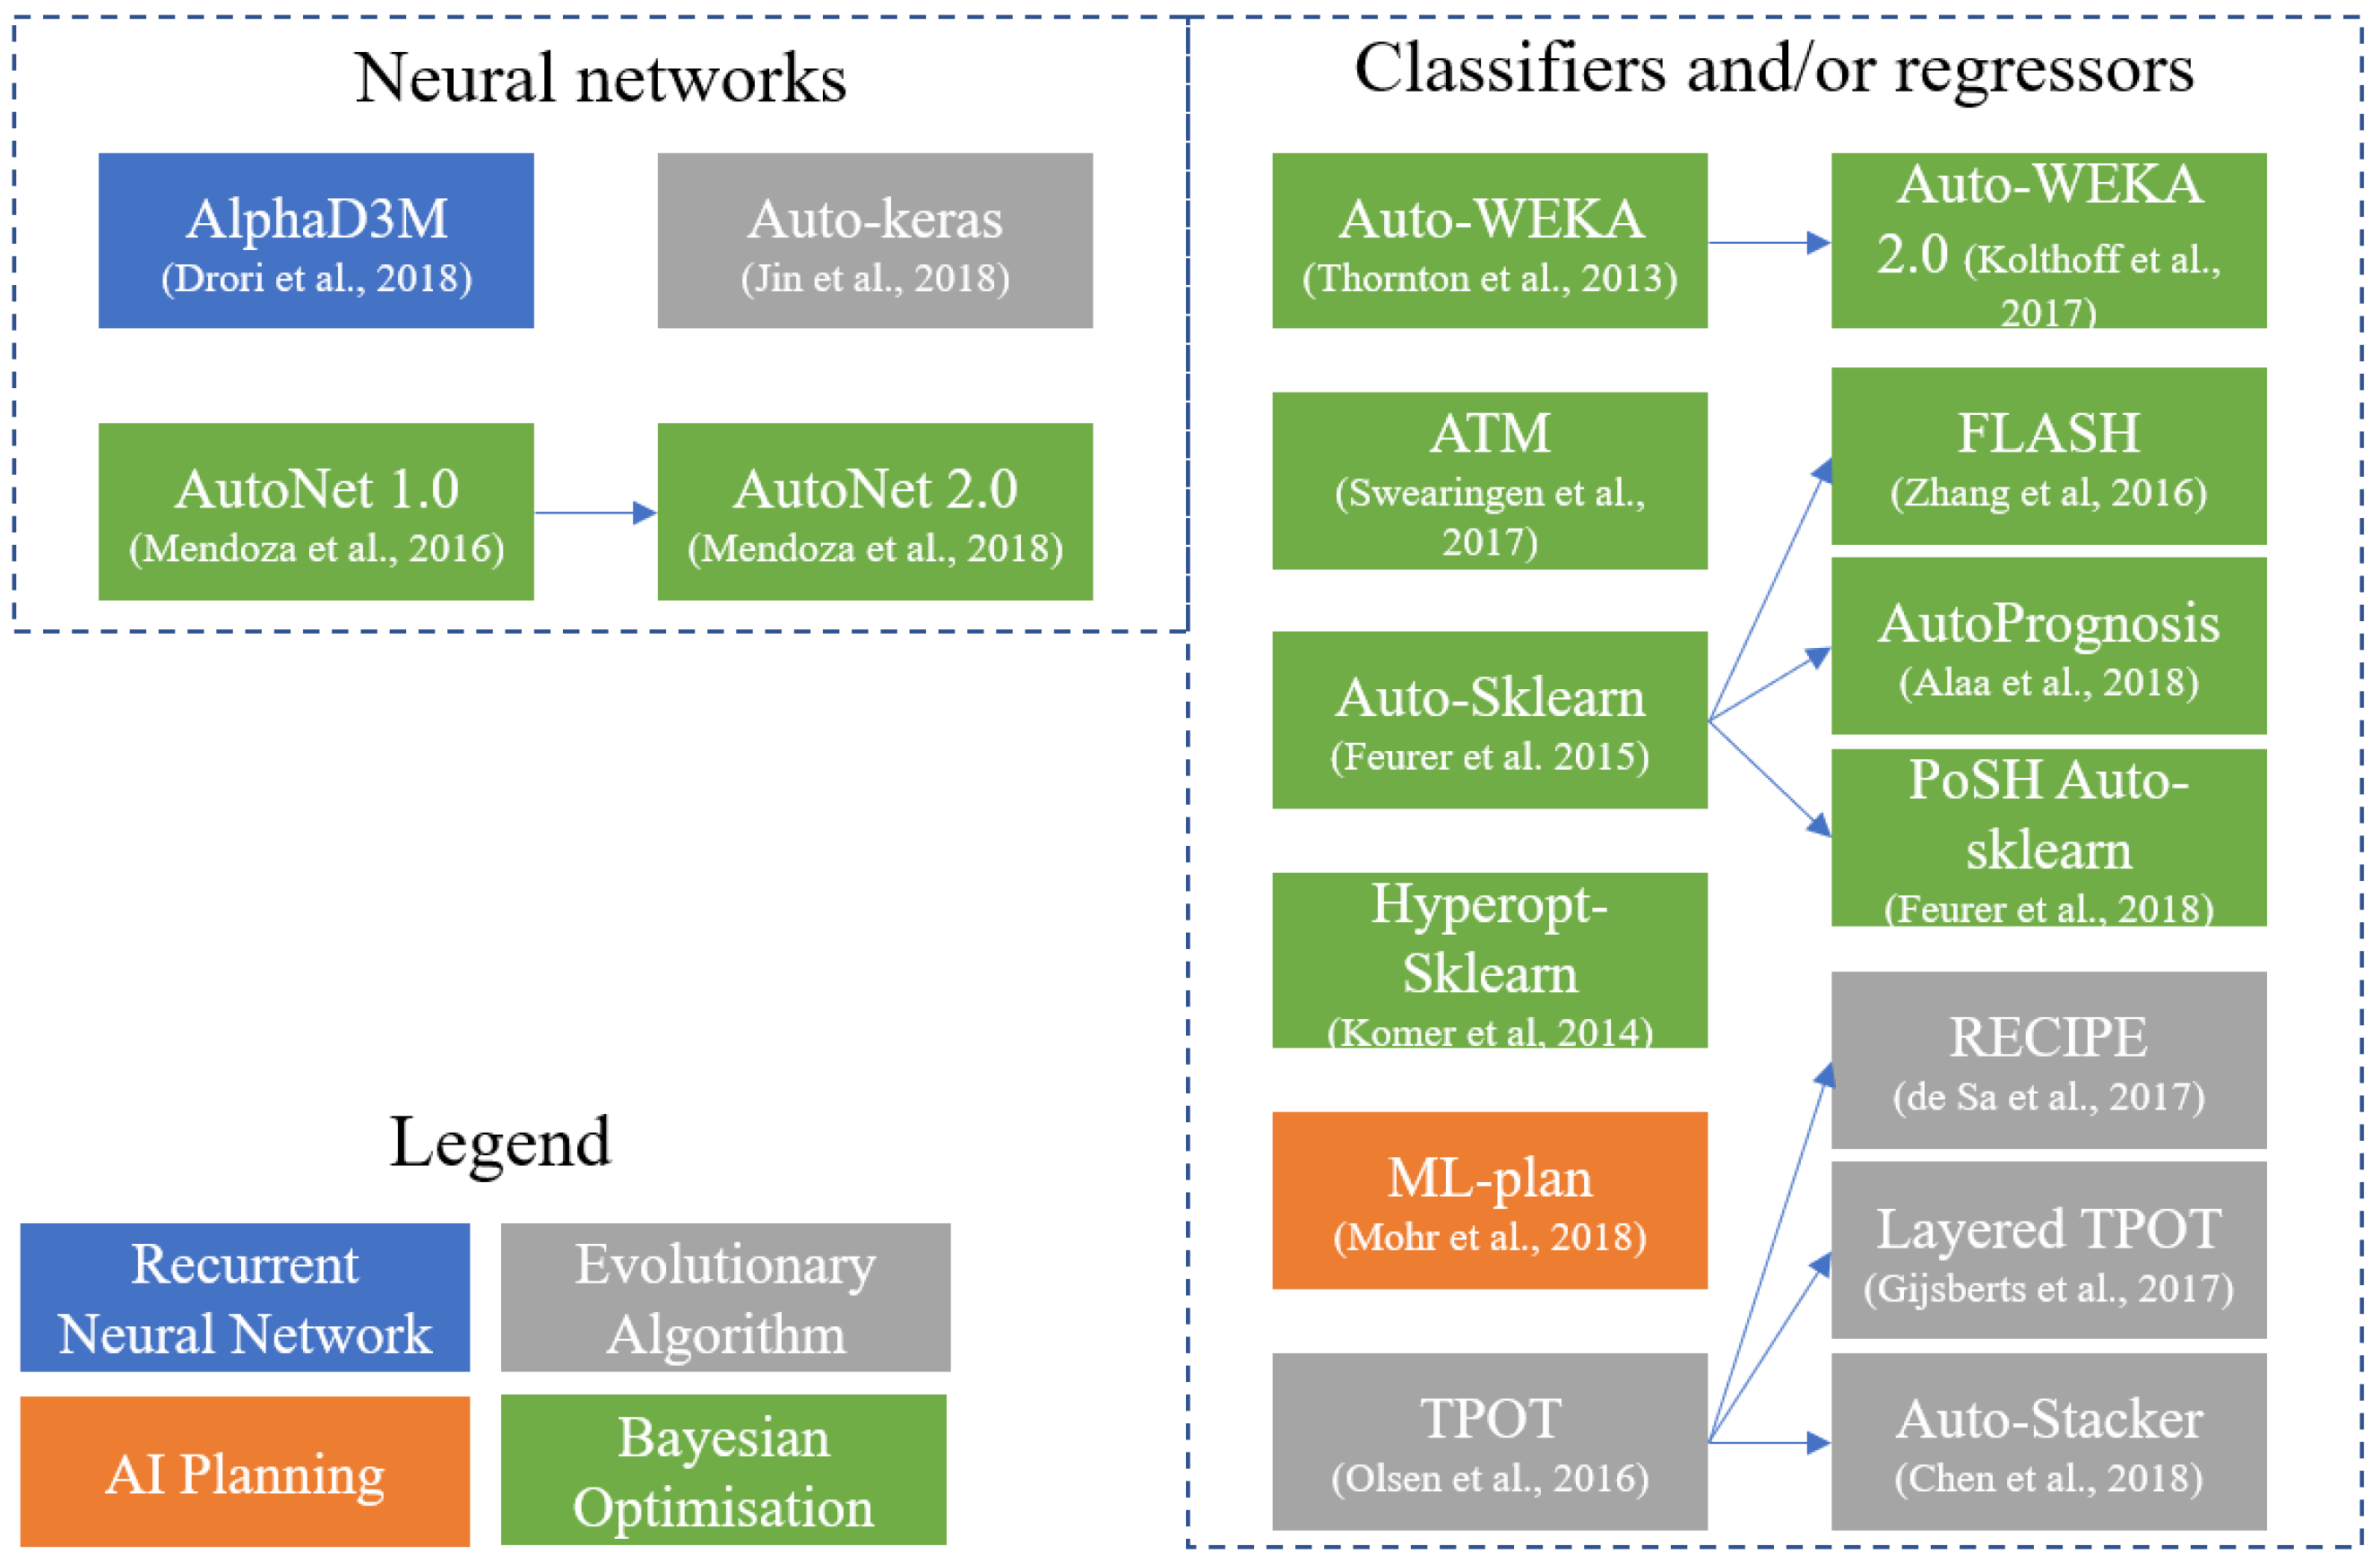
Figure 2 visualizes the relations between AutoML methods discussed in this section. It makes a distinction between methods that build NNs and methods that use traditional classifiers or regressors in their pipeline. Arrows between methods point out a relationship between methods. The colors of the methods indicate the search strategy that is applied in a method to create a pipeline. A tabular overview of the discussed AutoML methods is available in Appendix A, including the prediction tasks, a link to the code repository and more information about the pipeline creation.
3. Research Method
We used the Design Science research framework [30] to answer the research questions. To do so, we first performed a benchmark test using the framework of Gijsbers and colleagues [31] on all available medical datasets from the OpenML100 [32] to find out if one AutoML method performed best on medical tasks. We ran medical binary-classification tasks on four datasets: Breast cancer [33], Diabetes [34], Indian Liver Patient [34], and Sick dataset [35]. All selected methods received a time budget of one hour in a 10-fold cross-validation set-up to create the best pipeline on the given datasets. The time limit is set on one hour, as longer runs do not significantly provide better results [31], a finding that was also confirmed during our experiments. To baseline the performance of the AutoML methods in the benchmark test, we added a decision tree and a constant predictor. Following Gijsbers et al. [31], we used Area Under the Receiver Operator Curve (AUROC) for scoring. All tests have been run on Amazon Web Services using m5.2xlarge machines (32 GB memory, 8 vCPUs (Intel Xeon Platinum 8000 series Skylake-SP processor with a sustained all core Turbo CPU clock speed of up to 3.1 GHz). The OS used is Amazon Linux (https://aws.amazon.com/ec2/instance-types/m5/) to get constant circumstances and enough computing power for the AutoML methods. In our research we only used the AutoML methods available in the benchmark set to create an even playing field. Hence, no industrial tools were considered in this research.
To understand the needs of domain experts we elicited requirements using semi-structured interviews. We selected semi-structured interviews as the best method for requirements elicitation for three reasons. First, semi-structured interviews are considered to be the most effective way for requirements elicitation [36]. Second, it is an accepted method for conducting qualitative research in healthcare [37]. Third, semi-structured interviews have the benefits of eliciting people’s own views and uncovering issues or concerns that have not been considered beforehand by the researcher [38]. For our interviews, we constructed an interview protocol following the guidelines for interview research [39]. The sample consisted of five domain experts who were active in the scientific department of a regional hospital in the Netherlands. The interviewees have decided to participate voluntarily and hold different roles and medical expertise within non-academic hospitals in the Netherlands. The interviewees are active in the research fields of cancer, orthopedy, and cardiology and participate in medical research, either full-time or part-time. The sample consists of three women and two men. We evaluated the capabilities of the AutoML methods to the requirements of the domain experts. Based on the requirements we created two artefacts and evaluated these with the interviewees. The first artefact had a graphical user-interface, the second artefact had a code-based interface. We used artificial summative evaluation as part of the framework for evaluating design science research [40]. We evaluated the artefacts on the user story categories from the previous research question. To be able to evaluate the artefact properties, we used refined hypotheses [41].
4. Results
This section describes the result of the benchmark test, the requirements evaluation and artefact evaluation.
4.1. Benchmark Test
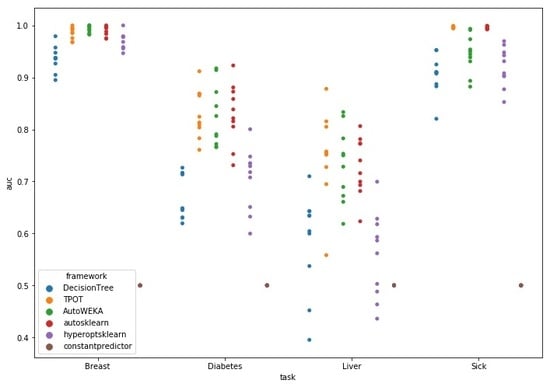
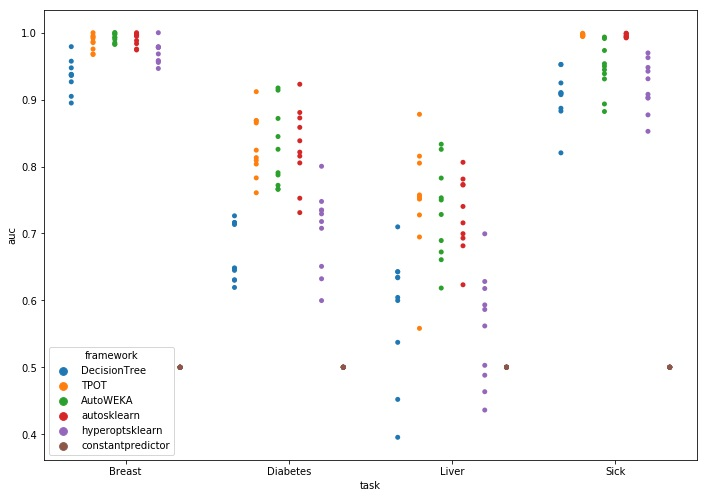
The benchmark test was ran using a time budget of one hour with a total of 160 hours of computational time. Figure 3 contains the visualization of results; the datasets are on the X-axis, the Y-axis shows the AUROC score. A colored dot marks the score for an AutoML method on each of the ten folds. A Kruskal–Wallis H test indicated that there was a statistically significant difference in the distribution for the Breast (H = 11.36, p < 0.001), Diabetes (H = 18.64, p < 0.001), Liver (H = 17.93, p < 0.001), and Sick dataset (H = 27.87, p < 0.001) between the AutoML methods, see Table 1 for statistics.
What is noteworthy in Figure 3 is that on the Liver dataset, the decision tree and Hyperopt-Sklearn do not always outperform the constant predictor. On the Diabetes dataset, Hyperopt-Sklearn lags compared the three other methods, but performs better than the constant predictor and has a similar performance to the decision tree. On the Breast dataset, all AutoML methods have the maximum score in at least one fold. All methods perform well on the Breast set, given their median scores and distribution. The performance of the decision tree indicates that it is not a hard prediction problem. For the results on the Sick dataset, we see that TPOT and Auto-Sklearn outperform the other two methods in both consistency and score of their predictions despite the fact that the set has missing values. Hyperopt-Sklearn is again not better than the decision tree.
Overall, TPOT registered the highest median score after running for one-hour on all sets but the Breast dataset, in which autosklearn registered the best median performance. A Mann–Whitney U test indicated that autosklearn significantly outperforms the decision tree (U = 2.0, p < 0.001) and hyperoptsklearn (U = 17.5, p < 0.01) on the Breast set. TPOT significantly outperforms the decision tree on the datasets Diabetes (U = 0.0, p < 0.001), Liver (U = 8.0, p < 0.001) and Sick (U = 0.0, p < 0.001). Furthermore, TPOT outperforms hyperoptsklearn significantly on the datasets Diabetes (U = 2.0, p < 0.001), Liver (U = 7.0, p < 0.001) and Sick (U = 0.0, p < 0.001). Finally, AutoWEKA is significantly outperformed on the Sick dataset by TPOT (U = 0.0, p < 0.001). This is probably because AutoWEKA does not impute data for missing values. Autosklearn and TPOT do impute values for missing data and have significantly better results. The statistics for the Mann–Whitney U test are available in Table 2. The table shows the p-values and U statistics for each method compared to the best performing method on each dataset. TPOT and autosklearn do not significantly differ in performance for any of the datasets.
From the benchmark test we can conclude that no method consistently outperforms all others. However, we see that TPOT records the highest median scores on three of the four tasks in this test but this performance is not significantly better than the performance of other methods. Autosklearn and AutoWEKA get similar results to TPOT, only AutoWEKA is outperformed on the Sick dataset.
4.2. AutoML Requirements Evaluation
We elicited twenty-one requirements of domain experts in the form of user stories, as shown in part in Appendix B. These are texts that capture a desired functionality and a reason for the desire from the end-users of a product. The user stories are categorized in four categories: User interaction, model construction, model usage and model explanation. We only consider the AutoML methods that participated in the benchmark test for comparison with user stories. Furthermore, we only include user stories that were mentioned by at least two participants, leaving us with fifteen user stories. For user stories, we use the template of Cohen [42]: “As a <type of user>, I want <goal>, [so that <some reason>].” Table A1 provides the collection of elicited user stories that are requested by two or more interviewees. There are three user stories in the user interaction (UI) category with the AutoML artefact. These are in conflict, two out of five domain experts prefer to use code to do their analysis, so they have more control over what is happening, e.g., “I like SPSS for its syntax function, not so much for its clicking”. In contrast, two other domain experts prefer to have a GUI, as small coding errors cost a lot of time to solve, e.g., “Just an interface? That would be great!”.
For model construction (MC) there are five user stories. Automatic model configuration as well as the possibility to set a time budget is covered by the concept of AutoML, e.g., “Using R is a bit a too far removed from my interests”. The restriction of only using logistic regression can only be satisfied by TPOT and AutoWEKA, e.g., “If you do not use it (logistic regression), then the reviewers do not know what is happening, so they reject your paper. Not because it is bad, just because they do not understand it”. Autosklearn and TPOT are the methods that satisfy the requirement of an explanation on handling missing data. There is only one user story about using the created model in practice (MU). Using the created model on unseen data is supported by all assessed AutoML methods.
Over half of the user stories are about model explanation (MX). The domain experts are interested in what variables are important, what the statistical power of a model is and what decisions are made during model creation, e.g., “Being accurate is one thing, but how explainable is it?”. However, none of the assessed AutoML methods could satisfy any of these requirements. It is possible to integrate comparison of created models and an explanation of regression in the artefacts.
The word cloud in Figure 4 illustrates the need for an explanation of the variables and understanding of the process of creating a model. The word cloud is made from the transcripts of the answers to the why questions on the individual evaluations of the interviewees. The words variable, model, happening, explanation, control and understand all stand out. Most interviewees do not consider the output of TPOT as a model, e.g., “It does not show an answer to my question. I do not consider this a model.” We noted that the interviewees only wanted logistic regression models, which limits the power of using AutoML methods. Furthermore, it was evident that the interviewees wanted to keep in control of creating the model. Without the rationale of the AutoML method on the creation of the model they considered it useless. There was no trust in the method as it was so opaque. In addition to that it was unhelpful that the subjects found the machine output of the model unreadable. This was due to the fact that there was no description of importance of variables.
After comparing the four AutoML methods to the user stories, we can conclude that TPOT is the most appropriate AutoML method for this set of requirements. TPOT satisfies five of the fifteen assessed requirements compared to four out of fifteen by Auto-WEKA and Auto-Sklearn. What is noteworthy to see is the inability of all AutoML methods to explain the created models. The need for explainability is evident: Model explanation is the biggest category in the user story categorization. Besides that, explaining model decisions is obligatory in Europe since the introduction of the General Data Protection Regulation Law [43] (pp. 40–42). Table 3 contains an overview of the AutoML methods in each category. We have not included the user-interaction category into the table as it contains conflicting user stories and does not apply to AutoML methods, only to the artefacts. As TPOT performs better than autosklearn on the requirements we integrated TPOT in the artefacts.
4.3. Artefact Evaluation
Based on the user stories we created two artefacts to automate a part of the data preparation phase and the complete modelling phase of CRISP-DM [44]. The data preparation activities involve the possibility to include or exclude variables, data imputation for missing values and the recoding of categorical variables to numerical variables, as TPOT cannot handle non-numerical data as input. Due to the conflict in user-interaction requirements, we designed two artefacts with the same functionalities, but a different user interface. The artefacts can be used to create logistic regression models and users who do not know how to code should be able to use the artefacts. The artefacts contain a description of missing data handling, as well as the possibility to compare the different models.
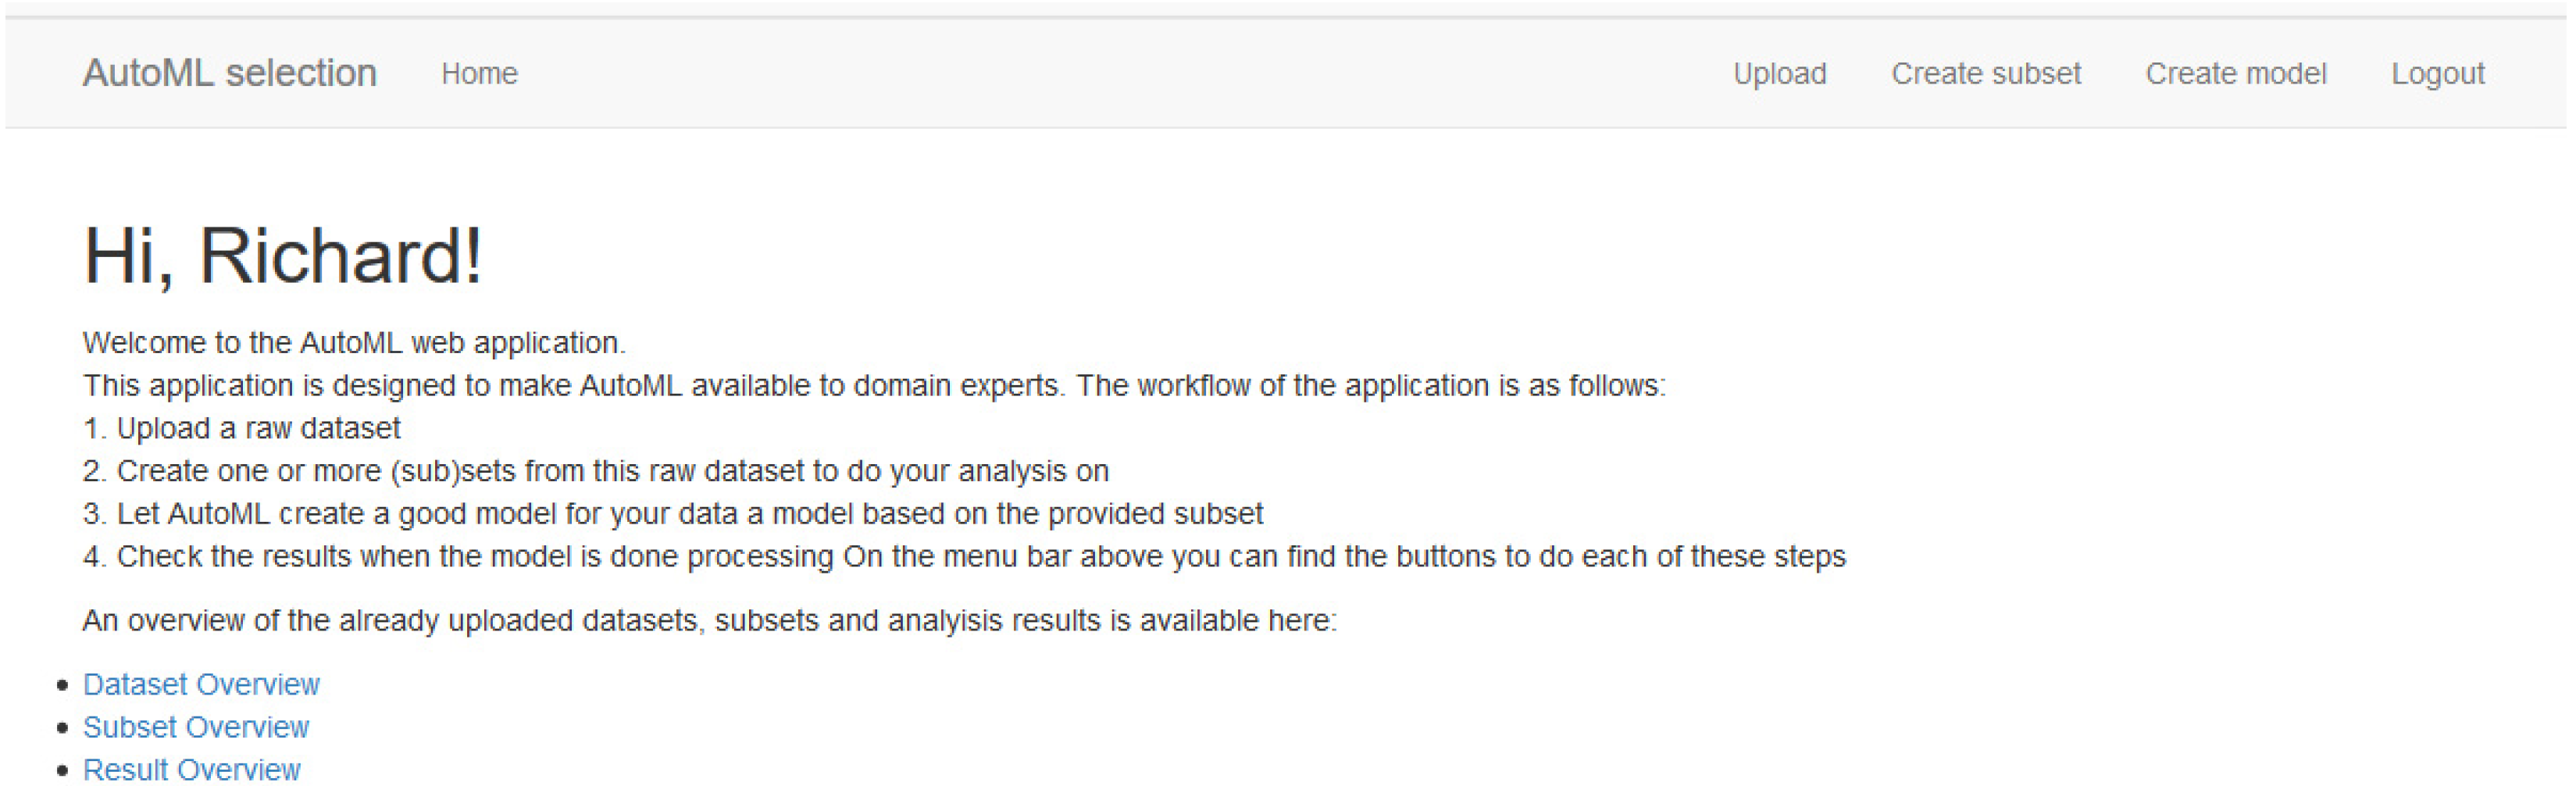
The two artefacts are a Flask web application (GUI artefact) to satisfy the graphical user interface preference and a Jupyter notebook (Code artefact) to satisfy the coding preference, as shown in Figure A1, Figure A2 and Figure A3 in Appendix C, respectively. The source codes for the web application as well as the Jupyter notebook are available at this URL: https://github.com/richooms/healthcare_automl.
Using the risk and efficacy strategy from the framework for evaluation in design science [40]. We created a set of refined hypotheses based on the user story categories to evaluate the artefacts with the domain experts. The hypotheses are available in Appendix D. For the user-interaction we tested on four elements: Uploading a dataset, creating a subset, the workflow of the application and the workflow explanation. Only for uploading a dataset the GUI artefact was preferred. For all other actions the code artefact was preferred, as the interviewees felt more in control of the process. The same was the case for model construction and the progress reporting on model construction as parts of the model construction category. The model explanation category consisted of comparing of different results, explanation of missing data handling and readability. In this category artefact A was preferred over artefact B for all interactions except for explanation of missing data handling. An overview of the preferences and categories is available in Table 4. The preference column demonstrates the type of artefact that was preferred for that part of the artefact interaction. The score column indicates how many subjects had the preference.
What we found is that a hybrid version of the two artefacts is preferred to interact with AutoML by the interviewees. To keep control over the process of creating a model they prefer coding, for the relatively simple tasks such as uploading a set or comparing results, they prefer a graphical user interface. Furthermore, TPOT needs to explain variable importance to make it usable in their research practice as it is considered a must-have for the adoption of AutoML by domain experts.
5. Discussion
This section discusses the conducted research. First, we discuss the lessons learned. Second, we discuss the validity of this research.
5.1. Lessons Learned
In this section, we discuss two lessons learned during this research project. First, we discuss the suitability of AutoML for healthcare practitioners. Second, we discuss the bias in medical (analytics) publications.
5.1.1. Suitability of AutoML Methods for Researcher-Physicians
After the elicitation of requirements, we found that researcher-physicians prefer to create logistic regression models in their research. There are multiple reasons why we find that AutoML in the way we assessed it, is not the best way to create models for researcher-physicians. First, AutoML originates from the CASH problem. If the algorithm type is pre-selected, AutoML can only contribute to HPO. As logistic regression only has two hyperparameters [8], we question the need for using AutoML to tune these hyperparameters.
Second, even if we drop the constraint of logistic regression for model construction, previous research found that other ML models do not significantly outperform logistic regression models in medical studies [45]. Even when we drop the logistic regression model constraint, we still doubt the usability of AutoML due to the results of Christodoulou et al. although other researchers do not find the same results on general datasets [46,47].
Third, there is no explanation of variable importance by the tested AutoML method. As model explainability and variable importance are essential requirements for researcher-physicians, this makes AutoML unsuitable in its current form. If the given explanations are satisfactory, AutoML might be useful in research. More on variable importance is available in the future research section below. If AutoPrognosis can deliver on its promises it can be a promising technology considering the user stories on model explanation.
Fourth, there is no structure in the pipelines created by TPOT; this can lead to very complicated pipelines in with three or four logistic regression models, all using each other’s results as input. These constructions are hard to understand for domain experts, if we would use grammar to represent the pipeline like in RECIPE [26]. The grammar can help to create more understandable pipelines for researcher-physicians. Another option could be using fixed-pipeline methods based on BO. Although they performed worse on the benchmark test, they can compensate if their results make more sense to the researcher-physicians. Finally, we have learned that there is a gap in the knowledge level of ML between literature and practice for researcher-physicians. The literature on AutoML states that AutoML aims to aid non-expert users of ML techniques [8]. However, we find that most non-expert users have no knowledge or education in programming. Hence, the current offering of AutoML techniques are still too technical for non-expert users in healthcare.
5.1.2. Bias in Medical Analytics Publications
Most publications about healthcare analytics that we have come across during this research, have all published a positive result. [48] noticed the same: there is a need to publish every positive result, but there are no real tests for the value of ML solutions in healthcare. If we add the findings of Christodoulou et al. [45] to the fact that ML models do not perform significantly better than traditional methods in medical research we find a discrepancy between what is published and what is improving healthcare. Hence, we think that it would be helpful for the development of accurate methods for analytics in healthcare to publish results that do not provide a direct benefit. In this way, funding for research can be either used for improving methods that do not yet work in healthcare or in researching different methods for solving the same problem. When negative results are not published, we fear a waste of research funding by researchers continually reinventing the wheel and thus stalling research and innovation.
5.2. Validity
In this section, we address the “subjective” nature of the data collection and analysis of this research [49]. To assess the validity of this study, we look at three of the five aspects of validity for qualitative research, as proposed by Burke Johnson [50]. We do not discuss theoretical validity as the goal of design science research is on artefact creation instead of theory creation. We do not aim to explain a phenomenon. We also do not discuss Internal validity, as we do not aim to answer a question about a causal phenomenon. The main research question of this research is a “how”-question.
5.2.1. Descriptive Validity
Descriptive validity is on the factual accuracy of the account of events as reported by the researcher [50]. As a single researcher has conducted this research, hence there is a bias in data collection. A researcher is subjective by nature, and so are his data collection and analysis [49]. Besides that, the relationship between the researcher and participants significantly influences what the participants reveal to the researcher [51] (pp. 11–30). To mitigate this validity threat, we used a framework to set up the semi-structured interviews and the framework for evaluation of design science to set up the artefact evaluation. We recorded all interactions with the participants, and we took part in sessions to obtain peer-feedback on our research to increase the descriptive validity.
5.2.2. Interpretive Validity
Interpretive validity is about accurately portraying the meaning that was attached by the participants to the objects that were studied [50]. To mitigate this threat, we have sent the elicited user-stories to the participants to obtain feedback on our findings [49]. Furthermore, we used data-triangulation by tapping into other sources to confirm our findings. To make sure we portrayed the meaning of the participants well, we used low inference descriptors by quoting participants in this research [50].
5.2.3. External Validity
External validity is crucial if we want to generalize our findings to a larger part of the population [50]. Although generalizability is not the primary purpose of this research, we will touch upon the subject. As this research conducts a case-study, the best way to generalize its findings is to find the similarity in subjects, objects and issues [52]. As the sample size and characteristics are not valid for generalizability, the best method to generalize our findings is to identify similarity in other situations.
Characteristics that make the sample inapplicable for generalization to medical professionals are the limited set of medical domains in which the participants operate and the fact that all participants decided to participate voluntarily. Hence, insights derived from this study are hard to generalize but could be a steppingstone for future research.
6. Conclusions
The main research question of this study was “How can we support healthcare professionals in their knowledge discovery process by applying Automated machine learning?”. We found that AutoML is currently only suitable for the data understanding phase of the CRISP-DM method when using TPOT as AutoML method. TPOT performed best on the benchmark test along with Auto-Sklearn, but satisfied more requirements than Auto-Sklearn. Although the assessed AutoML methods are capable of modelling and data pre-processing, it misses an explanation for the decisions made in the modelling process. Part of medical knowledge discovery is finding the cause of a medical event. Because modelling decisions are not shared and variable importance is absent in the result, AutoML does not support the discovery of new knowledge. However, the domain experts point out that they see the added value of automatically finding out possible scores for their datasets. Furthermore, they mention that AutoML can help them in getting an understanding of their data in the data understanding phase of their knowledge discovery process.
7. Future Research
In this section we discuss three possibilities for future research, first we discuss model uncertainty of AutoML created models. Second, we discuss possible new use-cases for AutoML methods. Finally, we discuss interpretability as a direction for future research.
7.1. AutoML Model Uncertainty
One of the benefits that are proposed by AutoML is the reproducibility of created ML pipelines [8,9,12]. However, these authors state that the outcome of the creation of an ML pipeline with an AutoML method is dependent on the time budget allocated to the AutoML method. Besides that, EA based AutoML methods start with a random population. Thus, it is harder to reproduce the result of a single run without explicitly setting the seed. [53] investigated model uncertainty in a medical context. They have found that as much as changing the seed can influence the prediction outcome for an individual patient. Hence, we argue that there should be more research on the stability of AutoML pipelines in the medical domain.
7.2. AutoML Use Cases
In our synthesis in Section 2, we explain that AutoML is applicable for tuning neural networks and creating classification and regression models. In healthcare, the fields with the most significant potential for the application of ML are image recognition and natural language processing [48]. Because researcher-physicians accept black boxes in image recognition and natural language processing more than in traditional research, these ML tasks might be better suited to enable domain experts to work with AutoML in healthcare. Hence, we argue that the scope of AutoML use-cases could be widened to NLP and image recognition tasks if we want to accelerate the adoption of analytics in healthcare.
7.3. AutoML Interpretability
As pointed out in Section 5, the explainability of ML models is crucial to adoption for domain experts in healthcare [54]. Molnar [55] argues that ML interpretability is crucial to the adoption of black-box algorithms in every sector. In healthcare, this barrier to adoption is even higher, as being able to explain decisions is part of the medical culture and vital to patient-doctor interaction. Hence, AutoML methods must become more interpretable for non-expert users. The interpretability technique should be model agnostic. In that way, the technique is suitable for all pipelines created by the AutoML methods [56]. To improve the interpretability of AutoML models we propose three areas for further research on the interpretability of AutoML: Surrogate models, Local Interpretable Model-agnostic Explanations (LIME) [55] and Shapley values [57]. However, others argue that we should improve the trust in artificial intelligence in healthcare rather than improving the interpretability. If the trust is high enough, the researcher-physicians will start using the black boxes [58]. Most researcher-physicians also do not precisely know how a car works. However, they still use cars in their daily lives. We believe that the addition of interpretability will ignite the adoption rate of AutoML methods in healthcare and other sectors to enable self-service data-science.
Author Contributions
Conceptualization: M.S.; Methodology, Software, Formal Analysis, Investigation: R.O.; Validation: R.O., M.S.; Writing—Original Draft Preparation: R.O.; Writing—Review & Editing: M.S., R.O.; Supervision: M.S. All authors have read and agreed to the published version of the manuscript.
Funding
This research received no external funding.
Conflicts of Interest
The authors declare no conflict of interest.
Appendix A

Table A1.
Overview of Automated Machine Learning (AutoML) methods.
| Tool | Library/Package | Optimization | Pre-Processor | Post-Processor | Extra Feature(s) | Analysis Capabilities | Code Link |
|---|---|---|---|---|---|---|---|
| Auto-Weka 2.0 | WEKA | Tree-based hierarchical BO | Yes | No | Binary classification Multi-label classification Regression | https://github.com/automl/autoweka | |
| Auto-Sklearn | scikit-learn | Tree-based BO | Yes | Yes | Meta-learner | Binary classification Multi-label classification Regression | https://github.com/automl/auto-sklearn |
| Hyperopt-Sklearn | scikit-learn | Tree-based BO | Yes | No | Binary classification Multi-label classification | https://github.com/hyperopt/hyperopt-sklearn | |
| TPOT | scikit-learn DEAP | Tree-based GP | Yes | No | Binary classification Multi-label classification Regression | https://github.com/EpistasisLab/tpot | |
| Layered TPOT | scikit-learn | Tree-based GP | Yes | No | Binary classification Multi-label classification Regression | https://github.com/PG-TUe/tpot/tree/layered | |
| Auto-Net 1.0 | Lasagne | Feed-forward NN on Stochastic Gradient Descent | Yes | No | Binary classification Multi-label classification Regression | No implementation found | |
| Auto-Net 2.0 | PyTorch | BO and Hyperband (BOHB) | Yes | No | Binary classification Multi-label classification Regression | No implementation found | |
| FLASH | scikit-learn | BO with expected improvement | Yes | No | Pipeline caching | Binary classification | https://github.com/yuyuz/FLASH |
| RECIPE | scikit-learn | Grammar-based GP | Yes | No | Binary classification | https://github.com/RecipeML/Recipe | |
| Auto-Prognosis | scikit-learn | BO and GP | Yes | Yes | Meta-learner, Explainer | Binary classification Survival analysis Temporal analysis | https://github.com/ahmedmalaa/AutoPrognosis |
| ML-Plan | WEKA scikit-learn | HTN and EA | Yes | No | Binary classification Multi-label classification | https://github.com/fmohr/ML-Plan | |
| Auto- stacker | scikit-learn XGBoost | Hierarchical stacking and EA | No | No | Binary classification Multi-label classification | No implementation found | |
| Alpha3DM | PyTorch | NN and Monte Carlo Tree Search | Yes | Yes | Binary classification Multi-label classification Regression | No implementation found | |
| PoSH AUTO-sklearn | scikit-learn | BO with successive halving | Yes | Yes | Meta-learner | Binary classification Multi-label classification Regression | No implementation found |
| Auto-Keras | scikit-learn | BO guided network morphism | Yes | No | Binary classification Multi-label classification | https://autokeras.com/ | |
| ATM | scikit-learn | Conditional Parameter Tree | Yes | No | Meta-learner | Binary classificationMulti-label classification | https://github.com/HDI-Project/ATM |
Appendix B
Table A2.
Collection of the Top-15 elicited user stories, sorted on descending frequency.
| # | User Story | Frequency | Category |
|---|---|---|---|
| 1 | As a researcher-physician, I want to know how a prediction mechanism works, so that I can trust it more easily. | 5 | MX |
| 2 | As a researcher-physician, I want to be able to perform ML without having to code, so that I do not have to spend time learning how to program. | 5 | MC |
| 3 | As a researcher-physician, I want to use logistic regression, so that I can follow the medical guidelines for research. | 4 | MC |
| 4 | As a researcher-physician, I want to see which variables are included and excluded in the model, so that I can assess variable importance. | 4 | MX |
| 5 | As a researcher-physician, I want to see the difference between models with different variables included so that I can assess variable importance. | 4 | MX |
| 6 | As a researcher-physician, I want to transfer my model into a calculation tool, so that it can be used in clinical practice. | 4 | MU |
| 7 | As a researcher-physician, I want to have results within a day, so that I do not have to wait. | 4 | MC, MU |
| 8 | As a researcher-physician, I want to know the statistical power of a created model, so that I know if I can use it. | 4 | MX |
| 9 | As a researcher-physician, I want that the AutoML method explains its decisions, so that I can check its reasoning. | 3 | MX |
| 10 | As a researcher-physician, I want to have a graphical user interface, so that the chance of making errors is less than while coding. | 2 | UI |
| 11 | As a researcher-physician, I want to see the importance of each variable. So that I can check the reasoning of the computer. | 2 | MX |
| 12 | As a researcher-physician, I want to use code, so that I can trace back the decisions that I have made. | 2 | UI, MX |
| 13 | As a researcher-physician, I want to know what happens with missing data, so that I can evaluate the model correctly. | 2 | MC, MX |
| 14 | As a researcher-physician, I want to get suggestions for variables to include by the computer, so that I can improve my models. | 2 | MC |
| 15 | As a researcher-physician, I want to see the amount of variance that is explained by my model, so that I can assess the model quality. | 2 | MX |
Appendix C
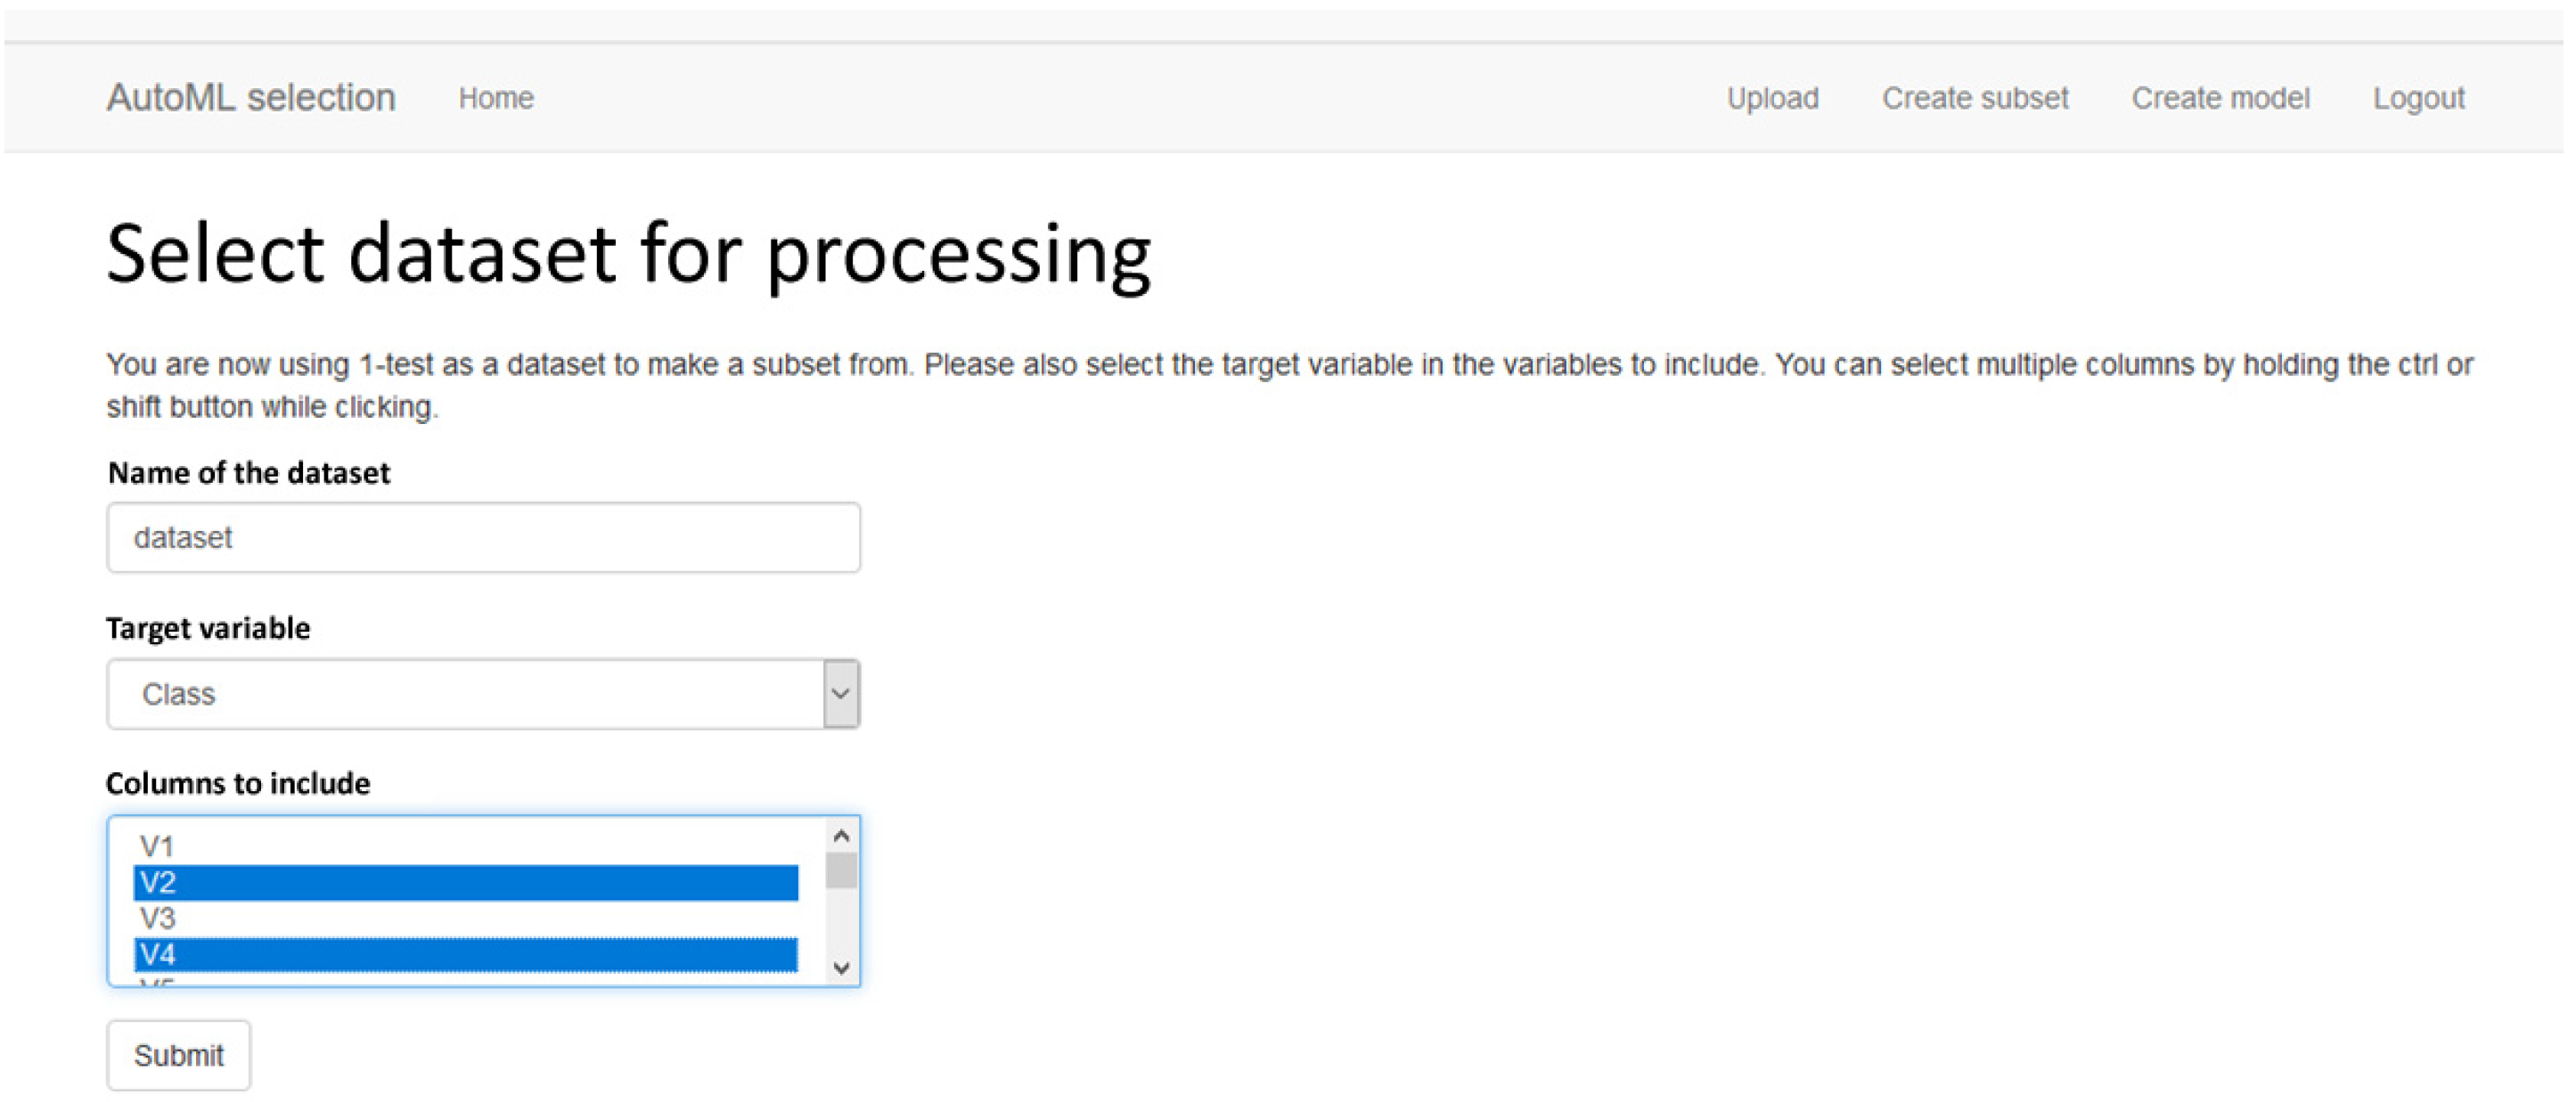
Figure A1.
Screenshot 1 of of AutoML artefact A, the Web application interface (preference: GUI).

Figure A2.
Screenshot 2 of of AutoML artefact A, the Web application interface (preference: GUI).

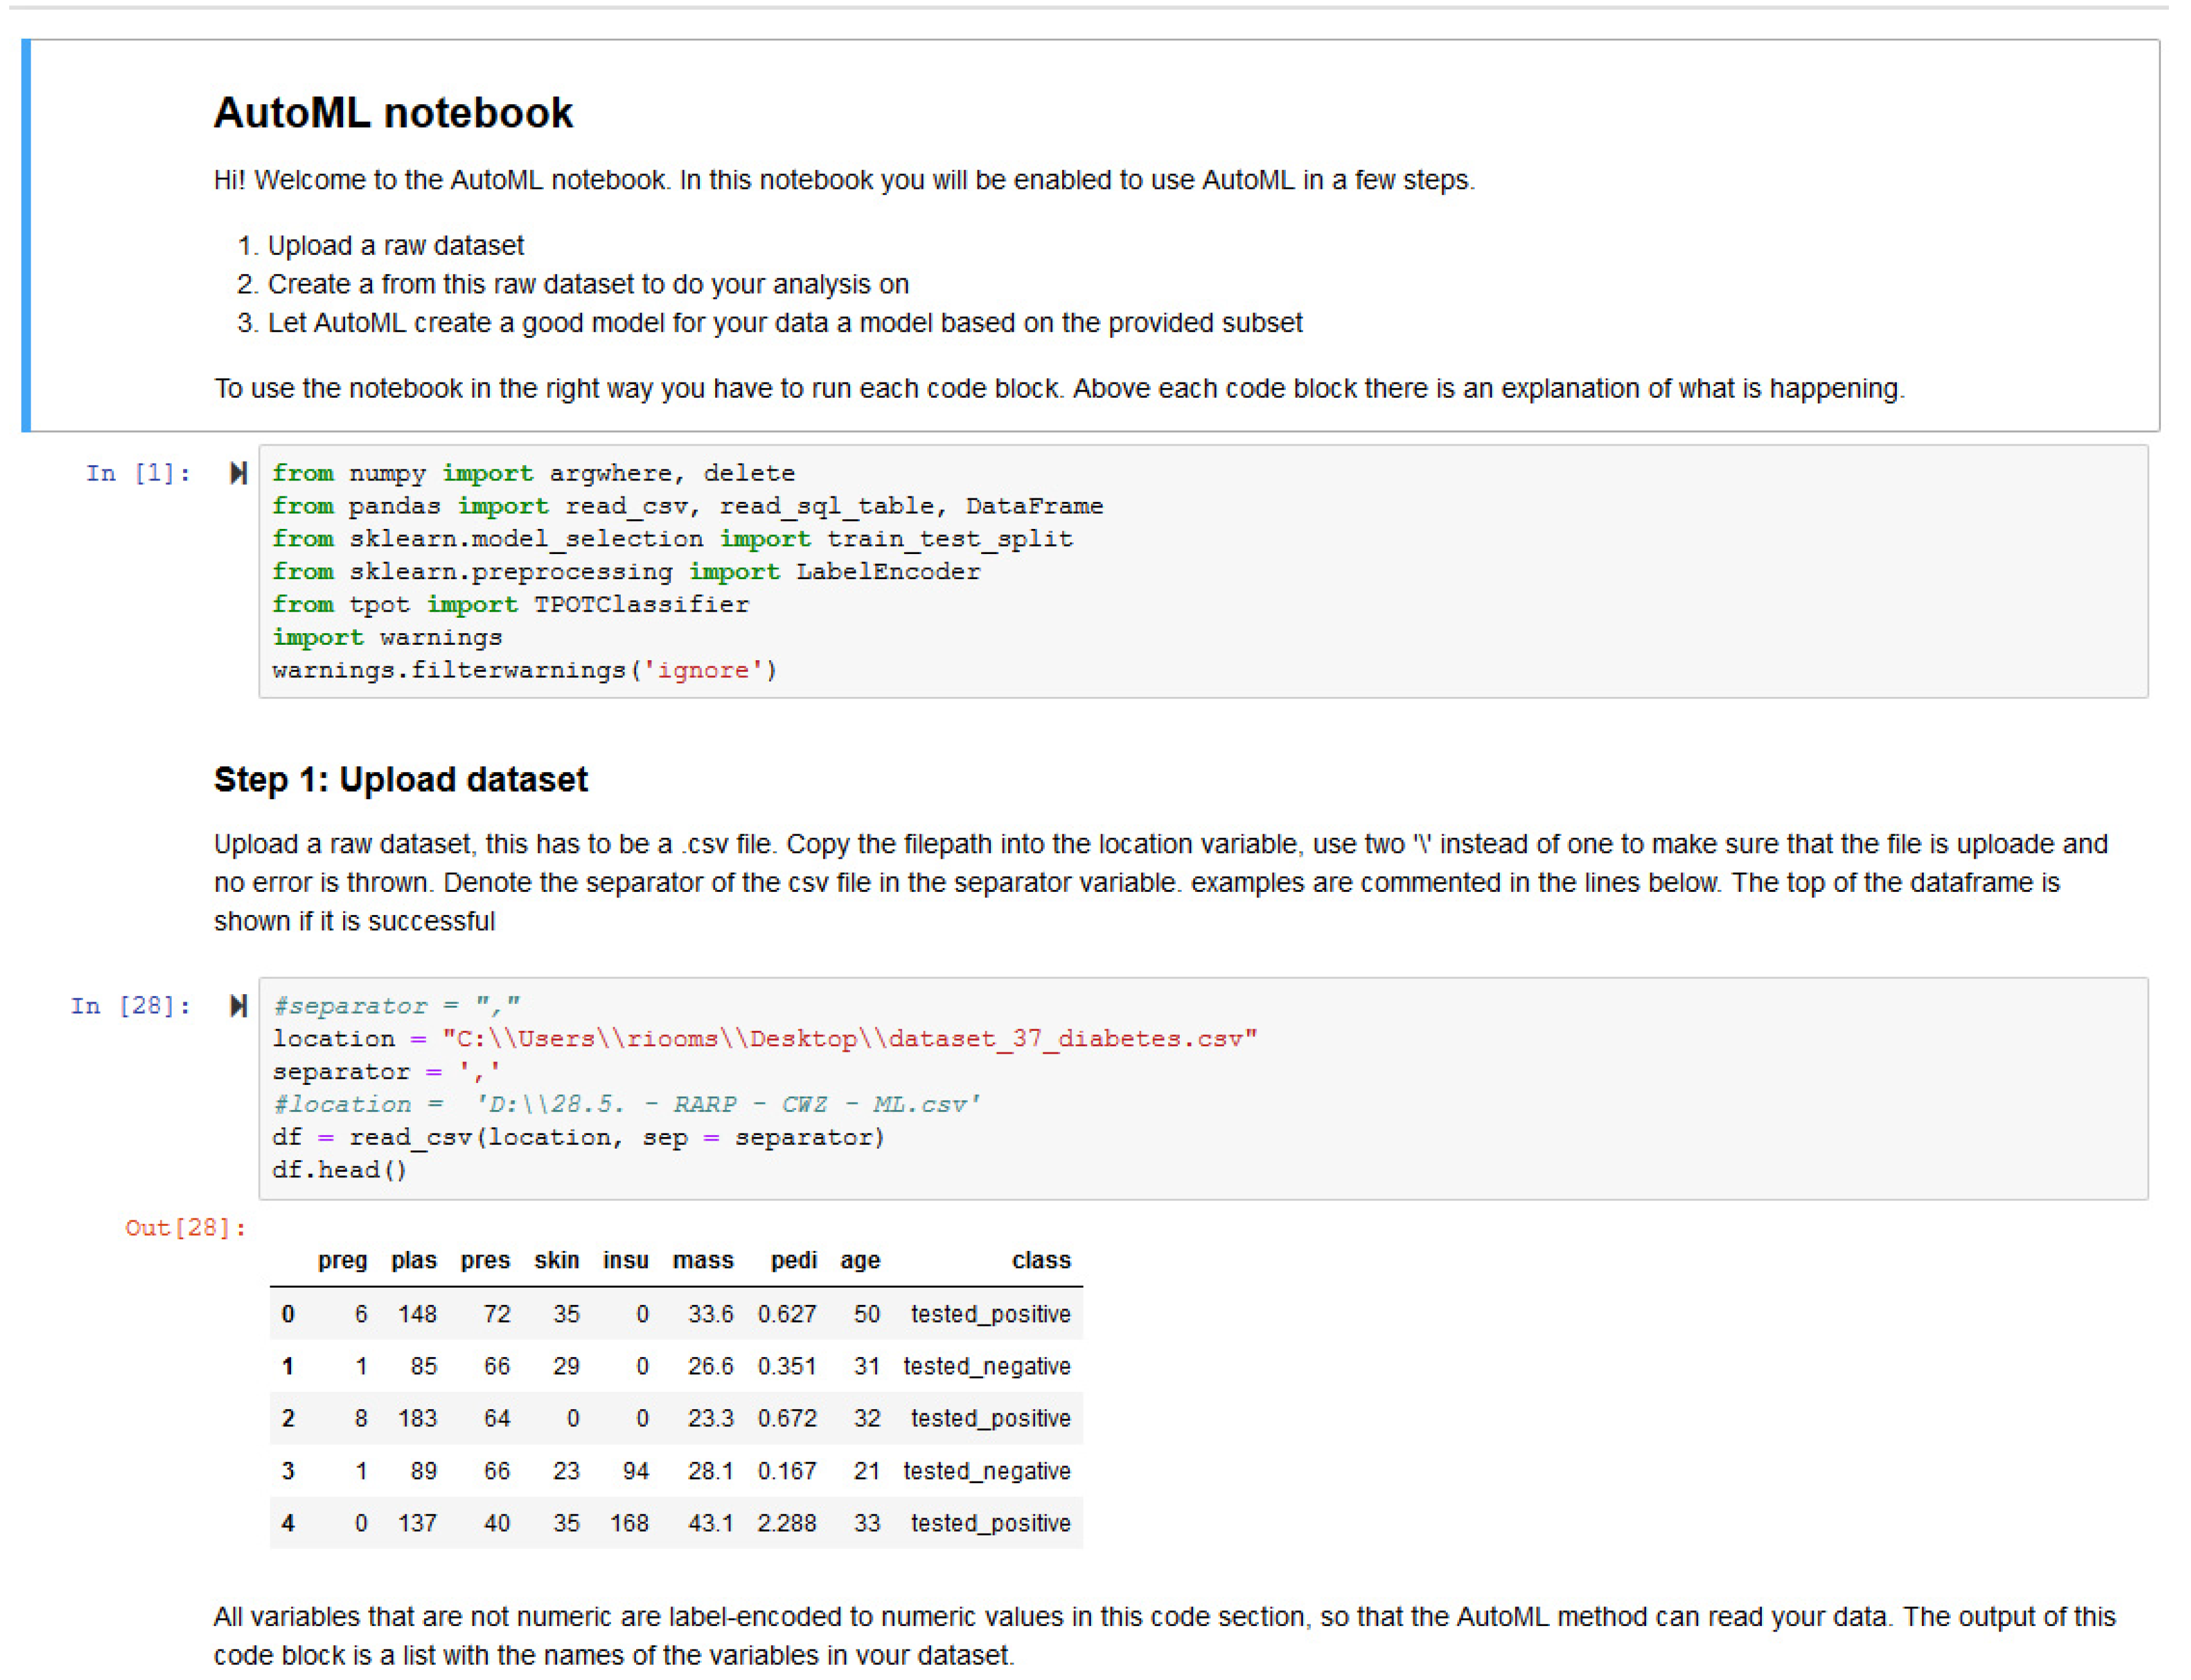
Figure A3.
Screenshot of AutoML artefact B, the Jupyter notebook interface (preference: Code).

Appendix D
Overview of the refined hypotheses. For user interaction the hypotheses are:
- Artefact A is preferred over Artefact B to upload a dataset.
- Artefact A is preferred over Artefact B to create a subset.
- Artefact B is preferred over Artefact A to find the way in the different steps.
- Artefact B is preferred over Artefact A for the explanations of the workflow.
For model construction the hypotheses are:
- Artefact B is preferred over Artefact A for progress reporting on model construction.
- Artefact B is preferred over Artefact A for model construction.
Because no user-stories matched a model explanation requirement, the first two hypotheses are about the model comparison. The latter hypotheses are about the desired explainability mentioned in the user-stories.
- Artefact A is preferred over Artefact B for comparing results of model creation.
- Artefact A is preferred over Artefact B for the explanation of missing data handling.
- Artefact B is preferred over Artefact A for reading the produced model.
- Users consider accuracy to be a good measure of model performance.
- Users want to know the statistical power of the created model.
- Users want to know the importance of each variable in the created model.
References
- Wang, X.; Noor-E-Alam, M.; Islam, M.; Hasan, M.; Germack, H. A Systematic Review on Healthcare Analytics: Application and Theoretical Perspective of Data Mining. Healthcare 2018, 6, 54. [Google Scholar]
- Chawla, N.V.; Davis, D.A. Bringing big data to personalized healthcare: A patient-centered framework. J. Gen. Intern. Med. 2013, 28, 660–665. [Google Scholar] [CrossRef] [PubMed] [Green Version]
- Raghupathi, W.; Raghupathi, V. Big data analytics in healthcare: Promise and potential. Heal. Inf. Sci. Syst. 2014, 2, 1–10. [Google Scholar] [CrossRef] [PubMed]
- Spruit, M.; Lytras, M. Applied data science in patient-centric healthcare: Adaptive analytic systems for empowering physicians and patients. Telemat. Inform. 2018, 35, 643–653. [Google Scholar] [CrossRef]
- Spruit, M.; Vries de, N. Self-Service Data Science for Adverse Event Prediction with AutoCrisp. In Proceedings of the Springer Proceedings in Complexity, Research & Innovation Forum, Athens, Greece, 15–17 April 2020. [Google Scholar]
- Spruit, M.; Jagesar, R. Power to the People!—Meta-Algorithmic Modelling in Applied Data Science. In Proceedings of the 8th International Conference on Knowledge Discovery and Information Retrieval, Porto, Portugal, 9–11 November 2016; Volume 1, pp. 400–406. [Google Scholar]
- Spruit, M.R.; Dedding, T.; Vijlbrief, D. Self-Service Data Science for Healthcare Professionals: A Data Preparation Approach. In Proceedings of the 13th International Joint Conference on Biomedical Engineering Systems and Technologies (BIOSTEC 2020)—Volume 5: HEALTHINF, Valletta, Malta, 24–26 February 2020; pp. 724–734. [Google Scholar]
- Thornton, C.; Hutter, F.; Hoos, H.H.; Leyton-Brown, K. Auto-WEKA: Combined Selection and Hyperparameter Optimization of Classification Algorithms. In Proceedings of the 19th ACM SIGKDD International Conference on Knowledge Discovery and Data Mining, Chicago, IL, USA, 22–27 August 2013. [Google Scholar]
- Hutter, F.; Kotthoff, L.; Vanschoren, J. Automatic Machine Learning: Methods, Systems, Challenges; Springer: New York, NY, USA, 2019. [Google Scholar]
- Zhang, Y.; Bahadori, M.T.; Su, H.; Sun, J. FLASH: Fast Bayesian Optimization for Data Analytic Pipelines. In Proceedings of the 22nd ACM SIGKDD International Conference on Knowledge Discovery and Data Mining, San Francisco, CA, USA, 13–17 August 2016; pp. 1–21. [Google Scholar]
- Alaa, A.M.; van der Schaar, M. AutoPrognosis: Automated Clinical Prognostic Modeling via Bayesian Optimization with Structured Kernel Learning. In Proceedings of the International Conference on Machine Learning, Stockholm, Sweden, 10–15 July 2018; pp. 139–148. [Google Scholar]
- Kotthoff, L.; Thornton, C.; Hoos, H.H.; Hutter, F.; Leyton-Brown, K. Auto-WEKA 2.0: Automatic model selection and hyperparameter optimization in WEKA. J. Phys. B At. Mol. Opt. Phys. 2017, 18, 1–5. [Google Scholar]
- Komer, B.; Bergstra, J.; Eliasmith, C. Hyperopt-Sklearn: Automatic HyperparameterConfiguration for Scikit-Learn. ICML Work. AutoML 2014, 2825–2830. [Google Scholar] [CrossRef] [Green Version]
- Feurer, M.; Klein, A.; Eggensperger, K.; Springenberg, J.T.; Blum, M.; Hutter, F. Efficient and Robust Automated Machine Learning. In Proceedings of the 28th International Conference on Neural Information Processing Systems, Montreal, QC, Canada, 7–12 December 2015; MIT Press: Cambridge, MA, USA, 2015; pp. 2755–2763. [Google Scholar]
- Feurer, M.; Eggensperger, K.; Falkner, S.; Lindauer, M.; Hutter, F. Practical Automated Machine Learning for the AutoML Challenge 2018. In Proceedings of the ICML 2018 AutoML Workshop, Stockholm, Sweden, 10–15 July 2018. [Google Scholar]
- Mohr, F.; Wever, M.; Hüllermeier, E. ML-Plan: Automated machine learning via hierarchical planning. Mach. Learn. 2018, 107, 1495–1515. [Google Scholar] [CrossRef] [Green Version]
- Bergstra, J.S.; Bardenet, R.; Bengio, Y.; Kégl, B. Algorithms for hyper-parameter optimization. In Proceedings of the Advances in Neural Information Processing Systems, Granada, Spain, 12–14 December 2011; pp. 2546–2554. [Google Scholar]
- Bergstra, J.; Yamins, D.; Cox, D.D. Hyperopt: A Python Library for Optimizing the Hyperparameters of Machine Learning Algorithms. Comput. Sci. Discov. 2013, 1–8. [Google Scholar] [CrossRef]
- Vanschoren, J.; van Rijn, J.N.; Bischl, B.; Torgo, L. OpenML: Networked science in machine learning. ACM SIGKDD Explor. Newsl. 2014. [Google Scholar] [CrossRef] [Green Version]
- Nau, D.; Au, T.C.; Ilghami, O.; Kuter, U.; Murdock, J.W.; Wu, D.; Yaman, F. SHOP2: An HTN planning system. J. Artif. Intell. Res. 2003, 20, 379–404. [Google Scholar] [CrossRef]
- Mendoza, H.; Klein, A.; Feurer, M.; Springenberg, J.T.; Hutter, F. Towards Automatically-Tuned Neural Networks. Proc. Work. Autom. Mach. Learn. 2016, 64, 58–65. [Google Scholar]
- Drori Krishnamurthy, Y.; Rampin, R.; Lourenço, R.; Ono, J.P.; Cho, K.; Silva, C.T.; Freire, J. AlphaD3M: Machine Learning Pipeline Synthesis. In Proceedings of the ICML 2018 AutoML Workshop, Stockholm, Sweden, 10–15 July 2018. [Google Scholar]
- Jin, H.; Song, Q.; Hu, X. Auto-Keras: Efficient Neural Architecture Search with Network Morphism. arXiv 2018, arXiv:1806.10282. [Google Scholar]
- Olson, R.S.; Moore, J.H. TPOT: A tree-based pipeline optimization tool for automating machine learning. In Work. Automated Machine Learning; Springer: New York, NY, USA, 2006; pp. 66–74. [Google Scholar]
- Gijsbers, P.; Vanschoren, J.; Olson, R.S. Layered TPOT: Speeding up tree-based pipeline optimization. In Proceedings of the European Conference on Machine Learning and Principles and Practice of Knowledge Discovery in Databases, Skopje, Macedonia, 18–22 September 2017; pp. 49–68. [Google Scholar]
- de Sá, A.G.C.S.; Pinto, W.J.G.S.; Oliveira, L.O.V.B.; Pappa, G.L. RECIPE: A grammar-based framework for automatically evolving classification pipelines. Lect. Notes Comput. Sci. (Incl. Subser. Lect. Notes Artif. Intell. Lect. Notes Bioinform.) 2017, 10196 LNCS, 246–261. [Google Scholar]
- Chen, B.; Wu, H.; Mo, W.; Chattopadhyay, I.; Lipson, H. Autostacker: A Compositional Evolutionary Learning System. In Proceedings of the Genetic and Evolutionary Computation Conference, Kyoto, Japan, 15–19 July 2018; pp. 402–409. [Google Scholar]
- Hornby, G.S. ALPS: The Age-Layered Population Structure for Reducing the Problem of Premature Convergence. In Proceedings of the 8th Annual Conference on Genetic and Evolutionary Computation, Seattle, DC, USA, 8–12 July 2006. [Google Scholar]
- Swearingen, T.; Drevo, W.; Cyphers, B.; Cuesta-Infante, A.; Ross, A.; Veeramachaneni, K. ATM: A distributed, collaborative, scalable system for automated machine learning. In Proceedings of the 2017 IEEE International Conference on Big Data, Big Data 2017, Boston, MA, USA, 11–14 December 2017; pp. 151–162. [Google Scholar]
- Hevner, A.R.; Ram, S.; March, S.; Park, J. Design Science in Information Systems. MIS Q. 2004, 28, 75–105. [Google Scholar]
- Gijsbers, P.; Ledell, E.; Thomas, J.; Poirier, S.; Bischl, B.; Vanschoren, J. An Open Source AutoML Benchmark. In Proceedings of the ICML Workshop on AutoML, Long Beach, CA, USA, 14 June 2019; pp. 1–8. [Google Scholar]
- Bischl, B.; Casalicchio, G.; Feurer, M.; Hutter, F.; Lang, M.; Mantovani, R.G.; van Rijn, J.N.; Vanschoren, J. OpenML Benchmarking Suites and the OpenML100. arxiv 2017, arXiv:1708.03731. [Google Scholar]
- Mangasariona, O.L.; Wolberg, W.H. Cancer Diagnosis via Linear Programming. SIAM News 1990, 23, 1–18. [Google Scholar]
- Dua, D.; Graff, C. UCI Machine Learning Repository. 2019. Available online: https://archive.ics.uci.edu/ml/index.php (accessed on 28 April 2019).
- Quinlan, J.R. Simplifying decision trees. International journal of man-machine studies. Int. J. Man Mach. Stud. 1987, 27, 221–234. [Google Scholar] [CrossRef] [Green Version]
- Davis, A.; Dieste, O.; Hickey, A.; Juristo, N.; Moreno, A.M. Effectiveness of Requirements Elicitation Techniques: Empirical Results Derived from a Systematic Review. In Proceedings of the 14th IEEE International Requirements Engineering Conference, Minneapolis/St. Paul, MN, USA, 11–15 September 2006; pp. 179–188. [Google Scholar]
- Al-Busaidi, Z.Q. Qualitative research and its uses in health care. Sultan Qaboos Univ. Med. J. 2008, 8, 9–11. [Google Scholar] [PubMed]
- Pope, C.; van Royen, P.; Baker, R. Qualitative methods in research on healthcare quality. Qual. Saf. Health Care 2002, 11, 52–148. [Google Scholar] [CrossRef] [Green Version]
- Castillo-Montoya, M. Preparing for interview research: The interview protocol refinement framework. Qual. Rep. 2016, 21, 811–831. [Google Scholar]
- Venable, J.; Pries-Heje, J.; Baskerville, R. FEDS: A Framework for Evaluation in Design Science Research. Eur. J. Inf. Syst. 2016, 25, 77–89. [Google Scholar] [CrossRef] [Green Version]
- Offermann, P.; Levina, O.; Schönherr, M.; Bub, U. Outline of a Design Science Research Project. In Proceedings of the 4th International Conference Design Science Research in Information Systems and Technologies, Philadelphia, PA, USA, 6–8 May 2009. [Google Scholar]
- Cohen, M. User Stories Applied: For Agile Software Development; Addison-Wesley Professional: Boston, MA, USA, 2004. [Google Scholar]
- Janssen, J.H.N. The Right to Explanation: Means for ‘White-Boxing’ the Black-Box? Master’s Thesis, Tilburg University, Tilburg, The Netherlands, 2019. [Google Scholar]
- Chapman, P.; Clinton, J.; Kerber, R.; Khabaza, T.; Reinartz, T.; Shearer, C.; Wirth, R. The CRISP-DM user guide. In Proceedings of the 4th CRISP-DM SIG Workshop, Brussels, Belgium, 18 March 1999; Volume 1999. [Google Scholar]
- Christodoulou, E.; Ma, J.; Collins, G.S.; Steyerberg, E.W.; Verbakel, J.Y.; van Calster, B. A systematic review shows no performance benefit of machine learning over logistic regression for clinical prediction models. J. Clin. Epidemiol. 2019, 110, 12–22. [Google Scholar] [CrossRef] [PubMed]
- Gareth, J.; Witten, D.; Hastie, T.; Tibshirani, R. An Introduction to Statistical Learning with Applications in R; Springer: New York, NY, USA, 2013. [Google Scholar]
- Kotsiantis, S.B. Supervised Machine Learning: A Review of Classification Techniques. Informatica 2007, 31, 249–268. [Google Scholar]
- Vollmer, S.; Mateen, B.; Bohner, G.; Király, F.; Ghani, R.; Jonsson, P.; Cumbers, S.; Jonas, A.; McAllister, K.; Myles, P.; et al. ine learning and AI research for Patient Benefit: 20 Critical Questions on Transparency, Replicability, Ethics and Effectiveness. arXiv 2018, arXiv:1812.10404. [Google Scholar]
- Kaplan, B.; Maxwell, J. Qualitative Research Methods for Evaluating Computer Information Systems. In Evaluating the Organizational Impact of Healthcare Information Systems; Springer: New York, NY, USA, 2005. [Google Scholar]
- Burke Johnson, R. Examining the Validity Structure of Qualitative Research. Education 1997, 118, 282–292. [Google Scholar]
- Kiegelmann, M. The Role of the Researcher in Qualitative Psychology; Ingeborg Huber Verlag: Tübingen, Germany, 2002. [Google Scholar]
- Polit, D.F.; Beck, C.T. Generalization in quantitative and qualitative research: Myths and strategies. Int. J. Nurs. Stud. 2010, 47, 1451–1458. [Google Scholar] [CrossRef] [Green Version]
- Michael, W.D.; Dustin, T.; Edward, C.; Jonas, K.; Jeremy, N.; Ghassen, J.; Katherine, H.; Andrew, M.D. Analyzing the Role of Model Uncertainty for Electronic Health Records. arXiv 2019, arXiv:1906.03842. [Google Scholar]
- Sung, N.; Crowley, J.W.F.; Genel, M.; Salber, P.; Sandy, L.; Sherwood, L.M.; Johnson, S.; Catanese, V.; Tilson, H.; Getz, K.; et al. Central Challenges Facing the National Clinical Research Enterprise. JAMA J. Am. Med. Assoc. 2003, 289, 1278–1287. [Google Scholar] [CrossRef]
- Molnar, C. Interpretable Machine Learning; Leanpub: Munich, Germany, 2019. [Google Scholar]
- Ribeiro, M.T.; Singh, S.; Guestrin, C. Model-Agnostic Interpretability of Machine Learning. In Proceedings of the ICML Workshop on Human Interpretability in Machine Learning, New York, NY, USA, 23 June 2016. [Google Scholar]
- Shapley, L.S. A value for n-person games. In Contributions to the Theory of Games; Princeton University Press: Princeton, NJ, USA, 1953; pp. 307–317. [Google Scholar]
- Bartoletti, I. AI in Healthcare: Ethical and Privacy Challenges. In Artificial Intelligence in Medicine; Elsevier: Amsterdam, The Netherlands, 2019; pp. 7–10. [Google Scholar]
Figure 1.
Self-service data science research in context of related data science disciplines.

Figure 2.
Overview of AutoML methods.

Figure 3.
One hour benchmark test results.

Figure 4.
Word cloud of all comments on artefact evaluation questions.

Table 1.
Statistics for Kruskall Wallis test.
| Breast | Diabetes | Liver | Sick | |
|---|---|---|---|---|
| H-statistic | 11.36 | 18.64 | 17.93 | 27.87 |
| P-value | 0.995 ** | 0.324 ** | 0.455 ** | 0.386 ** |
** p < 0.001.
Table 2.
P-values and U statistic for Mann–Whitney U test compared to best performer.
| Breast | Diabetes | Liver | Sick | |||||
|---|---|---|---|---|---|---|---|---|
| p | U | p | U | p | U | p | U | |
| DecisionTree | 0.164 ** | 2.0 | 0.908 ** | 0.0 | 0.895 ** | 8.0 | 0.913 ** | 0.0 |
| TPOT | 0.236 | 40.0 | ||||||
| AutoWEKA | 0.395 | 46.0 | 0.455 | 48.0 | 0.263 | 40.0 | 0.913 ** | 0.0 |
| Autosklearn | 0.425 | 47.0 | 0.213 | 39.0 | 0.5 | 49.5 | ||
| Hyperoptsklearn | 0.8 * | 17.5 | 0.164 ** | 2.0 | 0.657 ** | 7.0 | 0.913 ** | 0.0 |
* p < 0.01 ** p < 0.001.
Table 3.
AutoML method scores on user story categories.
| Category/Method | Auto Sklearn | Auto-WEKA | TPOT | Hyperopt-Sklearn |
|---|---|---|---|---|
| User interaction (UI) | n/a | n/a | n/a | n/a |
| Model construction (MC) | 3 | 3 | 4 | 2 |
| Model explanation (MX) | 0 | 0 | 0 | 0 |
| Model usage (MU) | 1 | 1 | 1 | 1 |
| Total matches | 4 | 4 | 5 | 3 |
Table 4.
Artefact preferences of the five domain experts.
| Category | Preference | Score |
|---|---|---|
| User interaction | ||
| Upload dataset | GUI | 4/5 |
| Create a subset | Code | 3/5 |
| Workflow | Code | 4/5 |
| Workflow explanation | Code | 4/5 |
| Model construction | ||
| Progress reporting | Code | 4/5 |
| Model construction | Code | 5/5 |
| Model explanation | ||
| Compare results | GUI | 4/5 |
| Explanation missing data | Code | 4/5 |
| Readability | GUI | 4/5 |
© 2020 by the authors. Licensee MDPI, Basel, Switzerland. This article is an open access article distributed under the terms and conditions of the Creative Commons Attribution (CC BY) license (http://creativecommons.org/licenses/by/4.0/).
Share and Cite
MDPI and ACS Style
Ooms, R.; Spruit, M. Self-Service Data Science in Healthcare with Automated Machine Learning. Appl. Sci. 2020, 10, 2992. https://0-doi-org.brum.beds.ac.uk/10.3390/app10092992
AMA Style
Ooms R, Spruit M. Self-Service Data Science in Healthcare with Automated Machine Learning. Applied Sciences. 2020; 10(9):2992. https://0-doi-org.brum.beds.ac.uk/10.3390/app10092992
Chicago/Turabian StyleOoms, Richard, and Marco Spruit. 2020. "Self-Service Data Science in Healthcare with Automated Machine Learning" Applied Sciences 10, no. 9: 2992. https://0-doi-org.brum.beds.ac.uk/10.3390/app10092992
Note that from the first issue of 2016, this journal uses article numbers instead of page numbers. See further details here.