Article

Improvement of an Online Education Model with the Integration of Machine Learning and Data Analysis in an LMS

by
William Villegas-Ch
1,*,
Milton Román-Cañizares
1 and
Xavier Palacios-Pacheco
2
1
Escuela de Ingeniería en Tecnologías de la Información, FICA, Universidad de Las Américas, Quito 170125, Ecuador
2
Departamento de Sistemas, Universidad Internacional del Ecuador, Quito 170411, Ecuador
*
Author to whom correspondence should be addressed.
Submission received: 28 June 2020 / Revised: 13 July 2020 / Accepted: 22 July 2020 / Published: 4 August 2020
(This article belongs to the Special Issue Emerging Artificial Intelligence (AI) Technologies for Learning)

Abstract

:
The events that took place in the year 2020 have shown us that society is still fragile and that it is exposed to events that rapidly change the paradigms that govern it. This has been shown by a pandemic like Coronavirus disease 2019; this global emergency has changed the way people interact, communicate, study, or work. In short, the way in which society carries out all activities has changed. This includes education, which has bet on the use of information and communication technologies to reach students. An example of the aforementioned is the use of learning management systems, which have become ideal environments for resource management and the development of activities. This work proposes the integration of technologies, such as artificial intelligence and data analysis, with learning management systems in order to improve learning. This objective is outlined in a new normality that seeks robust educational models, where certain activities are carried out in an online mode, surrounded by technologies that allow students to have virtual assistants to guide them in their learning.

1. Introduction

Currently, society is affected by a health emergency that has changed the way it lives [1]. The Coronavirus disease 2019 (COVID-19) has revealed the fragility of all areas, be they health, education, industrial, etc. There is no part of society that has not been affected; however, it is the duty of universities and their research departments to work on all these weaknesses and create robust models based on what has been learned from this emergency [2]. For this, it is necessary to take into account the tools that have allowed us to combat this disease and that have served as a channel to keep certain areas available and functional that are necessary for the development and subsistence of society. These tools are information and communication technologies (ICT), which have allowed most activities to be carried out remotely and securely [3]. It should be noted that what happened has changed our vision of the way we live.
The new normality that the world is experiencing brings with it new challenges that must be overcome and that all sectors must assume with the use of ICT and new technologies. Higher education is one of the sectors of society that for several years has integrated these technologies into its activities [4]. This integration has allowed education to continue despite the severe drawbacks. However, it is necessary to identify the problems that have arisen and adopt adaptive education models that integrate new and better technologies that allow students to continue their learning in any situation [5]. To achieve this objective, it is necessary to return to certain concepts and tools that have been neglected. For example, the learning management systems (LMSs), which, in recent years, have lost prominence because they are considered by certain institutions as simple repositories. This vision took a drastic turn due to current circumstances, in which LMS is the medium that allows students to maintain interaction with their institutions [6].
It is necessary to specify that the face-to-face educational model under the current circumstances was forced to move to a virtual or online educational model [7]. This factor, although it seems to be easily absorbed by the students, makes a big difference in a deeper analysis [8]. A change in the study modality presents drastic results in the performance of the students, such as the loss of interest and lack of adaptability, factors that directly affect learning. In a traditional education model, the teacher is expected to be the main actor in learning, since he is the owner of knowledge [9]. The moment this changes, and the student becomes the main actor in their learning is where the problems begin. To solve them, it is important to create an ideal environment for the student, where they find the necessary resources for their learning. In addition, it is necessary to include systems that continuously monitor their performance [10], as well as the inclusion of systems that are in charge of assigning activities aligned with the characteristics of each student.
In this work, the integration of artificial intelligence (AI), data analysis, and LMS is proposed to improve an online education model and thereby improve student learning. To do so, it is based on an online education model from a university in Ecuador that participates in this research. As a tool, the model uses an LMS, where students find sections with resources and activities that serve for their training [11]. An AI system, such as machine learning, is integrated into this model, which is responsible for interacting and managing student performance. The objective is to transmit security and support to the student in their academic activities [12]. The model knows all the student’s data, both from the interaction with the student, and from the data obtained from the analysis. The task of data analysis is to identify patterns in students that allow their classification and thereby create an adaptive model that is aligned with the needs of each student. By integrating these technologies with the LMS, learning is prioritized; therefore, the student, upon entering the LMS, will meet a virtual assistant who knows their academic agenda and all the minors of their performance [13]. Through the academic agenda, the assistant knows what activities are to be carried out and sends notifications for compliance. The management of grades is another parameter that the assistant has; therefore, it constantly monitors student performance and has the ability to interact with the student to work on their learning.
The system after the analysis adjusts the activities that are presented as an evaluation mechanism and aligns them with the characteristics and needs of the student [14]. The system generates an alert that is discussed and verified with the teacher in order to improve the activity, change it, or even modify the course methodologies to achieve the objective of improving learning in an online educational model through the integration of technologies and interaction with students. The model is based on two essential components for its development: First, the university infrastructure. This component is the starting point as it offers a functional architecture for data processing and management. The deployed architecture allows the process to be aligned and adjusted to meet the integration requirements of technologies, such as big data and AI. The second component is the integration of new technologies; both data analysis and AI must converge in harmony and the data must be constantly evaluated. The evaluation allows the AI system to learn from the errors of each instance that is generated in the analysis and make increasingly successful decisions. For the sample, two chairs of the online modality were considered, which are related to ICT. The objective of choosing these subjects is that students have an adequate level with the use of ICT. Therefore, the handling of the new applications will not be indifferent to the student; on the contrary, they will have an effect of interest and involvement in the use of the tools. The work is divided as follows: In Section 2, a description of the works related to the research topic is made; Section 3 reviews the concepts used; Section 4 describes the proposed method; Section 5 shows the results of the investigation and discusses the results obtained; and finally, Section 6 presents the conclusions.

2. Related Works

Several related papers have been reviewed, highlighting the use of AI or educational data analysis tools in LMS [15]. However, these works do not propose the main objective of improving learning, making this integration an assistant for those involved. Certain works propose the use of data mining algorithms for knowledge discovery in educational databases [16]. This functionality aims to identify the deficiencies of the students in a given course. This knowledge is transferred to the areas or people in charge of the learning quality who are the ones who take the necessary corrective measures. Other works use more complex models that integrate business intelligence (BI) architectures. With the use of a BI, it is proposed to include several data sources to give greater granularity to the analysis [17]. The granularity in the analysis allows us to identify the variables that lead students to academic desertion, which is one of the problems with the greatest impact on virtual or online educational models.
The works related to the use of AI in the LMS mainly seek to help the teacher to generate better models and learning methodologies applied in these environments. There is important information about the use of specialized AI techniques in user interaction and that they learn from each interaction [18]. These models are robust and contribute significantly to the development of this work [19]. Based on the review carried out, it can be highlighted that the proposed work differs from those existing in the integration of two technologies, such as AI and data analysis, in a single environment. By centralizing all academic management in a single system, a virtual assistant can be created that, at first, manages the information of each student and is responsible for automatic and personalized monitoring. The assistant, in addition to learning from the user interaction, has all the information resulting from the data analysis [20]. The analysis is not limited to the data found in the LMS, as the integration of various sources becomes a key point to identify the needs and expectations of each student. The technology with this capacity is big data, and the amount and type of data that is integrated into the analysis provides adaptability to decision-making [21]. This integration allows AI to make quick and effective decisions about student performance.

3. Preliminary Concepts

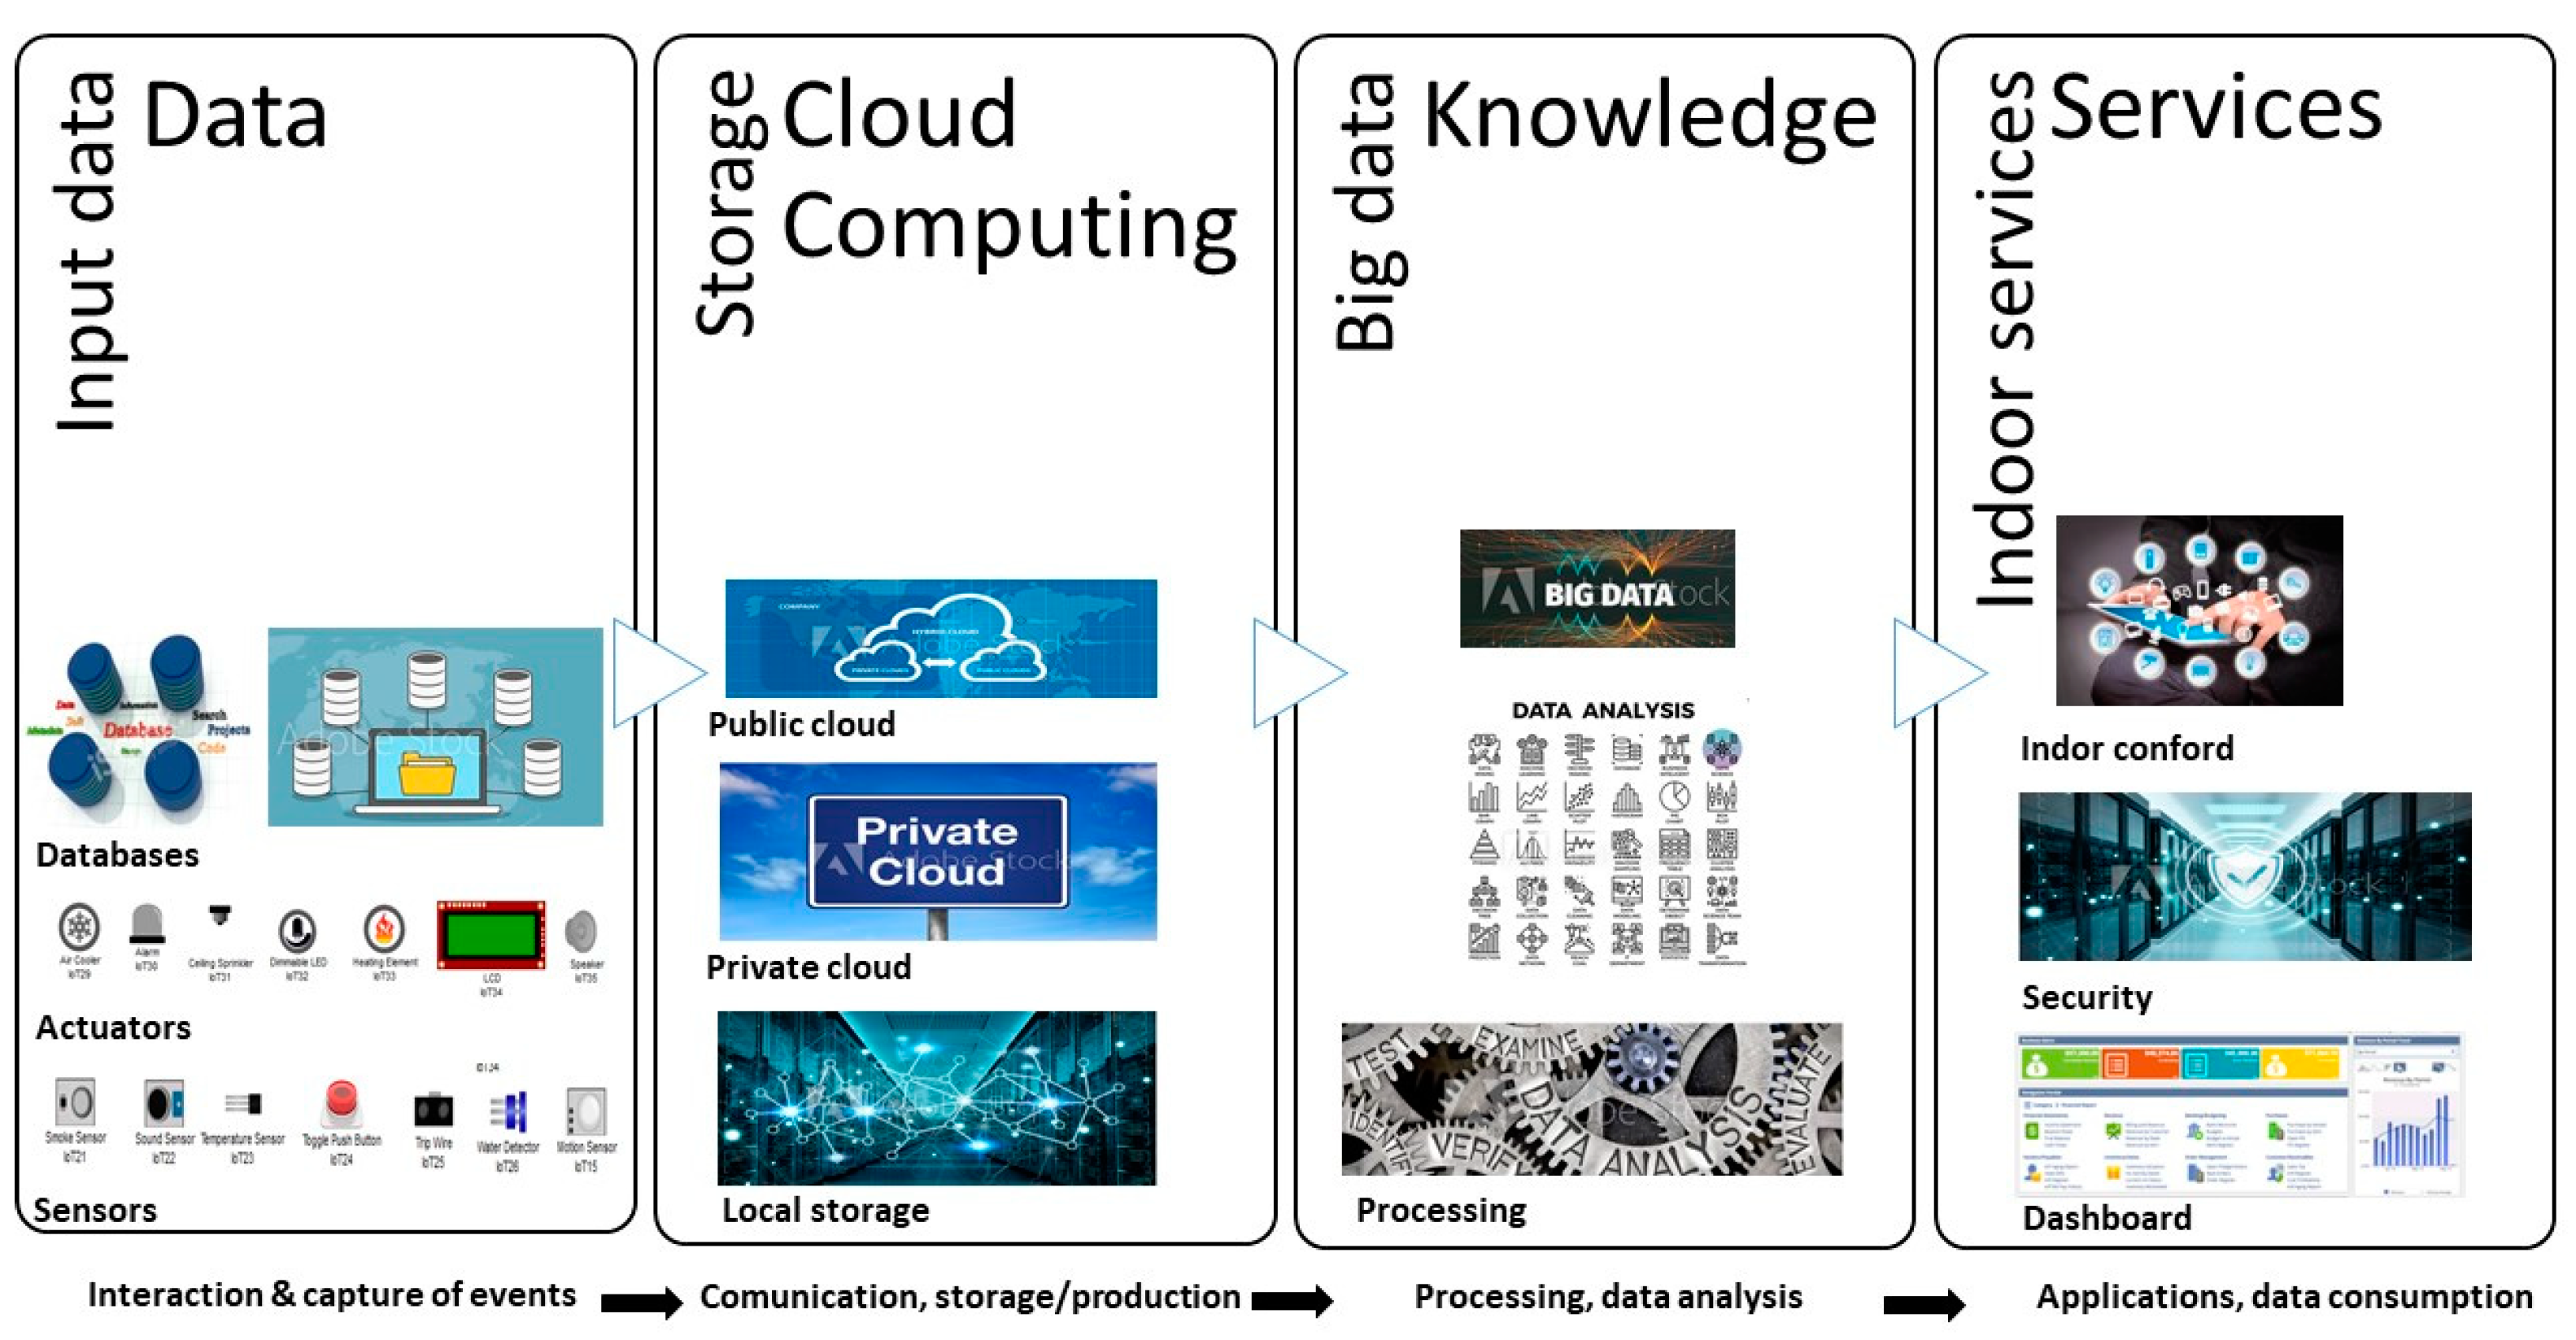
3.1. Analysis of Data

Data analysis is responsible for examining a set of data in order to draw conclusions about the information in order to make decisions, or to expand knowledge on a specific topic. Data analysis subjects the data to various operations in order to obtain precise conclusions that help achieve the proposed objectives. Data analysis is used in various industries to enable companies and organizations to make better business decisions, and it is also used in the sciences to verify or fail existing models or theories [22]. The difference with data extraction is defined by its scope, its purpose, and its focus on analysis. Data extractors classify vast data sets using sophisticated software to identify undiscovered patterns and establish hidden relationships. Data analysis focuses on inference, the process of drawing a conclusion based only on what the researcher knows [23]. The areas that generally use data analysis are:
  • Marketing: Data analysis has been used primarily to predict consumer behavior, including to classify it.
  • Human resources: Data analysis is also very useful within companies to maintain a good work environment, identifying potential employees.
  • Academics: Data analysis is also present in education; it serves to select new students and to measure student performance.

3.2. Artificial Intelligence

AI is the simulation of human intelligence by machines. In general, it is the discipline that tries to create systems capable of learning and reasoning as a human being [24]. These systems learn from experience, have the ability to solve problems under certain conditions, contrast information, and carry out logical tasks. Typically, an AI system is capable of analyzing high-volume data, identifying patterns and trends, and therefore formulating predictions automatically, quickly, and accurately. AI makes everyday experiences smarter [20]. How? By integrating predictive analytics and other AI techniques into applications that are used on a daily basis, for example:
  • Siri works as a personal assistant as it uses natural language processing.
  • Facebook and Google Photos suggest tagging and grouping of photos based on image recognition.
  • Amazon offers product recommendations based on shopping basket models.
  • Waze provides optimized traffic information and real-time navigation.
Artificial intelligence has many fields and its operation is based on the application of various techniques. Some of the most widely used are described below.
  • Machine learning is a type of artificial intelligence that gives computers the ability to learn. It is based on data analysis, through which new patterns are identified that allow modification of your behavior [7]. That is, it analyzes and processes information, discovers patterns, and acts accordingly.
  • Knowledge engineering is based on the use of the necessary techniques to create expert systems. It is a computational area that is used to store important information and uses it for strategic purposes [25]. The deeper the layers of information, the better the strategies applied.
  • Fuzzy logic is one of the most trending mathematical theories currently. It is based on the use of appreciations that are not totally true or false but occupy all the intermediate positions between the absolute truth and total falsehood [26].
  • Artificial neural networks is a technique whose behavior is inspired by the functioning of human neural networks. As in the human being, they are independent systems that are interconnected with each other [13]. Each artificial neuron receives a certain number of inputs, to which it gives a certain “weight”. Depending on the number of inputs and your weight, it will receive a certain “nervous impulse”, which translates into an output value [21].
  • Rule-based systems work by applying different rules for a given situation and comparing the results obtained. This task can be carried out by different methods. On the one hand, they can start from initial evidence or a situation and find their possible solution [27]. On the other hand, they can start from hypotheses with possible solutions and carry out the inverse journey to find the premise or evidence.
  • Expert systems are computer systems that function as a human expert in a specific subject. Its operation is based on learning, memorizing, and communicating information [28]. Normally, the information has been provided by human experts, and the system performs the processes based on standards to use its knowledge in particular situations. In turn, this expert system can learn and improve with future additions.
  • Artificial vision is the combination of hardware and software that allows devices to process and recognize images captured in the real world based on numerical or symbolic concepts [4].

3.3. Online Education Model

The development of ICT has opened up countless possibilities to carry out educational projects in which all people have the opportunity to access quality education regardless of when or where they are. Indeed, the access alternatives that have been put in the hands of people have eliminated time and distance as an obstacle to teaching and learning [6].
Online education is a modality of distance studies developed in a digital environment known as a virtual classroom, which is accessed through an Internet connection and uses technological tools for the teaching-learning process. It has the advantage of being an asynchronous study model, in which hours and days of the week are established for interaction with the teacher. Online education arises from the busy pace of life in which society currently lives [29]. Whether for work, family, or the geographical position of some people, online education achieves a common educational objective, without the limitations of space or time.
Some characteristics of online education models are:
  • Interactive model allows the student to interact with the content, their teachers, and fellow students.
  • Accessible, no matter the place or time, and works anywhere with Internet access.
  • Synchronous and asynchronous, allowing the student to participate in tasks or activities at the same time as others.
  • Online resources allow access to resources without the need to have them physically at any time that is necessary.

4. Method

For the development of the work, it is necessary to specify the environment where the implementation of the different systems will be carried out. By determining exactly the current conditions, it is possible to determine the ideal way of integrating technologies. In a second instance, the data analysis model that is required in the university center is determined, according to the variables and questions that are to be answered. Last but not least, the AI system that works in conjunction with the LMS, data analysis, and students is adjusted to improve learning in an online education model.

4.1. Identification of the Environment

In this work, a university from Ecuador participated, and this university offers two study modalities. The first modality is face-to-face, which meets the characteristics of a traditional modality, and learning depends on the experience and methodology applied by the teacher [30]. The student becomes a spectator of her own learning and must comply with previously established schedules. In addition, the teacher becomes the entity that determines what they should learn and how they should do it. For this reason, the teacher has a greater influence in identifying the performance of each student [19]. Therefore, this identification is biased to the teacher’s criteria, a factor that is not expected in an ideal learning model.
The second model that the university offers is online education. This model has been worked on and improved over 10 years. In addition, its evolution dates back to a virtual education model. This process has allowed the integration of information technology (IT) and has a technological architecture that becomes the basis of this work. The methodology used by this online education model has been designed for people who, due to their schedules and obligations, cannot access a face-to-face modality. This model takes as a platform an LMS, where schools and courses have been created depending on each degree. In the virtual course, the student must comply with three compulsory activities, which are the development of tasks, evaluations, and participation in forums. For the development of these activities, the student has a module where he will find all the resources that the teacher and designer of the course have considered relevant.
The course is designed in weekly modules; therefore, all activities must be completed and made available on the platform every seven days. The management of the modality has defined a specific schedule for 60-min asynchronous tutorials, where each tutor simply clarifies the doubts that have arisen in the week on the topics covered. The problem with this educational model is that although its intention is to adapt to the needs of students both in time and in learning [31], this does not really happen and there are very high dropout rates and low academic effectiveness. In addition, the learning indicators are not desired [15]. These problems generally point to students not having adequate study methodologies, as well as disciplined practice in keeping with their own schedules. These factors are understandable, since the highest percentage of students come from a face-to-face educational model [32]. The adaptability to this system where there is no daily control by the teachers and where the learning falls on the student becomes the main cause of abandonment and other problems already mentioned.
The technological infrastructure that the university uses for this modality becomes an advantage for the development of this work. It has been designed to support a high volume of transactions and services. Issues, such as information security and care, are covered by the IT department. This ensures that this work focuses on integrating AI, data analysis, and LMS without compromising data. Figure 1 presents the IT architecture that includes the university. This architecture is made up of layers, where an additional one has been included that is in charge of data analysis [33].
The data entry layer is responsible for obtaining data from all systems and devices that are available for student use [29]. In this layer, the data that students generate in social networks on specific topics about their condition as students is even considered. The data can be structured or unstructured, and the data analysis layer adds a value to the data.
The cloud computing and storage layer provides the opportunity to manage data according to its purpose. This is important in this work, since various activities are carried out through the use of mobile applications [34]. Various data from these activities are stored or processed directly in public or private clouds [35].
The knowledge layer is responsible for data analysis. To do so, it uses a big data architecture. This layer becomes the engine of the online education model [36]. This layer processes all the data found in the different sources and analyzes it through various data mining algorithms. The information passes to the AI system, which generates knowledge about the results obtained and interacts with the students and the areas in charge of learning [23].
The service layer is the integration of the systems and layers already mentioned in the LMS and presented to members of the online education modality [37]. The way the information is presented can also be presented in different systems related to the educational model.

4.2. Analysis of Data

Data analysis is of vital importance in this work due to the large amount of data that is expected to be processed, in addition to the type of data that it intends to integrate into the analysis. The technology that meets the characteristics of this work is big data. The objective that this fulfills is to analyze the data that comes from different repositories. The data generated by the students from the activities they carry out, as well as the interaction with the LMS is stored in its own database in a structured way. However, if only these data are considered, granularity is not obtained in the analysis. Moreover, the results will be segmented to the corresponding scores for each activity. This does not mean that real data is being obtained on the learning of each student. Therefore, it is necessary to integrate more information to the analysis architecture, as universities generally store the socioeconomic information of students and in some cases include relevant information on the academic performance of basic training institutions. This information allows the discovery of possible trends in the students and the way in which they learn [38]. All the aforementioned refers to structured data; however, this work aims to obtain information from students through all available sources, such as social networks.
The big data framework used for this work is based on Hadoop. This framework allows the processing of large volumes of data regardless of its type [39]. This feature and the reliability of Hadoop allows the analysis of as many variables as possible, guaranteeing granular and quality results. Hadoop, being an open-source system, allows storing, processing, and analyzing of academic data at no additional cost to the institution [40]. The Hadoop components that allow us to pose it as the ideal architecture for this work are the Hadoop Distributed File System (HDFS), which allows the data file not to be saved on a single machine but rather to be able to distribute the information to different devices. Mapreduce is a framework that makes it possible to isolate the programmer from all the tasks of parallel programming. It allows a program that has been written in the most common programming languages to be run in a Hadoop cluster [41]. YARN is a framework for task planning and cluster resource management.

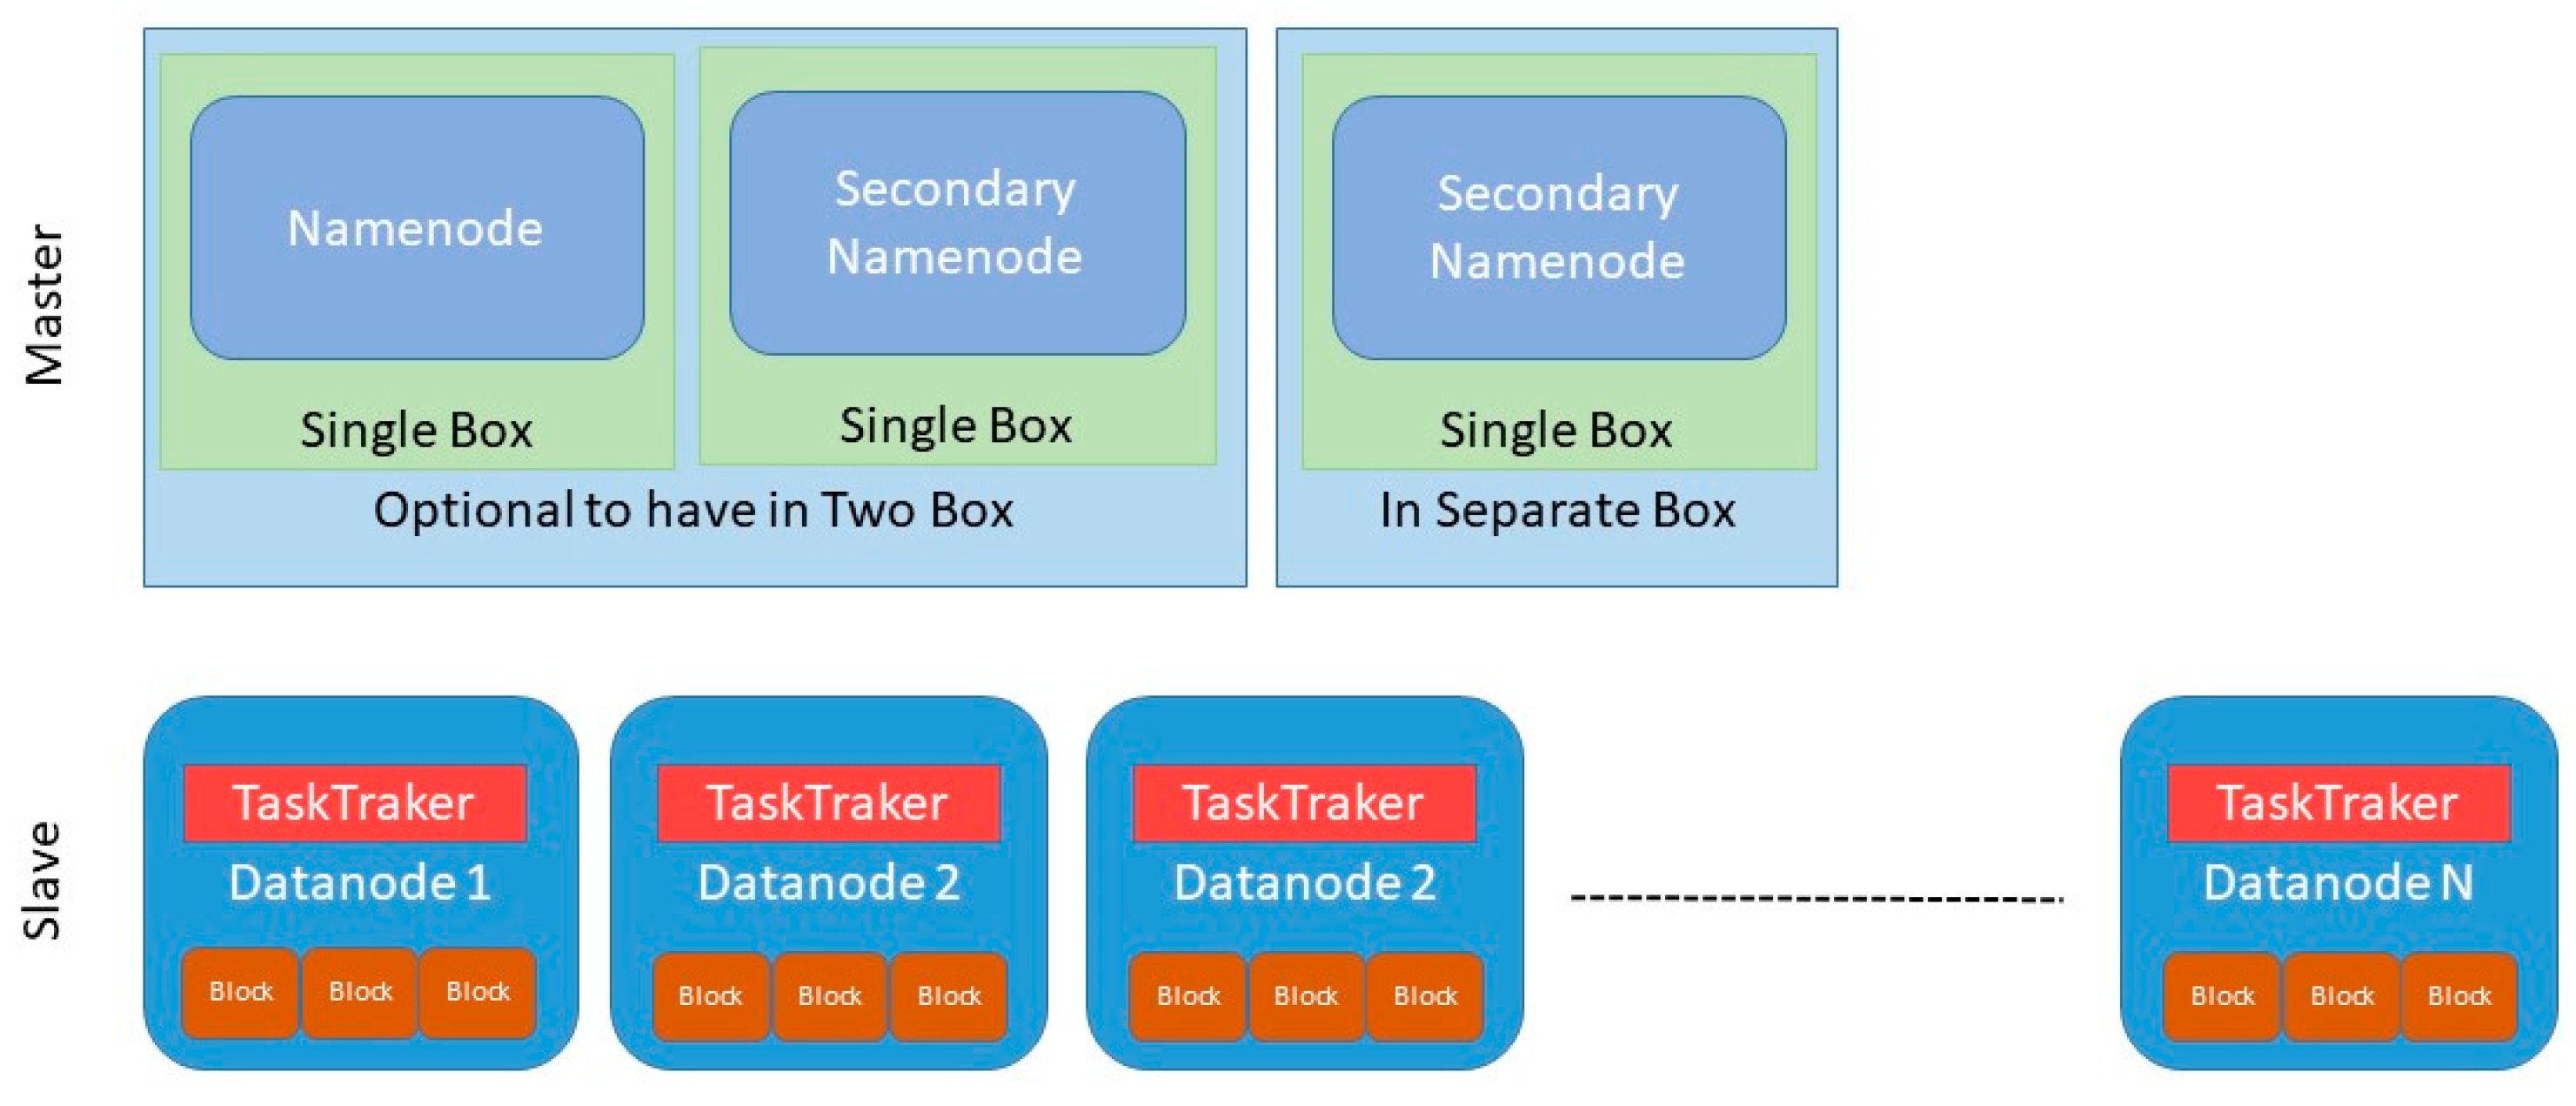
4.2.1. Hadoop Operation

MapReduce sends the computational process to the site where the data to be processed resides, which is collected in a cluster. When a MapReduce process is launched, the tasks are distributed among the different servers in the cluster and Hadoop manages the sending and receiving of data between nodes. Computing happens at nodes that have data on the premises to minimize network traffic. Once all the data has been processed, the user receives the result of the cluster.
MapReduce contains two phases, although the second is subdivided into two others:
  • Map.
  • Reduce: shuffle data and reduce.

4.2.2. Phases in Hadoop MapReduce

In Hadoop MapReduce, the input data is divided into separate chunks that are processed by the mappers in parallel. The results of the map are ordered, which are the input for the reducers. Generally, the inputs and outputs of jobs are stored in a file system, these being the storage and compute nodes [42]. It is common that the application logic cannot be decomposed into a single MapReduce run, so several phases are chained, treating the results of one as input for the mappers of the next phase. This feature allows the tasks of each fragment to be executed on the node where it is stored, reducing the data access time and movements between nodes in the cluster [40].
The framework is also responsible for managing resources, planning, restarting, and monitoring tasks with the Hadoop YARN manager, which has a single resource manager and a node manager on each node of the cluster [33].
  • The map phase runs on subtasks called mappers. These components are responsible for generating key-value pairs by filtering, grouping, ordering, or transforming the original data. Intermediate data pairs are not stored in HDFS.
  • The shuffle sort phase may not be necessary. It is the intermediate step between map and reduce that helps to collect data and sort them conveniently for processing. With this phase, the repeated occurrences in each of the mappers are added.
  • The reduce phase manages the aggregation of the values produced by all the mappers in the system or by the key-value-type shuffle phase based on their key. Finally, each reducer generates its output file independently, generally written in HDFS.
In Figure 2, the classification of the clusters where the processing of each node is assigned is observed, and the MapReduce framework has a master/slave architecture. It has a master server or JobTracker and several slave servers or TaskTrackers, one for each node in the cluster. The JobTracker is the point of interaction between users and the MapReduce framework. Users submit MapReduce jobs to the JobTracker, which puts them in a pending job queue and runs them in the order of arrival. The JobTracker manages the assignment of tasks and delegates the tasks to the TaskTrackers. TaskTrackers execute tasks under the command of the JobTracker and also handle the movement of data between the map phase and reduce [43].
MapReduce components align with the type of analysis required in developing a system that integrates AI, data analysis, and LMS. One of the conditions that establishes the use of Hadoop is that a real-time analysis is not necessary, but the architecture must guarantee the handling of a large volume of data, as well as its diversity [44]. Another factor that has been considered for the use of this architecture is the knowledge that exists on the part of the IT area of the university that participates in the study.

4.3. Artificial Intelligence

AI includes several tools that can be exploited by an online education model to endow systems with special characteristics that allow the creation of virtual assistants that interact directly with students. The AI aims to take the data that has been previously processed by big data and look for patterns in them. In this way, the system can autonomously classify the results and recommend different actions to students and tutors of the modality [45]. Among the AI tools that can perform this type of work are:
  • Expert systems are systems highly trained in a specific intellectual activity, based on the knowledge of experts in the field. A classic example is that of systems that play chess.
  • Chatbots are systems that make an interesting use of natural language processing and improve with each experience, allowing coherent two-way communication with humans, either oral or written.
  • Virtual assistants are the closest thing to a movie AI that we can interact with today. It recognizes our voice, adapts to the way we ask for things, and is able to recommend entertainment according to our tastes. One of the strengths of these technologies is that they have an immense number of users who feed them constantly and help reinforce their learning algorithms.
  • Machine learning are computer programs that try to learn from previous experience and examples, and have a specific and predetermined purpose that is generally modeling, predicting, understanding patterns in the data, or controlling some system.
According to the description of the main types of AI and how it is presented to the user, it is necessary to identify what is the need to be covered in the investigation. In the first instance, there is a need for an autonomous system that can generate knowledge of the data that is already obtained from the analysis [24]. The second instance is that the AI can interact with the user. These characteristics define expert systems or Chatbots as ideal systems for managing students. However, it is required that the tool has the capacity to generate learning on data for which it was never programmed and that, according to this learning, it recommends certain activities to students and teachers. For this reason, a machine learning model is used.
To implement a machine learning model, there are two main strategies:
  • Supervised learning: For this methodology, a previous training phase (datasets) is required, where hundreds of labels are introduced. If a machine is required to be able to recognize between dogs and cats in a photo, then we have to show the program thousands of images where it becomes clear what is a cat? What is a dog? After this training phase, the program would be able to identify each of the animals in different circumstances. This method is called classification. Another type of supervised learning would be regression, which is the same as following a continuous value. It is somewhat similar to the machine being able to follow logical values, such as if there is a numerical series of 2, 4, 6 that the machine is able to follow it as 8, 10, 12. This is used especially for prediction.
  • Unsupervised learning: In this procedure, a training phase is not required, and the machine must be able to understand and find patterns in the information itself directly. An example is to group students into homogeneous groups. If the information from thousands of clients with unstructured data is disclosed to the system, the computer system would be able to recognize the characteristics of the students, and segment it into profiles with similar criteria. This problem is called clustering or data agglomeration. This is useful to reduce the number of total variables to 2 or 3 maximums, so that there is no loss of information, and thus the data can be visualized, visually facilitating its understanding.

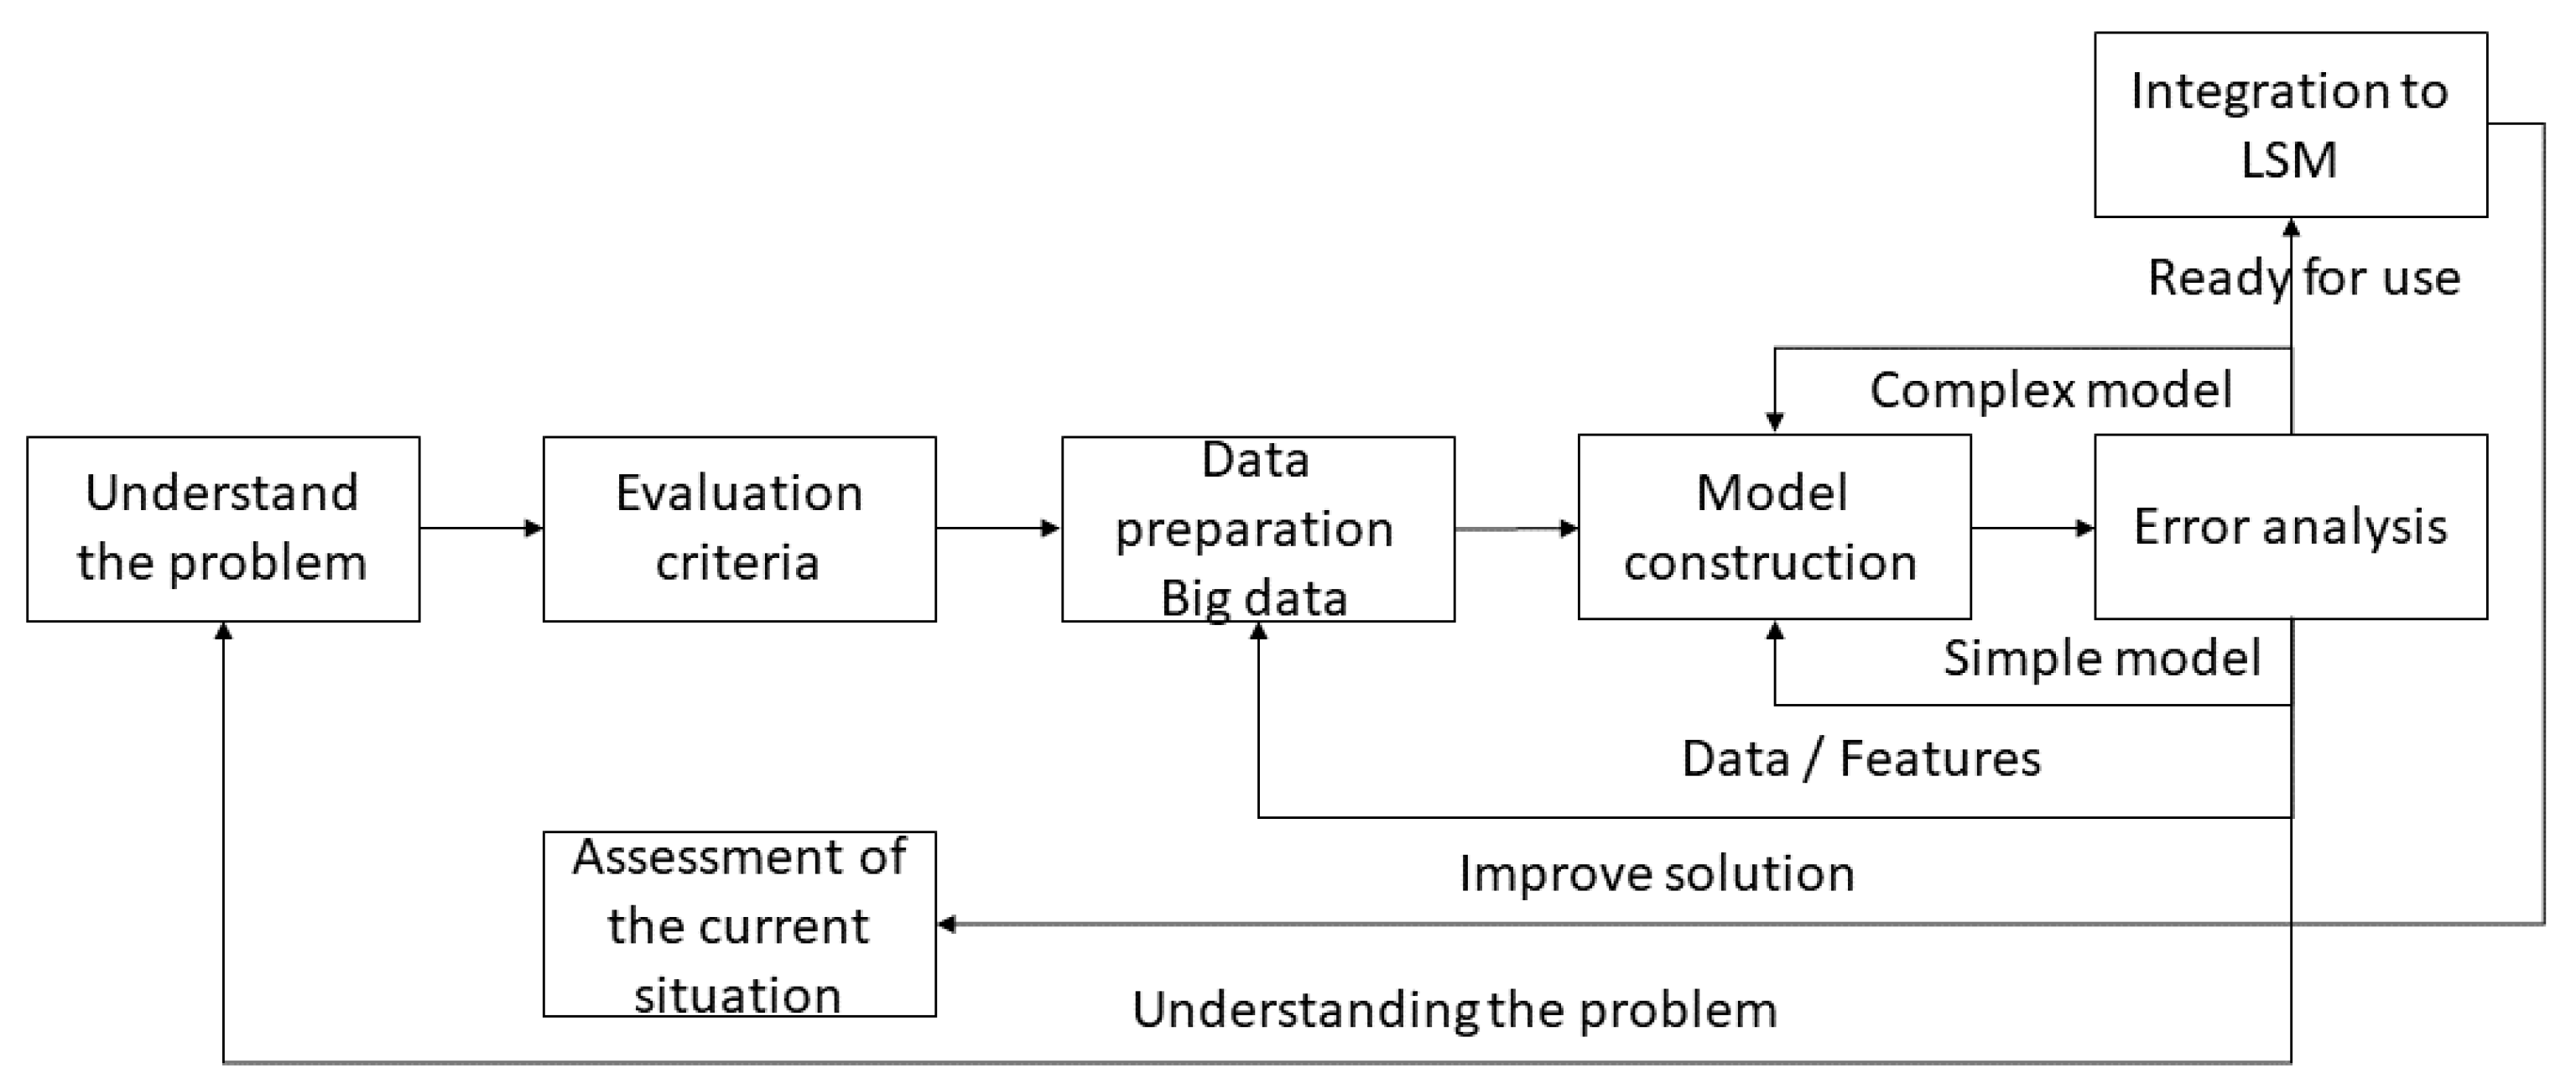
Phases for the Implementation of Machine Learning

Before thinking about the technological solution, it is necessary to address the business objective that is sought to be solved with a machine learning tool. The goals can be as diverse as improving conversions, reducing churn, or increasing user satisfaction [46]. The important thing is to be clear about which element to optimize to focus resources on it and not to implement a solution that exceeds the original goal [12].
Figure 3 shows the different phases of the machine learning process and how they interact with each other.
  • To understand the problem, it is important to understand the problem that we have to solve. Normally, this takes a long time, especially if the problem comes from a sector in which knowledge is poor. In this phase, it is necessary to create collaborative environments with people who know a lot about the problem.
  • To understand the data, it is common to do an exploratory analysis of the data to become familiar with it. Descriptive statistics, correlations, and graphs are performed in exploratory analysis to better understand the story the data is telling. Furthermore, it helps to estimate if the available data is sufficient, and relevant, to build a model.
  • Defining an evaluation criterion is usually an error measure. Typically, the root-mean-square error is used for regression problems and the cross entropy is used for classification problems. For classification problems with two classes that are common, other measures, such as accuracy and completeness, are used.
  • Evaluation of the current solution: Probably, the problem to be solved with machine learning, is already being solved in another way. Surely, the motivation to use machine learning to solve this problem is to get better results. Another common motivation is to get similar results automatically, replacing boring manual work. By measuring the performance of the current solution, it can be compared to the performance of the machine learning model. In this way, the feasibility of using the machine learning model is identified. If there is no current solution, a simple solution can bee defined that is very easy to implement. For example, predicting a student’s grade in a course with automatic learning is comparable to a simple solution (the average value of their qualifications during an academic period). Only in this way, when the machine learning model is implemented, is it possible to define if it is good enough, if it needs to be improved, or if it is not worth implementing. If in the end it turns out that the current solution or a simple solution is similar to the machine learning solution, it is probably better to use the simple solution.
  • Prepare the data: Although this process is carried out by the big data section, it is necessary to detail certain factors in the machine learning phases. Data preparation is one of the phases of machine learning that involves more effort. The main challenges are incomplete data. It is normal that the ideal data for the machine learning process is not available. For example, to predict which students are more likely to enter an online educational model, the data we have comes from an online survey. There will be many people who have not filled in all the fields. However, incomplete data is better than having no data at all, and there are several actions that can be used to prepare the data, such as deleting it, imputing it with a reasonable value, imputing it with a machine learning model, or doing nothing and using some machine learning technique that handles incomplete data. When combining data from various sources, some data may come from a database, others from a spreadsheet, from files, etc. It is necessary to combine the data so that the machine learning algorithms can consider all the information. Calculating the relevant features (machine learning algorithms) works much better with relevant features instead of pure data [47]. As an example, it is much easier for people to know the temperature in degrees Celsius than to know how many milligrams of mercury have been dilated in a traditional thermometer.
  • Building the model: The phase of building a machine learning model, once the data is ready, surprisingly requires little effort. This is because there are already several machine learning libraries available. Many of them are free and open source. During this phase, which type of machine learning technique to use it chosen. The machine learning algorithm will automatically learn to get the right results with the historical data that has been prepared.
  • Error analysis: This phase is important to understand what needs to be done to improve machine learning results. In particular, the options will be use a more complex model, use a simpler model, identify the need to include more data and/or more characteristics, develop a better understanding of the problem, etc. In the error analysis phase, it is important to ensure that the model is capable of generalization. Generalization is the ability of machine learning models to produce good results when they use new data. In general, it is not difficult to achieve acceptable results using this process. However, to get excellent results, we have to iterate over the previous phases several times. With each iteration, the understanding of the problem and the data will grow. This allows the design of better relevant features and reduces the generalization error. A greater understanding also offers the possibility of choosing with more criteria the machine learning technique that best suits the problem.
  • Model integrated into a system. Once the model has been adjusted based on error, the machine learning model is integrated into the LMS. The phase of integrating a machine learning model into a system requires a greater relative effort. It is necessary to be able to automatically repeat the data preparation phases, which requires that the machine learning model communicates with other parts of the system and that the results of the model are used in the system. Furthermore, errors must be automatically monitored. The model warns if model errors grow over time to rebuild the machine learning model with new data, either manually or automatically. The construction of interfaces for the data is necessary so that the model can obtain data automatically and so that the system can use its prediction automatically.

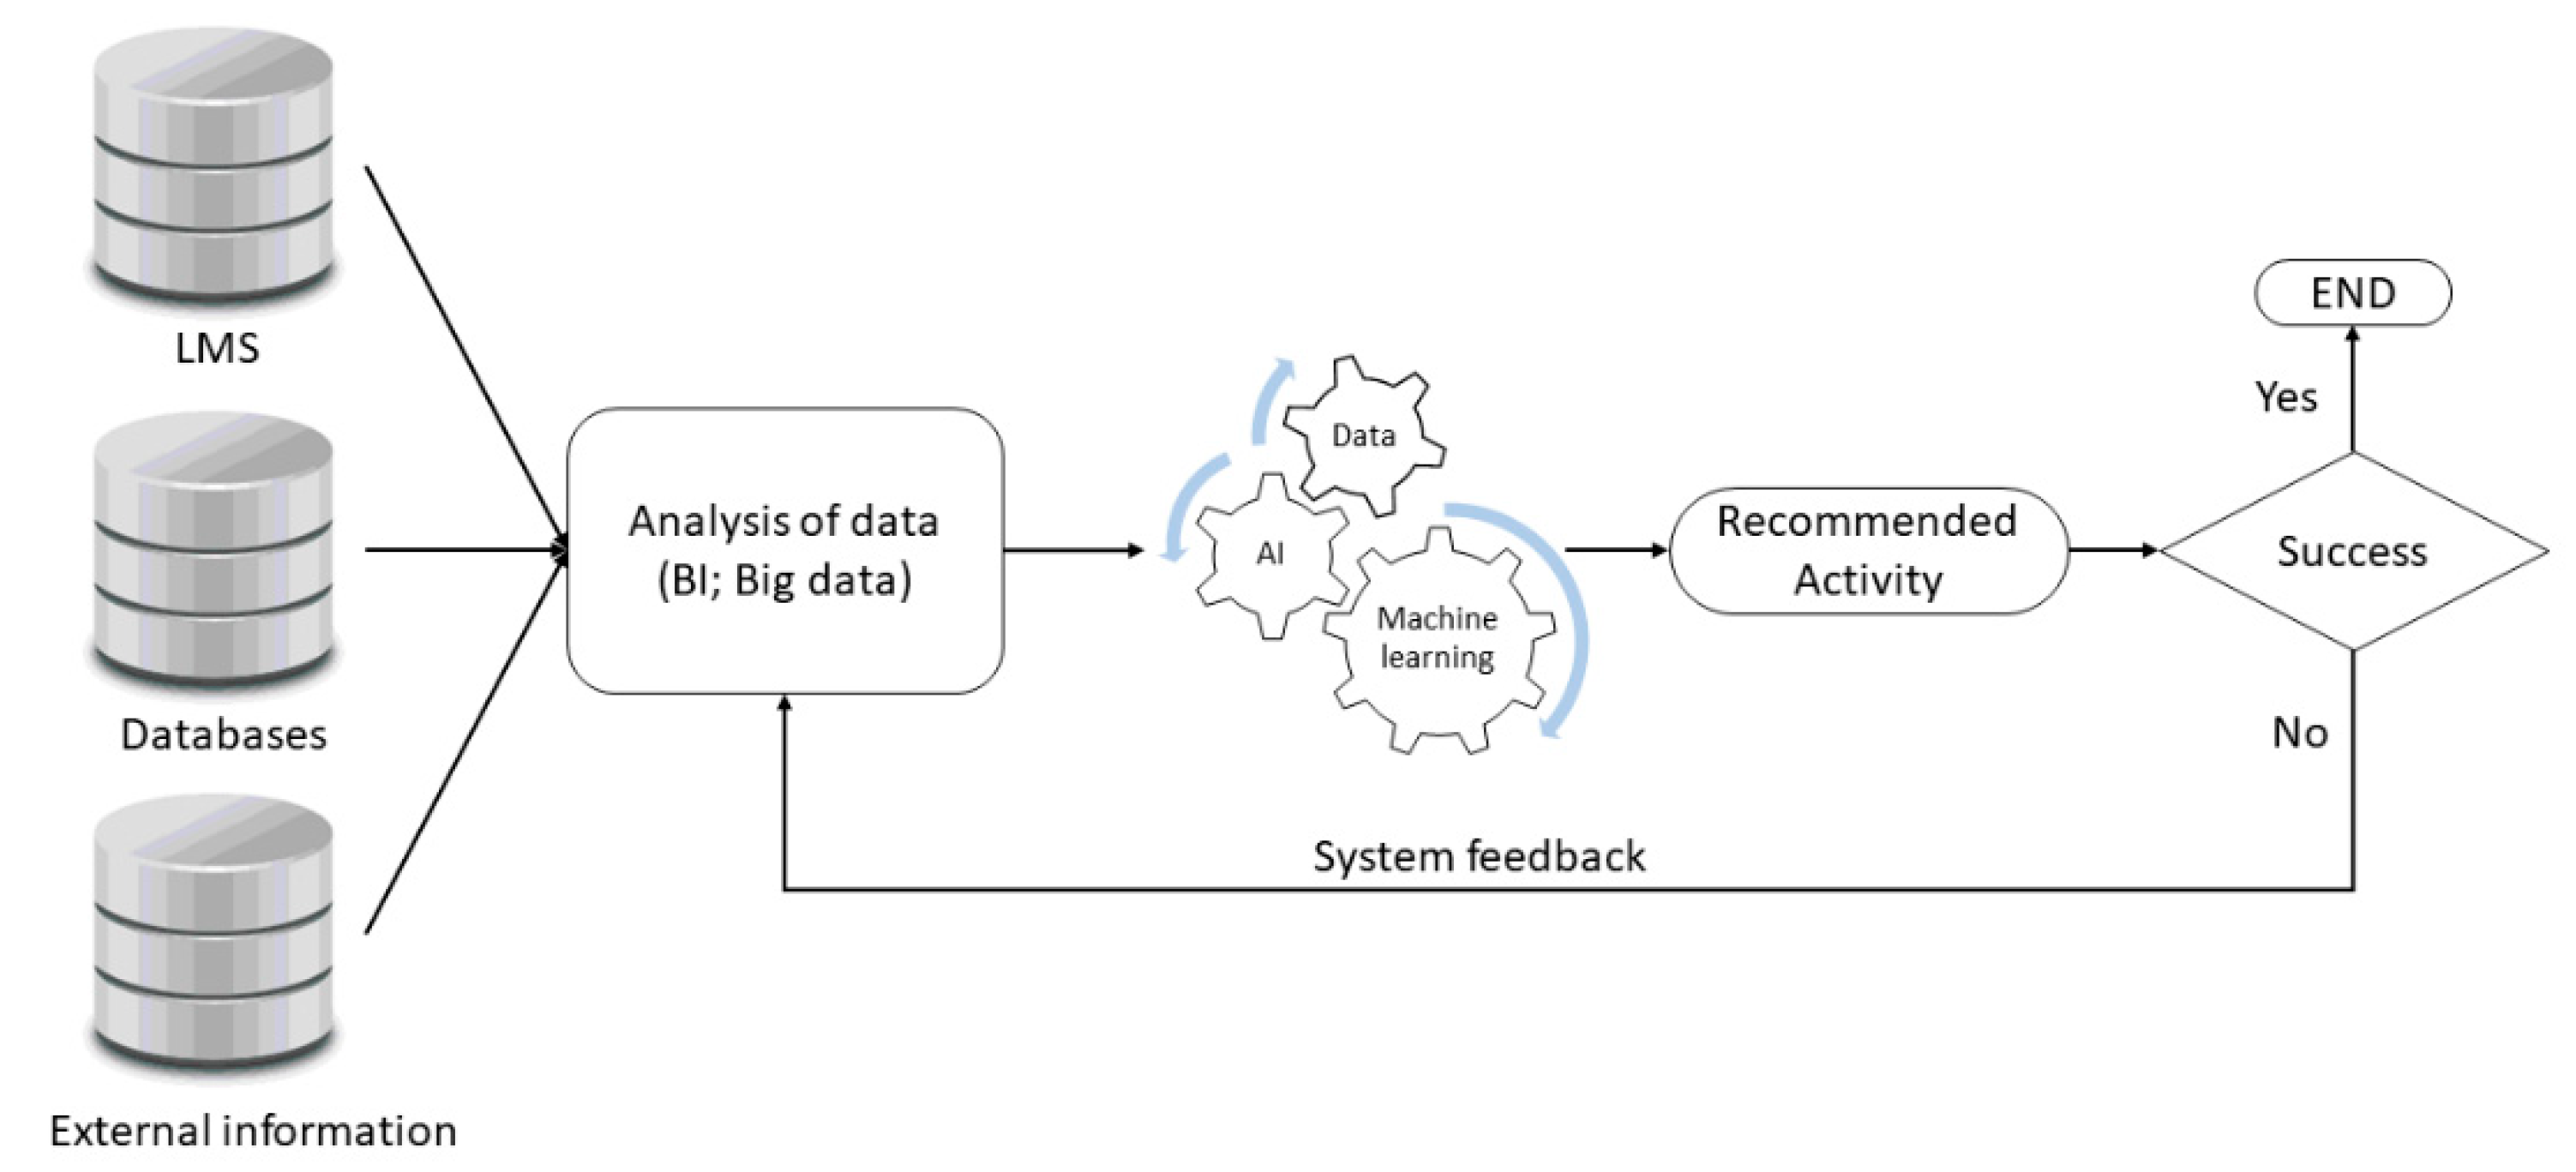
4.4. Integration of Big Data, Machine Learning, and LMS

For the integration of systems and new technology, a model, such as that shown in Figure 4, is used, where the LMS has a large volume of data on all activities and interaction with the student. The interaction is not direct; however, it is common for there to be information in the LMS database on how long each student remains active on the platform. Other information that can be obtained is the usual schedule in which each student connects [19]. To these data are added those that are stored in databases of administrative and other academic systems. This information allows an analysis that covers a greater number of variables that the big data architecture is in charge of processing [48].
The architecture of big data in its first phase is responsible for extracting data from all sources, and this data is structured and unstructured [49]. Once it obtains all the data, it processes it in such a way that it is useful for obtaining the knowledge that the AI is in charge of through machine learning. Machine learning is responsible for recognizing the patterns of analysis and with them performs the classification of individuals. The patterns are presented as characteristics of each group, where the objective is that, by knowing the needs of each group, the system has the ability to propose strategies or techniques that improve the way activities are presented [50]. Furthermore, it improves learning by recommending learning activities to students based on their needs.
Once the activities have been recommended, machine learning enters a state of analysis of the results. For this, the system analyzes the grades that students obtain in the recommended activities. If the results show that the student improved their performance, the process ends and returns to the initial state. If the system detects that the results do not exceed the average mark, defined as the basis for the university’s policies, the system feeds back and integrates this data into the analysis phase, where the system begins the process again until satisfactory results are obtained.

5. Discussion and Results

The new normality that humanity lives in forces institutions to seek new models that adapt to the needs of people. This paper takes this consideration into account and seeks to improve an online education model. The integration of technologies becomes the starting point to improve education and monitor student performance. It should be noted that the current reality has allowed online, virtual, or hybrid education models to become the expected response to continue with higher learning. This work is applied on the architecture and infrastructure of the university that participated in the study. This is considered an advantage, since, having the majority of the infrastructure deployed, it allows the concentration of efforts on the design of the machine learning model. If there is a need to modify any layer of the architecture, it is simply updated without the need to generate higher technical, human, or economic costs.
With the integration of these technologies, the monitoring of student performance is improved, which generally depends clearly on the criteria of the teacher or those in charge of learning. With this model, the monitoring does not have human actors, the systems are in charge of carrying out a continuous analysis of each student, and the machine learning model will even detect the cases that have the highest risk of low academic performance. This feature allows thee generation of an early warning that is currently established when the academic monitoring department knows a certain number of grades. Early detection of the comprehensive model allows the generation of projections based on the student’s history. For example, in students who had problems in the subject of introduction to calculus, the system recognizes them as possible cases with problems in calculus I and subjects whose prerequisite is introduction to calculus. This analysis can be very superficial; however, the system can even determine a possible case of repetition by analyzing the topics that make up a subject.
For the recommendation of activities, machine learning has knowledge of the student’s performance in each activity. Therefore, the decision is made based on the best results that the student obtains in each activity. For example, cases have been detected where type activities, rapid evaluations by means of true and false items, do not align with the need of a certain group of students. The model identifies these groups and recommends other types of activities to the course designer. For this, the development of active learning is taken as an essence. In this type of learning, a wide variety of activities have been developed that machine learning proposes to the student according to their needs.
In order to evaluate the proposed model, several exercises were carried out in which the two parallels that belong to an administrative career were involved. Each parallel is made up of 24 students, and the follow-up period was 16 weeks, which generally lasts one academic period. Each level is made up of five subjects, among which students must take general, complementary, and professionalizing subjects. The sample of students belongs to the fourth level. The main reason why this group was chosen is for information obtained from the academic monitoring department. Here, it was found that the first two years of study is where the highest dropout rate is recorded. In addition, students at this level have taken all computer science subjects, allowing them to adapt more easily to a model based on the integration of technologies. The online education model of the university participating in the study complies for each course or subject with an already standardized model consisting of 16 weeks. These are divided into two partials each of seven weeks plus one partial evaluation. Within the LMS, specifically Moodle in the case of the university, each of the courses is created and registered and these have been divided into modules that respond to each week of the period. The courses consist of a main module that provides detailed information on the type of study, the matter, and the assigned tutor. In the same way, the student will find the syllabus and the study guide that allows him to know exactly the topics to be reviewed and the activities to be completed. Within each week, the module is divided into sections that contain the resources, activities, and corresponding information to assign an asynchronous meeting with the tutor.
In the resources section, each tutor is in charge of uploading all the material corresponding to the topic of the week. These resources must be aligned according to the learning results of the subject. The tutor usually uploads his own material, such as a presentation, the resolution of an exercise, or a reading. In addition, it must include supporting material, such as videos, readings, scientific articles, etc.
In the activities section, the student finds everything to do during each week. An activity is an opinion forum, where the student comments critically and objectively on a topic raised by the tutor. Another activity that the student must complete is a task that meets the requirements set forth in Bloom’s taxonomy. The objective of this theory is that after completing a learning process, the student acquires new skills and knowledge. For this reason, it consists of a series of levels built with the purpose of ensuring meaningful learning that lasts throughout life. The levels of Bloom’s taxonomy are know, understand, apply, analyze, evaluate, and create. In addition, the student must complete a questionnaire-type evaluation, the purpose of which is to encourage students to read the resources.
The last section maintains the information corresponding to the asynchronous meeting with the tutor. The objective of the meeting is that students can make all the queries directly to the tutor or can receive feedback on the activities or topics discussed. Each meeting lasts 60 min. In this model, these meetings are not mandatory and the student can review the recording as many times as they deem necessary.
Once the scenario where the model is integrated has been defined, the variables that explain the dropout are established. The set of variables is the university degree corresponding to the numerical value of the general average of a student’s secondary studies, the number of subjects passed, the number of enrollments in the defined periods, the subjects taken (between 1 and 20, coded according to the average number of subjects taken), the sex, and the age of the students between 19 and 30 years old. The problem addressed refers to the detection of the causes of university dropout; previous works have considered desertion to constitute the failure of a student in a consecutive period. In the first exercise, big data requires access to all logs of activities carried out by teachers and students that are usually stored in MySQL. All the data obtained from the different sources went through a processing and transformation phase in order to obtain clean data that are analyzed by Hadoop in search of the patterns that the students follow.
In Figure 5, the patterns of the first exercise are presented, where the results of the activities carried out by the students during the established period are obtained. In the “x” axis, the activities, where H1 is the forums, H2 the tasks, and H3 the questionnaire-type evaluations, are shown. On the “y” axis, the obtained grade is presented. It is necessary to indicate that the grades respond to the use of rubrics that guarantee learning. These grades range from 1 to 10. On this axis, six is marked as an acceptable grade that meets the minimum learning criteria. In the forums, it is observed that the learning level is high in most cases, and the low grades are mostly due to the fact that the student did not register their participation or that the contributions were not objective. In the task, based on Bloom’s taxonomy, mean values are obtained that represent that a part of the students adequately meets the requirements of the activity. The group closest to 1 is the questionnaire-type evaluations. These evaluations consist of 10 questions that are scheduled to be completed in 20 min, where the student must answer each question in an average of two minutes. In this activity, the values are extremely low and do not contribute to learning.
The result obtained by big data is taken by the AI to feed machine learning and learn about this data for decision-making. The AI model integrated the analysis, the data from the LMS in relation to the time of dedication of the students to the reading of the teacher’s resource, and the data from a survey carried out on the students, where the time they had to answer each question was discussed. The data from this analysis was subjected to the naive Bayes data mining algorithm with the results presented in Table 1.
The algorithm performed the analysis of 51 instances to identify the reason why the scores in the evaluations present a performance below the expected. Of the 51 instances, 48 were classified as correct, with 94.1176%. This value was considered as true to assume the decision of the analysis. The results are presented in Table 2.
The results obtained gave as a result that the time available to answer each question (2 min), damages the development of the evaluation. These results were compared with the number of evaluations that the LMS closed because the evaluation time was completed. The number of instances that detect this effect are 18 effective and one erroneous or that the analysis detected it as an evaluation difficulty. In the time of the dedication of the students to the reading of the teacher’s resources, 15 true instances were obtained. Finally, in the difficulty of the evaluation, 15 correct instances were registered and two were registered as the cause of the problem, the time assigned to each question. Based on this analysis, the machine learning model recommended that the tutor increased the response time for each question. The mean was calculated so that each of the questions is answered in 2 min and 30 s with a total evaluation time of 25 min. The modification was made, and the results obtained in the following evaluation are those presented in Figure 6.
According to the figure, the evaluations improved considerably thanks to the data analysis and the learning carried out in the machine learning model. When necessary, the model adds a greater number of variables to the analysis and makes a decision considering the results. In this exercise, information from the LMS and from a survey of the students was detected. The model allows adjustment of the weights to guarantee effective decision-making. This becomes a necessity when the results are adjusted, such as those presented in Table 2. In addition, the rapid action of the model allows effective corrections to be taken before an event becomes a problem. This consideration is made when evaluations were assigned in the same period.

6. Conclusions

Education will never be the same. Online, virtual, or hybrid educational models have become the main actors in learning and research, in which the integration of all technology as a basis for improving learning is a priority. Through new student-centered educational models, it is possible to improve learning and reduce problems, such as high dropout rates and low academic effectiveness rates, which is measured in the number of graduates in relation to the number of admissions.
This work allows technology to become the ideal assistant for both students and teachers. Further, it allows the management of calendars to the students, as well as the generation of events, reminders, and notifications that indicate to the student what activities must be fulfilled, and based on its results, it can carry out a continuous accompaniment that allows the student to improve their performance. The system allows the teacher to know the learning status of each student, but it does so based on a granular analysis of all the data that the system has.
As a contribution to the online education modality, the work serves as an evaluating entity for learning and generates indicators on each methodology used. Furthermore, the knowledge generated by the model allows it to improve the resources and activities, making online education a quality model with the ability to provide agile responses, even before an event occurs, such as dropout. By reducing the dropout of students from a university, it manages to conserve the income of economic resources that can be used in the generation of virtual laboratories, which has been one of the fragile subjects of online education and that the pandemic has made remarkable. Another issue related to the adequate management of resources is that the model becomes the main actor in student monitoring and educational quality. Therefore, universities can reorganize the human resources that were responsible for these activities. It must be considered that generally, the monitoring tasks and the educational quality depend on the criteria of certain people. The proposed model does so based on a granular analysis of a large volume of student data.
As future works, it is proposed to integrate into this model two technologies as important as those used. These technologies are the blockchain, which seeks to secure the data and processes of the students and the institution. In addition, the inclusion of internet of things will be considered as important. In this modality, the inclusion of devices to obtain data that allows the educational model to be continuously improved is desirable.

Author Contributions

Conception and design of the study, W.V.-C.; implementation of the architecture, W.V.-C.; writing of the article, W.V.-C.; approval of the version presented, W.V.-C.; design of the platforms, M.R.-C. and W.V.-C.; formal analysis of the research, M.R.-C. and W.V.-C.; validation of the results; M.R.-C. and W.V.-C.; performance evaluation, X.P.-P.; data analysis and interpretation; X.P.-P.; approval of the submitted version; X.P.-P. All authors have read and agreed to the published version of the manuscript.

Funding

This research received no external funding.

Conflicts of Interest

The authors declare no conflict of interest.

References

  1. Li, H.; Liu, S.M.; Yu, X.H.; Tang, S.L.; Tang, C.K. Coronavirus disease 2019 (COVID-19): Current status and future perspectives. Int. J. Antimicrob. Agents 2020, 55, 105951. [Google Scholar] [CrossRef]
  2. Riofrio, G.; Encalada, E.; Guaman, D.; Aguilar, J. Business intelligence applied to learning analytics in student-centered learning processes. In Proceedings of the Latin American Computing Conference, Arequipa, Peru, 19−23 October 2015; pp. 1–10. [Google Scholar]
  3. Beldarrain, Y. Distance education trends: Integrating new technologies to foster student interaction and collaboration. Distance Educ. 2006, 27, 139–153. [Google Scholar] [CrossRef]
  4. Hssina, B.; Bouikhalene, B.; Merbouha, A. Europe and MENA Cooperation Advances in Information and Communication Technologies; Rocha, A., Mohammed, S., Felgueiras, C., Eds.; Springer International Publishing: Saidia, Marocco, 2017; Volume 520, ISBN 978-3-319-46567-8. [Google Scholar]
  5. Villegas-Ch, W.; Lujan-Mora, S.; Buenano-Fernandez, D. Application of a Data Mining Method in to LMS for the Improvement of Engineering Courses in Networks. In Proceedings of the 10th International Conference of Education, Research and Innovation (Iceri2017), Seville, Spain, 16–18 November 2017; pp. 6374–6381. [Google Scholar]
  6. Comendador, B.E.V.; Rabago, L.W.; Tanguilig, B.T. An educational model based on Knowledge Discovery in Databases (KDD) to predict learner’s behavior using classification techniques. In Proceedings of the IEEE International Conference on Signal Processing, Communications and Computing, Shanghai, China, 20–25 March 2016; pp. 1–6. [Google Scholar]
  7. Kim, T.; Lim, J. Designing an Efficient Cloud Management Architecture for Sustainable Online Lifelong Education. Sustainability 2019, 11, 1523. [Google Scholar] [CrossRef] [Green Version]
  8. Ferguson, R. Learning analytics: Drivers, developments and challenges. Int. J. Technol. Enhanc. Learn. 2013, 4, 304–317. [Google Scholar] [CrossRef]
  9. Lee, S.J.; Lee, H.; Kim, T.T. A study on the instructor role in dealing with mixed contents: How it affects learner satisfaction and retention in e-learning. Sustainability 2018, 10, 850. [Google Scholar] [CrossRef] [Green Version]
  10. Lee, J.; Song, H.D.; Hong, A.J. Exploring factors, and indicators for measuring students’ sustainable engagement in e-learning. Sustainability 2019, 11, 985. [Google Scholar] [CrossRef] [Green Version]
  11. Villegas-Ch, W.; Palacios-Pacheco, X.; Buenaño-Fernandez, D.; Luján-Mora, S. Comprehensive learning system based on the analysis of data and the recommendation of activities in a distance education environment. Int. J. Eng. Educ. 2019, 35, 1316–1325. [Google Scholar]
  12. Darcy, A.M.; Louie, A.K.; Roberts, L.W. Machine learning and the profession of medicine. JAMA J. Am. Med. Assoc. 2016, 315, 551–552. [Google Scholar] [CrossRef] [PubMed]
  13. Villegas-Ch, W.; Arias-navarrete, A.; Palacios-pacheco, X. Proposal of an Architecture for the Integration of a Chatbot with Artificial Intelligence in a Smart Campus for the Improvement of Learning. Sustainability 2020, 12, 1500. [Google Scholar] [CrossRef] [Green Version]
  14. Villegas-Ch, W.; Palacios-Pacheco, X.; Luján-Mora, S. Artificial intelligence as a support technique for university learning. In Proceedings of the IEEE World Conference on Engineering Education (EDUNINE), Lima, Peru, 26 May 2019; pp. 1–6. [Google Scholar]
  15. Villegas-Ch, W.; Luján-Mora, S. Analysis of data mining techniques applied to LMS for personalized education. In Proceedings of the IEEE World Engineering Education Conference (EDUNINE), Santos, Brazil, 19–22 March 2017; pp. 85–89. [Google Scholar]
  16. Villegas-Ch, W.; Palacios-Pacheco, X.; Ortiz-Garcés, I.; Luján-Mora, S. Management of educative data in university students with the use of big data techniques. Rev. Iberica Sist. Tecnol. Inf. 2019, E19, 227–238. [Google Scholar]
  17. Villegas-Ch, W.; Luján-Mora, S.; Buenaño-Fernandez, D. Data mining toolkit for extraction of knowledge from LMS. In Proceedings of the ACM International Conference Proceeding Series, Moscow, Russia, 18–21 April 2017; Volume 1346, pp. 31–35. [Google Scholar]
  18. Hill, J.; Ford, W.R.; Farreras, I.G. Computers in Human Behavior Real conversations with artificial intelligence: A comparison between human—Human online conversations and human—Chatbot conversations. Comput. Hum. Behav. 2015, 49, 245–250. [Google Scholar] [CrossRef]
  19. Boran, A.; Bedini, I.; Matheus, C.J.; Patel-Schneider, P.F.; Keeney, J. A smart campus prototype for demonstrating the semantic integration of heterogeneous data. In Lecture Notes in Computer Science (Including Subseries Lecture Notes in Artificial Intelligence and Lecture Notes in Bioinformatics); Springer: Berlin/Heidelberg, Germany, 2011; Volume 6902, pp. 238–243. [Google Scholar]
  20. Zhou, J.; Zhou, Y.; Wang, B.; Zang, J. Human–Cyber–Physical Systems (HCPSs) in the Context of New-Generation Intelligent Manufacturing. Engineering 2019, 5, 624–636. [Google Scholar] [CrossRef]
  21. Sultan Mahmud, M.; Zhexue Huang, J.; Salloum, S.; Emara, T.Z.; Sadatdiynov, K. A Survey of Data Partitioning and Sampling Methods to Support Big Data Analysis. Big Data Min. Anal. 2020, 3, 85–101. [Google Scholar] [CrossRef]
  22. Popoola, S.I.; Atayero, A.A.; Badejo, J.A.; John, T.M.; Odukoya, J.A.; Omole, D.O. Learning analytics for smart campus: Data on academic performances of engineering undergraduates in Nigerian private university. Data BR 2018, 17, 76–94. [Google Scholar] [CrossRef] [PubMed]
  23. Peng, M.Y.-P.; Tuan, S.-H.; Liu, F.-C. Establishment of Business Intelligence and Big Data Analysis for Higher Education. In Proceedings of the International Conference on Business and Information Management, Beijing, China, 23–25 July 2017; pp. 121–125. [Google Scholar]
  24. Colin, H.; Donnelly, I.A. Ambient intelligence: Technologies, applications, and opportunities. Proc. Annu. Meet. ISSS 2017, 91, 399–404. [Google Scholar]
  25. Syeda Farha Shazmeen, S.F.S. Performance Evaluation of Different Data Mining Classification Algorithm and Predictive Analysis. J. Comput. Eng. 2013, 10, 1–6. [Google Scholar] [CrossRef]
  26. Lee, C.K.M.; Na, C.M.; Kit, N.C. IoT-based asset management system for healthcare-related industries. Int. J. Eng. Bus. Manag. 2015, 7, 7–19. [Google Scholar]
  27. Shawar, B.A.; Atwell, E.S. Using corpora in machine-learning chatbot systems. Int. J. Corpus Linguist. 2005, 10, 489–516. [Google Scholar] [CrossRef]
  28. Chen, C. Personalized E-learning system with self-regulated learning assisted mechanisms for promoting learning performance. Expert Syst. Appl. 2009, 36, 8816–8829. [Google Scholar] [CrossRef]
  29. D’Adamo, I.; Falcone, P.M.; Ferella, F. A socio-economic analysis of biomethane in the transport sector: The case of Italy. Waste Manag. 2019, 95, 102–115. [Google Scholar] [CrossRef]
  30. Riquelme, J.C.; Ruiz, R.; Gilbert, K. Minería de datos: Conceptos y tendencias. Intel. Artif. 2006, 10, 11–18. [Google Scholar]
  31. Shukla, V.K.; Verma, A. Enhancing LMS Experience through AIML Base and Retrieval Base Chatbot using R Language. In Proceedings of the International Conference on Automation, Computational and Technology Management, London, UK, 24–26 April 2019; pp. 561–567. [Google Scholar]
  32. Villegas-Ch, W.; Luján-Mora, S. Systematic Review of Evidence on Data Mining Applied to LMS Platforms for Improving E-Learning. In Proceedings of the International Technology, Education and Development Conference, Valencia, Spain, 6–8 March 2017; pp. 6537–6545. [Google Scholar]
  33. Villegas-Ch, W.; Molina-Enriquez, J.; Chicaiza-Tamayo, C.; Ortiz-Garcés, I.; Luján-Mora, S. Application of a Big Data Framework for Data Monitoring on a Smart Campus. Sustainability 2019, 11, 5552. [Google Scholar] [CrossRef] [Green Version]
  34. Pacheco, J.; Hariri, S. Anomaly behavior analysis for IoT sensors. Trans. Emerg. Telecommun. Technol. 2018, 29, 1–15. [Google Scholar] [CrossRef]
  35. Aazam, M.; Khan, I.; Alsaffar, A.A.; Huh, E.N. Cloud of Things: Integrating Internet of Things and cloud computing and the issues involved. In Proceedings of the 2014 11th International Bhurban Conference on Applied Sciences and Technology, Islamabad, Pakistan, 14–18 January 2014; pp. 414–419. [Google Scholar]
  36. Taleb, I.; Serhani, M.A. Big Data Pre-Processing: Closing the Data Quality Enforcement Loop. In Proceedings of the IEEE International Congress on Big Data (BigData Congress), Boston, MA, USA, 11–14 December 2017; pp. 498–501. [Google Scholar]
  37. Shah, S.; Soriano, C.B.; Coutroubis, A.D. Is big data for everyone? The challenges of big data adoption in SMEs. In Proceedings of the 2017 IEEE International Conference on Industrial Engineering and Engineering Management (IEEM), Singapore, 11–13 December 2017; pp. 803–807. [Google Scholar]
  38. Mohammed, A.F.; Humbe, V.T.; Chowhan, S.S. A review of big data environment and its related technologies. In Proceedings of the 2016 International Conference on Information Communication and Embedded Systems (ICICES), Chennai, India, 23–24 February 2016; pp. 1–5. [Google Scholar]
  39. Merla, P.; Liang, Y. Data analysis using hadoop MapReduce environment. In Proceedings of the 2017 IEEE International Conference on Big Data (Big Data), Chennai, India, 23–24 February 2017; pp. 4783–4785. [Google Scholar]
  40. McHugh, J.; Cuddihy, P.E.; Williams, J.W.; Aggour, K.S.; Vijay, S.K.; Mulwad, V. Integrated access to big data polystores through a knowledge-driven framework. Proc. IEEE Int. Conf. Big Data 2018, 2018, 1494–1503. [Google Scholar]
  41. Saraladevi, B.; Pazhaniraja, N.; Paul, P.V.; Basha, M.S.S.; Dhavachelvan, P. Big data and Hadoop—A study in security perspective. Procedia Comput. Sci. 2015, 50, 596–601. [Google Scholar] [CrossRef] [Green Version]
  42. Luo, L. Data Acquisition and Analysis of Smart Campus Based on Wireless Sensor. Wirel. Pers. Commun. 2018, 102, 2897–2911. [Google Scholar] [CrossRef]
  43. Dai, W.; Ji, W. A mapreduce implementation of C4.5 decision tree algorithm. Int. J. Database Theory Appl. 2014, 7, 49–60. [Google Scholar] [CrossRef]
  44. Thusoo, A.; Sarma, J.; Jain, N.; Shao, Z.; Chakka, P.; Anthony, S.; Liu, H.; Wyckoff, P.; Murthy, R. Hive: A warehousing solution over a map-reduce framework. Proc. VLDB Endow. 2009, 2, 1626–1629. [Google Scholar] [CrossRef]
  45. Rahman, A.M.; Al Mamun, A.; Islam, A. Programming challenges of chatbot: Current and future prospective. In Proceedings of the 5th IEEE Region 10 Humanitarian Technology Conference 2017, Dhaka, Bangladesh, 21–23 December 2017; Volume 2018, pp. 75–78. [Google Scholar]
  46. Toutouh, J.; Arellano, J.; Alba, E. BiPred: A Bilevel Evolutionary Algorithm for Prediction in Smart Mobility. Sensors 2018, 18, 4123. [Google Scholar] [CrossRef] [Green Version]
  47. Arora, R.; Asstt, S.; Cse, D. Comparative Analysis of Classification Algorithms on Different Datasets using WEKA. Int. J. Comput. Appl. 2012, 54, 975–8887. [Google Scholar] [CrossRef]
  48. Lai, C.-T.; Chang, H.-H.; Lee, K.-T.; Huang, J.-Y.; Lee, W.-P. Predicting Drug Side Effects Using Data Analytics and the Integration of Multiple Data Sources. IEEE Access 2017, 5, 20449–20462. [Google Scholar]
  49. Chen, Y.S.; Tsai, Y.T. A mobility management using follow-me cloud-cloudlet in fog-computing-based RANs for smart cities. Sensors 2018, 18, 489. [Google Scholar] [CrossRef] [PubMed] [Green Version]
  50. Yang, C.T.; Chen, S.T.; Liu, J.C.; Liu, R.H.; Chang, C.L. On construction of an energy monitoring service using big data technology for the smart campus. Clust. Comput. 2019, 23, 265–288. [Google Scholar] [CrossRef]
Figure 1. Technological architecture of a university for the management of an online education modality [33].
Applsci 10 05371 g001
Figure 2. Architecture of a MapReduce master/slave model [13].
Applsci 10 05371 g002
Figure 3. Phases for the implementation of a machine learning model.
Applsci 10 05371 g003
Figure 4. Big data integration model—Machine learning and LMS.
Applsci 10 05371 g004
Figure 5. Data analysis of the activities developed in an online education model with the use of big data. H1: Forums, H2: Homework, H3: Evaluations.
Applsci 10 05371 g005
Figure 6. Results obtained by improving the evaluation execution times. H1: Forums, H2: Homework, H3: Evaluations.
Applsci 10 05371 g006
Table 1. Stratified cross-validation.
Correctly Classified Instances4894.1176%
Incorrectly Classified Instances35.8824%
Kappa statistic0.9113
Mean absolute error0.0447
Root mean squared error0.1722
Relative absolute error10.0365%
Root relative squared error36.4196%
Total Number of Instances51
Table 2. Matrix of confusion.
ABC← Classified as
1500|  a = T. Dedication
0181|  b = T. Question
0215|  c = Difficulty

