A Personalised Emotion-Based Model for Relaxation in Virtual Reality


IDLab, Department of Information Technology, Ghent University—Imec, Technologiepark-Zwijnaarde 126, 9052 Ghent, Belgium
*
Author to whom correspondence should be addressed.
Appl. Sci. 2020, 10(17), 6124; https://0-doi-org.brum.beds.ac.uk/10.3390/app10176124
Submission received: 7 August 2020
/
Revised: 31 August 2020
/
Accepted: 1 September 2020
/
Published: 3 September 2020
(This article belongs to the Special Issue Innovative Solutions for Augmented and Virtual Reality Applications)
Abstract
:One of the most frequent health problems is stress. It has been linked to negative effects on employee well-being in many occupations, and it is considered responsible for many physical and psychological problems. Traditional in-person relaxation therapy has proven to be effective in reducing stress. However, it has some drawbacks such as high cost, required infrastructure and the need for qualified trainers. Relaxation therapy in Virtual Reality (VR) tries to solve these problems. However, one aspect has received little attention, that is personalised therapy. Indeed, while many studies show the need for patient-tailored relaxation exercises, little existing work focuses on personalised VR content. One reason for this is the complexity of recognising emotions, which is required for emotion-based adaptive VR. In this work, a method for adapting VR content to the emotional state of the user is presented. This model has been applied in a VR relaxation therapy application, which adapts to the user’s emotional state utilising a heuristic optimiser. Simulations have proven the performance and usability of the emotion model. Additionally, this paper explores the impact of the order in which adaptations are performed on the effectiveness of the relaxation experience.
1. Introduction
According to the World Health Organisation (WHO), stress, especially relating to work activities, is the second most frequent health problem, impacting one-third of employed people in the European Union [1,2,3]. It has been widely linked with adverse effects on employees, their psychological and physical well-being in many occupations, with teaching and educational professionals at particular risk [4,5]. Excess of stress contributes to the development of physical ailments such as hypertension, ulcers, skin disorders, headaches, arteriosclerosis, cardiovascular diseases, and other life-threatening diseases [6,7]. Due to the prevalence of these stress-related health conditions, the cost to a nation’s health care system, and the loss of quality of life for individuals, concerns over the effects of stress are increasing among public health professionals [8].
Given the impact of stress, research has focused on means to reduce stress through relaxation therapy [2]. Relaxation therapy resorts to certain stress management techniques which have proven to help in allowing the body to cope with stress. Some of these techniques are biofeedback training to increase heart rate variability, paced breathing, muscle relaxation, or mental imaging and music [1]. While research has shown their effectiveness, most techniques require perseverance and focus of the patient which is difficult to maintain. Exercises can be perceived to be boring, tedious or impractical. Furthermore, escaping to a different environment is not always possible.
Virtual Reality (VR) can provide the required effectiveness for various kinds of therapy [9]. By fully immersing the user in a new environment, they can virtually teleport to a more suited location for relaxation. This immersion eliminates the many distracting factors of the real environment. Furthermore, it reduces costs, as the user only requires a Head Mounted Display (HMD) and an Internet connection, instead of the dedicated trainers and infrastructures of traditional relaxation therapy. Finally, where real-life relaxation therapy adopts a personally tailored approach, the VR counterpart should follow in this path. Indeed, given its individualistic essence, VR has the potential to provide personalised solutions to the users. However, due to the absence of a trainer or therapist, the personalisation needs to be automated by a computer system.
In previous research, the potential of personalised VR for relaxation have been explored. For example, Pizzoli et al. [10] proposed a user-centered VR experience for general relaxation. However, current solutions are either too tailored for a very particular user-type or very generic thus decreasing their effectiveness. Furthermore, they tend to rely fully on sensor data and subjective user evaluations. While employing user data aids to tailor and adapt the applications, the variability makes it difficult to create models that could be utilised for a broad range of users. For such cases, there is a need for objectively driven models able to fit a broad range of users.
This work proposes a personalised and adaptive VR model for relaxation therapy in VR. Employing a broad set of possible adaptations in a Virtual Environment (VE), our approach models relaxation as a function of three other emotions, namely stress, arousal and fear. We have evaluated our approach both for relaxation indoor and outdoor environments and for a wide range of users. Our results illustrate the potential of employing objective models for personalisation approaches in VR.
The remainder of this paper is structured as follows. Section 2 describes the state of the art on VR for relaxation therapy. Section 3 introduces our method providing all the equations and theoretical reasoning behind the definition of the model. Section 4 and Section 5 present the evaluation setup details and evaluation results. Finally, Section 6 concludes this paper.
2. Related Work
VR has been used in clinical settings to treat a range of cognitive, emotional and motor problems in various psychological and psychiatric disorders [9,11,12,13,14,15,16]. Many studies have shown that the VR-based therapy is as effective as their in-vivo (traditional) counterpart [13,17,18].
Shah et al. [19], Soyka et al. [20], Gerber et al. [21] and Anderson et al. [22] performed studies providing empirical evidence for the effect of using VR for reducing stress in various domains of application. Indeed, the study by Shah et al. reported positive results on stress reduction and/or anxiety through exposure to natural imagery in VR. Additionally, the authors employed abdominal breathing and muscle relaxation as well as psycho-education in their study. Their tests were focused on people with mood disorders who had been submitted to a hospital. Gerber et al. restricted themselves to patients in an Intensive Care Unit (ICU) while Anderson et al. explored the effect on people living and working in isolated and confined environments (e.g., submarines, space). Whereas Soyka et al. did not envision a particular target group but focused on underwater scene imagery. Additionally, Anderson et al. discussed the need for a personalised experience in relaxation VR. They suggest that the effect of natural imagery on stress reduction depends on personal preference. Many of the existing work focuses on (personalised) relaxation in the context of a specific condition (e.g., cancer treatment, ICU) and not for general relaxation or de-stressing. This work focuses on the latter.
It has been suggested in previous research that providing a personalised treatment would indeed improve the therapy, either in effectiveness or in user satisfaction [23]. In 1987, Graffam and Johnson [24] already did a comparative study between two relaxation strategies. Their finding was that both strategies were equally effective while one was more preferred than the other by patients. Hyland et al. [25] came to similar conclusions as well when performing a study comparing six different relaxation techniques. This shows there is a definite and clear need for personalised relaxation therapy. However, most studies on VR based relaxation lack this personalised and adaptive approach [26]. Only a few papers in literature make contributions to this specific domain. In their paper [10], Pizzoli et al. propose a VR experience with personalised content as an alternative to generic story-telling or guided activities for regulating emotions in VR.
Personalised systems need input to adapt to the user. For real-time adaptations, continuous data streams are preferred to estimate a certain state of the user, e.g., predicting the emotional state for biofeedback. Substantial research has been done on detecting this emotional state from various sensor data [27,28]. Healey et al. [29] developed a system for predicting stress while driving based on heart rate and skin conductance data. Miranda et al. [30] also used heart rate but in combination with spontaneous blink rate to detect anxiety. They did, however, find that heart rate was the most prominent predictor.
Other work researches the use of machine learning techniques such as Convolutional Neural Network (CNN) [31] and Support Vector Machine (SVM) [32] in detecting emotions. These algorithms are often very complex and need large amounts of computing power and expensive wearables. In some cases, they are designed for one particular setting without proof for application to other settings [29]. For many use cases, aimed at relaxation, these are unacceptable requirements. These use cases require simple usage, non-intrusive and non-obstructing sensors, and preferably cheap hardware. Therefore, there is a need for simpler models predicting the emotional state of a person. Developing such a model needs a deep understanding of emotions on a biological and physiological level [33].
3. Methodology
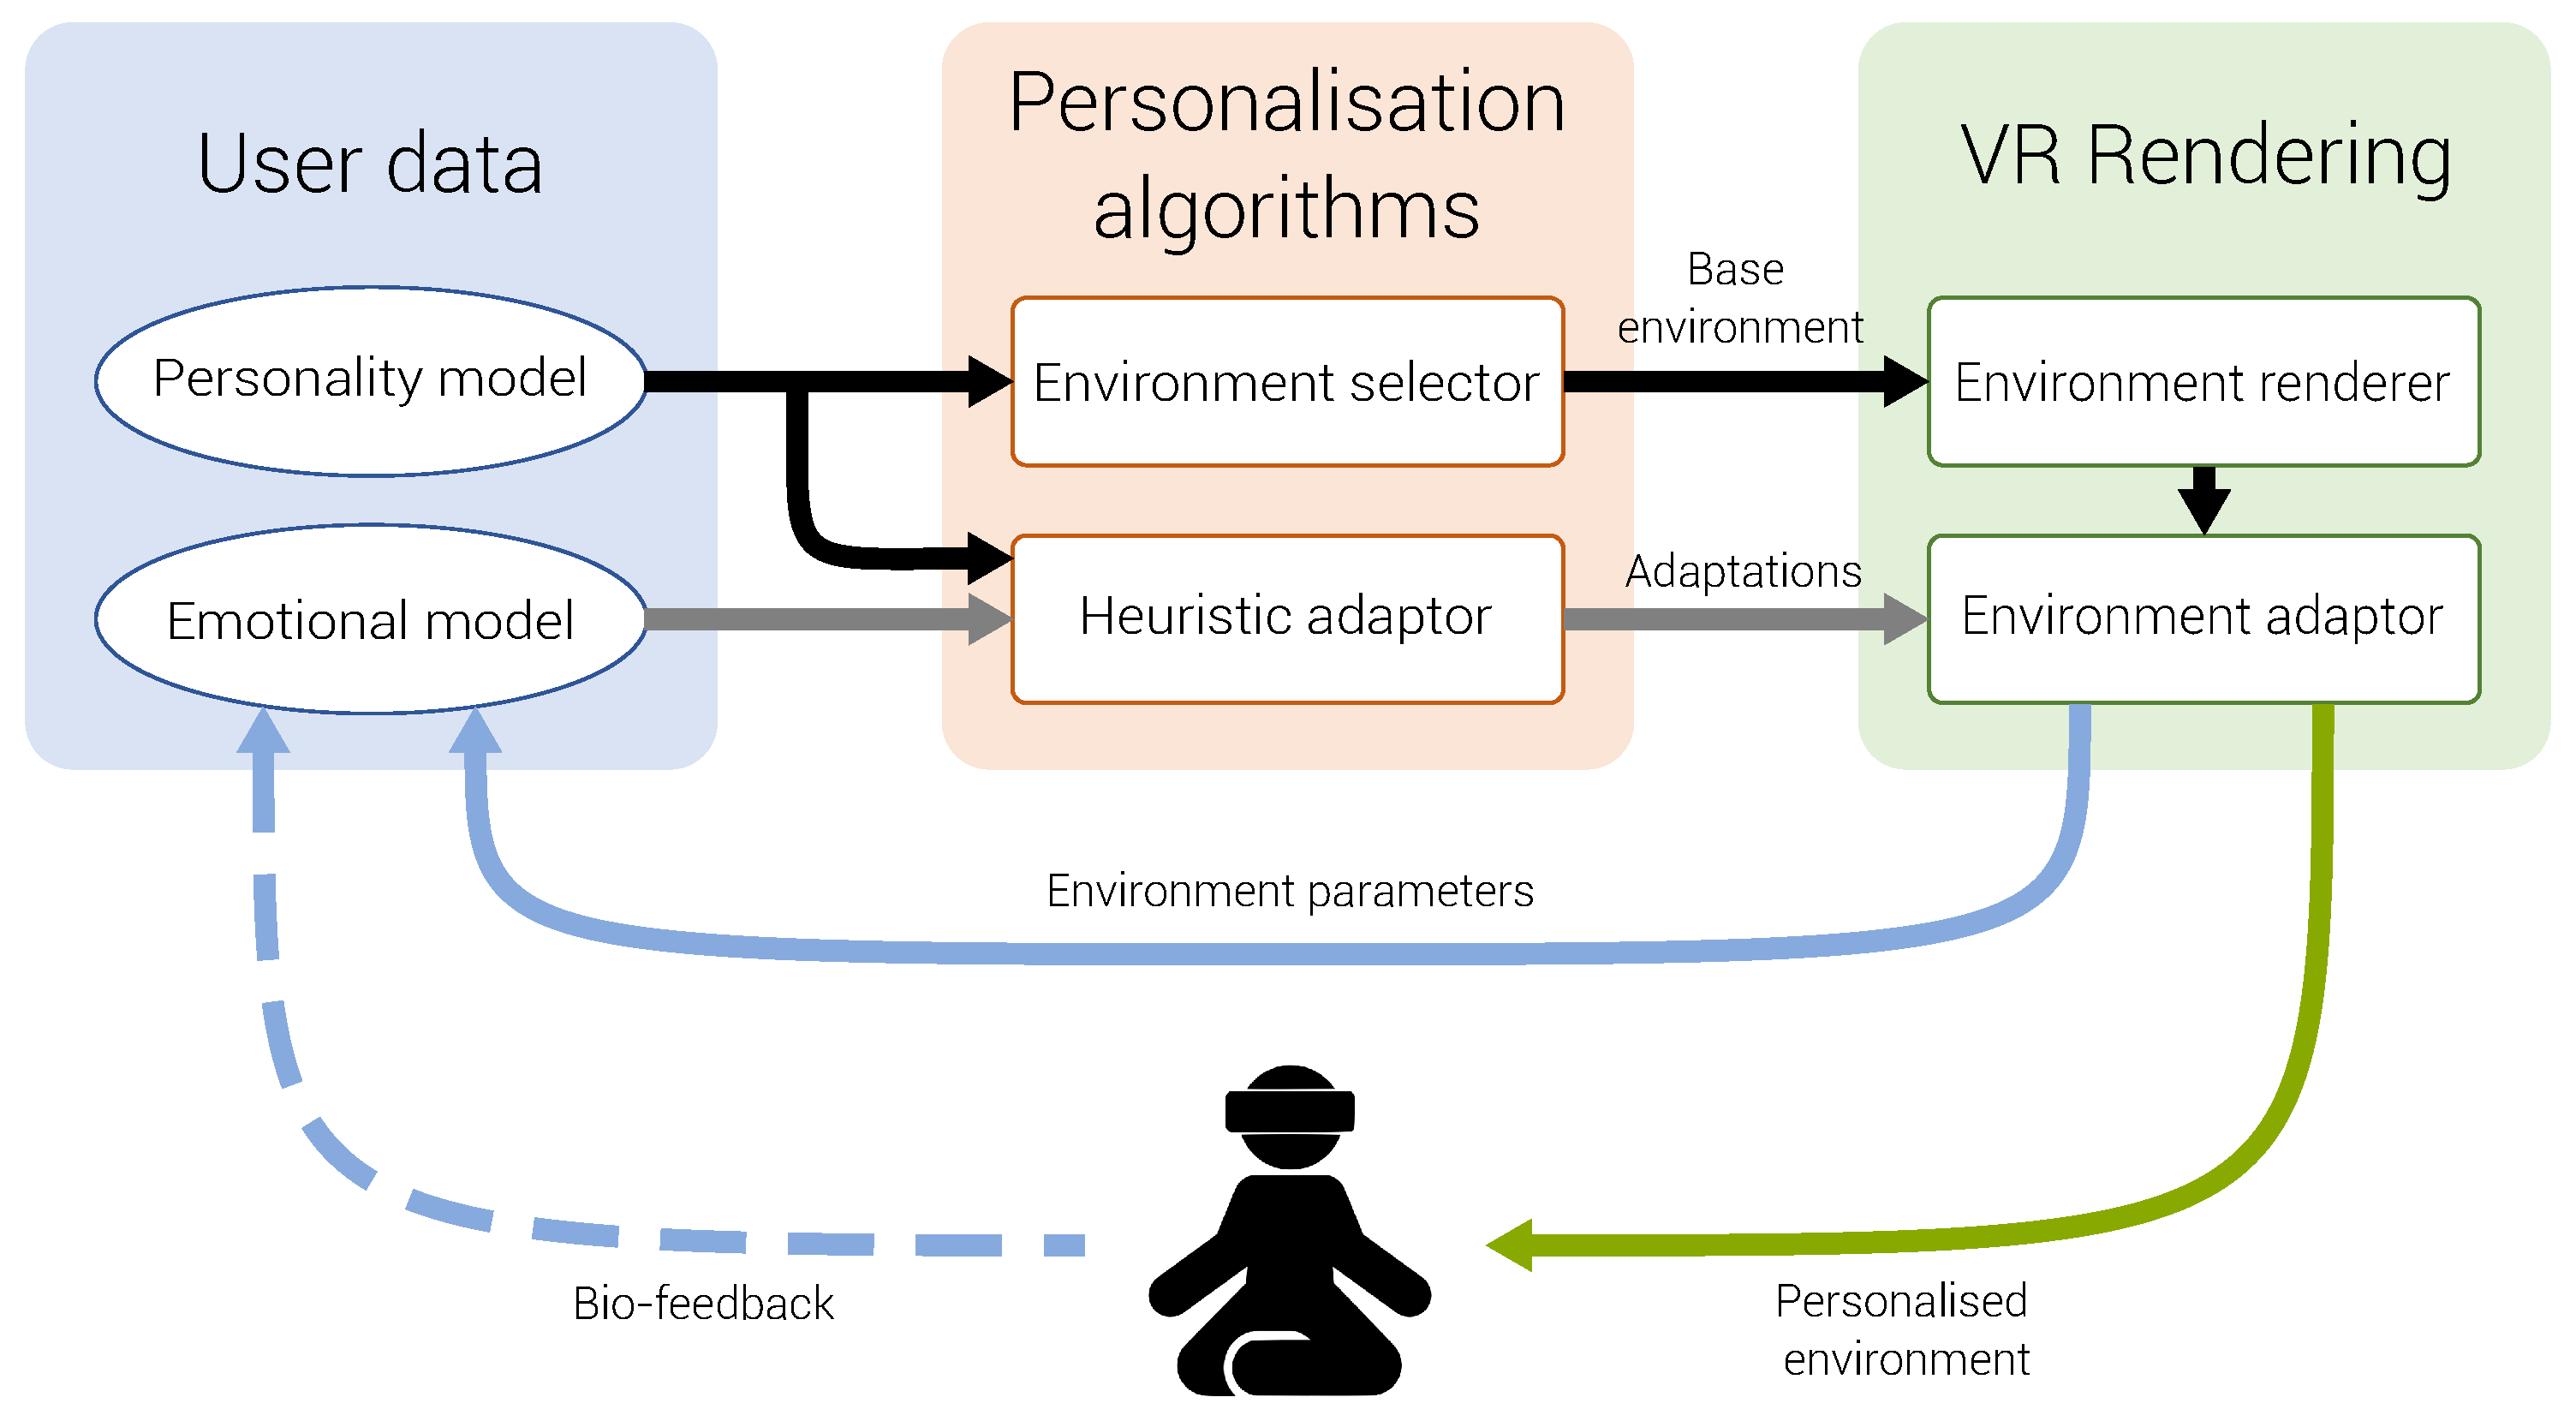
This section presents the methodology employed on the design of the adaptive and personalised VR approach to relaxation therapy. The high-level overview of the system is illustrated in Figure 1. At the start of the session, the user provides data regarding their personality and their initial emotional state. Based on both types of information, a virtual environment is created. To provide smooth transitions to the user and not to disturb the immersiveness, radical changes in the environment are avoided. Therefore, first, a blueprint of the environment is chosen based solely on the personality of the user and independent of the emotional state of the user. Choosing this blueprint is done by the environment selector, resulting in a raw environment to render. Next, the blueprint is enhanced to create the final environment that is shown to the user, this enhancement is done by the adaptor component. Subsequently, the VE can be shown to the user. This is done by the VE render component. Visualising the environment will trigger an emotional reaction in the user, which is simulated by the emotional model, resulting in new emotional data. This data is then returned to the adaptor, completing the cycle. In a hybrid approach, the estimation of the emotional state could be improved by incorporating biofeedback from the user. However, this is outside the scope of this paper. Next, further details are given on the personality and emotional models as well as on the heuristic adaptor.
3.1. Personality Model
The environment selector is responsible for generating a raw environment based on the personality of the user. To achieve this, it uses decision trees. The decisions taken at every decision node depend solely on the user’s personality data and each outcome represents a different raw environment. The set of possible raw environments is fixed and thus the same for every user. Therefore, users with similar personalities could generate the same raw environment. However, their final environments may still show significant differences as the environment details get decided upon later, as they are based on the user’s emotional status. The decision tree will be modified depending on the available virtual environments and options.
3.2. Emotional Model
The main purpose of the emotional model is to estimate the level of relaxation, or rather the state of relaxation , of the user based on the current settings of the environment. Relaxation has been shown to be influenced by stress, fear and arousal [33]. Therefore, the model estimates relaxation from the three latent variables (, , and ). At the most abstract level, relaxation can be expressed as a function of the three other emotional states and the preference of the user on the adaptations in the environment. This is formalised in Equations (1)–(4), where is the vector representing the values of all adaptations in the environment.
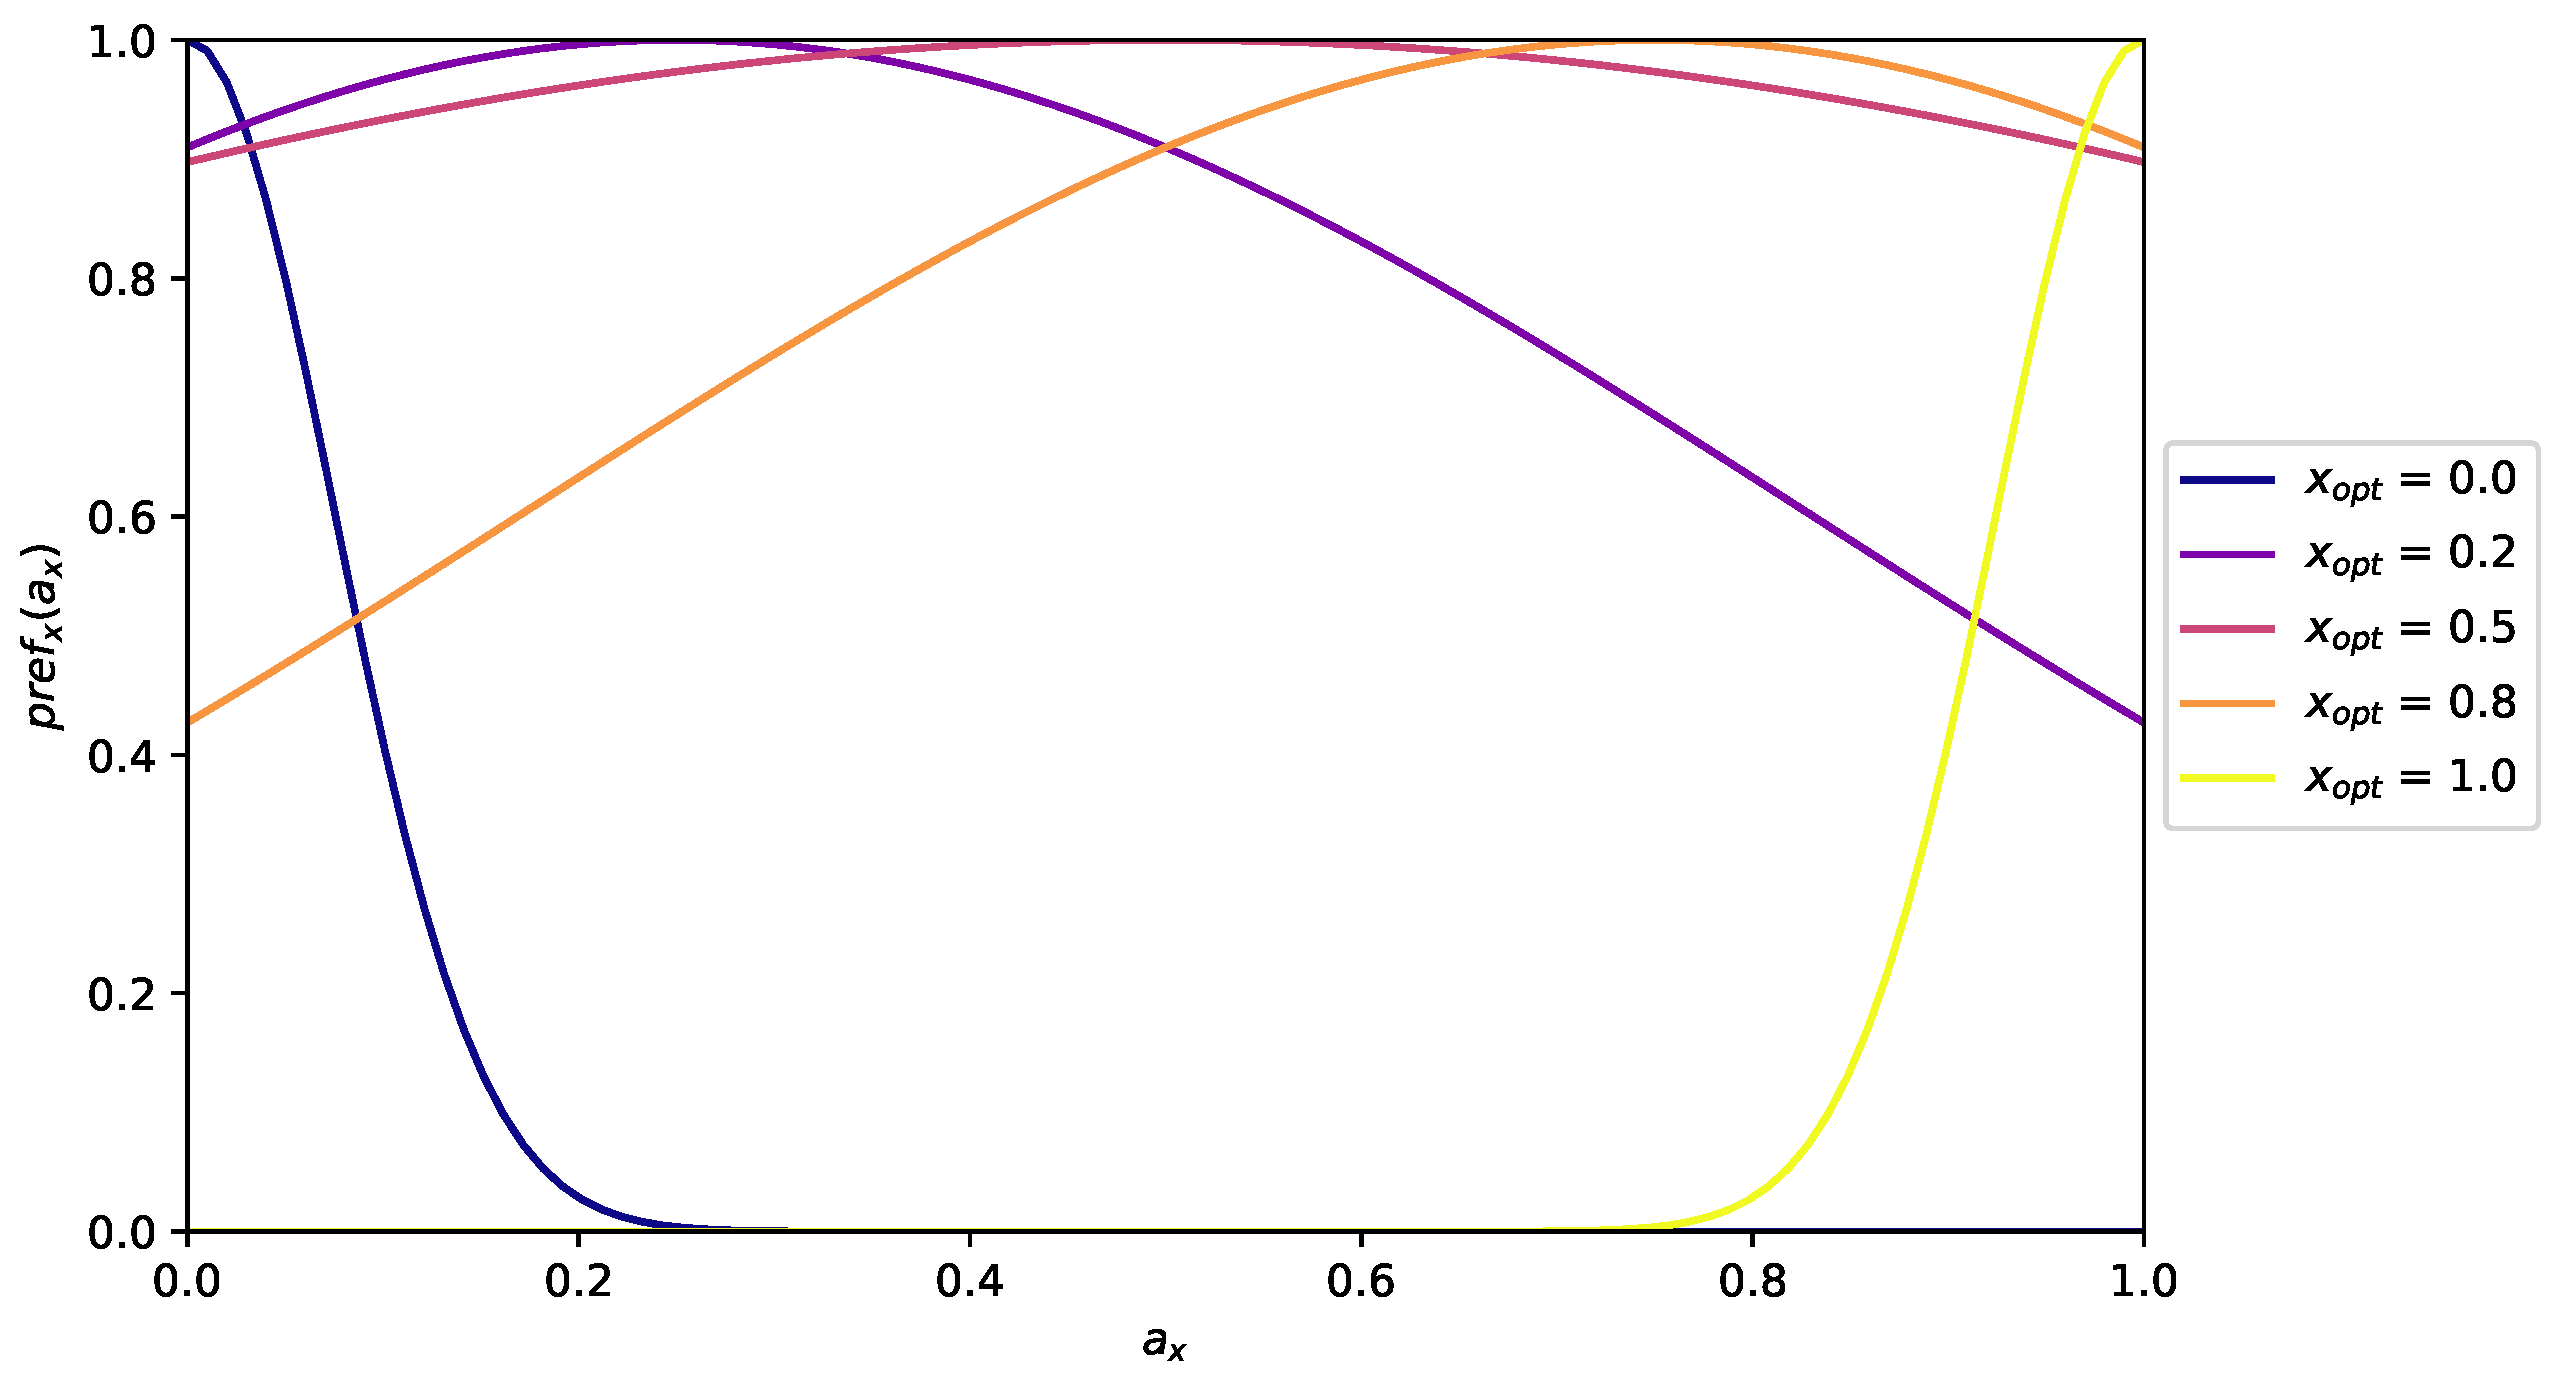
Adaptations can influence the model either by the preference for the adaptation or directly by its value. Given the large variety of options and the variability of users, when the user first starts the system, they will answer questions regarding their preferences on some of the adaptations. In that way, for example, if the user is afraid of darkness, the created environment will be made in a manner that it maintains light throughout the session. Therefore, a preference function for each adaptation is defined according to Equation (5) which determines the impact of the individual adaptations on the user’s emotional state. Human perception has been deemed to be highly nonlinear, following more the shape of a sigmoid or a Gaussian curve [34]. Therefore, a Gaussian function is used. The Gaussian has a maximum value of 1, centred around the adaptation’s optimal intensity (). This optimal intensity is a fixed value derived from the questionnaire data. The range of the function is between 0 and 1, where 0 indicates that the user does not like the adaptation and 1 that the user likes it very much. As can be seen in Figure 2, the more the optimal intensity leans towards , the more the user feels indifferent about the adaptation, thus the flatter the Gaussian becomes. In other words, large changes in the adaptation intensity have little effect on the preference function’s outcome. The more the optimal intensity reaches 0 or 1, the stronger the user feels about the adaptation, thus the more narrow the bell shape becomes. Meaning that small changes in the adaptation intensity already have a big impact on the preference function’s outcome.
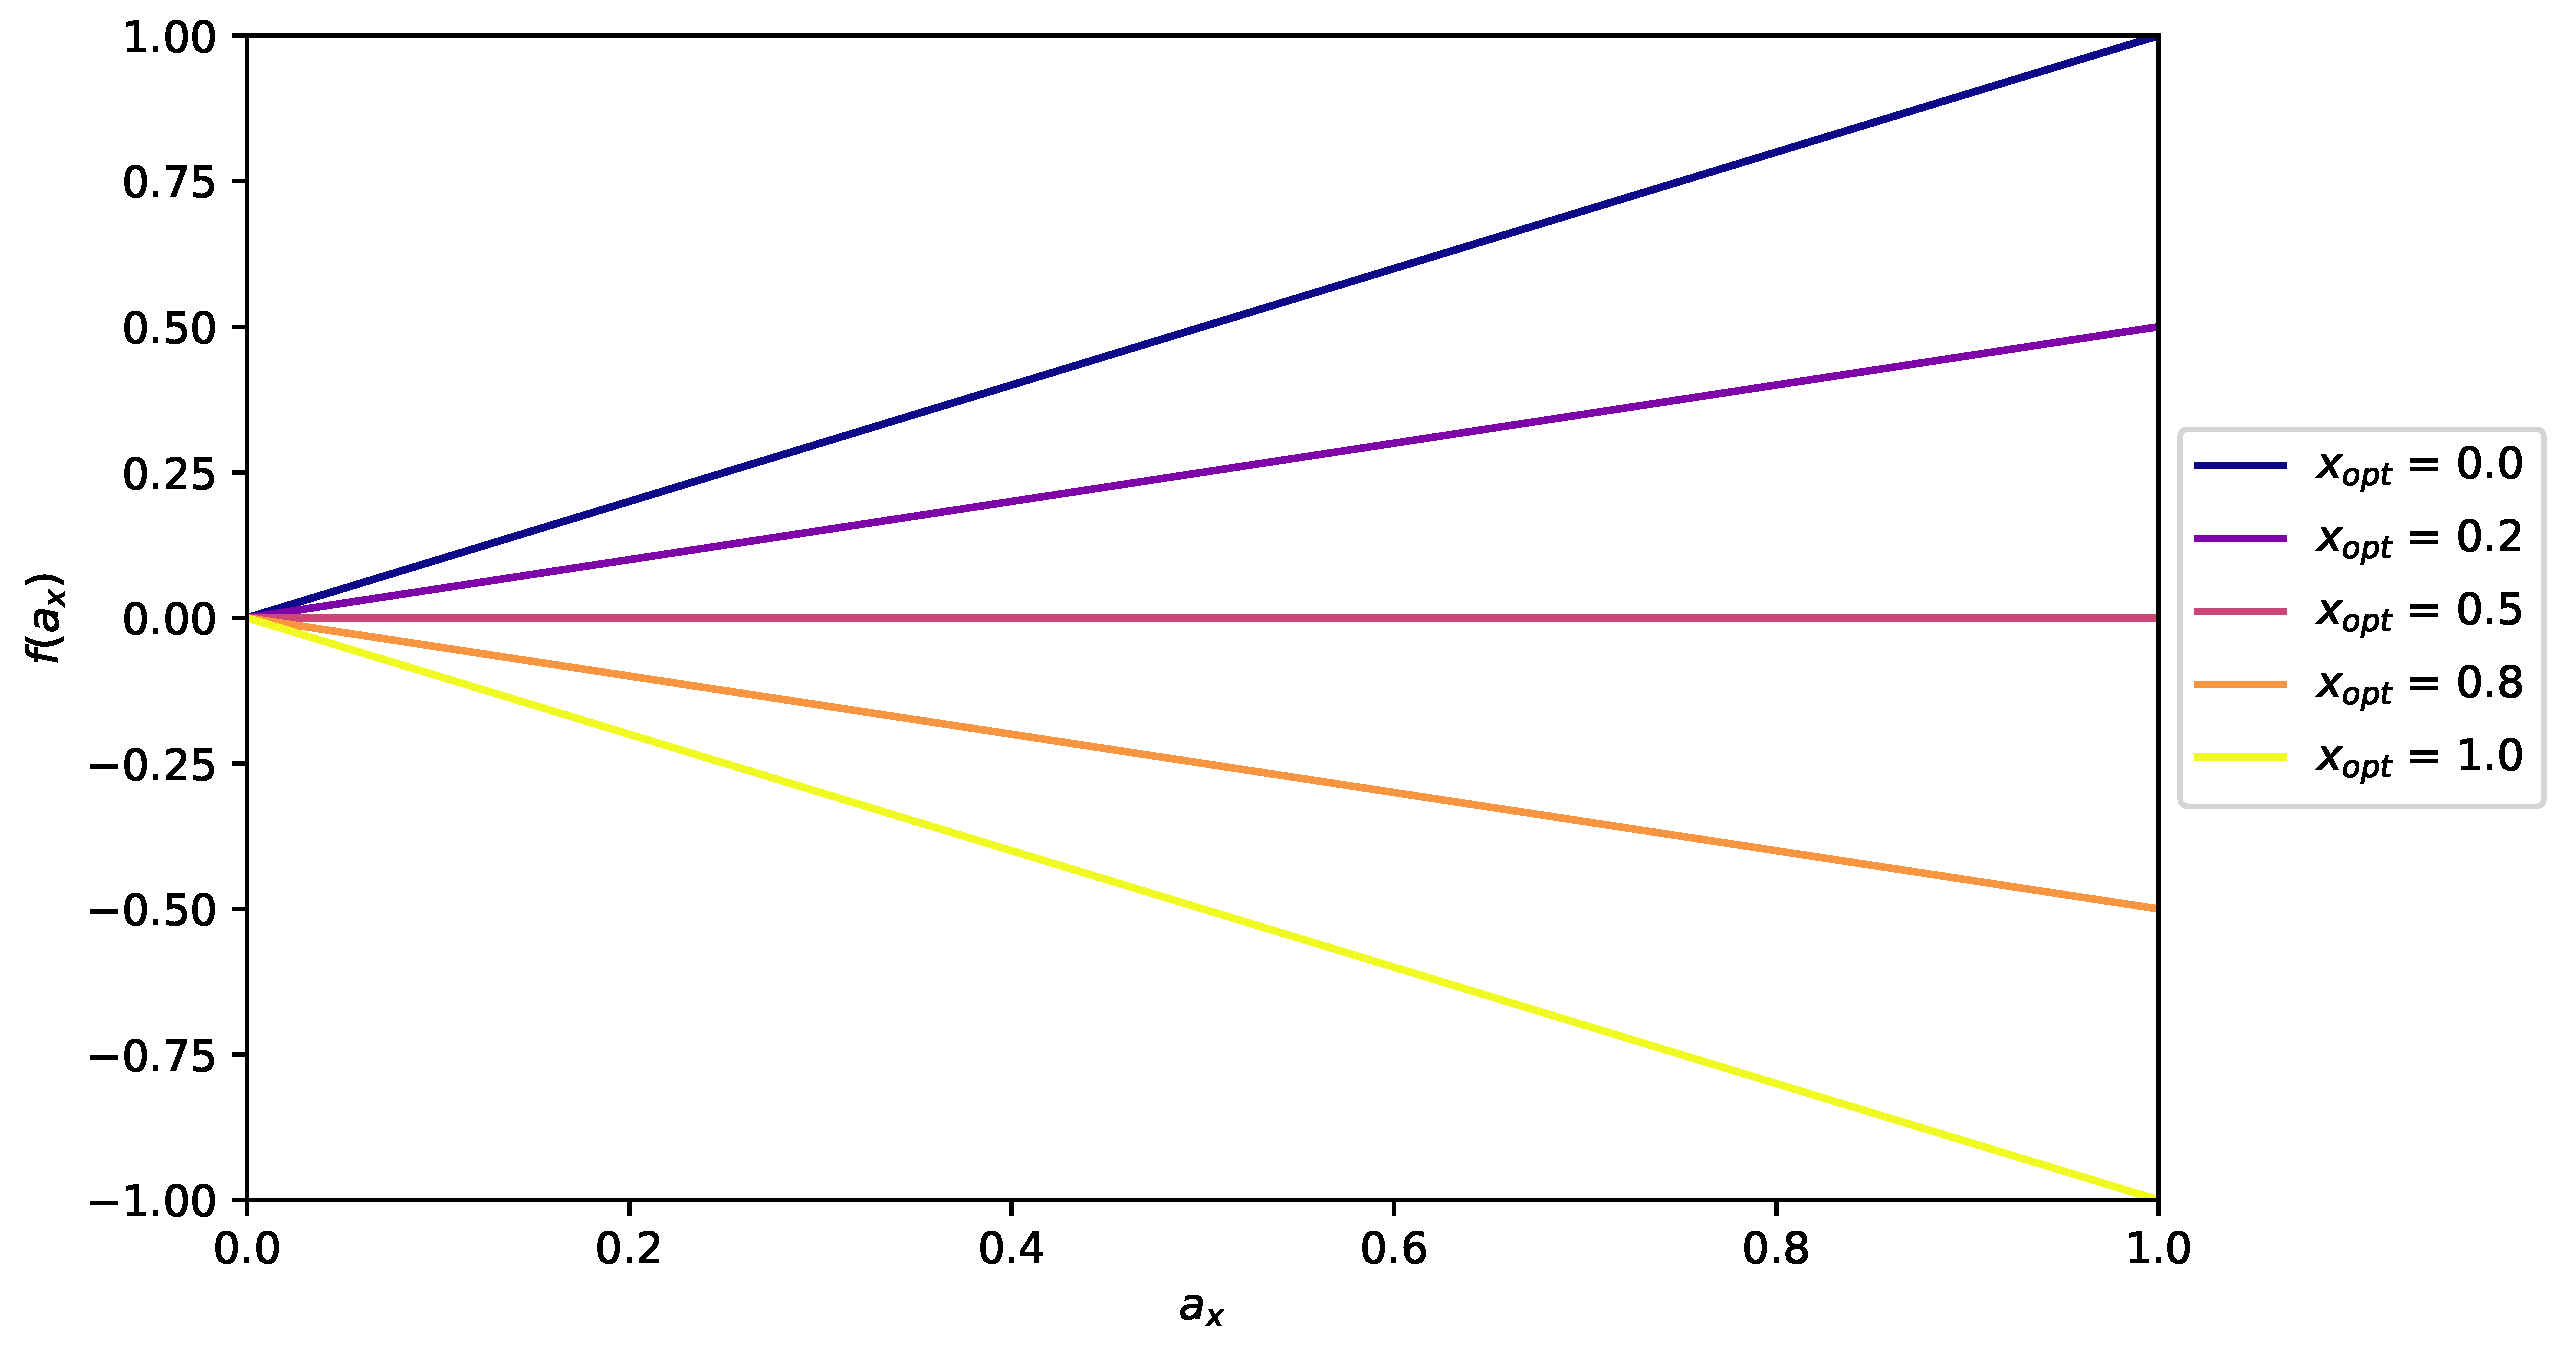
With the definitions for the adaptations and preferences, the three emotion models will be explained. Since some of the adaptations in the system could potentially induce fear on the user, these are called (fear) inductors. For example, a user can be afraid of darkness, fire or animals. Therefore, in this model fear is calculated as a weighted sum of the possible fear inductors independently (Equation (6)). The weights () can be chosen based on the user’s personality. Each inductor is modeled by a function based on the user profile’s optimal value () as in Equation (7). The fear inductor function, , is a linear function based on the adaptation’s current intensity and the fixed optimal intensity. This is plotted in Figure 3 for different values of optimal intensity. This plot shows that if the adaptation has an optimal intensity value below , it frightens the user, thus contributing to a positive impact on the overall fear. An optimal intensity above indicates comfort, thus contributing to a negative impact on the overall fear. The magnitude of fear or comfort depends on how much the value leans towards 0 or 1 respectively. As is a linear combination of instances of , it also is a linear function similar to Figure 3. The resulting function for fear always provides an output value between and 1. Negative fear indicates that the user is not afraid and feels comfortable, whilst positive fear indicates the user is afraid.
The second emotion is stress. In Equation (8), it is formulated as a max-function of three arguments.The first element is the value of , as the level of fear will directly translate into stress. The second is a new candidate value for which depends on the preference functions of adaptations that can induce stress. As the adaptations current values approach the optimal preference, the stress decreases (Equation (9)). Lastly, the value of at the previous time step is considered.
The final emotion is arousal (Equation (10)). Much like stress arousal is non-linear and formulated as a max function with three arguments. The first is the emotional state of fear (), with high fear comes high arousal. The second is the emotional state of stress (), analogous to fear, with high stress comes high arousal. The last argument is the minimum of a new candidate value for arousal and the value of at the previous time step. The candidate value of arousal is based on the preference of some adaptations and the direct effect of others. For example, users have a preference for music. Therefore, based on their preference for this adaptation, the user will feel more or less aroused. On the other hand, other adaptations, such as the presence of light, has been shown to increase arousal in all users [35]. Thus, their effect needs to be directly added to the arousal calculation. The value of arousal always lies between 0 and 1.
Based on the preferences of the users and the latent emotional states, can be expressed. Equation (12) shows relaxation as a combination of the adaptation preferences which directly affect relaxation, the adaptations that affect the relaxation independent from the user preference, the stress, arousal and fear values. It is important to note that adaptations will either affect as a preference or directly as an adaptation. Therefore for an adaptation , either or will be set to a value higher than zero. To keep the value of relaxation between 0 and 1, relaxation is divided by the sum of the weights of the elements.
3.3. Heuristic Adaptor
The adaptor is the component in charge of updating the adaptation intensities in real-time. It observes the current state of the VE and the user’s emotional data. Based on this, it decides which adaptation intensity should be changed next. The adaptor updates one adaptation each time step. It calculates which action is best, performs this action, and waits for the user’s emotional state to update. This process is repeated until the user reaches his optimal emotional state, at which point no more adaptations are necessary. Finding this optimal state and the maximal relaxation linked to it can be formulated as an optimisation problem. The emotional model is non-linear and can be solved using Mixed Integer Non-Linear Programming (MINLP). As MINLP problems are not easy to solve, the problem (and thus, the model) need to be linearised. This results in a linear problem that can be solved using Mixed Integer Linear Programming (MILP) [36]. However, this optimisation problem cannot be solved in real-time. Therefore, a heuristic approach is used.
The heuristic approach first determines the absolute maximum achievable relaxation for the environment and user profile. It achieves this by sampling the adaptation intensities and comparing all possible combinations, i.e., a brute force approach. The combination that leads to the maximal relaxation value is the combination the heuristic optimiser should work towards. As it can only change one adaptation intensity per step, it should choose an order in which to change the intensities.
4. Use Case Implementation
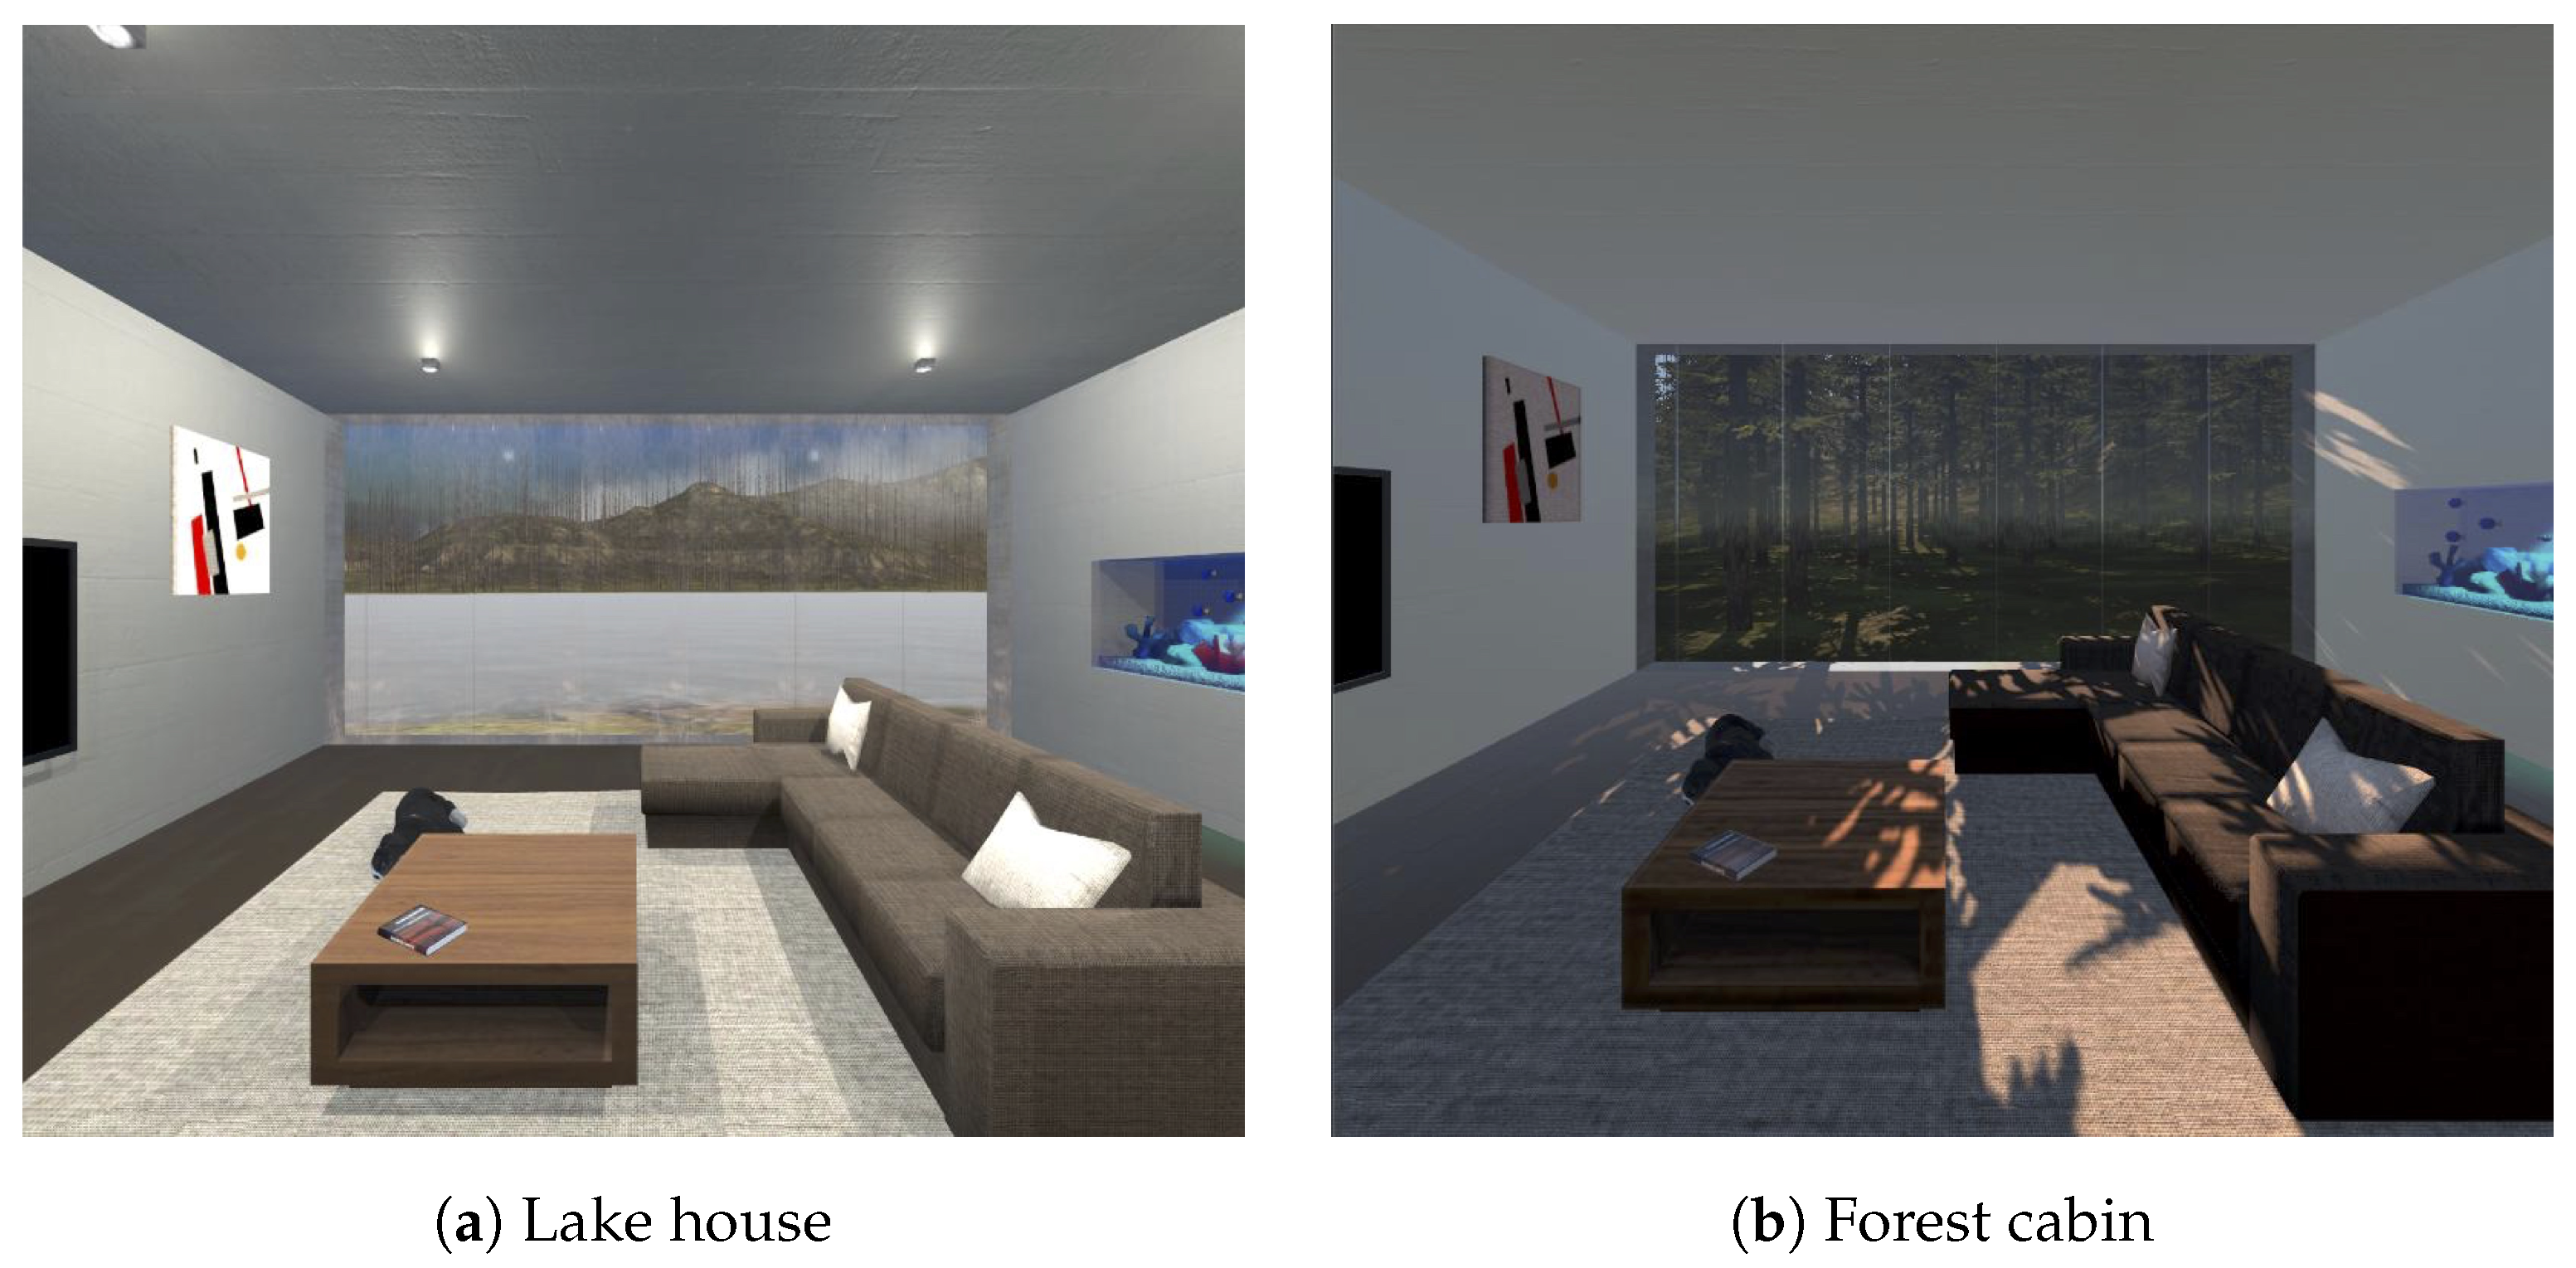
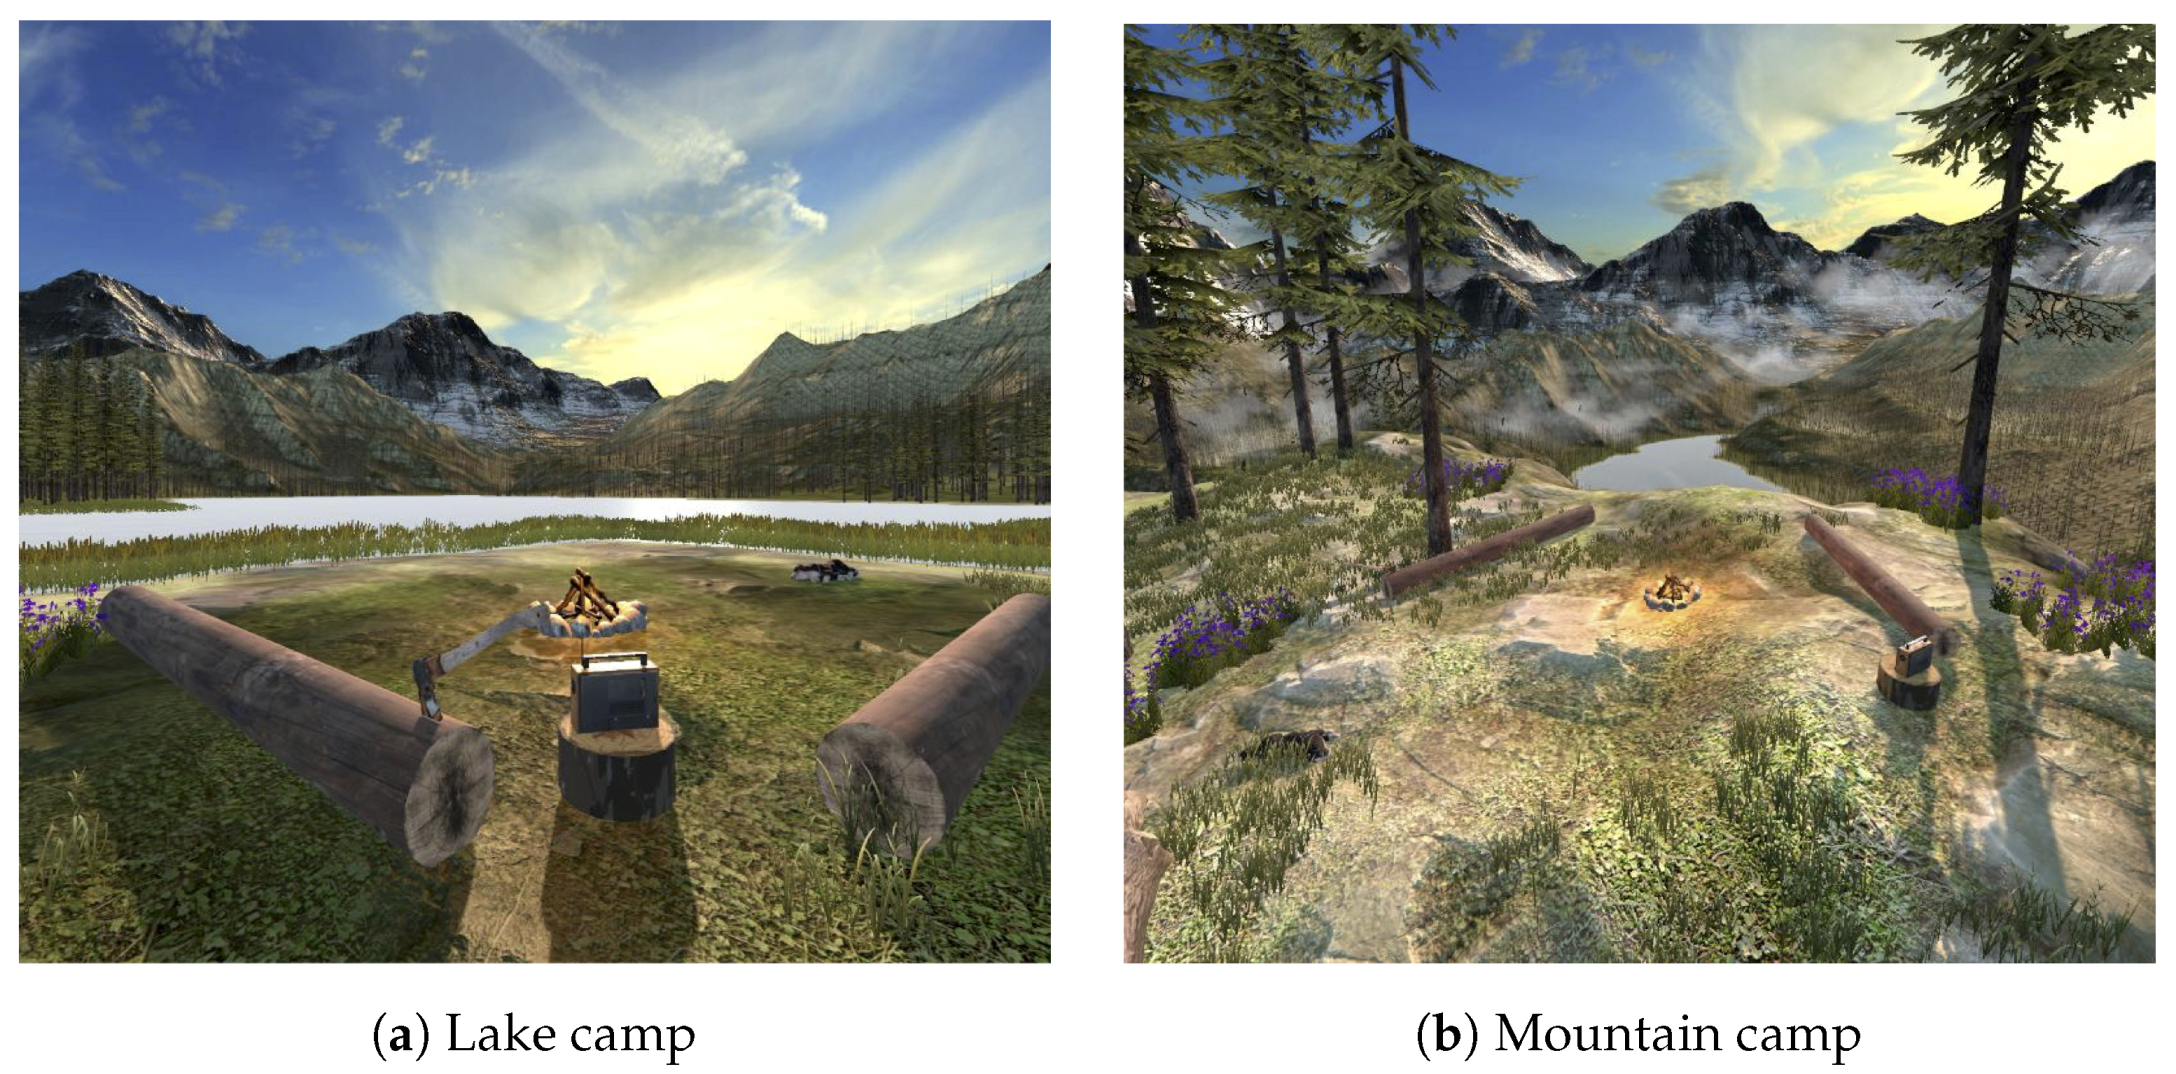
This section discusses the use case implemented to test our model and algorithm. Two different VE settings have been designed, one is for indoor environments and the other for outdoor environments. For each, two different types are provided. The indoor settings resemble a living room of a house either near a lake (Figure 4a) or in a forest (Figure 4b), while the outdoor setting replicates a cosy camp spot around a campfire either near a lake (Figure 5a) or in the mountains (Figure 5b). These two VEs have been chosen as they are very different from each other as well as offer different possibilities for adaptations which could influence relaxation. All adaptations which are implemented for this use case are listed in Table 1 with a short description. The second and third columns indicate whether they are implemented for indoor or outdoor environments. The VEs are implemented in Unity3D, it provides an easy to use framework for VR content. These environments have been designed for use with the HTC Vive HMD. The emotional model and heuristic optimiser runs as a separate Java application which can communicate with the VR application.
Based on the possible adaptations available to implement in the online system, the remainder of this section presents the implementation of the personalisation model and the emotion model.
4.1. Personalisation Model and Environment Selector
A questionnaire is used to gather both the personality data and the initial emotional data. Questions one through nine in Table 2 are designed specifically for the developed VE to gather the personality data of the user. This data consists of optimal intensities (used by the emotional model) and binary variables (used by the environment selector). Based on the chosen optimal intensity for each adaptation, the system may decide to remove that adaptation from the environment. e.g., for a very low optimal intensity for dog it is better not to show the dog at all. The threshold value is chosen at , anything below this value will remove the adaptation. It was observed that any value bellow had little effect on the users. The questions asked to gather the initial emotional data are given by questions ten to twelve. Based on this data, a rough estimate of the initial adaptation intensities is derived. Afterwards, the initial state of is computed using the emotional model.
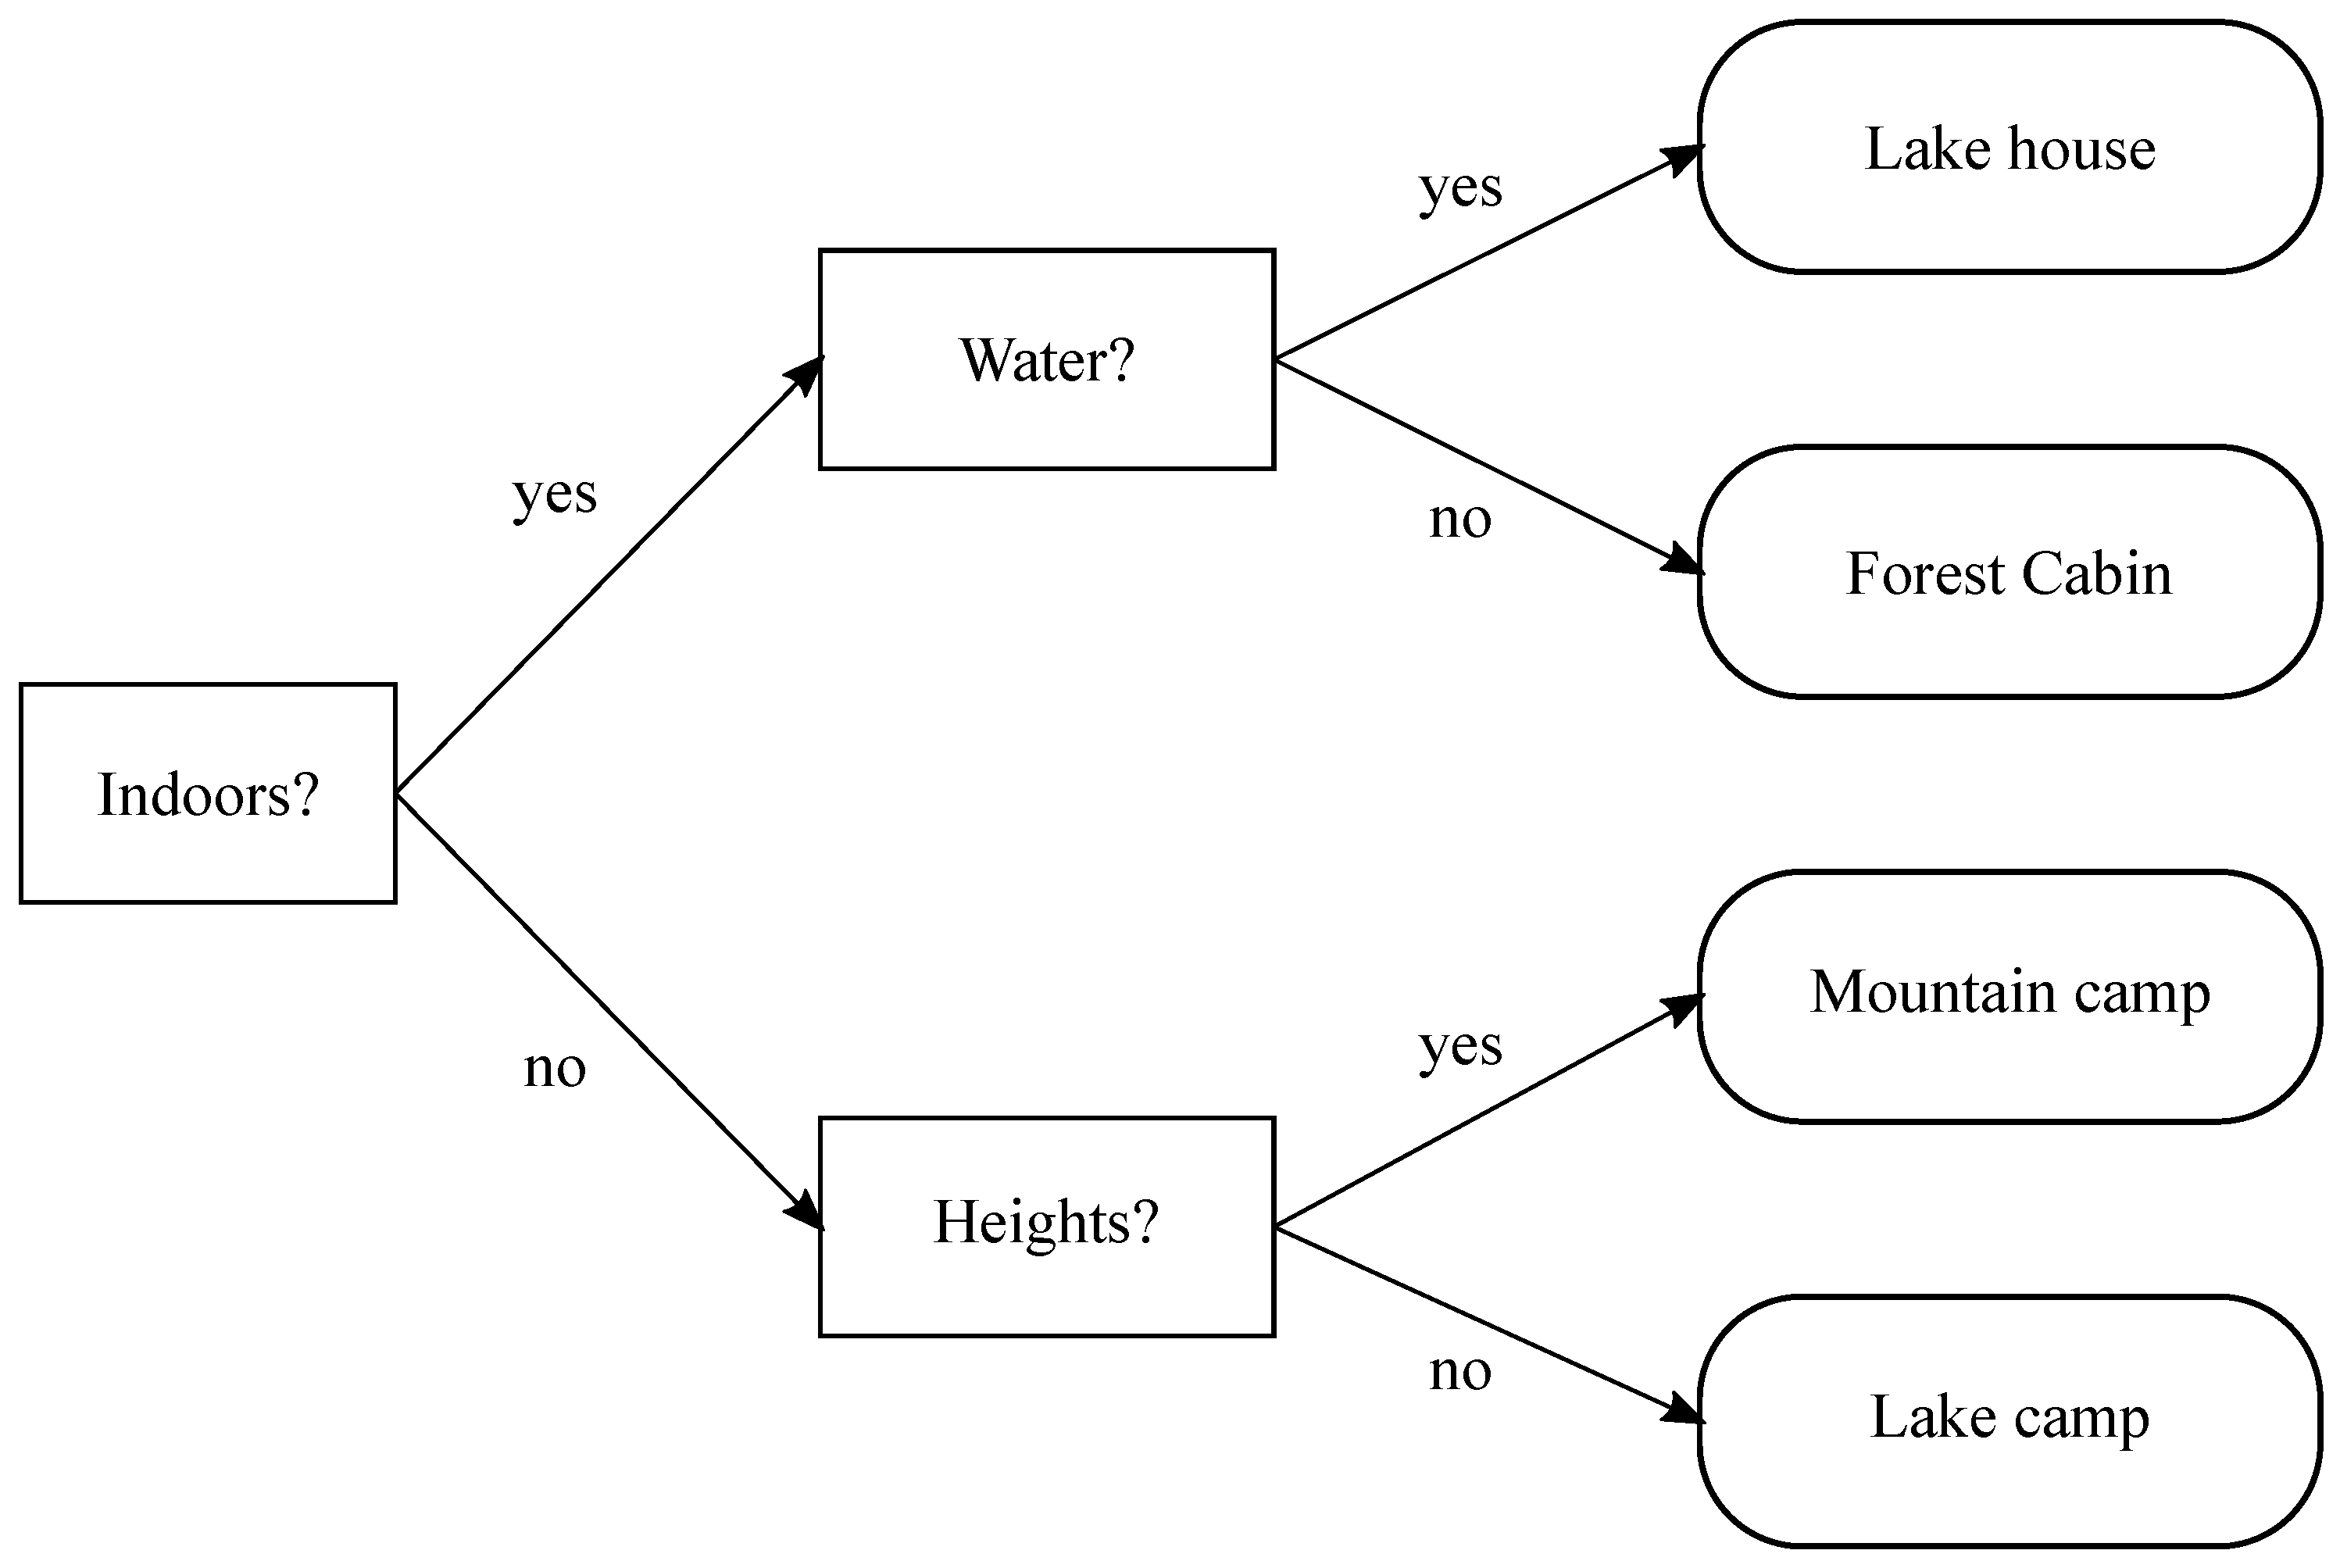
The environment selector uses the personality data and transforms it into a raw environment using a decision tree. This tree is given in Figure 6. Based on three decision nodes in the tree, four different outcomes are possible. The first node determines whether to select an indoor or outdoor environment, which are fundamentally different from each other. As mentioned before, each indoor and outdoor environment has 2 variations. For the indoor, the second decision checks whether a view over the water is preferred. For the outdoor, the second decision checks whether a view from a height is preferred. For every possible outcome, a raw VE is prepared. The decision tree decides which VE to load.
4.2. Emotional Model
The emotional model is implemented for the presented VEs. Based on the adaptations found in Table 1 the formulas in Section 3.2 are completed. Table 3 shows the range of values for each adaptation as well as the weights they are given for each of the formulas. The adaptations are discussed in more detail. First, artificial light () corresponds to light artificially produced, e.g., a light bulb. The light intensity scales linearly between 0 and 1, where 0 is no light and 1 is maximum light. This artificial light will only be present for indoor environments. Second, natural light () denotes naturally produced light, such as the sun. The light intensity scales linearly between 0 and 1, where 0 is late at night (low light) and 1 is around noon (maximum light). Light has a significant impact on arousal [35]. Therefore, the system has to control the parameters for light. Third, it has been shown that the colour of artificially created light has a strong influence on the relaxation of the user [37]. Therefore, we defined the adaptation light colour (). If artificial light is activated, the colour of the light can be set. The colour of the lights scales linearly between white and blue light, where 0 is with white light and 1 is blue light. The fourth adaptation is the fire (). It has been shown that a source of fire, such as a fireplace or an outdoor campfire, can be relaxing for some users [38], while at the same time fire can distress people with pyrophobia. The intensity of the fire scales linearly between 0 and 1, where 0 is no fire and 1 is a large fire. The fire adaptation is only defined for the outdoor environment. Fifth, for both the indoor and outdoor environments, it is possible to add a dog. The dog adaptation () activates a dog playing around unless the user prefers otherwise. Dogs have proven to provide comfort and reduce stress in patients [39]. The distance of the dog to the user can be controlled choosing from three values, where for 0 the dog is far away, for the dog is closer and for 1 the dog is very close. Music has shown very good results to induce relaxation. Therefore, music is also set as a part of the adaptation set. When music () is selected, relaxation music (indoor) or sounds (outdoor) are playing in the background, e.g., birds. The music can be turned on (1) or off (0). Finally, control breathing () provides a visual aid for a controlled breathing exercise. This visualisation is either turned on (1) or off (0).
Based on the adaptations, for this use case, we defined three sources of fear which are modelled with the function defined in Equation (7). These are pyrophobia, cynophobia [40] and nyctophobia [41]. Pyrophobia is the fear of fire. It is therefore induced by the fire adaptation (). Cynophobia, or fear of dogs, is induced by the dog adaptation (). Finally, to model the fear of darkness or nyctophobia (), we modelled it by the combination of the fire, natural light, and artificial light adaptations. The adaptation intensity of dark is give by Equation (13) and defines how dark the environment is. In this equation, and are weights for each adaptation, indicating their significance to the overall darkness intensity.
Figure 7 illustrates the behaviour of the fear functions for changing intensities of an adaptation. In this case is plotted out in function of where the intensities of fire () and darkness () equal and their optimal values and respectively, equal 0. Different plots show a different optimal intensity for dog ().
Regarding stress, as explained in Section 3, it is modelled as a non-linear max function of the current fear, the possible new stress and the stress of the previous interval if the controlled breathing was enabled. Taking into account the possible adaptations, and the defined formulas in the methodology, the possible new stress has been set to be influenced by the fire (py) and the dog (dg) as formulated in Equation (9). Figure 8 illustrates an example of the calculation of stress. The figure shows stress as a function of three different adaptations: dog, fire and darkness. Each plot shows the three arguments of the maximisation function from Equation (8) and the resulting value of stress. As can be seen from the figure, in each case stress takes the greatest value of all other functions. Moreover, note how the candidate value for stress is constant in the third plot as it does not depend on the intensity of darkness. However, fear does depend on darkness in the emotional model and can overtake the candidate value resulting in an increased level of stress.
The arousal is again a max function of the current values of stress, fear and the new candidate values of arousal. The candidate new arousal is based on the preference towards music, the intensity of natural light and the intensity of artificial light as defined in Equation (11). In short, arousal will only increase when fear or stress increases, and it will only decrease when the music is optimal and/or the environment is bright. Figure 9 shows the evaluation of arousal as an example. The three plots show arousal in function of music, artificial light and dog respectively. Each plot shows the 4 arguments of the maximisation and minimisation functions from Equation (10) as well as arousal itself. The plots clearly show how arousal takes the maximum of fear and stress but the minimum of the candidate arousal and previous arousal values. Indeed, as explained before, arousal decreases as music approaches the optimal value ( in this case) or as the environment gets brighter. Additionally, arousal increases as fear or stress increase.
Finally, the preferences of music, light colour, natural light and artificial light, the adaptation values of controlled breathing and the latent emotional states and conform the relaxation model.
As the heuristic optimiser, which takes care of applying the appropriate adaptations based on the output of the emotional model, can only change one adaptation intensity per step, it should choose an order in which to apply the adaptations. The order the heuristic optimiser applies is fixed as follows:
- dog
- fire
- natural lighting
- artificial lighting
- controlled breathing on
- controlled breathing off
- music
- light colour
This order is chosen as the default order for the heuristic optimiser based on logical reasoning, e.g., “controlled breathing on” should come before “controlled breathing off”. However, there is no proof yet this order is the optimal approach. This will be analysed in detail in Section 5.
5. Experimental Evaluation
This section presents the experimental evaluation of the personalised adaptive emotion system for relaxation therapy in VR. Given the broad range of users and personalisation options, an approach with simulated users was opted for. Through this approach, the performance of the system can be assessed in a controlled environment and for iterations. Section 5.1 presents the simulation approach and the user profiles employed in the analysis. These users have been put through the system to evaluate its performance, the results of these experiments are presented in Section 5. Finally, further analysis and lessons learned are provided in Section 5.3.
5.1. Simulating Users
To fully analyse the performance of the system, it needs to be evaluated on a wide range of user profiles. To this end, user profiles have been created and the outcome is analysed in an offline simulation for evaluation of the system. The output of the simulation shows the evolution of the adaptions and the effect on the emotional state.
In a real setup, the user profiles would be defined by the information that is provided through the questionnaire in Table 2. One possibility would be to generate every combination of answers to the questions and perform a simulation for every possible profile. However, doing this is computationally infeasible as some questions from the questionnaire accept continuous values which would result in an infinite amount of user profiles. While at the same time many combinations of answers would lead to the same decisions and therefore the same results or very similar results. Therefore, a less naive approach is adopted by creating 12 user profiles with very different characteristics. These 12 profiles are sufficient to cover all edge cases and some average users for both indoor and outdoor environments.
The 12 profiles are constructed by specifying the seven parameters which are normally derived from the questionnaire, these are preferred environment and the optimal intensity of the six adaptations (dog, fire, natural light, artificial light, light colour and music). The 12 selected profiles with their values for these parameters are listed in Table 4.
The first six profiles are extreme cases used for observing general trends and comparing adaptations objectively. This is because the optimal intensity of all adaptations is the same, and thus they will have the same impact on the model. The six last profiles are average users. Users 7 and 8 prefer a dark environment with a fire or blue lights. They also prefer music when relaxing and dislike dogs. Users 9 and 10 are the opposite, they like dogs and bright environments but dislike fire, blue light, and music. Lastly, users 11 and 12 are somewhat in between. They are quite neutral towards a dog and darkness, dislike music, and like fire and blue light. The environment parameter has only two possibilities, either an indoor or an outdoor environment. Therefore, six profiles are created for each. Finally, we note that the initial emotional state should also be set and has an infinite amount of possible combinations. However, a simulation with a mild initial emotional state (already high relaxation) does not provide many insights. It would merely result in fewer adaptations to reach optimal relaxation. Therefore, the initial state for each simulation is set to be the most severe, that is high fear, high stress and high arousal which leads to low relaxation.
5.2. Results
In this section, the results of the evaluation of the two tests are discussed. First, the performance of the heuristic optimiser, as described before, is evaluated on the 12 generated users. Second, the impact of order in which the adaptations are applied is observed.
5.2.1. Performance Analysis
The purpose of this first analysis is to assess the performance of the personalised relaxation model. For this, the default heuristic order configuration (dog, fire, natural lighting, artificial lighting, controlled breathing on, controlled breathing off, music, light colour) is taken and we evaluate the 12 user profiles.
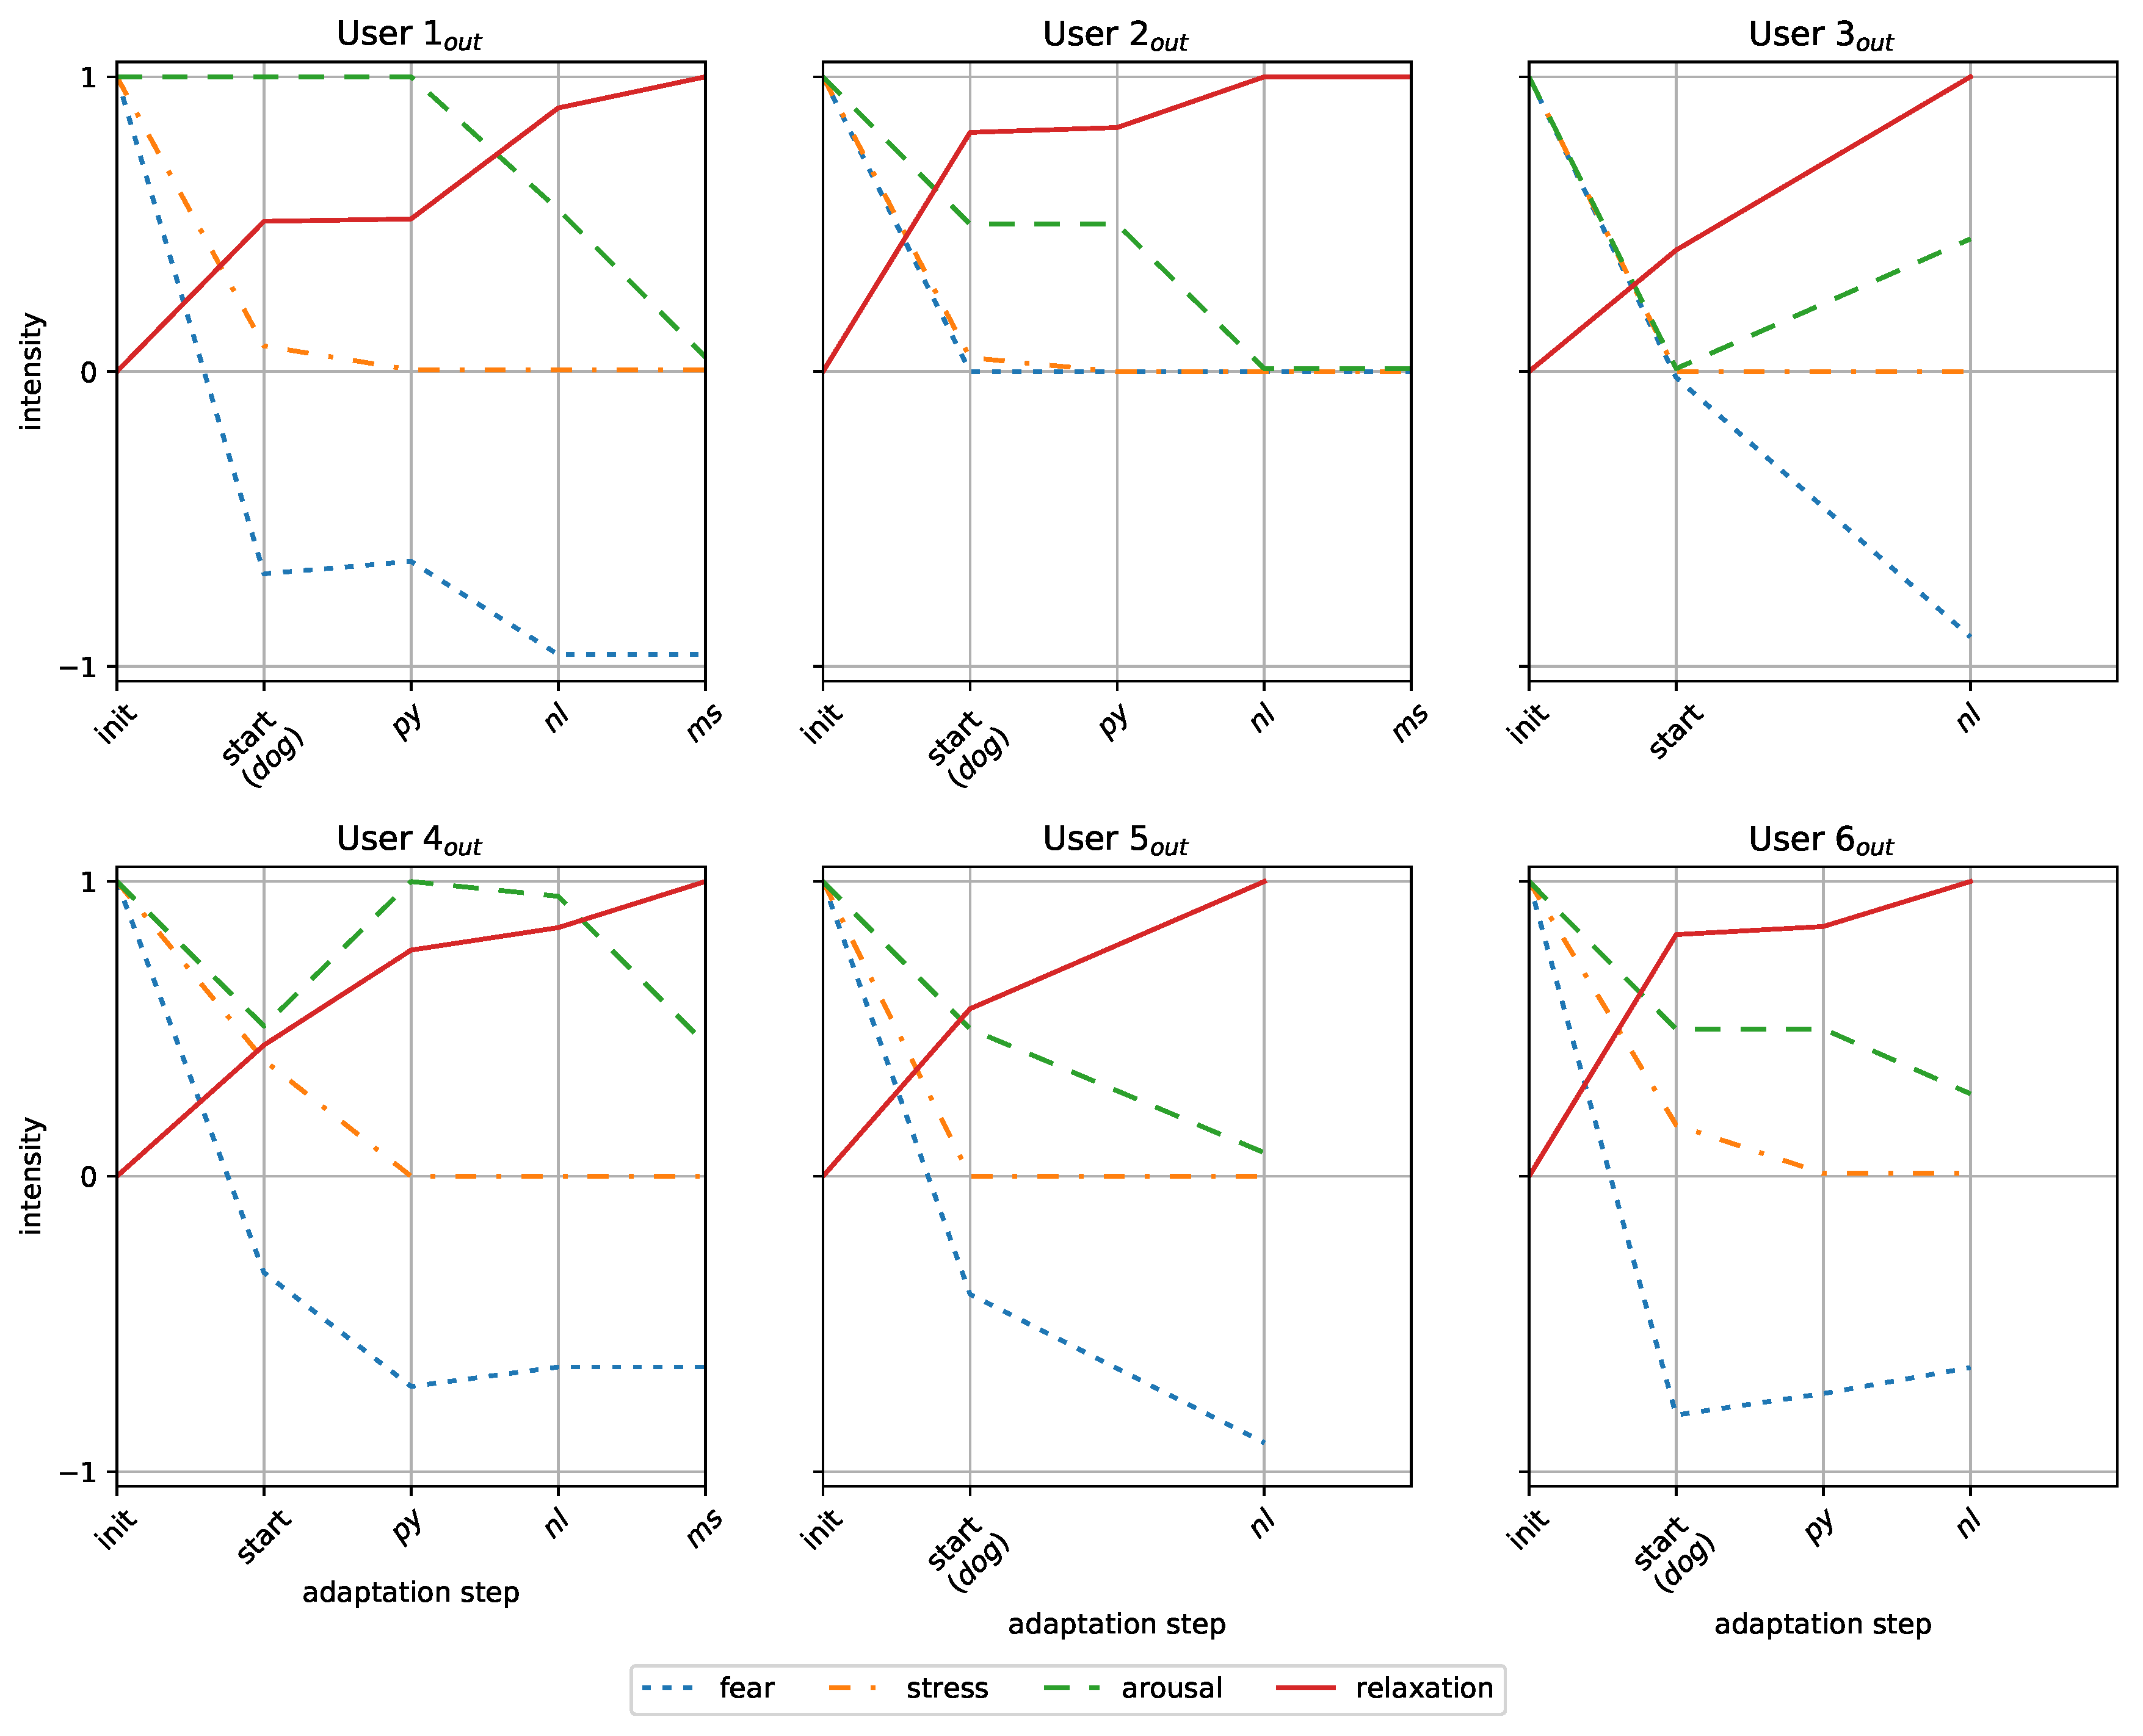
The evolution of the emotional state in the simulations for the outdoor and indoor environments are shown in Figure 10 and Figure 11 respectively. The plots show the evolution of the different emotional parameters with every adaptation in the environment. The adaptations are shown on the x-axis while the four emotions are presented on the y-axis. While the most important emotion is relaxation (which needs to be maximised), the other parameters, fear, stress and arousal are also interesting to the observer as these need to decrease. For some of the users, not all possible adaptations appear. This is due to the profile of these users which prevents these adaptations form being used.
The initial emotion state is observed at init and is the same for every user. The emotional state at time step start depends on the user itself. At this time step environment is generated and initial values for the adaptations are calculated, these have an impact on the emotional state already as shown in each plot. In the case where the user has the dog adaptation, this will be activated at time step start, this is indicated in the plots as well.
For every simulated user in the outdoor environment the maximum relaxation of 1 is reached. While the stress parameter disappears (value of 0) in every simulation as well, the others, fear and arousal, do not always reach their minimum. Fear never reaches . Similarly, arousal is also never completely gone. However, these sub-optimal final emotional parameters do not have an impact on the final relaxation parameter as they are counteracted by the high evaluation of the preference functions.
In the case of the indoor environments, for every user, the relaxation increases significantly over the duration of the simulation. However, in many cases, the optimal value of 1 is not reached. In those cases, the arousal value does not approach 0 which could be the reason for the sub-optimal result. In some cases (Users , , and ) fear does not reach its minimal value of −1, however, this does not seem to impact the final relaxation too much either. Finally, the relaxation curve shows slight reductions for users 3, 5 and 7 suggesting relaxation cannot be reached through a greedy approach, in other words, local optima in the curve are not to be considered as a global optimum.
These simulations indeed show how, even with a fixed order for activating the adaptations, near-optimal relaxation can be researched. Additionally, the heuristic optimiser can find a solution which leads to an acceptable final relaxation. However, it is also clear that maximising relaxation is not sufficient in every case. The other emotions should be minimised as much as possible to reach perfect relaxation. This could potentially be achieved by changing the order of the adaptations.
5.2.2. Adaptation Order
As seen in the previous evaluation, the order in which adaptations occur could have an impact on the effectiveness of the adaptations and, thus, the final emotional state. To evaluate this, tests are performed which change this order. Every time interval, exactly one adaptation takes place, which leads to a change of emotional values. Eight adaptations occur (, , , , on, off, , and ). Therefore, possible permutations of these adaptations exist, however, as “ off” will only happen after “ on”, only permutations are valid. Fortunately, some more redundancies can be removed to reduce the number of permutations further down. While in indoor environments the fire () adaptation is not present, outdoor environments do not contain artificial light (), controlled breathing (), and light colour (). Therefore, the number of permutations for indoor environments is reduced to 5040 possible permutations and for outdoor to 24. To further reduce the number of permutation of indoor environments, the actions “ on” and “ off” are combined into one, lowering the number of valid permutations to 720. This leads to a simulation run time of a maximum of 12 min for indoor environments and around 25 s for outdoor environments. In total, simulating the twelve users takes approximately 45 min.
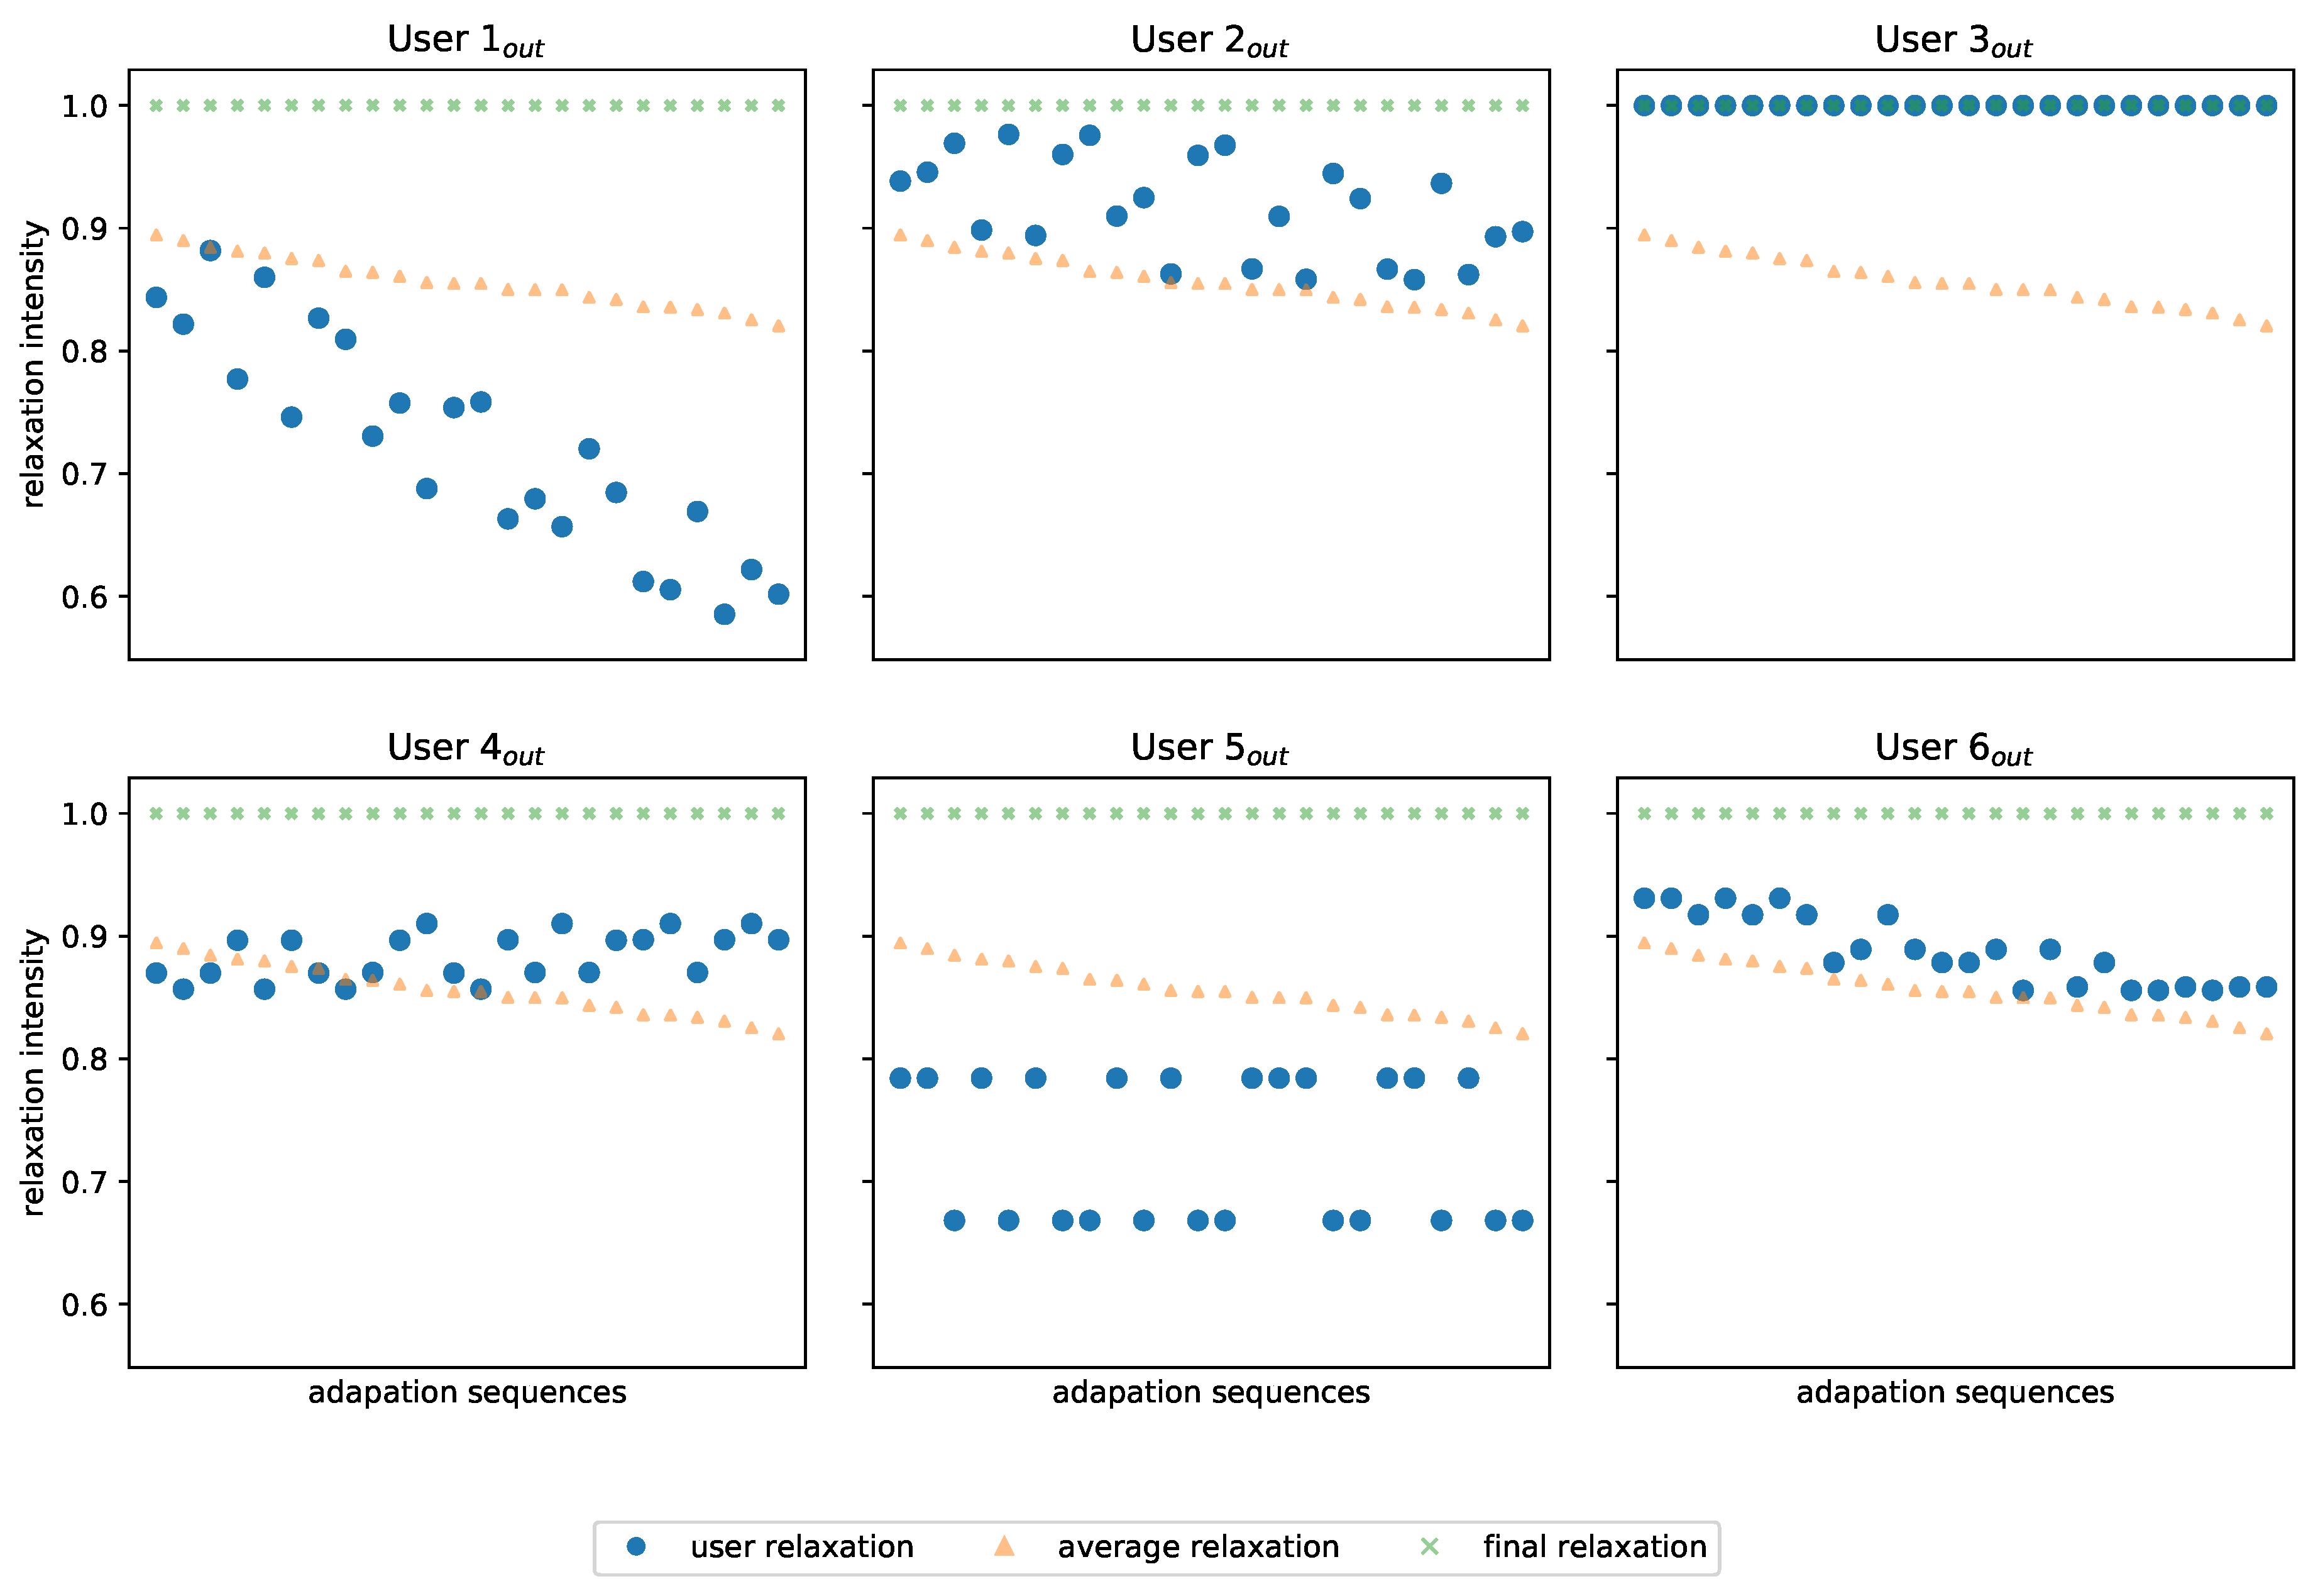
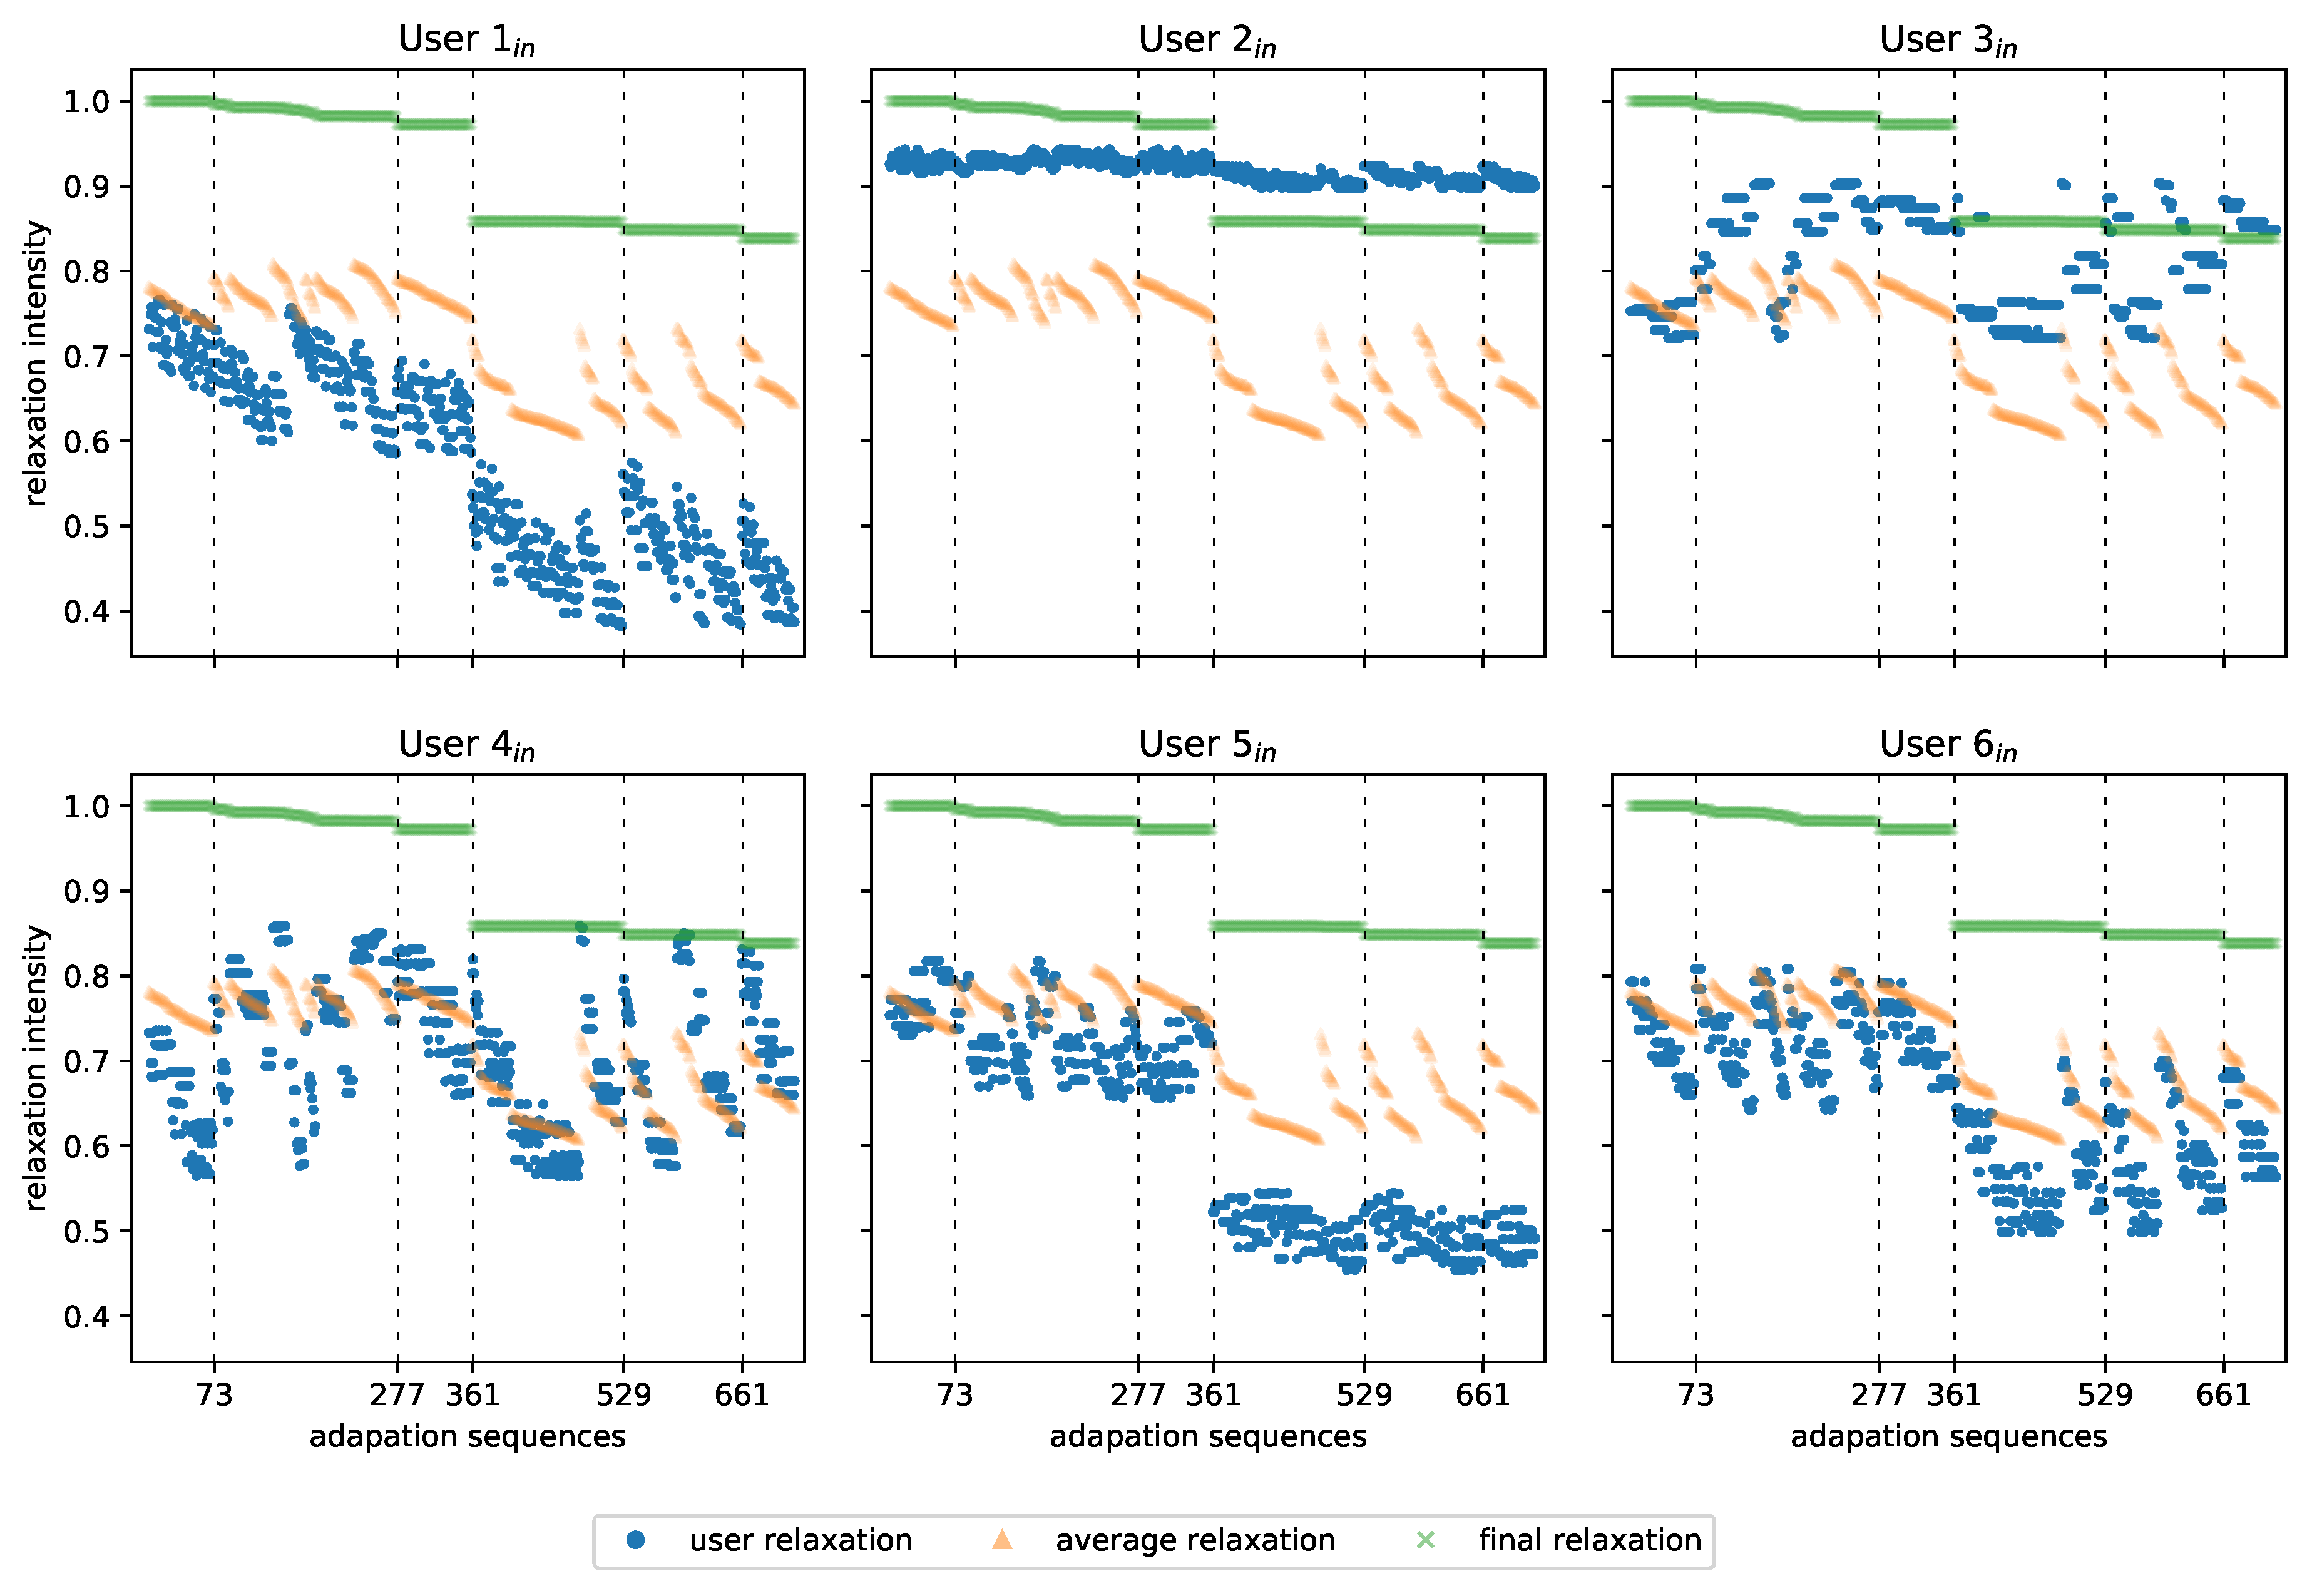
The results of the simulations on the effect of changing the order in which adaptations occur are shown in Figure 12 and Figure 13 for the outdoor and indoor environments respectively. These plots show the relaxation, averaged over all sessions of every simulated user, and the relaxation at the end of each session averaged over all users. The different sequences (x-axis) are first sorted by decreasing final relaxation than by decreasing average relaxation. In these plots, a relaxation value of 1 corresponds to the maximum relaxation achievable for that particular environment and user profile. This normalisation is performed to enable a proper comparison of the different user profiles. Table 5 and Table 6 show the same sequences with the actual values for the averaged and final relaxation. The following sections discuss the results in more detail.
The first thing to notice for the outdoor environment in Figure 12 is that for the outdoor environment every sequence of adaptations the maximum relaxation is achieved. This implies that the order of the adaptations has no impact on the final relaxation for this set of adaptations. However, the order does have an impact on the average relaxation over each session. A higher average relaxation means that early on in the session a higher relaxation is obtained. This translates into first applying adaptions with a big impact and finishing with the lower impact adaptations. Reaching high relaxation as soon as possible is the desired outcome. Interestingly, three groups of users are observed in terms of average relaxation. Users and have a relaxation below the average (orange) for every permutation of the adaptations, users and are always above the average relaxation, while users and perform around the average for each sequence. This could be partially explained by the profile of the simulated users in Section 5.1. The first three user profiles are extreme cases, resulting in above or below average results. The last three are rather average users resulting in average relaxation except for user . This user shows a rather low average relaxation with little variation for different sequences. This could be explained by the fact that this user has many restrictions which resulted in only two effective adaptation. These same applies for user which has only one effective adaptation.
In Table 5 the 24 permutations of the adaptions are listed with the average relaxation over every user. This list is also sorted according to this relaxation metric. Sequences 1, 2, 3 and 5 have in common that the first two adaptation are dog () and natural light () while the last two adaptation in the sequence are music () and fire () which is not the case for any of the other sequences. The highlighted row in Table 5 indicates the sequence which is used by the heuristic optimiser. Indeed this sequence is not the optimal order.
Now we can consider the indoor environments in Figure 13 for which Table 6 shows some of the most interesting sequences. These are also indicated on the plots. The order of the adaptations does have an impact on the final relaxation. Certain permutations are sub-optimal in the sense that they do not guarantee maximal relaxation. Furthermore, the order also has an impact on the average relaxation per user and the average relaxation overall. Interestingly, the same three groups of users can be identified for the indoor environments as for the outdoor. Namely, users and achieve below average relaxation for every permutation, users and achieve above-average relaxation, while users and perform on average.
Figure 13 and Table 6 indicate that from sequence 360 to 361 a big decrease in final and average relaxation occurs. The table shows that every sequence before 361 has the dog () adaptation before the controlled breathing ().
Next, out of all 720 sequences, exactly 72 achieve maximal final relaxation for all users. These 72 sequences turn out not to be random. As indicated earlier, in all 72 sequences dg occurs before . For 60 of the 72 best sequences, the sequence ends with artificial light (). The other 12 sequences end with the adaptation immediately followed by the light colour () adaptation. When inspecting the plots, it can be observed that for all users, except and , the optimal sequence is within the first 72 sequences. Users and have the combination of a low optimal and intensity. A low optimal intensity deactivates the adaptation, and thus the occurrence of before does not make a difference. Furthermore, the absence of the adaptation means that fear and stress need to be decreased by another adaptation before activating , i.e., by and . The highlighted row in Table 6 indicates the sequence which is used by the heuristic optimiser. As for the outdoor environment this sequence is also not the optimal order in this case.
5.3. Discussion
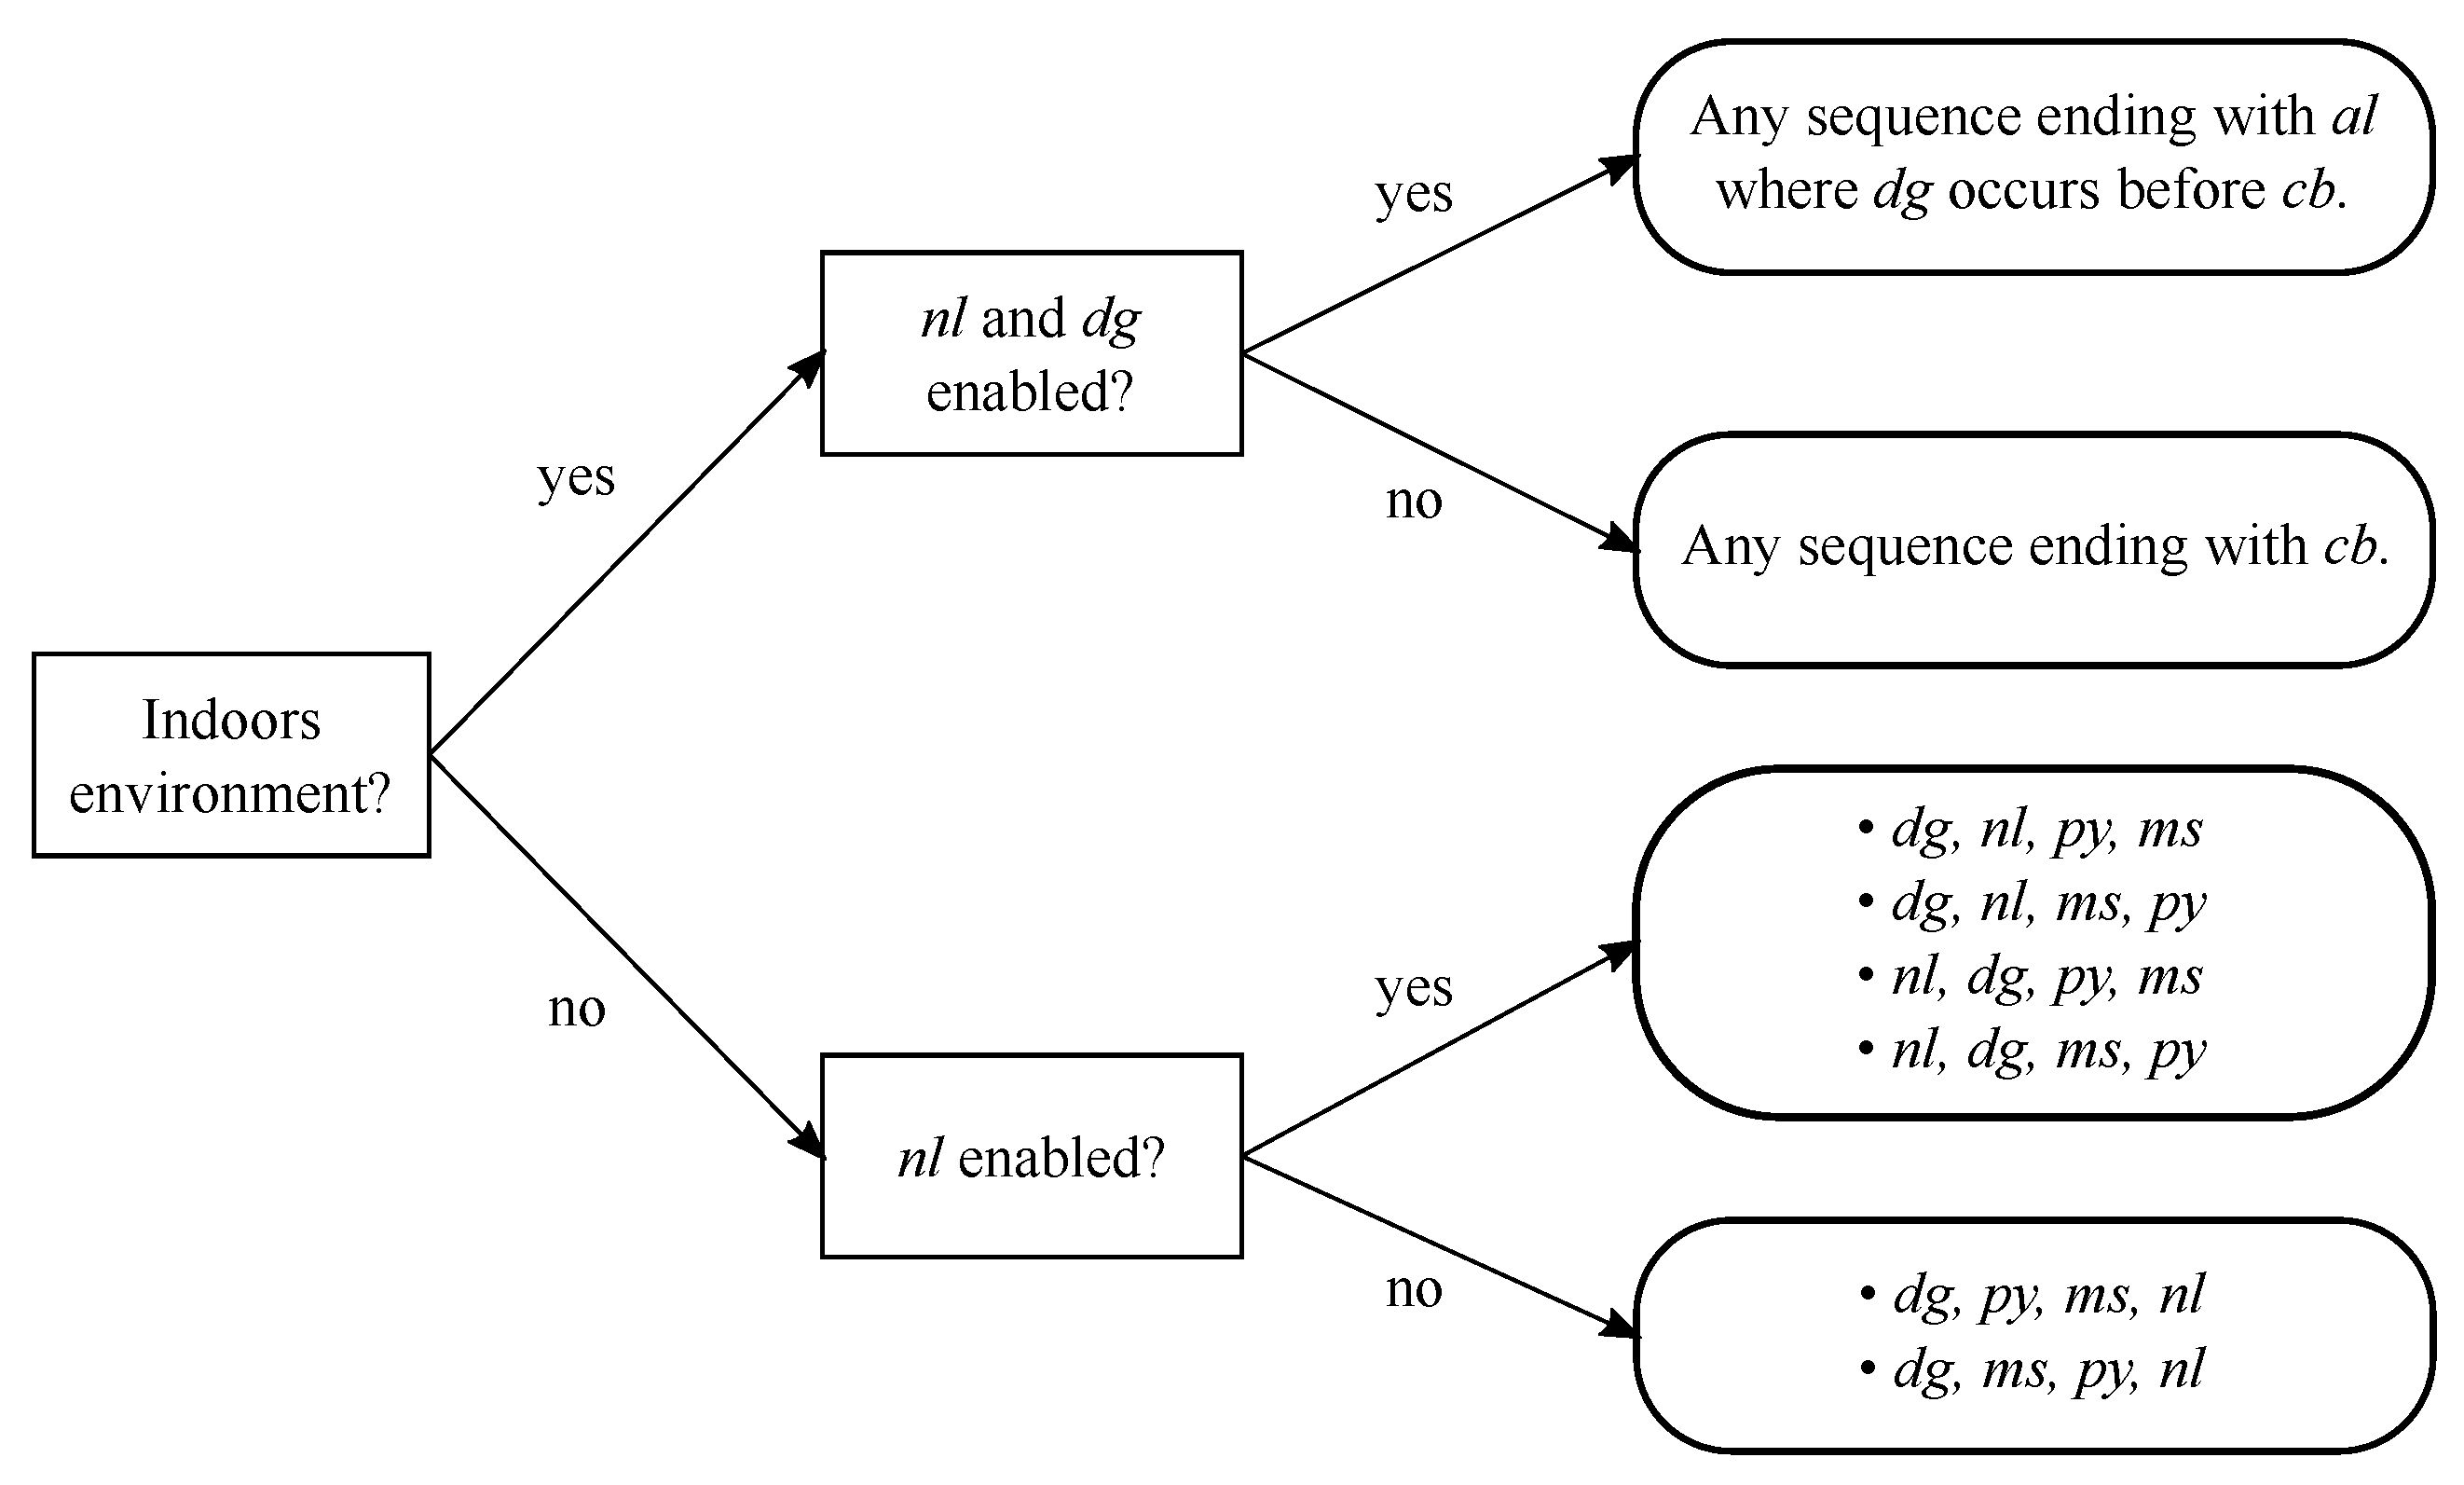
The results on the order of the adaptations have indicated that each user has an optimal order for the adaptations to occur in, this order depends entirely on the profile of the user. In fact, an algorithm in the form of a decision tree can be constructed which selects the optimal order. Before constructing this decision tree, the findings which lead to the algorithm are summarised. For the outdoor environment it was observed that natural light and dog should occur early in the sequence and music and fire can occur near the end. However, when natural light has a low optimal value, and therefore had little impact, the optimal sequences would end with natural light instead. More specifically, the set of optimal sequences are , , , ; , , , ; , , , ; and , , , . Expect if natural light has a low optimal value, than the optimal sequences are , , , ; and , , , .
Since the indoor environments contain other adaptations as well, different rules apply. It was observed that every sequence should end with artificial light and that dog should also come before controlled breathing. However, when artificial light and dog are not enabled because their optimal value is too low, the sequence should simply end with controlled breathing.
Structuring this logic into a decision tree results in Figure 14. This tree can be used to reduce the set of all possible permutation of adaptions to a small set of sequences which are guaranteed to perform better than any other sequence. Depending on the available computing power, a simulation can be run to select the very best sequence from this reduced set, or a random sequence can be selected.
This result, which shows that different sequences result in a different outcome, indeed proves that personalisation is needed. Additionally, it is shown that through the described algorithms this personalisation can be achieved. More complex algorithms and more data could potentially further improve the benefits of a personalised approach. For example, the addition of biofeedback could ensure a quicker and more accurate response to changes in emotion and behaviour of the patient.
At this stage, the focus of the research is on simulated users as they provide full control over the users. In a next stage, these tests will be extended to real human users. A demo application was already developed for these VE and the proposed model and algorithm. This demo application was presented in [42]. The response to this demo during its presentation at the conference was very positive. However, no formal subjective study was conducted. In future work, structured tests will be performed with this demo application to evaluate the relevance of the model on real users.
6. Conclusions and Future Work
In this work, a mathematical model for simulating emotional response for VR-based relaxation therapy is presented. The model makes use of both a personality profile as well as the user’s emotional state to create a fully adaptive and personalised relaxation environment for the user. This is a simple yet effective model that does not need more complication as only a limited set of base environments are possible. To illustrate its potential, it has been implemented and used in a system that provides a personalised VR experience for relaxation therapy. The system selects an environment based on a decision tree. The information for evaluating the decision tree is collected through a short list of questions. From these base environments, small adaptations are made through adaptation parameters, to personalise the environment and thus maximise the relaxation.
In this paper, the potential of the emotional model has been shown through preliminary results from simulations. Furthermore, this work shows the capability of personalised, adaptive applications in VR, not only for relaxation therapy but also for other exposure therapy applications.
As future work, we aim to further tune the emotional model by incorporating biofeedback. This biofeedback could insure that the estimated emotional state is in sync with the user’s actual state. Moreover, it could make it possible to react on small, sudden changes in the user’s state, which are not caused by the environment or are not captured explicitly in the mathematical model. Additionally, tests with actual users will be performed to collect further evidence for the effectiveness of this approach.
Author Contributions
Conceptualization, J.H. and M.T.V.; methodology, T.D.J.; software, T.D.J.; validation, J.H. and M.T.V.; formal analysis, J.H.; investigation, J.H., M.T.V. and T.D.J.; writing—original draft preparation, J.H., M.T.V. and F.D.B.; writing—review and editing, J.H., M.T.V., F.D.B. and F.D.T.; visualization, J.H.; supervision, F.D.B. and F.D.T. All authors have read and agreed to the published version of the manuscript.
Funding
This research is funded by the imec.icon project PATRONUS with contract number HBC.2017.0156, which was co-financed by imec, VLAIO, The Human Link, PreviewLabs, Bazookas and Van Roey Automation. This was a research collaboration with Ghent University—IDLab, Ghent University—MICT and imec—CHS. Maria Torres Vega is funded by the Research Foundation Flanders (FWO), grant number 12W4819N.
Conflicts of Interest
The authors declare no conflict of interest.
Abbreviations
| CNN | Convolutional Neural Network. |
| HMD | Head Mounted Display. |
| ICU | Intensive Care Unit. |
| MILP | Mixed Integer Linear Programming. |
| MINLP | Mixed Integer Non-Linear Programming. |
| SVM | Support Vector Machine. |
| VE | Virtual Environment. |
| VR | Virtual Reality. |
| WHO | World Health Organisation. |
References
- Varvogli, L.; Darviri, C. Stress Management Techniques: Evidence-based procedures that reduce stress and promote health. Health Sci. J. 2011, 5, 74–89. [Google Scholar]
- Bell, A.S.; Rajendran, D.; Theiler, S. Job stress, wellbeing, work-life balance and work-life conflict among Australian academics. E J. Appl. Psychol. 2012, 8, 25–37. [Google Scholar] [CrossRef]
- Skakon, J.; Nielsen, K.; Borg, V.; Guzman, J. Are leaders’ well-being, behaviours and style associated with the affective well-being of their employees? A systematic review of three decades of research. Work Stress 2010, 24, 107–139. [Google Scholar] [CrossRef]
- Kinman, G.; Wray, S. Taking Its Toll: Rising Stress Levels in Further Education UCU Stress Survey 2014; University and College Union: London, UK, 2015. [Google Scholar] [CrossRef]
- Carder, M.; Turner, S.; McNamee, R.; Agius, R. Work-related mental ill-health and ’stress’ in the UK (2002–2005). Occup. Med. 2009, 59, 539–544. [Google Scholar] [CrossRef] [Green Version]
- Hanser, S.B. Music Therapy and Stress Reduction Research. J. Music Ther. 1985, 22, 193–206. [Google Scholar] [CrossRef]
- Steptoe, A.; Kivimäki, M. Stress and cardiovascular disease. Nat. Rev. Cardiol. 2012, 9, 360–370. [Google Scholar] [CrossRef]
- Schure, M.B.; Christopher, J.; Christopher, S. Mind-Body Medicine and the Art of Self-Care: Teaching Mindfulness to Counseling Students Through Yoga, Meditation, and Qigong. J. Couns. Dev. 2008, 86, 47–56. [Google Scholar] [CrossRef]
- Trappey, A.; Trappey, C.V.; Chang, C.M.; Kuo, R.R.; Lin, A.P.; Nieh, C. Virtual Reality Exposure Therapy for Driving Phobia Disorder: System Design and Development. Appl. Sci. 2020, 10, 4860. [Google Scholar] [CrossRef]
- Pizzoli, S.F.M.; Mazzocco, K.; Triberti, S.; Monzani, D.; Alcañiz Raya, M.L.; Pravettoni, G. User-Centered Virtual Reality for Promoting Relaxation: An Innovative Approach. Front. Psychol. 2019, 10, 479. [Google Scholar] [CrossRef] [Green Version]
- Gutiérrez, A.; Sepúlveda-Muñoz, D.; Gil-Agudo, A.; de los Reyes Guzmán, A. Serious Game Platform with Haptic Feedback and EMG Monitoring for Upper Limb Rehabilitation and Smoothness Quantification on Spinal Cord Injury Patients. Appl. Sci. 2020, 10, 963. [Google Scholar] [CrossRef] [Green Version]
- Lee, L.N.; Kim, M.J.; Hwang, W.J. Potential of Augmented Reality and Virtual Reality Technologies to Promote Wellbeing in Older Adults. Appl. Sci. 2019, 9, 3556. [Google Scholar] [CrossRef] [Green Version]
- Valmaggia, L.R.; Latif, L.; Kempton, M.J.; Rus-Calafell, M. Virtual reality in the psychological treatment for mental health problems: An systematic review of recent evidence. Psychiatry Res. 2016, 236, 189–195. [Google Scholar] [CrossRef] [Green Version]
- Emmelkamp, P.M.G. Effectiveness of cybertherapy in mental health: A critical appraisal. Stud. Health Technol. Inform. 2011, 167, 3–8. [Google Scholar]
- Meyerbröker, K.; Emmelkamp, P.M. Virtual reality exposure therapy in anxiety disorders: A systematic review of process-and-outcome studies. Depress. Anxiety 2010, 27, 933–944. [Google Scholar] [CrossRef]
- Sekhavat, Y.A.; Nomani, P. A Comparison of Active and Passive Virtual Reality Exposure Scenarios to Elicit Social Anxiety. Int. J. Serious Games 2017, 4, 3–15. [Google Scholar] [CrossRef] [Green Version]
- Powers, M.B.; Emmelkamp, P.M. Virtual reality exposure therapy for anxiety disorders: A meta-analysis. J. Anxiety Disord. 2008, 22, 561–569. [Google Scholar] [CrossRef]
- Opriş, D.; Pintea, S.; García-Palacios, A.; Botella, C.; Szamosközi, Ş.; David, D. Virtual reality exposure therapy in anxiety disorders: A quantitative meta-analysis: Virtual Reality Exposure Therapy. Depress. Anxiety 2012, 29, 85–93. [Google Scholar] [CrossRef]
- Shah, L.B.I.; Torres, S.; Kannusamy, P.; Chng, C.M.L.; He, H.G.; Klainin-Yobas, P. Efficacy of the Virtual Reality-Based Stress Management Program on Stress-Related Variables in People With Mood Disorders: The Feasibility Study. Arch. Psychiatr. Nurs. 2015, 29, 6–13. [Google Scholar] [CrossRef]
- Soyka, F.; Leyrer, M.; Smallwood, J.; Ferguson, C.; Riecke, B.E.; Mohler, B.J. Enhancing stress management techniques using virtual reality. In Proceedings of the ACM Symposium on Applied Perception— SAP ’16, Anaheim, CA, USA, 22–23 July 2016; pp. 85–88. [Google Scholar] [CrossRef]
- Gerber, S.M.; Jeitziner, M.M.; Wyss, P.; Chesham, A.; Urwyler, P.; Müri, R.M.; Jakob, S.M.; Nef, T. Visuo-acoustic stimulation that helps you to relax: A virtual reality setup for patients in the intensive care unit. Sci. Rep. 2017, 7, 1–10. [Google Scholar] [CrossRef] [Green Version]
- Anderson, A.P.; Mayer, M.D.; Fellows, A.M.; Cowan, D.R.; Hegel, M.T.; Buckey, J.C. Relaxation with Immersive Natural Scenes Presented Using Virtual Reality. Aerosp. Med. Hum. Perform. 2017, 88, 520–526. [Google Scholar] [CrossRef]
- Hyland, M.E.; Halpin, D.M.; Blake, S.; Seamark, C.; Pinnuck, M.; Ward, D.; Whalley, B.; Greaves, C.J.; Hawkins, A.L.; Seamark, D. Preference for different relaxation techniques by COPD patients: Comparison between six techniques. Int. J. Chronic Obstr. Pulm. Dis. 2016, 11, 2315–2319. [Google Scholar] [CrossRef] [Green Version]
- Graffam, S.; Johnson, A. A comparison of two relaxation strategies for the relief of pain and its distress. J. Pain Symptom Manag. 1987, 2, 229–231. [Google Scholar] [CrossRef]
- Macnamara, C.L.; Cvejic, E.; Parker, G.B.; Lloyd, A.R.; Lee, G.; Beilharz, J.E.; Vollmer-Conna, U. Personalised relaxation practice to improve sleep and functioning in patients with chronic fatigue syndrome and depression: Study protocol for a randomised controlled trial. Trials 2018, 19, 371. [Google Scholar] [CrossRef] [Green Version]
- Maples-Keller, J.L.; Bunnell, B.E.; Kim, S.J.; Rothbaum, B.O. The Use of Virtual Reality Technology in the Treatment of Anxiety and Other Psychiatric Disorders. Harv. Rev. Psychiatry 2017, 25, 103–113. [Google Scholar] [CrossRef]
- Garcia-Ceja, E.; Riegler, M.; Nordgreen, T.; Jakobsen, P.; Oedegaard, K.J.; Tørresen, J. Mental health monitoring with multimodal sensing and machine learning: A survey. Pervasive Mob. Comput. 2018, 51, 1–26. [Google Scholar] [CrossRef]
- Egger, M.; Ley, M.; Hanke, S. Emotion Recognition from Physiological Signal Analysis: A Review. Electron. Notes Theor. Comput. Sci. 2019, 343, 35–55. [Google Scholar] [CrossRef]
- Healey, J.; Picard, R. Detecting Stress During Real-World Driving Tasks Using Physiological Sensors. IEEE Trans. Intell. Transp. Syst. 2005, 6, 156–166. [Google Scholar] [CrossRef] [Green Version]
- Miranda, D.; Calderón, M.; Favela, J. Anxiety detection using wearable monitoring. In Proceedings of the 5th Mexican Conference on Human-Computer Interaction—MexIHC ’14, Oaxaca, Mexico, 3–5 November 2014; pp. 34–41. [Google Scholar] [CrossRef]
- Lee, M.S.; Lee, Y.K.; Pae, D.S.; Lim, M.T.; Kim, D.W.; Kang, T.K. Fast Emotion Recognition Based on Single Pulse PPG Signal with Convolutional Neural Network. Appl. Sci. 2019, 9, 3355. [Google Scholar] [CrossRef] [Green Version]
- Domínguez-Jiménez, J.; Campo-Landines, K.; Martínez-Santos, J.; Delahoz, E.; Contreras-Ortiz, S. A machine learning model for emotion recognition from physiological signals. Biomed. Signal Process. Control 2020, 55, 101646. [Google Scholar] [CrossRef]
- Steimer, T. The biology of fear- and anxiety-related behaviors. Dialogues Clin. Neurosci. 2002, 4, 231–249. [Google Scholar]
- Sims, C.R. Rate–distortion theory and human perception. Cognition 2016, 152, 181–198. [Google Scholar] [CrossRef] [Green Version]
- Smolders, K.C.; de Kort, Y.A. Bright light and mental fatigue: Effects on alertness, vitality, performance and physiological arousal. J. Environ. Psychol. 2014, 39, 77–91. [Google Scholar] [CrossRef]
- Luenberger, D.G.; Ye, Y. Linear and Nonlinear Programming; International Series in Operations Research & Management Science; Springer International Publishing: Cham, Switzerland, 2016; Volume 228. [Google Scholar] [CrossRef]
- Manav, B. Color-emotion associations and color preferences: A case study for residences. Color Res. Appl. 2007, 32, 144–150. [Google Scholar] [CrossRef]
- Dana Lynn, C. Hearth and Campfire Influences on Arterial Blood Pressure: Defraying the Costs of the Social Brain through Fireside Relaxation. Evol. Psychol. 2014, 12, 147470491401200. [Google Scholar] [CrossRef]
- Friedmann, E.; Son, H. The Human–Companion Animal Bond: How Humans Benefit. Vet. Clin. N. Am. Small Anim. Pract. 2009, 39, 293–326. [Google Scholar] [CrossRef]
- Suied, C.; Drettakis, G.; Warusfel, O.; Viaud-Delmon, I. Auditory-Visual Virtual Reality as a Diagnostic and Therapeutic Tool for Cynophobia. Cyberpsychol. Behav. Soc. Netw. 2013, 16, 145–152. [Google Scholar] [CrossRef] [Green Version]
- Paulus, E.; Yusuf, F.; Suryani, M.; Suryana, I. Development and Evaluation on Night Forest Virtual Reality as Innovative Nyctophobia Treatment. J. Phys. Conf. Ser. 2019, 1235, 012003. [Google Scholar] [CrossRef] [Green Version]
- Heyse, J.; Jonge, T.D.; Torres Vega, M.; Backere, F.D.; De Turck, F. A personalized Virtual Reality Experience for Relaxation Therapy. In Proceedings of the 2019 Eleventh International Conference on Quality of Multimedia Experience (QoMEX), Berlin, Germany, 5–7 June 2019; pp. 1–3. [Google Scholar] [CrossRef] [Green Version]
Figure 1.
High level view of the architecture.

Figure 2.
Plots showing different preference functions for different optimal values.

Figure 3.
Plots showing different fear inductor functions for different optimal values.

Figure 4.
The two types of indoor environment.

Figure 5.
The two types of outdoor environment.

Figure 6.
Decision tree used by the environment selector.

Figure 7.
The progression of the fear function for a changing intensity of and different values for , where and are fixed.
Figure 7.
The progression of the fear function for a changing intensity of and different values for , where and are fixed.

Figure 8.
Plots showing the calculation of stress as it depends on other functions. Each plot shows stress in function of a different adaptation.
Figure 8.
Plots showing the calculation of stress as it depends on other functions. Each plot shows stress in function of a different adaptation.

Figure 9.
Plots showing the calculation of arousal as it depends on other functions. Each plot shows arousal in function of a different adaptation.
Figure 9.
Plots showing the calculation of arousal as it depends on other functions. Each plot shows arousal in function of a different adaptation.

Figure 10.
Plots showing the evolution of the emotional states at each time step for the outdoor environment. The heuristic optimiser applies the adaptations in the same order for each user.
Figure 10.
Plots showing the evolution of the emotional states at each time step for the outdoor environment. The heuristic optimiser applies the adaptations in the same order for each user.

Figure 11.
Plots showing the evolution of the emotional states at each time step for the indoor environment. The heuristic optimiser applies the adaptations in the same order for each user.
Figure 11.
Plots showing the evolution of the emotional states at each time step for the indoor environment. The heuristic optimiser applies the adaptations in the same order for each user.

Figure 12.
The average relaxation over all simulations plotted for every permutation of adaptations for the outdoor environment. The adaptation sequences are sorted according to decreasing final and average relaxation.
Figure 12.
The average relaxation over all simulations plotted for every permutation of adaptations for the outdoor environment. The adaptation sequences are sorted according to decreasing final and average relaxation.

Figure 13.
The average relaxation over all simulations plotted for every permutation of adaptations for the indoor environment. The adaptation sequences are sorted according to decreasing final and average relaxation.
Figure 13.
The average relaxation over all simulations plotted for every permutation of adaptations for the indoor environment. The adaptation sequences are sorted according to decreasing final and average relaxation.

Figure 14.
Visualisation of the decision process that leads to an optimal sequence.


Table 1.
Summary of all possible adaptations implemented in the VEs.
| Full Name | Notation | Indoor | Outdoor | Description |
|---|---|---|---|---|
| Artificial light | x | Artificial light coming from light bulbs in the ceiling of the room. | ||
| Natural light | x | x | Natural light coming from the sun and moon. | |
| Light colour | x | The colour of the artificial light. The available colors are white and blue and any mixture of these two. | ||
| Fire | x | A simulation of a campfire. This also generates some artificial light. | ||
| Dog | x | x | A dog playing around. The dog can be either playing around further away or be near the user. | |
| Music | x | x | Some relaxation music or sounds are playing in the background. These are birds sounds for the indoor environments and soothing music for the indoor environments. | |
| Controlled breathing | x | An visual aid for a controlled breathing exercise is shown. |
Table 2.
The amount of possible answers that can be given to every question from the questionnaire.
| No. | Question | Possible Answers |
|---|---|---|
| 1 | Would you prefer an indoor or outdoor environment to relax? | [indoor, outdoor] |
| 2 | Could the presence of water help you to relax? | [yes, no] |
| 3 | Are you afraid of heights? | [yes, no] |
| 4 | What is you favourite season? | [summer, winter] |
| 5 | How does having a calm campfire nearby make you feel? | {relaxed, anxious} |
| 6 | How do you feel when a dog is in your presence? | {relaxed, anxious} |
| 7 | How does darkness make you feel? | {relaxed, anxious} |
| 8 | How do you find classical relaxation music? | {very relaxing, not relaxing at all} |
| 9 | Blue light gives you a relaxed feeling, do you agree? | {agree, disagree} |
| 10 | How afraid do you feel right now? | {not at all, very much} |
| 11 | How stressed do you feel right now? | {not at all, very much} |
| 12 | How aroused do you feel right now? | {not at all, very much} |
Table 3.
Summary of all possible adaptations used by the emotional model. For each of the adaptations, the value of the constants defines the presence of the emotions in the equation.
Table 3.
Summary of all possible adaptations used by the emotional model. For each of the adaptations, the value of the constants defines the presence of the emotions in the equation.
| Range | ||||||||
|---|---|---|---|---|---|---|---|---|
| 1 | 0 | 0 | 0 | 1 | 1 | 0 | ||
| 1 | 0 | 0 | 0 | 1 | 1 | 0 | ||
| 0 | 0 | 0 | 0 | 0 | 1 | 0 | ||
| 1 | 1 | 0 | 0 | 0 | 0 | 0 | ||
| 1 | 1 | 0 | 0 | 0 | 0 | 0 | ||
| 0 | 0 | 0 | 1 | 0 | 1 | 0 | ||
| 0 | 0 | 1 | 0 | 0 | 0 | 1 |
Table 4.
User profiles used for simulations.
| Id | Environment | Optimal Intensity | Description | |||||
|---|---|---|---|---|---|---|---|---|
| dg | py | nl | al | lc | ms | |||
| User | indoor | 0.9 | n/a | 0.9 | 0.9 | 0.9 | 0.9 | Dog lover; Afraid of darkness; Likes music and blue light. |
| User | outdoor | 0.9 | 0.9 | 0.9 | n/a | n/a | 0.9 | Dog lover; Afraid of darkness; Likes music and fire. |
| User | indoor | 0.5 | n/a | 0.5 | 0.5 | 0.5 | 0.5 | Neutral towards every adaptation. |
| User | outdoor | 0.5 | 0.5 | 0.5 | n/a | n/a | 0.5 | Neutral towards every adaptation. |
| User | indoor | 0.1 | n/a | 0.1 | 0.1 | 0.1 | 0.1 | Afraid of dogs; Loves darkness; Dislikes music and blue light. |
| User | outdoor | 0.1 | 0.1 | 0.1 | n/a | n/a | 0.1 | Afraid of dogs and fire; Loves darkness; Dislikes music. |
| User | indoor | 0.0 | n/a | 0.1 | 0.1 | 0.7 | 0.9 | Afraid of dogs; Loves darkness, music and blue light. |
| User | outdoor | 0.0 | 0.7 | 0.1 | n/a | n/a | 0.9 | Afraid of dogs; Loves darkness, music and fire. |
| User | indoor | 1.0 | n/a | 0.8 | 0.8 | 0.1 | 0.3 | Dog lover; Afraid of darkness; Dislikes music and blue light. |
| User | outdoor | 1.0 | 0 | 0.8 | n/a | n/a | 0.3 | Dog lover; Afraid of darkness and fire; Dislikes music. |
| User | indoor | 0.6 | n/a | 0.4 | 0.4 | 0.8 | 0.1 | Likes blue light; Dislikes music. |
| User | outdoor | 0.6 | 0.8 | 0.4 | n/a | n/a | 0.1 | Loves fire; Dislikes music. |
Table 5.
Effect of different adaptation sequences on the average relaxation for outdoor environments. The list is ordered according to decreasing final and average relaxation. The highlighted sequence is the order used in the heuristic implementation.
Table 5.
Effect of different adaptation sequences on the average relaxation for outdoor environments. The list is ordered according to decreasing final and average relaxation. The highlighted sequence is the order used in the heuristic implementation.
| No. | Sequence | Average Relaxation | Final Relaxation | |||
|---|---|---|---|---|---|---|
| 1 | dg | nl | ms | py | 0.894 | 1 |
| 2 | dg | nl | py | ms | 0.890 | 1 |
| 3 | nl | dg | ms | py | 0.884 | 1 |
| 4 | dg | ms | nl | py | 0.881 | 1 |
| 5 | nl | dg | py | ms | 0.880 | 1 |
| 6 | ms | dg | nl | py | 0.875 | 1 |
| 7 | nl | ms | dg | py | 0.874 | 1 |
| 8 | nl | py | dg | ms | 0.865 | 1 |
| 9 | dg | py | nl | ms | 0.864 | 1 |
| 10 | ms | nl | dg | py | 0.861 | 1 |
| 11 | dg | ms | py | nl | 0.856 | 1 |
| 12 | nl | ms | py | dg | 0.855 | 1 |
| 13 | nl | py | ms | dg | 0.855 | 1 |
| 14 | dg | py | ms | nl | 0.850 | 1 |
| 15 | py | dg | nl | ms | 0.850 | 1 |
| 16 | ms | dg | py | nl | 0.850 | 1 |
| 17 | py | nl | dg | ms | 0.844 | 1 |
| 18 | ms | nl | py | dg | 0.842 | 1 |
| 19 | py | dg | ms | nl | 0.836 | 1 |
| 20 | ms | py | dg | nl | 0.836 | 1 |
| 21 | py | nl | ms | dg | 0.834 | 1 |
| 22 | py | ms | dg | nl | 0.831 | 1 |
| 23 | ms | py | nl | dg | 0.825 | 1 |
| 24 | py | ms | nl | dg | 0.820 | 1 |
Table 6.
Effect of different adaptation sequences on the final and average relaxation for indoor environments. The list is ordered according to decreasing final and average relaxation. The highlighted sequence is the order used in the heuristic implementation.
Table 6.
Effect of different adaptation sequences on the final and average relaxation for indoor environments. The list is ordered according to decreasing final and average relaxation. The highlighted sequence is the order used in the heuristic implementation.
| No. | Sequence | Average Relaxation | Final Relaxation | |||||
|---|---|---|---|---|---|---|---|---|
| 1 | lc | dg | ms | cb | nl | al | 0.782 | 1.000 |
| … | ||||||||
| 72 | ms | nl | dg | cb | lc | al | 0.736 | 1.000 |
| 73 | lc | dg | ms | cb | al | nl | 0.793 | 0.996 |
| … | ||||||||
| 221 | dg | nl | al | cb | ms | lc | 0.759 | 0.982 |
| … | ||||||||
| 276 | ms | al | nl | dg | cb | lc | 0.751 | 0.982 |
| 277 | dg | al | lc | ms | cb | nl | 0.793 | 0.972 |
| … | ||||||||
| 360 | al | ms | nl | dg | cb | lc | 0.745 | 0.972 |
| 361 | lc | nl | ms | al | cb | dg | 0.719 | 0.858 |
| … | ||||||||
| 528 | cb | ms | al | nl | dg | lc | 0.622 | 0.858 |
| 529 | lc | nl | al | cb | dg | ms | 0.720 | 0.848 |
| … | ||||||||
| 660 | cb | al | ms | nl | dg | lc | 0.621 | 0.848 |
| 661 | al | lc | nl | ms | cb | dg | 0.719 | 0.838 |
| … | ||||||||
| 720 | al | cb | ms | nl | dg | lc | 0.644 | 0.838 |
© 2020 by the authors. Licensee MDPI, Basel, Switzerland. This article is an open access article distributed under the terms and conditions of the Creative Commons Attribution (CC BY) license (http://creativecommons.org/licenses/by/4.0/).
Share and Cite
MDPI and ACS Style
Heyse, J.; Torres Vega, M.; De Jonge, T.; De Backere, F.; De Turck, F. A Personalised Emotion-Based Model for Relaxation in Virtual Reality. Appl. Sci. 2020, 10, 6124. https://0-doi-org.brum.beds.ac.uk/10.3390/app10176124
AMA Style
Heyse J, Torres Vega M, De Jonge T, De Backere F, De Turck F. A Personalised Emotion-Based Model for Relaxation in Virtual Reality. Applied Sciences. 2020; 10(17):6124. https://0-doi-org.brum.beds.ac.uk/10.3390/app10176124
Chicago/Turabian StyleHeyse, Joris, Maria Torres Vega, Thomas De Jonge, Femke De Backere, and Filip De Turck. 2020. "A Personalised Emotion-Based Model for Relaxation in Virtual Reality" Applied Sciences 10, no. 17: 6124. https://0-doi-org.brum.beds.ac.uk/10.3390/app10176124
Note that from the first issue of 2016, this journal uses article numbers instead of page numbers. See further details here.