Effect of Equivalent Load Distribution on the Accuracy of Mapping the Reinforcement Load Deflection Curve in LTP


1
Institute of Civil Engineering, Warsaw University of Life Sciences, Nowoursynowska 159, 02 776 Warsaw, Poland
2
Institute of Building Engineering, Warsaw University of Technology, Al. Armii Ludowej 16, 00-637 Warsaw, Poland
*
Authors to whom correspondence should be addressed.
Appl. Sci. 2020, 10(17), 6127; https://0-doi-org.brum.beds.ac.uk/10.3390/app10176127
Submission received: 30 July 2020
/
Revised: 25 August 2020
/
Accepted: 1 September 2020
/
Published: 3 September 2020
(This article belongs to the Section Civil Engineering)
Abstract
:The formulations of tasks modelling embankments on soft soil, improved with columns and with reinforced load transfer platform (LTP), differ significantly. One of these differences is the distribution of equivalent load modelling part of the load carried by the LTP reinforcement and soft soil. This article analyses the influence of the nature of the load-modelling linear function, i.e., inverse triangular, uniformly distributed and triangular, as well as intermediate distributions. In total, 41 distributions of equivalent load were considered, and the results of the obtained deflection functions were compared with the measurement results of reinforcement deflection for 5 cases of experimental research available in the literature. A measure of the accuracy of mapping the reinforcement deflection curve was proposed as a relative error in relation to the deflection curve resulting from experimental measurements. Based on the analysis of the mapping error, it was determined that among the three commonly used distributions, the inverse triangular distribution shows the best fit in most of the analysed cases. However, not in every single case this is the distribution leading to a solution that best describes the behaviour of the geosynthetic reinforcement.
1. Introduction
For many years, embankments on soft soils improved with columns with transmission layer reinforcement have been the subject of worldwide research. This is an extremely complex problem due to a number of system interactions and occurring phenomena (e.g., the arching effect). The mechanism of load distribution and behaviour of such structure is still not fully understood, and models used for designing calculations differ significantly.
The research results on embankments supported by a ground improved with columns are commonly presented in current literature, indicating the need for further analysis. The research concerns both cases, i.e., without LTP reinforcement and with reinforcement. Ellis and Aslam [1,2] described in detail a series of centrifuge tests of unreinforced piled embankments; these studies were aimed at a better understanding of the arching concept. The results of measurements of model experiments on embankments without LTP reinforcement were also presented, e.g., by Britton and Naughton [3,4] and Hewlett and Randolph [5].
A series of model tests of embankments with a reinforced LTP were also performed. The results of scaled field experiments are given in [6], and the results of scaled laboratory experiments are presented e.g., in [7,8]. Measurements from selected tests presented in [9,10] were used in the current paper. Full scale tests were carried out both on trial plots [7,11,12,13] and in the final structure [14,15]. In most cases, researchers measured the geosynthetic strains. Only in a few tests the displacement of the geosynthetic was also measured. Data reported by Briançon and Simon [13] were particularly useful for application in the present paper. In the case of these studies, geosynthetic/soil settlements and the pressure exerted by the embankment between columns were measured over time.
The experimental results presented in [16] showed that the membrane effect in a reinforcement combined with soil arching provides values of efficiency regarding load transfer to the piles close to 100% for all of the twenty-eight centrifuge tests performed.
The analysis of road embankments on a ground improved with columns is carried out in two steps. In the first step, the load from the embankment and traffic is divided into the part carried directly by the columns (denoted as part A) and the rest (B + C) carried by the LTP reinforcement and the soft soil between the columns. This separation occurs as a result of arch mobilisation in the soil (the so-called ‘arching’ effect). Depending on local conditions, the geosynthetic may or may not be supported on weak soil (in the latter case C = 0). Whether soft soil is involved in the load distribution depends on its properties. In the case of BS [17], it is assumed that the soft soil does not contribute to the load transfer (C = 0). On the other hand, in the case of CUR [18] and EBGEO [19], the parameter characterizing soft soil for design purposes is subgrade reaction k [kN/m3]. Subgrade reaction k of the stratum can be estimated from the constrained modulus of the stratum E [kN/m2] and its thickness. In exceptional situations, such as loss of soil support, k = 0 is assumed for calculations [18,19].
In the analytical methods, in order to determine the forces and strains of the reinforcement, the spatial system is reduced to the 1D problem of the membrane loaded with the equivalent load modelling the remaining part of the load (B + C).
The arching effect and its description have been the subject of numerous reports (for example [20,21,22,23,24,25,26]. Fonseca and Palmeira [27], Naughton and Kempton [28] and Stewart and Filz [29] showed that various analytical calculation models for arching in piled embankments give different results in specific cases. Zhang et al. [30] with series of 3-D numerical analysis showed, that embankment on soft soil improved with columns with reinforced LTP performed better under uniform surface loading than under localized surface loading in terms of its deformation and load transfer. The arching phenomenon and the load distribution itself is not the main focus of this article; the values of the equivalent load resulting from measurements were adopted for the reinforcement analyses.
In the present paper, only the second step of the calculations is analysed (load deflection behaviour of the reinforcement). In this step, the load (B + C) on the reinforcement strip between the columns is the one-dimensional load on the membrane strip, and its distribution is different depending on the model used.
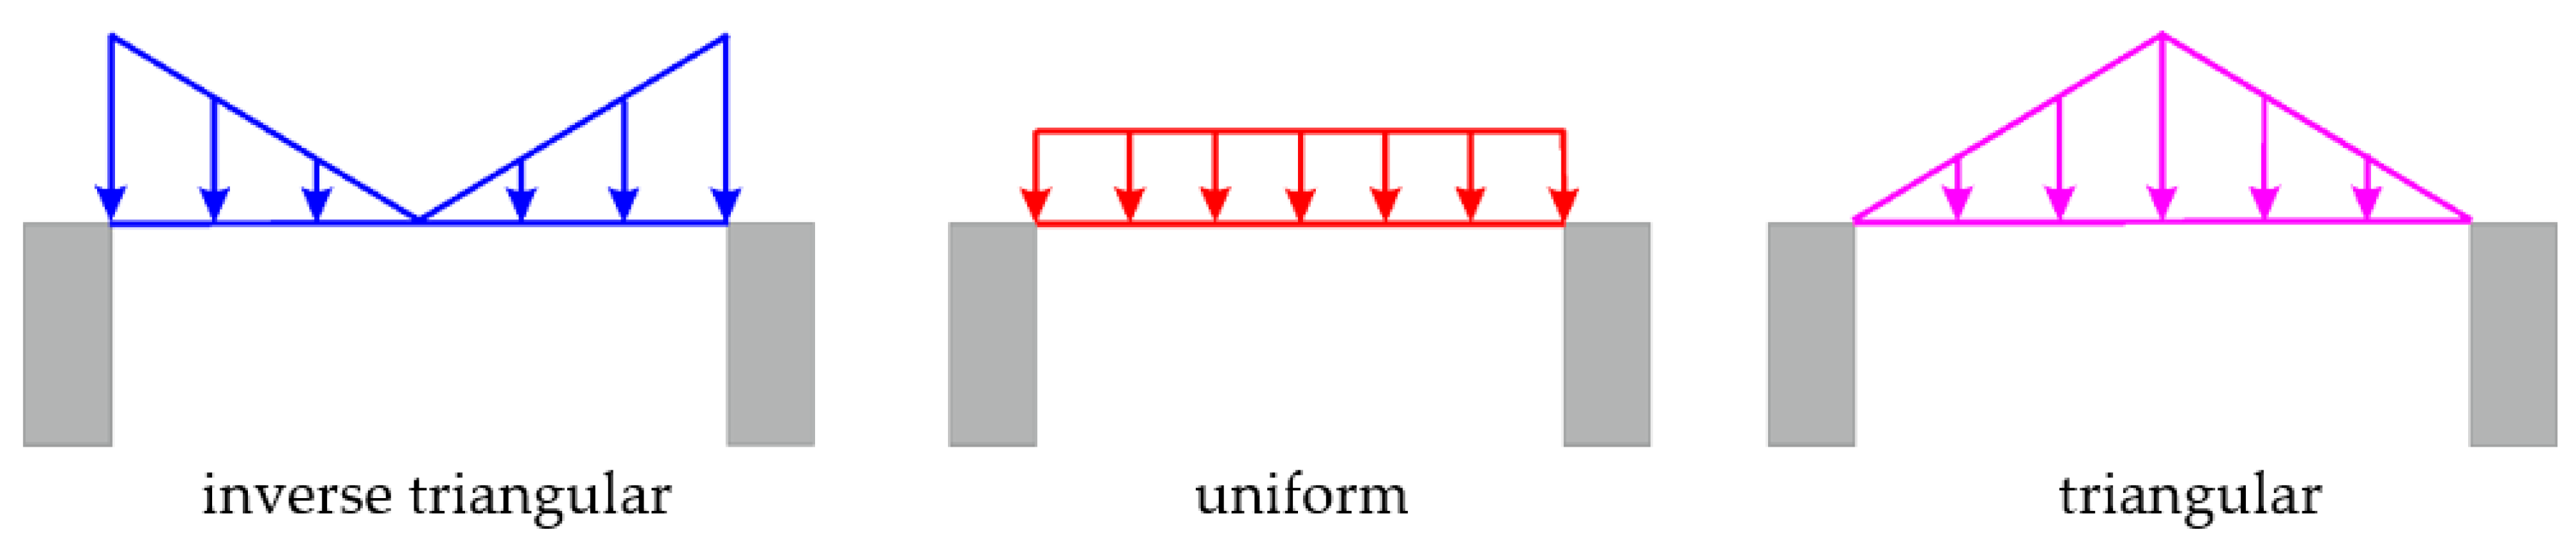
Some researchers assume that the vertical stress distribution applied on the geosynthetic is uniform [16,17,31,32,33], has a triangular shape [19] or an inverse triangular shape [9,10,18]. There is no unified approach to both the shape of the equivalent load distribution and the arching model.
The three commonly used distributions of equivalent load that model the load of the LTP reinforcement, presented in Figure 1, differ considerably. The behaviour of the membrane varies depending on the adopted distribution. Gajewska and Gajewski [34] showed that the distribution of the equivalent load has a significant impact on the behaviour of the membrane modelling the LTP reinforcement.
In the present paper, 41 distributions of the equivalent load from inverse triangular to triangular were analysed, and the obtained deflection functions were compared with the results of measurements of reinforcement deflection for 5 cases. Three cases concern a situation where the soil between the columns is not involved in the load transfer (k = 0, no soil support). For these cases, 4 deflection curves were analysed. The next two cases were related to situations where the role of soft soil in transferring loads is significant. For these cases, 7 deflection curves were analysed. The aim of the research was to determine which of the considered load distributions best maps the actual behaviour of the geosynthetic reinforcement. The analyses presented so far in the literature (cf. e.g., [9,10]) concerning the influence of the load distribution on the shape of the deflection curve of the reinforcement consisted in a visual comparison of the shape of the analytical deflection function and the shape of the experimental reinforcement deflection curve, and the assessment of the equivalent load distribution based on the shape of the second derivative plot of the reinforcement deflection curve. The authors proposed the measure of degree of accuracy as a relative error of mapping the deflection curve (see Equation (2)). The smaller the error value, the adopted load distribution allowed to more accurately reproduce the deflection curve resulting from the measurements.
2. Methodology
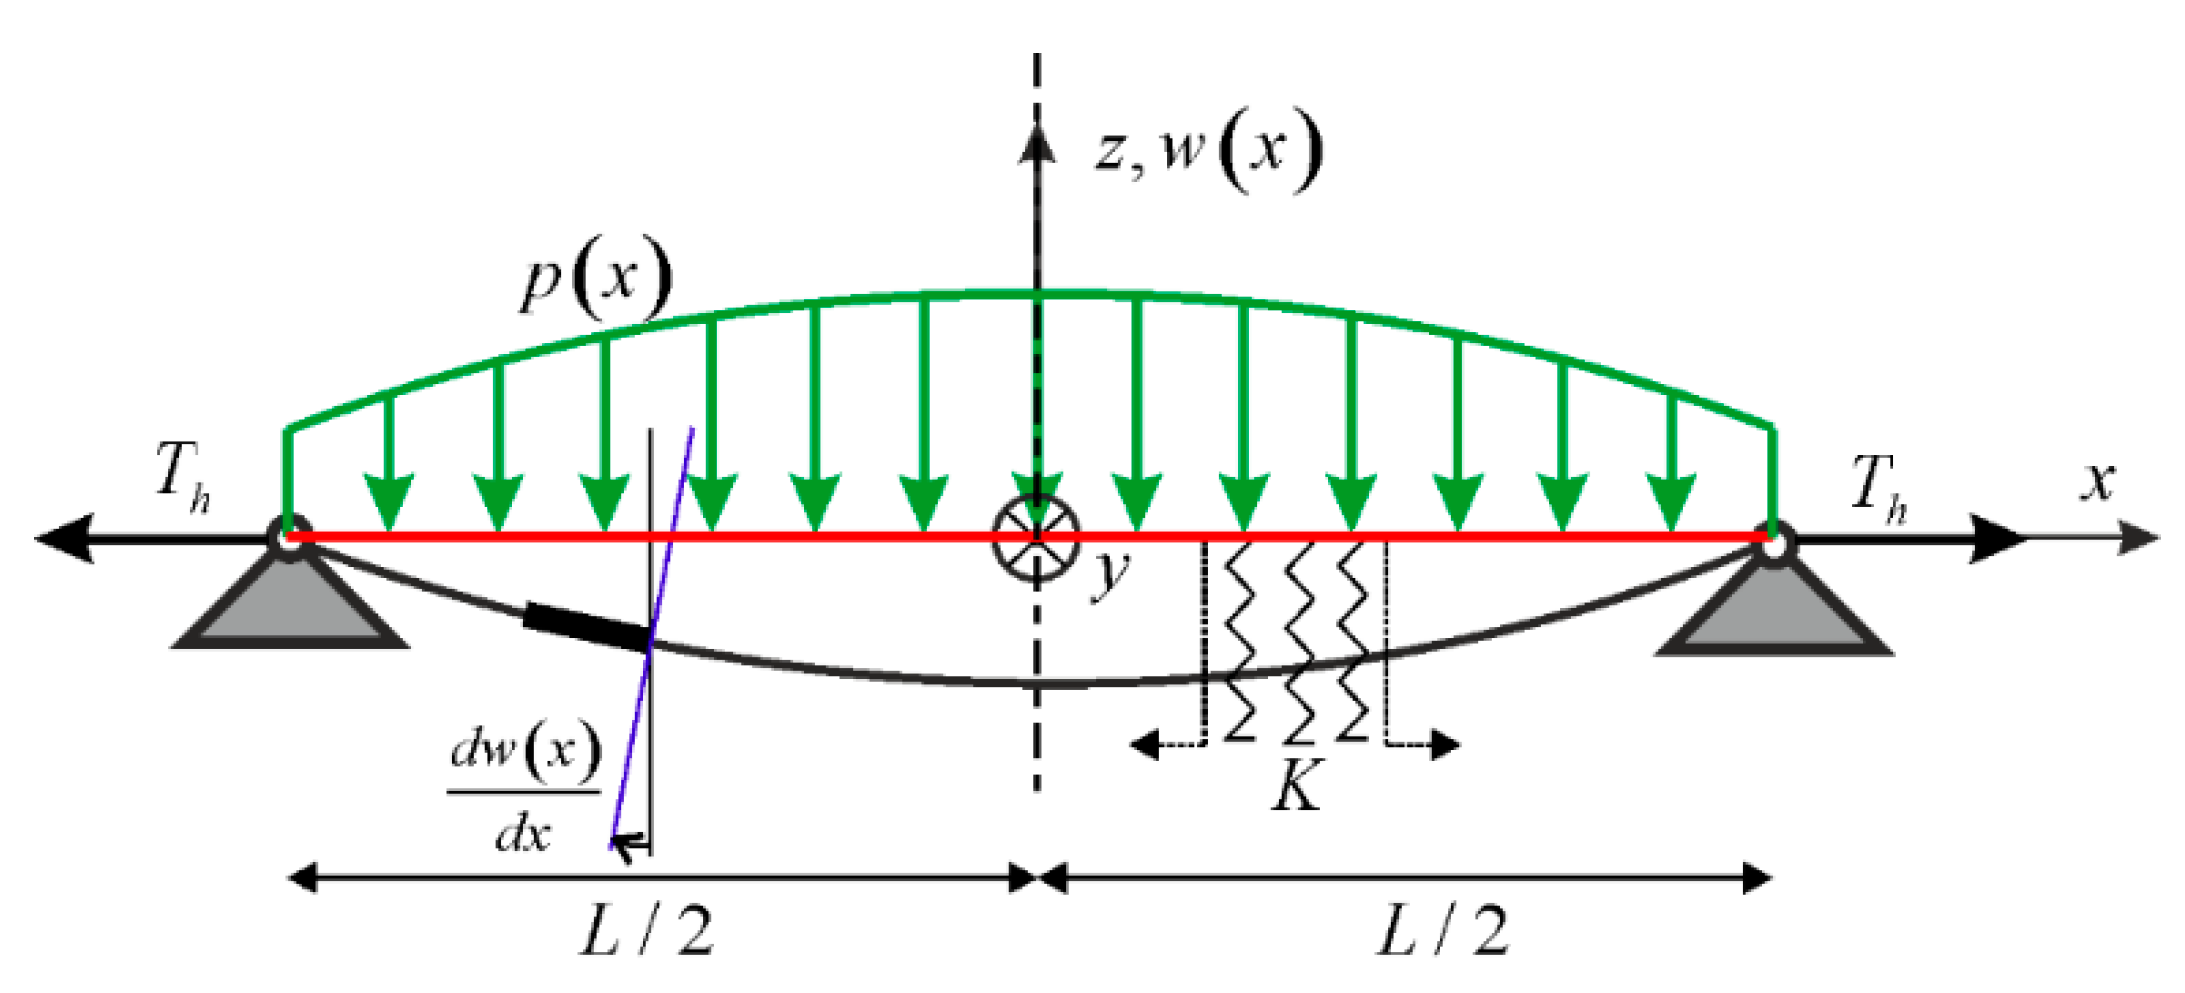
The equivalent load in a one-dimensional task should have a distribution ensuring a solution corresponding to the actual behaviour of the structure and enabling the most accurate determination of all quantities necessary for the proper design of the LTP geosynthetic reinforcement. A membrane modelling the geosynthetic reinforcement, loaded with the equivalent load of a given general distribution, is shown in Figure 2. The parameter K is equivalent subgrade reaction value [kN/m3].
In this paper, the loads in the form of a function (1) modelling all distributions from inverse triangular, through uniform, to triangular, were assumed:
where:
- —function describing the equivalent load [kPa];
- —equivalent load on the membrane [kPa];
- —coefficient determining the load distribution [–];
- —clear distance between adjacent columns [m];
- —distance from the centre between the columns [m].
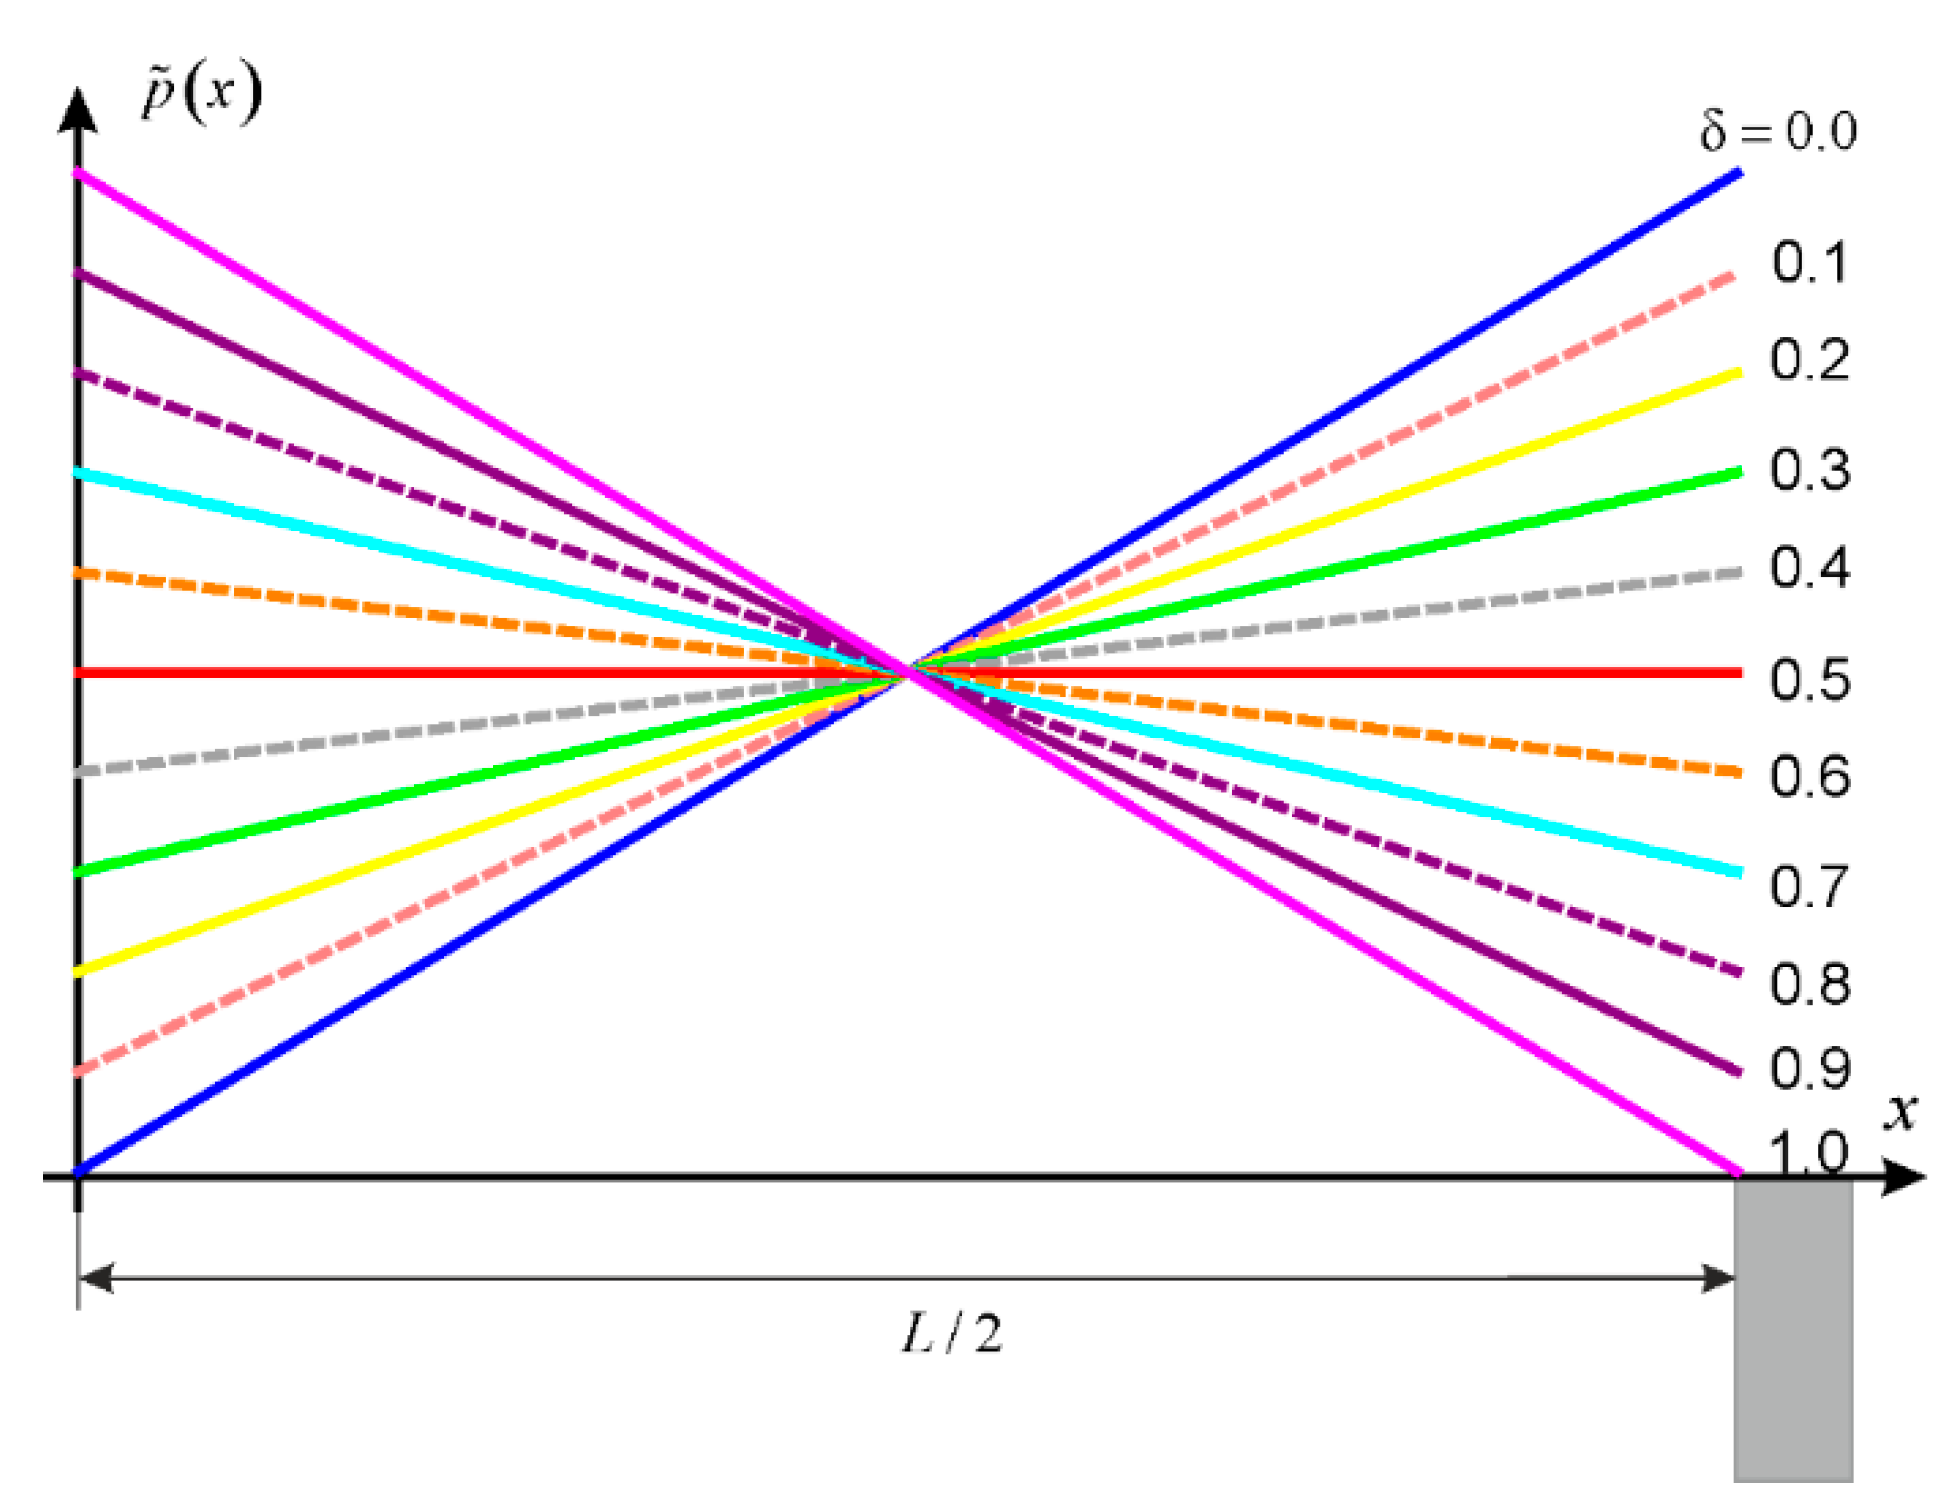
Parameter is the parameter in the range from 0 to 1. The load attains the inverse triangular distribution for , the uniform distribution—for , and the triangular distribution—for . Examples of load distributions depending on parameter are shown in Figure 3.
In further analyses, 41 load distributions from inverse triangular to triangular () were taken into account with the increment equal to 0.025. The deflection curve of the membrane was determined for each analysed load distribution. In order to determine the forces in the membrane and its deflection curve , the method presented by the authors in [35] was applied. This method is based on expanding into the Taylor series the expression for the curve length used to determine the deformation in the membrane. The membrane tension force can be determined from the condition for strain equality (see [35,36]). Unfortunately, this equation is highly nonlinear and additionally the accuracy of the solution depends on the number of series terms in the expression for the curve length. Tension force is found using numerical methods and the Wolfram Mathematica program. In order to compare the deflection of the membrane under each of the analysed load distributions with the results of experimental tests (laboratory and in situ), the formula for the interpretation of the mapping error was introduced in the following form:
As 41 values of parameter were introduced and the obtained solutions were compared with 5 cases (including 18 deflection curves resulting from the measurements), a program was written in Mathematica to automate the calculations. For example, Figure 4 shows the degree of accuracy of the deflection curve resulting from the measurements (blue line) for three load distributions represented by , and .
3. Analysis of the Measurement Results of Geosynthetic Reinforcement Deflection
There are many publications describing laboratory-scaled and natural-scale tests of embankments on a soft soil improved with columns and with reinforced LTP. In the case of LTP reinforcement, the required parameters are the values of the reinforcement strains [10]. Few researchers have measured the geosynthetic settlement, from which the deflection curve can be determined. For the present paper, measurements from five tests available in the literature were used, both the laboratory-scaled test and the full-scale tests.
Dutch scaled tests
Van Eekelen conducted a series of 12 laboratory-scaled tests [10]. Soft soil was modelled by a foam rubber cushion. On the top of the foam cushion and the piles, a 1.5 to 2 cm thick sand layer was applied. Then a GR (geotextile or geogrid) was attached. The embankment was represented by a 42 cm layer of sand or granular fill. The consolidation process of the soft soil was also modelled; the tap allowed drainage of the cushion during each test.
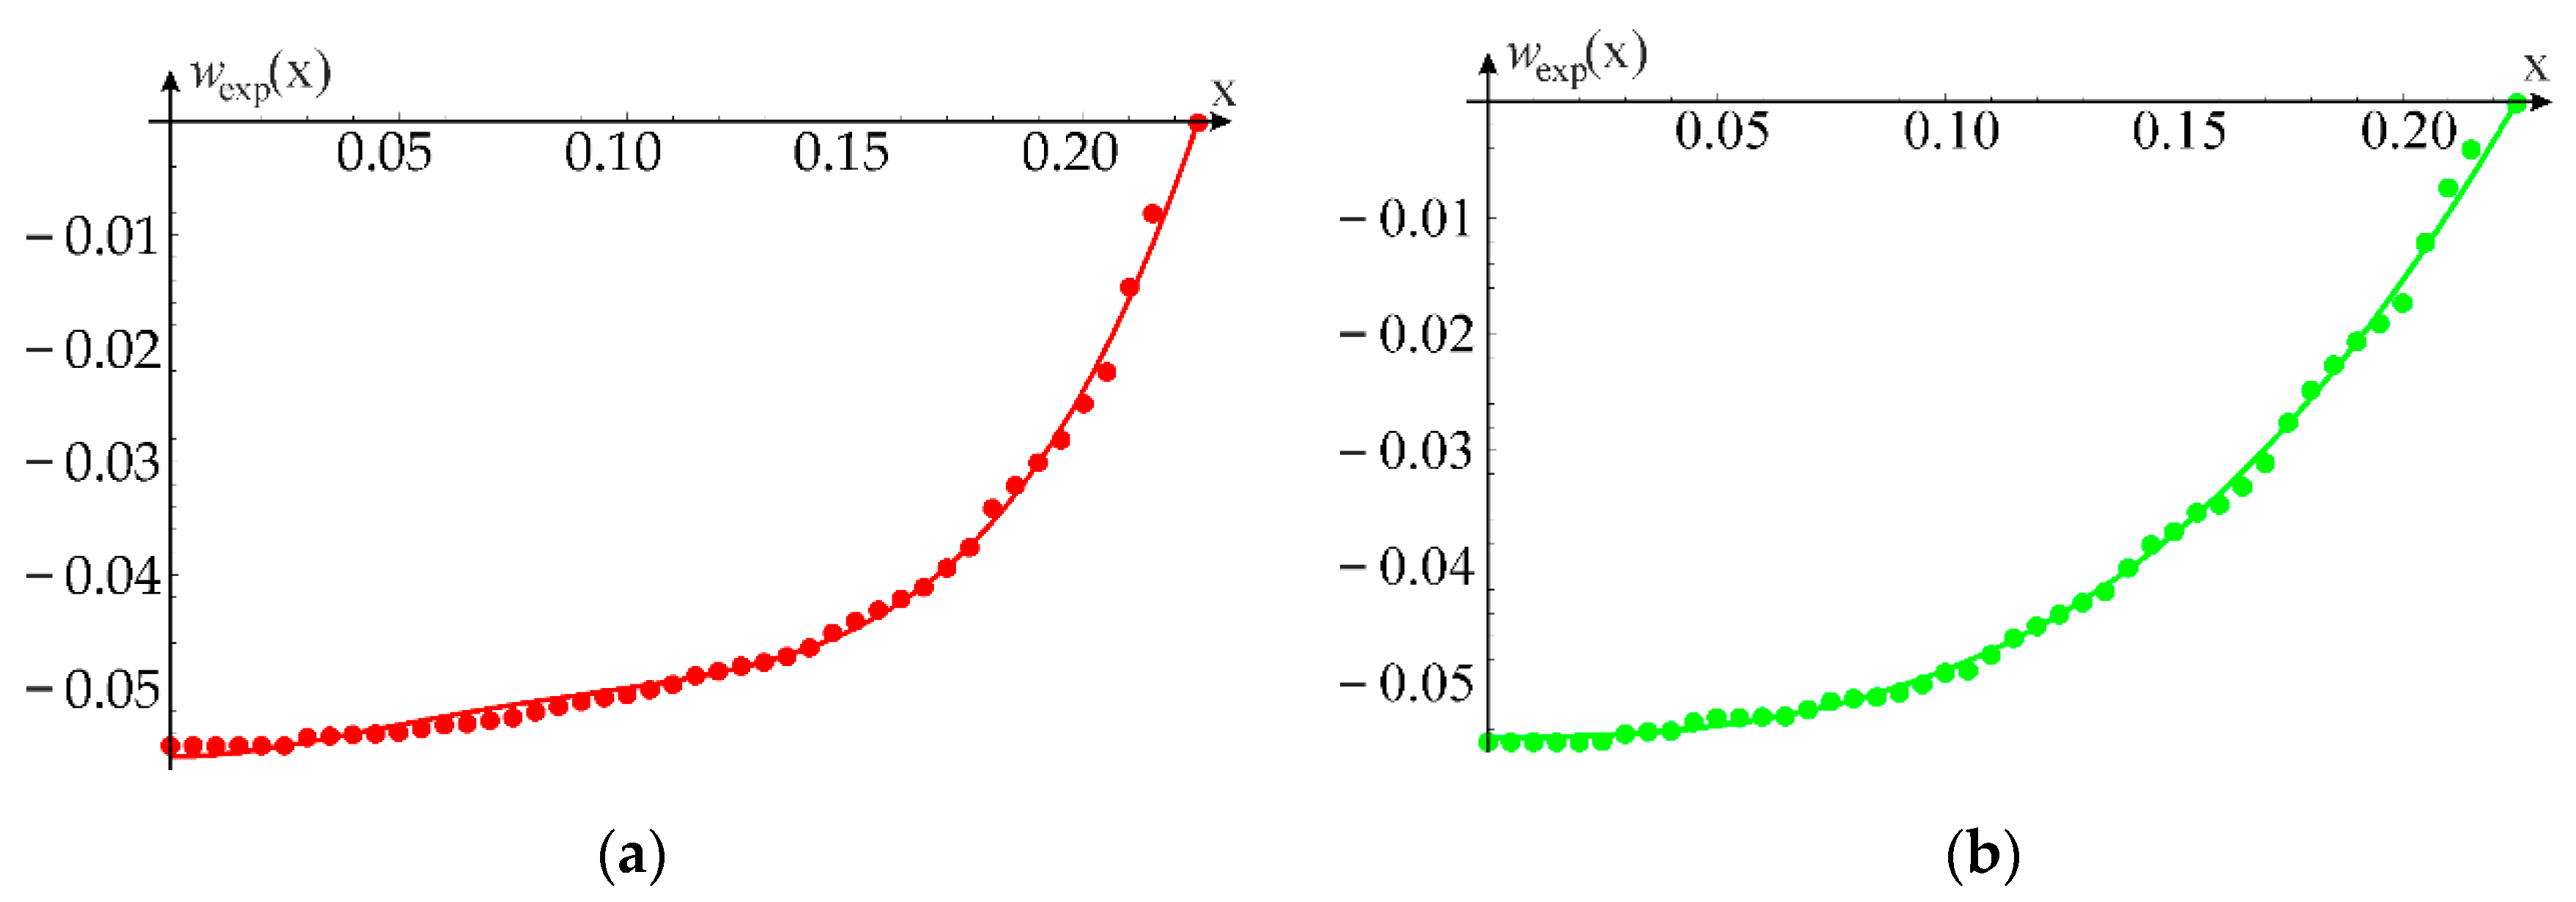
In the case of tests K2 and T3 in [10], vertical displacements of the reinforcement were reported at two points (see Tables S1 and S2). In order to determine the approximation of the deflection curve resulting from the measurements, additional assumptions were made: zero rotation angle at (halfway between the columns) and zero displacements at the edge of the column (). The approximation of the deflection function was determined by assuming the seventh-degree polynomial in the form of: . The coefficients of the assumed function were determined so that the function passed through the points resulting from the displacement measurements. Plots of selected approximations are shown in Figure 4 and Figure 5. Since one specific deflection curve for a given case is analysed each time, adopting the polynomial as an approximation function is justified. The adoption of the seventh order polynomial made it possible to find a function that accurately approximates the experimental results (see Figure 4 and Figure 5). According to [10], the material used as reinforcement in test T3 was completely biaxial for larger strains. The calculations were made for two given reinforcement stiffnesses, but due to the same nature of the error distribution, the results of deflection curve mapping error for the higher of the values presented in Table 1 are shown.
In the case of test referred in the paper as C, the results were reported in [9]. After the test, the fill and GR were removed. The deformed shape of the thin sand layer below the GR was assumed to be the same as the deformed shape of the GR in the final phase of the test. The deformed surface was laser scanned. This allowed for the determination of the number of points on the GR displacement curve. The measured deformed shape was not completely symmetric. Therefore, the measurements for both parts were analysed as independent deflection curves (denoted as C_L and C_R, respectively), like in [9,10], (see Table S3). As it cannot be clearly stated which results of the Dutch tests were presented in [9], on the basis of the information contained in [9,10], the reinforcement stiffness given in Table 1 and the most probable load value were adopted for the analyses. The ratio of the load and the stiffness of the reinforcement in this case was 0.125. In order to investigate the effect of the ratio for cases with no soil support on the distribution of the deflection curve mapping error depending on the distribution of the equivalent load, a parametric analysis was performed for the C_L case. Therefore, the deflection functions for were determined. In the case of test C, the seventh degree polynomial was also used to approximate the results. This allowed for an even better fit through measurements than in the case with the power law functions and which are shown in [9], cf. Figure 5. The measurement results of reinforcement settlements for cases with k = 0 are shown in Figure 6.
French experiments.
Briançon and Simon [13] and Nunez et al. [37] reported a series of large-scale tests in four test fields 1R–4R. Reinforcement was used only for plots 3R and 4R, PET biaxial geotextile in case of 3R and two layers of biaxial geogrid in case of 4R. The soft soil was improved with columns 0.38 m in diameter at an axial distance of 2 m. The measurements of settlements were carried out over a period of about six months. Parameters of the French tests are listed in Table 2.
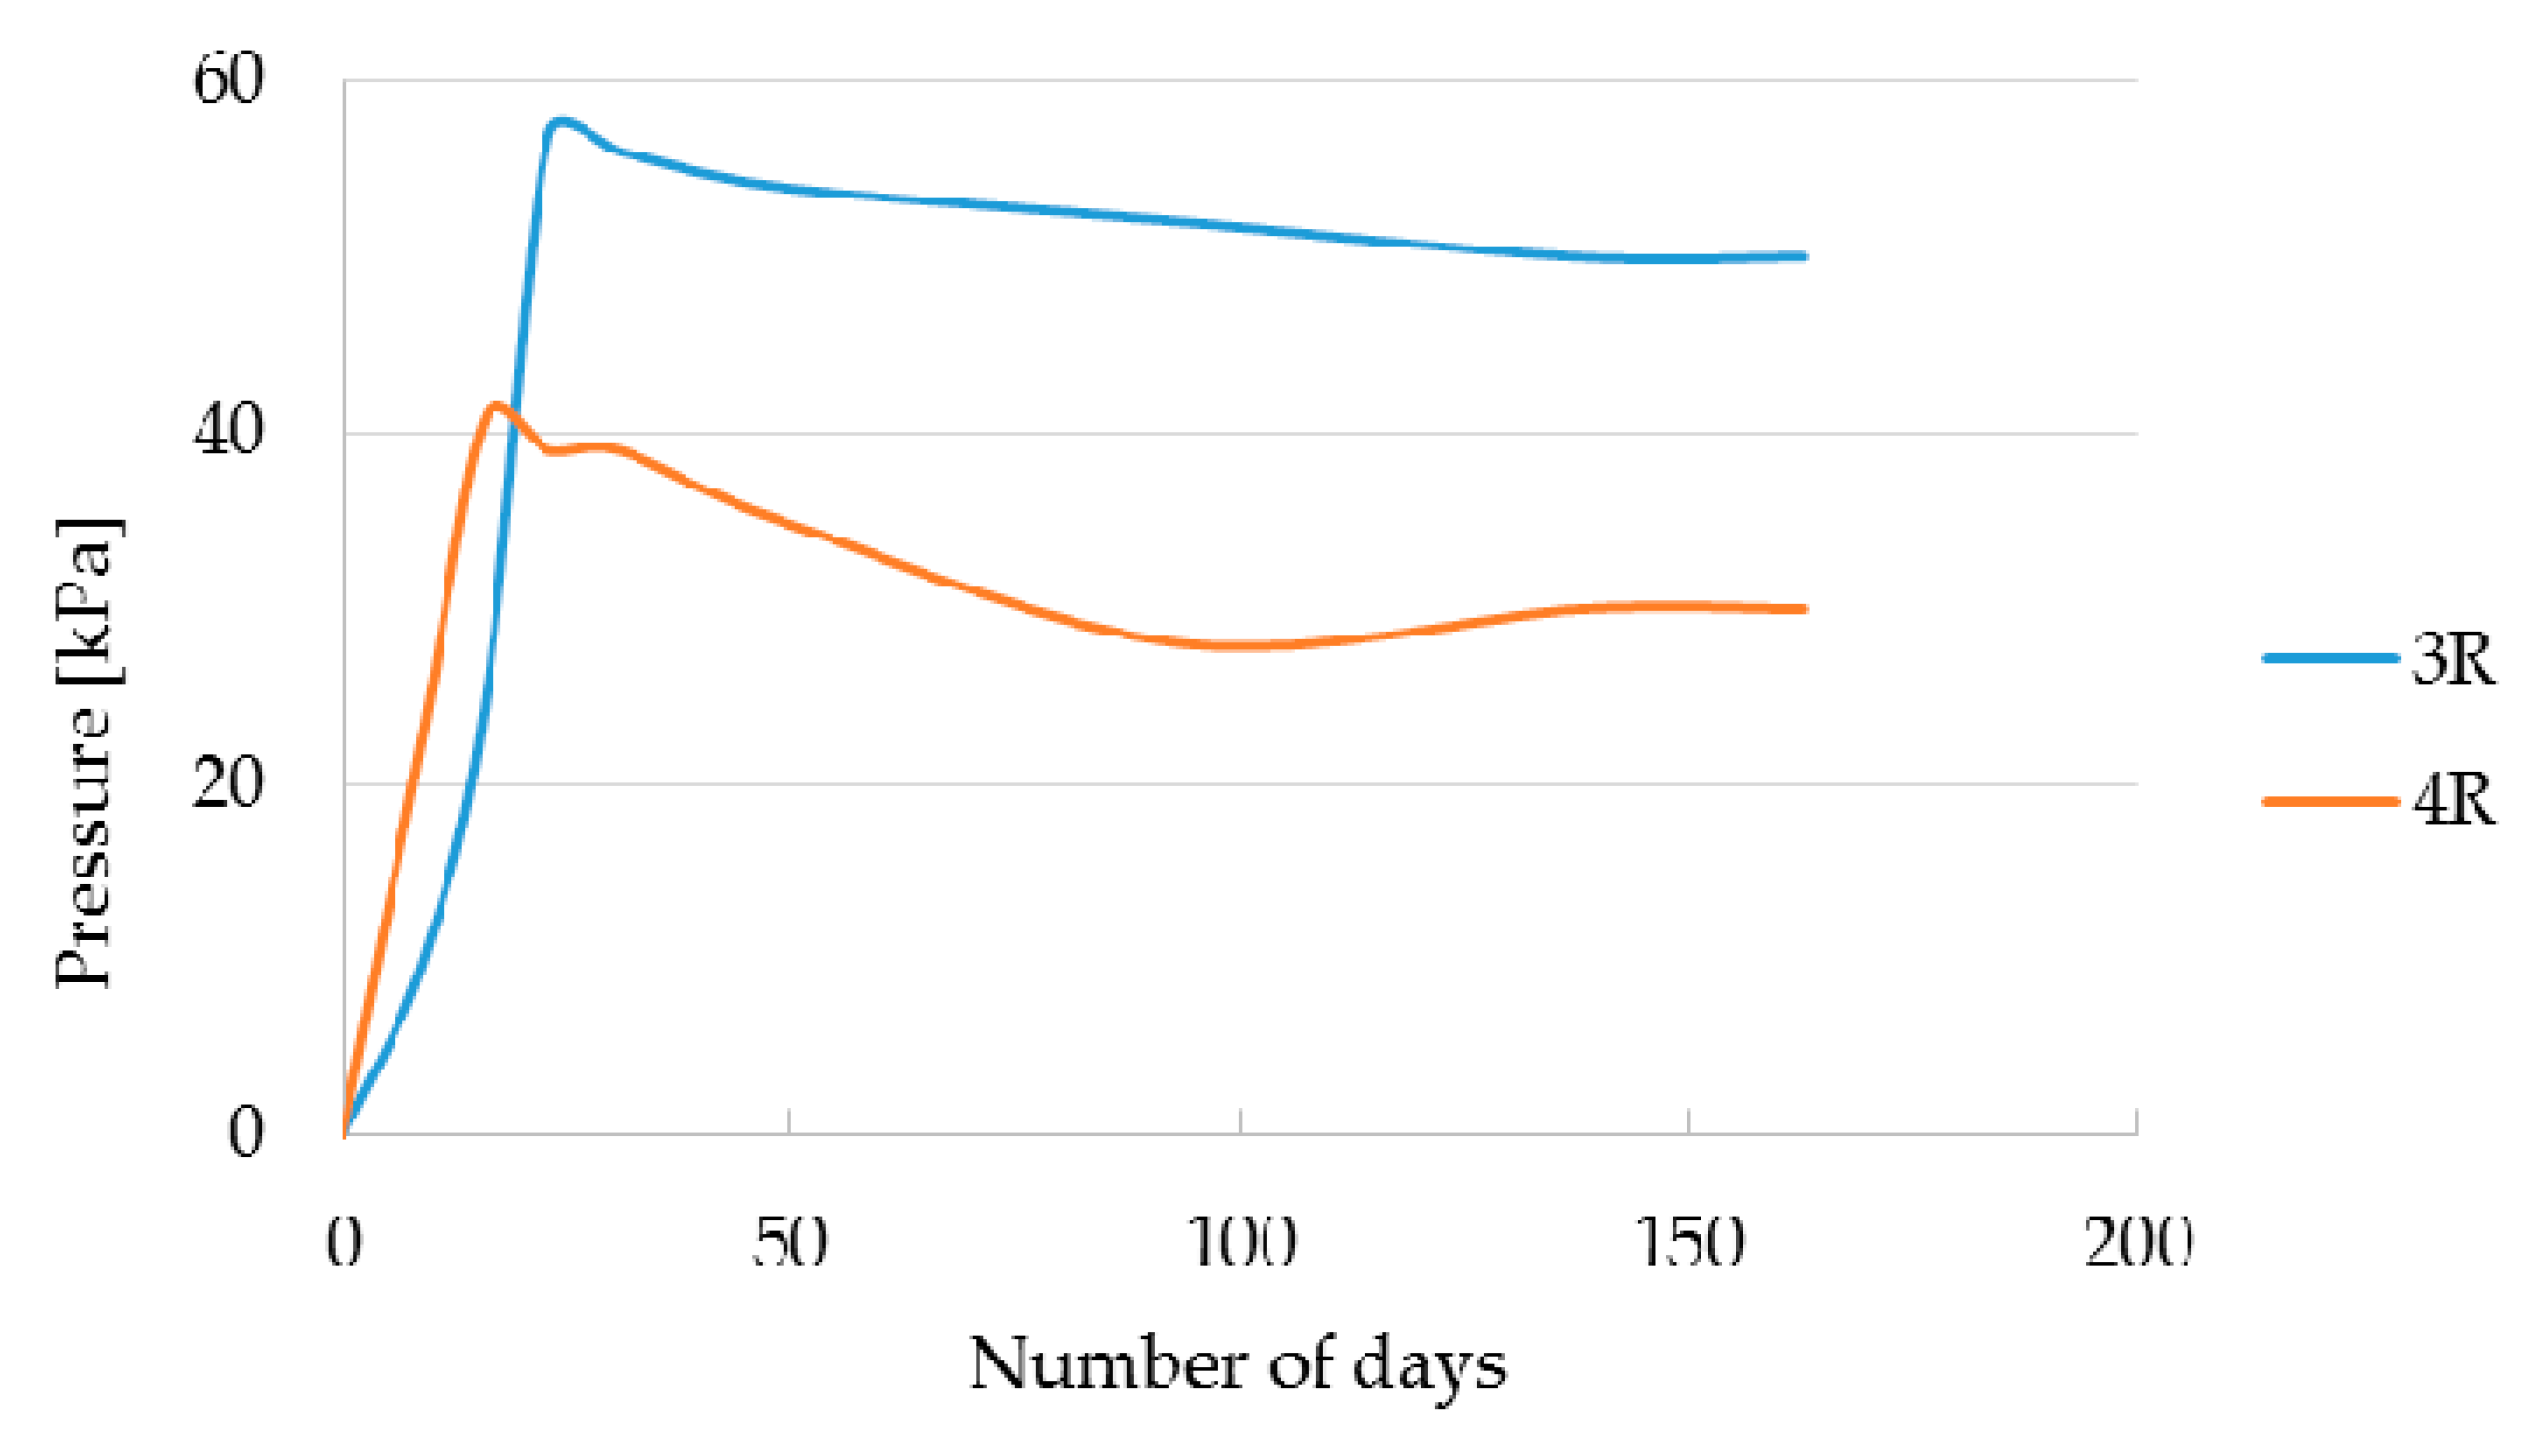
In the calculations the GR stiffness at the end of the test was reduced by 25%, which is a typical reduction for PET in a six month period [10]. For 9 days (first measurement), the whole short-time stiffness was assumed. The load was assumed on the basis of measurements of the pressure exerted on the reinforcement (Figure 7). The embankment in Section 4R was erected up to day 24 after the LTP was installed, and the embankment in Section 3R was raised up to day 31.
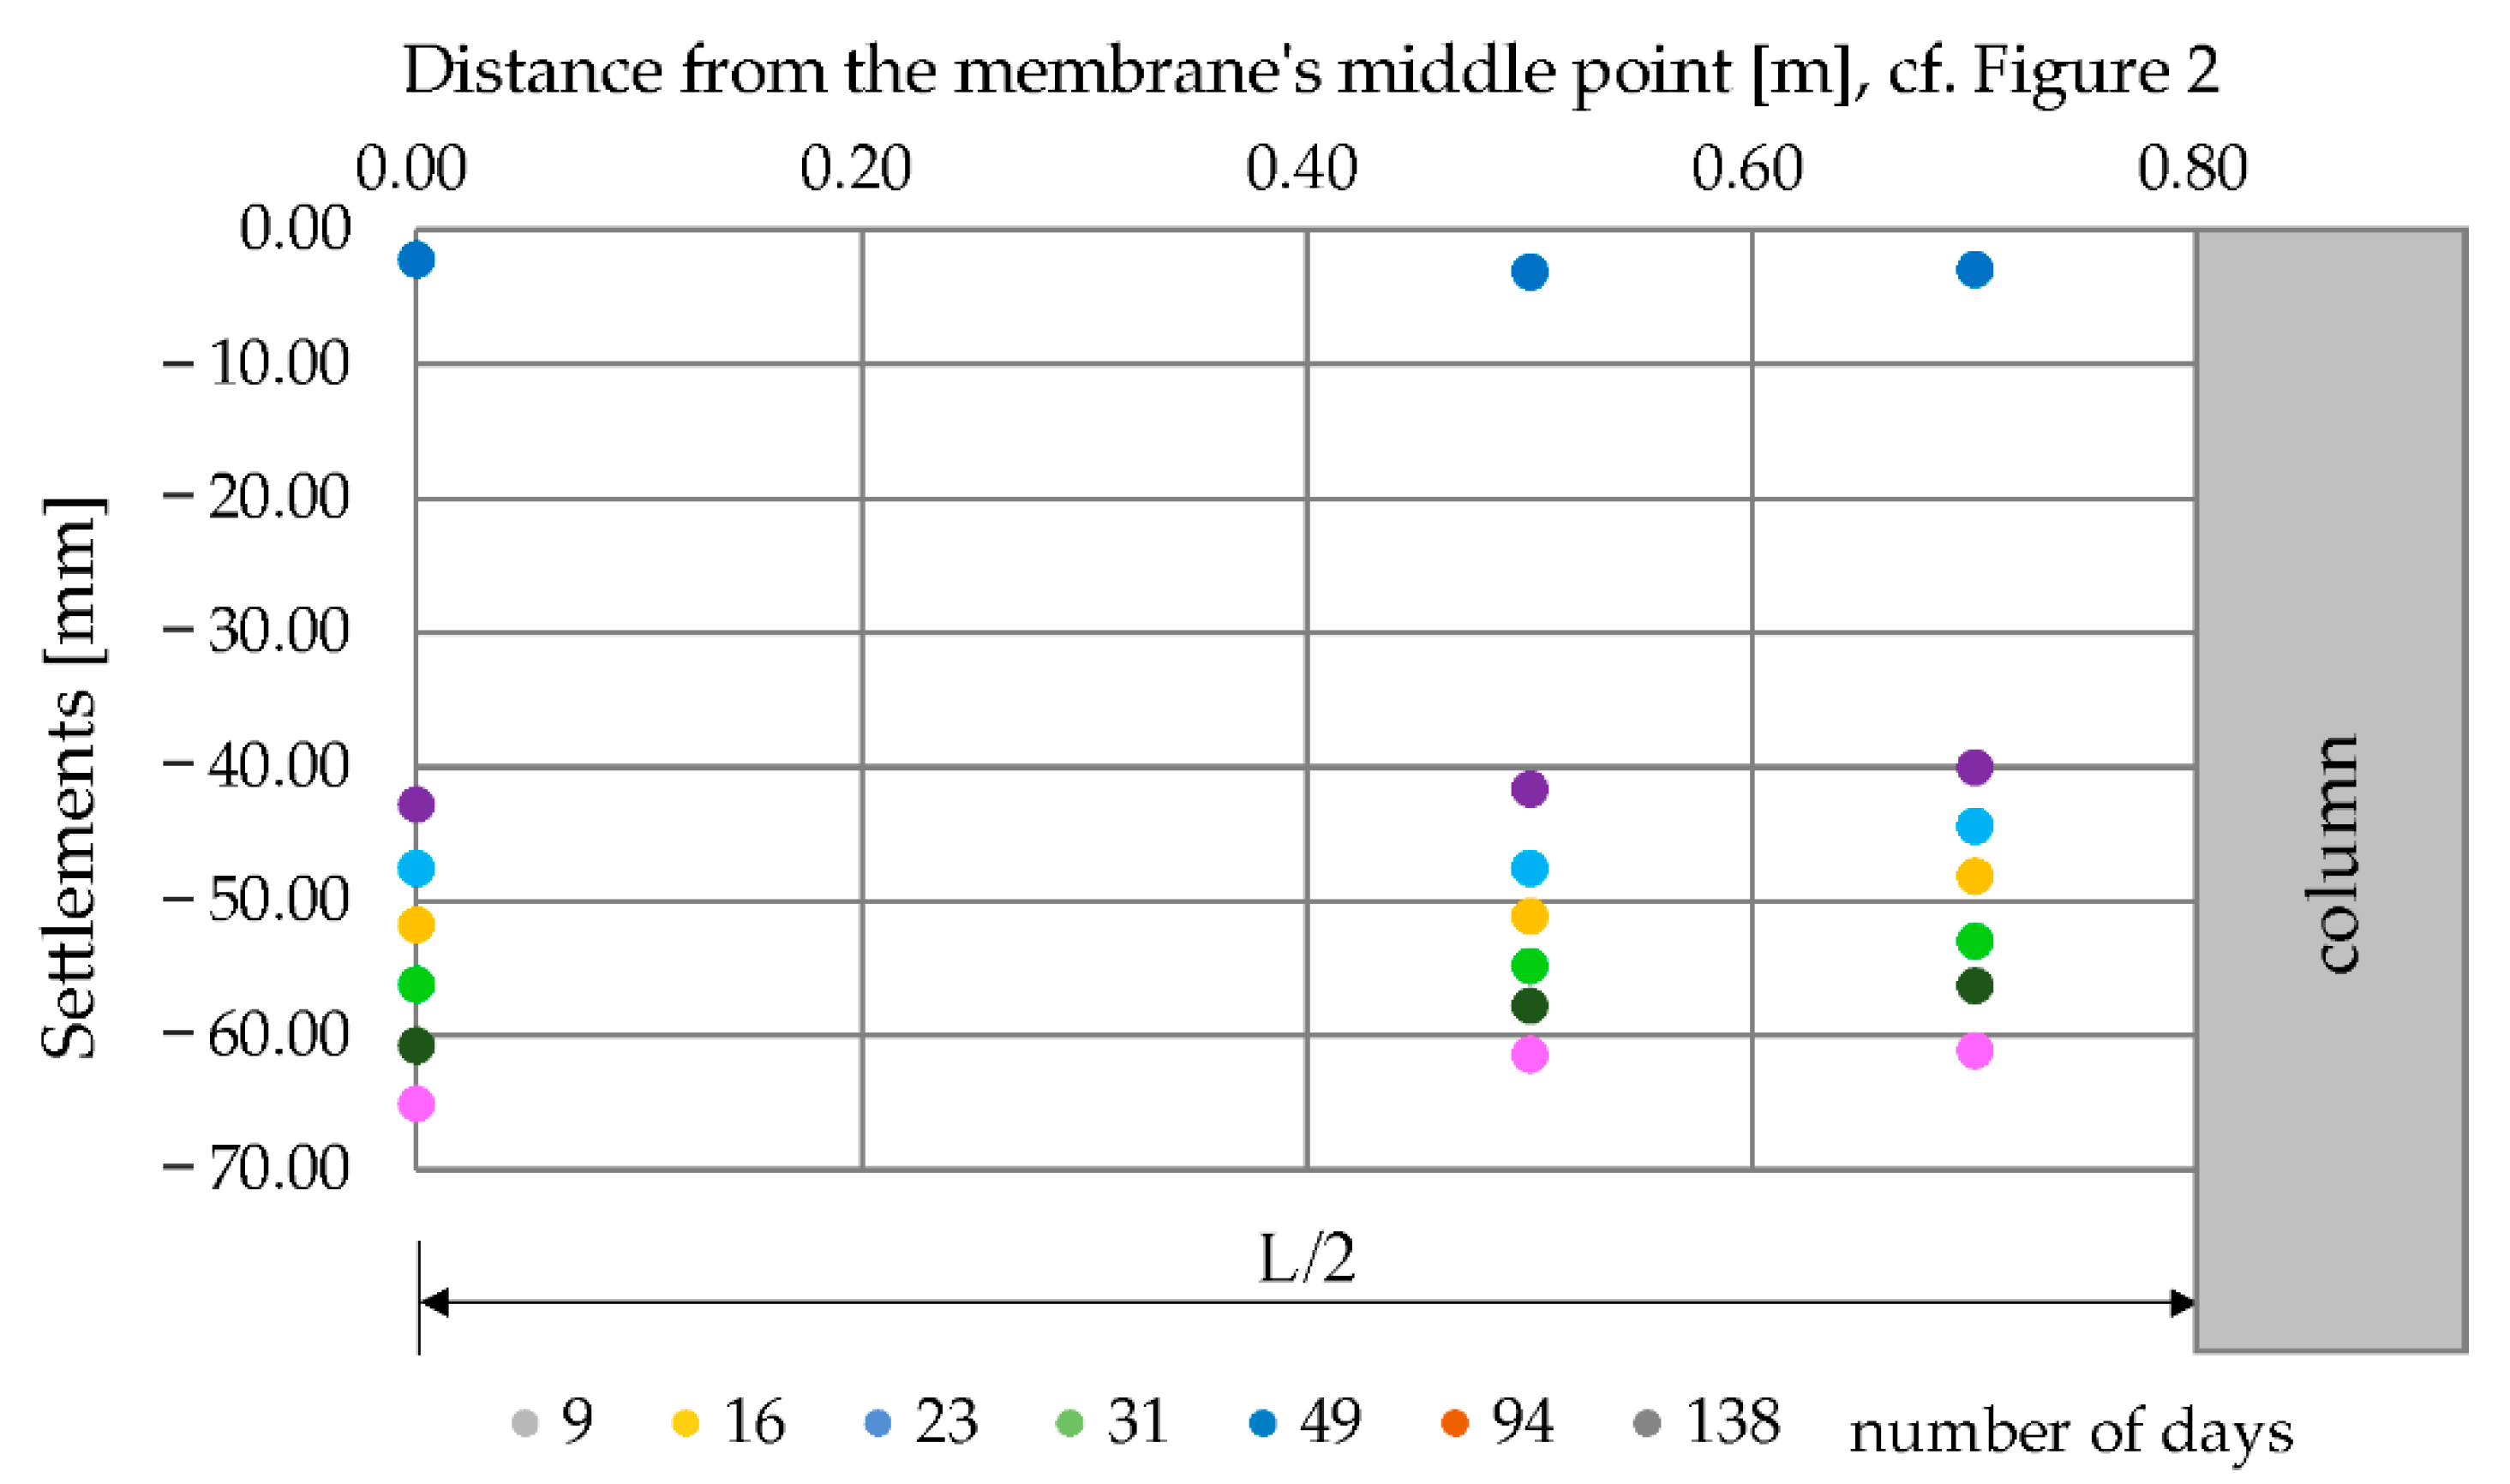
The deflection curves for sections 3R and 4R (see Tables S4 and S5) were determined by approximating the measurement results with a function, depending on the analysed case, in the form of or . Exemplary measurement results of soil/gtx settlements between columns in relation to the column head zero level for Section 4R are shown in Figure 8. In Section 3R, settlements were greater at the column than in the middle between the columns, while in the case of Section 4R, this phenomenon was observed only for measurements after 9 days. Since in the analytical methods, when determining forces and strains in the reinforcement it is assumed that the column does not settle, a zero settlement at the edge of the column was assumed as in [10], where geosynthetic deformations were analysed after about half a year after the installation.
4. Results
4.1. Cases of k = 0 (No Support by Subsoil)
This subsection presents the results of calculations performed for cases K2, T3 and C (two deflection curves), i.e., cases in which the soft soil does not contribute to the load transfer. The influence of the number of series terms on the accuracy of the received solution was analysed in [36]. The number of series terms was assumed in the calculations in order to obtain a satisfactory accuracy of the solution but also, at the same time, not to extend the calculations significantly. In all analysed cases, the calculation of the mapping error was performed assuming 20 elements of the Taylor series.
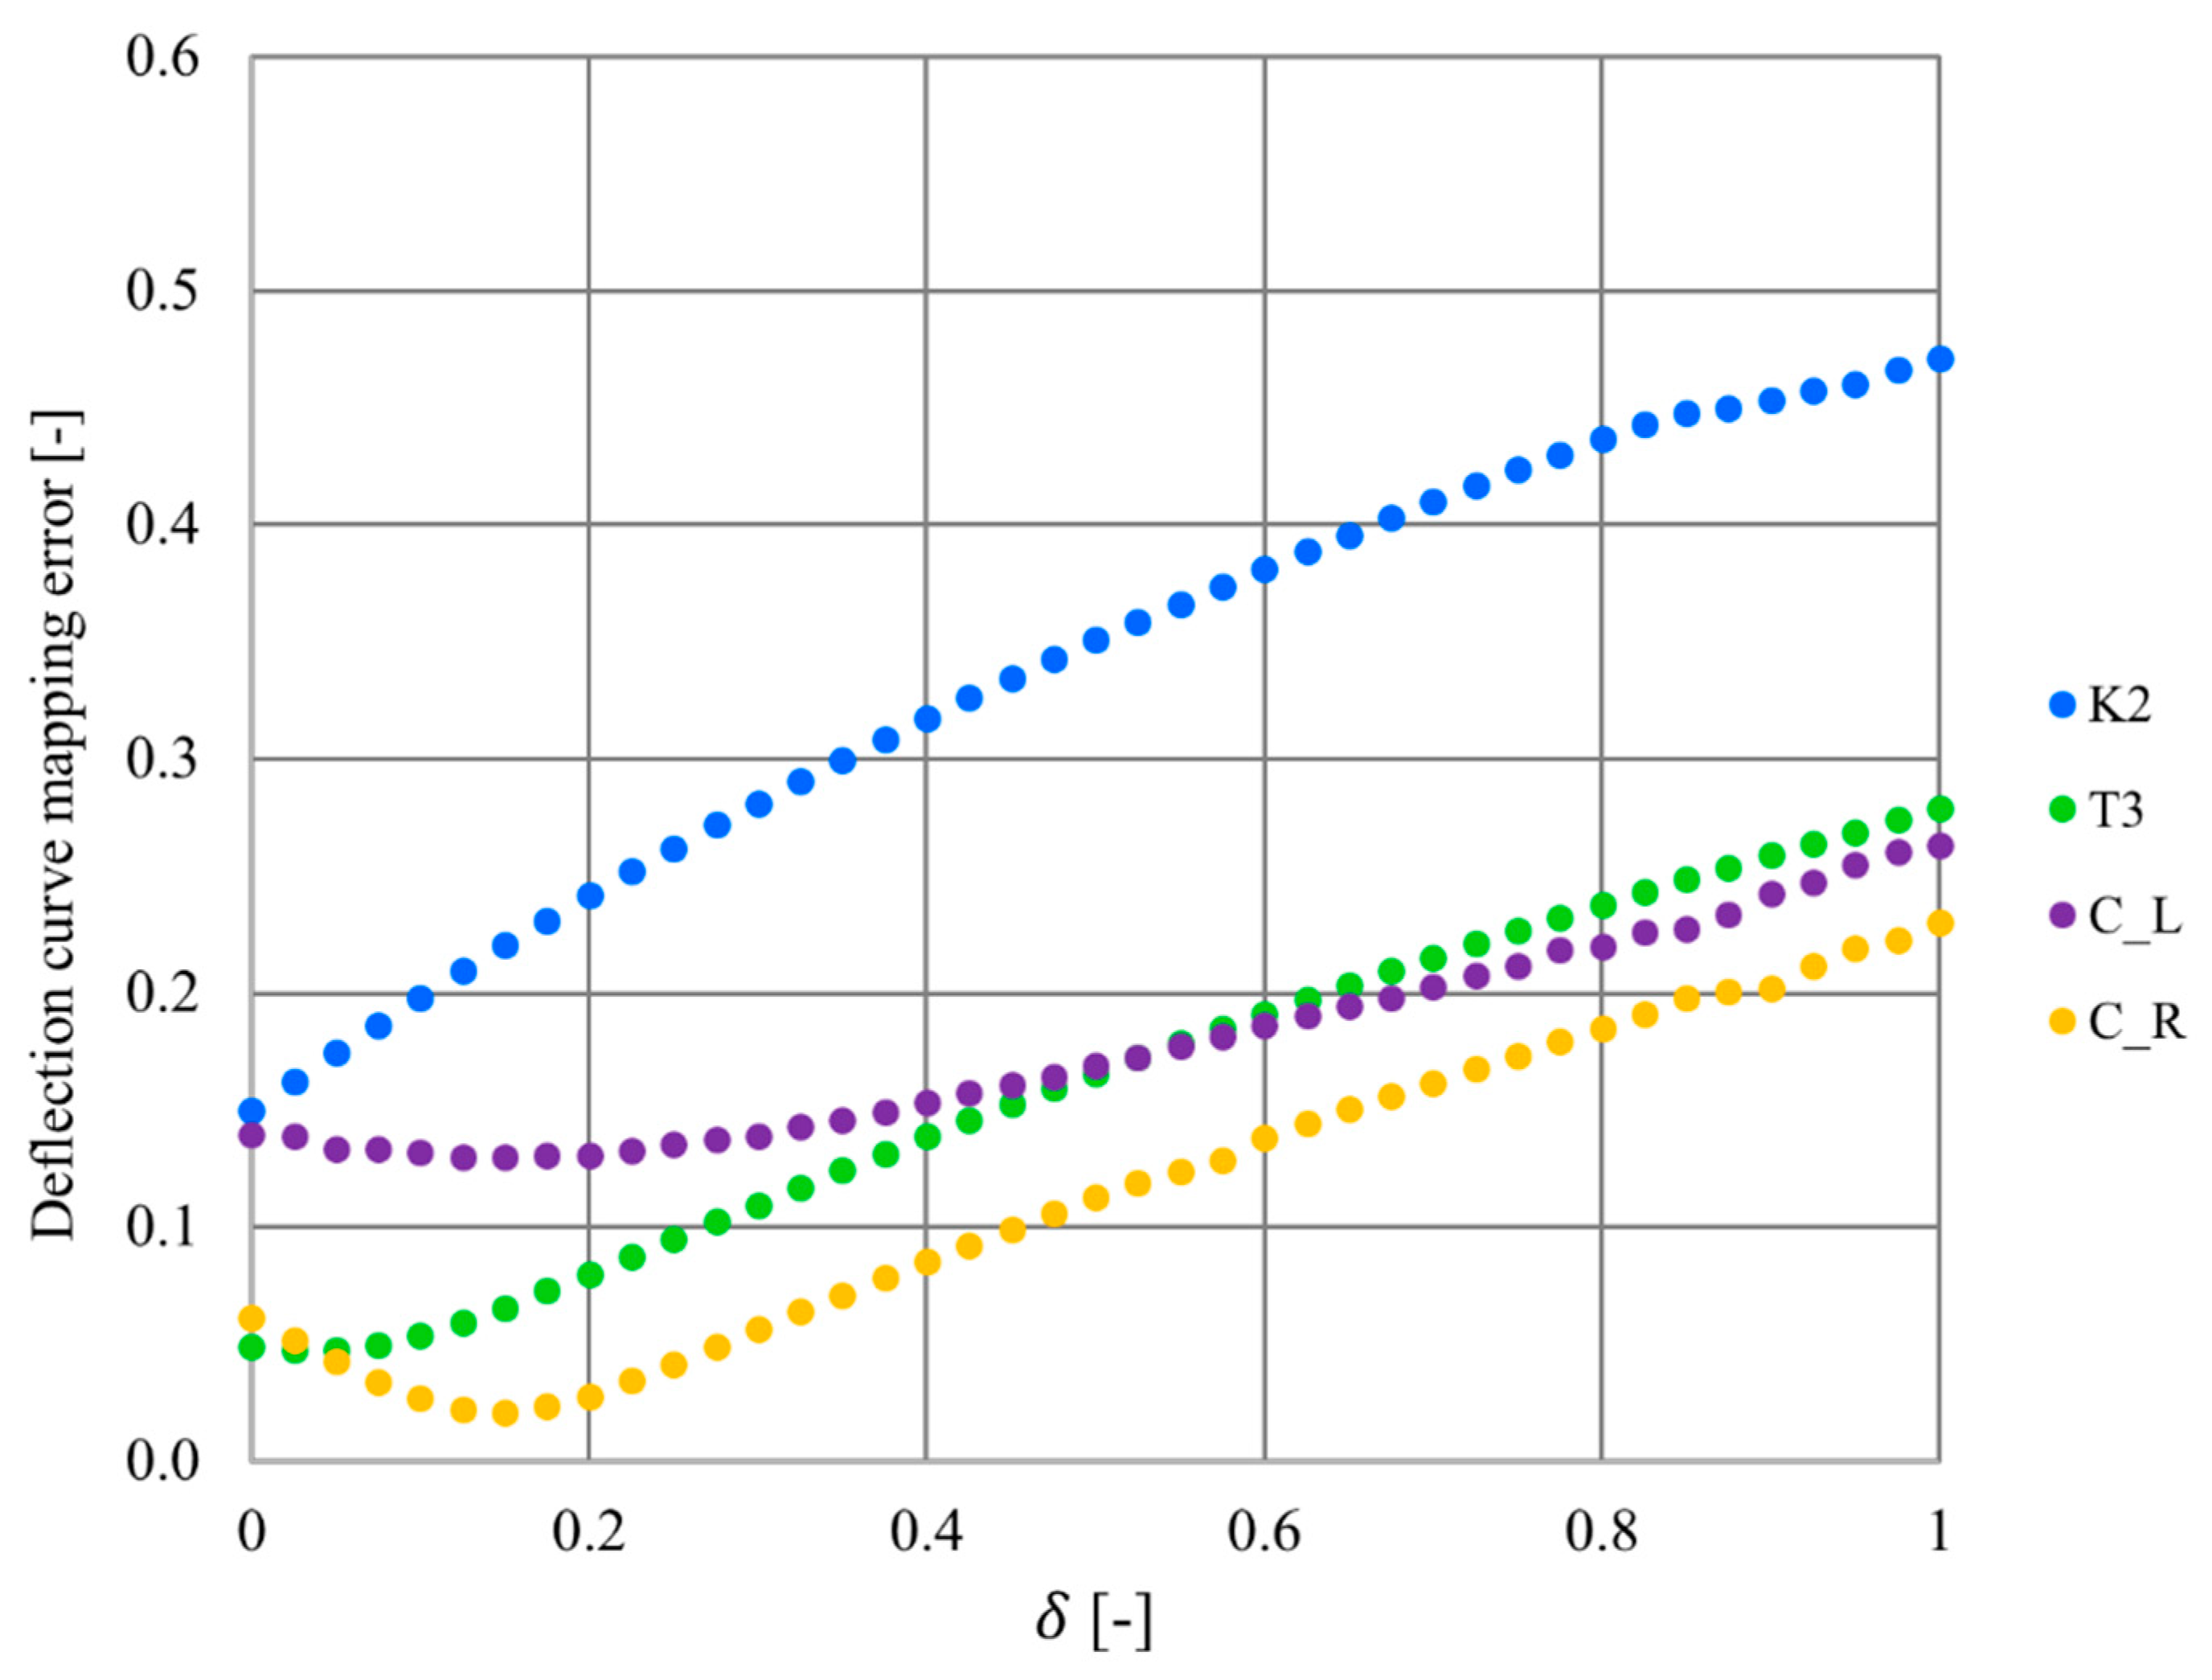
Figure 9 shows the distribution of the membrane tension force depending on the distribution of the equivalent load represented by parameter . In all cases, the lowest value of the membrane tension force was obtained for (inverse triangular load distribution). The tension force distribution for all analysed tests is the same. Figure 10 shows the obtained calculations of the deflection curve mapping error for individual distributions and various tests. In the case of test K2, the nature of the error distribution depending on is similar to the plot of the membrane tension force. The mapping error increases with the increase of parameter , the smallest mapping error was obtained for , and the largest for . In the case of tests T3 and C, a decrease of the error value is visible even to the value of (for case C_L), and then the mapping error for subsequent values of increases. Comparing the values of the mapping error for inverse triangular, uniform, and triangular distributions, in each case the error is smaller for the inverse triangular distribution and higher for the triangular distribution.
When analysing the calculation results shown in Figure 11, it is clearly visible that the ratio has a large impact on the nature of the distribution of the deflection curve mapping error. As the value of the ratio decreases, the error distribution function changes from increasing to decreasing almost in the entire range. This analysis shows how important it is to divide correctly the load in the first step of calculations into the part transferred by the columns (A) and the rest (B + C), and to determine the stiffness of the reinforcement. Figure 12 shows the deflection curves from the inverse triangular load, uniformly distributed and triangular for case C_L and the ratio = 0.075. It can be seen that although the deflection curve from the triangular load (blue line) has a shape almost identical to the deflection curve resulting from the measurements (black line), for this particular case a better representation accuracy was obtained for uniform (red line) and triangular (magenta line) load.
4.2. Significant Soil Support Cases
In the case of sections 3R and 4R (k = 356 kN/m3, significant soil support), the membrane tension force distribution is completely different than in tests with k = 0 (no soil support). In all analysed cases, the membrane tension force was the lowest for at approx. 0.5 (uniform distribution of equivalent load), and the values of the force are similar for the extreme values and . Figure 13 shows an exemplary diagram of the membrane tension force for Section 3R (measurements taken 9 days after installation).
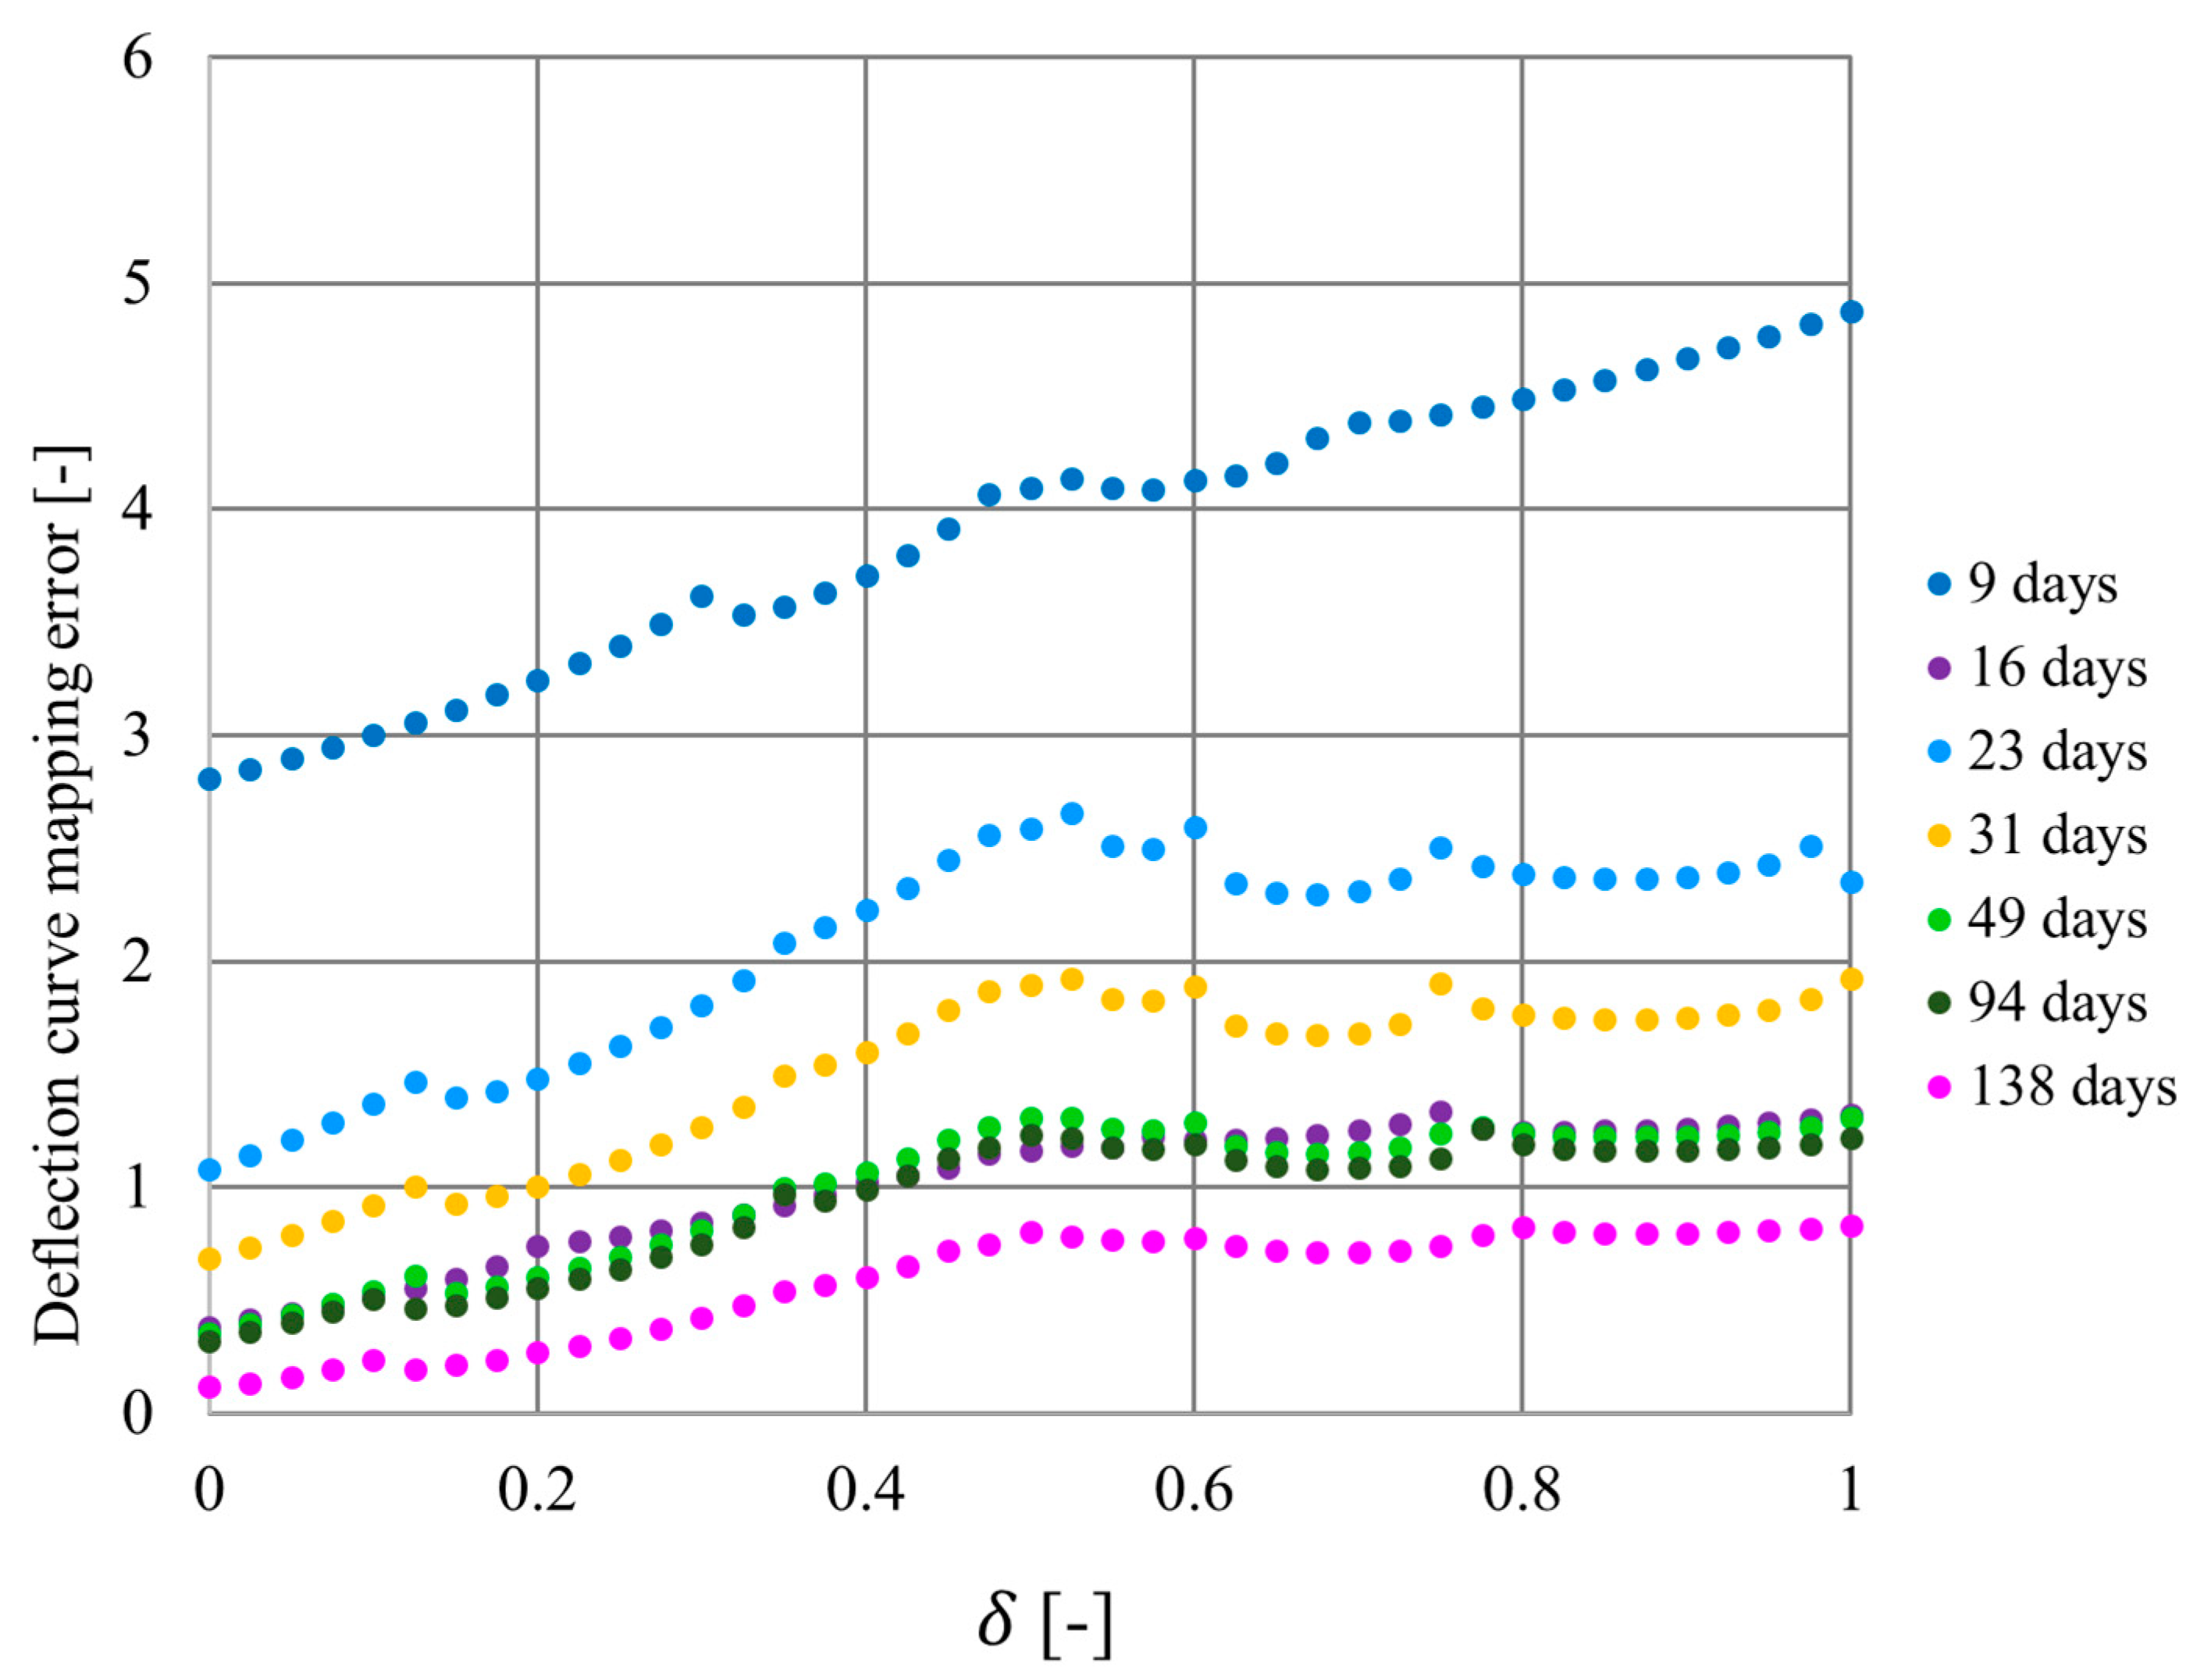
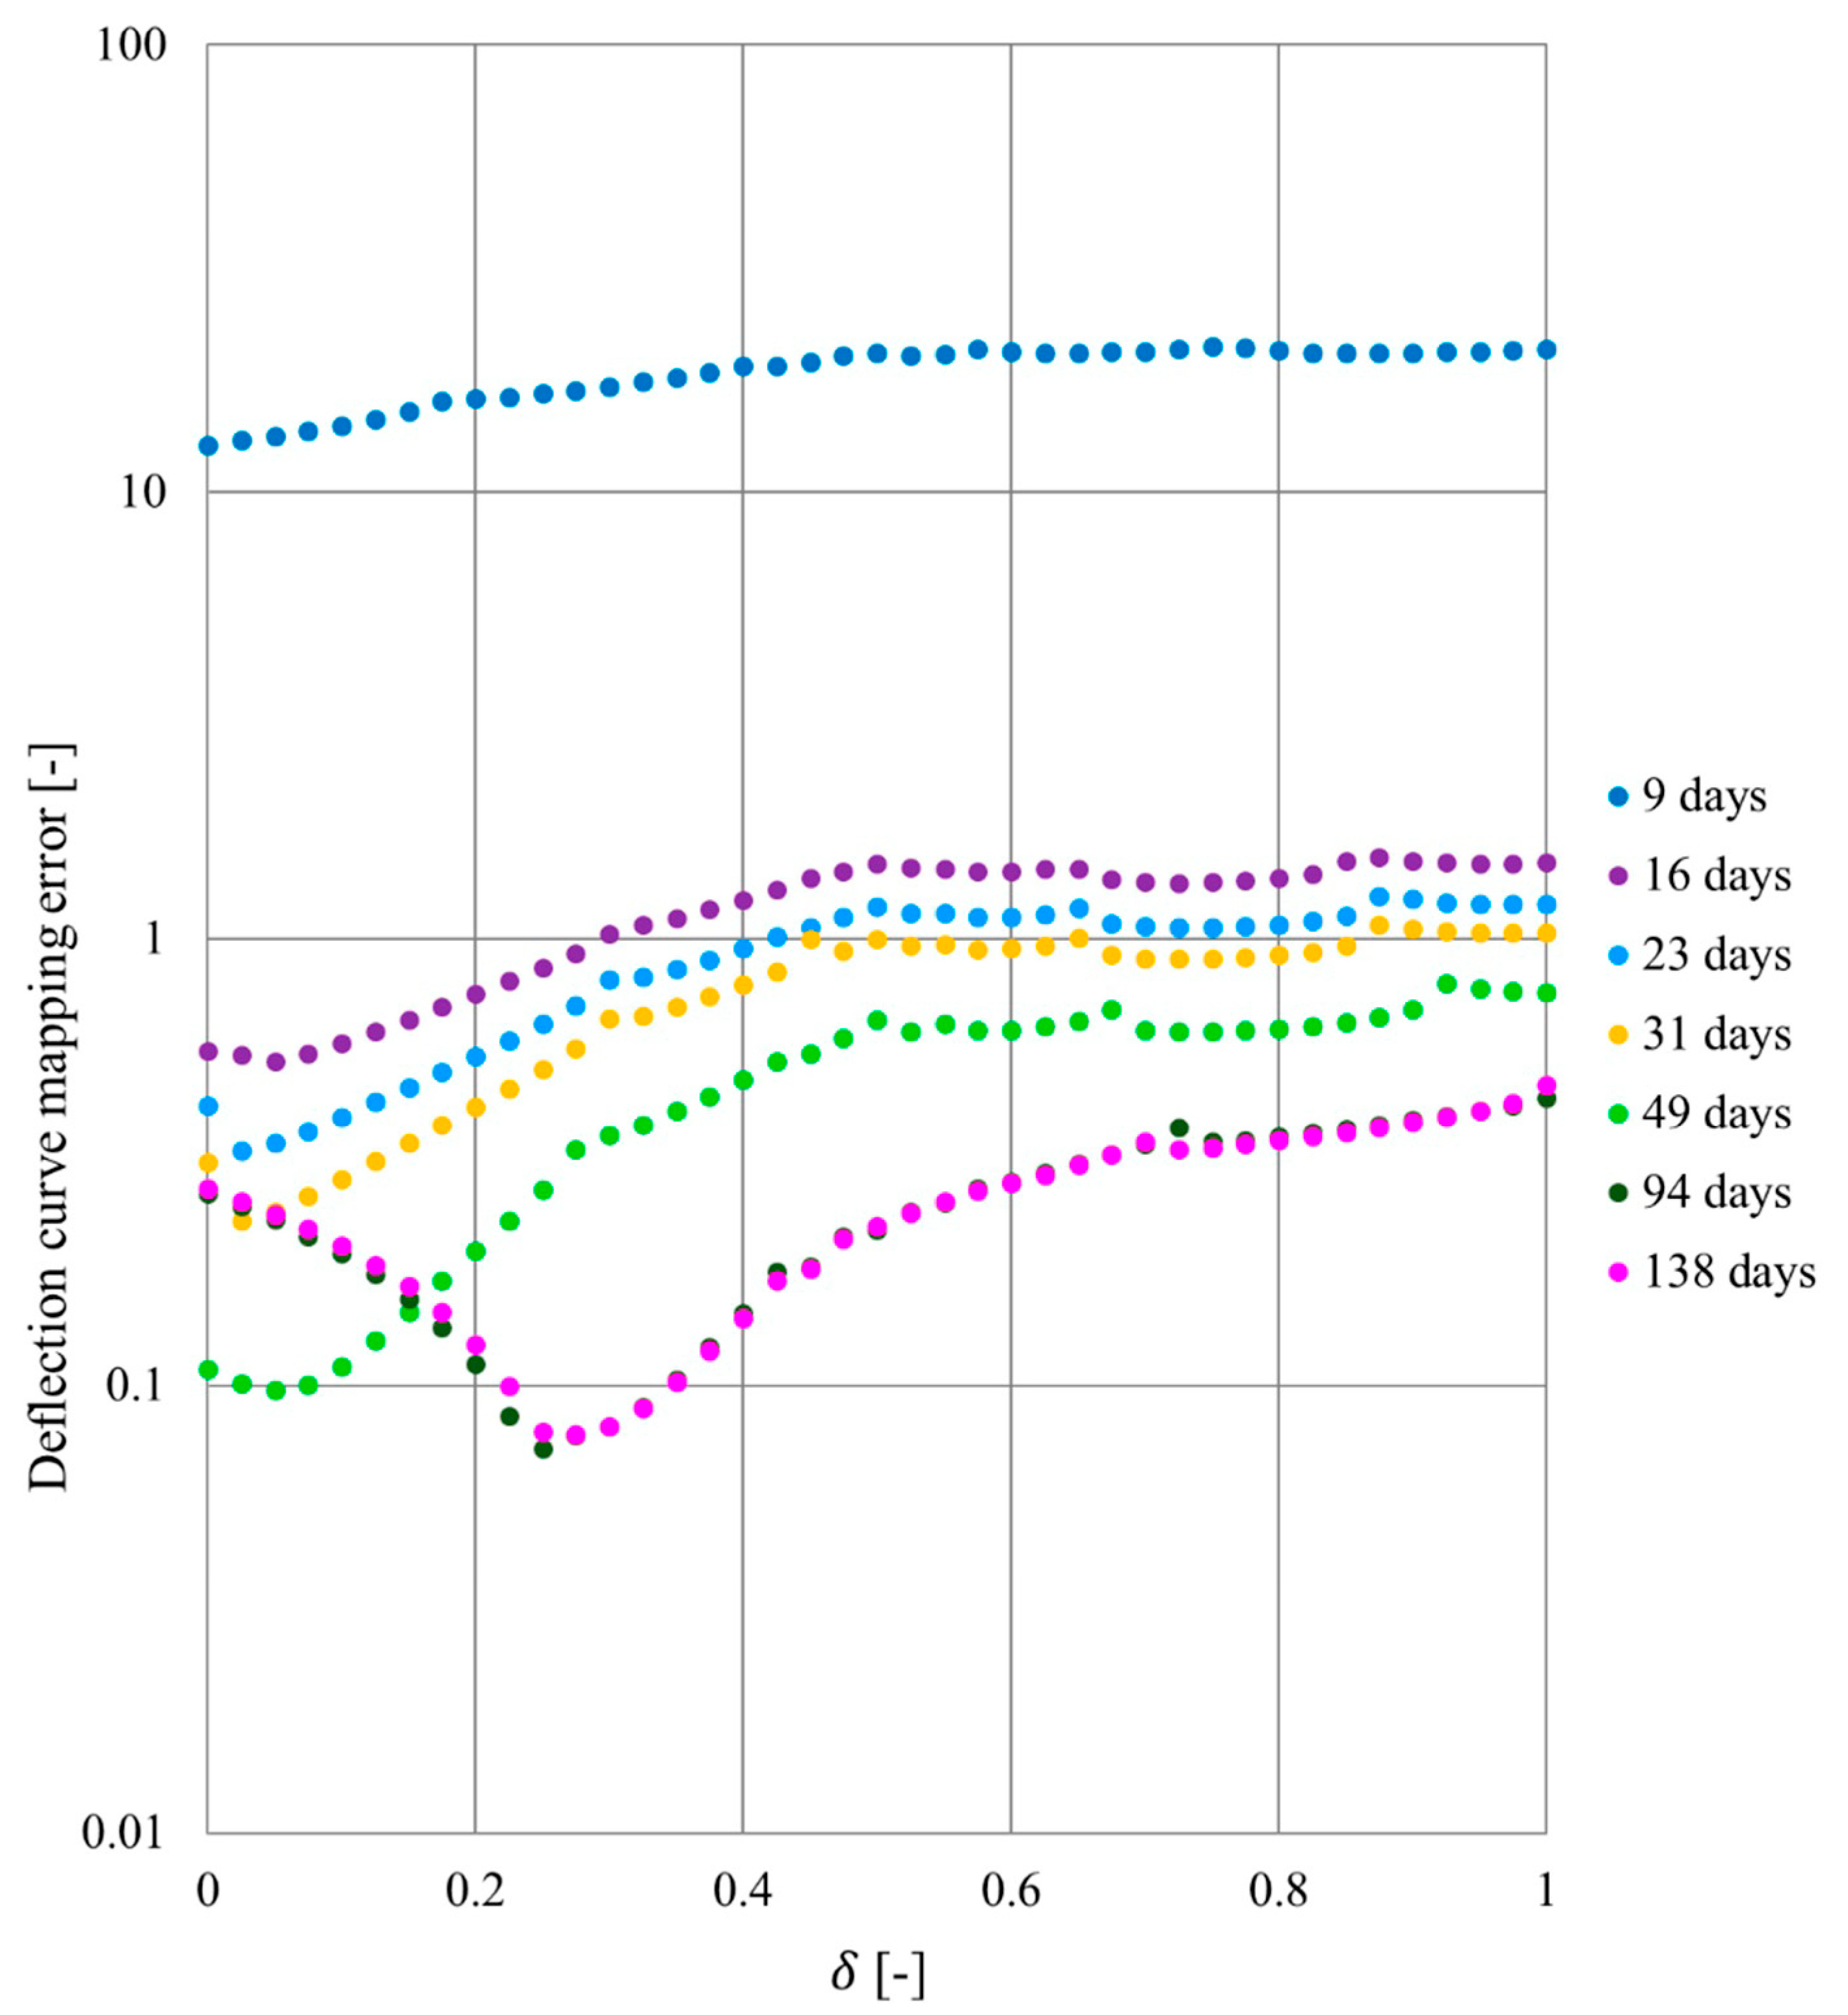
For sections 3R and 4R, settlements were measured at 9, 16, 23, 31, 49, 94 and 138 day after installation of the geosynthetic. This allowed the analysis to be carried out over time. In the case of Section 3R, the highest error values were obtained for measurements after 9 days (Figure 14). For the measurements after 16 days, there was a rapid decrease in the values of the deflection curve mapping errors. For measurements of settlement after 23 days, the error values for all analysed distributions increased significantly, and for subsequent measurements, the obtained error values gradually decreased. The nature of the distribution of the error value for different load distributions is similar, but for subsequent measurements of settlement, the difference between the smallest error value for (which corresponds to the distribution of the equivalent load in the form of an inverted triangle) and the error values for the distributions for (distributions from equal to triangular) decreases. For all measurements in Section 3R, the lowest mapping error was obtained for the inverse triangular distribution (). Later, the error value grows, and from a uniform to triangular distribution ( from about 0.5 to 1), the error value for measurements from the 16th day after installation is at a similar level for individual series of measurements.
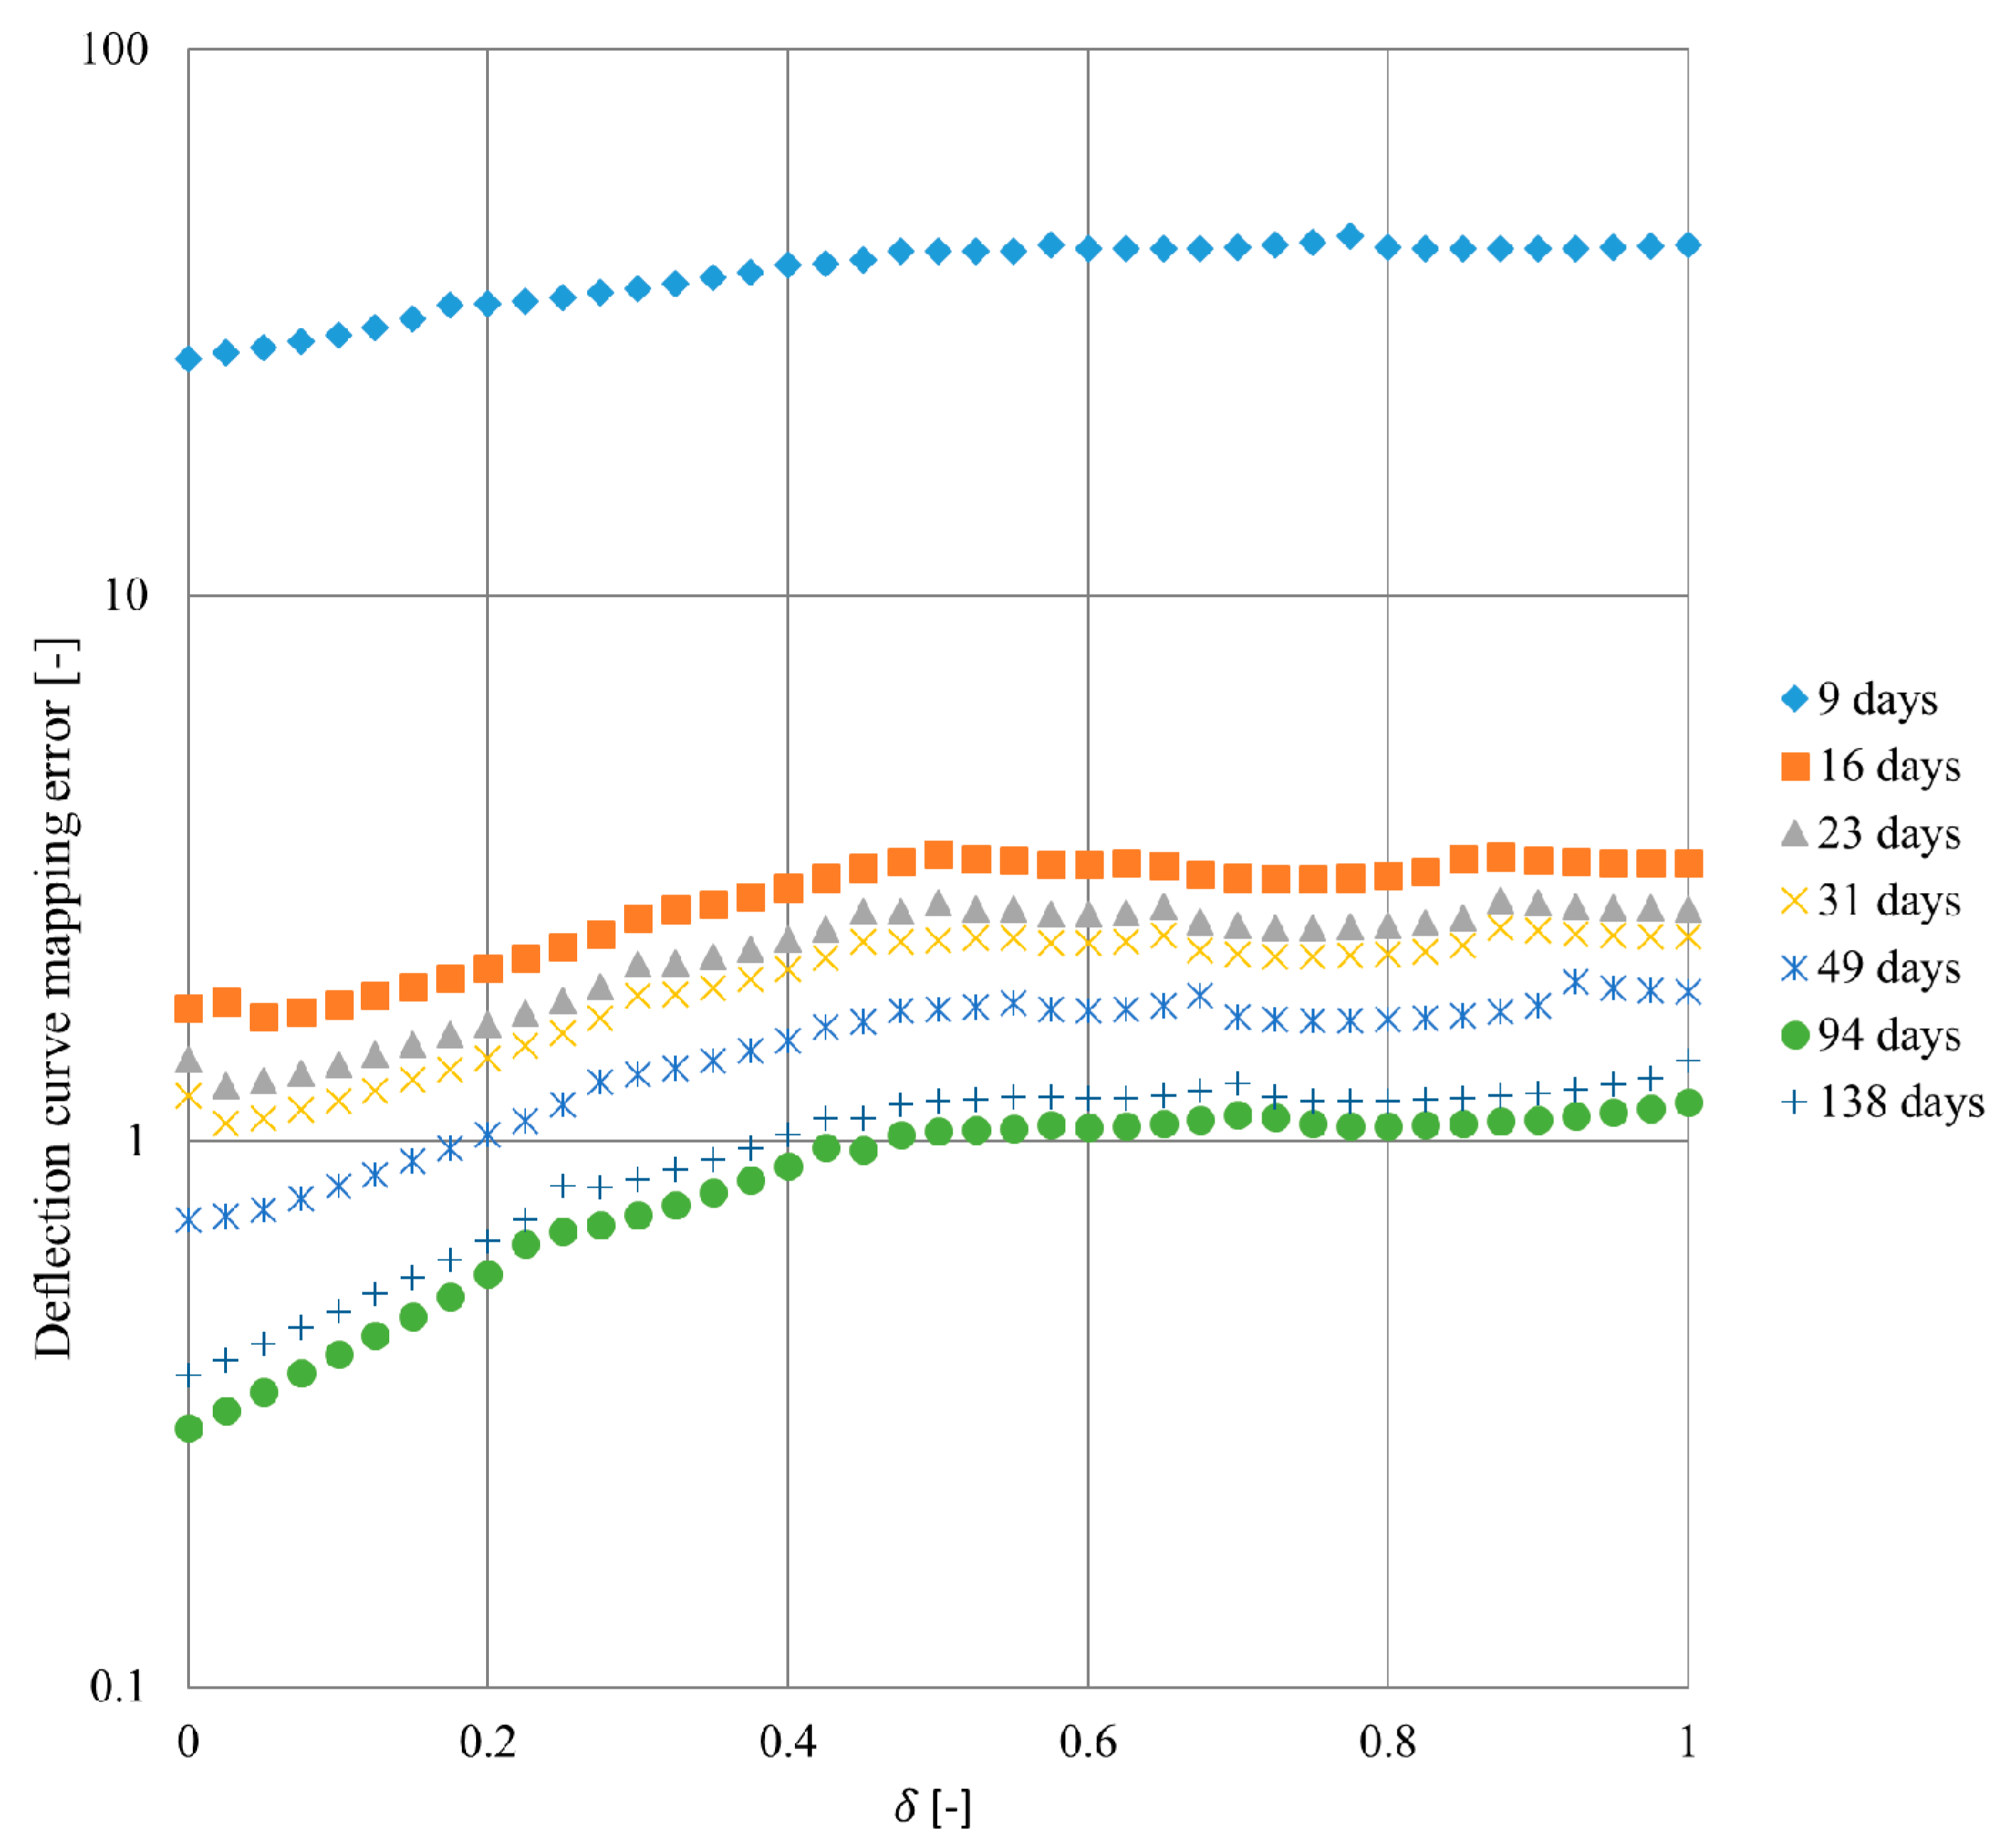
In the case of Section 4R, the highest mapping error values were obtained for the settlement measurements after 9 days (embankment construction phase), cf. Figure 15. For measurements after 16 days, the error values are much lower, and for subsequent measurements they gradually decrease. The nature of the error distribution for the measurements from 9 to 49 days is similar to the nature of the error distribution for plot 3R. However, for the measurements from day 16 to 49, the smallest error was obtained for distributions represented by between 0.025 and 0.05. For the last two series of measurements, i.e., after 94 and 128 days, the nature of the error distribution depending on parameter changed significantly. The smallest error value was obtained for load distribution represented by , and this value is almost four times smaller than the error for the equivalent load distribution with (inverse triangular distribution) and over six times lower than the error for the equivalent load distribution with (triangular distribution). The error value increases for values of above 0.25 for the 94th day and 0.275 for the 138th day. The highest mapping error value was obtained for equivalent to a triangular distribution of the equivalent load.
For sections 3R and 4R, settlements of the column were also measured. In the final phase, they were equal to 31 and 28 mm, respectively. Therefore, for Section 4R, the influence of taking into account the settlements of the column on the accuracy of mapping the deflection curve of the geosynthetic was additionally analysed. The deflection curves of the geosynthetic were determined based on the settlement difference of soil between columns and the column itself. The results are shown in Figure 16.
Taking into account the column settlements caused that the mapping errors for all measurements were greater compared to the case when the column settlement is zero. In this case, the nature of the error distribution is very similar to the distribution obtained for the measurements in Section 3R without taking into account the column settlements. The error values are decreasing for subsequent measurements. Interestingly, for the measurements after 96 days, the obtained error values were slightly lower for all considered load distributions than for the measurements after 138 days.
5. Discussion of the Obtained Results
So far, no detailed analyses of mapping of the deflection curve of a geosynthetic have been presented in the literature. The authors propose a fit measure defined as the mapping error (see Section 2). Van Eekelen and Bezuijen [38] and Van Eekelen [10] analysed which of the distributions: triangular, uniform or inverse triangular gives the best fit to the obtained displacement results. However, no measure was used in those analyses. The measure of matching proposed by the authors of this article in the form of a relative error of the deflection curve mapping allowed to quantify the accuracy of mapping the deflection curve of the reinforcement depending on the distribution of the equivalent load.
In the case of tests for which soil between the columns does not participate in the load transfer (k = 0), the distribution that allowed the deflection curve of the reinforcement to be determined with the smallest error was the distribution represented by for test K2, for test T3, for C_L and for C_R. In any case, the mapping error increases for different values of . Therefore, it can be concluded that in the case where the subgrade reaction is zero or very low, the inverse triangular distribution allows to determine the behaviour of the LTP reinforcement more precisely than the uniform and triangular distributions. This conclusion is in accordance with those presented in [9,10]. In [9], the correctness of the equivalent load distribution was determined by comparing the shape of the deflection curve.
However, it should be remembered that the accuracy of mapping for cases with k = 0 is influenced not only by the shape of the deflection curve under a given load distribution, but also by the ratio (see Figure 10 and Figure 11). While the stiffness value J is a parameter that characterizes the reinforcement and results from the reinforcement properties, the value depends on the adopted arching model and may be more or less correctly determined.
Comparing centrifuge testing and analytical modelling, Blanc et al. [39] analysed also the influence of load distribution on the values of reinforcement deflection. In the presented in [39] case, an inverse triangular distribution gave deflection values lower than the uniform distribution. In turn, uniform distribution gave deflection values lower than the triangular distribution. However, the results of the conducted research, obtained by Blanc et al. [39], did not make it possible to unequivocally state which of the distributions is the best. The results of the study on the influence of the equivalent distribution on the correct mapping of the reinforcement deflection curve have shown that in most of the analysed cases the smallest error value corresponds to the inverse triangular or close distribution, and the largest to the triangular one.
Lehn et al. [40] indicated that the inverse triangular load distribution and the three dimensional Concentric Arches model proposed by Van Eekelen [10] seems to be more realistic than the approach of the EBGEO both under static and cyclic loading. The authors of this article analysed only the second step of the calculations, assuming the value of the load for reinforcement and soil between the columns as data resulting from measurements. The results of the calculations performed allow to confirm the conclusions formulated in [40] regarding the distribution of equivalent load. For all analysed cases, the obtained error was lower for mapping the reinforcement deflection curve for the inverse triangular distribution than for the triangular distribution used in the EBGEO. However, not in every case the smallest mapping error value corresponds to the inverse triangular distribution (see Figure 15).
In the case of the French full-scale test, measurements were carried out at certain intervals from the moment of geosynthetic installation. This allowed for the analysis of reinforcement behaviour over time. The obtained results (Figure 14 and Figure 15) clearly show that in the case when soft soil is characterised by a significant value of the subgrade reaction k, the use of current analytical methods does not allow to predict the actual behaviour of the reinforcement shortly after installation. These models assume the elastic behaviour of the ground and do not take into account the time needed for consolidation of soft soil. Therefore, in such cases, analysis of the reinforcement behaviour for the construction phases of the structure, as required by e.g., EBGEO [19], are not justified. Van Eekelen, while validating the proposed model [10], and analysing the French full-scale test, also performed calculations of the reinforcement behaviour only for the final phase, taking into account settlement measurements approximately half a year after reinforcement installation.
Commonly used analytical models (BS [17], CUR [18], EBGEO [19]) do not take column settlements into account. In the case of laboratory model tests, the assumption that the column does not settle is perfectly valid. However, in real structures column settlements are often quite significant. The model proposed by Klobe [41] taking into account column compliance, is not widely used. In the case of French full-scale tests, the analyses were carried out for deflection curves determined from the geosynthetic settlement measurements between the columns and the assumption that the column head level is constant, analogically as in Van Eekelen [10]. In fact, due to the occurrence of column settlement, the geosynthetic deflection will be smaller in relation to the current head level. The values of the mapping error for the deflection curve for Section 4R taking into account the current level of the column head are greater than in the case of a constant level of the column head, and the nature of the distribution of the mapping error value depending on parameter is similar to the distribution for Section 3R (see Figure 14 and Figure 16). A comparison of the values of the deflection curve mapping errors determined from the reference point equal to the head zero level and equal to the head level after a given time (Figure 15 and Figure 16) shows that taking into account column settlement in the calculation model is an important issue, and would be the subject of further research.
6. Conclusions
In the performed study, 41 distributions of equivalent load (from inverse triangular, through uniform to triangular and intermediate distributions) were analysed for each case. In each analysed case, the only variable was load distribution (parameter ). The obtained results of the deflection curve mapping error allowed for the formulation of the following conclusions:
- In many of the analysed cases, the best representation of the geosynthetic deflection curve (the smallest mapping error) was obtained for a distribution represented by or close to it.
- Inverse triangular distribution usually allows to obtain a fairly accurate representation of the real deflection curve of the load transfer platform geosynthetic reinforcement of embankments on soft soils improved with columns.
- If the bearing resistance of soft soil is significant, the load distribution that allows for a better representation of the LTP reinforcement deflection in the final phase of the structure operation, depending on load ratio and stiffness of the reinforcement, and with the same value of the subgrade reaction, may be different. In the considered case 3R for measurements after 138 days, the smallest mapping error was obtained for the distribution with , and for case 4R—for the distribution with .
- The analyses have shown that among the considered load distributions, it is not possible to identify one that ensures the most accurate forecasting of the LTP reinforcement behaviour in every situation.
- Large values of the mapping error obtained for measurements made during the embankment construction phases and at a small distance from its implementation in the case of sections 3R and 4R indicate that the analytical methods do not allow for a reliable prediction of geosynthetic behaviour in these phases in the case with soil characterized by a significant coefficient of resistance k. When soft soil between the columns takes part in the load transfer (soils with significant value of subgrade reaction k), there is no justification for calculating the behaviour of the reinforcement in the embankment construction phases.
Supplementary Materials
The following are available online at https://0-www-mdpi-com.brum.beds.ac.uk/2076-3417/10/17/6127/s1, Table S1: Measurements of reinforcement displacements based on the K2 test data presented in [10], Table S2: Measurements of reinforcement displacements based on the T3 test data presented in [10], Table S3: Measurements of reinforcement displacements in test C based on data presented in [9], Table S4: Measurements of reinforcement displacements in case of plot 3R based on data presented in [13], Table S5: Measurements of reinforcement displacements in case of plot 4R based on data presented in [13].
Author Contributions
B.G. conceptualization, investigation, methodology, numerical calculations, visualization, writing—original draft, writing—review and editing. M.G. conceptualization, investigation, methodology, numerical calculations, visualization, writing—original draft, writing—review and editing. All authors have read and agreed to the published version of the manuscript.
Funding
This research received no external funding.
Conflicts of Interest
The authors declare no conflict of interest.
References
- Ellis, E.; Aslam, R. Arching in piled embankments. Comparison of centrifuge tests and predictive methods, part 1 of 2. Ground Eng. 2009, 42, 34–38. [Google Scholar]
- Ellis, E.; Aslam, R. Arching in piled embankments. Comparison of centrifuge tests and predictive methods, part 2 of 2. Ground Eng. 2009, 42, 28–31. [Google Scholar]
- Britton, E.J.; Naughton, P.J. An experimental investigation of arching in piled embankments. In Proceedings of the 4th European Geosynthetics Congress EuroGeo 4, Edinburgh, Scotland, 7–10 September 2008; p. 106. [Google Scholar]
- Britton, E.J.; Naughton, P.J. An experimental study to determine the location of the critical height in piled embankments. In Proceedings of the Geo-Frontiers Congress 2011, Dallas, TX, USA, 13–16 March 2011; Han, J., Alzamora, D.E., Eds.; ASCE: Reston, VA, USA, 2011. [Google Scholar]
- Hewlett, W.J.; Randolph, M.F. Analysis of piled embankments. Ground Eng. 1988, 22, 12–18. [Google Scholar]
- Oh, Y.I.; Shin, E.C. Reinforced and arching effect of geogrid-reinforced and pilesupported embankment on marine soft ground. Mar. Georesources Geotechnol. 2007, 25, 97–118. [Google Scholar] [CrossRef]
- Sloan, J.A. Column-Supported Embankments: Full-Scale Tests and Design Recommendations. Ph.D. Thesis, Virginia Polytechnic Institute and State University, Blacksburg, VA, USA, 2011. [Google Scholar]
- Zaeske, D. Zur Wirkungsweise von unbewehrten und bewehrten mineralischen Tragschichten über pfahlartigen Gründungselementen. Schr. Geotech. Univ. Kassel 2001, 10, 143. (In German) [Google Scholar]
- Van Eekelen, S.J.M.; Lodder, H.J.; Bezuijen, A. Load distribution on the geosynthetic reinforcement within a piled embankment. In Proceedings of the 15th European Conference on Soil Mechanics and Geotechnical Engineering, Athens, Greece, 15 September 2011; Anagnostopoulos, A., Pachakis, M., Tsatsanifos, C., Eds.; IOS Press: Amsterdam, The Netherlands, 2011; pp. 1137–1142. [Google Scholar]
- Van Eekelen, S.J.M. Basal Reinforced Piled Embankments. Ph.D. Thesis, Technical University of Delft, Delft, The Netherlands, 2015. [Google Scholar]
- Almeida, M.S.S.; Ehrlich, M.; Spotti, A.P.; Marques, M.E.S. Embankment supported on piles with biaxial geogrids. Geotech. Eng. 2007, 160, 185–192. [Google Scholar] [CrossRef]
- Almeida, M.S.S.; Marques, M.E.S.; Almeida, M.C.F.; Mendonca, M.B. Performance on two low piled embankments with geogrids at Rio de Janeiro. In Proceedings of the First Pan American Geosynthetics Conference and Exhibition, Cancun, Mexico, 2–5 March 2008; pp. 1285–1295. [Google Scholar]
- Briançon, L.; Simon, B. Performance of Pile-Supported Embankment over Soft Soil: Full-Scale Experiment. J. Geotech. Geoenviron. Eng. 2012, 138, 551–561. [Google Scholar] [CrossRef]
- Van Duijnen, P.G.; Van Eekelen, S.J.M.; Van der Stoel, A.E.C. Monitoring of a railway piled embankment. In Proceedings of the 9th International Conference on Geosynthetics (9ICG), Guarujá, Brazil, 23–27 May 2010; pp. 1461–1464. [Google Scholar]
- Van Eekelen, S.J.M.; Bezuijen, A.; van Duijnen, P.G. Does a piled embankment ‘feel’ the passage of a heavy truck? High frequency field measurements. In Proceedings of the 5th European Geosynthetics Congress EuroGeo5, Valencia, Spain, 16–19 September 2012; Volume 5, pp. 162–166. [Google Scholar]
- Fagundes, D.F.; Almeida, M.S.S.; Thorel, L.; Blanc, M. Load transfer mechanism and deformation of reinforced piled embankments. Geotext. Geomembr. 2017, 45, 1–10. [Google Scholar] [CrossRef]
- BS8006–1. Code of Practice for Strengthened/Reinforced Soils and Other Fills; British Standards Institution: London, UK, 2010. [Google Scholar]
- CUR 226. Design Guideline for Basal Reinforced Piled Embankment Systems; SBRCURnet/CRC Press: Delft, The Netherlands, 2016. [Google Scholar]
- EBGEO. Recommendations for Design and Analysis of Earth Structures Using Geosynthethic Reinforcements; DGGT; Ernst & Sohn: Berlin, Germany, 2011. [Google Scholar]
- Al-Naddaf, F.; Han, J.; Xu, C.; Jawad, S.; Abdulrasool, G. Experimental investigation of soil arching mobilization and degradation under localized surface loading. J. Geotech. Geoenviron. Eng. 2019, 145, 04019114. [Google Scholar] [CrossRef]
- Eskişar, T.; Otani, J.; Hironaka, J. Visualization of soil arching on reinforced embankment with rigid pile foundation using X-ray CT. Geotext. Geomembr. 2012, 32, 44–54. [Google Scholar] [CrossRef]
- Filz, M.G.; Smith, M.E. Net vertical load on geosynthetic reinforcement in column-supported embankments. In Proceedings of the Sessions of Geo-Denver 2007, Soil Improvement (GSP 172), Denver, CO, USA, 18–21 February 2007; Schaefer, V.R., Filz, G.M., Gallagher, P.M., Sehn, A.L., Wissmann, K.J., Eds.; ASCE: Reston, VA, USA, 2007. [Google Scholar]
- Naughton, P.; Scotto, M.; Kempton, G. Piled embankments: Past experience and future perspectives. In Proceedings of the 4th European Geosynthetics Conference, Edinburgh, Scotland, 7–10 September 2008; p. 184. [Google Scholar]
- Zhang, Z.; Tao, F.J.; Ye, G.B.; Han, J.; Xu, C.; Liu, L. Physical models to investigate soil arching phenomena under cyclic footing loading using transparent soil. In Proceedings of the GeoShanghai 2018 International Conference: Fundamentals of Soil Behaviours, Shanghai, China, 27–30 May 2018; Zhou, A., Tao, J., Gu, X., Hu, L., Eds.; Springer: Singapore, 2018; pp. 792–801. [Google Scholar]
- Zhuang, Y.; Ellis, E.; Yu, H.S. Three-dimensional finite-element analysis of arching in a piled embankment. Géotechnique 2012, 62, 1127–1131. [Google Scholar] [CrossRef]
- Zhuang, Y.; Wang, K.Y.; Liu, H.L. A simplified model to analyze the reinforced piled embankments. Geotext. Geomembr. 2014, 42, 154–165. [Google Scholar] [CrossRef]
- Fonseca, E.C.A.; Palmeira, E.M. Evaluation of the accuracy of design methods for geosynthetic-reinforced piled embankments. Can. Geotech. J. 2019, 56, 761–773. [Google Scholar] [CrossRef]
- Naughton, P.J.; Kempton, G.T. Comparison of analytical and numerical analysis design method for piled embankments. In Proceedings of the Geo-Frontiers 2005, Contemporary Issues in Foundation Engineering (GSP 131), Austin, TX, USA, 24–26 January 2005; Anderson, J.B., Phoon, K.K., Smith, E., Loehr, J.E., Eds.; ASCE: Reston, VA, USA; pp. 135–144. [Google Scholar]
- Stewart, M.E.; Filz, G.M. Influence of clay compressibility on geosynthetic loads in bridging layers for column-supported embankment. In Proceedings of the Geo-Frontiers 2005, Contemporary Issues in Foundation Engineering (GSP 131), Austin, TX, USA, 24–26 January 2005; Anderson, J.B., Phoon, K.K., Smith, E., Loehr, J.E., Eds.; ASCE: Reston, VA, USA; pp. 1–14. [Google Scholar]
- Zhang, Z.; Tao, F.; Han, J.; Ye, G.; Liu, L. Numerical Analysis of Geosynthetic-Reinforced Pile-Supported Embankments Subjected to Different Surface Loads. In Proceedings of the Geo-Congress 2020: Engineering, Monitoring, and Management of Geotechnical Infrastructure (GSP 316), Minneapolis, MN, USA, 25–28 February 2020; ASCE: Reston, VA, USA. [Google Scholar]
- Deb, K.; Mohapatra, S.R. Analysis of stone column-supported geosynthetic-reinforced embankments. Appl. Math. Model. 2013, 37, 2943–2960. [Google Scholar] [CrossRef]
- Filz, G.M.; Sloan, J.A. Load distribution on geosynthetic reinforcement in column-supported embankments. In Proceedings of the Geo-Congress 2013: Stability and Performance of Slopes and Embankments III (GSP 231), San Diego, CA, 3–7 March 2013; Meehan, C., Pradel, D., Pando, M.A., Labuz, J.F., Eds.; ASCE: Reston, VA, USA, 2013. [Google Scholar]
- Jones, B.M.; Plaut, R.H.; Filz, G.M. Analysis of geosynthetic reinforcement in pile-supported embankment. Part I: 3D plate model. Geosynth. Int. 2010, 17, 59–67. [Google Scholar] [CrossRef]
- Gajewska, B.; Gajewski, M. Wpływ rozkładu obciążenia ekwiwalentnego na zachowanie membrany modelującej zbrojenie warstwy transmisyjnej. Acta Sci. Pol. Archit. 2020. in press. (In Polish) [Google Scholar]
- Gajewska, B.; Gajewski, M. Approximation Method for Evaluation of Strains and Forces in LTP Reinforcement of Embankments on Columns. IOP Conf. Ser. Mater. Sci. Eng. 2019, 661, 012089. [Google Scholar] [CrossRef]
- Gajewska, B.; Gajewski, M. Reinforced column-supported embankments: An approximation method for evaluating LTP reinforcement. In Theoretical Foundation of Civil Engineering. Mechanics of Materials and Structures; Szwed, A., Kamińska, I.D., Eds.; Oficyna Wydawnicza Politechniki Warszawskiej: Warszawa, Poland, 2019; Volume 9, pp. 55–74. [Google Scholar]
- Nunez, M.A.; Briançon, L.; Dias, D. Analyses of a pile-supported embankment over soft clay: Full-scale experiment, analytical and numerical approaches. Eng. Geol. 2013, 153, 53–67. [Google Scholar] [CrossRef]
- Van Eekelen, S.J.M.; Bezuijen, A. Inversed triangular load distribution in a piled embankment, 3D model experiments, field tests, numerical analysis and consequences. In Proceedings of the 5th European Geosynthetics Congress EuroGeo5, Valencia, Spain, 16–19 September 2012; Volume 5, pp. 172–176. [Google Scholar]
- Blanc, M.; Thorel, L.; Girout, R.; Almeida, M. Geosynthetic reinforcement of a granular load transfer platform above rigid inclusions: Comparison between centrifuge testing and analytical modelling. Geosynth. Int. 2014, 21, 37–52. [Google Scholar] [CrossRef]
- Lehn, J.; Moormann, C.; Aschrafi, J. Numerical Investigations on the Load Distribution over the Geogrid of a Basal Reinforced Piled Embankment under Cyclic Loading. Procedia Eng. 2016, 143, 435–444. [Google Scholar] [CrossRef] [Green Version]
- Klobe, B. Die erdstatische Berechnung geotechnischer Flächentragwerke. Bautechnik 2007, 84, 94–102. [Google Scholar] [CrossRef]
Figure 1.
Distributions of the equivalent load modelling the load of the LTP reinforcement.

Figure 2.
A membrane modelling the reinforcement of the LTP, boundary conditions and coordinate system.
Figure 2.
A membrane modelling the reinforcement of the LTP, boundary conditions and coordinate system.

Figure 3.
Examples of load distributions depending on parameter .

Figure 4.
Comparison of the deflection curve of the reinforcement with the deflection curve of the membrane for three equivalent load distributions (inverse triangular, uniform and triangular), using Formula (2); (source of measurement data [10]).
Figure 4.
Comparison of the deflection curve of the reinforcement with the deflection curve of the membrane for three equivalent load distributions (inverse triangular, uniform and triangular), using Formula (2); (source of measurement data [10]).

Figure 5.
Approximation of the C_L (a) and C_R (b) test results using a 7th degree polynomial.


Figure 7.
Measurement results of the pressure exerted on the geosynthetic based on the measurements presented in [13].
Figure 7.
Measurement results of the pressure exerted on the geosynthetic based on the measurements presented in [13].

Figure 8.
Results of measurements of the settlement of reinforcement between columns from the zero level of the column head—Section 4R (based on [13]).
Figure 8.
Results of measurements of the settlement of reinforcement between columns from the zero level of the column head—Section 4R (based on [13]).

Figure 9.
Membrane tension force as a function of parameter (k = 0).

Figure 10.
Deflection curve mapping error as a function of parameter (k = 0).

Figure 11.
Deflection curve mapping error of the C_L test curve as a function of parameter (k = 0) for different values of the ratio.
Figure 11.
Deflection curve mapping error of the C_L test curve as a function of parameter (k = 0) for different values of the ratio.

Figure 12.
Comparison of deflection curves under the equivalent load distributed in the form of an inverse triangle, uniform and a triangle in view of the measurement results [9] of the reinforcement deflection curve (black line) for C_L and = 0.075.
Figure 12.
Comparison of deflection curves under the equivalent load distributed in the form of an inverse triangle, uniform and a triangle in view of the measurement results [9] of the reinforcement deflection curve (black line) for C_L and = 0.075.

Figure 13.
An example graph of tension force as the function of parameter (3R, 9 days).

Figure 14.
Deflection curve mapping error as a function of parameter (Section 3R).

Figure 15.
Deflection curve mapping error as a function of parameter (4R).

Figure 16.
Deflection curve mapping error as a function of parameter (4R—taking into consideration the column settlement).
Figure 16.
Deflection curve mapping error as a function of parameter (4R—taking into consideration the column settlement).


Table 1.
Parameters of the Dutch tests.
| Test | Centre to Centre Distance between Piles (sx = sy) [m] | Diameter Circular Pile Caps d [m] | Subgrade Reaction k [kN/m3] | GR Short Time Stiffness J2% (Direction 1/Direction 2) [kN/m] |
|---|---|---|---|---|
| K2 | 0.55 | 0.10 | 0 | 2269 |
| T3 | 0.55 | 0.10 | 0 | 970/1810 |
| C | 0.55 | 0.10 | 0 | 1045 |
Table 2.
Parameters of the French tests.
| Test | Centre to Centre Distance between Piles (sx = sy) [m] | Diameter Circular Pile Caps d [m] | Subgrade Reaction k [kN/m3] | GR Short Time Stiffness Jx = Jy [kN/m] |
|---|---|---|---|---|
| 3R | 2.0 | 0.38 | 356 | 800 |
| 4R | 2.0 | 0.38 | 356 | 1000 (2 × 500) |
© 2020 by the authors. Licensee MDPI, Basel, Switzerland. This article is an open access article distributed under the terms and conditions of the Creative Commons Attribution (CC BY) license (http://creativecommons.org/licenses/by/4.0/).
Share and Cite
MDPI and ACS Style
Gajewska, B.; Gajewski, M. Effect of Equivalent Load Distribution on the Accuracy of Mapping the Reinforcement Load Deflection Curve in LTP. Appl. Sci. 2020, 10, 6127. https://0-doi-org.brum.beds.ac.uk/10.3390/app10176127
AMA Style
Gajewska B, Gajewski M. Effect of Equivalent Load Distribution on the Accuracy of Mapping the Reinforcement Load Deflection Curve in LTP. Applied Sciences. 2020; 10(17):6127. https://0-doi-org.brum.beds.ac.uk/10.3390/app10176127
Chicago/Turabian StyleGajewska, Beata, and Marcin Gajewski. 2020. "Effect of Equivalent Load Distribution on the Accuracy of Mapping the Reinforcement Load Deflection Curve in LTP" Applied Sciences 10, no. 17: 6127. https://0-doi-org.brum.beds.ac.uk/10.3390/app10176127
Note that from the first issue of 2016, this journal uses article numbers instead of page numbers. See further details here.