Article

Data Analysis as a Tool for the Application of Adaptive Learning in a University Environment

by
William Villegas-Ch
1,*,
Milton Roman-Cañizares
1,
Angel Jaramillo-Alcázar
1 and
Xavier Palacios-Pacheco
2
1
Escuela de Ingeniería en Tecnologías de la Información, FICA, Universidad de Las Américas, Quito 170125, Ecuador
2
Departamento de Sistemas, Universidad Internacional del Ecuador, Quito 170411, Ecuador
*
Author to whom correspondence should be addressed.
Submission received: 9 September 2020 / Revised: 25 September 2020 / Accepted: 2 October 2020 / Published: 9 October 2020
(This article belongs to the Special Issue Data Analytics and Machine Learning in Education)

Abstract

:
Currently, data are a very valuable resource for organizations. Through analysis, it is possible to profile people or obtain knowledge about an event or environment and make decisions that help improve their quality of life. This concept takes on greater value in the current pandemic, due to coronavirus disease 2019 (COVID-19), that affects society. This emergency has changed the way people live. As a result, the majority of activities are carried out using the internet, virtually or online. Education is not far behind and has seen the web as the most successful option to continue with its activities. The use of any computer application generates a large volume of data that can be analyzed by a big data architecture in order to obtain knowledge from its students and use it to improve educational processes. The big data, when included as a tool for adaptive learning, allow the analysis of a large volume of data to offer an educational model based on personalized education. In this work, the analysis of educational data through a big data architecture is proposed to generate learning based on meeting the needs of students.

1. Introduction

Information technologies (ITs) have great penetration in society and their way of life, they have turned traditional environments into digital environments [1]. This transformation allows people to modify their paradigms in relation to the way of communicating, working, learning and many activities that were believed to be typical of people’s physical interaction [2]. With IT, this has changed in an abysmal way, to the point that it allows people to even communicate with machines and that these in turn can generate comfortable environments for the development of activities typical of society [3]. The digital age definitely brings advantages that are exploited by all the individuals who use them, increasingly generating a knowledge society [4].
One of the characteristics of society is its need to learn. Currently, this has benefited thanks to the use of accessible technology and the Internet as a means of communication [5]. Knowledge has become globalized to such an extent that it has changed the way people learn. In response, universities create new educational models that align with the demands of society [6,7]. However, there are certain parameters that are somehow not considered in the creation of these new educational models [8,9]. One of them is that at the same time that IT creates new advantages for the development of people’s activities, these same IT create a faster world where time becomes a scarce resource that must be divided for work tasks, family, personal, educational, purposes, etc.
Transforming the time that a person dedicates to each activity into effective time is the problem that several scientific studies face. Universities and their educational models are the ideal environments to propose techniques or models that focus on the effective development of people [10]. Current educational models, such as the online study modality or face-to-face models, include ITs in all their processes to improve them and learn from possible mistakes [11]. However, in practice, the inclusion of IT has not solved problems such as dropouts or low academic effectiveness; in certain circumstances these problems have even been increasing. In response to these events, universities have taken steps to include student-based learning techniques, such as problem-solving-based learning, flipped learning, project-based learning, etc. These techniques are part of a very powerful model such as adaptive or personalized learning [12]. This type of learning places the student as the main actor in their education, for which IT is used as a main tool [13].
The concept of adaptive learning is aligned with the new reality that society is currently experiencing. Being affected by the Coronavirus Disease 2019 (COVID-19) pandemic, universities were involved in serious problems [14]. The continuity of education the same as most activities was stopped by a mandatory quarantine. A part of the solution to face the chaos generated came from information and communication technologies (ICTs) with teleworking and the use of different applications that allow synchronous communication. The effect of COVID-19 on education had serious implications that will be reflected in the periods after 2020. Although the face-to-face models went to a virtual or online mode and continued with their activities, the change was so abrupt that both resources and learning activities designed in a face-to-face education model were not adjusted to the new needs of the students. With this precedent, it is necessary to promptly update the educational models designed for adaptive learning where the entire academic environment revolves around the student [15].
In this work a data analysis model based on the use of a big data framework is proposed [16]. This model allows the processing of the large volumes of data that students generate in their academic activities and analyzes them to obtain knowledge about their needs [17]. With this information, it is possible to determine exactly what problems students present, for this it will be necessary to identify the different patterns in the data and classify individuals in order to offer an adaptive learning model.
This article is organized as follows: Section 2 reviews the concepts used in this research; Section 3 describes the proposed method; Section 4 shows the results of the investigation; Section 5 discusses the results obtained; Section 6 presents the conclusions.

2. Preliminary Concepts

For the development of this work, several concepts have been used that give a guide to all the components that must be included for the design of the proposal. These concepts clarify the environment where the work is carried out; in addition, it shows the operation of each of the technologies individually. This is the starting point that provides the basis for the integration of big data in educational environments for the generation of adaptive learning.

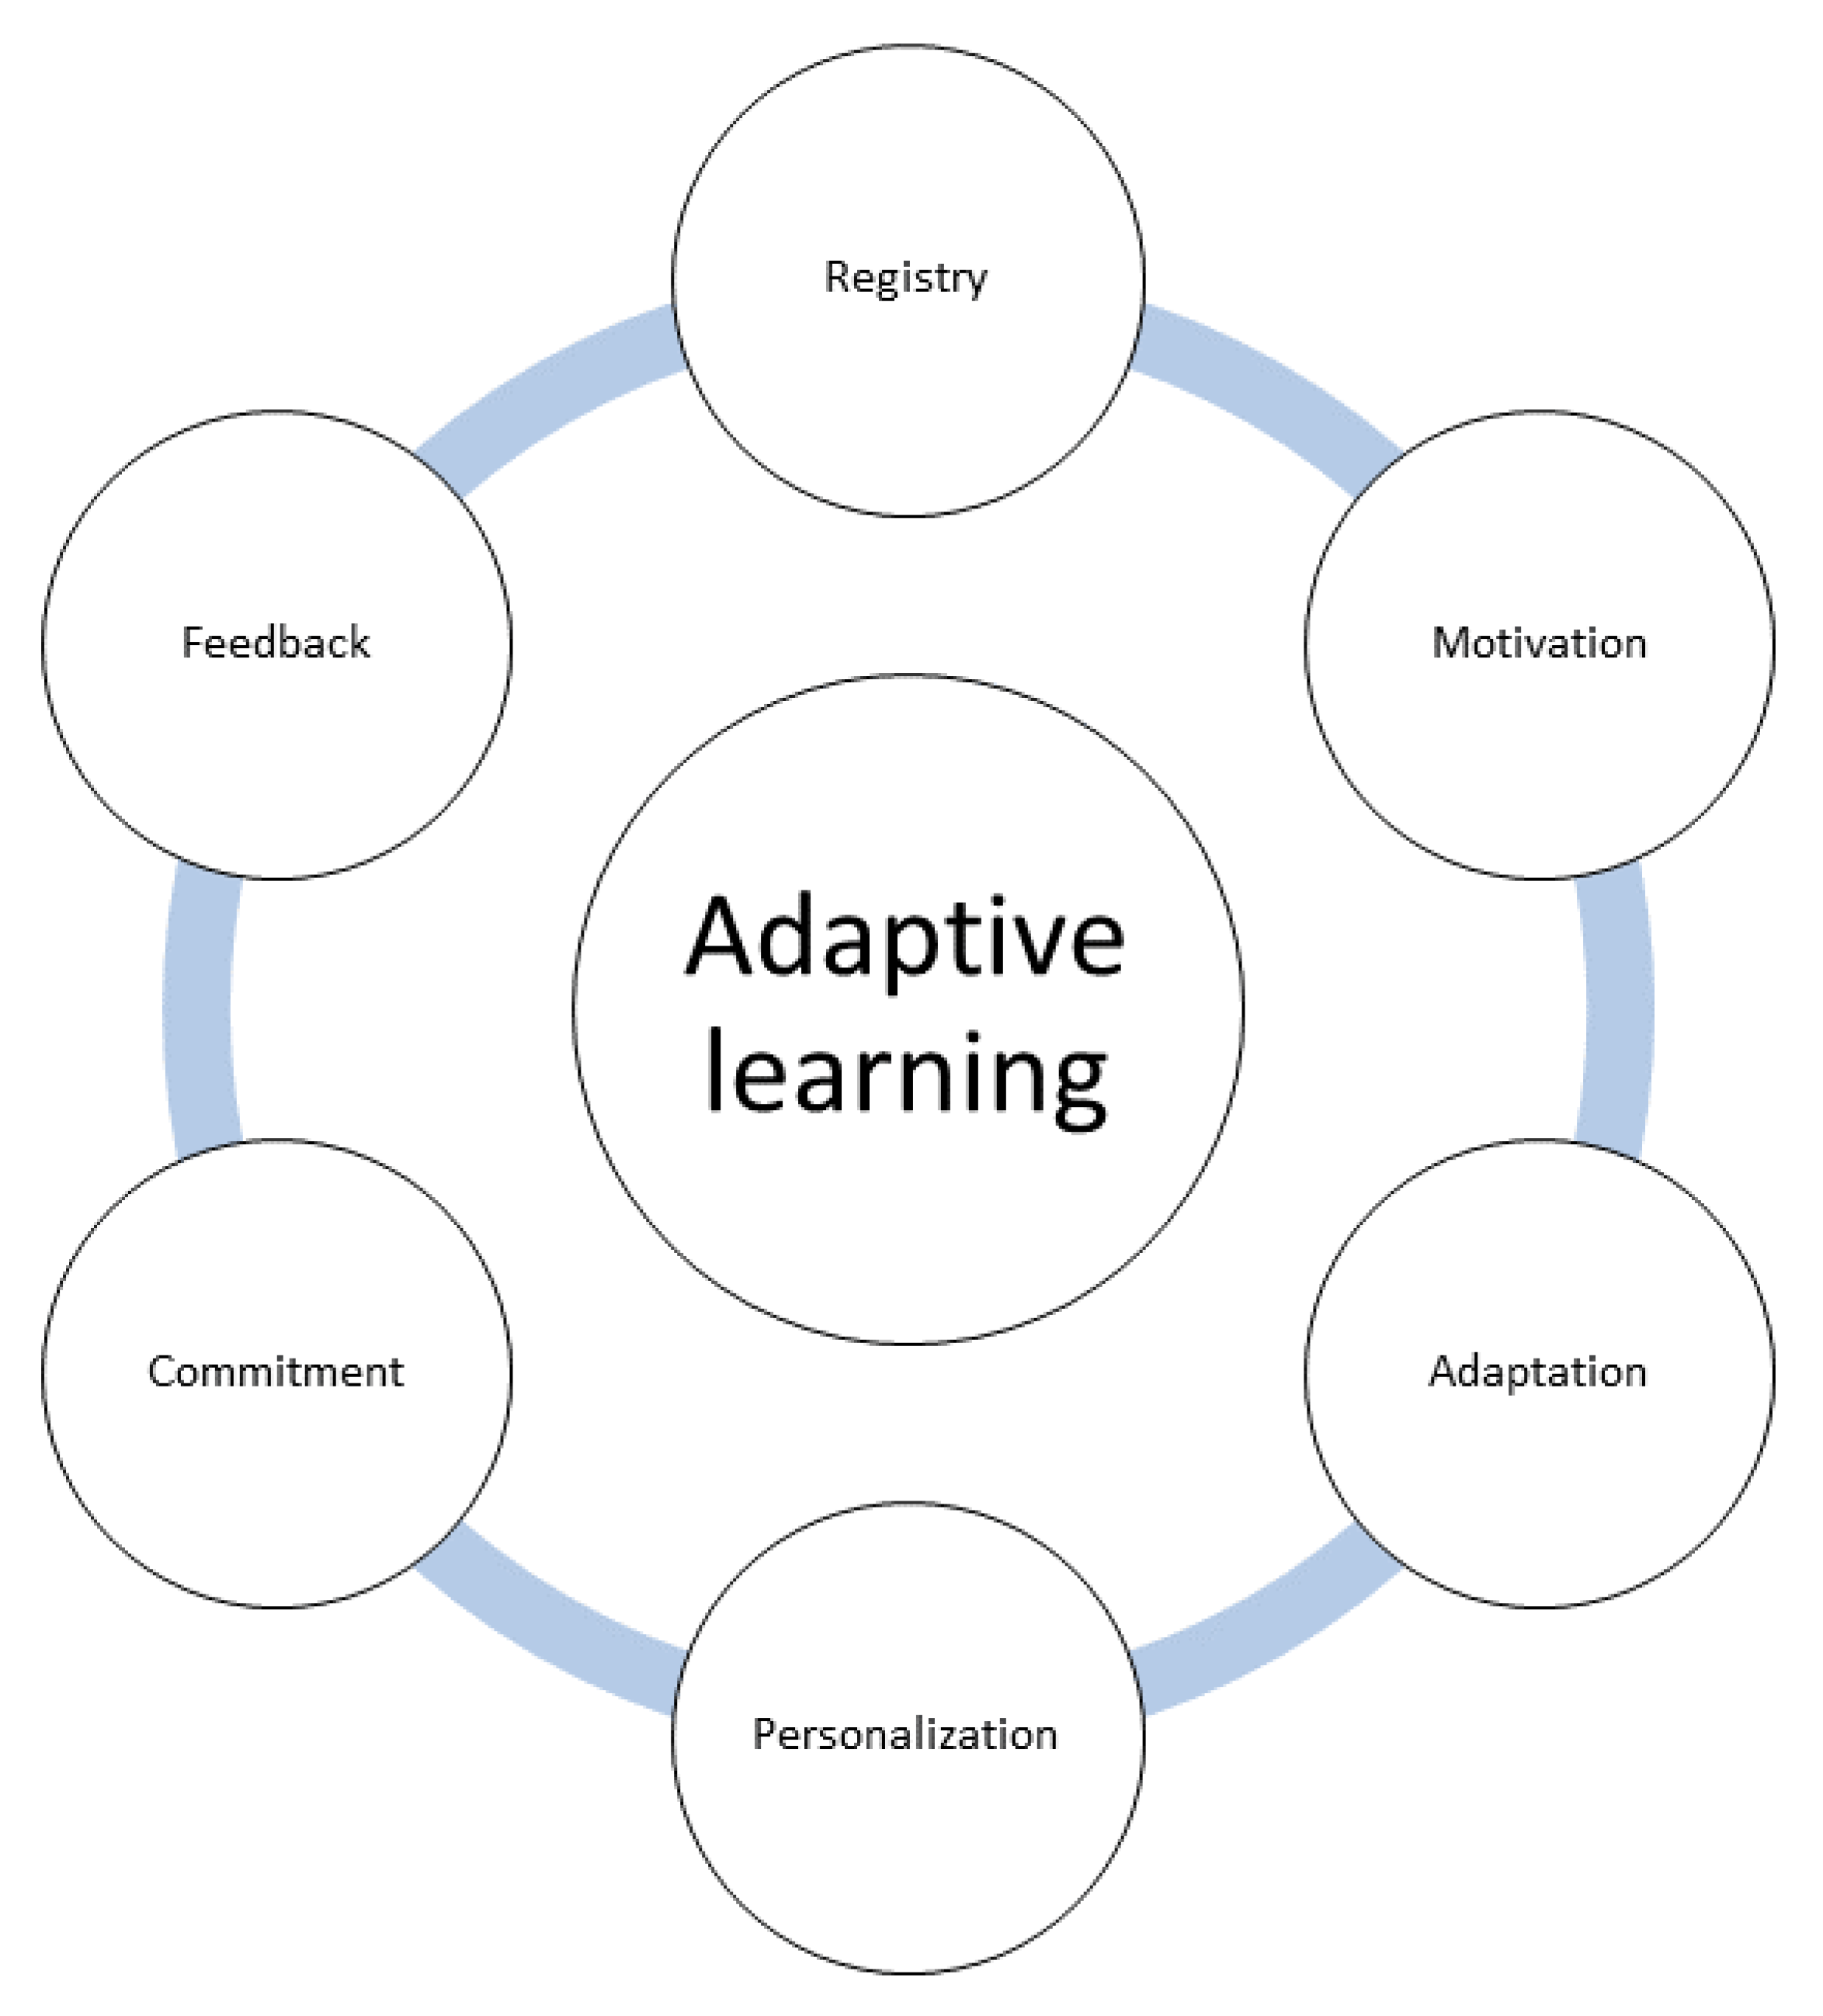
2.1. Adaptive Learning
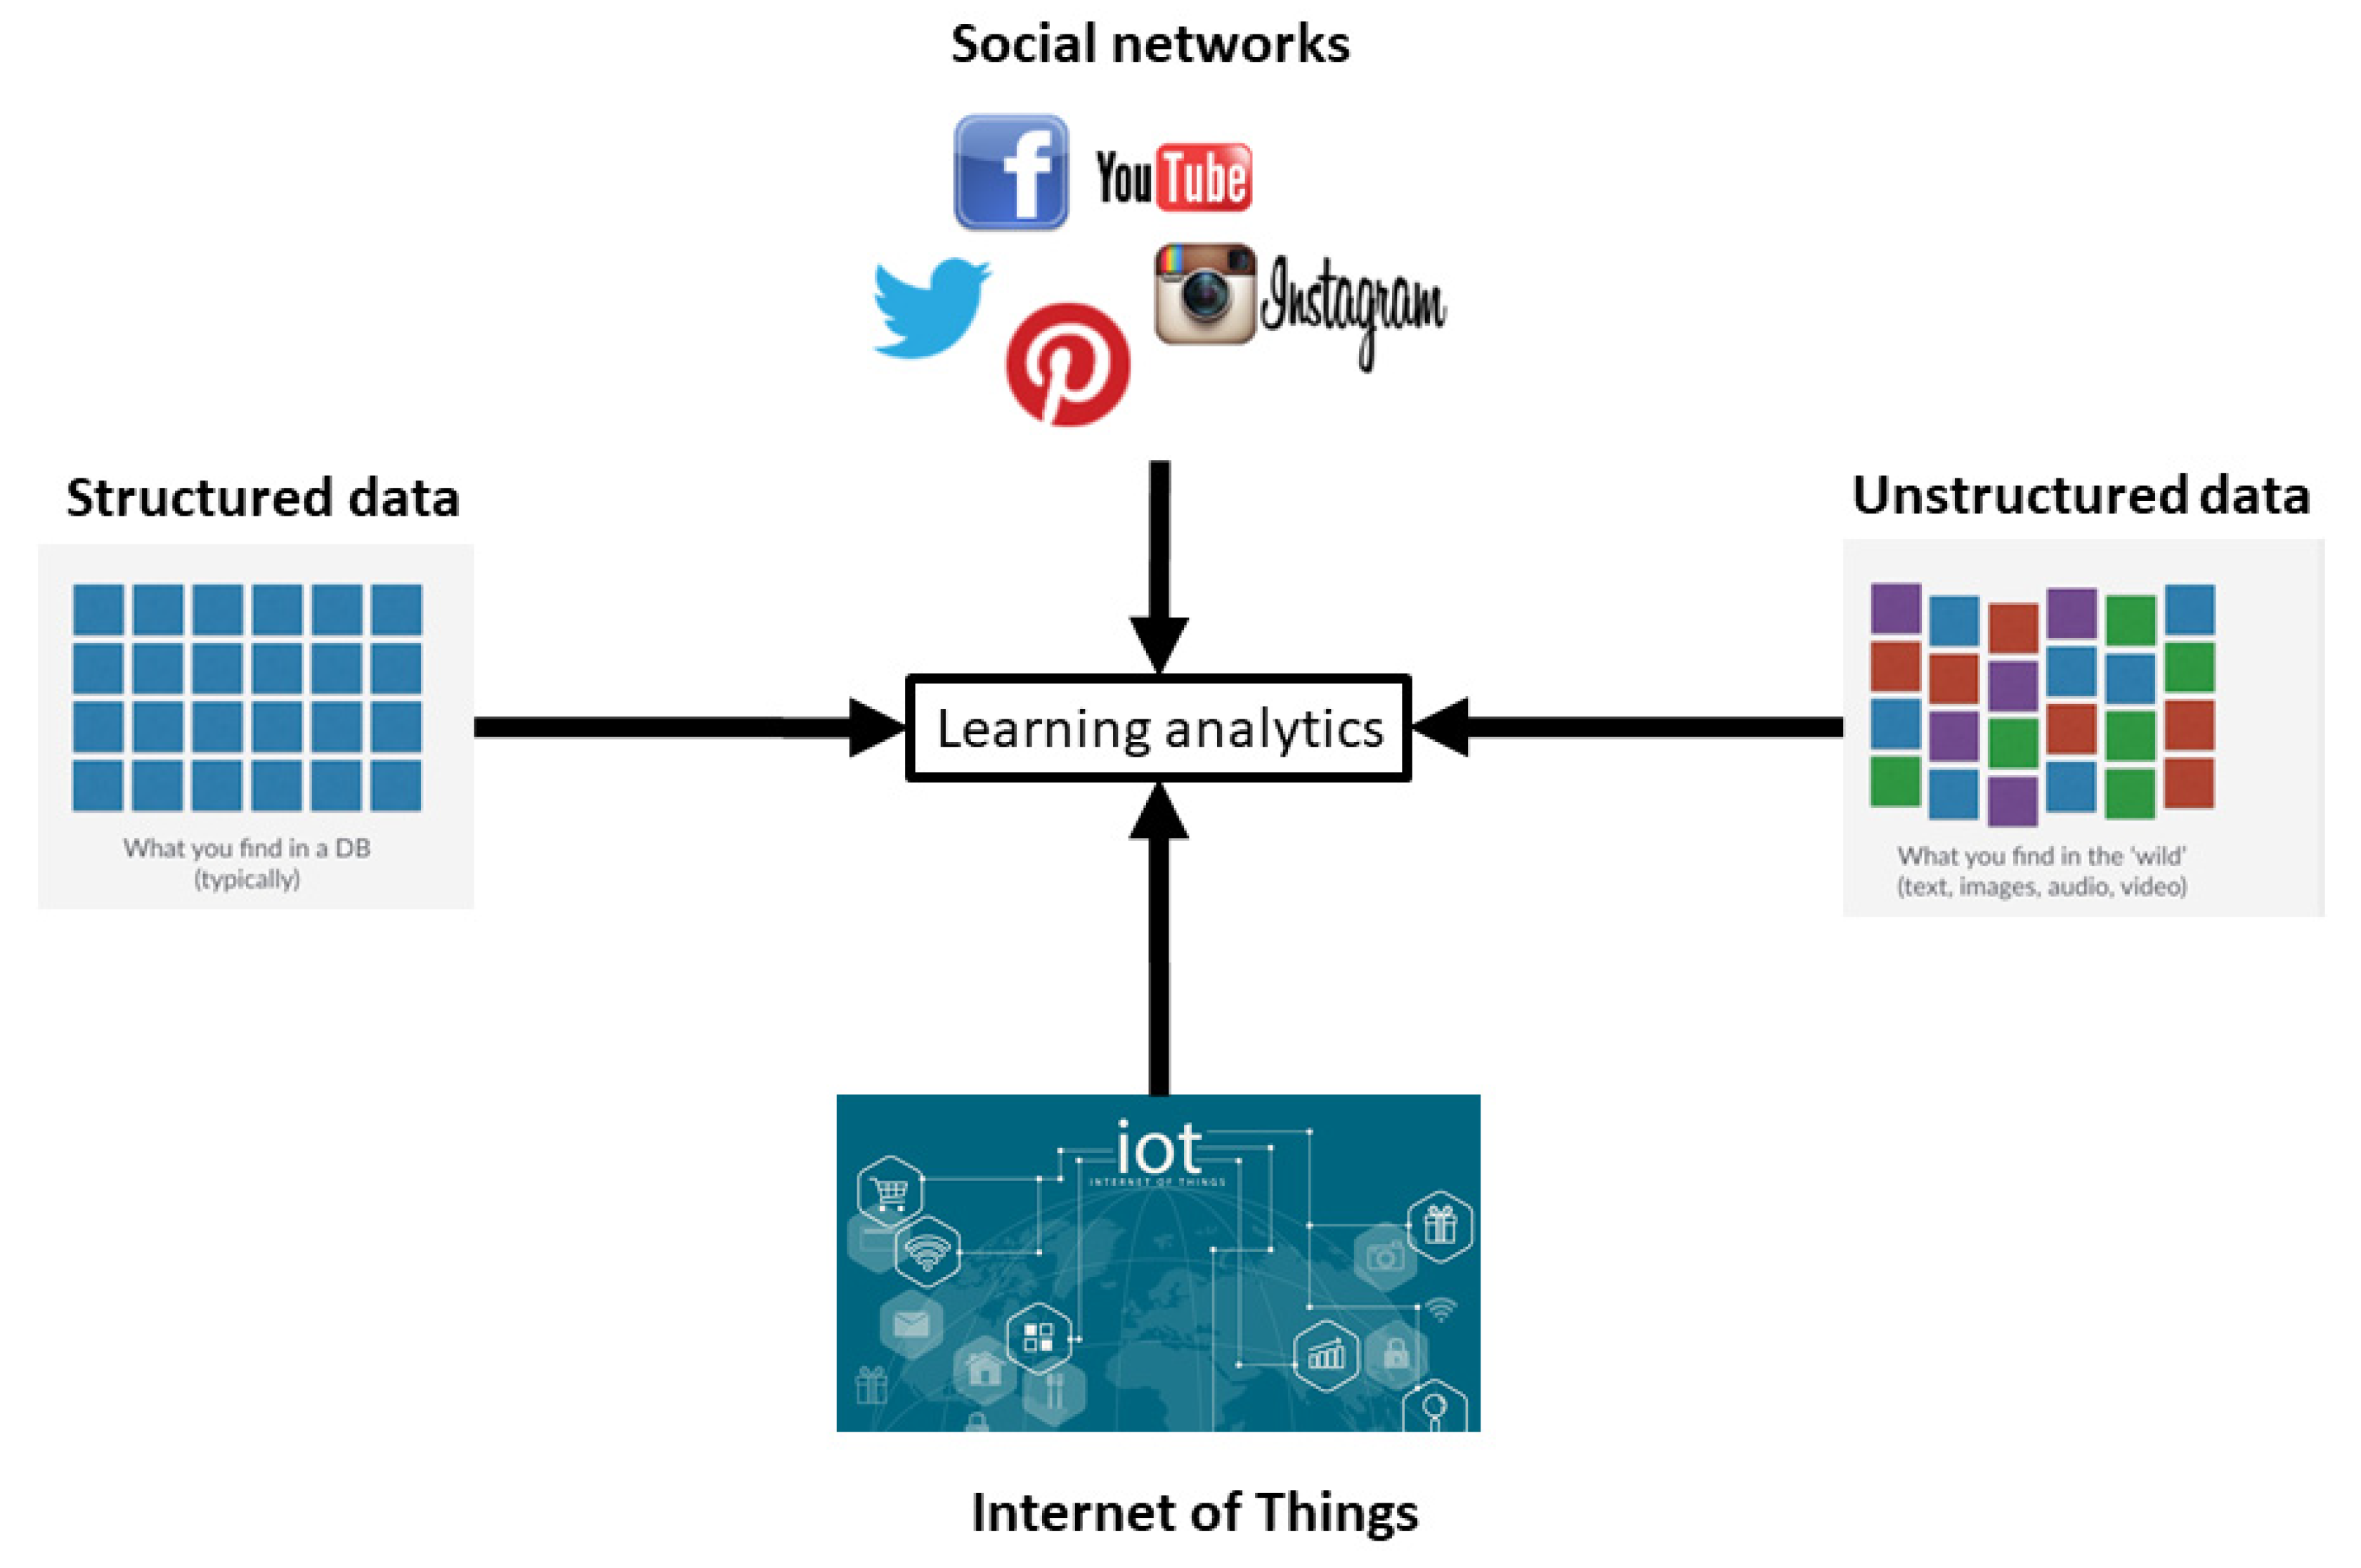
Adaptive learning is any pedagogical initiative based on analysis, by the academic environment, of data generated during the students’ learning process. This monitoring is known as learning analytics—it allows the learning process to be adapted to the educational needs of each student [18]. In this way, adaptive learning allows each student to achieve the knowledge required in each course at their own pace, thus becoming a pedagogical system capable of giving personalized attention to the largest number of students possible in school environments that are increasingly diverse [19]. Adaptive learning optimizes the learning process of each student, identifies the topics that must be reinforced and progresses with those that have already been understood, opting for higher levels if the student has a good preparation and basic levels if he lacks it [20].

2.2. Big Data

Big data consist of data that are so large or complex that it cannot be handled with traditional computing methods of processing. It consists of developing mechanisms capable of processing and managing massive data that come from various sources and is used to find repetitive patterns, predictive models or more precise statistics within those millions of data. It is able to process information and cross the data that are of interest at all times [21]. Ultimately, the objective is to process these data to convert them into information capable of being interpreted by humans and to help them make decisions.
Big data are useful for many academic institutions in that they provide answers to many questions that academic directorates did not even know they had. In doing so, academic institutions are able to identify the problems of their students or educational models in a more understandable way. There are different tools for managing big data—Hadoop (standard framework for storing large volumes of data and subsequent distributed processing in clusters) and Spark (seen as a natural evolution of Hadoop analytics in search of more optimized models) stand out for their functionality. The two frameworks belong to the Apache project and are open source [22].

3. Methods

An adaptive or personalized learning strictly depends on a technological architecture that responds to the needs of each student. Universities generally have robust technologies that allow them to store large volumes of data. However, these data are often not used to solve highly relevant issues such as learning or their evaluation. Their use in most cases is focused on administrative management, as well as on the marketing of the institution. Generating a student-centered adaptive learning model requires several components such as the type of data and its sources, the environment where the proposal is applied, the data analysis architecture and its deployment [23]. The integration of these components makes it possible to identify the needs of the students by identifying patterns in the data for later classification, through different data mining algorithms.

3.1. Data

The data that are generated in a university depend on the services they offer to students. Universities generally have traditional computer systems that are in charge of academic, financial and administrative management [24]. The data generated in these systems are stored in structured databases and in this line are the learning management systems (LMSs) and other educational platforms that make up academic support for students and teachers. These systems can be accessed by students through the internet [25]. However, there are other data that are typical of a face-to-face modality where the campus and the devices that comprise it create a digital environment capable of acquiring information from students. With this information it is possible to generate a greater number of variables that will allow the detection of new patterns in the campus population. Among the devices that have this capacity within a campus is the Internet of Things (IoT) or devices that are responsible for a specific action within the campus [26]. For example, sensors and actuators that verify and control access, the physical safety of people, setting of areas, etc. Education must be developed in ideal environments that, in addition to providing comfort for people, offer all the facilities for quality learning. The data obtained from these systems at first glance do not have a major impact on education but play an important role from an analytical point of view [27].
There is another group of data that is important to consider, such as data from social networks. These, through sentiment analysis, provide important information about what the student feels in relation to their university, career or a specific event. In Figure 1, several of the data sources considered in this work are presented—the greater the volume of data that is integrated into the analysis, the greater depth is provided to the analysis in such a way that the personalization of learning is optimal [28].

3.2. Description of the Application Environment of an Adaptive Learning Model

Technological or educational platforms that support adaptive learning make it possible to identify strengths and weaknesses in a certain topic to redirect them when advancing or reinforcing the missing content. In this lies the adaptation or personalization of learning for each student [29].
The university participating in this study has face-to-face and online educational models. For this reason, it is important to establish the environment where the architecture is implemented; for this, an important distinction must be made with respect to the study modalities. Predicting school failure and dropout was conducted by using data mining techniques [30]. Universities have been migrating their face-to-face education models to online or virtual educational models. In this research, the distinction is based on the source of data that is coupled with the research. In a face-to-face education model, data sources can present a greater variety; for example, the integration of data generated by IoT devices that can present an additional variable for analysis and that interact directly with students [31]. There are additional data sources such as teachers’ own resources, social networks, use of internal applications, etc. In an online or virtual education model, the data sources are focused on the applications offered by the university through its platforms.
The university in question has an LMS that becomes the main tool for education since it offers the student a course template where resources and activities are available that allow the development of learning [32]. However, this template was not intended for the implementation of adaptive learning; with an objective vision, it can be pointed out that LMSs have been used as simple repositories. This work proposes the promotion of adaptive learning through data analysis [33]. To do this, several factors must be considered that make traditional learning transition to adaptive learning. In Figure 2, the referenced environment is presented with components such as competencies, feedback, adaptation, etc. Based on technology, they allow the generation of a personalized environment that adapts to the needs of each student.

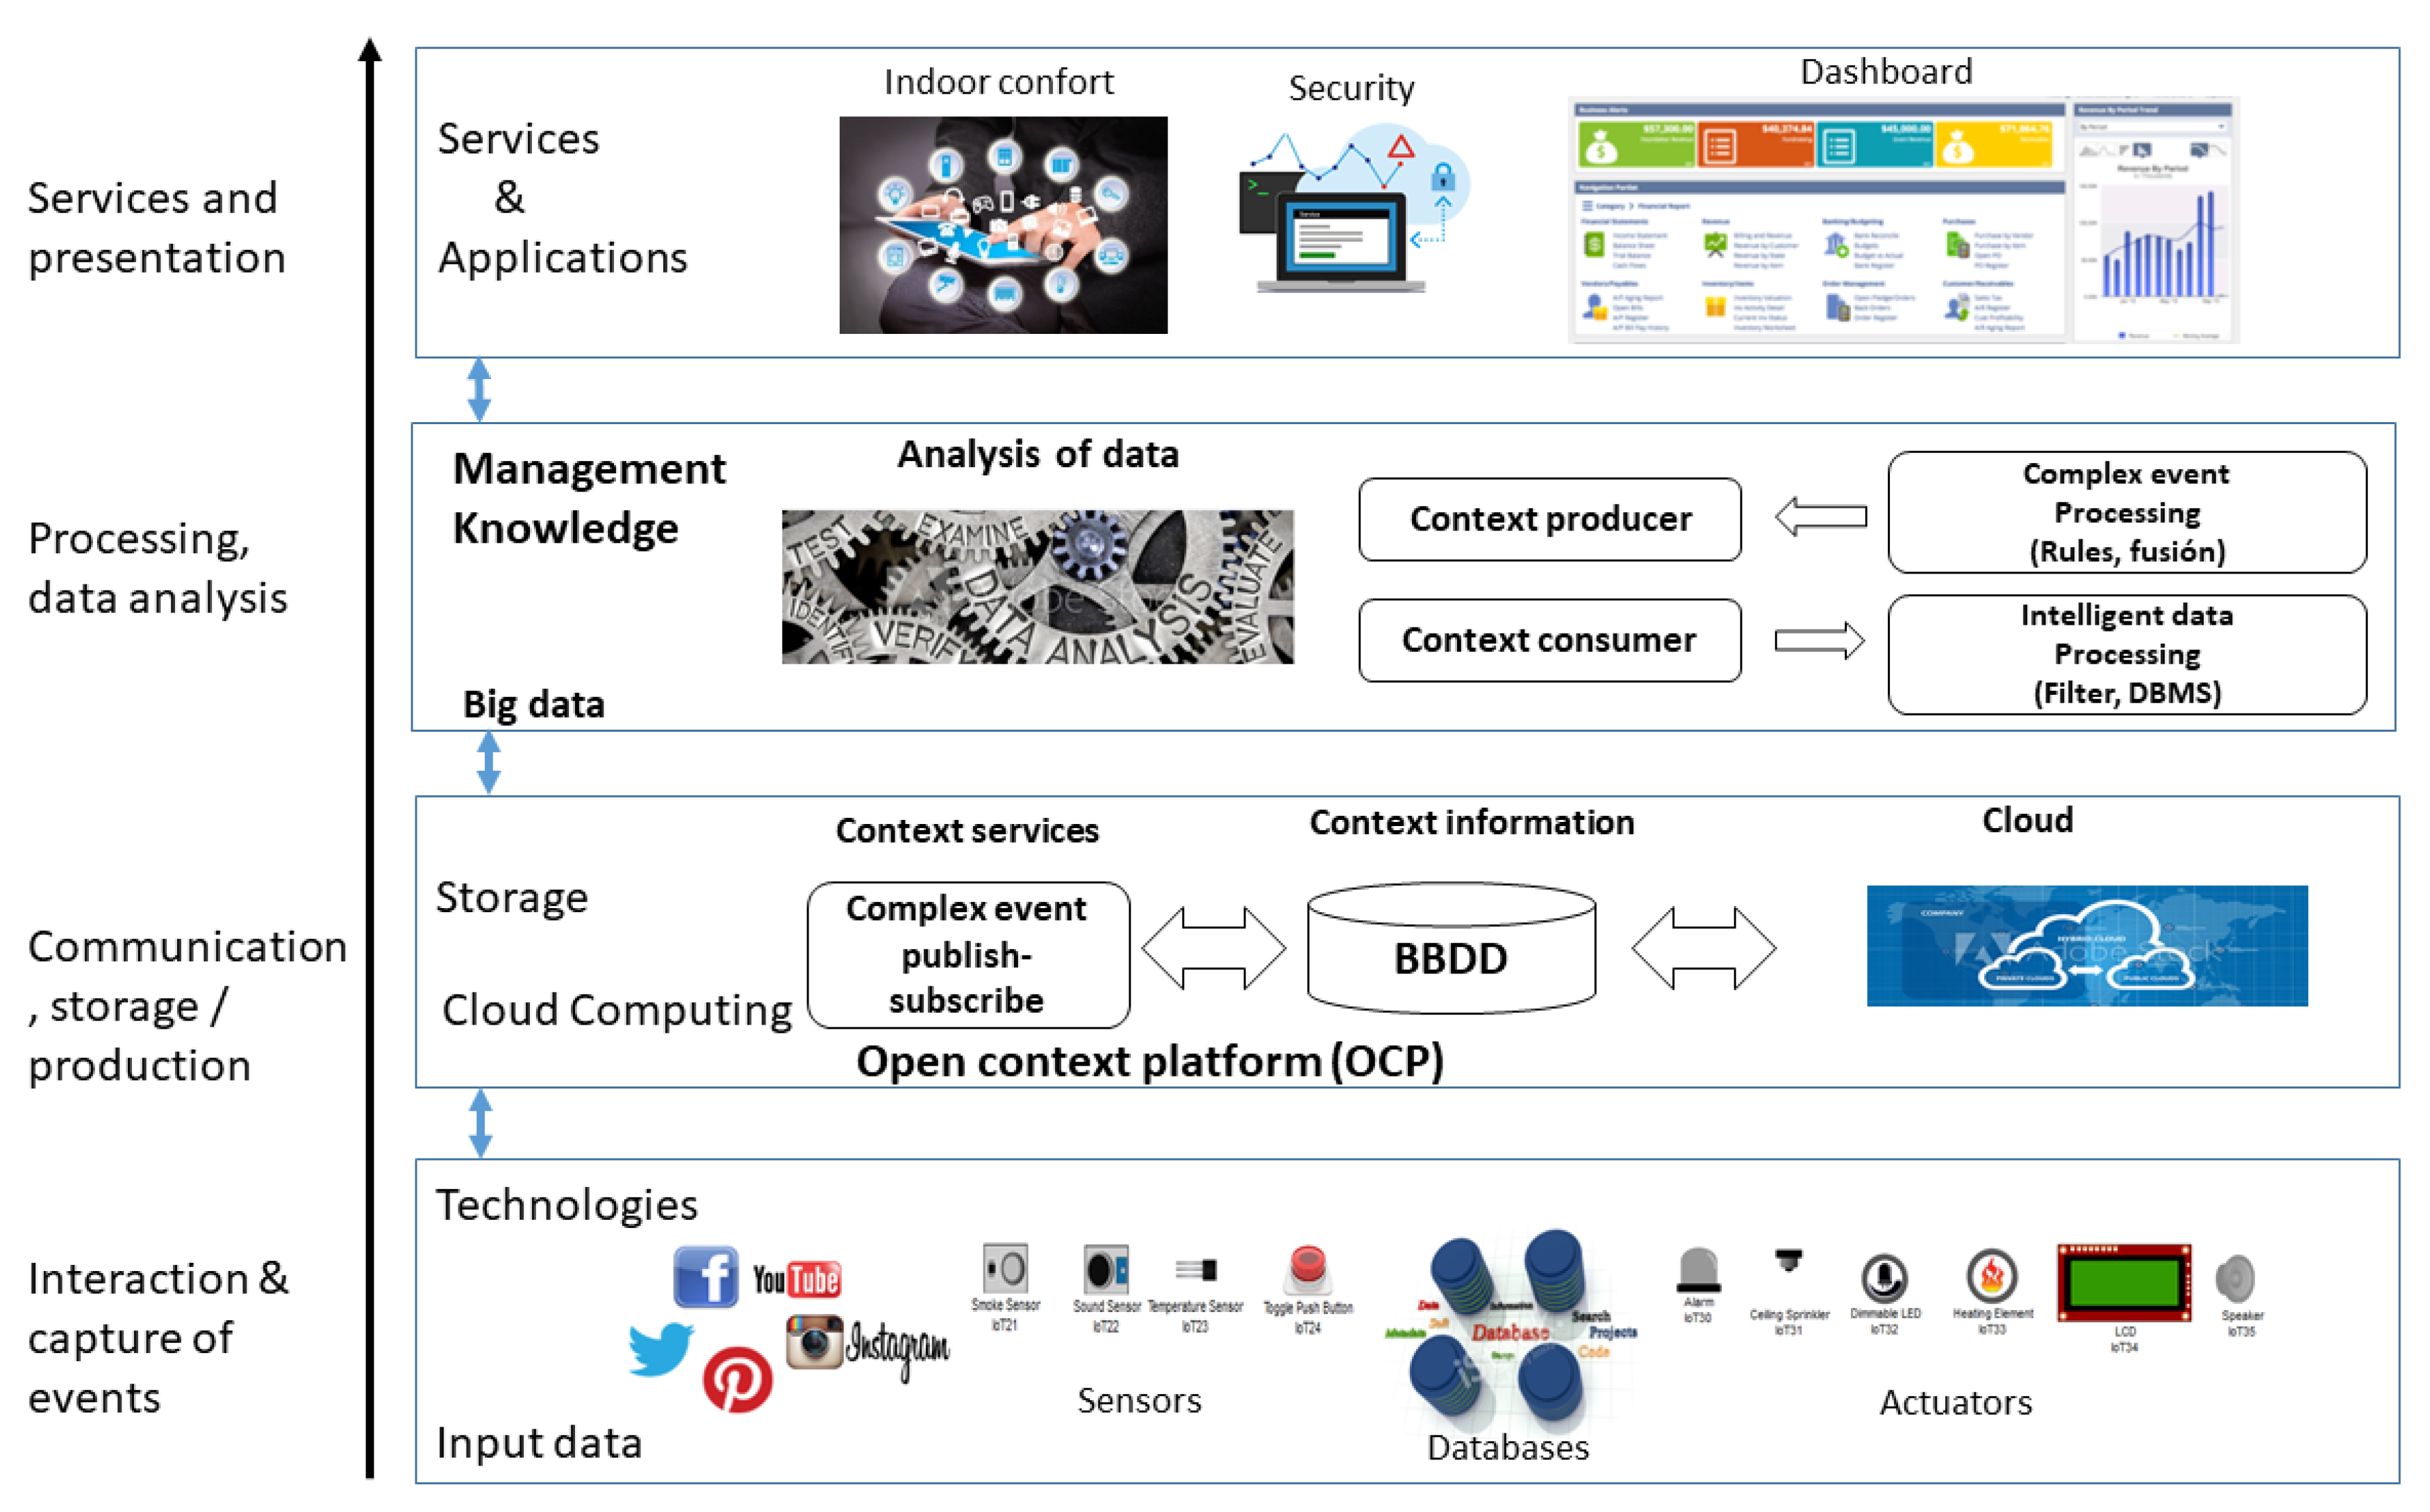
3.3. Technology for Data Analysis

The IT allows the design of a generic data analysis architecture focused on the management of a large volume and variety of data; this work proposes the use of these architectures to identify and satisfy the needs of students in a model that guarantees scalability in data management. For this, it is important to work under two fundamental perspectives, such as speed of responses and technical requirements in implementation. When analyzing technologies for data analysis that align with learning analysis, there are many variables that must be considered for your choice. However, in this work this gap is covered by the previous work by the authors of [16,17,29].
In an adaptive education model, the speed of the response to an event depends on the type of analysis that is performed on the historical data of the students [34,35]. The decision-making that proposes the improvement of learning must be executed in an efficient and timely manner [36]. For example, if the subject of learning assessment of a course is discussed, the analysis is usually carried out at the end of each period [37]. In another case, if the objective is to follow up on a student, the analysis must be quick and effective, in such a way that actions are taken before the student is considered a case of desertion. This consideration allows the establishing of an architecture based on Hadoop as the main actor, which is an open source framework and a large amount of information is available for its implementation. In the case that a real-time analysis is needed, it is necessary to think about another alternative, such as Spark, which, the same as Hadoop, is a framework based on Apache [38]. Its main characteristic is the analysis in real time and is an ideal application in the management of physical security within the campus. This work, being focused on the detection of student patterns in an adaptive education model, does not need the analysis to be in real time; for this reason, the choice for the analysis is based on Hadoop.

3.4. Model for Data Analysis in a University Environment

Based on the components mentioned in the previous sections, a comprehensive data analysis model is proposed that contributes to the detection of students’ needs. In Figure 3, a solution that is composed of layers is presented. In the layer of interaction and capture of events are all possible data sources—as it is a generic architecture, it is coupled to any type of infrastructure [39]. This layer is intended to collect all the information from both traditional systems and sensors and actuators found within the university campus. In addition, the university’s social networks are considered sources of data, which allows any event or information generated from a career or university to have followers and detractors. By performing an analysis of this information, the level of acceptance can be obtained and decisions based on these results can be made.
The storage, communication, and production layer refers to how the various data sources handle data. Each data source stores and processes information according to its initial guidelines; for example, the financial system stores its data in a relational database and the entire process carried out by the application is done on this database [40]. The data analysis layer through big data will have to obtain certain relevant information in the analysis of psychosocial variables to establish the causes of its performance. Another source of data such as IoT devices generally use cloud computing to process the data. In this architecture, the data that are sent to the cloud are synchronized with a private cloud in order to consume the data and guarantee their availability.
The data analysis layer integrates the Hadoop framework; all information processing is done in this layer. Hadoop responds to a cluster model where a machine acts as the master and manages several slaves that are in charge of data processing and analysis.
The services and presentation layer adds value to data analysis, interpreting the information and generating knowledge about the results. The knowledge is presented to the administrative and academic management areas of the university. In addition, the results can be consumed by other systems, such as recommendation systems that include artificial intelligence (AI) or expert systems.

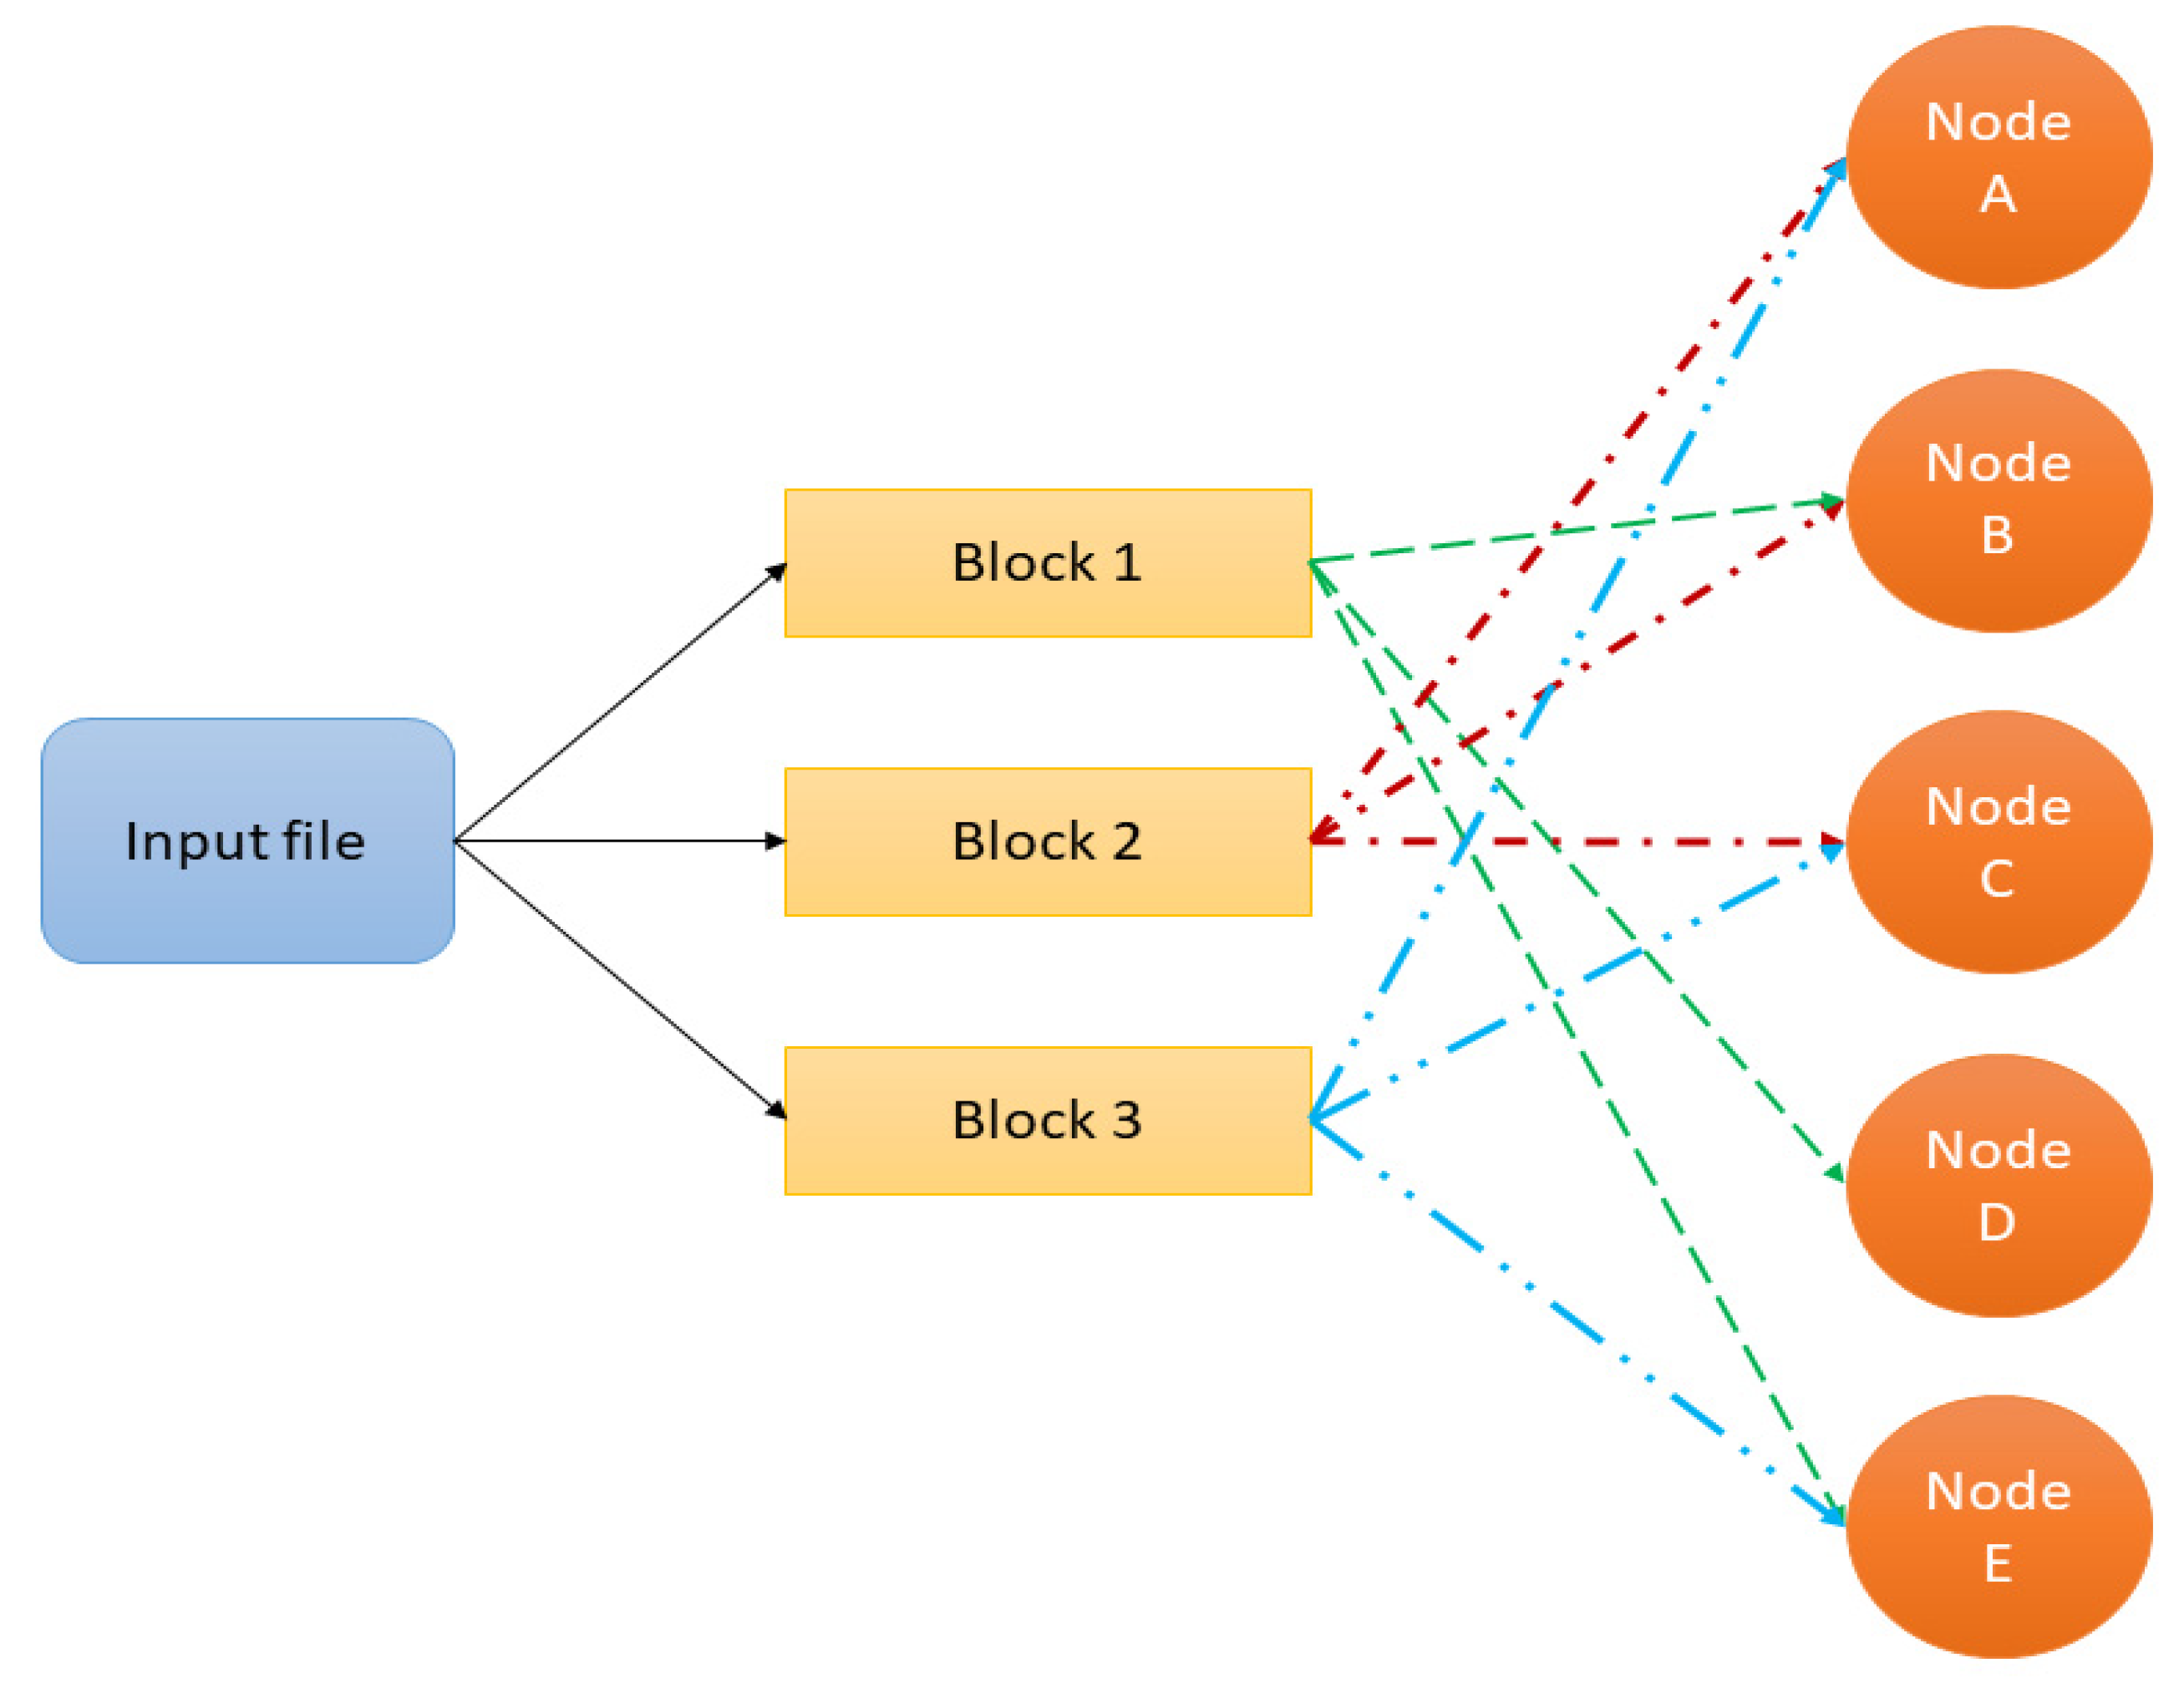
3.5. Deployment of a Big Data Framework

In the deployment of the big data framework, the principles of the tools that are used must be established. For this, it is necessary to define Hadoop as an open source system that has special characteristics in the storage, processing and analysis of large volumes of data [41]. Its advantages of use in large environments are made valid by presenting a parallel programming. In addition, it has an ecosystem that allows files to be distributed in nodes, which are nothing more than computers with commodity hardware [42]. This feature allows processes to run in parallel at all times. Hadoop in its basic version relies on two basic components—a distributed file system (HDFS) and MapReduce.
HDFS allows the data file to be able to distribute the information to different devices, as opposed to being saved on a single machine [43]. The data are then distributed across hundreds or thousands of nodes for processing. This is where redundancy is provided and data are repeated or replicated across multiple nodes and fault tolerance. If any node fails it is automatically replaced, as shown in Figure 4.
MapReduce is a working framework that makes it possible to isolate the programmer from all the tasks of parallel programming [44]. That is, it allows the easy development of applications and algorithms under the Java language for the distributed processing of large amounts of data. Within the ecosystem, the applications developed for the MapReduce framework are known as jobs. These are made up of three functions that can be seen in Figure 5. The Map is in charge of dividing the processing units to be executed in each node and distributing them for parallel execution [45]. Each call will be assigned a list of key/value pairs. A shuffle and sort function mixes the results of the previous stage with all the key/value pairs to combine them in a list and in turn they are sorted by key. The next step is to reduce—i.e., receive all keys and lists of values, adding them if necessary [46].

3.6. Integration of a Big Data Model in Adaptive Learning

Adaptive learning has a direct relationship with the use of ICT since it uses them to store and collect information. ICT allows the creation of specific learning routes for each student, combining the data generated by the student’s activity with statistical information and generating patterns and predefined responses based on the study of the degree of efficiency and frequency with which the student completes their tasks [36,47]. Each activity that the student performs leaves a fingerprint, which is represented in the data. An adaptive model, to offer a personalized education, must, in its architecture, be scalable with the ability to handle not only a large volume of data, but also a great variety of them [48]. The variety of data allows scaling of the analysis and integrating other data sources that extract information with the use of technologies such as the IoT or social networks. The integration of technologies has become a very powerful tool to provide any university with the possibility of improving its personalized learning models adjusted to the needs that each student presents. With this reference, the use of an architecture based on the use of big data is understandable—it takes the lead in monitoring the student. This is something that, in traditional education models, where analysis and decision-making depend on people, is almost impossible to do due to its own limitations [49]. In addition, that certain evaluation criteria may be biased to the criterion of the evaluator.
An adaptive learning model, which uses data analysis to detect deficiencies in a student’s academic performance, guarantees the quality of the entire process. However, universities are obliged to compromise the use of ICT in all their educational models since the generation of data depends on this use. The greater the use of the different systems of the university, the more the model will learn from students to personalize education [19,50]. This learning capacity of the model is achieved through a series of data mining algorithms that count the results of the students [51]. The time they have invested into getting them, the mistakes they have made and their personal performance are compared with the rest of the students in a digital environment.
Compared to the traditional educational models, educational models that use ICT offer an advantage that highlights their ubiquity [47,52]. The omnipresence of devices linked in one way or another to ICT, and their frequent use, allows adaptive learning to be carried out both inside and outside the classroom. An example of this is education through the Bring Your Own Device (BYOD) initiative, which takes advantage of students’ technological devices as a source of learning.
In Figure 6, a flow diagram is presented that details the entire process for detecting student needs through a data analysis model. The process begins with a request or a question about the status of a group or a student who has a problem regarding academic performance. This request can be made by a person such as a teacher or a department in charge of academic quality; even the request can be generated by the same system when it detects that a student is having a poor performance. The big data model extracts the data that feed the analysis variables. The data considered depends on the type of question asked; this clarification is important to determine if it is structured or unstructured data. The extracted data are processed and analyzed by the big data Hadoop framework and the processing includes the cleaning of the data that guarantees the quality of the results [53,54]. The processed data are analyzed by means of various big data tools that make comparisons, cross information, projections, etc.
The analysis allows the identification of the patterns that are presented in the data; with these results it is possible to classify the individuals by means of data mining algorithms that detect in a granular way the possible problems that exist in a certain population [41]. In the following flow, the model performs a validation of the results. If there is a variable that does not correspond or the inclusion of data from other sources is necessary, the process returns to the stage of “Process of the request”, where they are loaded again the data corresponding to the validation carried out. On the contrary, if the validation is correct, the process continues the flow to the next level where it prepares the results by means of different tools established in the big data model [55].
The following flow presents the results; this is done through dashboards where those in charge of academic quality can add different variables that allow projections to be made regarding a possible solution. In addition, the model interacts autonomously with each student and, through notifications, puts both their performance and what are the recurring failures in learning development. With the presentation of results, the following flow focuses on decision-making. Generally, this is put in charge of the tutors, directors or academic departments, who are in charge of adjusting the resources and activities to the needs found in the students. Finally, a validation of the results obtained from the students in the new activities is carried out, which were adjusted based on the analysis carried out. If there is no change in learning, the process returns to the flow of the presentation of results where it verifies the activities and resources with the results, adjusts them and continues with the main flow. If the assessment determines that the learning activities were tailored to the student’s needs by enhancing learning, the process comes to an end.

4. Results

4.1. Description of the Application Environment and Population Considered

The model proposed in this work was applied in a controlled environment, which is part of the university that participates in this study. To evaluate the scalability of the model, it was applied in two educational models that are part of the university’s academic proposal. The modalities are online education and a face-to-face education model. The two modalities share certain resources, such as technological infrastructure, services, educational platforms, and the institution’s social networks. The differences were centered on the model since in the online education model learning is part of the central activities of each student who has the possibility of interacting with a tutor on a previously assigned schedule that generally includes one hour a week. The tutoring session was optional and the policy was that it mainly solves doubts that the student encountered during the week about the previous review that I carried with the resources established by the tutor and that serve as the resolution of the activities that this proposes. In a face-to-face education model, which this year has not been applied due to the pandemic that affects society, it is characterized because its teaching model is mainly based on the experience and knowledge of the teacher. The role that the teacher plays in this modality includes what he wants the student to learn, as well as how he wants him to do it.
The infrastructure for both cases is unique, centered on an enterprise architecture. An educational platform that contributes to learning is the university’s LMS. In the LMS, the subjects are structured turning them into virtual classrooms, organized in a hierarchical way following the line of each of the careers that each faculty offers. Inside the classrooms, they are organized by means of a generic template composed of modules where the first one provides all the information on the subject and the policies for the use of the platform. From the second module onwards, each one represents a study week, which amounts to 16 modules per study period. Each week is made up of three sections—in the first all the resources developed or referenced by the teacher on the subject to be discussed are placed. The second section describes information relevant to the schedule of tutorials or regular classes in the case of the face-to-face mode; for the online mode the respective programming of the tool used for synchronous tutoring is established. In the third section, all the activities that each student must carry out in the corresponding week are detailed. These activities in the online mode are three compulsories—a forum, a task and a questionnaire-type evaluation. In the face-to-face mode, the activities are proposed at the discretion of the teacher, so they can vary in quantity and in the evaluation mechanism. The online and face-to-face education models have been considered for the analysis in order to obtain a comparison that allows us to take the good things from each of the modalities and to strengthen them based on the results generated by the analysis.
The population considered in the study belongs to the same faculty that offers the same career in both modalities. The career is administration and consists of approximately 500 students. However, only the third level of study and a single subject have been considered to further segment the population. This segmentation leaves a number of 50 students. The subject considered is advanced computing. Of the 50 students included in the study, 24 are part of the face-to-face education modality and 26 are from online education. In this matter, it was detected that there is a greater number of repetitions and even number of dropouts for the third enrollment, a state where students are forced to abandon their studies.

4.2. Data Considered in the Analysis

The first analysis that is run establishes the grades obtained by the students of the two modalities. This comparison, shown in Figure 7, identifies that face-to-face students have better grades. For this, variables such as the time that students interact with the platform and available resources, surveys on the availability and use of office tools were analyzed. Data are the academic systems such as grades and attendance at tutorials and classes.
The horizontal-axis represents the interaction time that students have with IT tools and the vertical-axis represents the general grades in the subject evaluated. The horizontal-axis scale considers the use of IT from at least 2 to 6 h of dedication to the use of IT in the aforementioned subject. The red marks represent the students of the online education modality and the green marks represent the students of the face-to-face modality. The IT refers to the LMSs—the attendance and academic record systems. To provide greater granularity, the data from the surveys passed to the 50 students were added. When processed, it was found that face-to-face students perform better with office tools, as well as a variety of different utilities. In the online mode, satisfaction is low and several students do not use tools such as Excel or have other utilities as shown in Figure 8. In this figure, several changes are observed. One of them is that now the measurement is carried out between the grades obtained by the 50 students in the second week of the 2020-2 period, where a survey was run regarding the availability and use of office tools (Excel, Access, web page designs with templates, etc.). The horizontal-axis in the graph represents the values with which the survey questions were scored, with 1 as the lowest level and 5 as the highest level.
The reason for analyzing this week specifically is that practical evaluations were carried out with the use of office tools; in addition, the resources contain guides on the use of these tools. Once again, after the analysis of the framework, more marked results are obtained in relation to the use of IT tools. Students with high grades mostly belong to the online education model where the teacher is the one who teaches the use of each tool step by step, something that does not happen in online education.
These results are not significant for the purpose of generating an adaptive learning model. Therefore, it is necessary to include a greater number of variables; among these, the data on attendance at classes for face-to-face sessions and tutorials for online education is included in the analysis. After the analysis, it was found that attendance at tutorials and classes do not display a difference that allows the determination of a possible problem. Therefore, a variable is integrated that provides data related to the age of each group. This variable determines that in the online modality the average age is 32 years in relation to the average of the face-to-face modality, which is 20 years. In addition, 93% of the online group worked full hours, as opposed to the face-to-face group that only worked at 1%; none of the latter worked full hours.
The results obtained with the inclusion of several variables allow the identification of certain patterns in the groups and can be related in a general way. Thus, the following scenario is presented. The 26 students of the online modality present a high percentage of low marks, considering 6/10 as an acceptable average mark. This group of students work normal hours and most of them are parents. These results can be a determining factor for the analysis, since, by having a limited time for the development of activities, the understanding of the topics is relative to their qualifications.
The application of the model to a very small scenario serves as a test bed to make the corresponding adjustments. In addition, it allows to establish the correct processing and inclusion of variables in the model without changing the infrastructure of the big data model. The application of data mining algorithms is responsible for the improvement process—by selecting the data that provide information to the analysis hypothesis. To identify the variables that directly affect the detection of patterns in the data, an analysis process was established using the J48 algorithm. For validation, the data provided showed that their efficiency was 94%, as indicated in Table 1.
In addition, from the scenarios so far specified, the data analysis model was evaluated with additional variables in order to measure student learning. For this, at the beginning of the academic period an integrating project was proposed. This project is individual in nature, where the student is the one who proposes the subject under certain mandatory standards. Among these are several deliverables found in the LMS, where you receive feedback from the teacher. These projects are aligned with the fulfillment of the learning results of the subject that, in the analysis, are transformed into classes that are aligned with the learning results of the career.
This integrative project aims to generate a grade and evaluate learning. This is possible by using rubrics that evaluate each stage of the project and in each of the criteria a status is defined, where the student meets the learning outcomes. In this way, it is possible to have a final grade and at the same time evaluate learning. The following example demonstrates the process and then, in the discussion, raises the different changes that must exist in the entire educational model in order to transform it into an adaptive model. The following learning outcomes are part of the subject with which the data analysis model has been evaluated.
  • Identify computer systems, their elements and the interaction between them.
  • Apply the best industry practices in solving basic IT problems.
The learning results of the subject guide the student on the conception of the project topic, objectives, scope, etc. These have been previously designed to align with the learning outcomes of the career and these are aligned with those of the university. With this sequence, it is possible to identify the levels of learning achieved by students. All criteria are part of a rubric evaluated with established marks such as very good, good, fair and insufficient. So far, the application in an LMS such as Moodle is totally transparent, but the LMS allows everything to be aligned to obtain a grade. Therefore, the work is transferred to the big data framework. In Table 2 that is presented, the different learning results aligned to each criterion are added; for example, in the element “Integration of Hardware and Software Infrastructure” two results are aligned with learning, one of the career and one given by the university—in the table they are represented by numbers. Compliance has been marked with X according to the level where it is assumed that a student obtains the learning established in each standard. This process is repeated until the last item in a rubric is reached. Each relationship between elements and learning outcomes is raised in the framework. It is the framework that collects all the information found in the LMS database, creates the connections and establishes an initial state where learning begins to be generated. At the request of the university participating in this study, the official learning outcomes are not described.
In Figure 9, the results of the analysis are presented, where the learning results are analyzed according to each evaluation criterion. In the first criterion, 90.91% of students fulfilled the expected results. In the control board, it is possible to identify each student and how the fluctuation in their learning has been according to the variables integrated in the analysis. It is also possible to integrate a greater number of variables that determine in greater depth the learning performance of each student.

5. Discussion

Data analysis is very important in identifying the needs of students, as it is from here that adaptive learning starts in our proposal. The relationship between the results obtained from the data analysis and a personalized learning model lies in the importance of discovering the elements that need to be improved. As mentioned in previous sections, the analysis starts from an online education model. Although this model presents the use of IT and has a large volume of data, it has not previously been used to improve the academic model. To improve the education model by converting it to an adaptive education model, it is important to transform all the components and groups involved. The model begins once the variables that intervene in learning have been validated. It is important to establish how they influence personalized learning. It is necessary to understand that the learning of any student improves when tools and activities are provided that are adjusted to their abilities and that respond to their significant needs. In fact, an educational model is effective to the extent that it adjusts to the characteristics of each student. Adaptability is the adjustment of one or more characteristics of the learning environment in order to be a model of personalized education. The content and its transmission is adapted to the capacities, way of learning and needs of each student. However, when talking about personalized education, it is necessary to go further, which includes analyzing the greatest number of variables that make up learning (administrative, academic, teaching and student areas).
In this way, and by means of the indicators that the data analysis is capable of generating, it is important to define as a first point the profile of the teacher and their role in the learning model. Its responsibility is modified in an adaptive model and goes from a role where it transmits knowledge to a role where it provides opportunities and incentives to students to build learning. This means that the teacher supports each student individually and the group does so by stimulating interest and motivation, providing feedback and questioning the student to help him achieve a better organization of cognitive structures. This role is of great importance, as it turns the teacher into an experienced companion in learning, since he must ensure that the community of the class has a fluid interaction and that the knowledge that is built both individually and collectively is reliable, without a basis in false conceptions or errors.
The second point includes teaching methodologies—i.e., it identifies which activities in the online education model are not adequate in the development of learning, since there is a high dropout rate. Furthermore, resources are not always aligned for the type of population considered in this work. It is important to propose substantial changes for the transformation of learning. For this, it is necessary to establish adequate educational models such as ultra-learning, which is a strategy for the acquisition of skills and knowledge that is self-directed. Learning strategies are not usually a straight line between point A and point B. Some strategies work well on certain occasions, but not on others, and they work in some contexts for certain people, but not for all. Therefore, ultra-learning is a strategy that must be designed and carved for each person differently. Ultra-learning is self-directed and is about being able to decide what to learn and why to learn it [56]. It is possible to be a self-directed student and go to a regular college to find a better way to learn. On the other hand, you can “teach yourself”.
One of the characteristics of ultra-learning and on which it sets its principles is that the technology, when used correctly, can give you access to knowledge. With this it is important to establish several tactics that fit an ICT-based environment. One of the tactics used for this environment is project development. The projects allow the student to understand how the knowledge or skill that they are seeking to develop is learned. The most remarkable thing about this tactic is that the result of any project is a product. If you take notes in class, you do not have a product, but if you learn to program by creating a computer application, the result is a product that encompasses learning. Another tactic that is executed in the model is the interview with the expert. This method is a good way to meet someone who has mastered the subject you want to learn. The tactic is to ask a series of questions that help you get a better idea of the process to follow and the mistakes you should not make. These tactics are proposed as activities aligned to adaptive learning in order to improve the results of each student. Each tutoring session with students works to cultivate focus and the ability to concentrate. You must learn to eliminate distractions and develop habits to make learning more effective. Working on focus is important—therefore, one of the problems that a lack of focus generates is procrastination, which is leaving what has to be done for later. A very effective technique is to stay focused for 25 min and then take a five-minute break and gradually develop longer focus times. Habits are built little by little and this is a simple technique that is proposed in our model.
The third point considered in the feedback—this is a way of receiving information about the current state of learning. It is a way to document and monitor the learning process. It is important to learn about the types of feedback and when it should be used. The teacher can make use of feedback on the result. This type of feedback indicates, in a general way, how the result is. However, it does not say what can be done to improve—this usually comes in the form of passing/failing. This feedback serves as a way to detect if the expected result is being achieved and to what degree it is doing so. In addition, this feedback requires the use of corrective feedback that informs on what is being done wrong and how to correct it. This is useful if you use the correct teaching materials, which teach the answers and the processes to arrive at those answers.

6. Conclusions

The use of ICT in an education model allows to establish control and verification parameters of the use of academic resources by students. This ability allows obtaining data that, when analyzed, generate knowledge about the difficulties that students face when generating knowledge. The availability of knowledge provides the possibility for those in charge of learning to improve their educational models, taking the student as the main axis.
IT, in addition to the already known advantages, allows the establishment of educational models based on learning and not on passing a subject by grades as it has traditionally been executed. Educational models must necessarily be transformed into adaptive learning models where each activity and resources are adapted to the needs of each student. To achieve this, the integration of new technologies or those we know as emerging is necessary. These allow to broaden the scope of analysis and establish situations where academic development is affected by a completely external variable to those handled in a university. It is in this way that sentiment analysis takes on greater relevance in the profiling of each student, which allows us to offer a personalized education.
The use of a big data framework guarantees the treatment of all types of data; it is necessary to establish that at the moment due to the new reality that society is experiencing, data analysis will take on a greater validity. Thus, organizations are already in search of solutions that allow them to anticipate events similar to those we are experiencing due to COVID-19. For this, IoT devices are being integrated to read variables; however, this is useless without a robust platform that allows the treatment of large volumes of data. For this reason and as has been demonstrated in this work, a framework such as Hadoop is capable of solving the entire environment that is required in data management and allows the establishing of an important nucleus in the transformation of digital universities where adaptive learning is framed in the future of education.

Author Contributions

W.V.-C. contributed to the following: the conception and design of the study, acquisition of data, analysis, and interpretation of data, drafting the article and approval of the submitted version. The authors M.R.-C. and A.J.-A. contributed to the study by design, conception, interpretation of data, and critical revision. X.P.-P. made the following contributions to the study: analysis and interpretation of data, approval of the submitted version. All authors have read and agreed to the published version of the manuscript.

Funding

This research received no external funding.

Conflicts of Interest

The authors declare no conflict of interest.

References

  1. Vasconcelos, F.H.L.; Da Silva, T.E.V.; Mota, J.C.M.; Silva, T.E.V. Multilinear Educational Data Analysis for Evaluation of Engineering Education. IEEE Lat. Am. Trans. 2015, 13, 2785–2791. [Google Scholar] [CrossRef]
  2. Katz, I.R. Testing Information Literacy in Digital Environments: ETS’s iSkills Assessment. Inf. Technol. Libr. 2007, 26, 3–12. [Google Scholar] [CrossRef] [Green Version]
  3. Fathema, N.; Shannon, D.; Ross, M. Expanding The Technology Acceptance Model (TAM) to Examine Faculty Use of Learning Management Systems (LMSs) In Higher Education Institutions. J. Online Learn. Teach. 2015, 11, 210–232. [Google Scholar]
  4. Hill, J.R.; Hannafin, M.J. Teaching and learning in digital environments: The resurgence of resource-based learning. Educ. Technol. Res. Dev. 2001, 49, 37–52. [Google Scholar] [CrossRef]
  5. Cook, D.J.; Augusto, J.C.; Jakkula, V.R. Ambient intelligence: Technologies, applications, and opportunities. Pervasive Mob. Comput. 2009, 5, 277–298. [Google Scholar] [CrossRef] [Green Version]
  6. Hassan, R. Network Time and the New Knowledge Epoch. Time Soc. 2003, 12, 225–241. [Google Scholar] [CrossRef] [Green Version]
  7. Leidner, D. Globalization, culture, and information: Towards global knowledge transparency. J. Strat. Inf. Syst. 2010, 19, 69–77. [Google Scholar] [CrossRef]
  8. Amory, A.; Seagram, R. Educational game models: Conceptualization and evaluation. S. Afr. J. High. Educ. 2004, 17, 206–217. [Google Scholar] [CrossRef]
  9. Literat, I. Implications of massive open online courses for higher education: Mitigating or reifying educational inequities? High. Educ. Res. Dev. 2015, 34, 1164–1177. [Google Scholar] [CrossRef]
  10. Villegas-Ch, W.; Luján-Mora, S. Analysis of data mining techniques applied to LMS for personalized education. In Proceedings of the IEEE World Engineering Education Conference (EDUNINE), Santos, Brazil, 19–22 March 2017; pp. 85–89. [Google Scholar]
  11. Cohen, J. Parents as Educational Models and Definers. J. Marriage Fam. 1987, 49, 339–351. [Google Scholar] [CrossRef]
  12. Kanwar, A.; Kodhandaraman, B.; Umar, A. Toward Sustainable Open Education Resources: A Perspective From the Global South. Am. J. Distance Educ. 2010, 24, 65–80. [Google Scholar] [CrossRef]
  13. Huang, Y.-M.; Liang, T.-H.; Su, Y.-N.; Chen, N.-S. Empowering personalized learning with an interactive e-book learning system for elementary school students. Educ. Technol. Res. Dev. 2012, 60, 703–722. [Google Scholar] [CrossRef]
  14. Li, H.; Liu, S.-M.; Yu, X.-H.; Tang, S.-L.; Tang, C.-K. Coronavirus disease 2019 (COVID-19): Current status and future perspectives. Int. J. Antimicrob. Agents 2020, 55, 105951. [Google Scholar] [CrossRef] [PubMed]
  15. Villegas-Ch, W.; Román-Cañizares, M.; Palacios-Pacheco, X. Improvement of an Online Education Model with the Integration of Machine Learning and Data Analysis in an LMS. Appl. Sci. 2020, 10, 5371. [Google Scholar] [CrossRef]
  16. Villegas-Ch, W.; Luján-Mora, S.; Buenaño-Fernandez, D.; Palacios-Pacheco, X. Big data, the next step in the evolution of educational data analysis. In Proceedings of the Advances in Intelligent Systems and Computing, Libertad, Ecuador, 21–25 July 2018; Volume 721, pp. 138–147. [Google Scholar]
  17. Palacios-Pacheco, X.; Villegas-Ch, W.; Luján-Mora, S. Application of Data Mining for the Detection of Variables that Cause University Desertion. In Proceedings of the Communications in Computer and Information Science, Athens, Greece, 12–13 December 2019; Volume 895, pp. 510–520. [Google Scholar]
  18. Chen, C.-M.; Lee, H.-M.; Chen, Y.-H. Personalized e-learning system using Item Response Theory. Comput. Educ. 2005, 44, 237–255. [Google Scholar] [CrossRef]
  19. Chen, C.-M. Personalized E-learning system with self-regulated learning assisted mechanisms for promoting learning performance. Expert Syst. Appl. 2009, 36, 8816–8829. [Google Scholar] [CrossRef]
  20. Villegas-Ch, W.; Palacios-Pacheco, X.; Buenaño-Fernandez, D.; Luján-Mora, S. Comprehensive learning system based on the analysis of data and the recommendation of activities in a distance education environment. Int. J. Eng. Educ. 2019, 35, 1316–1325. [Google Scholar]
  21. Li, X.; Zhang, F.; Wang, Y. Research on Big Data Architecture, Key Technologies and Its Measures. In Proceedings of the 2013 IEEE 11th International Conference on Dependable, Autonomic and Secure Computing, Chengdu, China, 21–22 December 2013; pp. 1–4. [Google Scholar]
  22. Verma, C.; Pandey, R. Big Data representation for grade analysis through Hadoop framework. In Proceedings of the 2016 6th International Conference—Cloud System and Big Data Engineering (Confluence), Noida, India, 14–15 January 2016; pp. 312–315. [Google Scholar]
  23. Villegas-Ch, W.; Palacios-Pacheco, X.; Ortiz-Garcés, I.; Luján-Mora, S. Management of educative data in university students with the use of big data techniques. Rev. Ibérica Sist. Tecnol. Informação 2019, E19, 227–238. [Google Scholar]
  24. Wijaya, R.; Pudjoatmodjo, B. An overview and implementation of extraction-transformation-loading (ETL) process in data warehouse (Case study: Department of agriculture). In Proceedings of the 2015 3rd International Conference on Information and Communication Technology (ICoICT), Nusa Dua, Indonesia, 27–29 May 2015; pp. 70–74. [Google Scholar]
  25. Kim, T.; Lim, J. Designing an Efficient Cloud Management Architecture for Sustainable Online Lifelong Education. Sustainability 2019, 11, 1523. [Google Scholar] [CrossRef] [Green Version]
  26. Tianbo, Z. The Internet of Things Promoting Higher Education Revolution. In Proceedings of the 2012 Fourth International Conference on Multimedia Information Networking and Security, Nanjing, China, 2–4 November 2012; pp. 790–793. [Google Scholar]
  27. Strohbach, M.; Ziekow, H.; Gazis, V.; Akiva, N. Towards a Big Data Analytics Framework for IoT and Smart City Applications. In Modeling and Optimization in Science and Technologies; Springer: Berlin/Heidelberg, Germany, 2015; Volume 4, pp. 257–282. ISBN 978-3-319-09176-1. [Google Scholar]
  28. Mahmud, M.S.; Huang, J.Z.; Salloum, S.; Emara, T.Z.; Sadatdiynov, K. A survey of data partitioning and sampling methods to support big data analysis. Big Data Min. Anal. 2020, 3, 85–101. [Google Scholar] [CrossRef]
  29. Villegas-Ch, W.; Arias-Navarrete, A.; Palacios-Pacheco, X. Proposal of an Architecture for the Integration of a Chatbot with Artificial Intelligence in a Smart Campus for the Improvement of Learning. Sustainability 2020, 12, 1500. [Google Scholar] [CrossRef] [Green Version]
  30. Márquez-Vera, C.; Morales, C.R.; Soto, S.V. Predicting School Failure and Dropout by Using Data Mining Techniques. IEEE Rev. Iberoam. Tecnol. Aprendiz. 2013, 8, 7–14. [Google Scholar] [CrossRef]
  31. Sun, Y.; Song, H.; Jara, A.J.; Bie, R. Internet of Things and Big Data Analytics for Smart and Connected Communities. IEEE Access 2016, 4, 766–773. [Google Scholar] [CrossRef]
  32. Villegas-Ch, W.; Lujan-Mora, S.; Buenano-Fernandez, D. Application of a Data Mining Method in to LMS for the Improvement of Engineering Courses in Networks. In Proceedings of the 10th International Conference of Education, Research and Innovation (Iceri2017), Seville, Spain, 16–18 November 2017; pp. 6374–6381. [Google Scholar]
  33. Villegas-Ch, W.; Luján-Mora, S.; Buenaño-Fernandez, D. Data mining toolkit for extraction of knowledge from LMS. In Proceedings of the ACM International Conference Proceeding Series, Moscow, Russia, 18–21 April 2017; Volume 1346, pp. 31–35. [Google Scholar]
  34. Huda, M.; Maseleno, A.; Shahrill, M.; Jasmi, K.A.; Mustari, I.; Basiron, B. Exploring Adaptive Teaching Competencies in Big Data Era. Int. J. Emerg. Technol. Learn. (iJET) 2017, 12, 68. [Google Scholar] [CrossRef]
  35. Kerr, P. Adaptive learning. ELT J. 2016, 70, 88–93. [Google Scholar] [CrossRef]
  36. Janssen, M.; Van Der Voort, H.; Wahyudi, A. Factors influencing big data decision-making quality. J. Bus. Res. 2017, 70, 338–345. [Google Scholar] [CrossRef]
  37. Winter, R.; Winter, R.; Strauch, B. A Method for Demand-driven Information Requirements Analysis in Data Warehousing Projects. In Proceedings of the 36th Annual Hawaii International Conference on System Sciences, Big Island, HI, USA, 6–9 January 2003. [Google Scholar]
  38. Merla, P.; Liang, Y. Data analysis using hadoop MapReduce environment. In Proceedings of the 2017 IEEE International Conference on Big Data (Big Data), Chennai, India, 23–24 February 2017; pp. 4783–4785. [Google Scholar]
  39. Villegas-Ch, W.; Palacios-Pacheco, X.; Luján-Mora, S. Application of a Smart City Model to a Traditional University Campus with a Big Data Architecture: A Sustainable Smart Campus. Sustainability 2019, 11, 2857. [Google Scholar] [CrossRef] [Green Version]
  40. Álvarez-Campana, M.; López, G.L.; Vazquez, E.; Villagra, V.A.; Berrocal, J. Smart CEI Moncloa: An IoT-based Platform for People Flow and Environmental Monitoring on a Smart University Campus. Sensors 2017, 17, 2856. [Google Scholar] [CrossRef] [Green Version]
  41. Saraladevi, B.; Pazhaniraja, N.; Paul, P.V.; Basha, M.S.; Dhavachelvan, P. Big Data and Hadoop-a Study in Security Perspective. Procedia Comput. Sci. 2015, 50, 596–601. [Google Scholar] [CrossRef] [Green Version]
  42. Shvachko, K.; Kuang, H.; Radia, S.; Chansler, R. The Hadoop Distributed File System. In Proceedings of the 2010 IEEE 26th Symposium on Mass Storage Systems and Technologies (MSST), Incline Village, NV, USA, 3–7 May 2010; Volume 26, pp. 1–10. [Google Scholar] [CrossRef]
  43. Cohen, J.; Acharya, S. Towards a more secure Apache Hadoop HDFS infrastructure: Anatomy of a targeted advanced persistent threat against HDFS and analysis of trusted computing based countermeasures. In Proceedings of the Network and System Security NSS 2013; Lecture Notes in Computer Science; Springer: Berlin/Heidelberg, Germany, 2013; Volume 7873, pp. 735–741. [Google Scholar] [CrossRef]
  44. Ghazi, M.R.; Gangodkar, D. Hadoop, MapReduce and HDFS: A Developers Perspective. Procedia Comput. Sci. 2015, 48, 45–50. [Google Scholar] [CrossRef] [Green Version]
  45. Dean, J.; Ghemawat, S. Mapreduce: Simplified data processing on large clusters. Commun. ACM 2008, 51, 107–113. [Google Scholar] [CrossRef]
  46. Dai, W.; Ji, W. A MapReduce Implementation of C4.5 Decision Tree Algorithm. Int. J. Database Theory Appl. 2014, 7, 49–60. [Google Scholar] [CrossRef]
  47. Atif, Y.; Mathew, S.S.; Lakas, A. Building a smart campus to support ubiquitous learning. J. Ambient. Intell. Humaniz. Comput. 2014, 6, 223–238. [Google Scholar] [CrossRef]
  48. Picciano, A.G. The Evolution of Big Data and Learning Analytics in American Higher Education. Online Learn. 2012, 16, 9–20. [Google Scholar] [CrossRef] [Green Version]
  49. Villegas-Ch, W.; Luján-Mora, S. Systematic Review of Evidence on Data Mining Applied to LMS Platforms for Improving E-Learning. In Proceedings of the International Technology, Education and Development Conference, Valencia, Spain, 6–8 March 2017; pp. 6537–6545. [Google Scholar]
  50. Ferguson, R. Learning analytics: Drivers, developments and challenges. Int. J. Technol. Enhanc. Learn. 2012, 4, 304. [Google Scholar] [CrossRef]
  51. Boumiza, S.; Souilem, D.; Bekiarski, A. Workflow approach to design automatic tutor in e-learning environment. In Proceedings of the 2016 International Conference on Control, Decision and Information Technologies (CoDIT), St. Julian’s, Malta, 6–8 April 2016; pp. 263–268. [Google Scholar]
  52. Baicun, W.; Jiyuan, Z.; Xianming, Q.; Jingchen, D.; Yanhong, Z. Research on New-Generation Intelligent Manufacturing based on Human-Cyber-Physical Systems. Chin. J. Eng. Sci. 2018, 20, 29–34. [Google Scholar] [CrossRef]
  53. McHugh, J.; Cuddihy, P.E.; Williams, J.W.; Aggour, K.S.; Vijay, S.K.; Mulwad, V. Integrated access to big data polystores through a knowledge-driven framework. Proc. IEEE Int. Conf. Big Data 2018, 2018, 1494–1503. [Google Scholar]
  54. He, C.; Lu, Y.; Swanson, D. Matchmaking: A New MapReduce Scheduling Technique. In Proceedings of the 2011 IEEE Third International Conference on Cloud Computing Technology and Science, Athens, Greece, 29 November–1 December 2011; pp. 40–47. [Google Scholar]
  55. Mazumdar, S.; Dhar, S. Hadoop as Big Data Operating System—The Emerging Approach for Managing Challenges of Enterprise Big Data Platform. In Proceedings of the 2015 IEEE First International Conference on Big Data Computing Service and Applications, Redwood City, CA, USA, 30 March–2 April 2015 ; pp. 499–505. [Google Scholar]
  56. Hillier, D.; Mitchell, A.; Millwood, R. ‘Change of heart!’: A new e-learning model geared to addressing complex and sensitive public health issues. Innov. Educ. Teach. Int. 2005, 42, 277–287. [Google Scholar] [CrossRef]
Figure 1. Types and sources of data considered in learning analytics in a university.
Applsci 10 07016 g001
Figure 2. Components of an adaptive learning model that use information technology.
Applsci 10 07016 g002
Figure 3. Data analysis model through the use of big data in a university environment [29].
Applsci 10 07016 g003
Figure 4. Structure of a Hadoop distributed file system (HDFS).
Applsci 10 07016 g004
Figure 5. Running MapReduce Parallel Distribution.
Applsci 10 07016 g005
Figure 6. Flow diagram of a data analysis model applied to adaptive learning.
Applsci 10 07016 g006
Figure 7. Analysis of the use of information and communication technology in the administration career in relation to grades per student.
Applsci 10 07016 g007
Figure 8. Analysis of the qualifications of the administration students due to the availability and use of ICT.
Applsci 10 07016 g008
Figure 9. Data analysis based on learning outcomes and their evaluation by criteria.
Applsci 10 07016 g009
Table 1. Stratified cross-validation.
ActionInstancesPercentage of Hits
Correctly Classified Instances14194%
Incorrectly Classified Instances972.115%
Kappa statistic0.91
Mean absolute error0.0598
Root mean squared error0.193
Relative absolute error13.4523%
Root relative squared error40.9465%
Total Number of Instances150
Table 2. Evaluation criteria vs. compliance with learning outcomes.
ElementsVery GoodGoodRegularInsufficient
Hardware and Software Infrastructure IntegrationIntegrates the appropriate concepts in the installation of the Operating System and assembly of computer components in a justified, structured and efficient way.Integrate the concepts in the installation of the Operating System and assembly of computer components in a justified, structured and efficient way.Integrates the concepts in the installation of the Operating System and assembly of computer components in a justified and structured way.Integrates the basic concepts in the installation of the Operating System and assembly of computer components.
Learning outcomes
1XX
2XX
Implementation of a data networkProperly configure the active equipment and manage network standards aligned to the solution of the problemConfigure the active equipment and manage network standards aligned to the solution of the problem.Configure active equipment and manage network standards aligned to the partial solution of the problem.It partially configures the active equipment and handles network standards, but they are not aligned to the solution of the problem.
Learning outcomes
2XX
7XXX
Use IT toolsOptimally uses TI tools in the implementation of networks and infrastructure.Use TI tools in network and infrastructure deployment.Partially use TI tools in network deployment.Use only TI tools.
Learning outcomes
2XX
Get resultsObtains efficient and viable results that provide the solution in a structured way and with technical support.It obtains efficient results that provide the solution in a structured way and with technical support.Obtains partial results with technical support that contribute to the solution.Get results without technical support that do not contribute to the solution.
Learning outcomes
3XXX
7XX
1 = Critical thinking—think clearly and precisely to solve problems or raise ideas, from an informed position, and reach valid conclusions. 2 = Infrastructure implementation—implements technological infrastructures considering the requirements of the organizations. 3 = Enforcement of regulations—evaluates different hardware architectures and software platforms. 7 = Digital Literacy—handles technology and information with ethics and scientific rigor for research.

