Article

Quinoa Sourdough Fermented with Lactobacillus plantarum ATCC 8014 Designed for Gluten-Free Muffins—A Powerful Tool to Enhance Bioactive Compounds

by
Maria Simona Chiş
1,
Adriana Păucean
1,*,
Simona Maria Man
1,
Dan Cristian Vodnar
2,3,
Bernadette-Emoke Teleky
3,
Carmen Rodica Pop
2,
Laura Stan
2,
Orsolya Borsai
4,
Csaba Balasz Kadar
1,
Adriana Cristina Urcan
5 and
Sevastiţa Muste
1
1
Department of Food Engineering, Faculty of Food Science and Technology, University of Agricultural Sciences and Veterinary Medicine of Cluj-Napoca, 3-5 Mănăştur Street, 400372 Cluj-Napoca, Romania
2
Department of Food Science, Faculty of Food Science and Technology, University of Agricultural Sciences and Veterinary Medicine of Cluj-Napoca, 3-5 Mănăştur Street, 400372 Cluj-Napoca, Romania
3
Institute of Life Sciences, University of Agricultural Sciences and Veterinary Medicine Cluj-Napoca, 3-5 Calea Mănăştur, 400372 Cluj-Napoca, Romania
4
Agro Transilvania Cluster, Dezmir, Crişeni Street, FN, 407039 Dezmir, Romania
5
Department of Microbiology and Immunology, University of Agricultural Sciences and Veterinary Medicine, 3-5 Mănăştur Street, 400372 Cluj-Napoca, Romania
*
Author to whom correspondence should be addressed.
Submission received: 10 September 2020 / Revised: 8 October 2020 / Accepted: 9 October 2020 / Published: 14 October 2020

Abstract

:
Lactobacillus plantarum ATCC 8014 was used to ferment quinoa flour, in order to evaluate its influence on the nutritional and rheological characteristics of both the sourdough and muffins. The quantification of carbohydrates and organic acids was carried out on a HPLC-RID system (high-performance liquid chromatography coupled with with refractive index detector), meanwhile HPLC-UV-VIS (high-performance liquid chromatography coupled with UV-VIS detector), AAS (Atomic absorption spectrophotometry), aluminum chloride colorimetric assay, Folin–Ciocalteu, and 1,1-Diphenyl-2-picrylhydrazyl radical scavenging activity (DPPH) methods were used to determine folic acid, minerals, flavonoids, total phenols, and radical scavenging activity, respectively. Two types of sourdough were used in this study: quinoa sourdough fermented with L. plantarum ATCC 8014 and quinoa sourdough spontaneous fermented. The first one influenced the chemical composition of muffins in terms of decreased content of carbohydrates, higher amounts of both organic acids and folic acid. Furthermore, higher amounts of flavonoids, total phenols and increased radical scavenging activity were recorded due to the use of Lactobacillus plantarum ATCC 8014 strain. These results indicate the positive effect of quinoa flour fermentation with the above strain and supports the use of controlled fermentation with lactic acid bacteria for the manufacturing of gluten free baked products.

1. Introduction

Quinoa (Chenopodium quinoa Willd) pseudo-cereal comes from the Andean region and it is considered an ancient grain [1]. Nowadays quinoa is receiving increased attention due to its various nutrients and bioactive compounds and is particularly used to design gluten free products. Celiac disease is defined as a chronic inflammatory autoimmune disorder of the small intestinal mucosa caused by the ingestion of gluten proteins [2] found mainly in wheat, barley, and rye [3]. A gluten free diet could lead to nutritional deficiencies in minerals, vitamins, folate [4], and the use of non-conventional raw materials, such as amaranth and quinoa, could represent new approaches to prevent the aforementioned nutritional deficiencies.
The valuable nutritional quality of quinoa seeds is mainly due to its high concentrations of proteins, minerals, and vitamins [5,6,7]. Quinoa proteins contains essential amino acids (lysine, threonine, and methionine), which are well-balanced and with a highly bioavailability, being superior to that of the common cereals. Its lipids contain unsaturated fatty acids (linoleic and linolenic acids) which are considered healthy [8,9]. Quinoa is also known as a high source of vitamins (folate and tocopherols), minerals (iron, calcium, copper, manganese, and potassium) and other phytochemicals (ecdysteroids, phenolic acids, and flavonoids such as kaempferol and quercetin) [8,9,10,11,12,13,14,15,16,17].
Although the nutritional composition of quinoa was characterized in many research articles, some issues concerning its applications in baking technology have received less attention [8]. Overall, the lack of gluten lead to a low baking quality of quinoa, while flavor, texture and appearance of baking products were generally considered with low or moderate acceptability by consumers [18,19]. Therefore, quinoa flour is considered a promising raw material for gluten-free products, but also a technological challenge for bakers who have to improve the textural and sensorial quality of these products [20].
It is generally recognized that fermentation could be a strategy to overcome these technological challenges [21]. The foremost fermentation used for baking purposes is with sourdough. Even more, it has been proven ideal to obtain bakery products with improved texture, taste, aroma, shelf life and nutritional value [22]. Thus, due to the microbial metabolic dynamics, the use of sourdough in gluten-free products (GF) manufacture may be considered a “tailored made” solution for improving their quality, safety, and acceptability [23].
Some of the beneficial aspects of use of sourdough fermentation are: the decrement of the glycemic response of bread, the improvement of minerals, phytochemicals, and vitamins uptake [24] along with the capacity of the lactobacilli metabolism to produce new functional compounds such as peptides, amino acid derivatives, and exo-polysaccharides [22]. The lactic acid bacteria from sourdough could influence the allergy and intolerance responses of cereal sensitive individuals due to their proteolytic activity [22].
Lactic acid bacteria (LAB) might be considered as cell factories able to deliver bioactive compounds and food ingredients producing improved quality GF products [25,26]. Raw matrix carbohydrates represent a key role in the adaptability of LAB in a new environment. Carbohydrates are the main fraction of flour from which starch, simple sugars, and fiber represent the main components. During milling, starch granules are broken, and the amylose and amylopectin glucose polymers could be hydrolyzed to simple molecules, such as maltose and glucose. During fermentation with LAB, the most important process is the utilization of carbohydrates, as a source of carbon [27], starch degradation being crucial for LAB growth and development [28]. Furthermore, LAB are able to metabolize starch, leading to the drop of the pH in the raw matrix and enhancing the production of organic acids such as lactic and acetic one [29].
It is generally accepted that Lactobacillus plantarum, like all facultative hetero fermentative lactobacilli, ferments hexoses to lactic acid via Embden-Meyerhof-Parnas pathway (EMP) and degrades pentoses and gluconate via the pentose phosphate (PP) pathway, producing acetic acid, ethanol, and formic acid [30,31]. Lactobacillus plantarum ATCC 8014 (Lp) was able to grow in quinoa sourdough, having a good adaptability and being able to improve the amino acids, volatile compounds, and sensory features of the final baked muffins through starch and protein degradation [3].
As supported by a large body of literature, dough fermented by LAB confer high sensory quality to bakery products [32], and they can improve the nutritional value of gluten-free flours [3,24,33]. On the other hand, spontaneous fermentation could lead to variations in the quality of the final baked goods; therefore, the use of selected starters is recommended [34]. Rizzello et al. [1] reported that the use of quinoa sourdough in bread improved the sensorial and textural quality, in terms of lower hardness, higher porosity specific volume, and protein content than the control (wheat bread). In the research published by Di Cagno et al. [35], Lactobacillus sanfranciscensis LS40 and LS41, and Lactobacillus plantarum CF1 were selected and used as sourdough starters for the manufacture of GF bread following a two-step fermentation process. By this approach, the improvement of the nutritional, textural and sensorial characteristics were targeted. The facultative heterofermentative Lactobacillus plantarum was among the dominant lactic acid biota in gluten-free sourdoughs from rice, amaranth, quinoa [36], or buckwheat and teff flour [20,37].
In the present study, quinoa flour fermented with Lactobacillus plantarum ATCC 8014 (Lp) was used as ingredient in gluten-free muffins manufacturing to improve their nutritional characteristics. In order to achieve this goal, the impact of Lp on carbohydrate metabolic conversion to organic acids and rheological features of quinoa sourdough was assessed.

2. Materials and Methods

2.1. Materials

Quinoa wholemeal flour (QWF), rice wholemeal flour (RWF), buckwheat flour, inulin, oatmeal, corn starch, baking powder, maple syrup, and coconut butter were acquired from Romanian specialized stores. Lactobacillus plantarum ATCC 8014 (Lp) was acquired from Microbiologics (St. Cloud, MN, USA). Maltose, glucose, fructose standards were purchased from Sigma Aldrich (Darmstadt, Germany), citric acid from Merck (Darmstadt, Germany) and lactic and acetic acid from Fluka (Saint Louis, MO, USA). All standard compounds were 99.5% pure. Before analysis, all the samples were filtered using a MF-MilliporeTM Membrane Filter (0.45 μm) from Merck (Darmstadt, Germany).

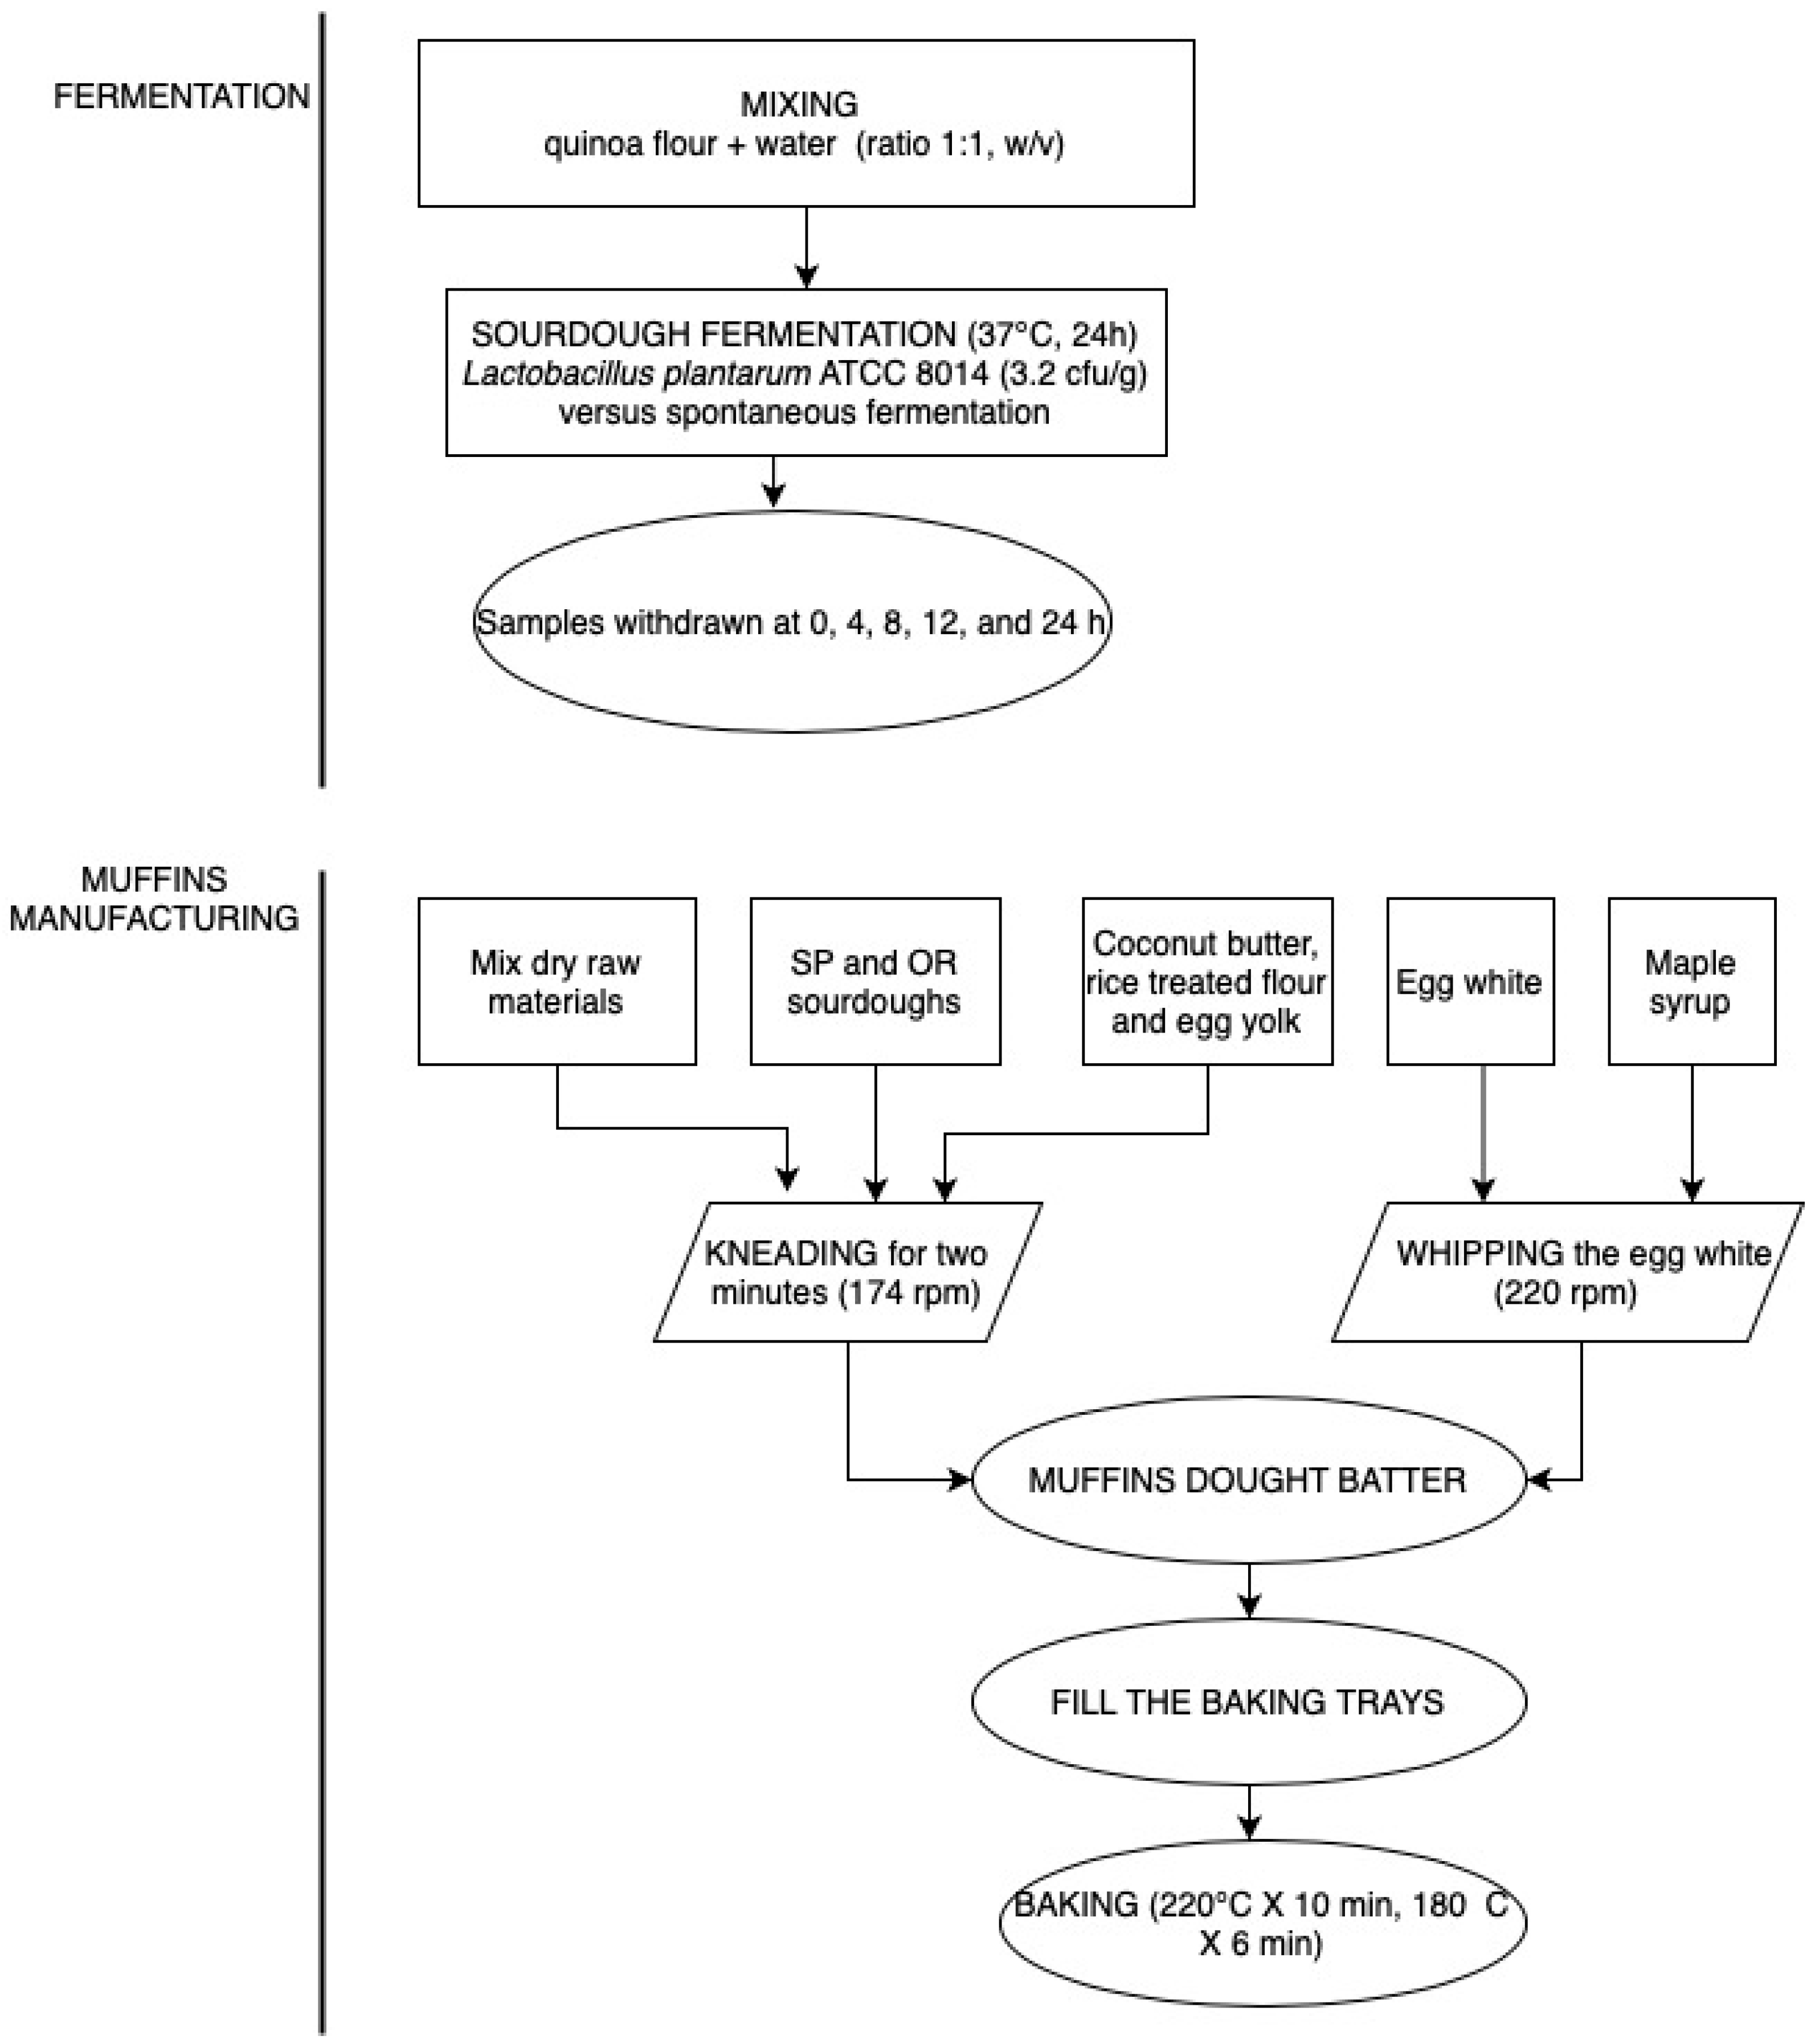
2.2. Microbial Starter Culture Preparation, Sourdough Preparation, and Muffins Formulation

Lactobacillus plantarum ATCC 8014 was purchased in lyophilized form and cultivated during 20 h in MRS (Man Rogosa Sharpe) broth at 37 °C, as reported in our previous study [38]. After that, the obtained biomass was centrifugated (Eppendorf R 5804 centrifuge, Hamburg, Germany) at 2300× g, 10 min, 4 °C and washed three times with sterile water. The SP initial cell concentration was 3.2 cfu/g sourdough. A spontaneous quinoa flour fermentation was used in the present study, as a control. Both sourdoughs were prepared by mixing quinoa flour with tap water in a ratio 1:1 (v:v), until a final dough yield of 200 was reached. The sourdoughs for controled fermentation were collected for prior analysis at 0, 4, 8, 12, and 24 h and coded with SP 0 h, SP 4 h, SP 8 h, SP 12 h, and SP 24 h. For the spontenous fermentation, the following abbreviations were used: OR 0 h, OR 4 h, OR 8 h, OR 12 h, and OR 24 h, respectively.
Muffins recipe was based on the following raw materials (w/w): mix dry raw materials (8% inulin, 10% oatmeal, 7% corn starch, 1.5% baking powder, and 8% buckwheat flour, 32.5% treated RWF), 15% sourdough with Lp strain (SP) or 15% sourdough without Lp strain (OR), eggs (8%), coconut butter (5%), and maple syrup (5%), as illustrated in Figure 1.
RWF was hydrothermally treated in order to improve its textural characteristics, as reported by Chiș et al. [39]. Different fermentation times (0, 12, and 24 h) were used for the muffins preparation with SP sourdough or with OR sourdough. The following codes were used for the final baked muffins manufactured with SP at 0, 12, and 24 h fermentation times: SP PF 0 h, SP PF 12 h, SP PF 24 h, and OR PF 0 h, OR PF 12 h, and OR PF 24 h for muffins with OR, respectively.

2.3. Organic Acids and Glucose, Maltose, and Fructose Determination by HPLC-RID

High-performance liquid chromatography (HPLC-Agilent 1200 series, Santa Clara, CA, USA) equipped with solvent degasser, manual injector coupled with with refractive index detector (RID) (Agilent Techologies, Santa Clara, CA, USA) was used in order to analyze the organic acids and carbohydrates amount. Briefly, 1 g of sample was mixed with 5 mL of ultrapure water, vortexed for 1 min and sonicated for 2 h at 50 °C in a heated ultrasonic bath Elmasonis E 15H (Elma Schmidbauer GmbH, Singen, Germany). After that, the samples were centrifuged at 2300× g for 10 min, in an Eppendorf 5804 centrifuge (Hamburg, Germany), filtered through Chromafil Xtra PA-45/13 nylon filter and 20 µL were injected in the HPLC-RID system.
The compounds were separated on a Polaris Hi-Plex H, 300 × 7.7 mm column (Agilent Techologies, Santa Clara, CA, USA) using the 5 mM H2SO4 mobile phase with a flow rate of 0.6 mL/min, column temperature T = 80 °C and RID temperature T = 35 °C. Elution of the compounds was made for 25 min. Data acquisition and results interpretation was performed using OpenLab software-ChemStation (Agilent Techologies, Santa Clara, CA, USA). The retention times for maltose, glucose, and fructose were 8.87 min, 10.24 min, and 10.88 min, respectively; meanwhile, the retention times for citric, lactic, and acetic acids were 9.39 min, 13.46 min, and 15.92 min, respectively.

2.4. Folic Acid Determination

Determination of folic acid was fulfilled in concordance with [40]. Briefly, an amount of 0.5 g of each sample was diluted with 5 mL of phosphate buffer (Ph = 7). After homogenization in a vortex, the mixtures were sonicated and centrifuged for 30 min at 3000 rpm (Eppendorf 5804, Hamburg, Germany). The supernatant was filtrated with nylon filter (0.45 µm) and 20 µL was injected in HPLC- UV detection (Agilent Technologies 1200 Series, Santa Clara, CA, USA).
A folic acid standard curve (y = 154.79x − 8.1463, R2 = 0.9954) having as minimum and maximum concentration 2 μg/mL and 25 μg/mL, respectively, was used in order to establish the concentration of folic acid, expressed in mg/l supernatant.
The operational parameters of the method were Lichrosphere 100 RP-18, (250 × 4.6 mm, 5 µm) column, mobile phase: ACN/AA 1% pH = 2.8, (20/80, v/v), flow rate: 0.6 mL/min, column temperature: 25 °C.

2.5. Minerals Content

Analysis of Macro and Microelements
Atomic absorption spectrophotometry (AAS) was used in order to determine the amounts of micro and macro elements, as described by [39,40]. Briefly, 3 g of each sample was burned for 10 h in a furnace (Nabertherm B150, Lilienthal, Germany) at a temperature of 550 °C. Afterwards, the ash was recovered in HCl 20% (w/v) in a volumetric flask, in order to achieve a final volume of 20 mL. The resulted samples were analyzed by AAS (Varian 220 FAA equipment, Germany). The results were calculated considering the samples fresh weight basis and expressed as mean value (n = 3) of three independent assays.

2.6. Total Flavonoids

Total flavonoids were determined according to the aluminum chloride colorimetric assay described by [41], adapted for the 96 well microplate reader (Synergy™ HT BioTek Instruments, Winooski, VT, USA). Quercetin was used as reference standard. Briefly, 25 µL of each sample methanolic extracts was mixed for 5 min with 100 µL distilled water and 10 µL of 5% sodium nitrate (NaNO2) solution. Afterwards, 15 µL of 10% aluminum chloride (AlCl3), 50 µL of 1 M sodium hydroxide (NaOH) and 50 µL of distilled water were added. The detection of total flavonoids was set at λ = 510 nm. A standard curve of quercetin was used to establish the final amount of total flavonoids content (y = 0.0003x + 0.0029, R2 = 0.9916). The results were calculated as mg of Qe (quercetin equivalent) per g of extract.

2.7. Total Phenols Assay by Folin–Ciocalteau Reagent

In order to analyze the total phenols amount, 1 g of sample was homogenized with 100 mL acidified methanol (85:15 v:v, MeOH:HCl). Atfer that, the sample was dried at 40 °C by using a vacuum rotary evaporator (Laborota 4010 digital rotary evaporator, Heidolph Instruments GmbH & Co. KG, Schwabach, Germany), according to the method described by [42,43]. Folin–Ciocalteu colorimetric method was used to evaluate the total phenols amount, as follows: 100 μL of methanolic extract was mixed with 500 μL Folin–Ciocalteu reagent, 6 mL of distilled water, and 2 mL of 15% Na2CO3, as described by [34,44]. The solution was brought up to 10 mL by adding distilled water, kept in the dark for two hours at room temperature the absorbance was read at λ = 760 nm with a UV/visible spectrophotometer Schimadzu 1700 (Shimadzu Corporation, Kyoto, Japan). A standard calibration curve of galic acid was used to establish the final amount of total phenols (y = 1.022958x + 0.08740, R2 = 0.99614) and the results were expressed as milligrams of gallic acid equivalent (GAE) per 100 g product.

2.8. Radical Scavenging Activity by DPPH Assay

The radical scavenging activity (RSA) was analyzed by DPPH method (1,1-Diphenyl-2-picrylhydrazyl) method as descriebed previously by [38]. Briefly, 0.1 mL of each methanolic extract was mixed with DPPH solution (3.9 mL), kept in the dark at room temperature for 30 min and recorded at λ = 515 nm, using an UV/visible spectrophotometer Schimadzu 1700 (Shimadzu Corporation, Kyoto, Japan). The following equation was used to calculate the radical scavening activity:
RSA   [ % ]   =   A b s   D P P H A b s   S a m p l e A b s   D P P H 100
where Abs DPPH = absorbance of DPPH solution; Abs Sample = absorbance of the sample.

2.9. Rheological Measurements

The SP and OR sourdoughs dynamic rheological characteristics were determined by using an Anton Paar MCR 72 rheometer (Anton Paar, Graz, Austria), supplied with a Peltier plate-plate system (P-PTD 200/Air) with temperature control and a 50 mm diameter smooth parallel plate geometry (PP-50-67300), according to the method described by [45]. The sourdough samples were analyzed before and after freezing (one week at −20 °C, and then defrosted at room temperature). Shortly, 3 g of sample was applied on the lower plate and the upper one was lowered to a plate distance set at a gap of 1 mm. Silicone oil was used in order to prevent sample moisture loss through testing. The storage modulus (G’) and loss modulus (G’’) of each sourdough at an angular frequency of 0.628–628 rad/s−1 were tested, and the shear strain was set at a constant value of 0.1%, with 35 total measuring points, at a constant temperature of 30 °C.

2.10. Statistical Analysis

Duncan multiple comparison test by SPSS version 19 software (IBM Corp., Armonk, NY, USA) was used in order to analyze the results. All samples were analyzed in triplicates and the results were expressed as means ± standard deviations.

3. Results and Discussion

3.1. Carbohydrates, Organic Acids, Folic Acid, Minerals, Flavonoids, Total Phenols Content, and Radical Scavenging Activity of Quinoa Flour (QF)

3.1.1. Carbohydrates and Organic Acids from Quinoa Wholemeal Flour (QWF)

The values of simple carbohydrates (maltose, glucose, and fructose) and organic acids (lactic, acetic, and citric) of QWF are reported in Table 1. The main carbohydrates from QWF was glucose, followed by fructose and maltose.
The carbohydrate content in quinoa is higher than in the common cereals and might be associated with frost tolerance, as confirmed by [46] who reported that quinoa from mountain region had higher sugar content than those from the valleys region. Likewise, ref. [47] reported that also the method of extraction, the origin of quinoa seeds, cultivation, and environmental stress could also influence the sugars content.
With respect to fructose content, it is known that its consumption could induce oxidative stress, leading to different type of diseases such as obesity, hypertriglyceridemia, and cardiovascular diseases. Pasko et al. [48] showed that although quinoa seeds contain fructose, the seeds are able to reduce the oxidative stress due to its ability to increase MDA (malondialdehyde) level, indicating an intensive lipid peroxidation and protecting plasma against peroxidation. Moreover, reducing the oxidative stress could reduce the free radicals during some pathological states.
In our previous study, we determined a value of 68.2% total carbohydrates [26], close to the value reported by [1] of 67.9% and [49]. The total carbohydrates content in quinoa could vary between 48.6 and 68.1% of dry matter weight and 45.16–59.78%, respectively, as reported by [50,51]. Starch, the major carbohydrate of quinoa, ranges between 32 and 69% of total carbohydrates [52] and is followed by total dietary fiber (7–9.7%) [50] and fermentable sugars (2% from the total carbohydrate amount), as reported by [53].
With respect to organic acids, lactic, and acetic acids could not be found in QWF, but citric acid had a total amount of 8.59 ± 0.30 mg/g f.w. (fresh weight). Citric acid was also identified in quinoa flour by other researchers, in the range of 210–317 mg/100 g d.w., and from 0.40 to 0.71 g/100 g f.w., respectively [47,49].

3.1.2. Quinoa Wholemeal Flour (QWF) Content in Folic Acid

In the present study, the amount of folic acid determined in quinoa flour was 183 ± 0.03 µg/100 g f.w. (fresh weight). The folic acid amount from QF is higher than the folic acid content of wheat flour (10.62 µg/100 g f.w.) and green lentil flour (168.36 µg/100 g f.w.), respectively, as previously reported by Păucean et al. [40]. In general, the folic acid content in pseudo-cereals such as quinoa, is higher than the amount in cereal grains which could range from 29 to 143 µg/100 g f.w. [54]. For example, the raw pearl-millet was reported to have a folic acid content of only 26.2 µg/100 g f.w. Therefore, the researchers’ attention is mainly focused on using raw materials with higher contents in folic acid in food manufacturing.
Many research data show that quinoa flour is as an important nutritional natural food source due to its valuable bioactive compounds such as B vitamin group (especially folic acid, named B9 vitamin), minerals, and essential amino acids [9,50,52,55]. Total folate content of quinoa is reported to be by about ten times higher than in wheat [56].

3.1.3. QWF Minerals Content

Quinoa is very rich in minerals like potassium, calcium, magnesium, zinc, and iron [57,58]. Table 2 displays the mineral content of quinoa flour and its composition in the following macro and microelements: calcium (Ca), magnesium (Mg), potassium (K), iron (Fe), copper (Cu), Zinc (Zn), manganese (Mn), and chromium (Cr). The ash content of quinoa flour could range from 2.4 to 4.8% [50]. In the present study, the ash content of quinoa flour was 2.3% (results previously published [3]). From the quantitative point of view, the main mineral is K (813.92 mg/100 g f.w.), followed by Mg, Ca, Fe, Mn, Zn, and Cu. The K and Mg content amounts are close to the values reported by Silva et al. [50], 926 mg/100 g, and 249.6 mg/100 g, respectively. Variation in different quinoa flour mineral content might be due to the environmental conditions (especially soil mineral availability) [59], fertilizer soil application [50], by the plant genotype [60,61], and also by the removal of the husk during milling process [51].

3.1.4. QWF Flavonoids

In the present study, the flavonoids content of QWF was 997 ± 0.52 mg Qe/100 g fresh weight. Quinoa flour has high flavonoid content that could range from 36.2 to 144.3 mg/100 g dry weight basis [10] but the total amount could be influenced by the extraction temperature, the solvent type used and non-application of ultrasounds [62]. The main flavonoids from quinoa are glycosides of the flavonols, kaempferol, and quercetin [47]. De Carvalho et al. [63] proved that besides quercetin and kaempferol glycosides, protocatechuic acid and a vanillic acid glucoside were also determined in QWF. Isoflavones, particularly Daidzein and Genistein, were found in different amounts in quinoa flour from different origins [64].

3.2. Carbohydrates, Organic Acids, Folic Acid, Minerals, Flavonoids, Total Phenols Content, Radical Scavenging Activity, and Rheological Features from Quinoa Sourdoughs with Lactobacillus plantarum (Lp) ATCC 8014 (SP) and without Lactobacillus plantarum ATCC 8014 (OR)

3.2.1. OR, SP Carbohydrates, and Organic Acids Contents

The OR and SP carbohydrates and organic acids amounts are displayed in Table 3. The glucose content of SP increased in the first 8 h of fermentation due to the starch degradation and conversion into glucose but decreased afterwards. There are two possible processes that could influence the glucose decrement. Firstly, glucose consumption during Lp cellular development and secondly, glucose conversion into lactic acid through via Embden-Meyerhof-Parnas pathway (EMP). On the other side, acetic acid increased during SP fermentation, probably due to the degradation of pentose and gluconate through via the pentose phosphate (PP) pathway [30,31] With respect to SP maltose content, the amount decreased after 24 h of fermentation, as reported in Table 3, reaching a final value of 1.05 mg/g f.w. after 24 h of fermentation.
On the other side, SP fructose content decreased from 4.1 mg/g f.w. to 2.69 mg/g f.w. after 24 h of fermentation. This could be due to the use of fructose by Lp as alternative external electron acceptor and its conversion into mannitol by mannitol dehydrogenase [65].
The SP content of lactic and acetic acids after 24 h of fermentation had a total value of 8.5 mg/g f.w. and 1.40 mg/g f.w., respectively, and the Lp growth during 24 h of fermentation reached a final value of log 6.7 cfu/g [38], thus emphasizing a good adaptability of the strain in the quinoa sourdough. The SP ratio between lactic and acetic acid, named FQ (fermentation quotient) was 6.07, indicating a good ratio between the two organic acids. With respect to OR fermentation, the FQ values was 1.27. This is in line with Montemurro et al. [66] who reported a FQ fermentation of 6.1 at quinoa flour fermented with Lactobacillus plantarum 1A7 strain.
In the case of spontaneous sourdough, in the first 8 h of fermentation the carbohydrates conversion was almost similar to SP. After 8 h of spontaneous fermentation, the carbohydrates conversion lags behind, probably due to the low capacity of wild microbiota to multiply and to produce organic acids. This behavior is reflected by the FQ values compared to the same values for SP and indicate low amounts of lactic and acetic acids.
With respect to the citric acid amount, after 24 h of fermentation the SP’s citric acid content decreased, but there was no significant difference between OR and SP (p < 0.05), as displayed in Table 3. The decrease of citric acid amount could be explained by the ability of Lp strain to use citric acid as an energy supply [45]. However, the Lp preference for energy source is reflected mainly in the use of fructose, decreasing its amount in SP sample from 4.36 to 1.69 mg/g f.w.
Salminen et al. [67] reported that in a raw matrix that contains glucose and fructose, the heterofermentative LABs will mainly use glucose as an energy source to grow and fructose as an electron acceptor. This is in line with [29] who proved that the same strain of Lactobacillus plantarum ATCC 8014 was able to growth in different MRS media supplemented with concentrations of glucose, fructose, sucrose, and maltose, and consumed all types of carbohydrates, although glucose being the easiest fermentable sugar for this strain.
On the other hand, [30] reported an increase amount of glucose and fructose during fermentation of wheat flour with LAB strains such as Lactobacillus reuteri and Lactobacillus brevis, respectively. Furthermore, Lb. reuteri R29 was able to metabolize maltose during sourdough fermentation, resulting in a low amount in the final sample.
Overall, it can be stated that during sourdough fermentation, the utilization of carbohydrates depends on the type of LAB strain which could have preferences towards a certain type of carbohydrates and on the chemical composition of the raw matrix. The fine link between bacterial strain and its favorite substrate is defined by the relationship between LAB and the raw material [68].

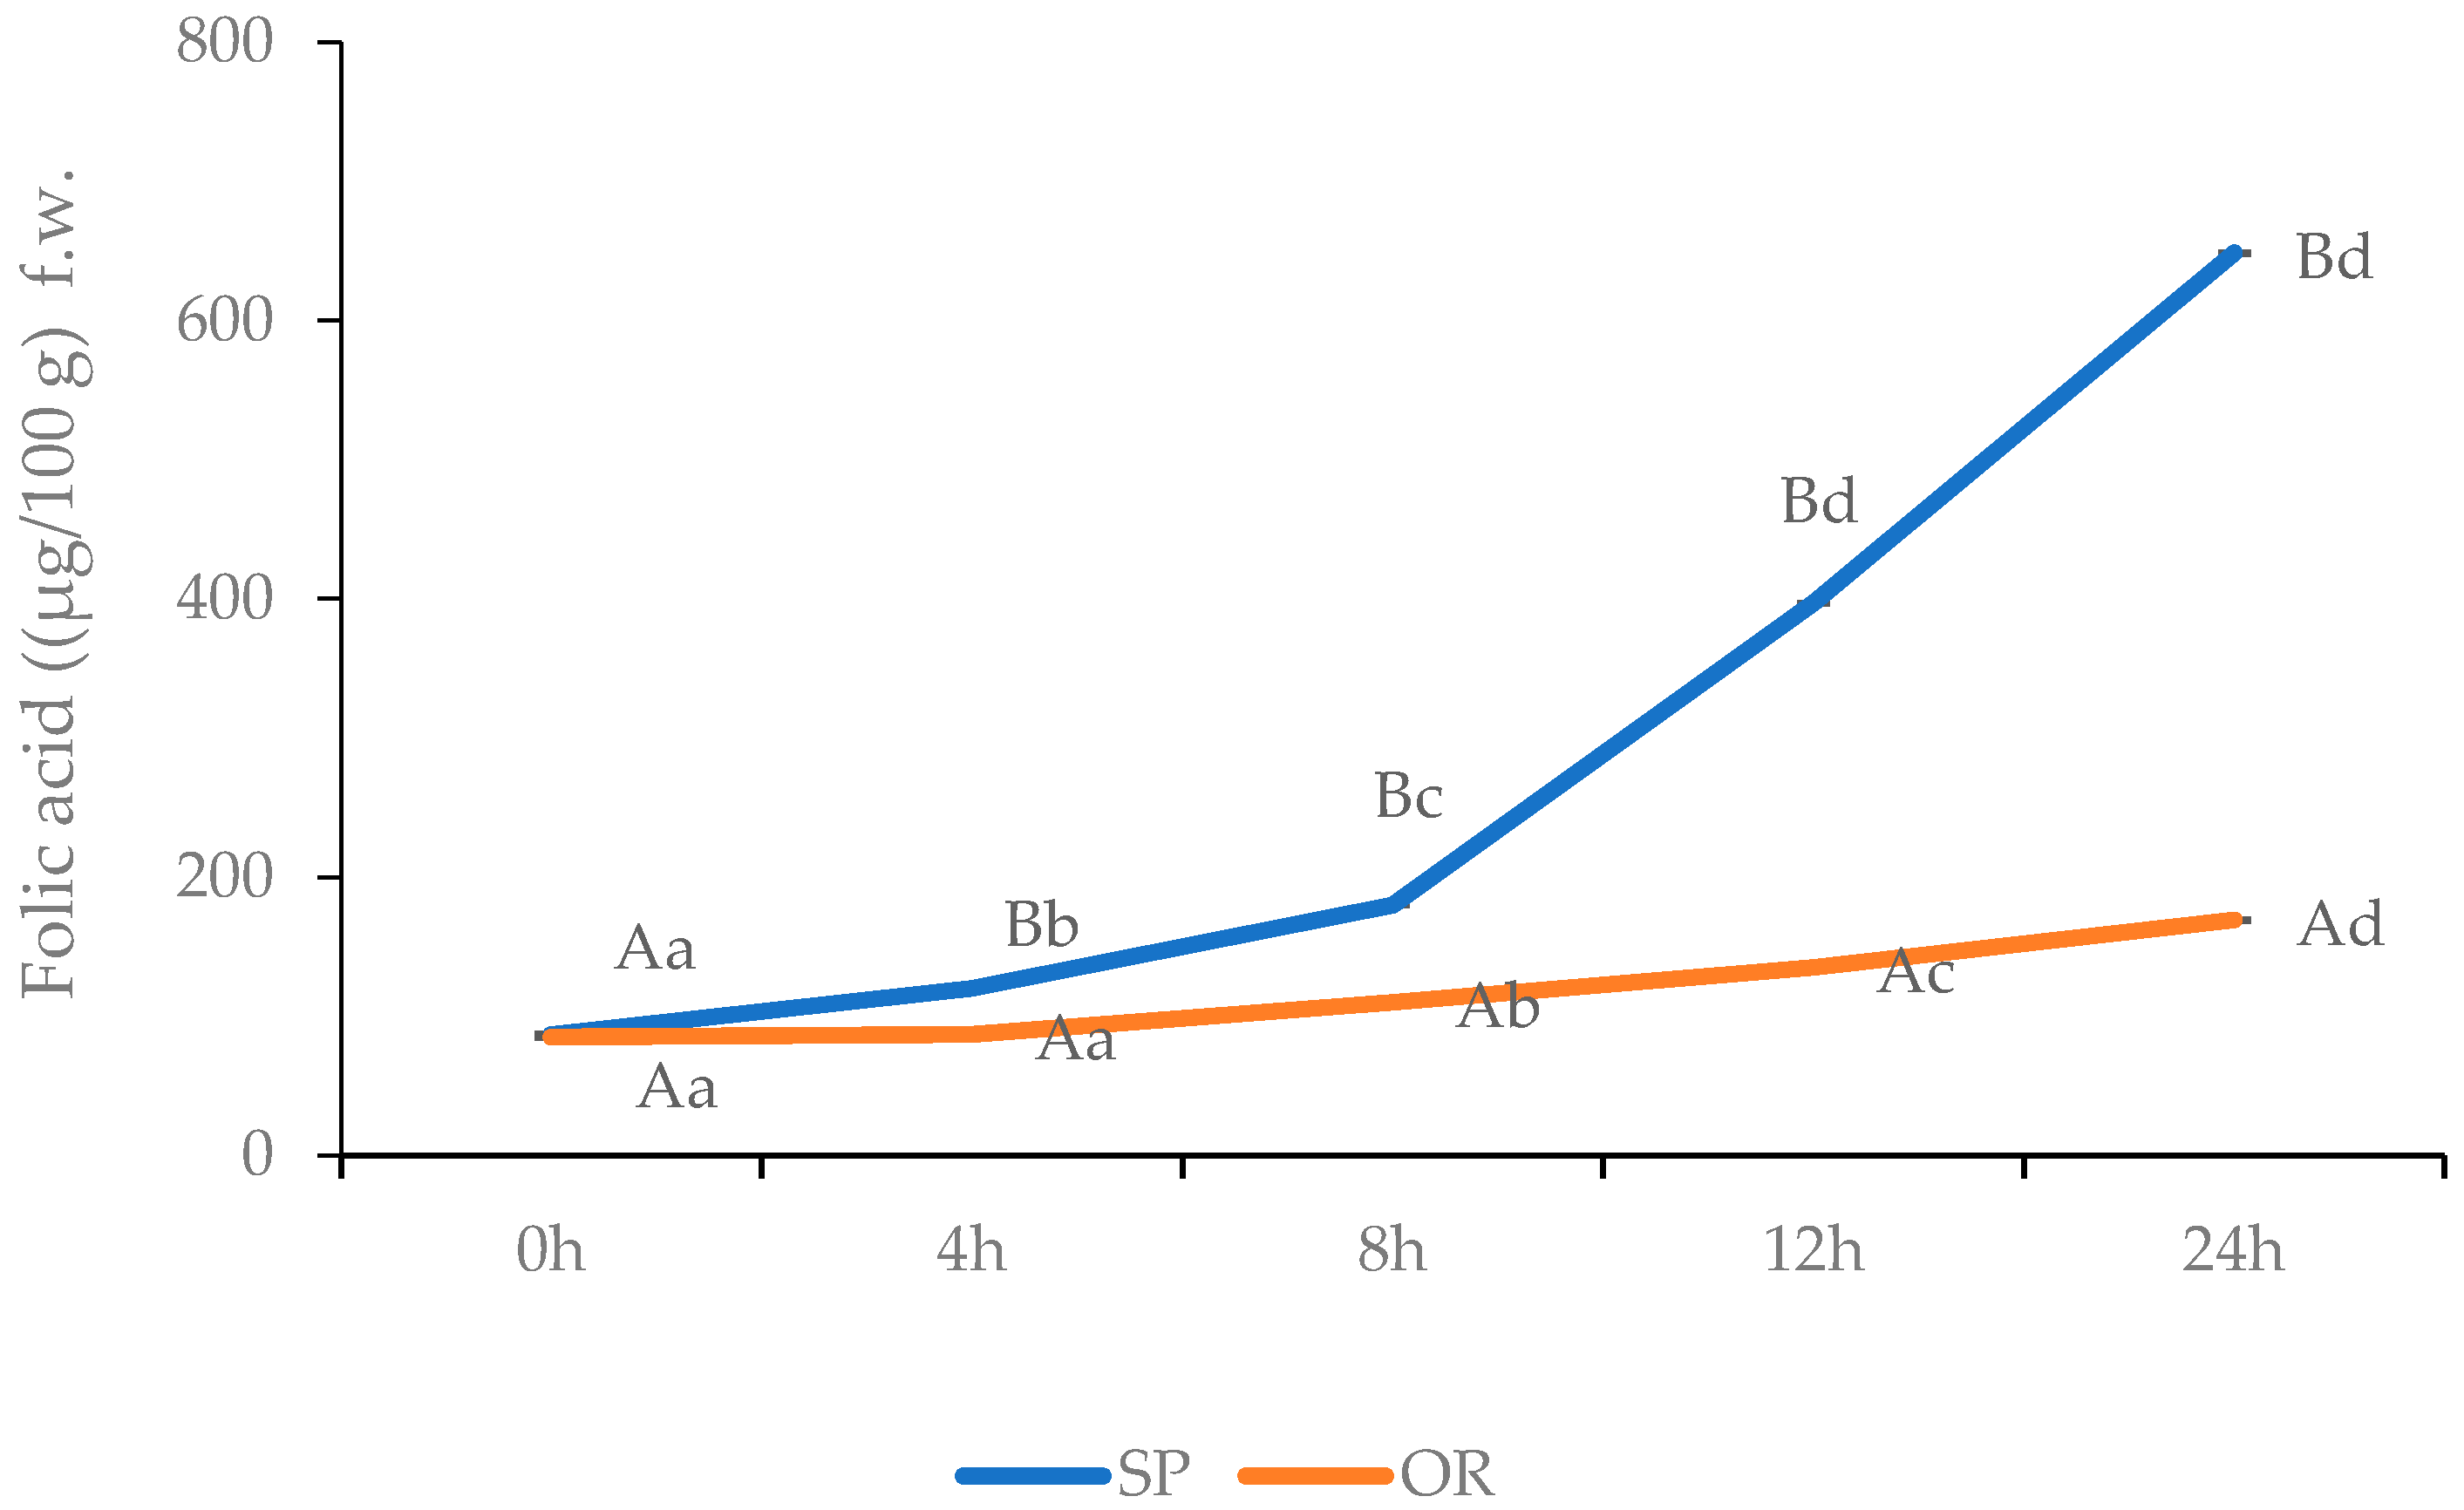
3.2.2. SP and OR folic Acid Content

In the present study, SP folic acid content improved during 24 h of fermentation, having a final value of 648.39 µg/100 g f.w. sourdough compared with OR sourdough, where the total folic acid amount was 169.12 µg/g dough f.w., as illustrated in Figure 2. The SP folic acid content is 3.8 times higher compared with OR sourdough and this is in agreement with [69] who reported that L. plantarum CRL 2107 + L. plantarum CRL 1964 strains are able to improve folic acid content during quinoa flour fermentation.
The capacity of Lactobacillus strains to produce folic acid during fermentation is supported by a large body of literature [70,71,72,73,74]. Likewise, [55] reported that through fermentation of cereal based foods, the folate content could increase up to 700%. Furthermore, [74] showed that Lactobacillus plantarum CRL 1973 strain was able to produce folate during quinoa sourdough fermentation, due to its capability to synthesize B-group vitamins. Other strains of LAB isolated from cereals and seeds from Argen, like Lactobacillus pentosus ES124 and Lactobacillus plantarum ES137 were also reported to be able to produce high amounts of folate [75].

3.2.3. QP and QQ Macro and Microelements Content

During SP fermentation a significant increase of minerals was recorded (Table 4). Potassium content increased by 161.43 mg/100 g, magnesium content reached a maximum value of 294.59 mg/100 g, representing 1.5 times higher than the maximum value of the spontaneous fermented sourdough. Similar trends were recorded for Ca, Fe, and Mn contents for both SP 24 h and OR 24 h with ratios SP 24 h/OR 24 h between 1.5 and 1.6.
Quinoa contains about 1% phytic acid which reduces the bioavailability of magnesium, zinc, iron, and calcium due to the strong connection between phytate and these multivalent metal ions, acting as an excellent chelator of cations. As reported by the literature, phytate chelation of mineral cations could have a negative influence on the bioavailability of essential minerals like zinc, iron, calcium, and magnesium [76].
Several studies demonstrated that fermentation with LAB led to a significant reduction of the phytic acid amount, increasing the concentration of Ca and Mg [77,78].
The increment of mineral content in quinoa sourdough is caused by the diminution of phytic acid due to the acidic pH value, which activates flour endogenous phytase and due to the phytase activity of LAB. In the conditions of our study, after 24 h of fermentation the pH value of the SP was 4.2, compared to pH value of 5.8 for OR [38]. The drop of the pH to 4.2 for SP 24 h after 24 h of fermentation, enhanced lactic acid content, and decreased the phytic acid amount leading to higher amount of minerals such as calcium, potassium, iron, zinc, magnesium, manganese, and chromium. This is in agreement with [79] who proved that during fermentation of quinoa with Lactobacillus plantarum the phytate was tremendously reduced (82–98%) and iron amount increased three to fivefold.
Highlighting this idea, [69] reported that using Lactobacillus plantarum strains for fermenting quinoa sourdough could be considered as a bio-enrichment of it, due to the ability of these strains to increase mineral bioavailability such as Ca, Fe, and Mg, through phytate degradation. This is supported also by [1] who previously demonstrated that quinoa LAB sourdough had a phytase activity 2.75 times higher that raw quinoa flour.

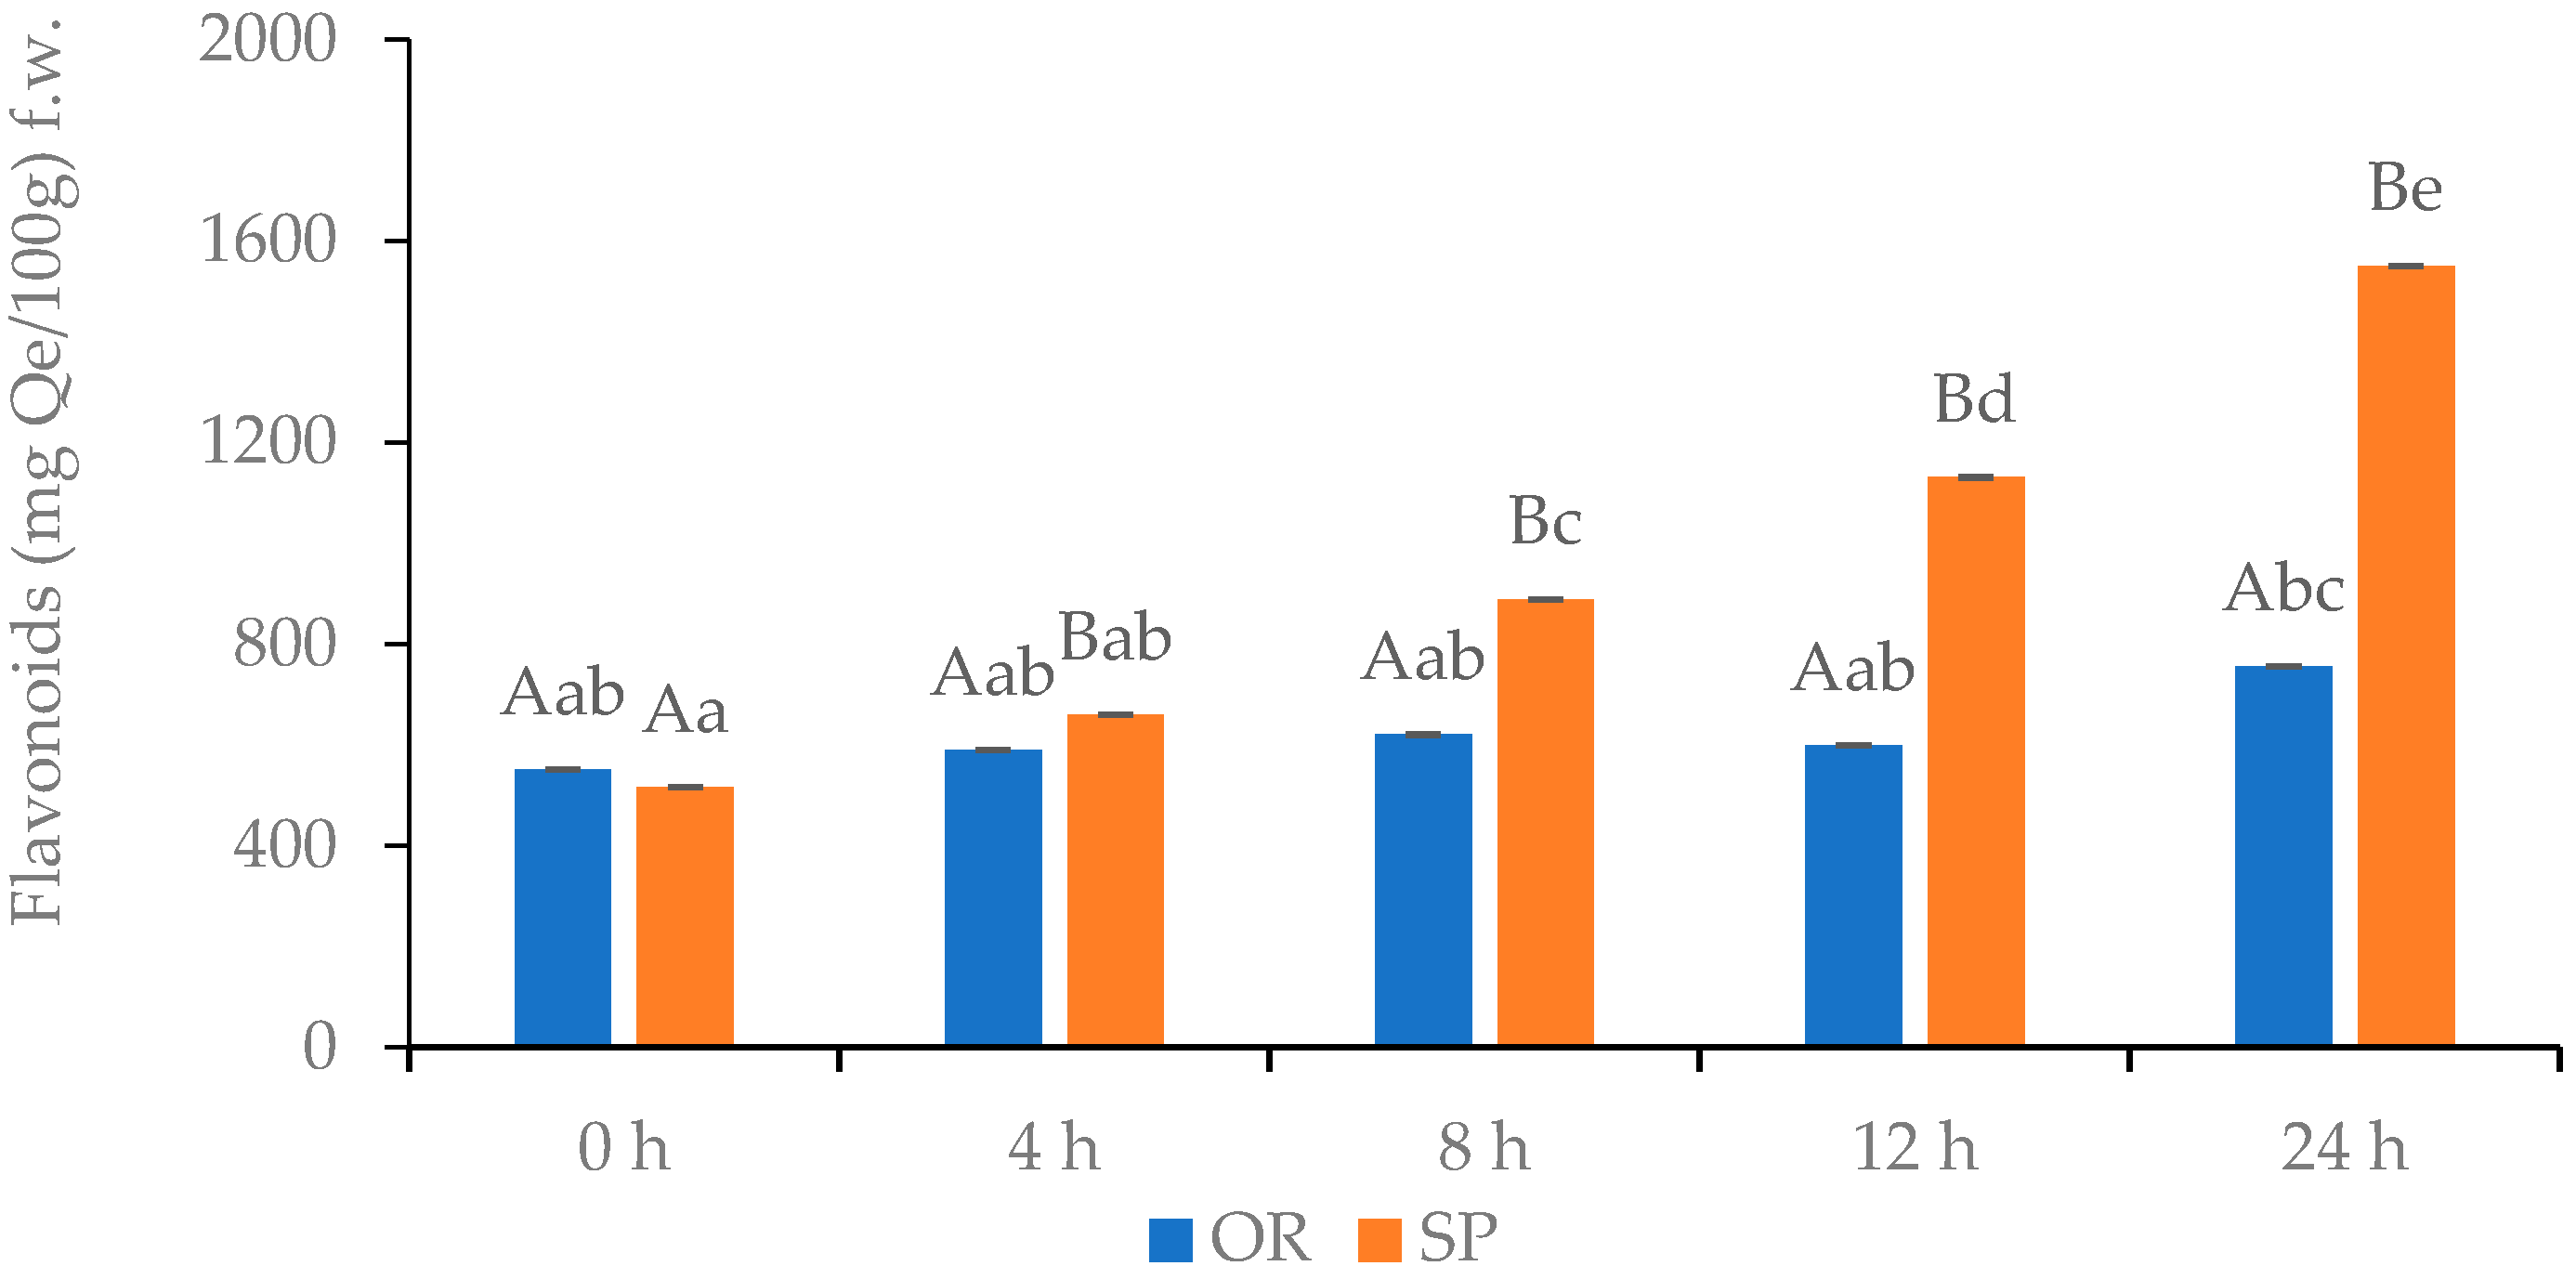
3.2.4. Total Flavonoids Content of OR and SP Sourdoughs

Total flavonoids content of OR and SP sourdoughs are illustrated in Figure 3. The SP flavonoids content increased during 24 h of fermentation, having a total value of 1551 mg Qe/100 g f.w., meanwhile OR 24 h reached a final amount of 757 mg Qe/100 g f.w. This finding is consistent with [80] who reported that during fermentation with Lactobacillus genus the total flavonoid content could improve. Through enzymatic reactions, Lactobacillus strains were able to release from glycosides flavonoids and isoflavone aglycones, respectively [81].

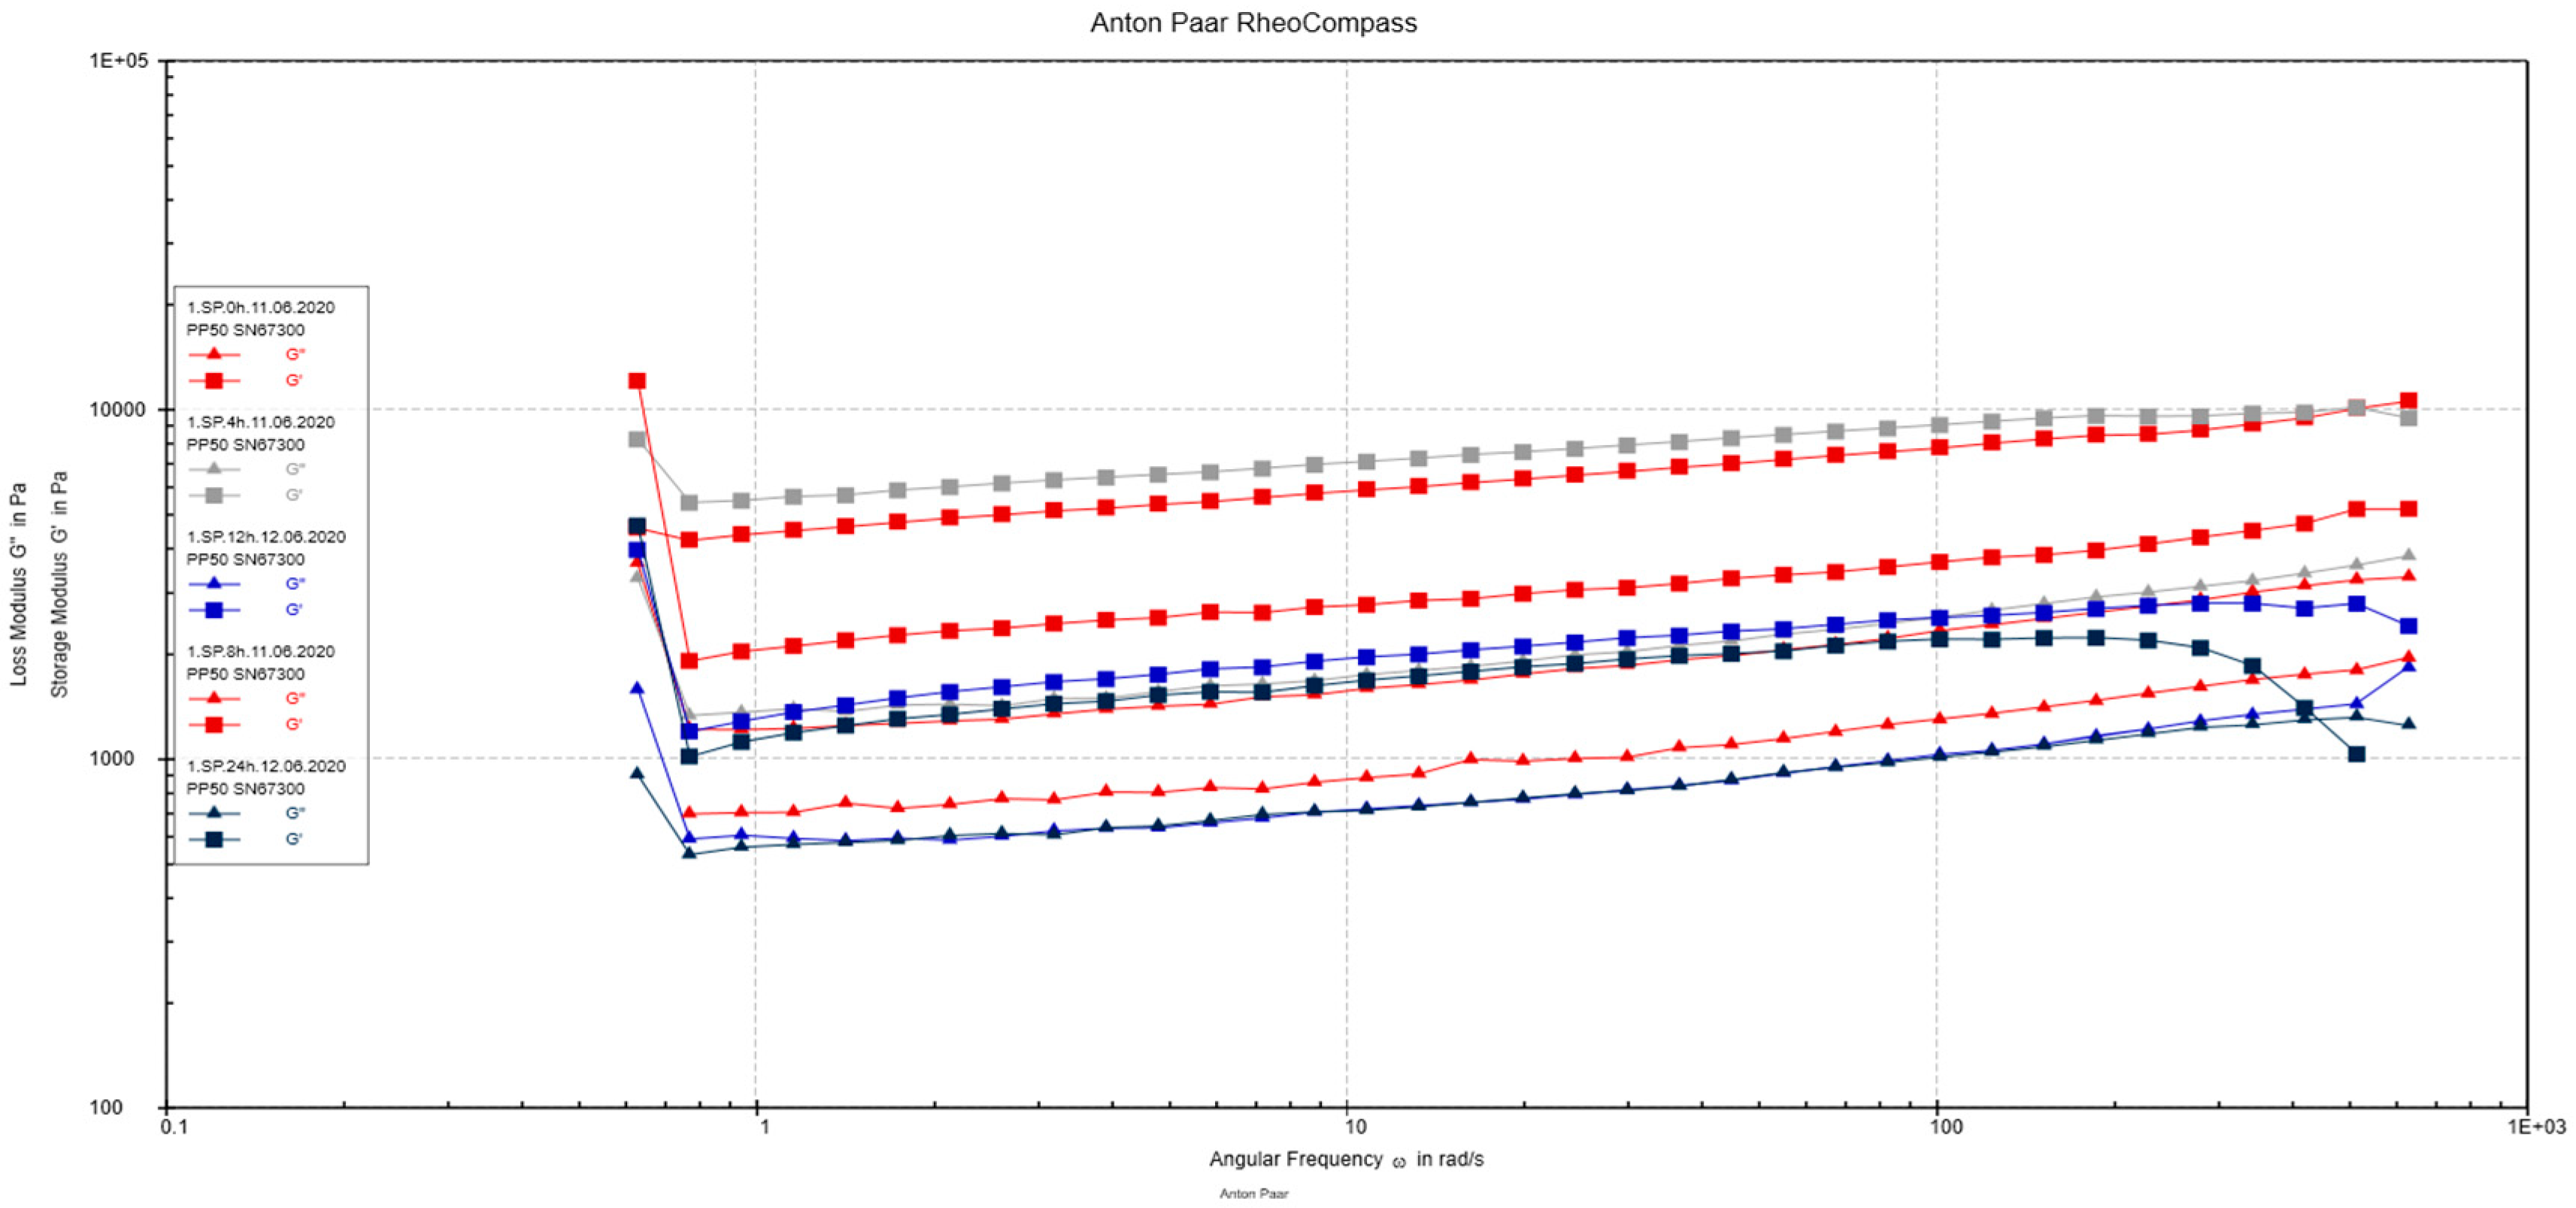
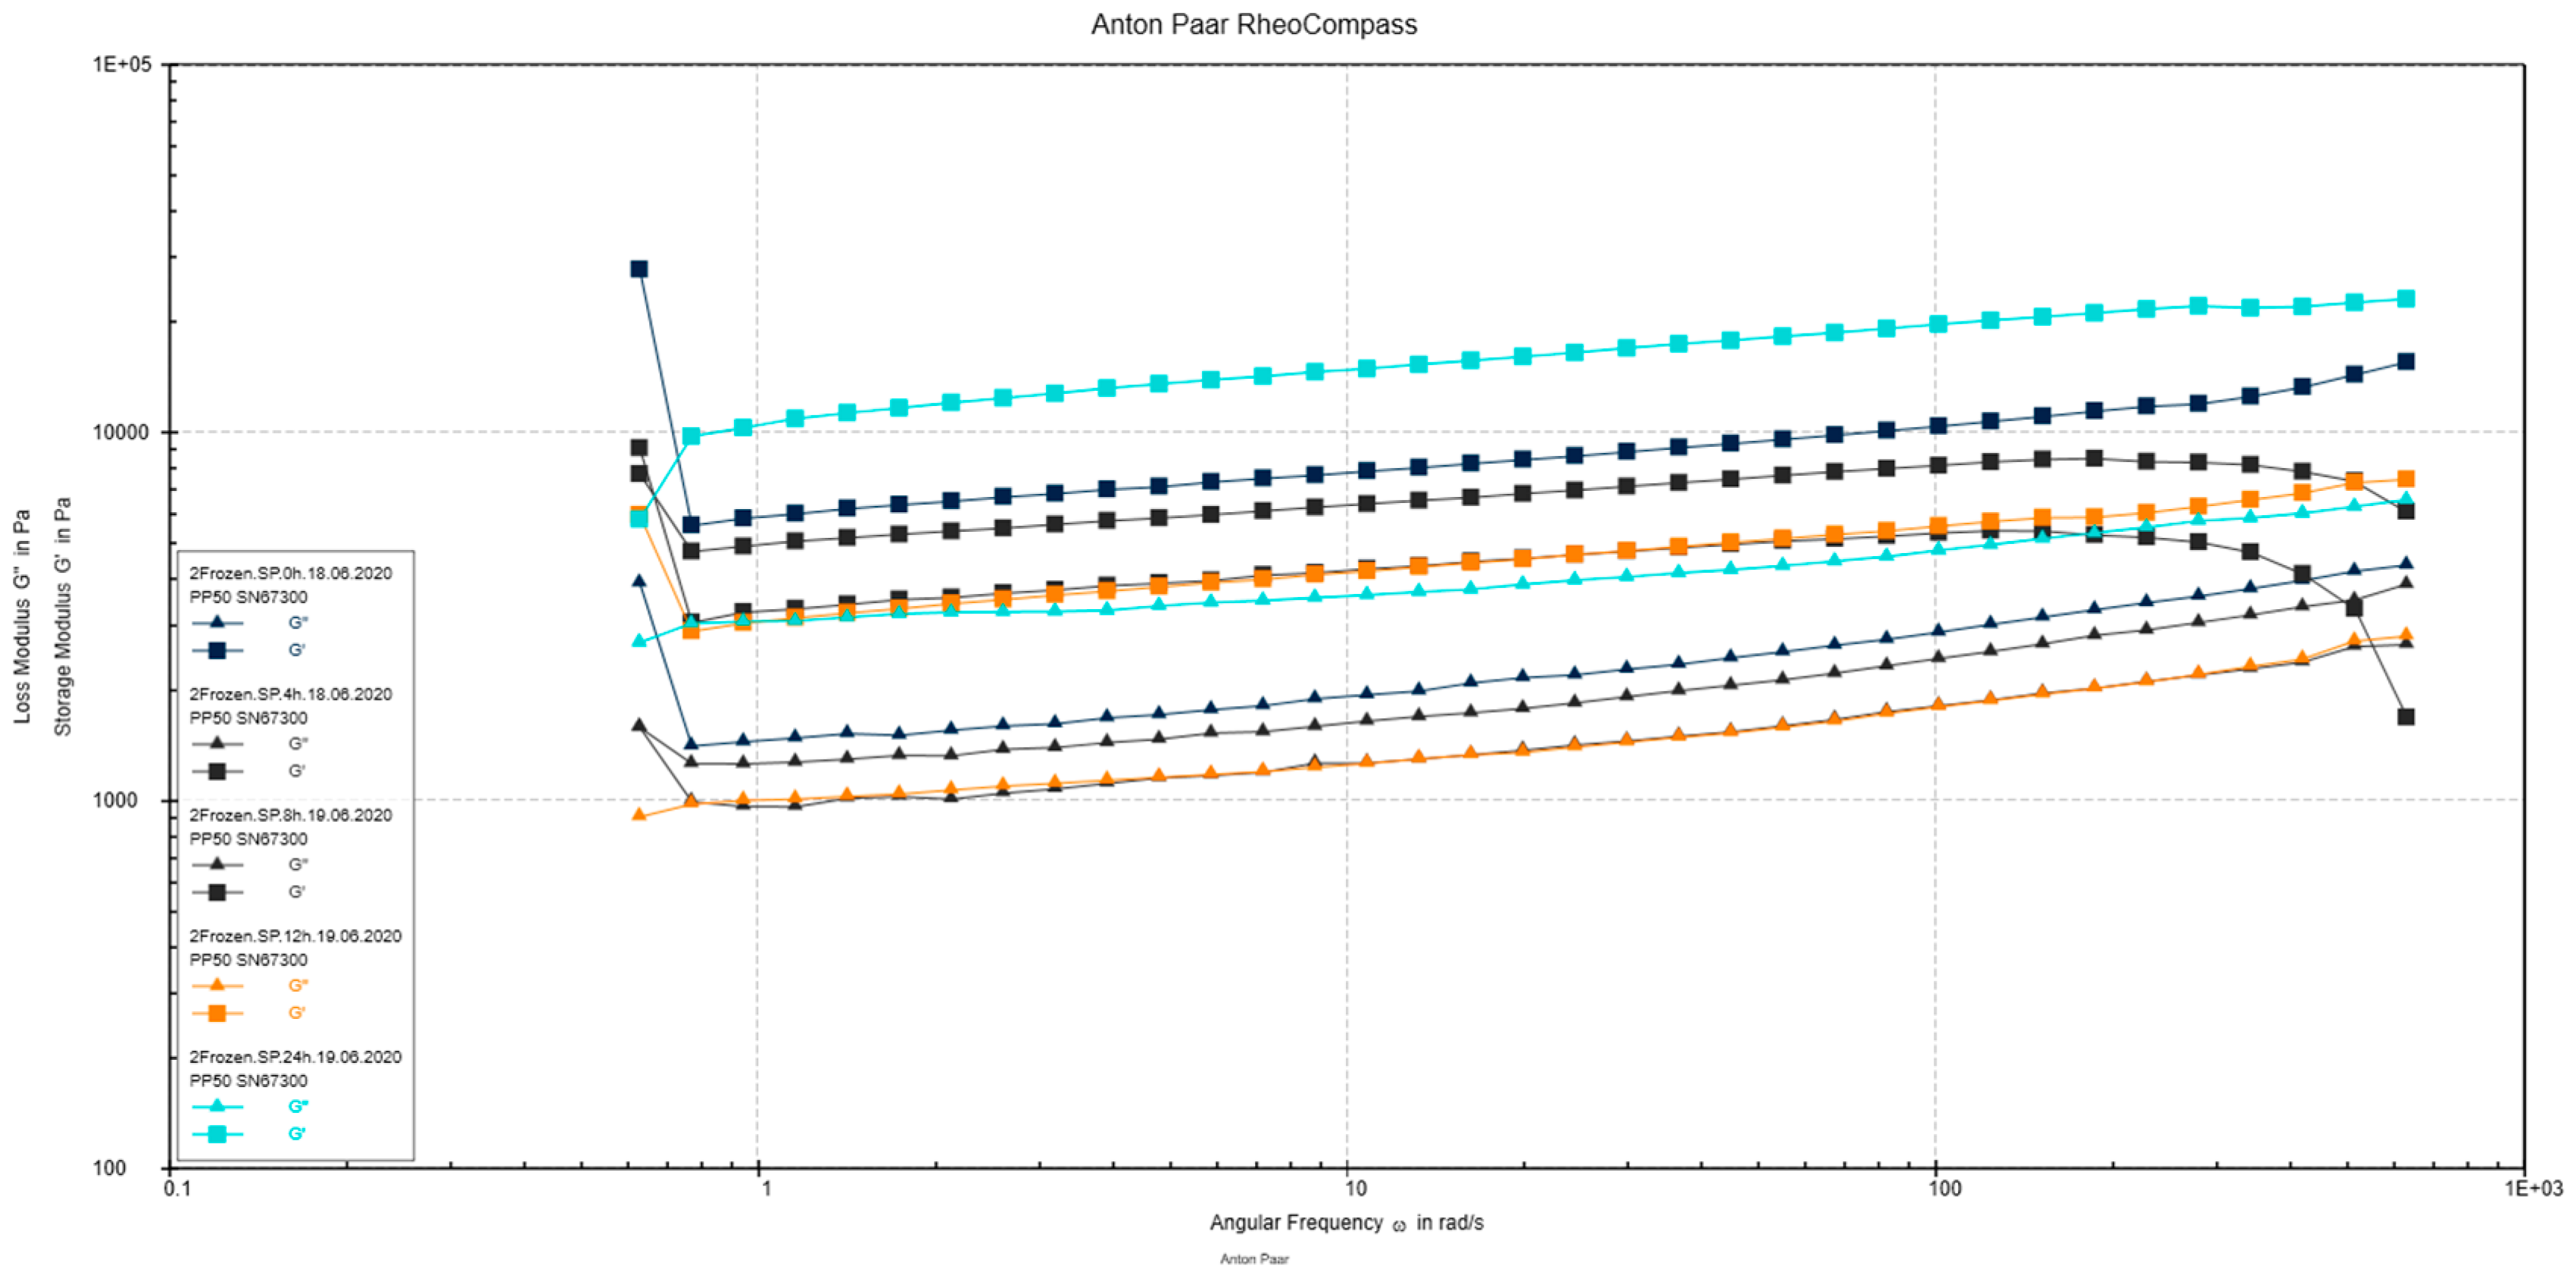
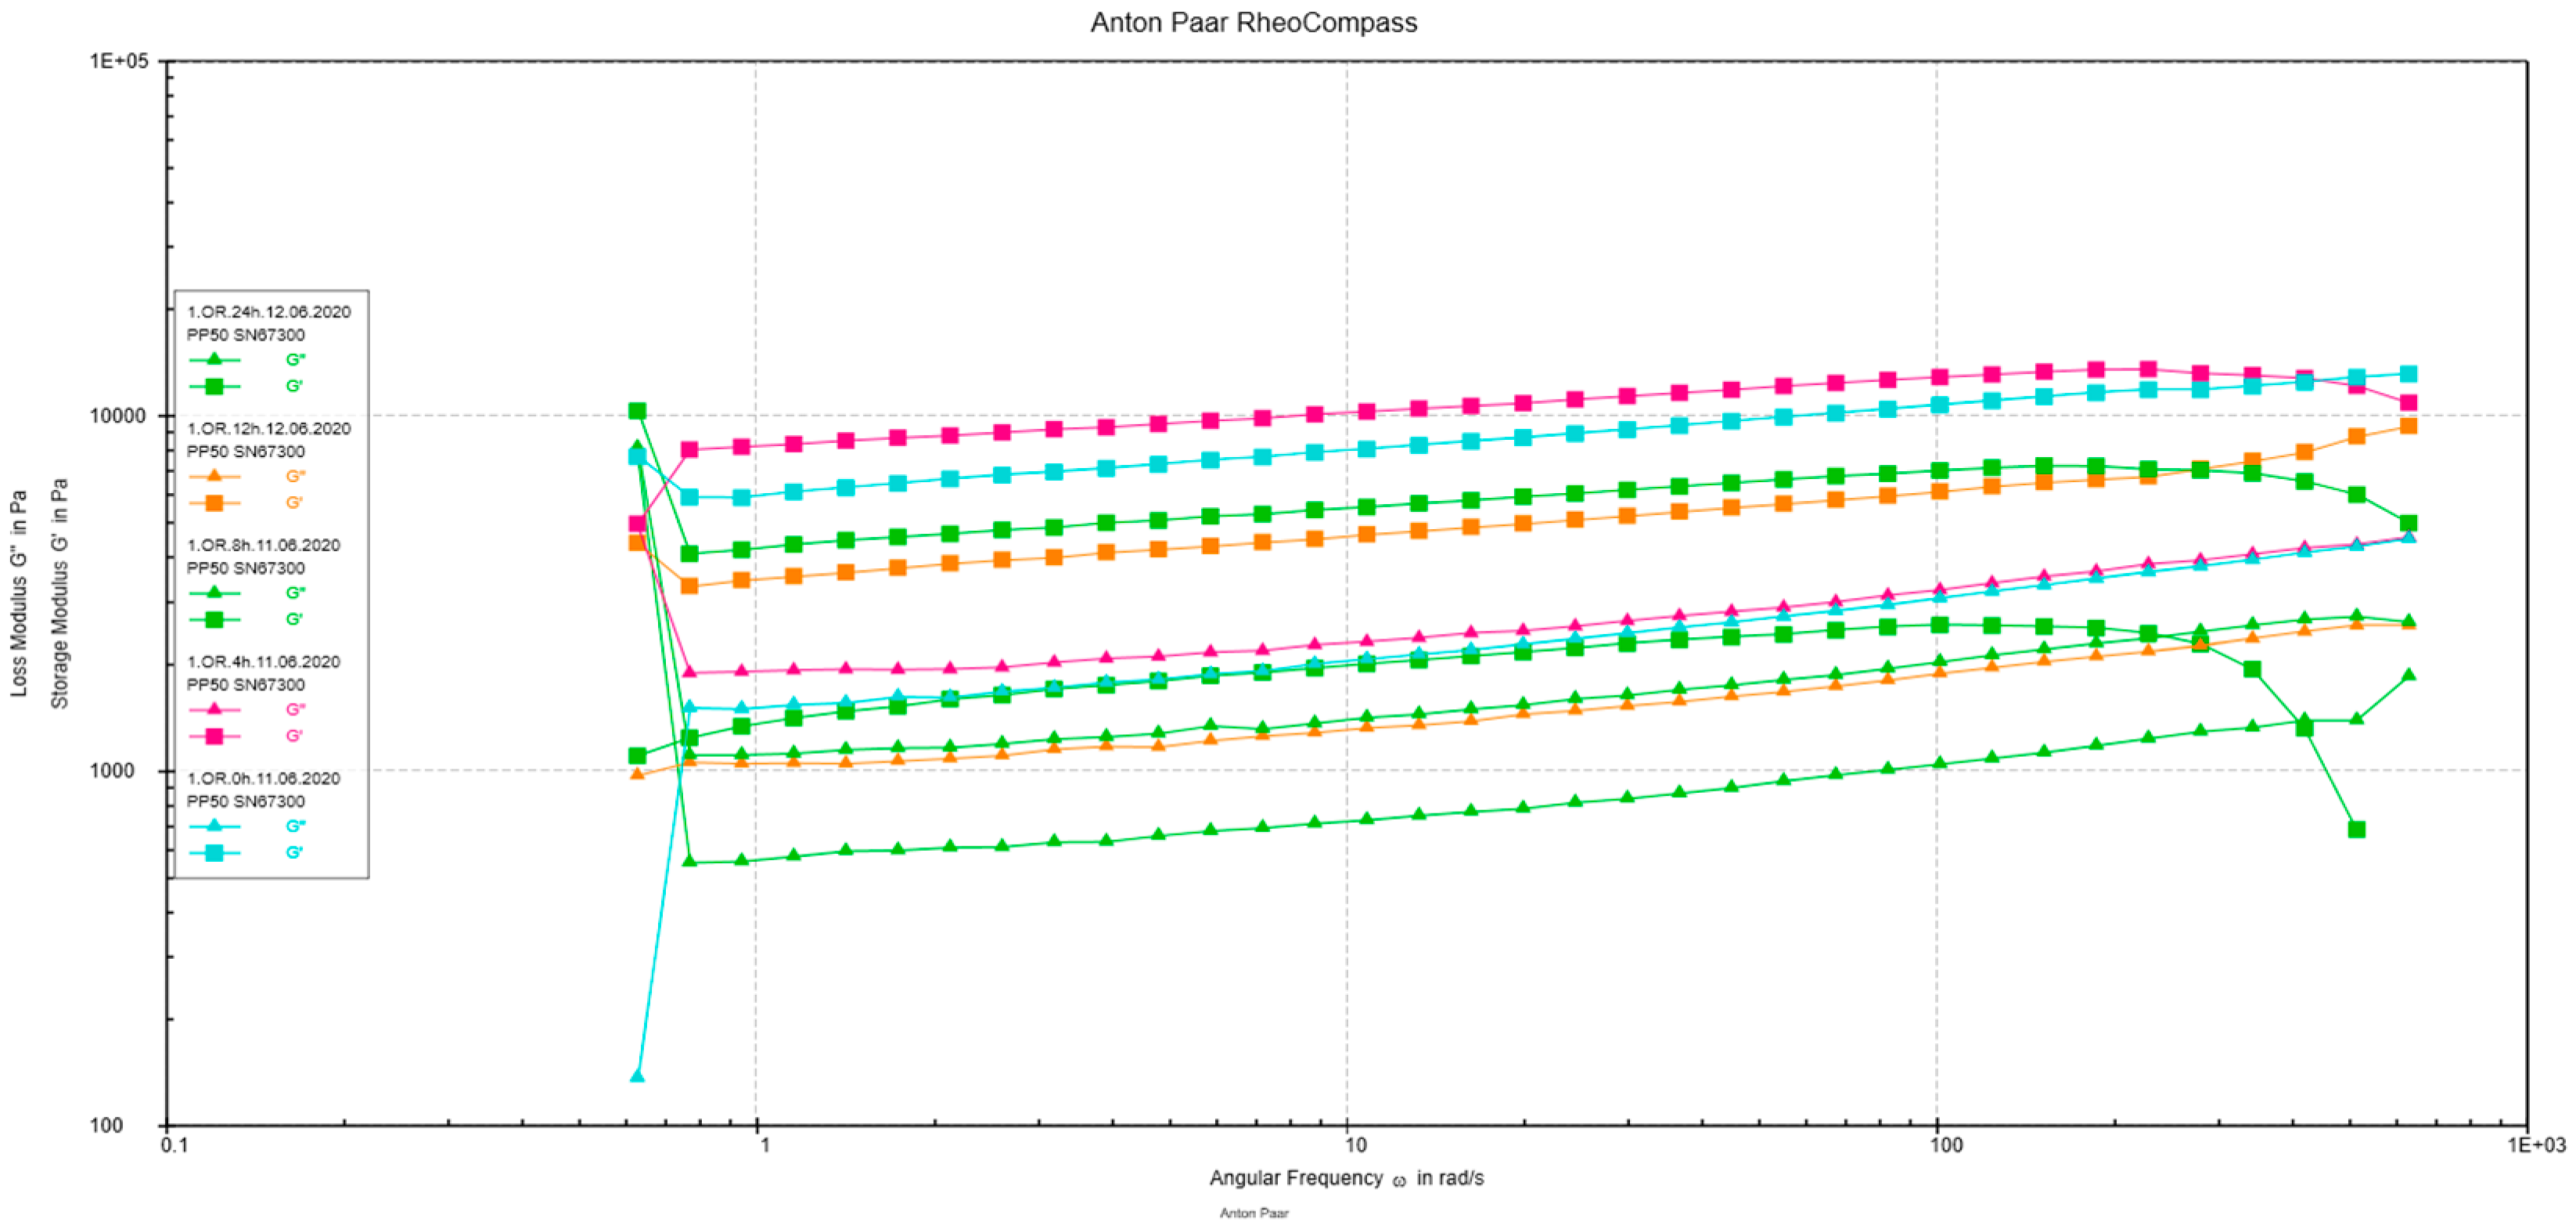
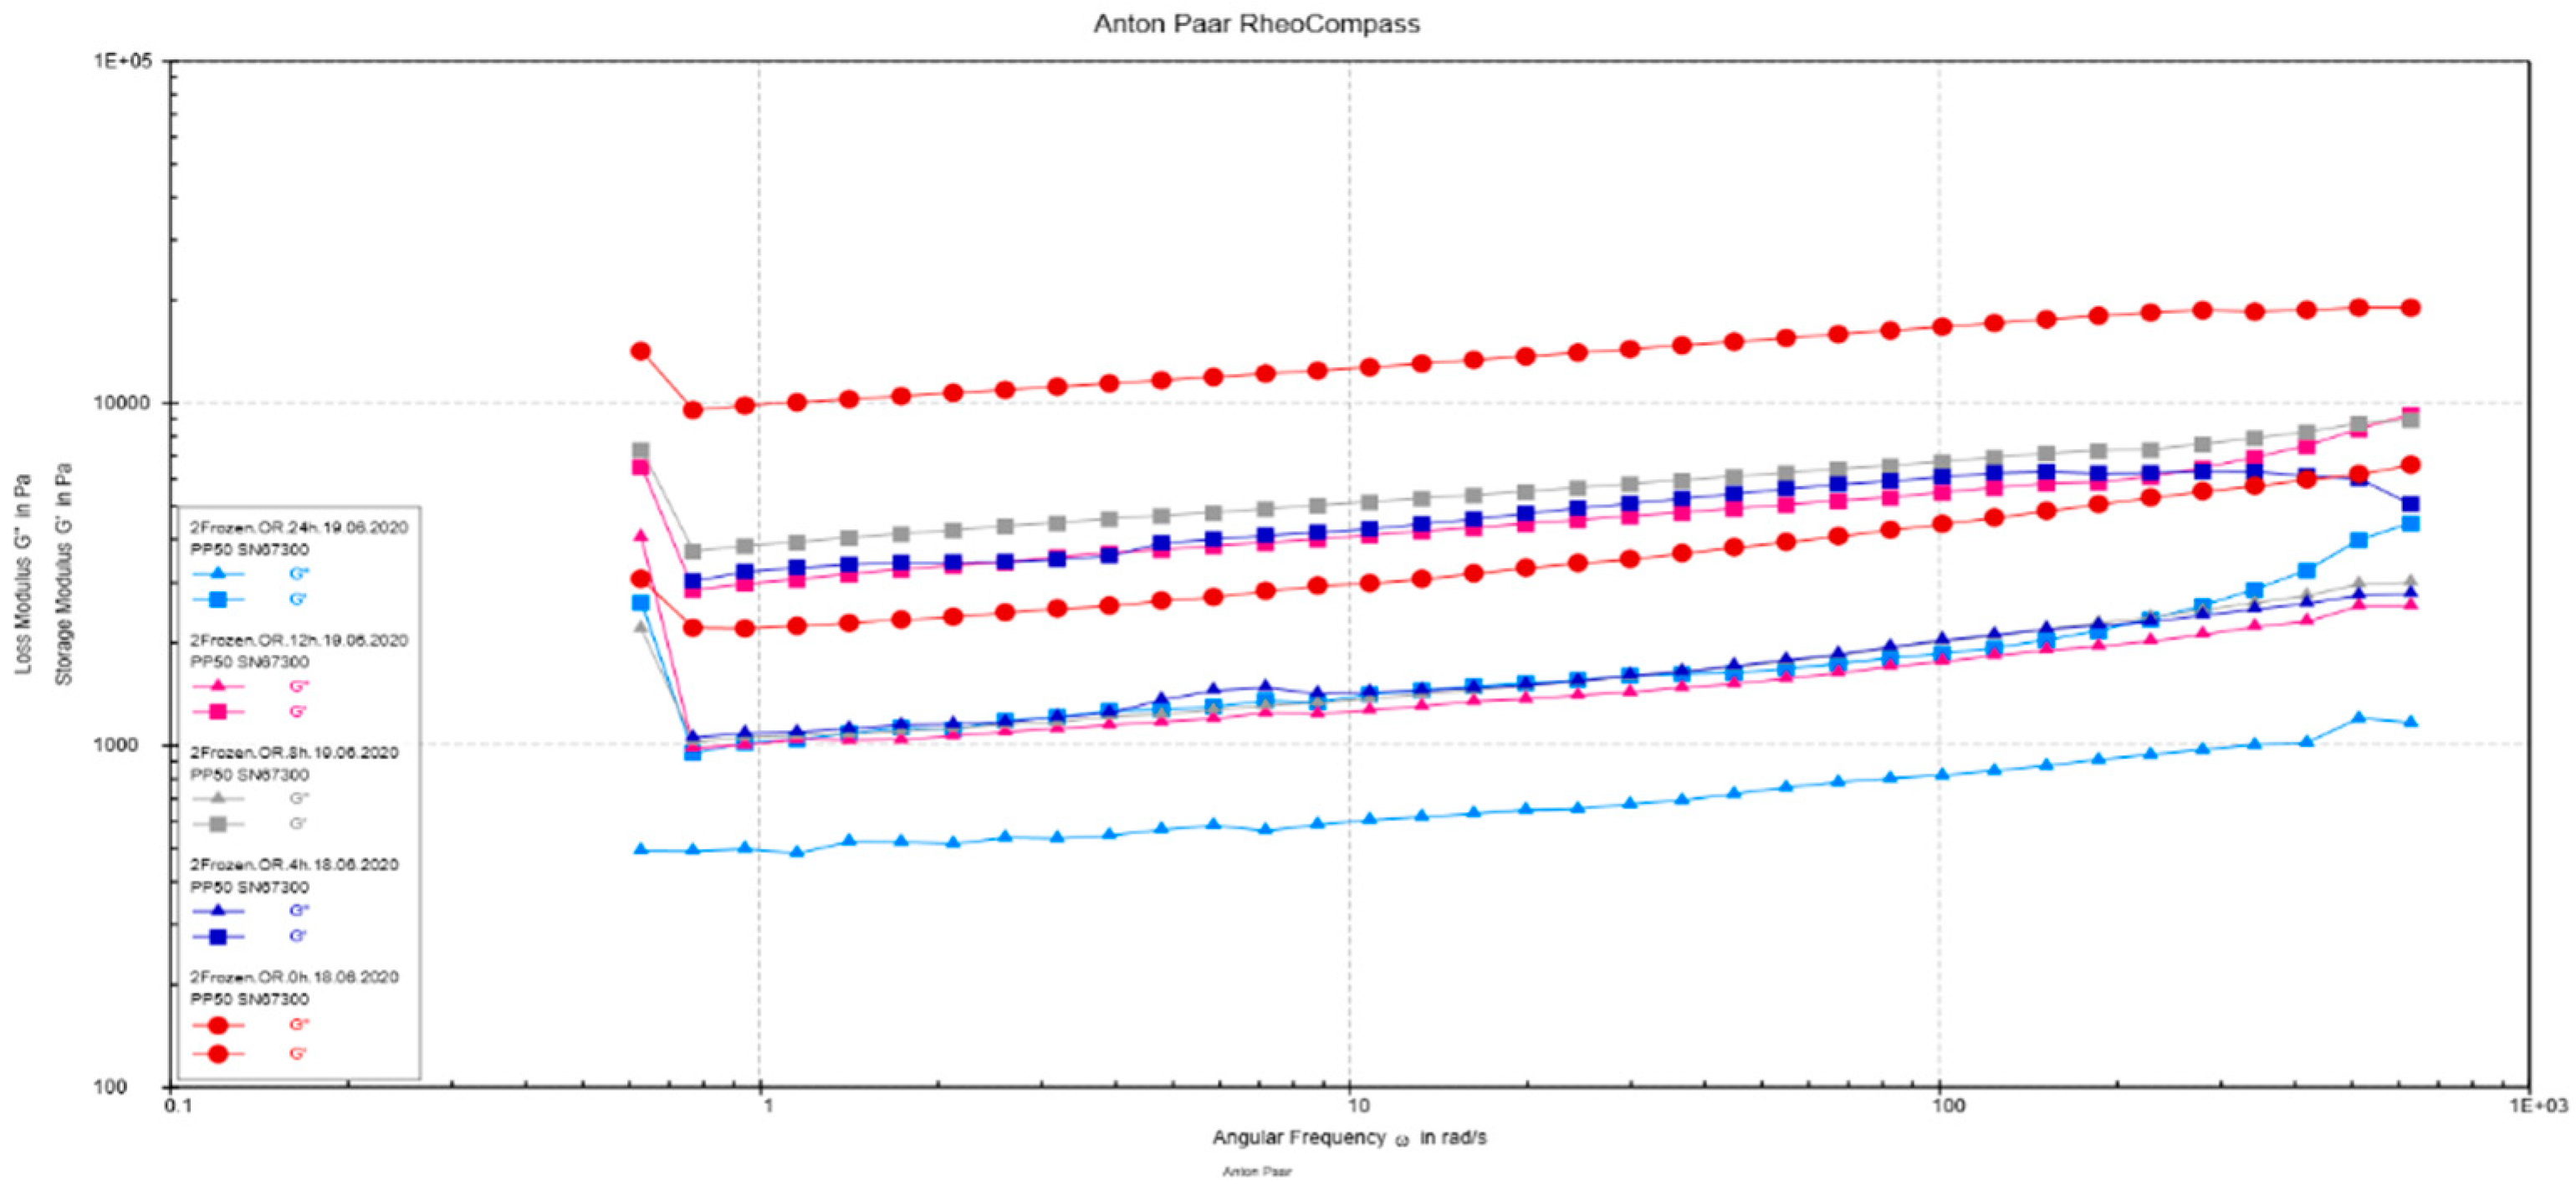
3.2.5. Rheological Measurements

The rheological alterations of OR and SP sourdoughs during fermentation and freezing are presented in Figure 4, Figure 5, Figure 6 and Figure 7. G’ represent the capability of materials to store the elastic deformation energy and G’’ modul represent the viscous portion of the materials [45]. In general, the G’’ was lower than the G’ in SP and OR fresh and frozen samples, indicating that the viscous properties of the sourdoughs increased while elastic behaviour decrease with the increasing hours of fermentation. This could be justified due to the possible Lp exopolysaccharides production through sourdough fermentation, which could act as viscosifiers and texturizers, having pseudoplastic rheological behavior and being involved in the water-binding capacity of sourdoughs [27,54,82] reported that strains from Lactobacillus genus could produce exopolysaccharides through sourdough fermentation. This is in agreement with [83] who confirmed that Lactobacillus plantarum is able to produce exopolysaccharides in sourdough through fermentation. On the other side, [84] reported that LAB might produce 12β-glucan during the growth process and metabolism, which could positively influence the viscosity and the water holding capacity of quinoa flour.
The low elastic properties of OR and SP fresh sourdoughs could be attributed to the starch degradation which might occur during fermentation [34]. Bolívar-Monsalve et al. [82] confirmed the amylolytic activity of Lactobacillus plantarum, activity which could influence the microstructure of quinoa starch and change the pasting properties of quinoa flour. SP 24 h frozen sample had the highest storage modulus (G′) (23127.00 Pa) and loss modulus (G″) (6574.7 Pa) at a a final angular frequency of 628 rad s-1, while SP 24 h fresh sample had G′ value of 0.06 Pa and G″ value of 1852.2 Pa, respectively, indicating that through freezing the elastic behaviour of quinoa sourdough improved due to the freeze-thaw stability of quinoa starch [50]. Another possible explanation for the G’’ improvement through freezing could be the reorganization of hydrogen bonds of amylose and amylopectin during the cooling period [82]. In addition, OR 24 h frozen sample registered values of 4463.80 Pa and 1161.40 Pa for G’ and G’’, respectively, while OR 24 h fresh sample had values for G’ and G’’ of 0.09 Pa and 1252.4 Pa supporting the idea that through freezing the viscous features of sourdough improved.
Gelation, water-holding, and foaming capacity represent the main technological applications of quinoa flour [52]. Water absorption capacity of quinoa flour is one of the most important physicochemical properties of carbohydrates content being influenced by the intermolecular association between starchy polymers [51]. Furthermore, this characteritics could influence the water loss in pastry or bakery final baked products [52]. Quinoa main carbohydrate is represented by starch having small granules (less than 3 µm in diameter) and higher maximum viscosity and significant swelling power compared with the barley and wheat starches [51]. Compared to the wheat flour, which has a gluten network, the gluten free flours network is mainly influenced by starch properties [84].
Due to its freeze-thaw stability, quinoa starch could be successefully used as an thickener in food manufacturing where resistance to retro degradation is desired. Likewise, quinoa starch is recomended for frozen baby food manufacturing proving good freeze-thawing stability. In addition to starch, dietary fiber (7–9%), such as pectin and xyloglucans, represent another carbohydrate group with importance on the viscosity and stability of the starch paste [50,57]. Moreover, due to its high content in soluble dietary fiber (1.41–2.3 % dry weight), quinoa flour could be used to improve the texture of highly viscous food products such as dough and final baked products [85].

3.3. Carbohydrates, Organic Acids, Folic Acid, Minerals, Flavonoids, Total Phenols Content, Radical Scavenging Activity, of OR PF and SP PF Muffins

3.3.1. Carbohydrates and organic acids content of gluten free muffins (GFM)

The GFM content in carbohydrates and organic acids are presented in Table 5. Glucose, fructose, and maltose amounts decreased in the gluten free muffins manufactured with SP 24 h sourdoughs, due to its lower carbohydrates content (Table 5). This is in line with [1] who reported that the starch utilization by the heterofermentative Labs such as Lactobacillus plantarum during quinoa sourdough fermentation improved the rate of starch hydrolysis and decreased the glycemic index in bread final baked product.
The glucose and fructose content of the final baked muffins could be influenced also by maple syrup, which is considered a superior natural sweetener from the chemical point of view, being rich in minerals, flavor compounds, and antioxidant capacity [86]. Sucrose, glucose, and fructose are the main carbohydrates detected in maple syrup range between 61.2 and 65.8%, 0.13 and 0.39%, and 0.07 and 0.27%, respectively. Furthermore, the consumption of maple syrup could produce lower glucose and insulin responses, being considered a successful replacement of refined sugars in human diet [87].
The presence of the organic acids in GFM could be explained by controlled and spontaneous fermentation of SP and OR sourdoughs. The lactic content of SP PF 24 h is higher (statistically different p < 0.05) than the amount of OR PF 24 h. This was expected since the initial concentration of lactic acid was statistically different (p < 0.05) in SP 24 h sourdough than in OR 24 h sourdough (8.50 mg/100 g f.w., and 5.81 mg/100 g f.w., respectively).
The same trend was observed with respect to the acetic acid content of GFM as the initial content of SP 24 h and OR 24 h were statistically different (p < 0.05). Acetic acid is the most promising organic acid involved in the bio-preservation of bakery products [88], having an antifungal effect; meanwhile, lactic acid plays an important role in the storage and safety of the final baked goods [89]. Moreover, lactic acid could positively influence the aroma and also the texture of the final baked goods [53,90] and might also degrade the rate of starch digestion in bakery products [26]. Furthermore, the presence of lactic and acetic acids in the final baked good, formed during sourdough fermentation, has been proved to reduce insulinemic and acute glycemic responses [26].
Citric acid possesses antimicrobial activity and could be produced during fermentation of sourdough with Lactobacillus plantarum [45]. Furthermore, the addition of citric acid in the manufacture of baked leaved goods could improve their sensory characteristics, including flavor [91]. In the present study, even if Lp was able to increase the amount of citric acid, the differences were not significant (p < 0.05). The same trend was noticed in the muffins made with SP 24 h, compared with OR PF 24 h, whose values were 2.20 and 2.27 mg/g f.w., respectively (Table 5).

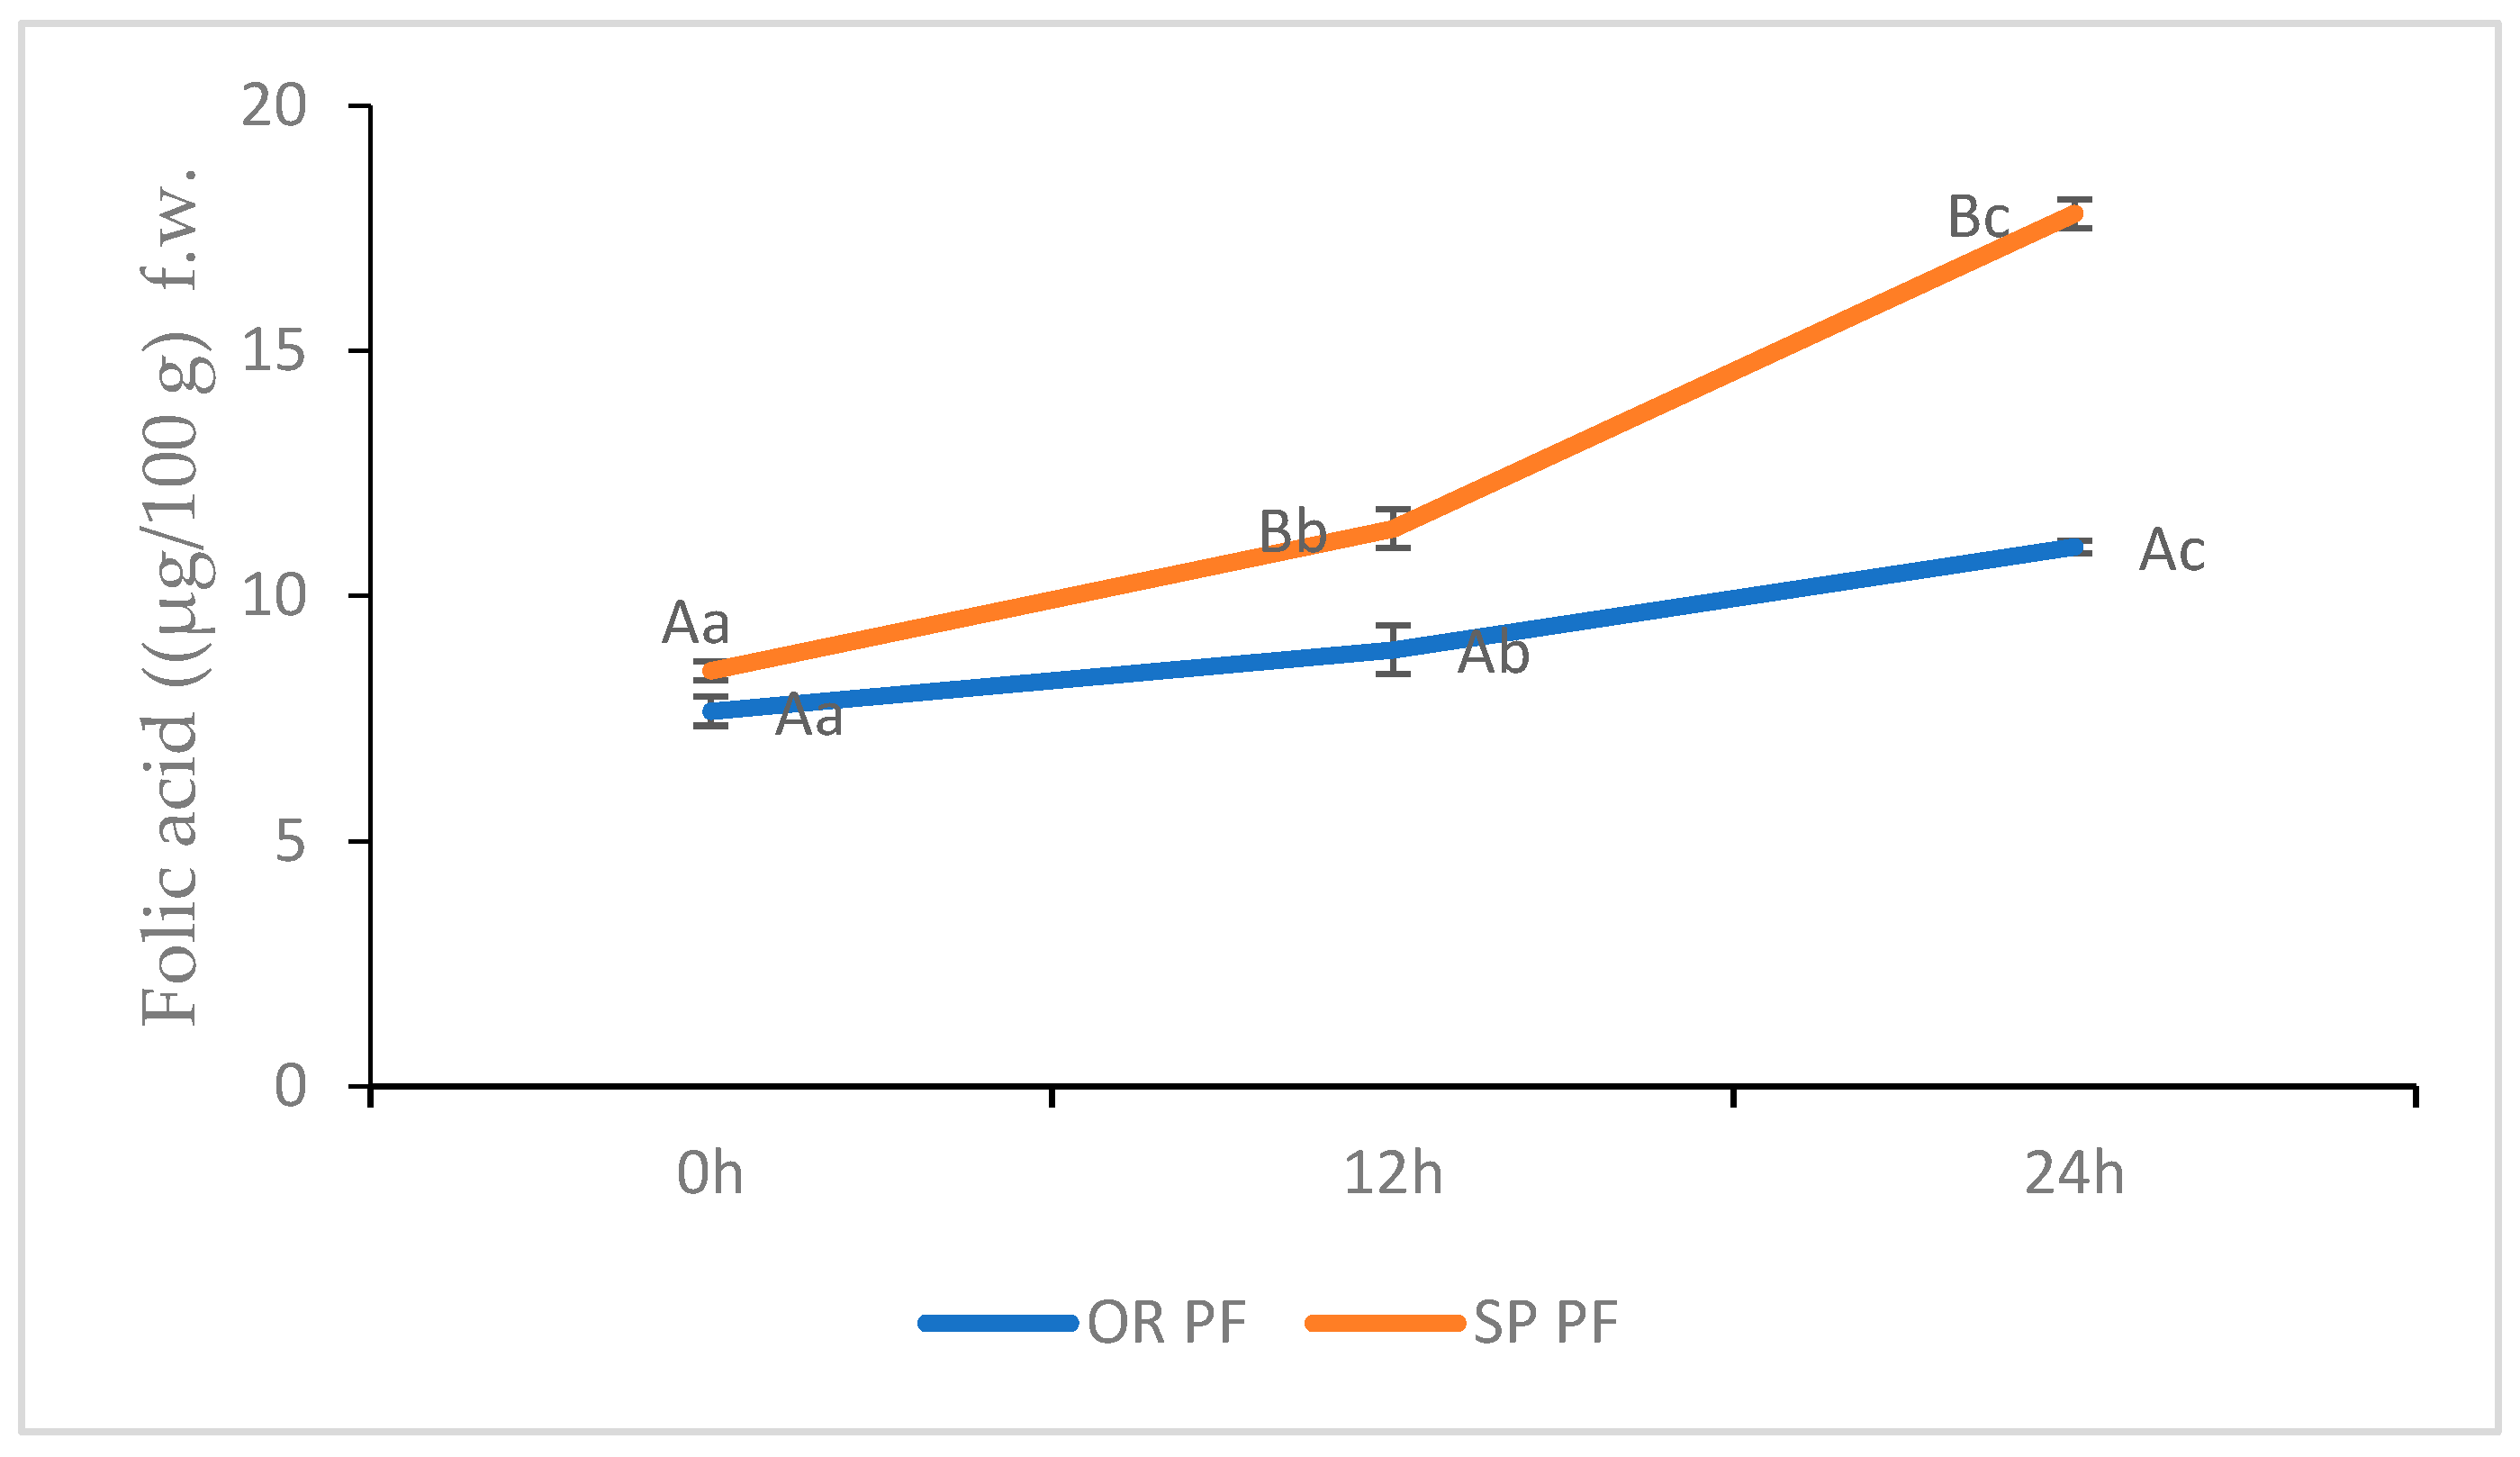
3.3.2. Folic Acid of Gluten Free Muffins (GFM)

The folic content of GFM manufactured with OR and SP sourdoughs at 0, 12, and 24 h of fermentation are illustrated in Figure 8. The folic content of GFM was influenced by the addition of the OR and SP, GFM produced with SP being statistically different (p < 0.05) from GFM produced with sourdough from spontaneous fermentation. This could be explained by the higher content in folic acid in sample SP 24 h (10.48 µg/g f.w) compared with the amount found in OR 24 h sample (3.2 µg/g f.w). This finding is consistent with [79] who proved that the use of sourdough fermented with Lactobacillus strains in bread manufacturing could counteract the thermal loss of bioactive compounds through baking process.
It is noteworthy to mention that the content of folic acid in final products like bread, noodles, and cookies was improved when QWF was used [48]. Even if, folate is a temperature sensitive vitamin and baking process could diminish its amount, [48] reported a total folate of 17–98 μg/100 g d.m. (dry matter) in noodles, 18–62 μg/100 g d.m. in cookies, and 26–41 μg/100 g d.m. in breads, respectively.
Folate is the generic descriptor for folic acid, used to describe the folic acid and its derivatives, and it is involved in cell essential metabolism function. Folic acid is defined as a chemical form of folate and it is often used in the food fortification process [92]. The lack of folates in human body could lead to the development of different diseases, such as neural tube defects, malformations, megaloblastic anemia, cardiovascular diseases, and could play an important role in lung carcinogenesis [40,92]. Therefore, in the US, the fortification of food with folic acid is mandatory and the daily intake recommendation between 200 and 400 µg [40,92]. Moreover, recently [4] reported a lack of folate content in the diet of children diagnosed with celiac disease highlighting the necessity for mandated gluten free folate food fortification policy.

3.3.3. Minerals Content of Gluten Free Muffins (GFM)

As presented in Table 6, the mineral content of GFM manufactured with SP 24 h are significantly higher than OR 24 h. K, Mg, and Ca were the mainly minerals identified in the SP 24 h GFM; although, Mn, Zn, Fe, and Cu could be identified in smaller amounts.
The final results for macro/micro minerals content demonstrated that through the lactic acid fermentation of a rich source of minerals, the final content of these nutrients was enhanced in the final baked product. These results are in agreement with previous findings such as [1,20].
Quinoa fermentation with Lp provided in the medium a value of pH optimal for enzymatic degradation of phytic acid, leading to final baked muffins enriched in minerals such as K, Ca, Mg, Mn, Fe, Zn, and Cu (Table 6). The successefully use of sourdough aiming to improve the minerals content of the gluten free products was prevously reported by [24,93]
The elimination of gluten involves sometimes the decrease of vitamins, minerals, fibers, and folate. Gluten free products had lower minerals content compared with the conventional ones and their bioavailability could range between 10 and 70% [94]. Furthermore, people who are undergoing a gluten free diet are exposed to mineral and vitamins deficiencies mainly because of their lower content in the final products [95] and due to the presence of phytic acid, an anti-nutritional factor which decreases the bioavailability of minerals such as calcium, magnesium, iron, or zinc [74].

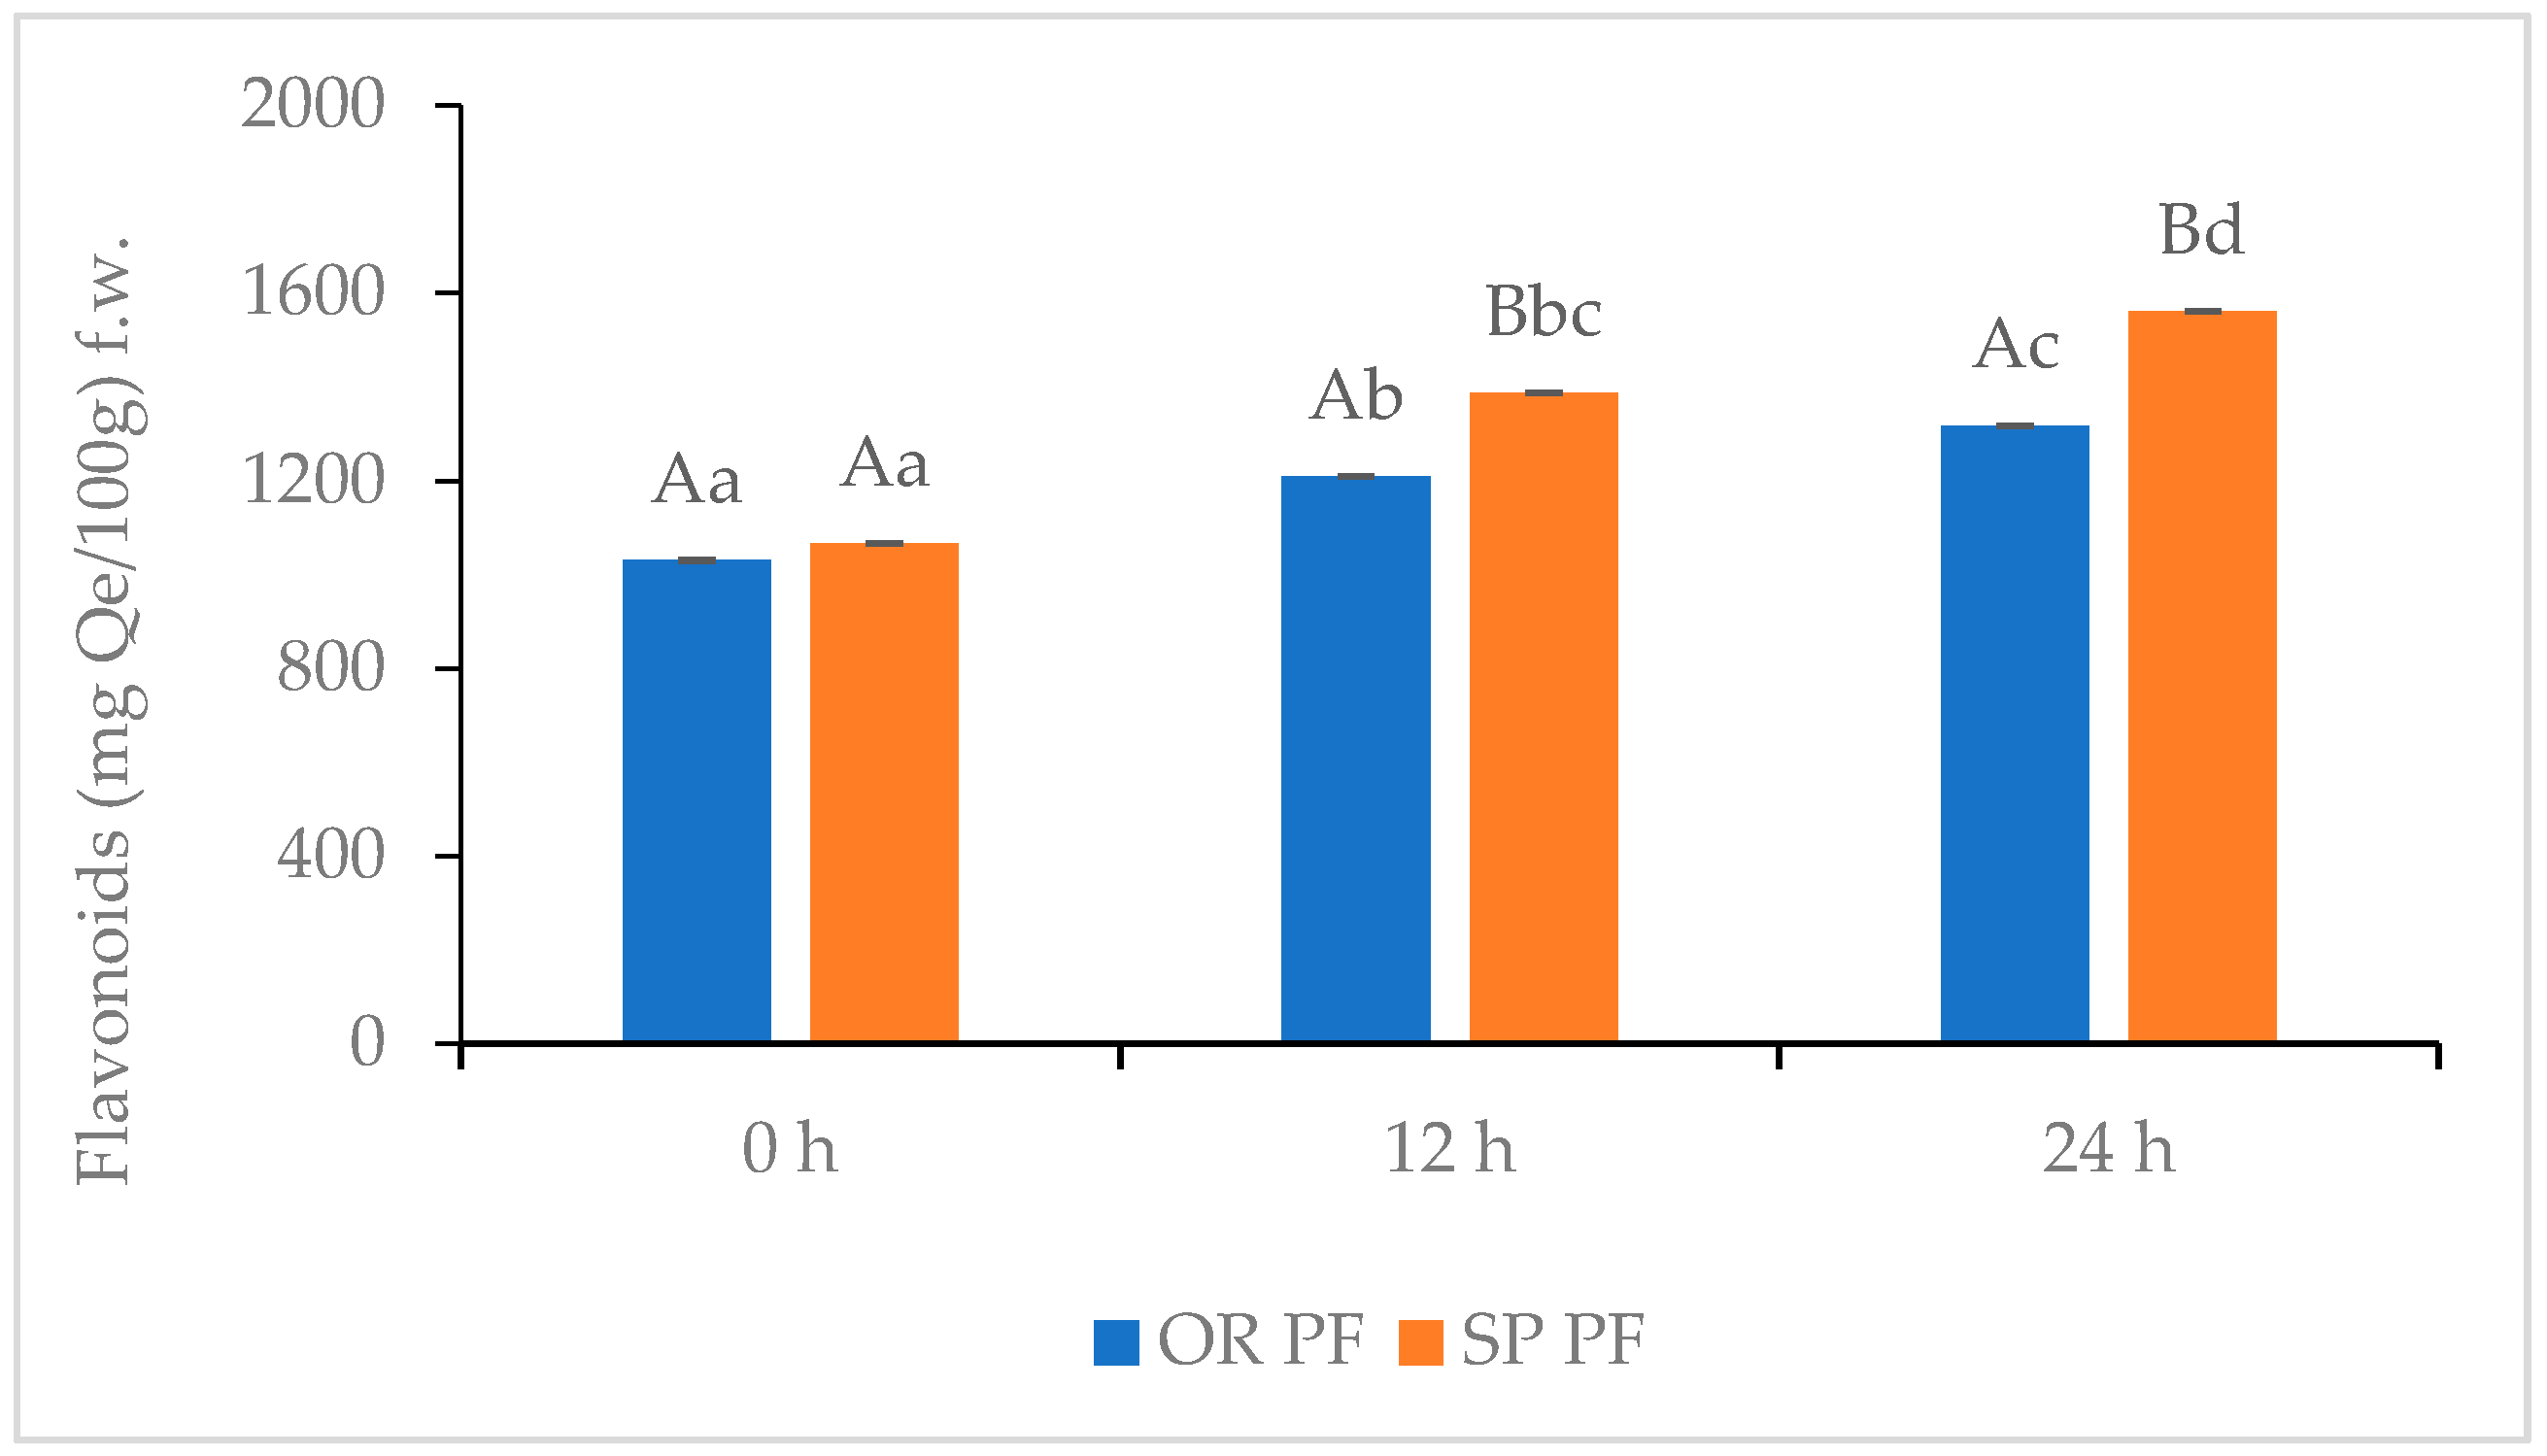
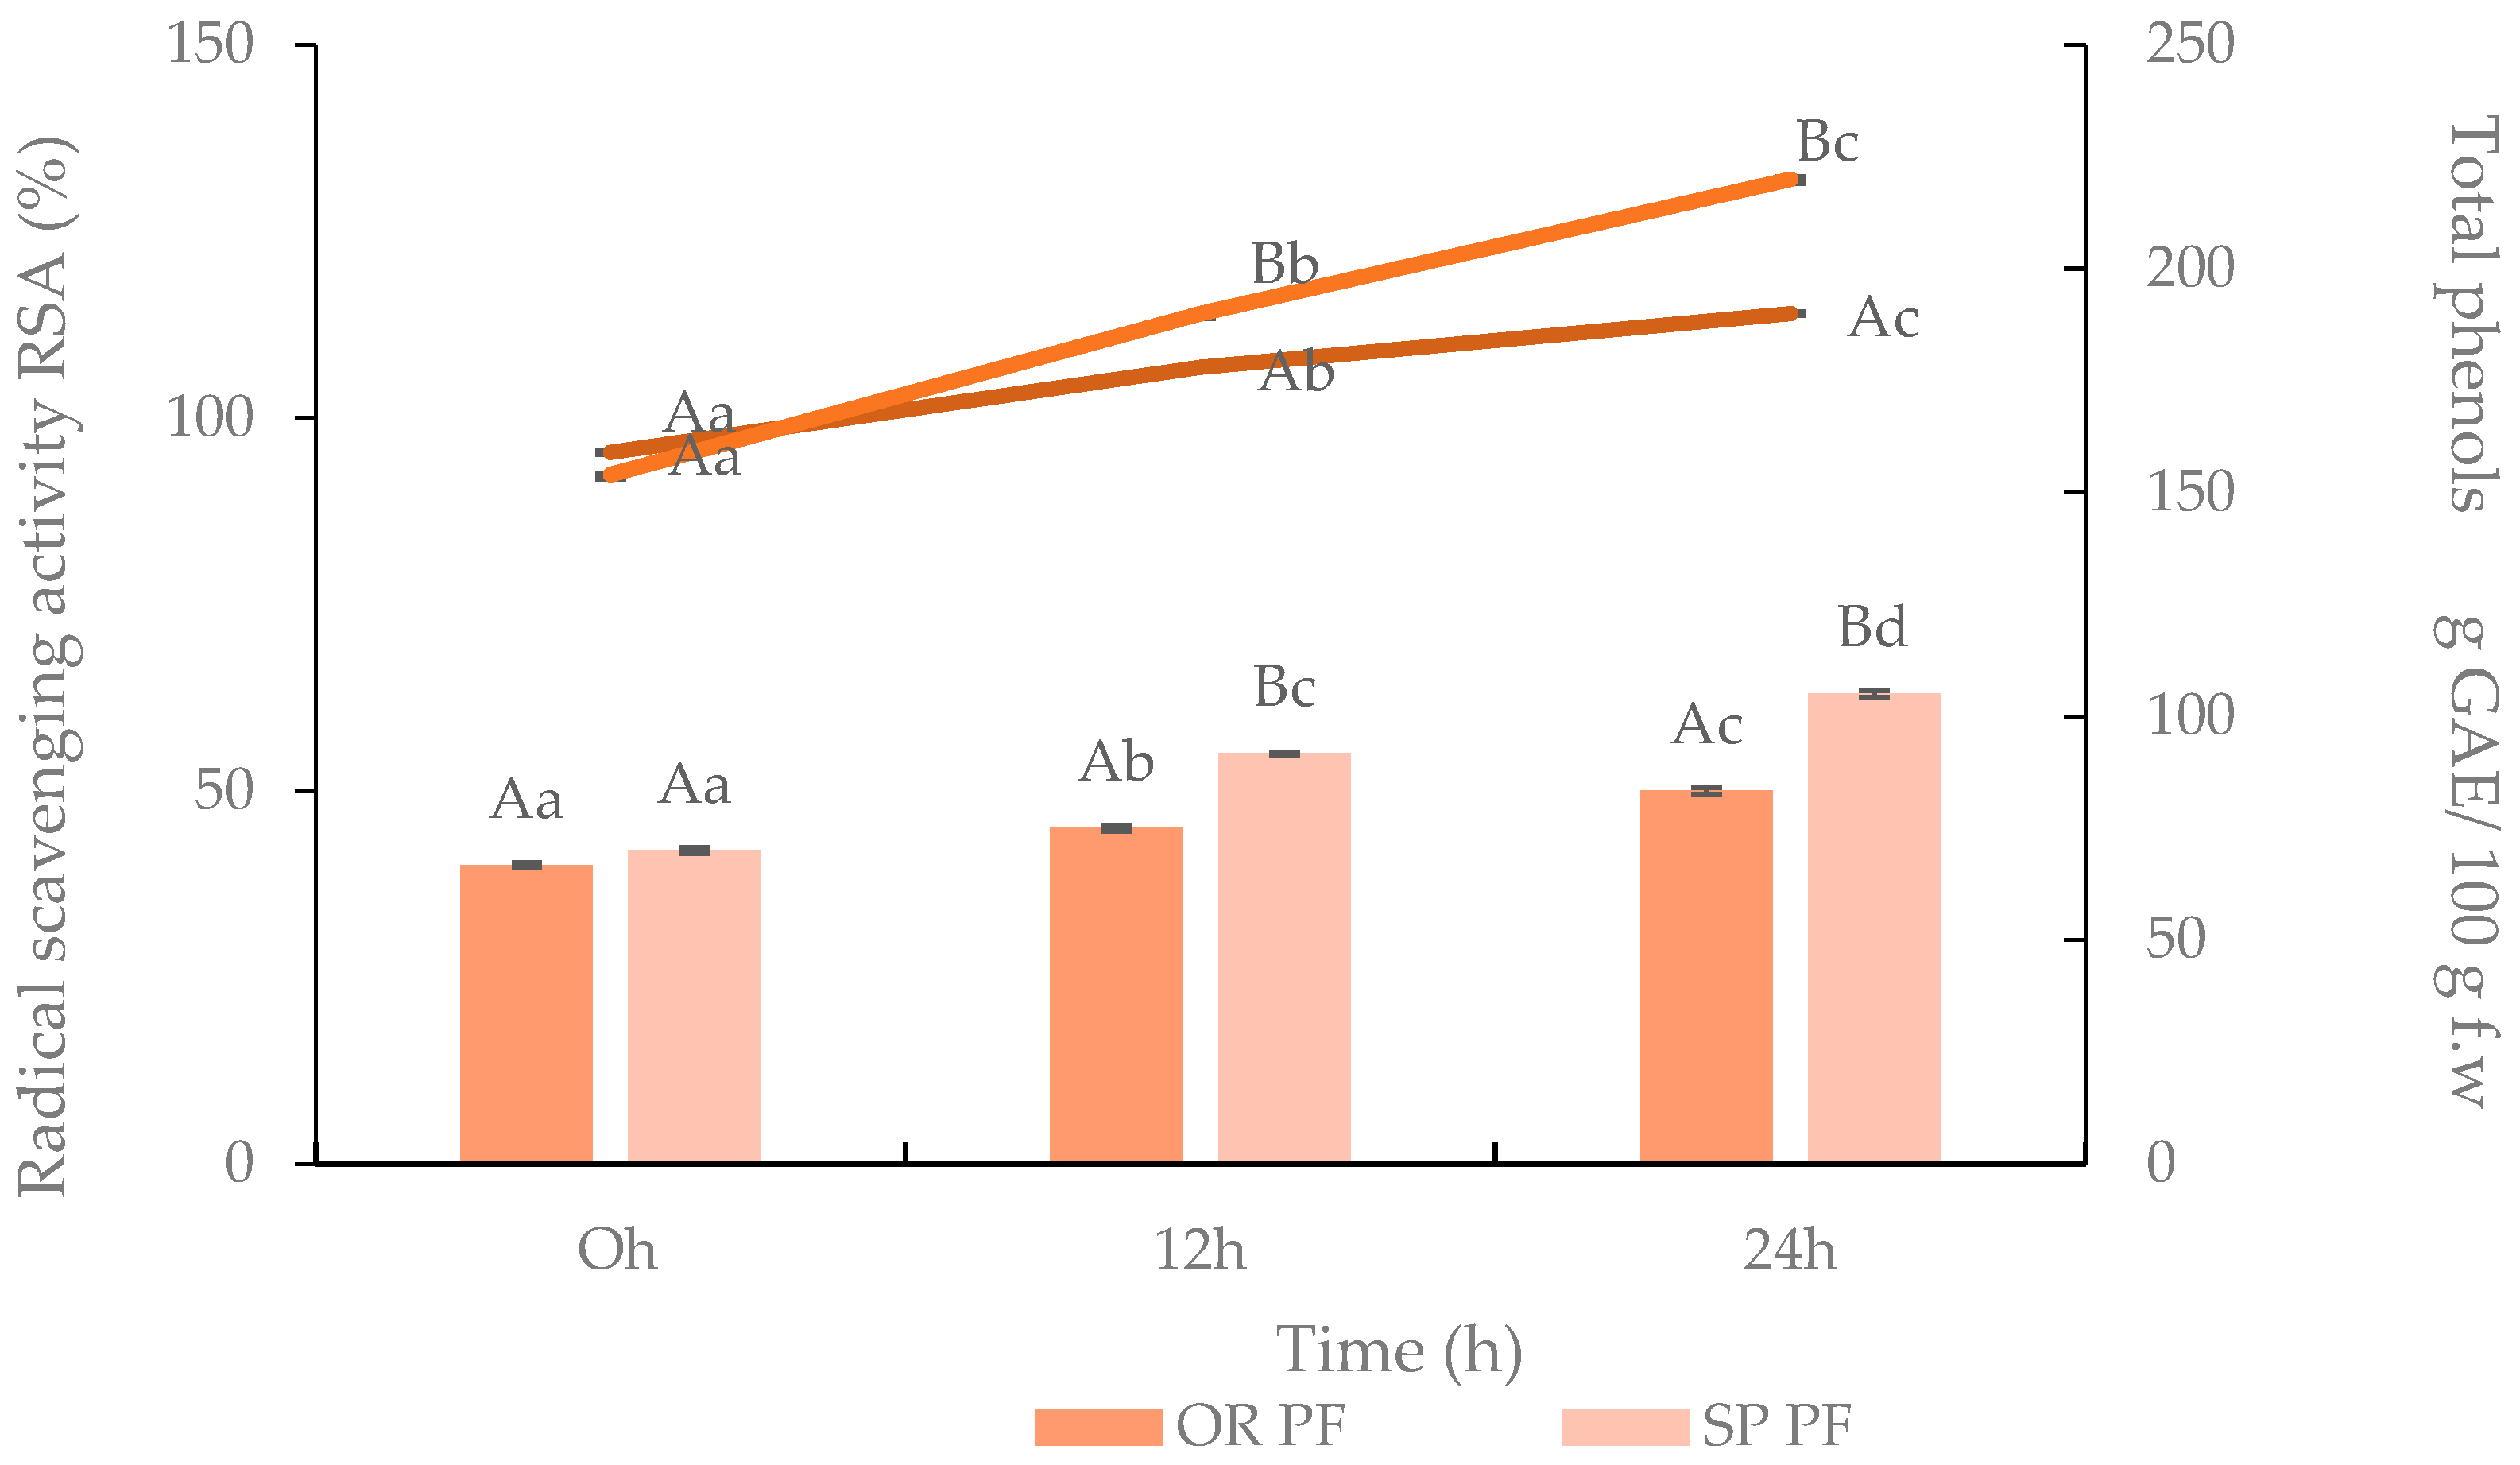
3.3.4. Flavonoids, Total Phenols Content, Radical Scavenging Activity of Gluten Free Muffins (GFM)

The total flavonoids content of GFM is illustrated in Figure 9. In the final baked muffins manufactured with SP 24 h, a total content of 1561 mg Qe/100 g f.w. was determined, compared with OR PF 24 h, where flavonoids had a total amount of 1317 mg Qe/100 g f.w. The difference between the samples could be explained by the presence of SP or OR 24 h sourdoughs. Nonetheless, it is noteworthy to mention that [96] identified in buckwheat flour a total of 188 flavonoid metabolites that could positively influence the content of flavonoids in the muffins. On the other side, the thermal treatment of the final baked goods could have a negative influence on the total flavonoids content [97].
The total phenols (TF) and radical scavenging activity (RSA%) of gluten free muffins made with SP sourdough were significantly different to those made with OR sourdough (Figure 10) due to the capacity of Lp to produce higher extent of lactic acid amount in SP sample, that could influence through acidification the extractability of total phenols and the antioxidant potential. Moreover, the interaction of Folin–Ciolcateu reagent with other non-phenolic compounds like vitamins, amino acids, and proteins could also have an influence on the number of polyphenolic compounds. On the other side, the lower OR 24 h total phenols and radical scavenging activity suggested that spontaneous fermentation and quinoa endogenous enzymes were not able to decrease the pH and release antioxidant compounds [98].
It is important to mention that the TF amount of quinoa flour and RSA were 451 ± 0.3 mg GAE/100 g f.w. and 92 ± 0.5%, respectively [38]. The total phenols amount could vary between samples as reported by [50] who proved that QF from Chile had significant higher polyphenols content compared with the flour from Mexico (319 mg GAE/100 g and 180.4 mg GAE/100 g, respectively) and could be justified by the differences in the polyphenol extraction process [47].
The TF value is close to the value reported by [99] as 464 mg GAE/100 g. With respect to RSA, other studies reported a value of it up to 71.8% [1]. The differences between the results could be due to the different extraction conditions such as the extraction solvent and due to the duration of the extraction that could influence the total phenols content [100].
Through the quinoa fermentation with Lp, the TF and RSA content improved up to 350 mg GAE/100 g f.w. and 94%, respectively [38]. This idea is supported by [98] who indicated that fermentation of quinoa flour with LAB could lead to an improvement of the antioxidant activity. Briefly, Rizello et al. indicated that Lb plantarum T6A10 strain was able to increase the radical scavenging activity from 32.7 to 84.8% during 24 h of fermentation, due to its ability to release peptides with antioxidant activity during controlled fermentation through proteolysis.
Overall, it can be stated that SP and OR 24 h sourdoughs had an important influence on the final amounts of flavonoids, TF, and RSA of SP PF 24 h and OR PF 24 h, increasing their amounts and highlighting the idea that fermentation of quinoa with Lp is a valuable source for exploiting its properties.

4. Conclusions

Fermentation of quinoa flour with Lactobacillus plantarum ATCC (Lp) 8014 leads to a sourdough nutritional enrichment and to an improvement of its rheological features. Briefly, glucose, maltose, and fructose were metabolized by Lp, enhancing lactic acid content during 24 h of fermentation; meanwhile, acetic acid was produced through the pentose phosphate pathway. The production of acids and the drop of the pH lead further to a bigger bioavailability of minerals, increasing their values at least twice. From the rheological point of view, the viscous properties of the Lp sourdough was improved, probably due to the production of exopolysaccharides and 12 β-glucan by Lp. Furthermore, the use of Lp sourdough in the final baked muffins improved their nutritional features such as folic acid, minerals, flavonoids, total phenols, and radical scavenging activity. The decrease of carbohydrates such as maltose, glucose, and fructose enhanced the presence of organic acids in the final leavened goods.
Lactobacillus plantarum ATCC 8014 and quinoa flour represent an optimum combination that needs to be explored further for the manufacturing of gluten free products.

Author Contributions

Conceptualization, M.S.C. and A.P.; methodology, L.S., S.M.M., S.M. and A.P.; software, M.S.C., O.B.; validation, M.S.C., L.S. and A.P.; formal analysis, M.S.C., B.-E.T., C.R.P., A.C.U. and C.B.K.; writing—original draft preparation, M.S.C. and A.P.; writing—review and editing, A.P. and L.S.; supervision, S.M.; project administration, M.S.C. and S.M.; funding acquisition, D.C.V. and A.P. All authors have read and agreed to the published version of the manuscript.

Funding

This research was funded by POC-A1-A1.1.1.-B-2015 and the publication was supported by National Research Development Projects to finance excellence (PFE)-37/2018–2020 granted by the Romanian Ministry of Research and Innovation.

Conflicts of Interest

The authors declare no conflict of interest.

References

  1. Rizzello, C.G.; Lorusso, A.; Montemurro, M.; Gobbetti, M. Use of sourdough made with quinoa (Chenopodium quinoa) flour and autochthonous selected lactic acid bacteria for enhancing the nutritional, textural and sensory features of white bread. Food Microbiol. 2016, 56, 1–13. [Google Scholar] [CrossRef] [PubMed]
  2. Kårlund, A.; Gómez-Gallego, C.; Korhonen, J.; Palo-Oja, O.M.; El-Nezami, H.; Kolehmainen, M. Harnessing microbes for sustainable development: Food fermentation as a tool for improving the nutritional quality of alternative protein sources. Nutrients 2020, 12, 1020. [Google Scholar] [CrossRef] [Green Version]
  3. Chiş, M.S.; Păucean, A.; Stan, L.; Suharoschi, R.; Socaci, S.A.; Man, S.M.; Pop, C.R.; Muste, S. Protein metabolic conversion of nutritional features during quinoa sourdough fermentation and its impact on baked goods. CyTA J. Food 2018, 280, 744–753. [Google Scholar]
  4. Cyrkot, M.; Anders, S.; Kamprath, C.; Liu, A.; Mileski, H.; Dowhaniuk, J.; Nasser, R.; Marcon, M.; Brill, H.; Turner, J.M.; et al. Folate content of gluten-free food purchases and dietary intake are low in children with coeliac disease. Int. J. Food Sci. Nutr. 2020, 7486, 1–13. [Google Scholar] [CrossRef] [PubMed]
  5. El-Sohaimy, S.A.; Shehata, M.G.; Mehany, T.; Zeitoun, M.A. Nutritional, physicochemical, and sensorial evaluation of flat bread supplemented with quinoa flour. Hindawi Int. J. Food Sci. 2019, 2019, 1–15. [Google Scholar] [CrossRef] [Green Version]
  6. Pappier, U.; Pinto, V.F.; Larumbe, G.; Vaamonde, G. Effect of processing for saponin removal on fungal contamination of quinoa seeds (Chenopodium quinoa Willd.). Int. J. Food Microbiol. 2008, 125, 153–157. [Google Scholar] [CrossRef] [PubMed]
  7. Ceballos-Gonzalez, C.; Bolívar-Monsalve, J.; Ramírez-Toro, C.; Bolívar, G.A. Effect of lactic acid fermentation on quinoa dough to prepare gluten-free breads with high nutritional and sensory quality. J. Food Process. Preserv. 2017, 42, e13551. [Google Scholar] [CrossRef]
  8. Vega-Galvez, A.; Miranda, M.; Vergara, J.; Uribe, E.; Puente, L.; Martinez, E.A. Nutrition facts and functional potential of quinoa (Chenopodium quinoa Willd.), an ancient Andean grain: A review. J. Sci. Food Agric. 2010, 90, 2541–2547. [Google Scholar] [CrossRef]
  9. Nascimento, A.C.; Mota, C.; Coelho, I.; Gueifao, S.; Santos, M.; Matos, A.S.; Gimenez, A.; Lobo, M.; Samman, N.; Castanheira, I. Characterisation of nutrient profile of quinoa (Chenopodium quinoa), amaranth (Amaranthus caudatus), and purple corn (Zea mays L.) consumed in the North of Argentina: Proximates, minerals and trace elements. Food Chem. 2014, 148, 420–426. [Google Scholar] [CrossRef] [PubMed]
  10. Repo-Carrasco-Valencia, R.; Hellström, J.K.; Pihlava, J.M.; Mattila, P.H. Flavonoids and other phenolic compounds in Andean indigenous grains: Quinoa (Chenopodium quinoa), kañiwa (Chenopodium pallidicaule) and kiwicha (Amaranthus caudatus). Food Chem. 2010, 120, 128–133. [Google Scholar] [CrossRef]
  11. Alvarez-Jubete, L.; Wijngaard, H.; Arendt, E.K.; Gallagher, E. Polyphenol composition and in vitro antioxidant activity of amaranth, quinoa buckwheat and wheat as affected by sprouting and baking. Food Chem. 2010, 119, 770–778. [Google Scholar] [CrossRef]
  12. Gómez-Caravaca, A.M.; Segura-Carretero, A.; Fernández-Gutiérrez, A.; Caboni, M.F. Simultaneous determination of phenolic compounds and saponins in quinoa (Chenopodium quinoa Willd.) by a liquid chromatography-diode array detection-electrospray ionization-time-of-flight mass spectrometry methodology. J. Agric. Food Chem. 2011, 59, 10815–10825. [Google Scholar] [CrossRef]
  13. Kumpun, S.; Maria, A.; Crouzet, S.; Evrard-Todeschi, N.; Girault, J.P.; Lafont, R. Ecdysteroids from Chenopodium quinoa Willd., an ancient Andean crop of high nutritional value. Food Chem. 2011, 125, 1226–1234. [Google Scholar] [CrossRef]
  14. Miranda, M.; Vega-Gálvez, A.; Uribe, E.; Lópeza, J.; Martínez, E.; Rodrígueza, M.J.; Quispea, I.; Di Scalac, K. Physicochemical analysis, antioxidant capacity and vitamins of six ecotypes of Chilean quinoa (Chenopodium quinoa Willd). Procedia Food Sci. 2011, 1, 1439–1446. [Google Scholar] [CrossRef] [Green Version]
  15. Wang, S.; Zhu, F. Formulation and quality attributes of quinoa food products. Food Bioprocess Technol. 2015, 9, 1–20. [Google Scholar] [CrossRef]
  16. Chillo, S.; Laverse, J.; Falcone, P.M.; Del Nobile, M.A. Quality of spaghetti in base amaranthus wholemeal flour added with quinoa, broad bean and chick pea. J. Food Eng. 2008, 84, 101–107. [Google Scholar] [CrossRef]
  17. Lorusso, A.; Verni, M.; Montemurro, M.; Coda, R.; Gobbetti, M.; Rizzello, C.G. Use of fermented quinoa flour for pasta making and evaluation of the technological and nutritional features. LWT Food Sci. Technol. 2017, 78, 215–221. [Google Scholar] [CrossRef] [Green Version]
  18. Stikic, R.; Glamoclija, D.; Demin, M.; Vucelic-Radovic, B.; Jovanovic, Z.; Milojkovic-Opsenica, D.; Jacobsen, S.E.; Milovanovic, M. Agronomical and nutritional evaluation of quinoa seeds (Chenopodium quinoa Willd.) as an ingredient in bread formulations. J. Cereal Sci. 2012, 55, 132–138. [Google Scholar] [CrossRef]
  19. Rizzello, C.G.; Tagliazucchi, D.; Babini, E.; Sefora Rutella, G.; Taneyo Saa, D.L.; Gianotti, A. Bioactive peptides from vegetable food matrices: Research trends and novel biotechnologies for synthesis and recovery. J. Funct. Foods 2016, 27, 549–569. [Google Scholar] [CrossRef]
  20. Wolter, A.; Hager, A.S.; Zannini, E.; Czerny, M.; Arendt, E.K. Impact of sourdough fermented with Lactobacillus plantarum FST 1.7 on baking and sensory properties of gluten-free breads. Eur. Food Res. Technol. 2014, 239, 1–12. [Google Scholar] [CrossRef]
  21. Gallagher, E.; Gormley, T.R.; Arendt, E.K. Crust and crumb characteristics of gluten-free breads. J. Food Eng. 2003, 56, 153–161. [Google Scholar] [CrossRef]
  22. Gobbetti, M.; Rizzello, C.G.; Di Cagno, R.; De Angelis, M. How the sourdough may affect the functional features of leavened baked goods. Food Microbiol. 2014, 37, 30–40. [Google Scholar] [CrossRef] [PubMed]
  23. Coda, R.; Cagno, R.D.; Gobbetti, M.; Rizzello, C.G. Sourdough lactic acid bacteria: Exploration of non-wheat cereal-based fermentation. Food Microbiol. 2014, 37, 51–58. [Google Scholar] [CrossRef] [PubMed]
  24. Gobbetti, M.; De Angelis, M.; Corsetti, A.; Di Cagno, R.; Calasso, R.; Archetti, G.; Rizzello, C.G. Novel insights on the functional/nutritional features of the sourdough fermentation. Int. J. Food Microbiol. 2019, 302, 1–11. [Google Scholar] [CrossRef] [PubMed]
  25. Arendt, E.K.; Moroni, A.; Zannini, E. Medical nutrition therapy: Use of sourdough lactic acid bacteria as a cell factory for delivering functional biomolecules and food ingredients in gluten free bread. Microb. Cell Fact. 2011, 10 (Suppl. 1), 1–9. [Google Scholar] [CrossRef] [Green Version]
  26. Zannin, E.; Pontonio, E.; Waters, D.M.; Arendt, E.K. Applications of microbial fermentations for production of gluten-free products and perspectives. Appl. Microbiol. Biotechnol. 2012, 93, 473–485. [Google Scholar] [CrossRef]
  27. Arena, M.P.; Russo, P.; Spano, G.; Capozzi, V. From microbial ecology to innovative applications in food quality improvements: The case of sourdough as a model matrix. J. Multidiscip. Sci. J. 2020, 3, 3. [Google Scholar] [CrossRef] [Green Version]
  28. Axel, C.; Brosnan, B.; Zannini, E.; Peyer, L.C.; Furey, A.; Coffey, A.; Arendt, E.K. Antifungal activities of three different Lactobacillus species and their production of antifungal carboxylic acids in wheat sourdough. Appl. Microbiol. Biotechnol. 2016, 100, 1701–1711. [Google Scholar] [CrossRef]
  29. Păucean, A.; Vodnar, D.C.; Socaci, S.A.; Socaciu, C. Carbohydrate metabolic conversions to lactic acid and volatile derivatives, as influenced by Lactobacillus plantarum ATCC 8014 and Lactobacillus casei ATCC 393 efficiency during in vitro and sourdough fermentation. Eur. Food Res. Technol. 2013, 237, 679–689. [Google Scholar] [CrossRef]
  30. Salvetti, A.; Torriani, S.; Felis, G.E. The genus Lactobacillus: A taxonomic update. Probiotics Antimicrob. Proteins 2012, 4, 217–226. [Google Scholar] [CrossRef]
  31. Hammes, W.P.; Vogel, R.F. The Genus Lactobacillus. In The Genera of Lactic Acid Bacteria; Wood, B.J.B., Holzapfel, W.H., Eds.; Blackie Academic & Professional: London, UK, 1995; pp. 19–54. [Google Scholar]
  32. Corsetti, A.; Settanni, L. Lactobacilli in sourdough fermentation. Food Res. Int. 2007, 40, 539–558. [Google Scholar] [CrossRef]
  33. De Vuyst, L.; Neysens, P. The sourdough microflora: Biodiversity and metabolic interactions. Trends Food Sci. Technol. 2005, 16, 43–56. [Google Scholar] [CrossRef]
  34. Olojede, A.O.; Sanni, A.I.; Banwo, K. Rheological, textural and nutritional properties of gluten-free sourdough made with functionally important lactic acid bacteria and yeast from Nigerian sorghum. LWT 2020, 120, 1–8. [Google Scholar] [CrossRef]
  35. Di Cagno, R.; Rizzello, C.G.; De Angelis, M.; Cassone, A.; Giuliani, G.; Benedusi, A.; Limitone, A.; Surico, M.F.; Gobbetti, M. Use of selected sourdough strains of Lactobacillus for removing gluten and enhancing the nutritional properties of gluten-free bread. J. Food Prot. 2008, 71, 1491–1495. [Google Scholar] [CrossRef] [PubMed]
  36. Vogelmann, S.A.; Seitter, M.; Singer, U.; Brandt, M.J.; Hertel, C. Adaptability of lactic acid bacteria and yeasts to sourdoughs prepared from cereals, pseudocereals and cassava and use of competitive strains as starters. Int. J. Food Microbiol. 2009, 130, 205–212. [Google Scholar] [CrossRef]
  37. Moroni, A.V.; Arendt, E.K.; Bello, F.D. Biodiversity of lactic acid bacteria and yeasts in spontaneously-fermented buckwheat and teff sourdoughs. Food Microbiol. 2011, 28, 497–502. [Google Scholar] [CrossRef]
  38. Chiş, M.S.; Păucean, A.; Stan, L.; Mureşan, V.; Vlaic, R.A.; Man, S.; Biriş-Dorhoi, S.E.; Muste, S. Lactobacillus plantarum ATCC 8014 in quinoa sourdough adaptability and antioxidant potential. Rom. Biotechnol. Lett. 2018, 23, 13581–13591. [Google Scholar]
  39. Chiş, M.S.; Păucean, A.; Man, S.M.; Bonta, V.; Pop, A.M.; Stan, L.; Beldean, B.V.; Pop, C.R.; Mureșan, V.; Muste, S. Effect of rice flour fermentation with Lactobacillus spicheri DSM 1549 on the nutritional features of gluten free muffins. Foods 2020, 9, 822. [Google Scholar] [CrossRef]
  40. Păucean, A.; Moldovan, O.P.; Mureşan, V.; Socaci, S.A.; Dulf, F.; Man, M.S.; Mureşan, A.E.; Muste, S. Folic acid, minerals, amino-acids, fatty acids and volatile compounds of green and red lentils. Folic acid content optimization in wheat-lentils composite flours. Chem. Cent. J. 2018, 12, 1–9. [Google Scholar]
  41. Urcan, A.D.; Criste, A.D.; Dezmirean, D.S.; Mărgăoan, R.; Caeiro, A.; Campos, M.G. Similarity of data from bee bread with the same taxa collected in India and Romania. Molecules 2018, 23, 2491. [Google Scholar] [CrossRef] [Green Version]
  42. Bunea, A.; Ruginǎ, D.O.; Pintea, A.M.; Sconţa, Z.; Bunea, C.I.; Socaciu, C. Comparative polyphenolic content and antioxidant activities of some wild and cultivated blueberries from Romania. Not. Bot. Horti Agrobot. 2011, 39, 70–76. [Google Scholar] [CrossRef] [Green Version]
  43. Păucean, A.; Man, S.M.; Chis, M.S.; Mureşan, V.; Pop, C.R.; Socaci, S.A.; Mureşan, C.C.; Muste, S. Use of pseudocereals preferment made with aromatic yeast strains for enhancing wheat bread quality. Foods 2019, 8, 443. [Google Scholar] [CrossRef] [PubMed] [Green Version]
  44. Dordević, T.M.; Šiler-Marinković, S.S.; Dimitrijević-Branković, S.I. Effect of fermentation on antioxidant properties of some cereals and pseudo cereals. Food Chem. 2010, 119, 957–963. [Google Scholar] [CrossRef]
  45. Teleky, B.E.; Martău, A.G.; Ranga, F.; Chețan, F.; Vodnar, D.C. Exploitation of lactic acid bacteria and Baker’s yeast as single or multiple starter cultures of wheat flour dough enriched with soy flour. Biomolecules 2020, 10, 778. [Google Scholar] [CrossRef] [PubMed]
  46. Schoenlechner, R. Quinoa: Its Unique Nutritional and Health-Promoting Attributes. In Gluten-Free Ancient Grains. Cereal, Pseudocereals and Legumes: Sustainaible, Nutritious and Health-Promoting Foods for the 21st Century, 1st ed.; Taylor, J., Awika, J.M., Eds.; Woodhead Publishing: Duxford, UK, 2017; pp. 105–129. [Google Scholar]
  47. Pellegrini, M.; Lucas-Gonzales, R.; Ricci, A.; Fontecha, J.; Fernandez-Lopez, J.; Perez-Alvarez, J.A.; Viuda-Martos, M. Chemical, fatty acid, polyphenolic profile, techno-functional and antioxidant properties of flours obtained from quinoa (Chenopodium quinoa Willd) seeds. Ind. Crop. Prod. 2018, 111, 38–46. [Google Scholar] [CrossRef]
  48. Pasko, P.; Barton, H.; Zagrodzki, P.; Izewska, A.; Krosniak, M.; Gawlik, M.; Gawlik, M.; Gorinstein, S. Effect of diet supplemented with quinoa seeds on oxidative status in plasma and selected tissues of high fructose-fed rats. Plant Foods Hum. Nutr. 2010, 65, 146–151. [Google Scholar] [CrossRef] [PubMed]
  49. Pereira, E.; Encina-Zelada, C.; Barros, L.; Gonzales-Barron, U.; Cadavez, V.; Ferreira, C.F.R. Chemical and nutritional characterization of Chenopodium quinoa Willd (quinoa) grains: A good alternative to nutritious food. Food Chem. 2019, 280, 110–114. [Google Scholar] [CrossRef] [PubMed] [Green Version]
  50. Angeli, M.; Silva, P.M.; Massuela, C.D.; Whan, M.W.; Hamar, A.; Khajehei, F.; Graeff-Hönninge, S.; Piatti, C. Quinoa (Chenopodium quinoa Willd.): An overview of the potentials of the “Golden Grain” and socio-economic and environmental aspects of its cultivation and marketization. Foods 2020, 9, 216. [Google Scholar] [CrossRef] [Green Version]
  51. Vázquez-Luna, A.; Fuentes, F.; Rivadeneyra, E.; Hernández, C.; Díaz-Sobac, R. Nutrimental content and functional properties of Quinoa flour from Chile and Mexico. Cienc. E Investig. Agrar. 2019, 46, 144–153. [Google Scholar] [CrossRef]
  52. Romano, N.; Ureta, M.M.; Guerrero-Sánchez, M.; Gómez-Zavaglia, A. Nutritional and technological properties of a quinoa (Chenopodium quinoa Willd.) spray-dried powdered extract. Food Res. Int. 2020, 129, 1–11. [Google Scholar] [CrossRef]
  53. Franco, W.; Pérez-Díaz, I.M.; Connelly, L.; Diaz, J.T. Isolation of exopolysaccharide-producing yeast and lactic acid bacteria from quinoa (Chenopodium quinoa) sourdough fermentation. Foods 2020, 9, 337. [Google Scholar] [CrossRef] [PubMed] [Green Version]
  54. Saubade, F.; Hemery, Y.M.; Rochette, I.; Guyot, J.P.; Humblot, C. Influence of fermentation and other processing steps on the folate content of a traditional African cereal-based fermented food. Int. J. Food Microbiol. 2018, 266, 79–86. [Google Scholar] [CrossRef]
  55. Bilgiçl, N.; İbanoğlu, Ş. Effect of pseudo cereal flours on some physical, chemical and sensory properties of bread. J. Food Sci. Technol. 2015, 52, 7525–7529. [Google Scholar] [CrossRef]
  56. Schoenlechner, R.; Wendner, M.; Siebenhandl-Ehn, S.; Berghofer, E. Pseudocereals as alternative sources for high folate content in staple foods. J. Cereal Sci. 2010, 52, 475–479. [Google Scholar] [CrossRef]
  57. Li, G.; Zhu, F. Physicochemical properties of quinoa flour as affected by starch interactions. Food Chem. 2017, 221, 1560–1568. [Google Scholar] [CrossRef] [PubMed]
  58. Iglesias-Puig, E.; Monedero, V.; Haros, M. Bread with whole quinoa flour and bifidobacterial phytases increases dietary mineral intake and bioavailability. LWT Food Sci. Technol. 2015, 60, 71–77. [Google Scholar] [CrossRef] [Green Version]
  59. Valcárcel-Yamani, B.; Caetano da Silva Lannes, S. Applications of Quinoa (Chenopodium quinoa Willd) and amaranth (Amaranthus spp.) and their influence in the nutritional value of cereal based foods. Food Public Health 2012, 2, 265–275. [Google Scholar]
  60. Prado, F.E.; Fernández-Turiel, J.L.; Tsarouchi, M.; Psaras, G.K.; González, J.A. Variation of seed mineral concentrations in seven quinoa cultivars grown in two agroecological sites. Cereal Chem. 2014, 91, 453–459. [Google Scholar] [CrossRef] [Green Version]
  61. Gonzalez, J.A.; Konishi, Y.; Bruno, M.; Valoy, M.; Prado, F.E. Interrelationships among seed yield, total protein and amino acid composition of ten quinoa (Chenopodium quinoa) cultivars from two different agroecological regions. J. Sci. Food Agric. 2012, 92, 1222–1229. [Google Scholar] [CrossRef]
  62. Carciochi, R.A.; Dimitrov, K. Optimization of antioxidant phenolic compounds extraction from quinoa (Chenopodium quinoa) seeds. J. Food Sci. Technol. 2014, 52, 4396–4404. [Google Scholar] [CrossRef]
  63. De Carvalho, F.G.; Ovídio, P.P.; Padovan, G.J.; Jordão Junior, A.A.; Marchini, J.S.; Navarro, A.M. Metabolic parameters of postmenopausal women after quinoa or corn flakes intake-a prospective and double-blind study. Int. J. Food Sci. Nutr. 2014, 65, 380–385. [Google Scholar] [CrossRef] [PubMed]
  64. Arneja, I.; Tanwar, B.; Chauhan, A. Nutritional composition and health benefits of golden grain of 21st century, quinoa (Chenopodium quinoa willd.): A review. Pak. J. Nutr. 2015, 14, 1034–1040. [Google Scholar] [CrossRef] [Green Version]
  65. De Vuyst, L.; Vrancken, G.; Ravyts, F.; Rimaux, T.; Weckx, S. Biodiversity, ecological determinants, and metabolic exploitation of sourdough microbiota. Food Microbiol. 2009, 26, 666–675. [Google Scholar] [CrossRef] [PubMed]
  66. Montemurro, M.; Pontonio, E.; Gobbetti, M.; Rizzello, C.G. Investigation of the nutritional, functional and technological effects of the sourdough fermentation of sprouted flour. Int. J. Food Microbiol. 2018, 302, 1–7. [Google Scholar] [CrossRef] [PubMed]
  67. Von Wright, A.; Axerlsson, L. Lactic Acid Bacteria: An Introduction. In Lactic Acid Bacteria: Microbiological and Functional Aspects, 4th ed.; Lahtinen, S., Ouwehand, A.C., Salminen, S., Von Wright, A., Eds.; CRC Press, Taylor & Francis Group: Boca Raton, FL, USA; London, UK, 2011; pp. 1–17. [Google Scholar]
  68. Petrova, P.; Petrov, K. Lactic acid fermentation of cereals and pseudocereals: Ancient nutritional biotechnologies with modern applications. Nutrients 2020, 12, 1118. [Google Scholar] [CrossRef] [PubMed] [Green Version]
  69. Carrizo, S.L.; de Moreno de LeBlanc, A.; LeBlanc, J.G.; Rollán, G.C. Quinoa pasta fermented with lactic acid bacteria prevents nutritional deficiencies in mice. Food Res. Int. 2020, 127, 1–12. [Google Scholar] [CrossRef]
  70. Florou-paneri, P.; Christaki, E.; Bonos, E. Lactic Acid Bacteria as Source of Functional Ingredients. In Lactic Acid Bacteria, 1st ed.; Kongo, M., Ed.; Intech Open Limited: Rijeka, Croatia, 2013; pp. 1–26. [Google Scholar]
  71. Leblanc, J.G.; Savoy de Giori, G.; Smid, E.J.; Hugenholtz, J.; Sesma, F. Folate Production by Lactic Acid Bacteria and Other Food-Grade Microorganisms. In Bioactive Foods as Dietary Interventions for Liver and Gastrointestinal Disease, 1st ed.; Watson, R.R., Preedy, V., Eds.; Academis Press: Cambridge, MA, USA, 2007; pp. 329–339. [Google Scholar]
  72. Carrizo, S.L.; Montes de Oca, C.E.; Laiño, J.E.; Suarez, N.E.; Vignolo, G.; LeBlanc, J.G.; Rollán, G. Ancestral Andean grain quinoa as source of lactic acid bacteria capable to degrade phytate and produce B-group vitamins. Food Res. Int. 2016, 89, 488–494. [Google Scholar] [CrossRef]
  73. Motta, C.; Delgado, I.; Matos, A.S.; Gonzales, G.B.; Torres, D.; Santos, M.; Chandra-Hioe, M.V.; Arcot, J.; Castanheira, I. Folates in quinoa (Chenopodium quinoa), amaranth (Amaranthus sp.) and buckwheat (Fagopyrum esculentum): Influence of cooking and malting. J. Food Compos. Anal. 2017, 64, 181–187. [Google Scholar] [CrossRef]
  74. LeBlanc, J.G.; Chain, F.; Martín, R.; Bermúdez-Humarán, L.G.; Courau, S.; Langella, P. Beneficial effects on host energy metabolism of short-chain fatty acids and vitamins produced by commensal and probiotic bacteria. Microb. Cell Fact. 2017, 16, 1–10. [Google Scholar] [CrossRef] [PubMed] [Green Version]
  75. Salvucci, E.; Leblanc, J.G.; Perez, G. Technological properties of Lactic Acid Bacteria isolated from raw cereal material. LWT Food Sci. Technol. 2016, 70, 1–26. [Google Scholar] [CrossRef]
  76. Taylor, J.R.N.; Belton, P.S.; Beta, T.; Duodu, K.G. Increasing the utilisation of sorghum, millets and pseudocereals: Developments in the science of their phenolic phytochemicals, biofortification and protein functionality. J. Cereal Sci. 2014, 59, 257–275. [Google Scholar] [CrossRef] [Green Version]
  77. Magala, M.; Kohajdová, Z.; Karovičová, J. Degradation of phytic acid during fermentation of cereal substrates. J. Cereal Sci. 2015, 61, 94–96. [Google Scholar] [CrossRef]
  78. Lopez, H.W.; Duclos, V.; Coudray, C.; Krespine, V.; Feillet-Coudray, C.; Messager, A.; Demigne’, C.; Remesy, C. Making bread with sourdough improves mineral bioavailability from reconstituted whole wheat flour in rats. Nutrition 2003, 19, 524–530. [Google Scholar] [CrossRef]
  79. Taylor, J.R.N.; Parker, M.L. Quinoa. In Pseudocereals and Less Common Cereals, Grain Properties and Utilization Potential, 1st ed.; Belton, S., Taylor, J.R.N., Eds.; Springer: Berlin/Heidelberg, Germany, 2002; pp. 93–122. [Google Scholar]
  80. Saa, D.T.; Di Silvestro, R.; Dinelli, G.; Gianotti, A. Effect of sourdough fermentation and baking process severity on dietary fibre and phenolic compounds of immature wheat flour bread. LWT Food Sci. Technol. 2017, 83, 26–32. [Google Scholar] [CrossRef]
  81. Montemurro, M.; Coda, R.; Rizzello, C.G. Recent advances in the use of Sourdough. Foods 2019, 8, 129. [Google Scholar] [CrossRef] [PubMed] [Green Version]
  82. Bolívar-Monsalve, J.; Ceballos-González, C.; Ramírez-Toro, C.; Bolívar, G.A. Reduction in saponin content and production of gluten-free cream soup base using quinoa fermented with Lactobacillus plantarum. J. Food Process. Preserv. 2018, 42, 1–10. [Google Scholar] [CrossRef]
  83. Sun, L.; Li, X.; Zhang, Y.; Yang, W.; Ma, G.; Ma, N.; Hu, Q.; Pei, F. A novel lactic acid bacterium for improving the quality and shelf life of whole wheat bread. Food Control 2020, 109, 1–9. [Google Scholar] [CrossRef]
  84. Wolter, A.; Hager, A.S.; Zannini, E.; Czerny, M.; Arendt, E.K. Influence of dextran-producing Weissella cibaria on baking properties and sensory profile of gluten-free and wheat breads. Int. J. Food Microbiol. 2014, 172, 83–91. [Google Scholar] [CrossRef]
  85. Turkut, G.M.; Cakmak, H.; Kumcuoglu, S.; Tavman, S. Effect of quinoa flour on gluten-free bread batter rheology and bread quality. J. Cereal Sci. 2016, 69, 174–181. [Google Scholar] [CrossRef]
  86. Mellado-Mojica, E.; Seeram, N.P.; López, M.G. Comparative analysis of maple syrups and natural sweeteners: Carbohydrates composition and classification (differentiation) by HPAEC-PAD and FTIR spectroscopy-chemometrics. J. Food Compos. Anal. 2016, 52, 1–8. [Google Scholar] [CrossRef]
  87. Nimalaratne, C.; Blackburn, J.; Lada, R.R. A comparative physicochemical analysis of maple (Acer saccharum Marsh.) syrup produced in North America with special emphasis on seasonal changes in Nova Scotia maple syrup composition. J. Food Compos. Anal. 2020, 92, 1–31. [Google Scholar] [CrossRef]
  88. Debonne, E.; Vermeulen, A.; Bouboutiefskia, N.; Ruyssen, T.; Van Bockstaeled, F.; Eeckhout, M.; Devlieghere, F. Modelling and validation of the antifungal activity of DL-3-phenyllactic acid and acetic acid on bread spoilage moulds. Food Microbiol. 2020, 88, 1–10. [Google Scholar] [CrossRef] [PubMed]
  89. Papadimitriou, K.; Zoumpopoulou, G.; Georgalaki, M.; Alexandraki, V.; Kazou, M.; Anastasiou, R.; Tsakalidou, E. Sourdough Bread, Innovations in Traditional Foods; Galanakis, C.M., Ed.; Woodhead Publishing: Cambridge, UK, 2019; pp. 127–158. [Google Scholar]
  90. Reddy, G.; Altaf, M.; Naveena, B.J.; Venkateshwar, M.; Kumar, E.V. Amylolytic bacterial lactic acid fermentation—A review. Biotechnol. Adv. 2008, 26, 22–34. [Google Scholar] [CrossRef] [PubMed]
  91. Kefalas, P.; Kotzamanidis, S.; Sabanis, D.; Yupsani, A.; Kefala, L.A.; Kokkalis, A.; Yupsanis, T. Bread making of durum wheat with chickpea sourdough or compressed baker’s yeast. J. Food. Qual. 2009, 32, 644–668. [Google Scholar] [CrossRef]
  92. Takata, Y.; Shu, X.O.; Buchowski, M.S.; Munro, H.M.; Wen, W.; Steinwandel, M.D.; Hargreaves, M.K.; Blot, W.J.; Cai, Q. Food intake of folate, folic acid and other B vitamins with lung cancer risk in a low-income population in the Southeastern United States. Eur. J. Nutr. 2020, 59, 671–683. [Google Scholar] [CrossRef]
  93. Chis, M.S.; Păucean, A.; Man, S.M.; Muresan, V.; Socaci, S.A.; Pop, A.; Stan, L.; Rusu, B.; Muste, S. Textural and sensory features changes of gluten free muffins based on rice sourdough fermented with Lactobacillus spicheri DSM 15429. Foods 2020, 9, 363. [Google Scholar] [CrossRef] [Green Version]
  94. Naqash, F.; Gani, A.; Gani, A.; Masoodi, F.A. Gluten-Free baking: Combating the challenges—A review. Trends Food Sci. Technol. 2017, 66, 98–107. [Google Scholar] [CrossRef]
  95. Capriles, V.D.; dos Santos, F.G.; Arêas, J.A.G. Gluten-Free breadmaking: Improving nutritional and bioactive compounds. J. Cereal Sci. 2016, 67, 83–91. [Google Scholar] [CrossRef]
  96. Li, L.; Shakhawat Hossain, M.D.; Ma, H.; Yang, Q.; Gong, X.; Yang, P.; Feng, B. Comparative metabolomics reveals diFferences in flavonoid metabolites among different coloured buckwheat flowers. J. Food Compos. Anal. 2019, 85, 1–8. [Google Scholar] [CrossRef]
  97. Chlopicka, J.; Pasko, P.; Gorinstein, S.; Jedryas, A.; Zagrodzki, P. Total phenolic and total flavonoid content, antioxidant activity and sensory evaluation of pseudocereal breads. LWT Food Sci. Technol. 2012, 46, 548–555. [Google Scholar] [CrossRef]
  98. Rizzello, C.G.; Lorusso, A.; Russo, V.; Pinto, D.; Marzani, B.; Gobbetti, M. Improving the antioxidant properties of quinoa flour through fermentation with selected autochthonous lactic acid bacteria. Int. J. Food Microbiol. 2017, 241, 252–261. [Google Scholar] [CrossRef] [PubMed]
  99. Cannas, M.; Pulina, S.; Conte, P.; del Caro, A.; Urgeghe, P.P.; Piga, A.; Fadda, C. Efect of substitution of rice flour with quinoa flour on the chemical-physical, nutritional, volatile and sensory parameters of gluten-free ladyfinger biscuits. Foods 2020, 9, 808. [Google Scholar] [CrossRef] [PubMed]
  100. Banu, I.; Vasilean, I.; Aprodu, I. Effect of lactic fermentation on antioxidant capacity of rye sourdough and bread. Food Sci. Technol. Res. 2010, 16, 571–576. [Google Scholar] [CrossRef]
Publisher’s Note: MDPI stays neutral with regard to jurisdictional claims in published maps and institutional affiliations.
Figure 1. Flow diagram of sourdough (SP—sourdough fermented with Lactobacillus plantarum; OR—spontaneous fermented sourdough) and muffins’ production.
Applsci 10 07140 g001
Figure 2. SP and OR folic acid content. Small letters in common indicate no significant differences between OR and SP samples withdrawn at different moments; Big different letters indicate significant differences between SP and OR samples withdrawn at the same moment.
Applsci 10 07140 g002
Figure 3. SP and OR total flavonoids content during 24 h of fermentation. Small letters in common indicate no significant differences between OR and SP samples withdrawn at different moments; Big different letters indicate significant differences between SP and OR samples withdrawn at the same moment.
Applsci 10 07140 g003
Figure 4. The storage (G’) and loss (G”) shear moduli for SP sourdough at different fermentation times: 0, 4, 8, 12, and 24 h.
Applsci 10 07140 g004
Figure 5. The storage (G’) and loss (G”) shear moduli for SP forzen sourdough at different fermentation times: 0, 4, 8, 12, and 24 h.
Applsci 10 07140 g005
Figure 6. The storage (G’) and loss (G”) shear moduli for OR sourdough at different fermentation times: 0, 4, 8, 12, and 24 h.
Applsci 10 07140 g006
Figure 7. The storage (G’) and loss (G”) shear moduli for OR forzen sourdough at different fermentation times: 0, 4, 8, 12, and 24 h.
Applsci 10 07140 g007
Figure 8. Folic acid content of gluten free muffins. Small letters in common indicate no significant differences between OR and SP samples withdrawn at different moments; Big different letters indicate significant differences between SP and OR samples withdrawn at the same moment.
Applsci 10 07140 g008
Figure 9. Total flavonoids of gluten free muffins. Small letters in common indicate no significant differences between OR and SP samples withdrawn at different moments; Big different letters indicate significant differences between SP and OR samples withdrawn at the same moments.
Applsci 10 07140 g009
Figure 10. Total phenols and radical scavenging activity of gluten free muffins. Small letters in common indicate no significant differences between OR and SP samples withdrawn at different moments; Big different letters indicate significant differences between SP and OR samples withdrawn at the same moment.
Applsci 10 07140 g010
Table 1. Carbohydrates and organic acids content of quinoa flour.
Parameters QWFRetention Times (min)
Carbohydrates (mg/g f.w.)
Maltose6.64 ± 0.208.87
Glucose89.45 ± 0.1310.24
Fructose12.12 ± 0.1510.88
Organic acids (mg/g f.w.)
Citric acid8.59 ± 0.309.39
Lactic acidn.d.13.76
Acetic acidn.d.15.92
Values of three different determinations followed by standard deviation; QWF: quinoa wholemeal flour; f.w.: fresh weight; n.d.: not detected.
Table 2. Chemical composition and mineral content of quinoa flour.
ParametersQWF
Minerals, mg/100 g f.w.
Calcium (Ca)18.09 ± 0.30
Magnesium (Mg)303.43 ± 0.17
Potassium (K)813.92 ± 0.11
Iron (Fe)3.02 ± 0.20
Copper (Cu)0.96 ± 0.03
Zinc (Zn)1.82 ± 0.02
Manganese (Mn)2.50 ± 0.01
Chromium (Cr)n.d.
Values of three different determinations followed by standard deviation; f.w.: fresh weight. QWF: quinoa wholemeal flour; n.d.: not detected.
Table 3. OR and SP carbohydrates and organic acids content during 24 h of fermentation.
Samples Maltose
mg/g f.w.
GlucoseFructoseCitric AcidLactic AcidAcetic Acid
mg/g f.w.mg/g f.w.mg/g f.w.mg/g f.w.mg/g f.w.
OR 0 h3.012 ± 0.02 Aa42.662 ± 0.34 Ac4.19 ± 0.19 Aabc5.25 ± 0.33 Abcn.d.n.d.
SP 0 h3.074 ± 0.21 Aa42.034 ± 0.54 Ac4.369 ± 0.28 Babc5.06 ± 0.22 Acdn.d.n.d.
OR 4 h2.979 ± 0.31 Aa46.576 ± 0.32 Abc4.21 ± 0.29 Babc4.26 ± 0.11 Aen.d.n.d.
SP 4 h3.053 ± 0.11 Aa46.085 ± 0.53 Abc3.15 ± 0.22 Ad4.92 ± 0.45 Bcdn.d.n.d.
OR 8 h2.848 ± 0.22 Aa51.126 ± 0.23 Abc4.76 ± 0.39 Ba4.74 ± 0.34 Adn.d.n.d.
SP 8 h2.916 ± 0.15 Aa67.672 ± 0.61 Ba3.75 ± 0.2 Abcd5.9 ± 0.36 Ban.d.n.d.
OR 12 h2.85 ± 0.25 Aa55.01 ±0.22 Bb4.48 ± 0.5 Bab5.06 ± 0.33 Acd2.42 ± 0.02 Aa0.50 ± 0.01 Aa
SP 12 h1.814 ± 0.14 Bb53.00 ± 0.45 Abc3.08 ± 0.4 Ad5.54 ± 0.12 Bab4.60 ± 0.05 Bb0.84 ± 0.02 Bab
OR 24 h2.09 ± 0.03 Ab46.02 ± 0.39 Bbc3.66 ± 0.6 Bcd5.15 ± 0.44 Bbcd3.81 ± 0.31 Ab2.98 ± 0.21 Bc
SP 24 h1.05 ± 0.30 Bc22.00 ± 0.27 Ad1.69 ± 0.4 Ae4.89 ± 0.33 Acd8.50 ± 0.5 Bc1.40 ± 0.21 Ab
Small letters in common indicate no significant differences between OR and SP samples withdrawn at different moments; Big different letters indicate significant differences between SP and OR samples at the same moment; f.w.: fresh weight; n.d.: not detected.
Table 4. Mineral content of OR and SP sourdoughs at different fermentation times.
SamplesCaMgKFeCuZnMn
OR 0 h8.06 ± 0.13 Aa156.09 ± 0.34 Aa330.9 ± 0.89 Aa0.61 ± 0.02 Aa0.11 ± 0.01 Aa0.46 ± 0.02 Aa0.55 ± 0.02 Aa
SP 0 h8.12 ± 0.11 Ba151.00 ± 0.23 Aa325.01 ± 0.99 Aa0.63 ± 0.03 Aab0.12 ± 0.02 Aa0.49 ± 0.01 Aa0.59 ± 0.06 Aab
OR 4 h8.23± 0.17 Aa159.03 ± 0.03 Aa341.08 ± 0.77 Aa0.69 ± 0.05 Aab0.13 ± 0.04 Aa0.50 ± 0.03 Aa0.57 ± 0.05 Aa
SP 4 h8.55 ± 0.33 Ba163.09 ± 0.03 Bab378.04 ± 0.88 Bbc0.75 ± 0.34 Aabc0.17 ± 0.01 Aab0.53 ± 0.04 Aa0.65 ± 0.07 Aab
OR 8 h8.9 ± 0.22 Aa172.04 ± 0.23 Aabc353.56 ± 0.89 Aab0.71 ± 0.11 Aab0.23 ± 0.01 Aab0.60 ± 0.01 Aa0.60 ± 0.06 Aab
SP 8 h9.6 ± 0.34 Bab176.89 ± 0.56 Babc456.67 ± 0.67 Bef0.89 ± 0.33 Bd0.29 ± 0.02 Ab0.72 ± 0.03 Aa0.72 ± 0.08 Abc
OR 12 h9.53 ± 0.11 Aab171.23 ± 0.45 Aabc386.4 ± 0.69 Abc0.77 ± 0.11 Abcd0.16 ± 0.03 Aab0.63 ± 0.02 Aa0.58 ± 0.06 Aa
SP 12 h11.67 ± 0.22 Bc198.98 ± 0.64 Bc407.61 ± 0.88 Bcd1.11 ± 0.02 Be0.51 ± 0.02 Bc0.99 ± 0.01 Bb0.89 ± 0.05 Bd
OR 24 h10.86 ± 0.45 Abc189.21 ± 0.59 Abc427.53 ± 0.79 Ade0.87 ± 0.02 Acd0.21 ± 0.04 Aab0.62 ± 0.02 Aa0.78 ± 0.03 Acd
SP 24 h17.06 ± 0.32 Bd294.59 ± 0.89 Bd486.44 ± 0.98 Bf1.42 ± 0.04 Bf0.79 ± 0.05 Bd1.68 ± 0.00 Bc1.23 ± 0.07 Be
The results are expressed in mg/100 g fresh weight. Small letters in common indicate no significant differences between OR and SP samples withdrawn at different moments; Big different letters indicate significant differences between SP and OR samples withdrawn at the same moment.
Table 5. Carbohydrates and organic acids of gluten free muffins manufactured with OR and SP sourdoughs at different fermentation times.
SampleMaltoseGlucoseFructoseCitric AcidLactic AcidAcetic Acid
mg/g f.w.mg/g f.w.mg/g f.w.mg/g f.w.mg/g f.w.mg/g f.w.
OR PF 0 h4.43 ± 0.03 Ade20.06 ± 0.31 Ad14.72 ± 0.56 Ade1.72 ± 0.05 Aan.d.n.d.
SP PF 0 h4.15 ± 0.23 Acd20.18 ± 0.22 Ad14.17 ± 0.45 Acd1.73 ± 0.03 Aabn.d.n.d.
OR PF 12 h4.84 ± 0.23 Be19.58 ± 0.34 Bd15.39 ± 0.39 Be1.72 ± 0.11 Aa0.44 ± 0.02 Aa0.80 ± 0.02 Ba
SP PF 12 h3.14 ± 0.11 Ab17.67± 0.67 Ab12.92 ± 0.56 Ab1.86 ± 0.43 Aac0.93 ± 0.05 Bc0.62 ± 0.04 Aa
OR PF 24 h3.82 ± 0.03 Bc18.65 ± 0.55 Bc13.55 ± 0.88 Bbc2.27 ± 0.02 Ad0.82 ± 0.07 Ab1.69 ± 0.09 Bb
SP PF 24 h2.58 ± 0.34 Aa16.37 ± 0.77 Aa10.57 ± 0.65 Aa2.30 ± 0.27 Ad1.52 ± 0.08 Bd1.02 ± 0.09 Aa
The results are expressed in mg/100 g fresh weight (f.w.). Small letters in common indicate no significant differences between OR and SP samples withdrawn at different moments; Big different letters indicate significant differences between SP and OR samples withdrawn at the same moment; n.d.: not detected.
Table 6. Mineral content of SP PF and OR PF muffins.
SamplesCaMgKFeCuZnMn
OR PF 0 h8.21 ± 0.03 Aa147.16 ± 0.07 Aa411.67 ± 0.03 Aa0.99 ± 0.02 Aa0.40 ± 0.05 Aa0.90 ± 0.23 Aa0.89 ± 0.02 Aa
SP PF 0 h8.34 ± 0.05 Aa148.32 ± 0.09 Aa410.36 ± 0.29 Aab1.00 ± 0.03 Aa0.41 ± 0.04 Aa0.93 ± 0.02 Aa0.90 ± 0.05 Aa
OR PF 12 h10.30 ± 0.02 Aab151.00 ± 0.07 Aa420.69 ± 0.34 Aab1.03 ± 0.05 Aa0.41 ± 0.01 Aa1.09 ± 0.05 Ab0.99 ± 0.04 Ab
SP PF 12 h12.06 ± 0.01 Bd172.12 ± 0.04 Bb465.24 ± 0.69 Bc1.30 ± 0.06 Ab0.40 ± 0.34 Ab1.34 ± 0.07 Ac1.22 ± 0.45 Ac
OR PF 24 h11.20 ± 0.30 Ac159.81 ± 0.02 Aab430.95 ± 0.72 Ab1.09 ± 0.03 Aa0.45 ± 0.21 Aab1.20 ± 0.11 Ab1.12 ± 0.34 Ad
SP PF 24 h14.25 ± 0.65 Be195.99 ± 0.02 Bc490.20 ± 0.89 Bd1.55 ± 0.01 Bc0.89 ± 0.11 Bc1.75 ± 0.10 Bd1.51 ± 0.22 Be
The results are expressed in mg/100 g fresh weight (f.w.). Small letters in common indicate no significant differences between OR and SP samples withdrawn at different moments; Big different letters indicate significant differences between SP and OR samples withdrawn at the same moment.

