Mechanical Fracture and Fatigue Characteristics of Fine-Grained Composite Based on Sodium Hydroxide-Activated Slag Cured under High Relative Humidity

 ,
,  , , , and
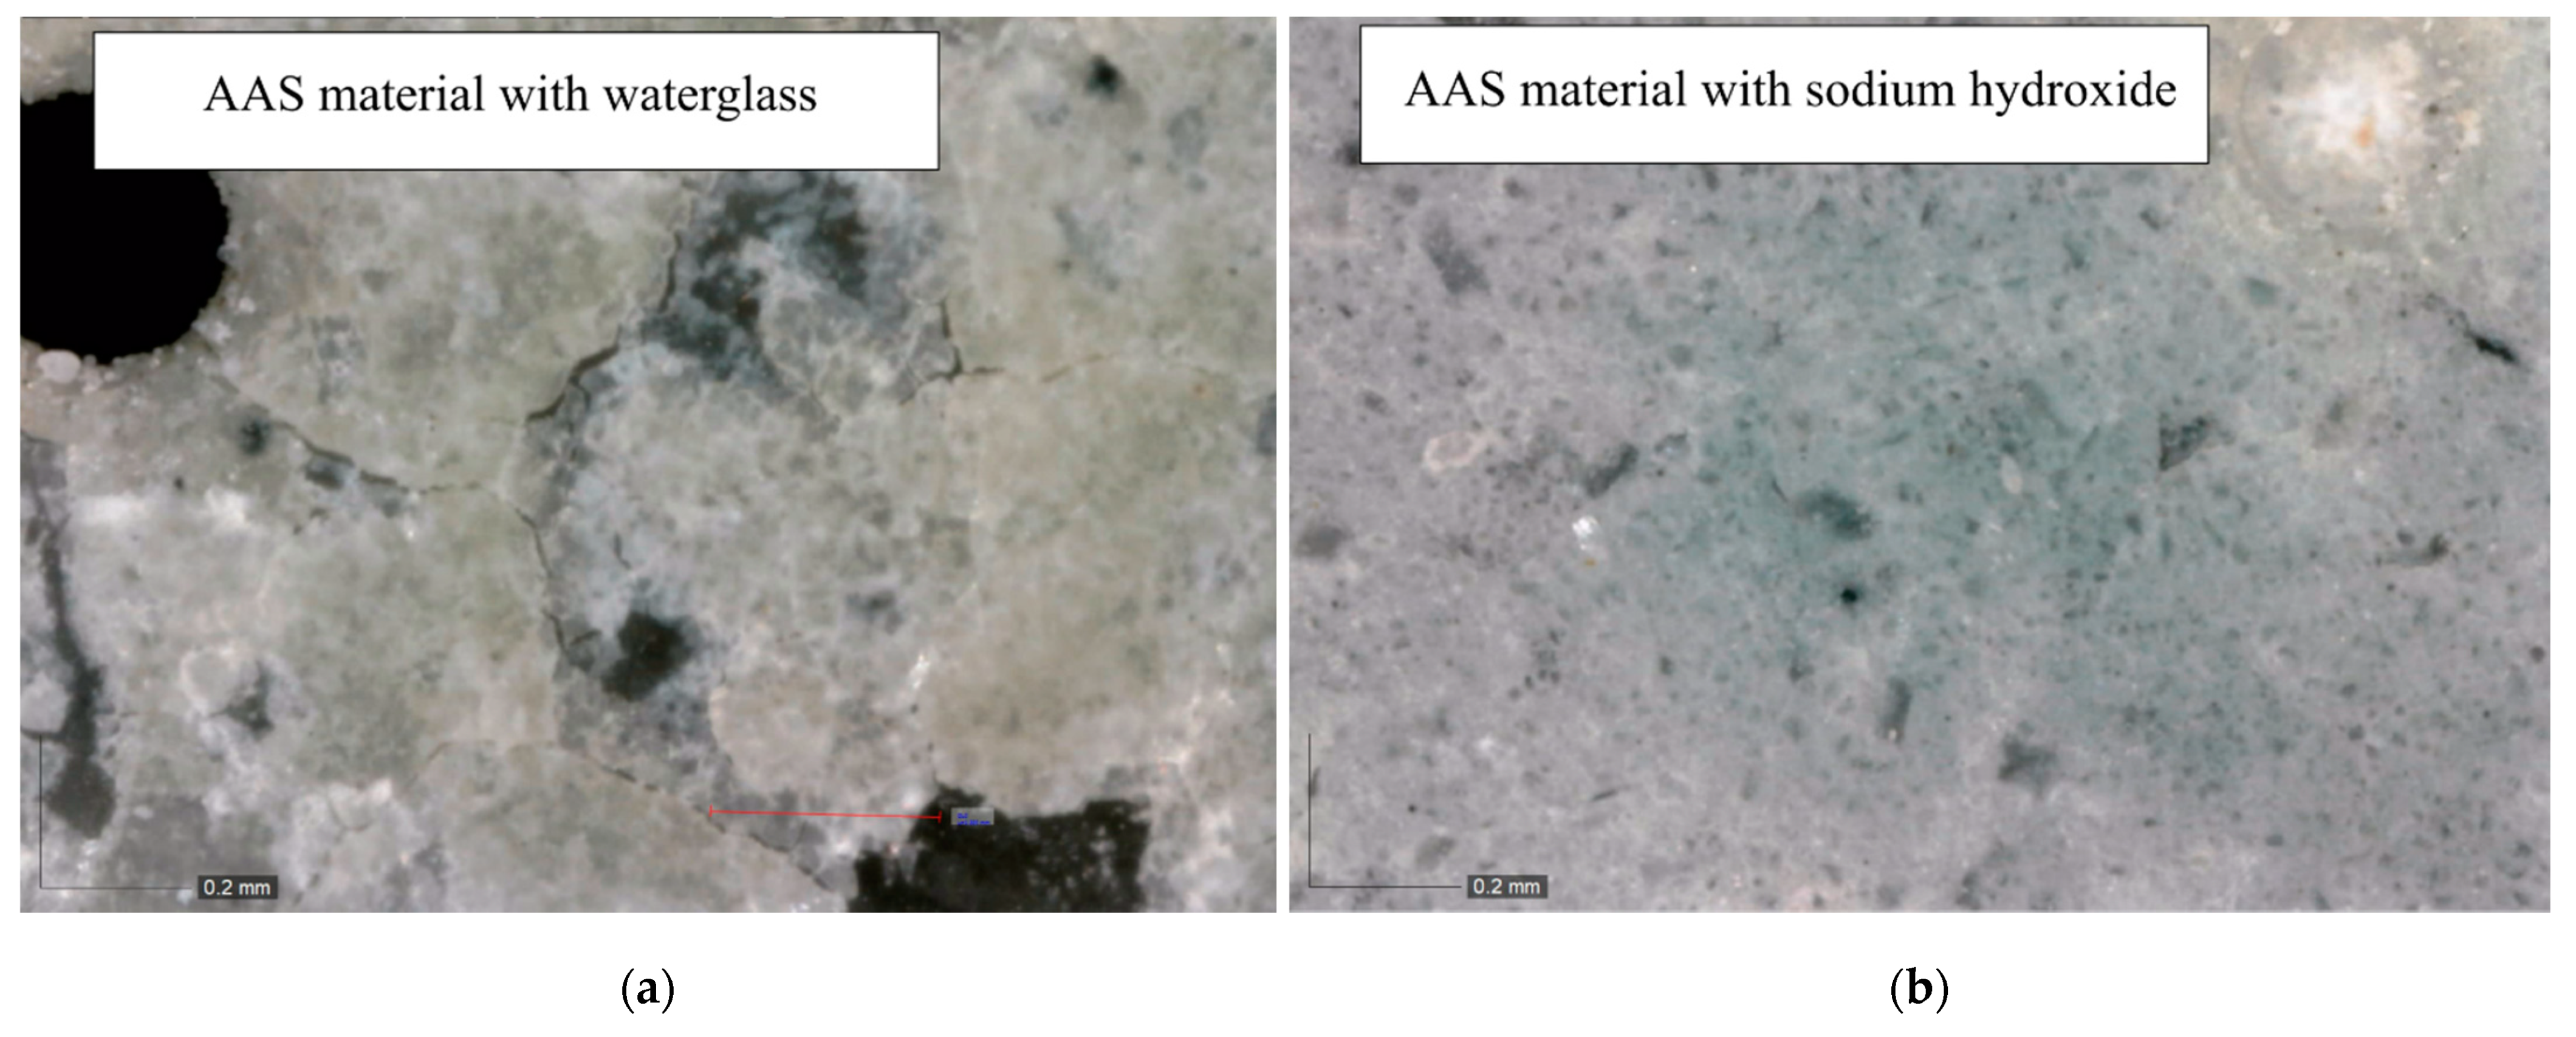
Abstract
:1. Introduction
2. Materials and Methods
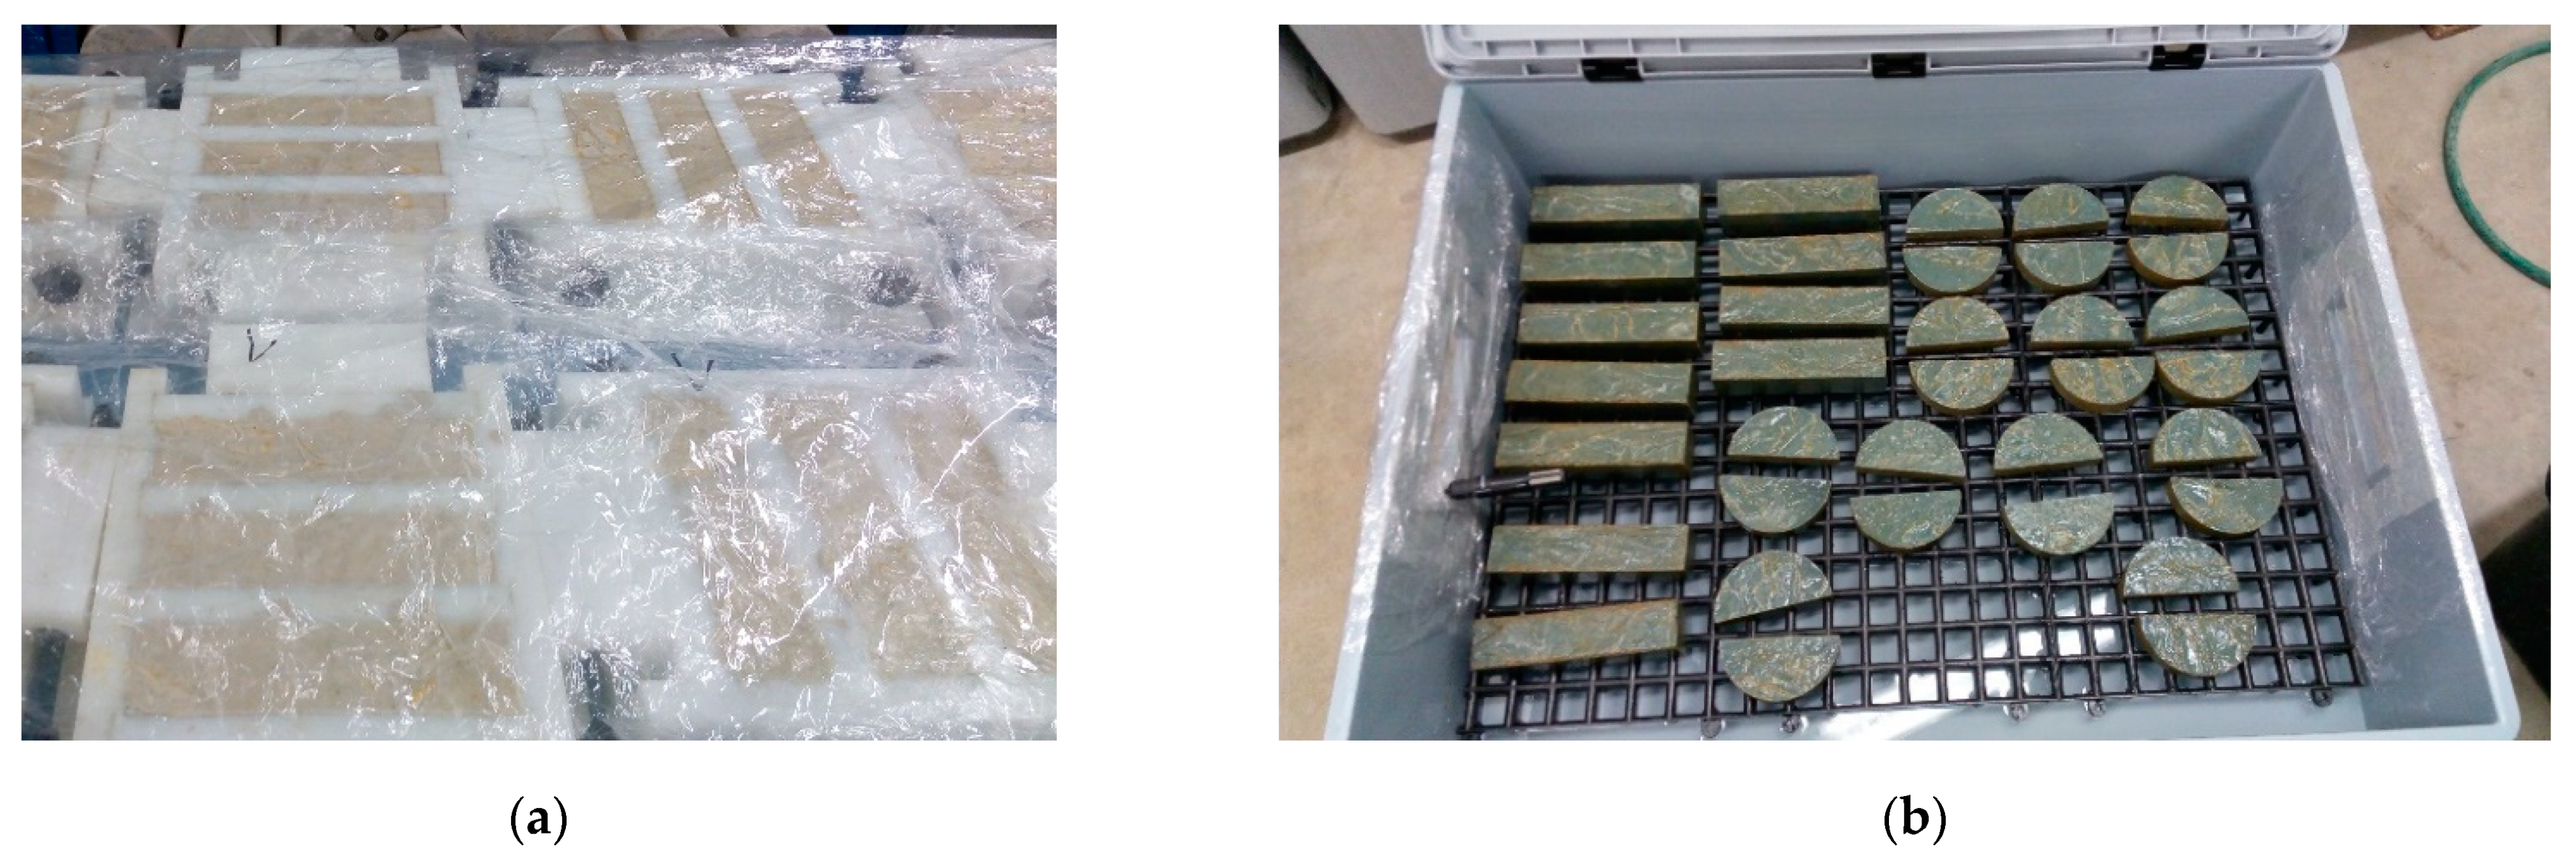
2.1. Materials and Specimens
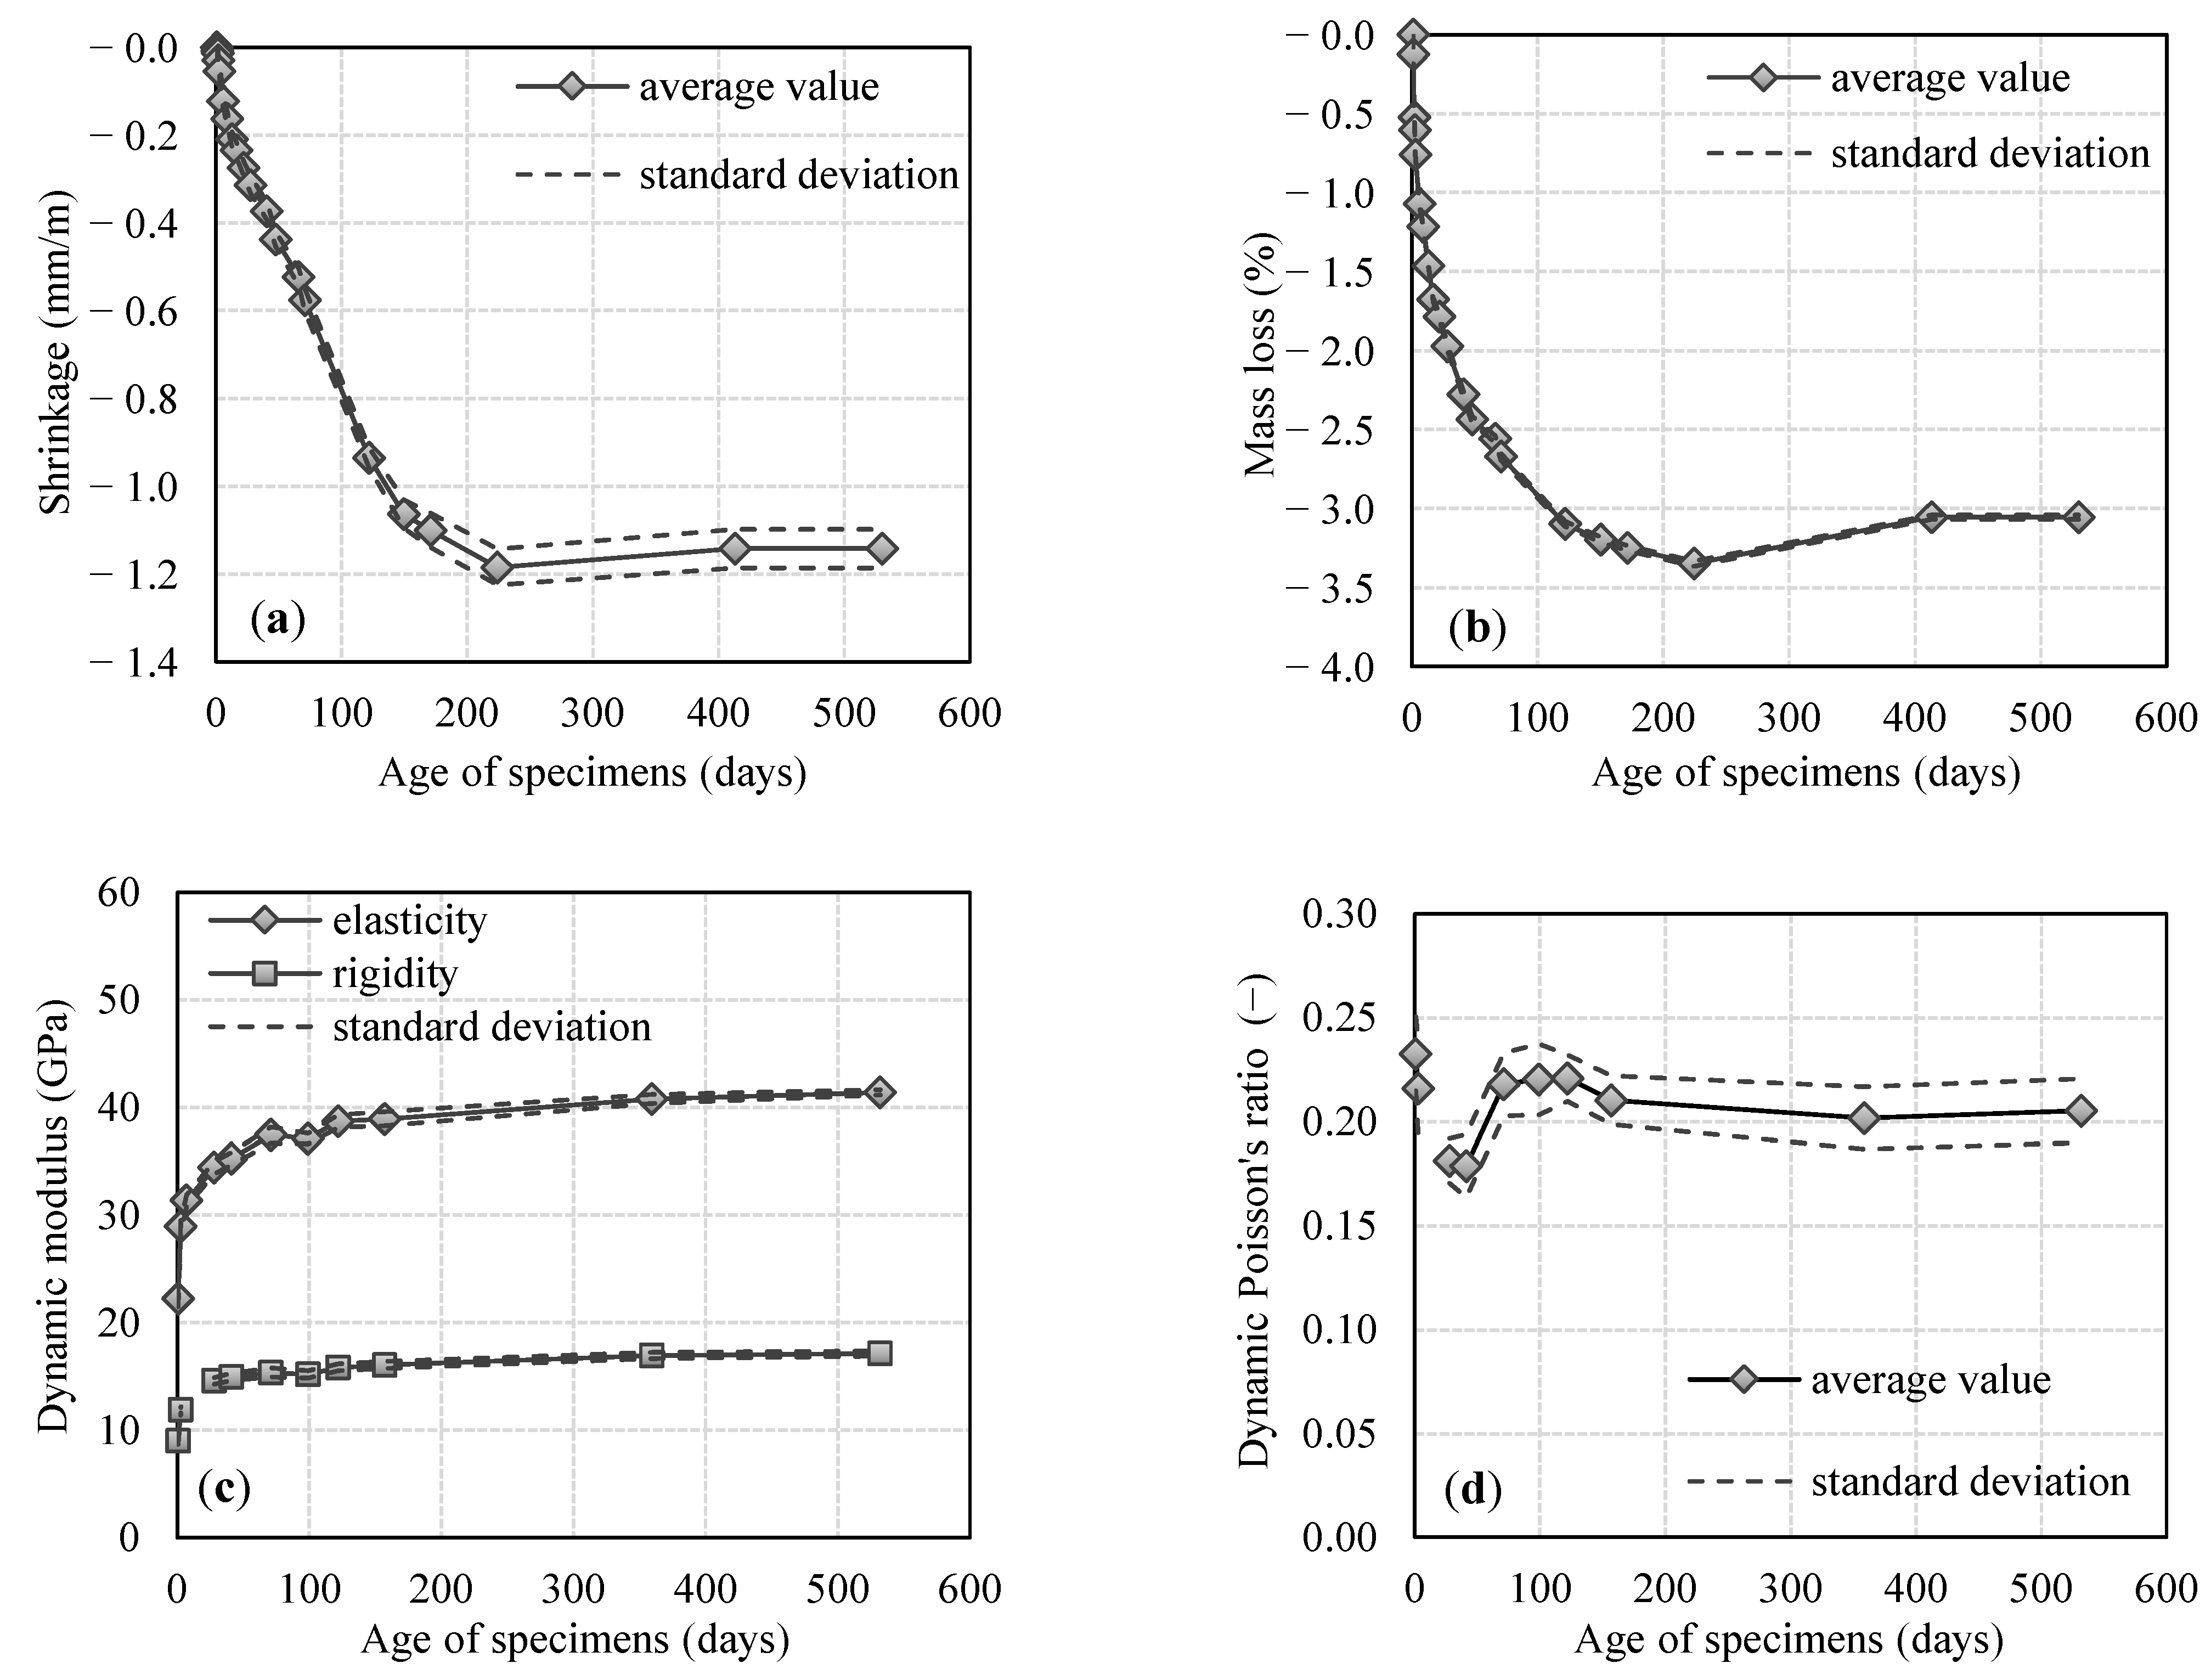
2.2. Shrinkage Measurement
2.3. Dynamic Modulus of Elasticity and Rigidity, and Dynamic Poisson’s Ratio
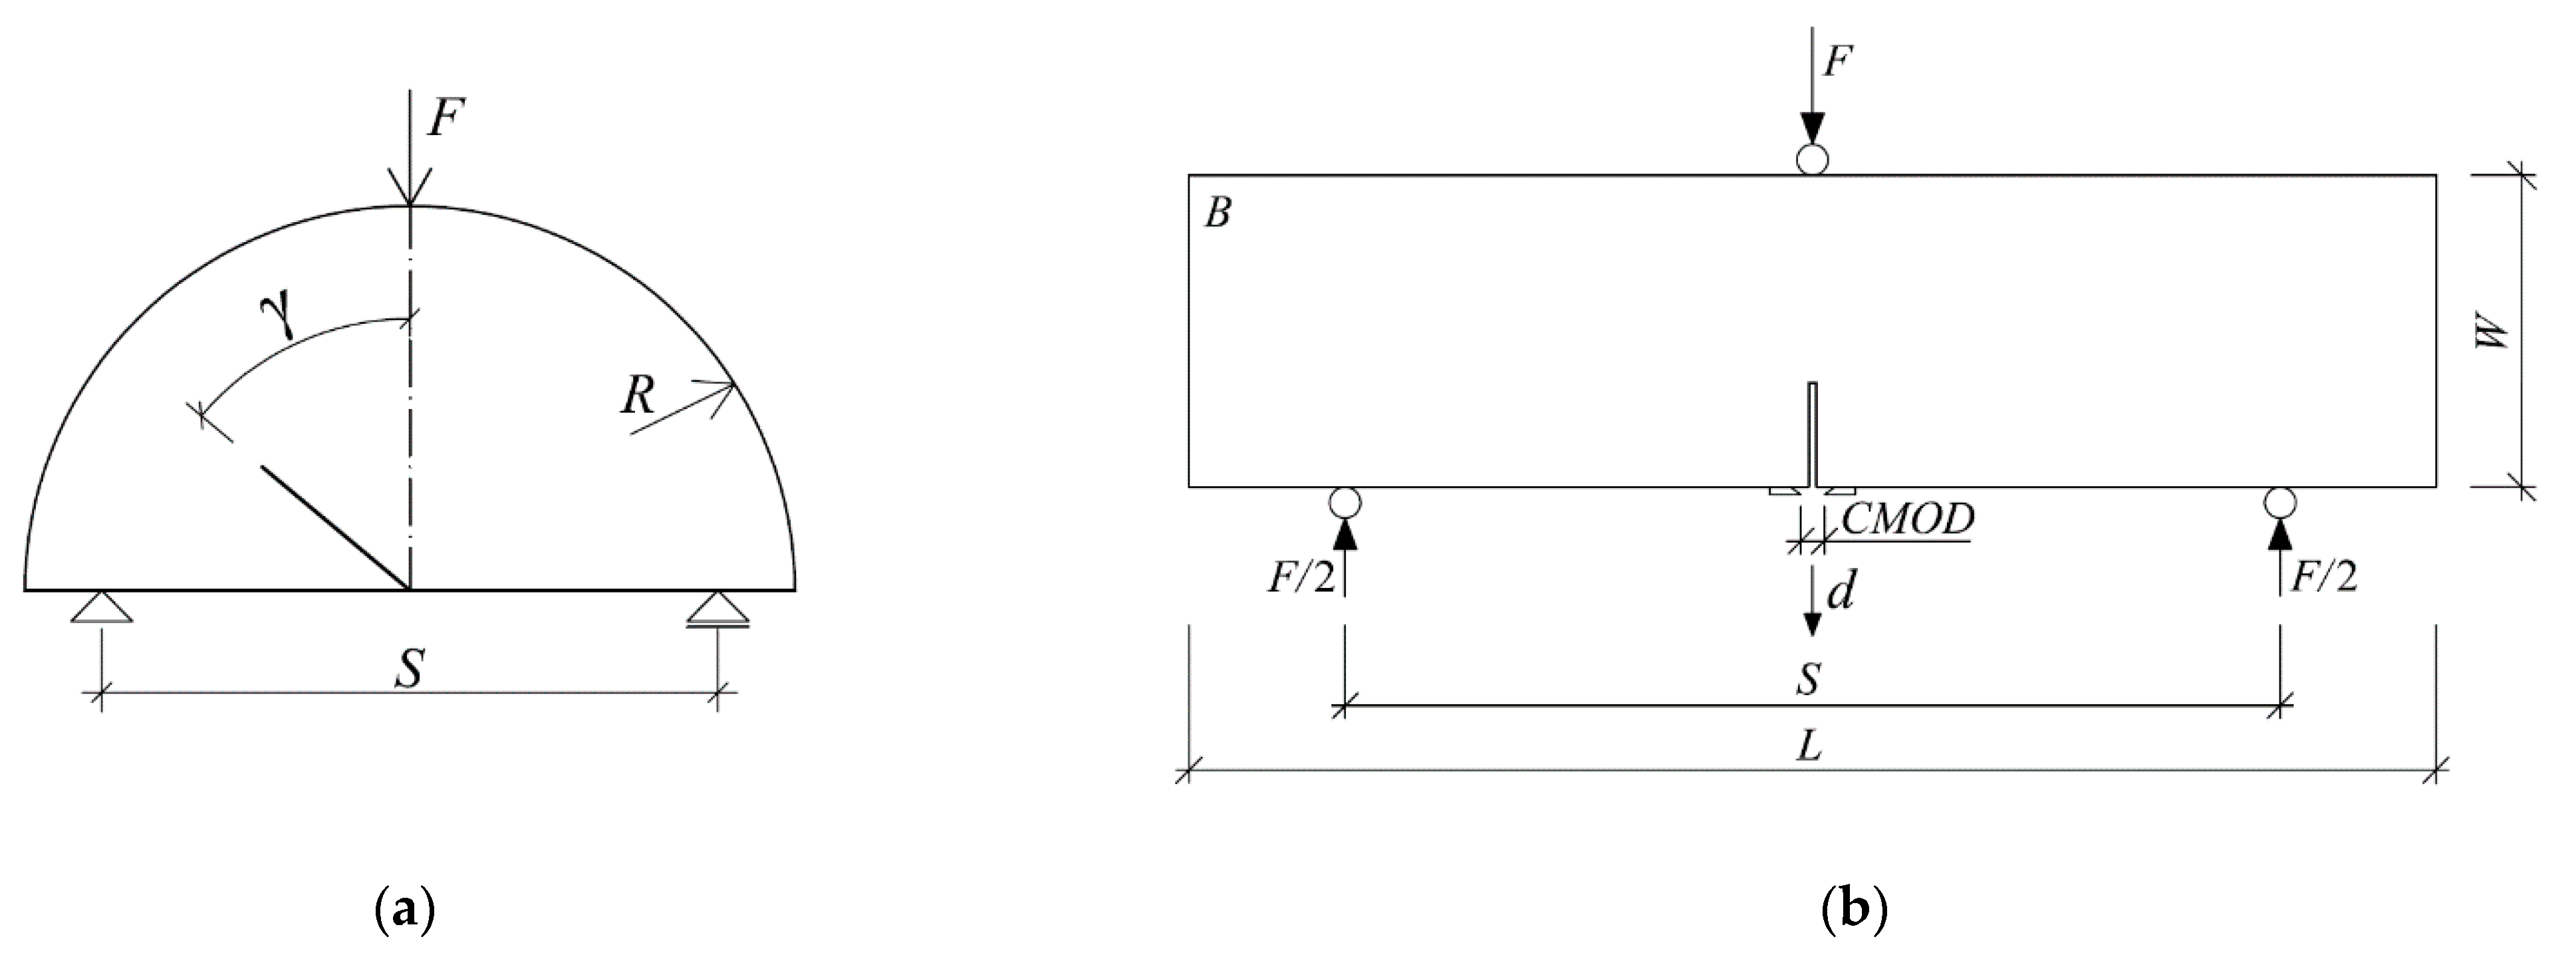
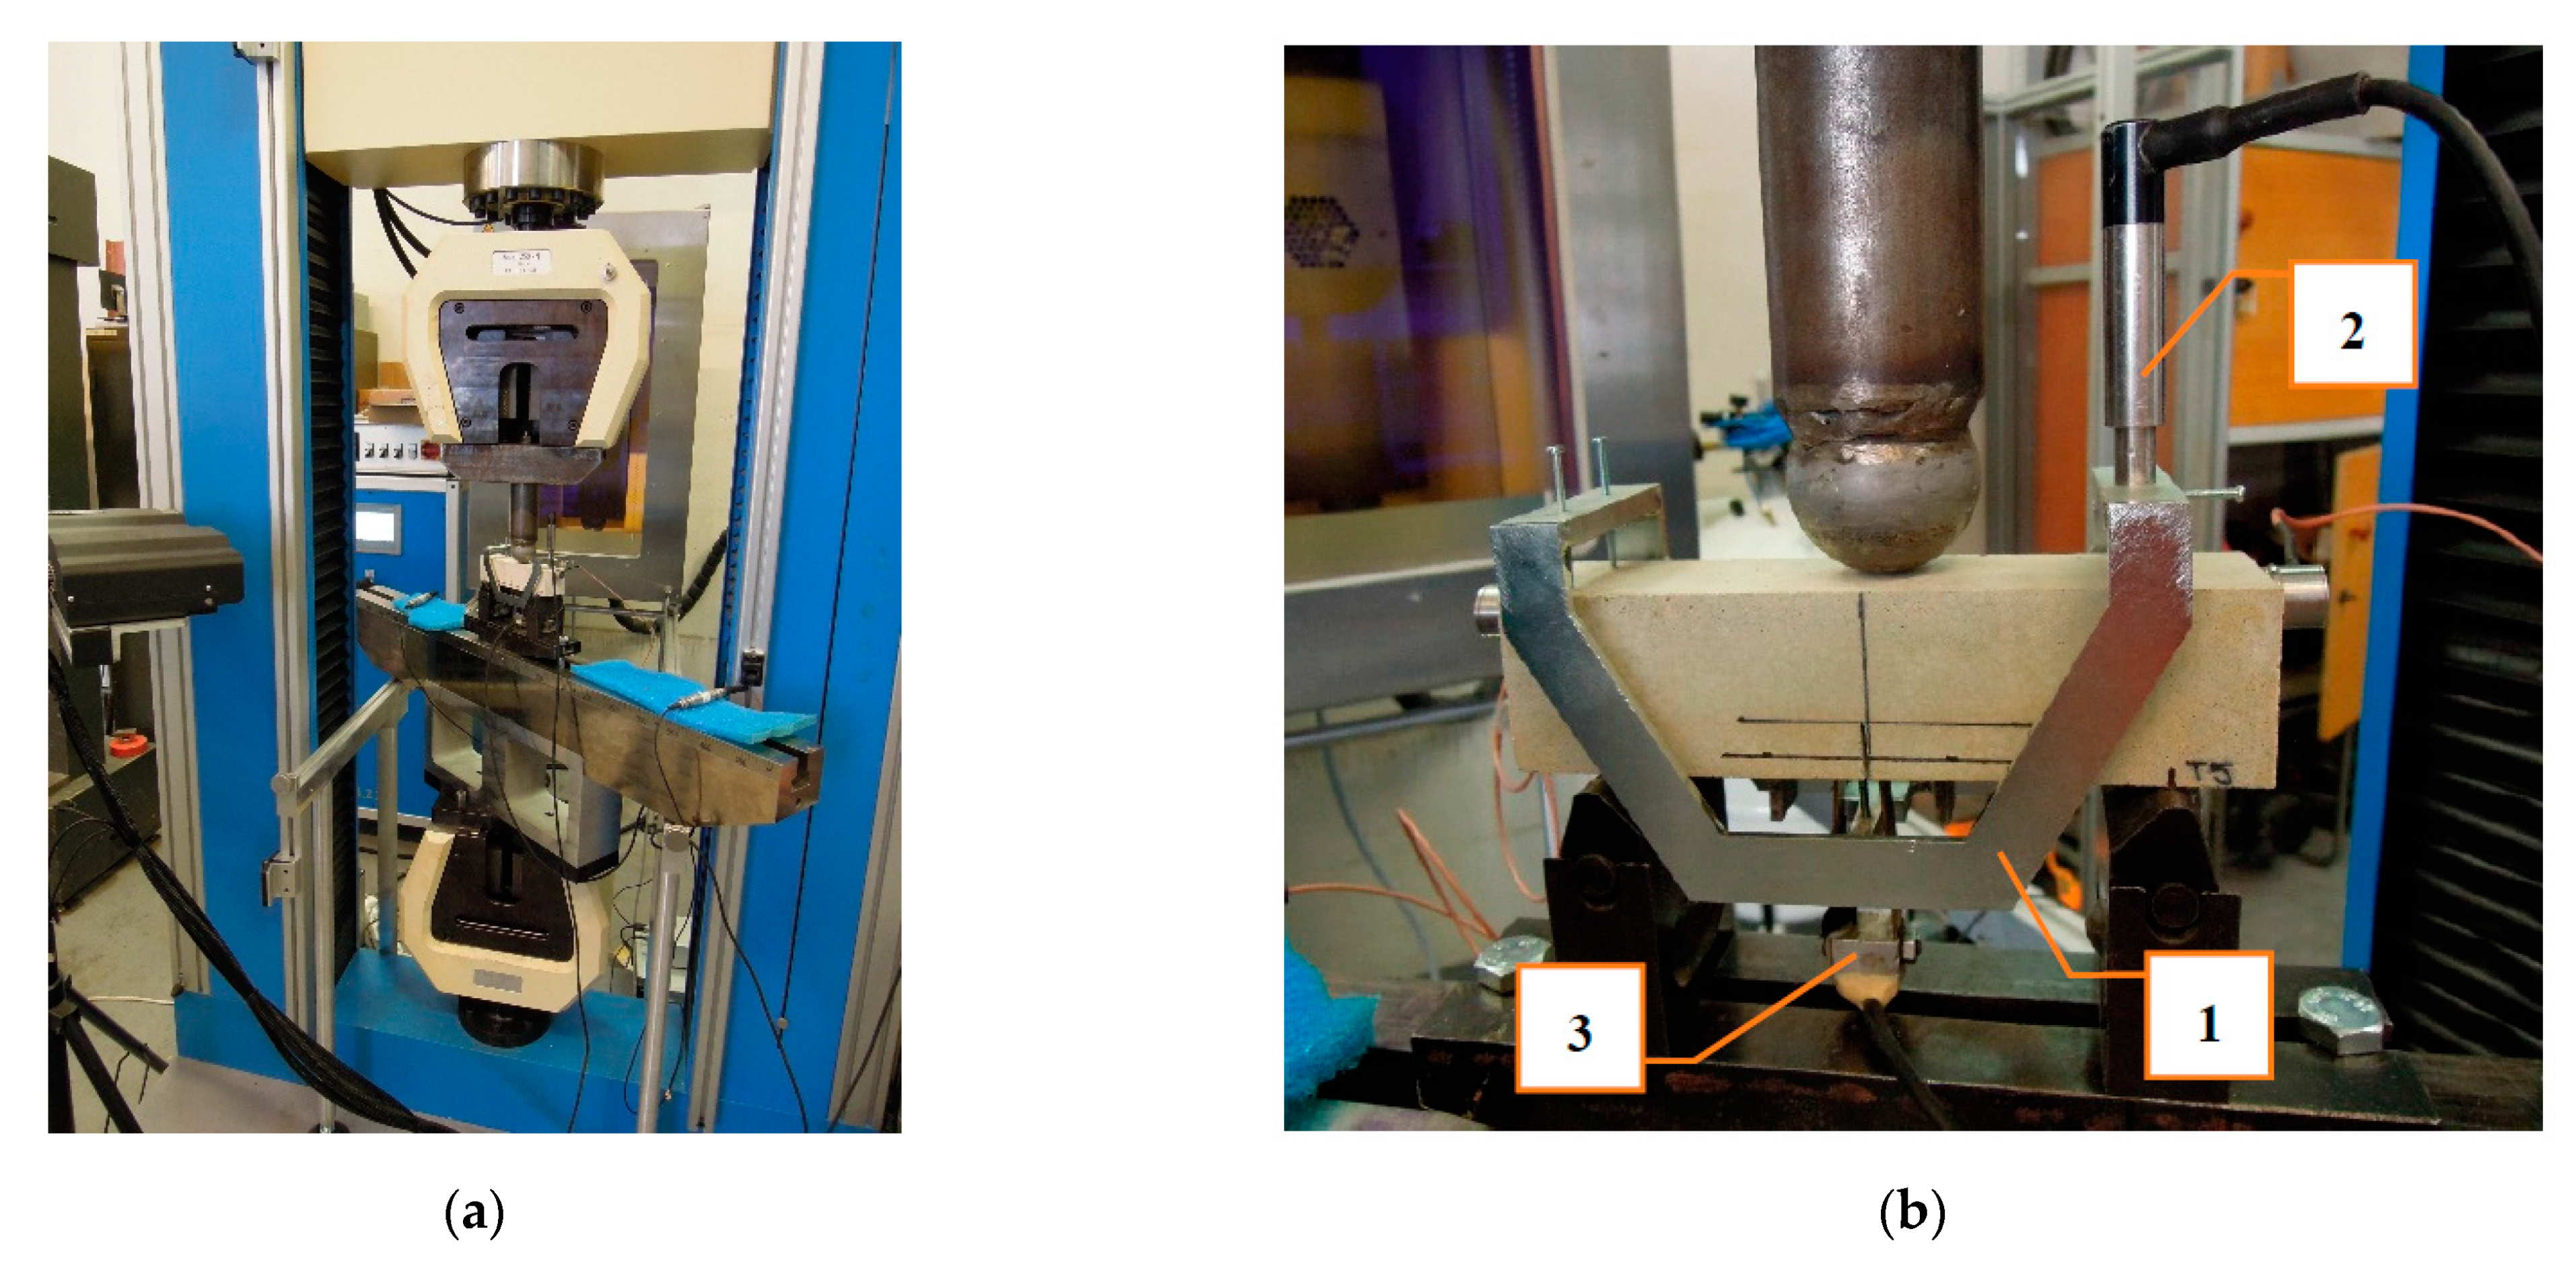
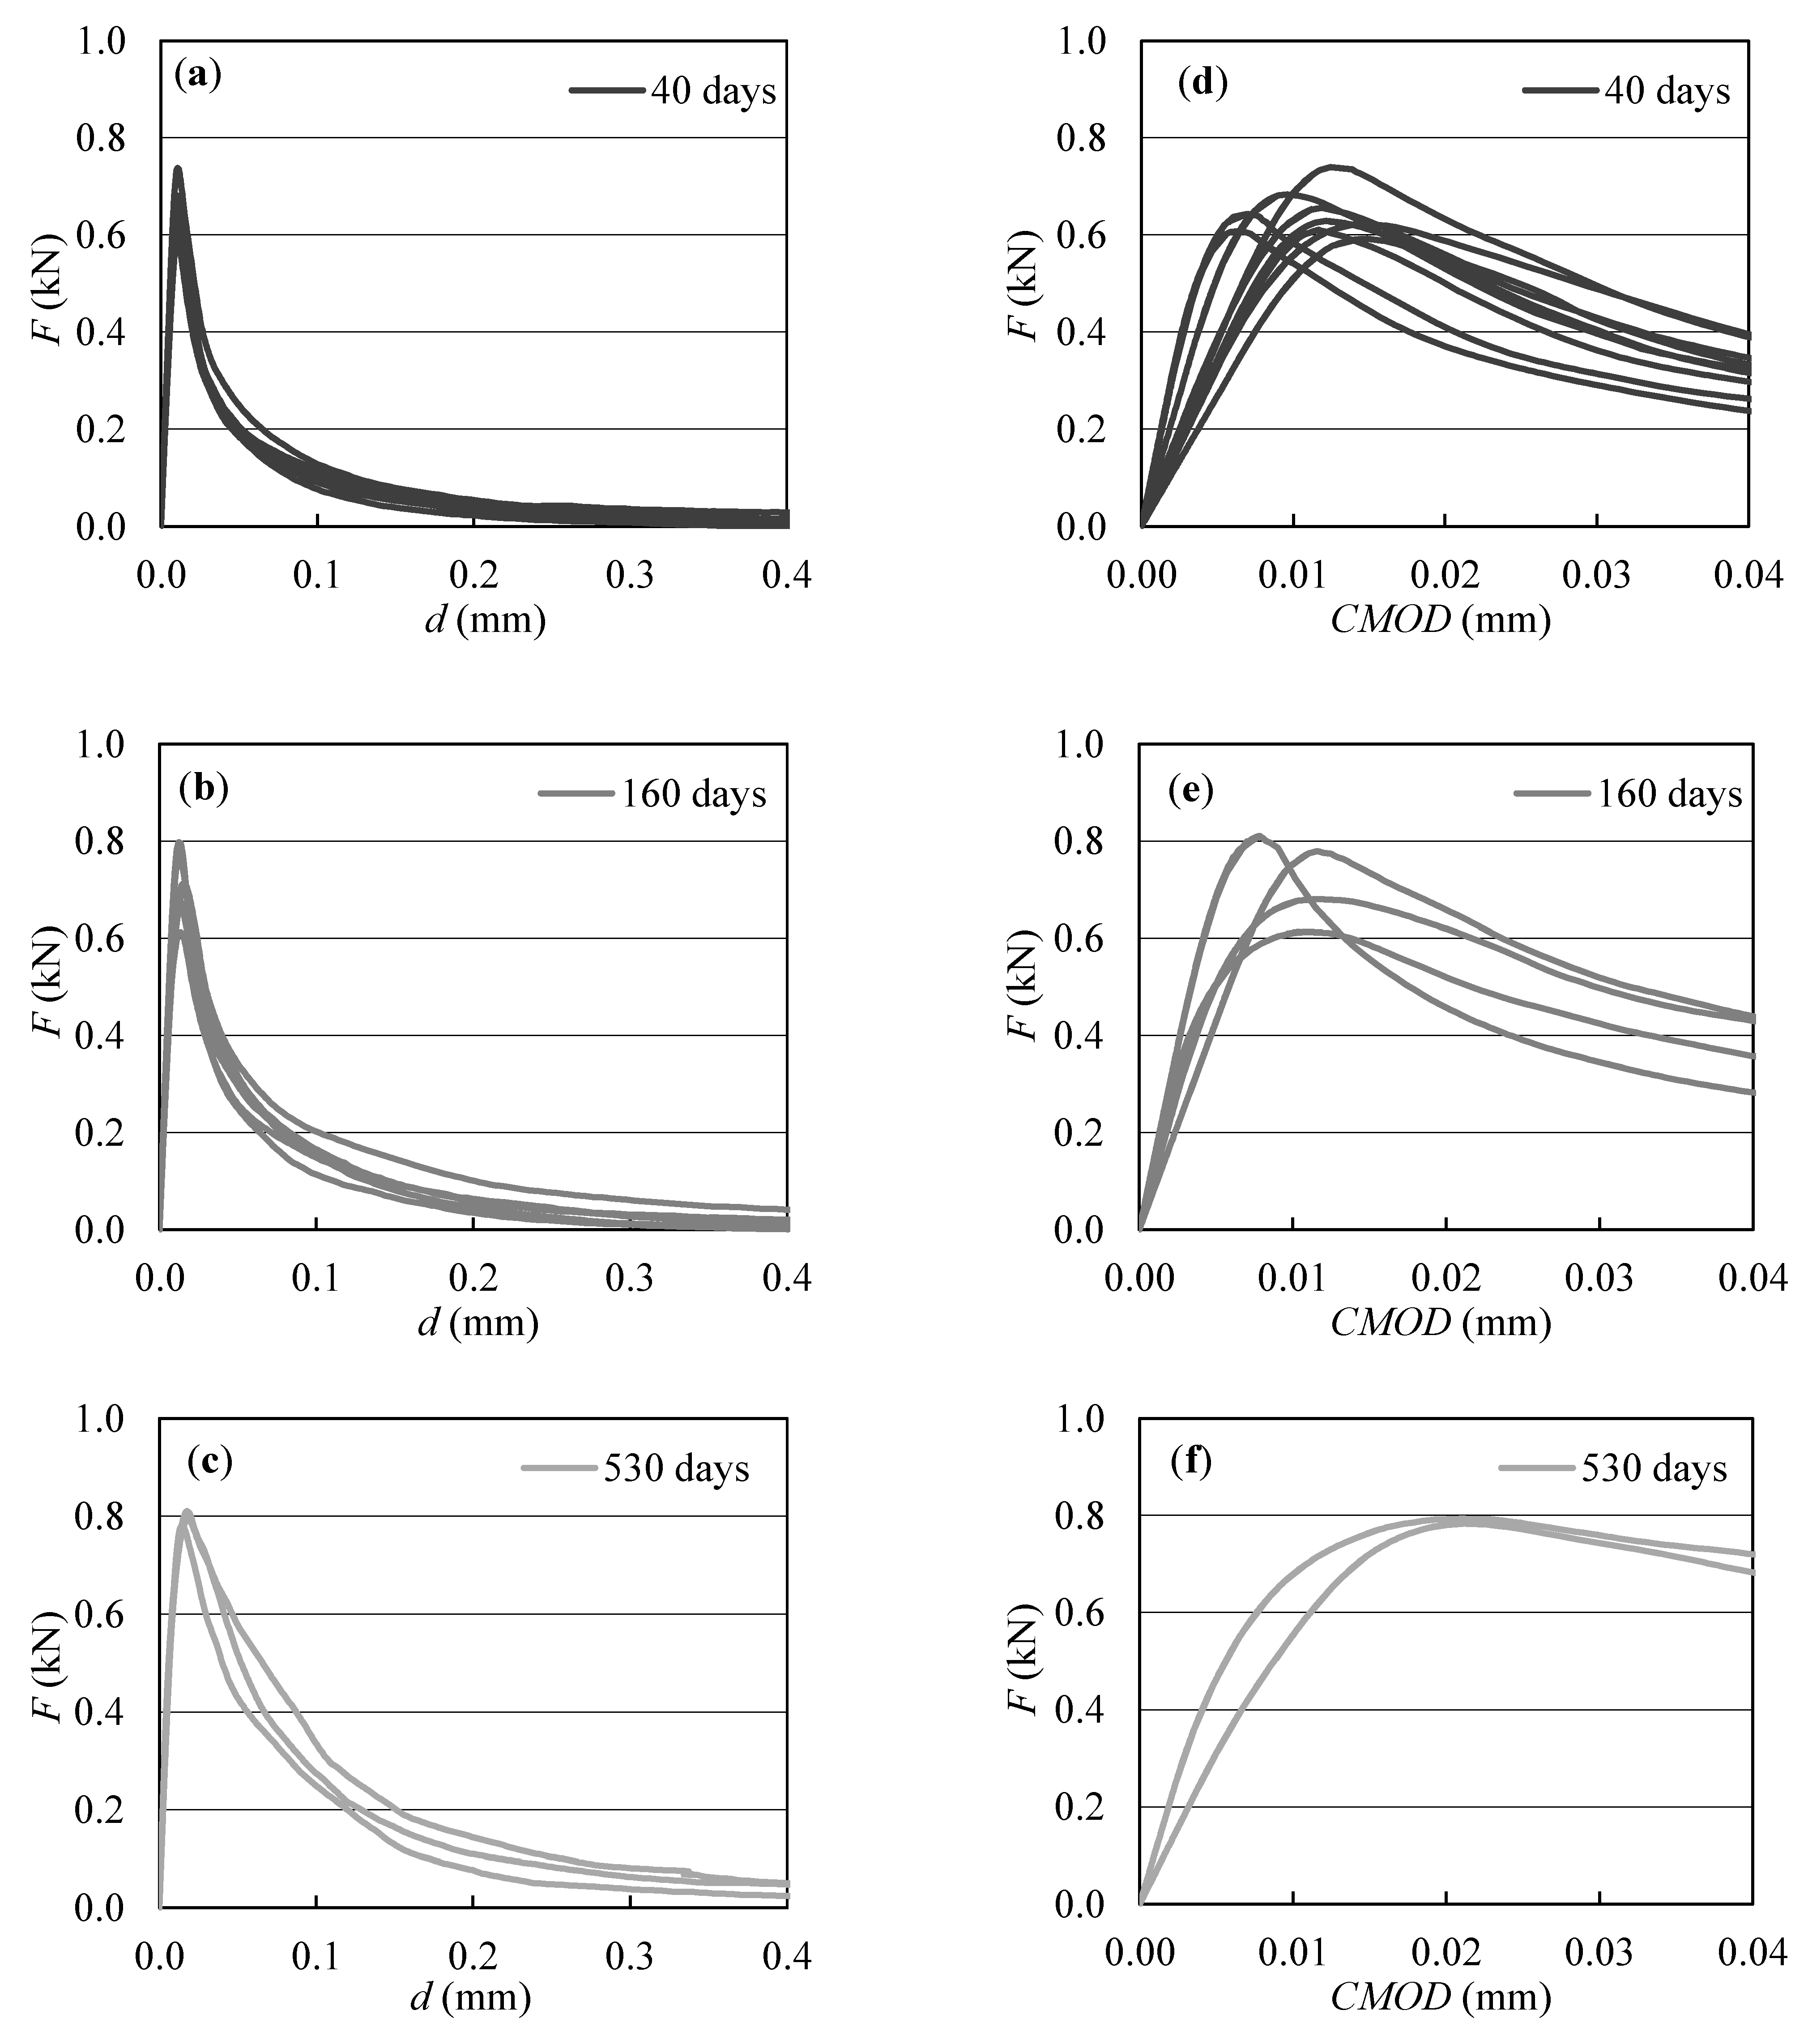
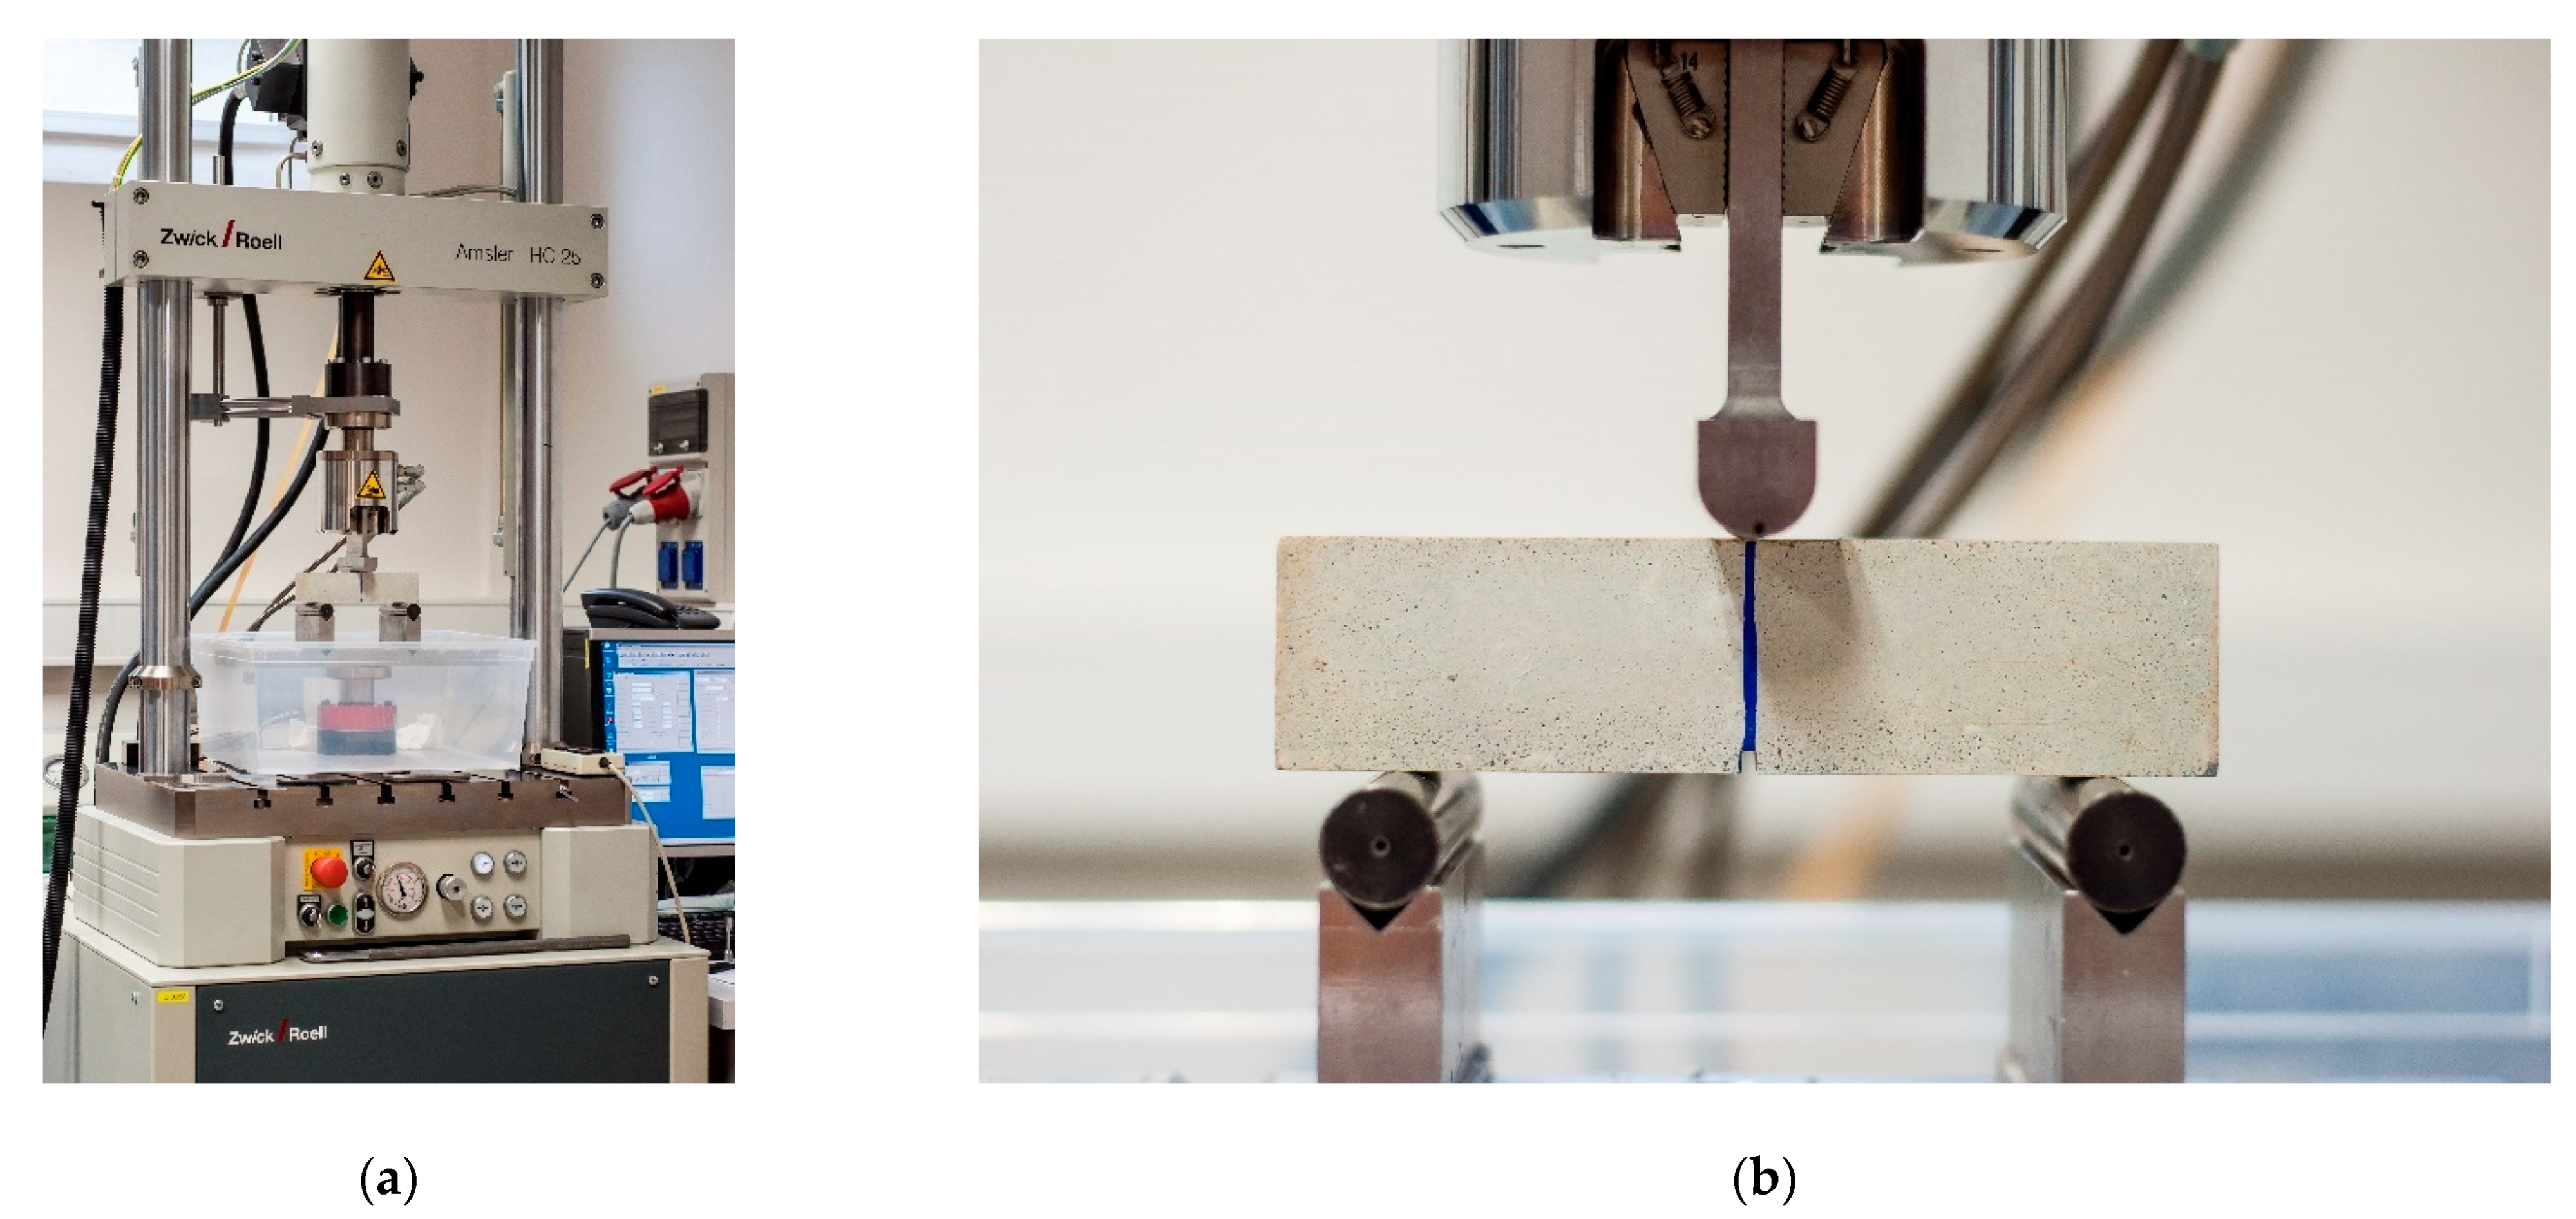
2.4. Static Fracture Tests
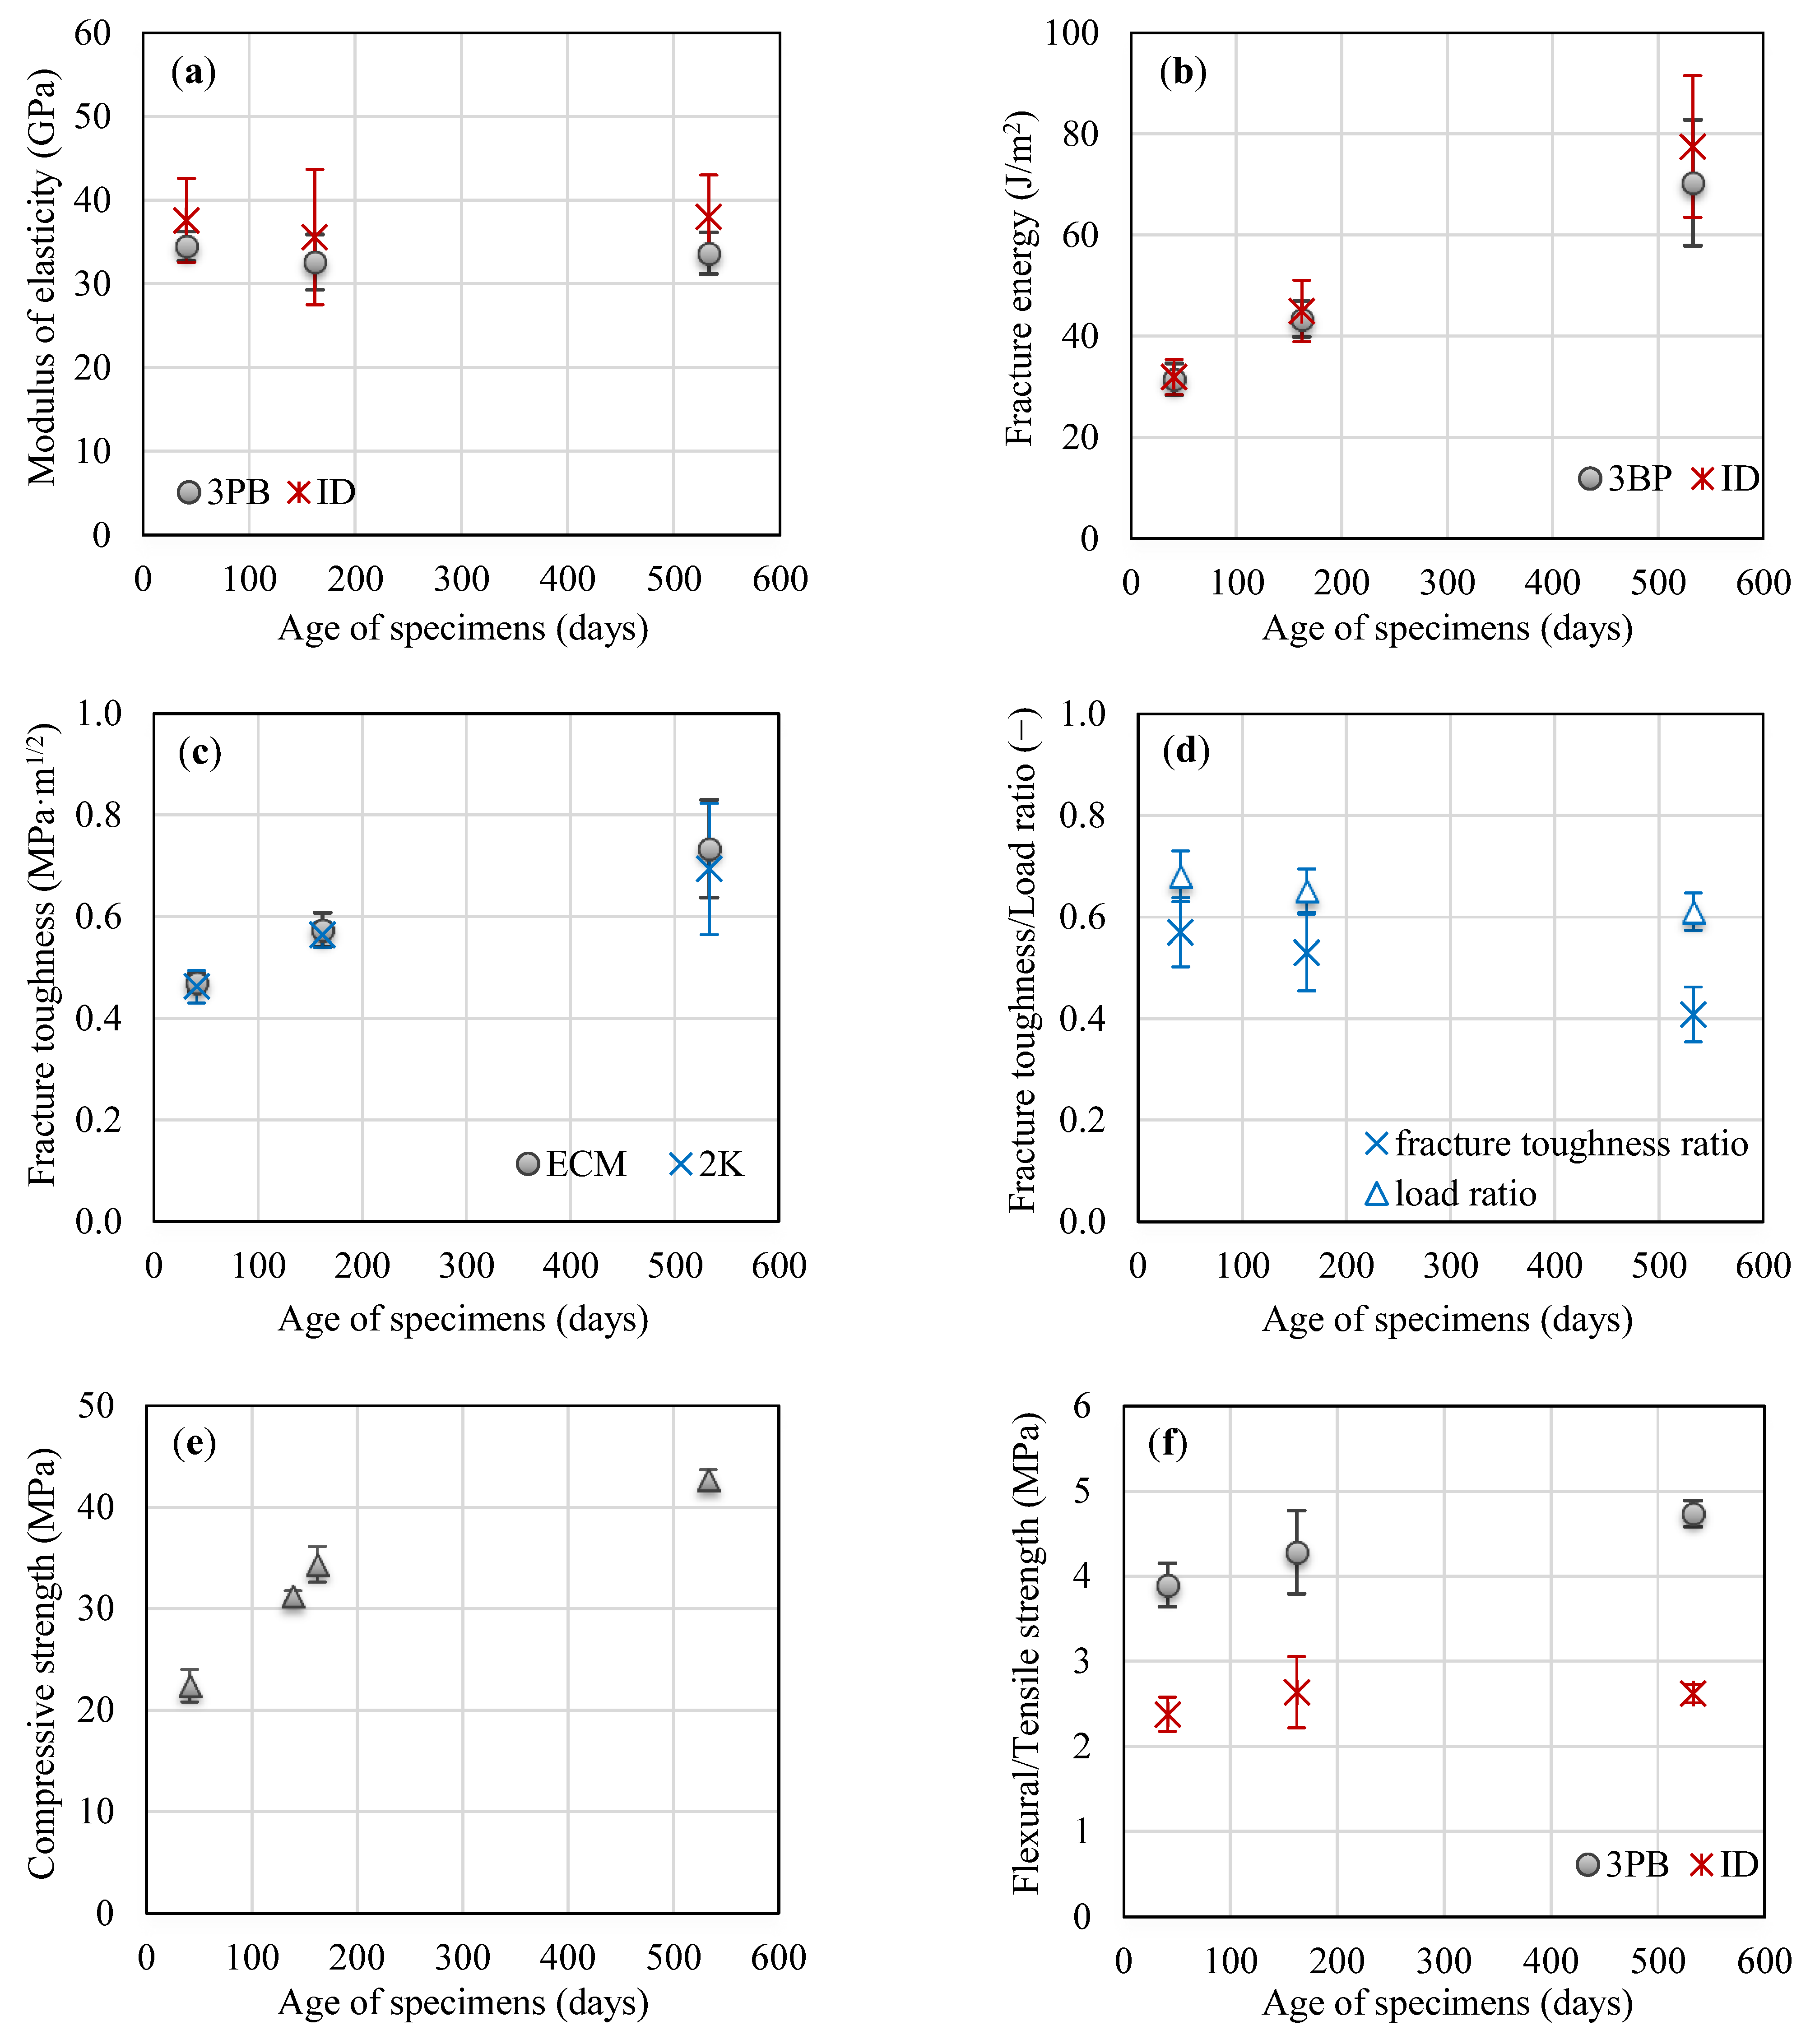
2.4.1. Direct Evaluation of Mechanical Fracture Parameters from F−d Diagrams
2.4.2. Identification of Mechanical Fracture Parameters from F−d Diagrams
2.4.3. Direct Evaluation of Mechanical Fracture Parameters from F−CMOD Diagrams
2.5. Cyclic/Fatigue Fracture Tests
3. Results and Discussion
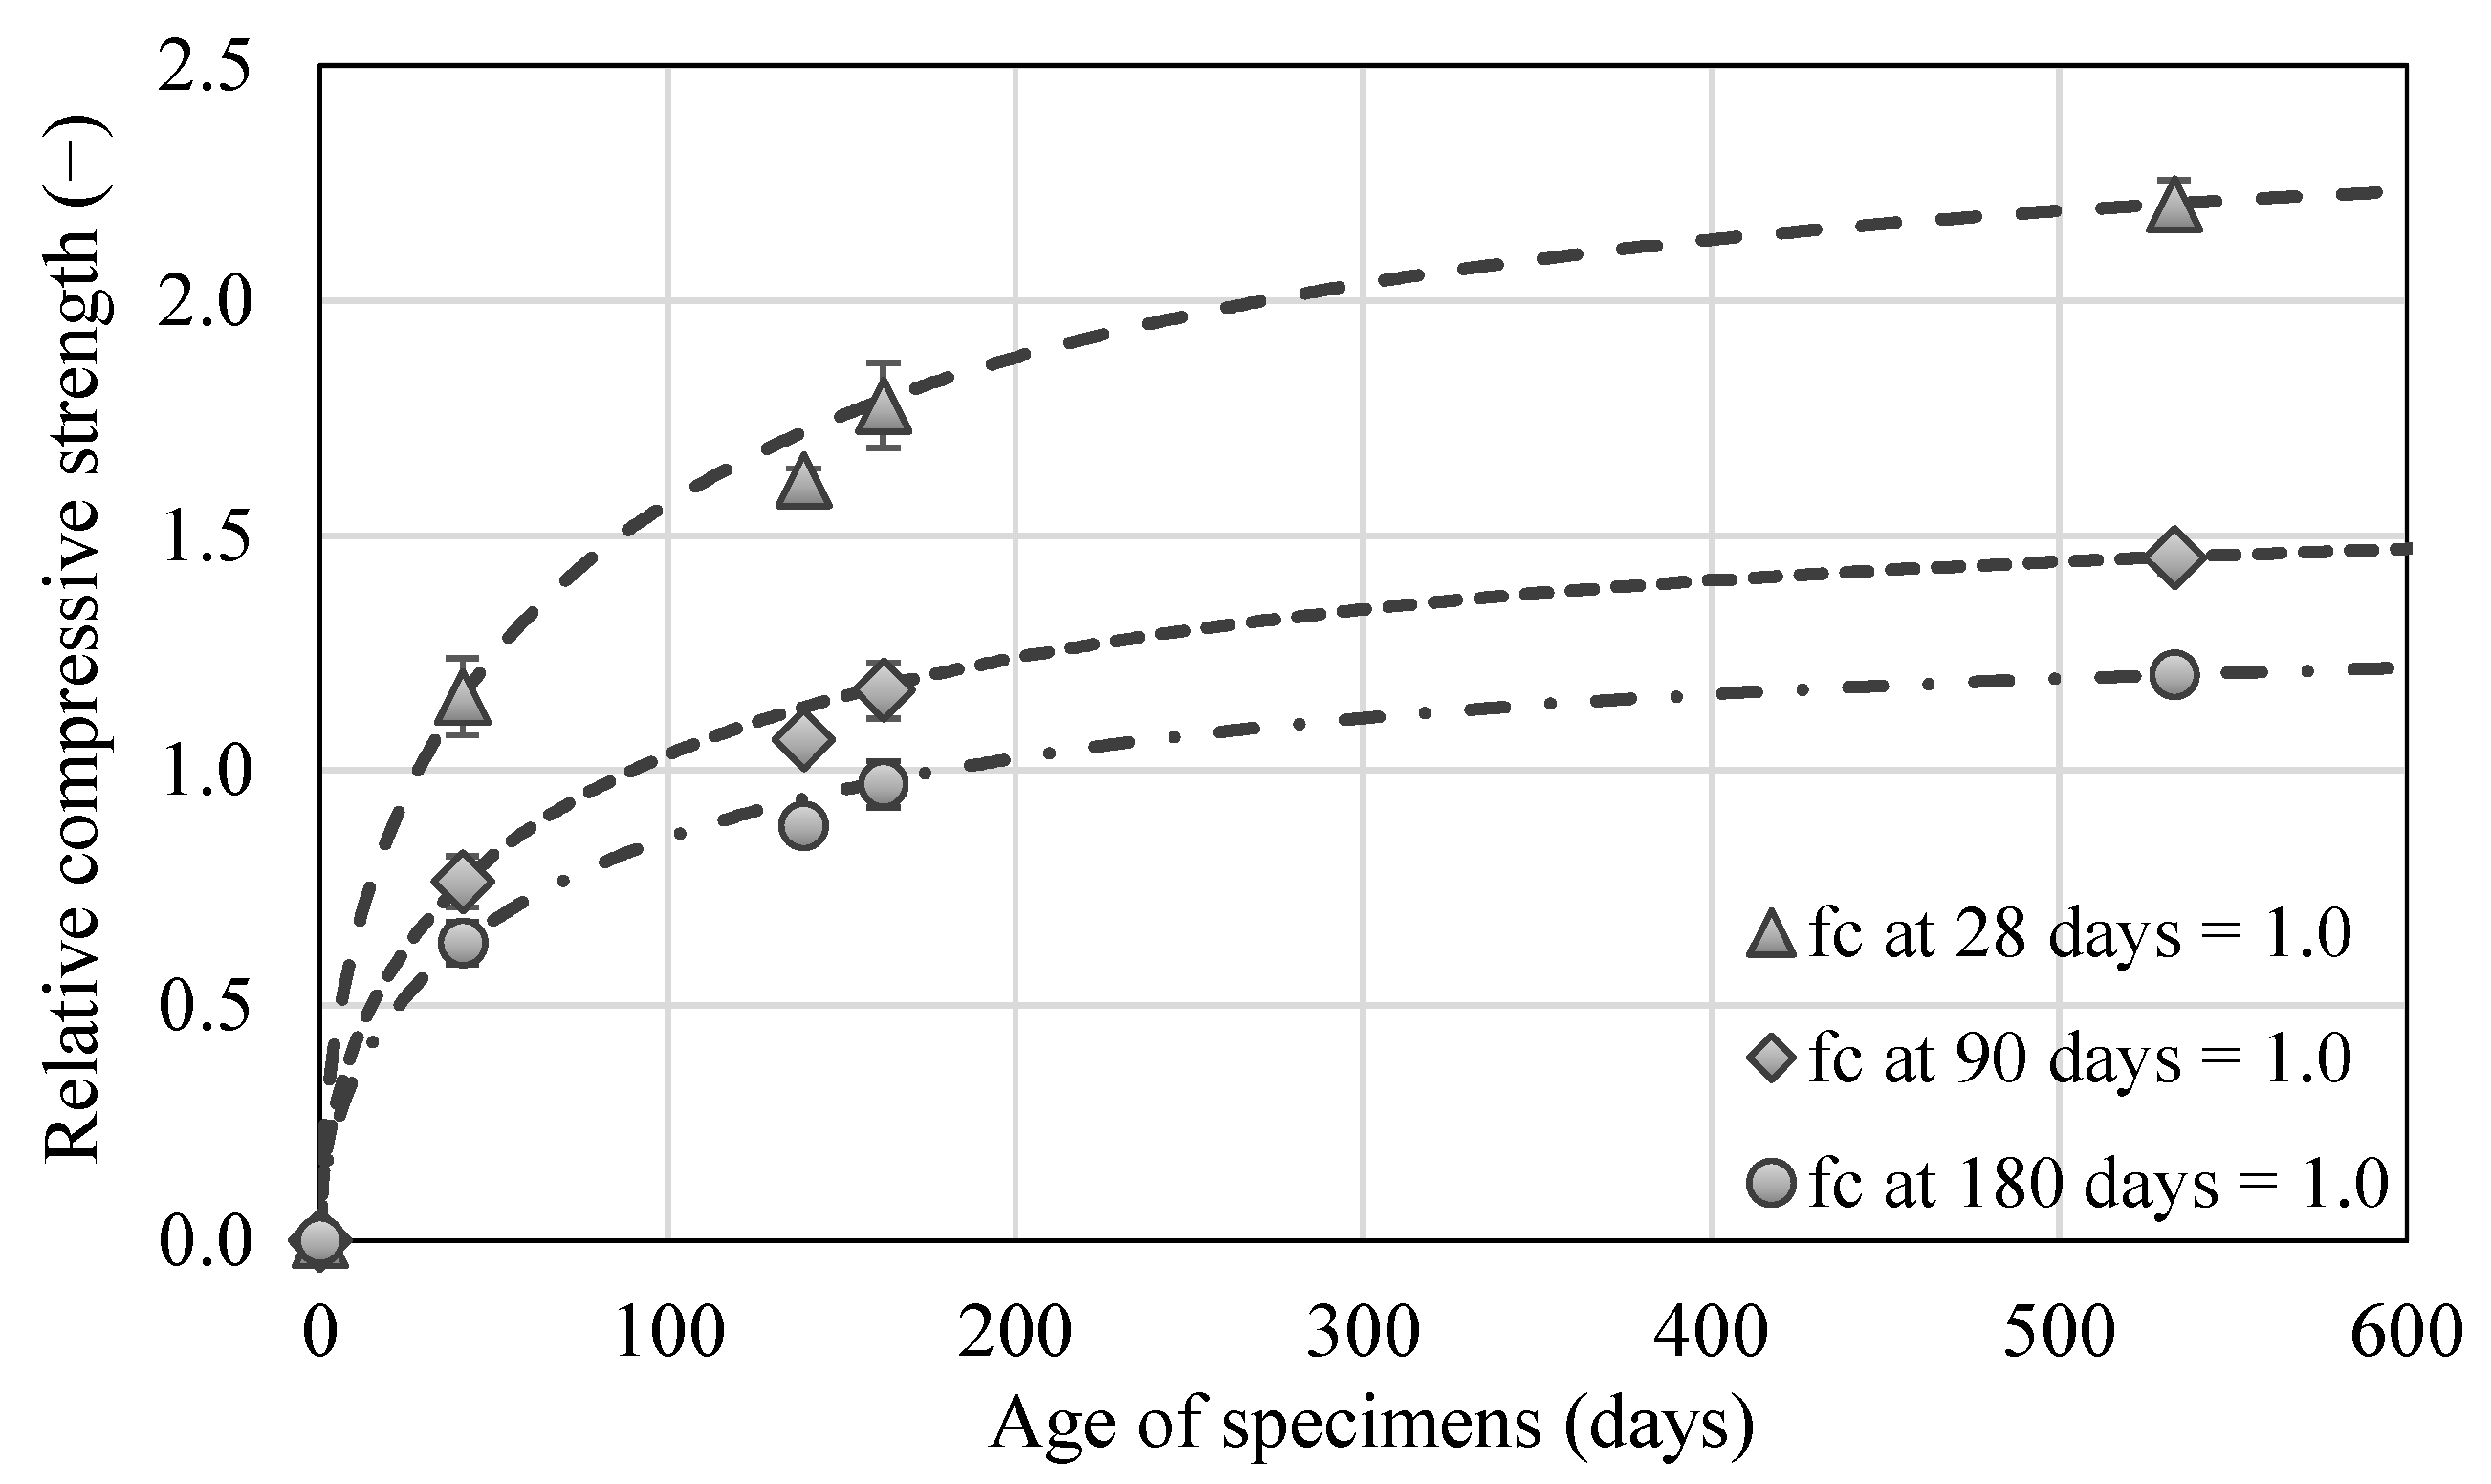
3.1. Basic Physical and Mechanical Parameters
3.2. Mechanical Fracture Parameters
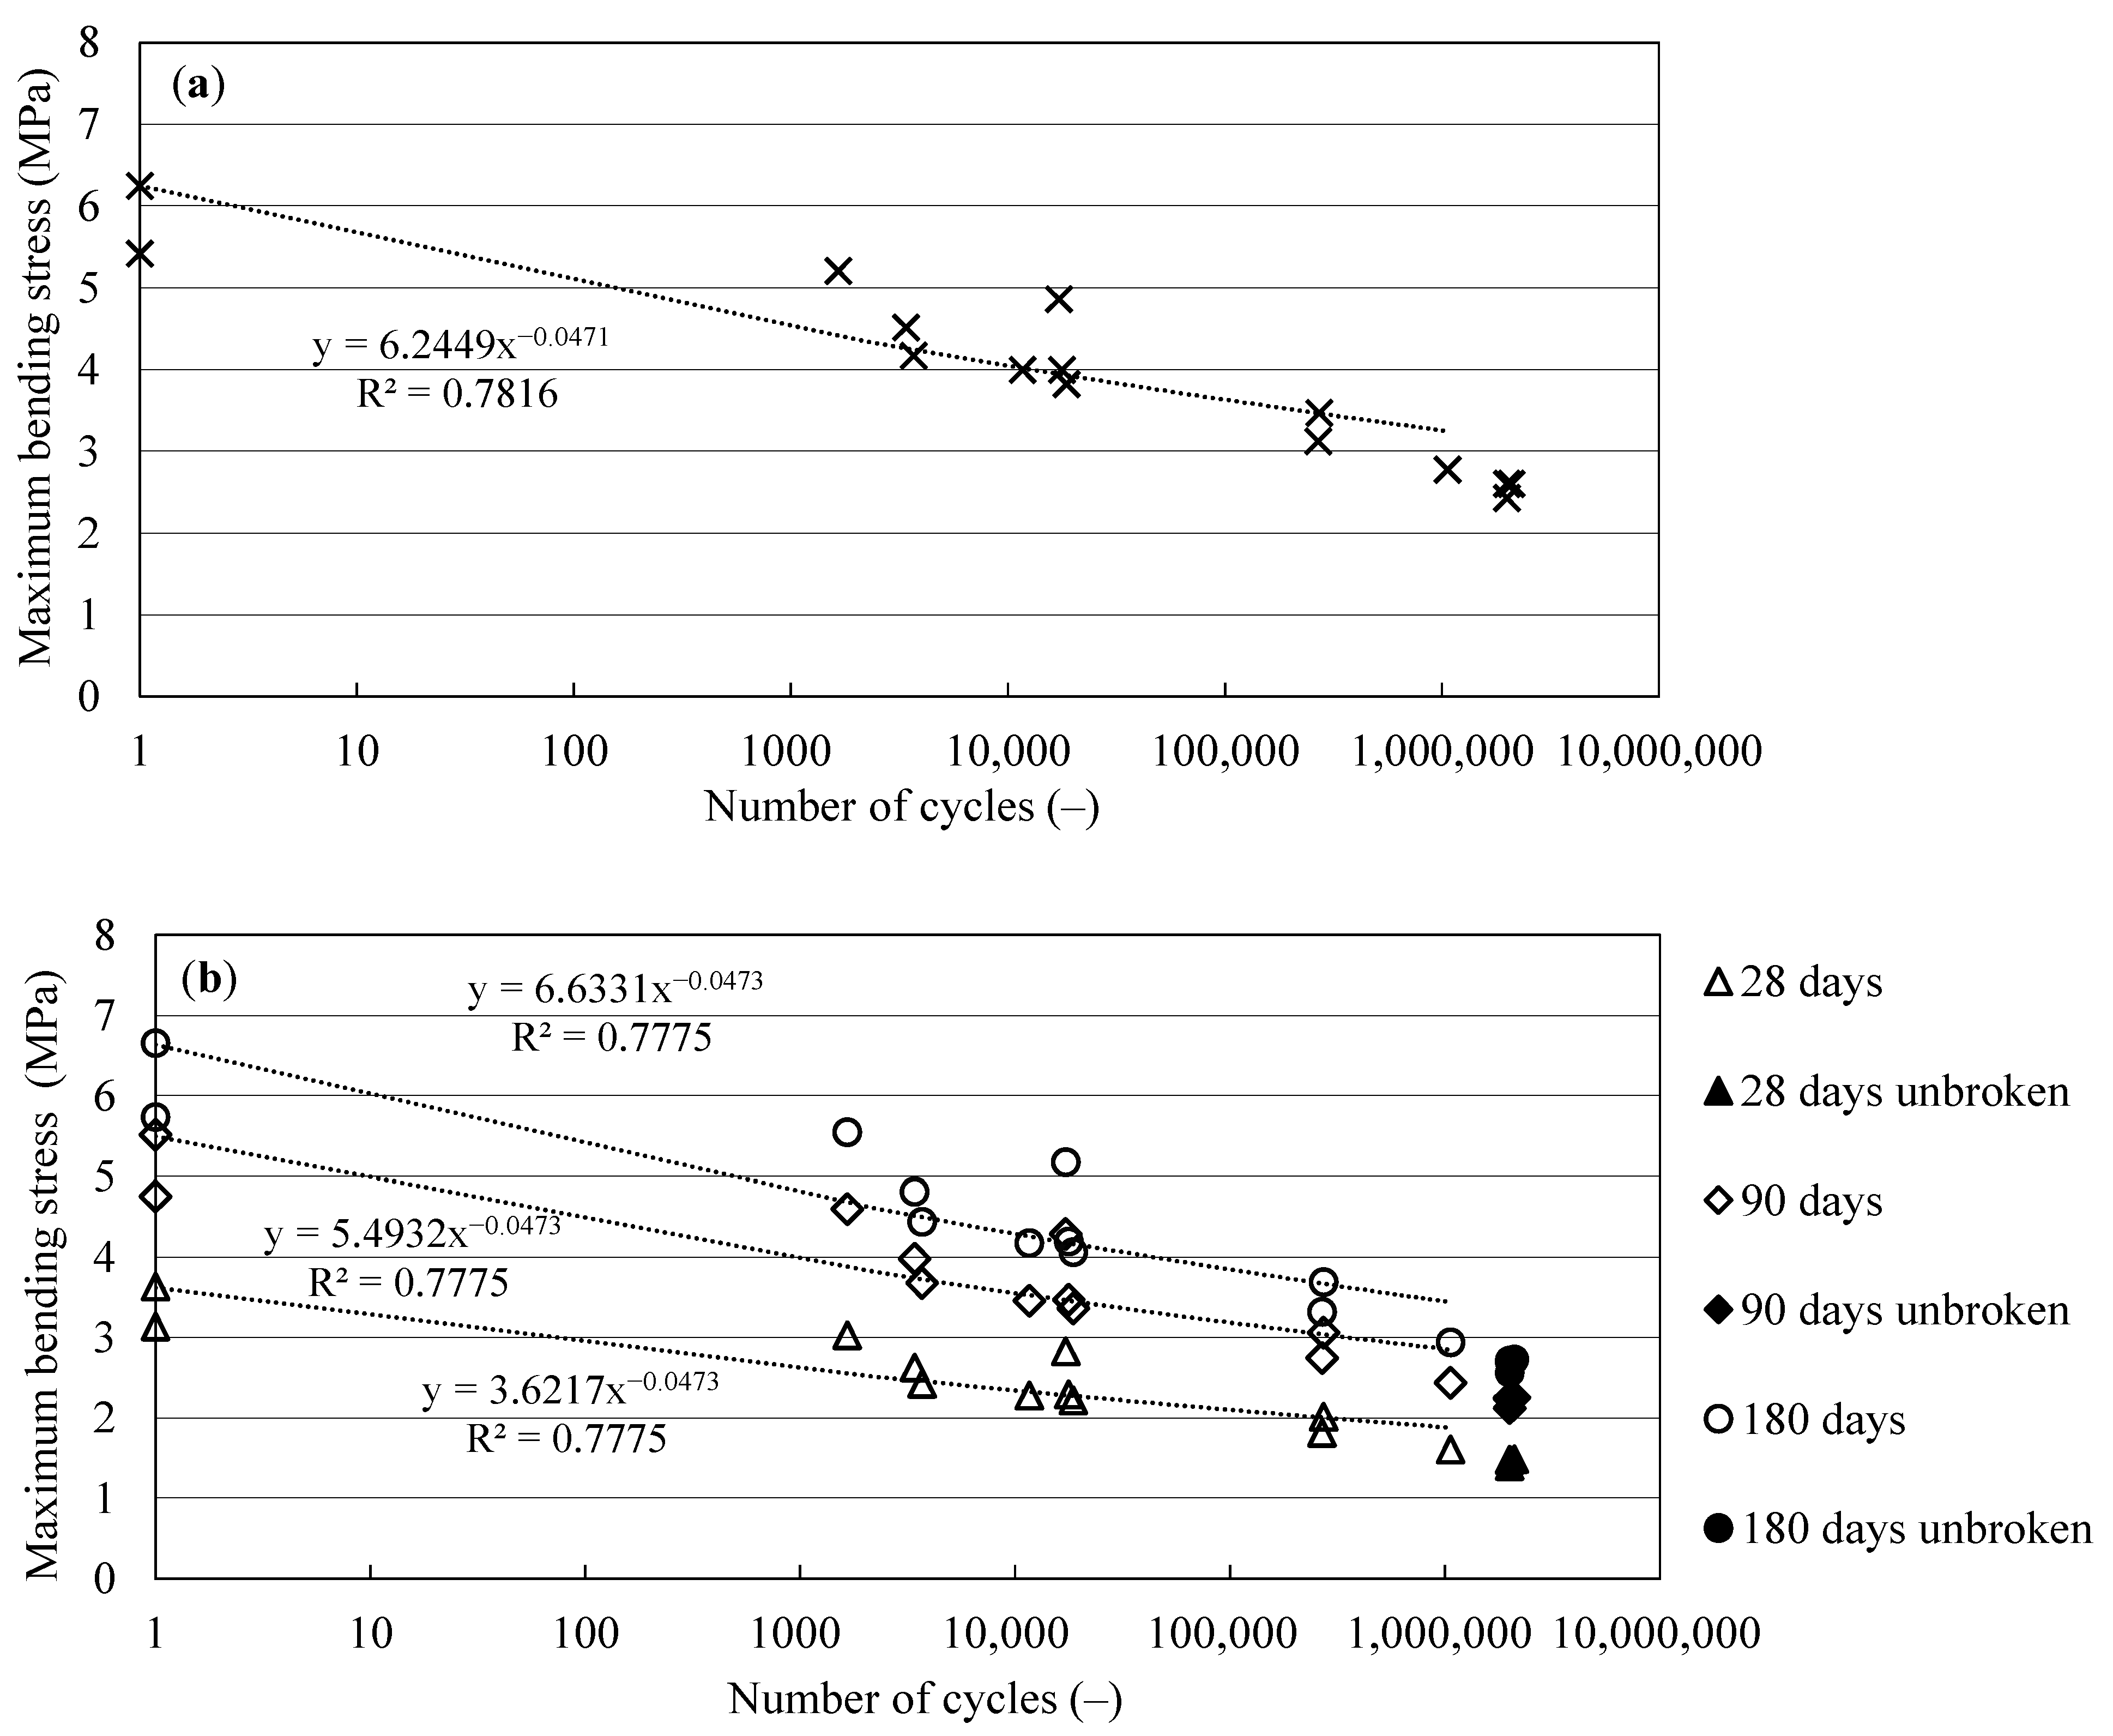
3.3. Fatigue Characteristics
4. Conclusions
Author Contributions
Funding
Institutional Review Board Statement
Informed Consent Statement
Data Availability Statement
Conflicts of Interest
References
- Provis, J.L. Alkali-activated materials. Cem. Concr. Res. 2018, 114, 40–48. [Google Scholar] [CrossRef]
- Gao, X.; Yu, Q.; Brouwers, H. Assessing the porosity and shrinkage of alkali activated slag-fly ash composites designed applying a packing model. Constr. Build. Mater. 2016, 119, 175–184. [Google Scholar] [CrossRef]
- Kumarappa, D.B.; Peethamparan, S. Stress-strain characteristics and brittleness index of alkali-activated slag and class C fly ash mortars. J. Build. Eng. 2020, 32, 101595. [Google Scholar] [CrossRef]
- Lee, M.; Barr, B. An overview of the fatigue behaviour of plain and fibre reinforced concrete. Cem. Concr. Compos. 2004, 26, 299–305. [Google Scholar] [CrossRef]
- Dobromil, P.; Jan, C.; Radomir, P. Material model for finite element modelling of fatigue crack growth in concrete. Procedia Eng. 2010, 2, 203–212. [Google Scholar] [CrossRef] [Green Version]
- Toumi, A.; Bascoul, A.; Turatsinze, A. Modeling of fatigue crack growth in concrete subjected to mode I crack opening. In Proceedings of the 4th International Conference on Fracture Mechanics of Concrete Structures, Cachan, France, 28 May–1 June 2001; de Borst, R., Mazars, J., Pijaudier-Cabot, G., van Mier, J.G.M., Eds.; CRC Press: Cambridge, UK, 2001; pp. 637–640. [Google Scholar]
- Xie, Y.; Cao, P.; Jin, J.; Wang, M. Mixed mode fracture analysis of semi-circular bend (SCB) specimen: A numerical study based on extended finite element method. Comput. Geotech. 2017, 82, 157–172. [Google Scholar] [CrossRef]
- Kuruppu, M.D.; Chong, K.P. Fracture toughness testing of brittle materials using semi-circular bend (SCB) specimen. Eng. Fract. Mech. 2012, 91, 133–150. [Google Scholar] [CrossRef]
- Razmi, A.; Mirsayar, M. On the mixed mode I/II fracture properties of jute fiber-reinforced concrete. Constr. Build. Mater. 2017, 148, 512–520. [Google Scholar] [CrossRef]
- Erarslan, N. Analysing mixed mode (I–II) fracturing of concrete discs including chevron and straight-through notch cracks. Int. J. Solids Struct. 2019, 167, 79–92. [Google Scholar] [CrossRef]
- Mirsayar, M.; Razmi, A.; Aliha, M.R.M.; Berto, F. EMTSN criterion for evaluating mixed mode I/II crack propagation in rock materials. Eng. Fract. Mech. 2018, 190, 186–197. [Google Scholar] [CrossRef]
- Xing, Y.; Huang, B.; Ning, E.; Zhao, L.; Jin, F. Quasi-static loading rate effects on fracture process zone development of mixed-mode (I-II) fractures in rock-like materials. Eng. Fract. Mech. 2020, 240, 107365. [Google Scholar] [CrossRef]
- Seitl, S.; Pokorný, P.; Bilek, V. The mixed-mode fracture resistance of C 50/60 and its suitability for use in precast elements as determined by the Brazilian disc test and three-point bending specimens. Theor. Appl. Fract. Mech. 2018, 97, 108–119. [Google Scholar] [CrossRef]
- Alanazi, N.; Susmel, L. Estimating Static/Dynamic Strength of Notched Unreinforced Concrete under Mixed-Mode I/II Loading. Eng. Fract. Mech. 2020, 107329. [Google Scholar] [CrossRef]
- Ruiz, G.; De La Rosa, A.; Almeida, L.; Poveda, E.; Zhang, X.; Tarifa, M.; Wu, Z.; Yu, R.C. Dynamic mixed-mode fracture in SCC reinforced with steel fibers: An experimental study. Int. J. Impact Eng. 2019, 129, 101–111. [Google Scholar] [CrossRef]
- Aliha, M.; Mousavi, S.; Ghoreishi, S. Fracture load prediction under mixed mode I + II using a stress based method for brittle materials tested with the asymmetric four-point bend specimen. Theor. Appl. Fract. Mech. 2019, 103, 102249. [Google Scholar] [CrossRef]
- Malíková, L.; Miarka, P.; Kucharczyková, B.; Šimonová, H. Williams expansion utilized for assessment of crack behaviour under mixed-mode loading in alkali-activated fine-grained composite. Fatigue Fract. Eng. Mater. Struct. 2021. under review. [Google Scholar]
- Bažant, Z.P.; Planas, J. Fracture and Size Effect in Concrete and other Quasibrittle Materials; Informa UK Limited: London, UK, 2019. [Google Scholar]
- Jirásek, M.; Grassl, P. Evaluation of directional mesh bias in concrete fracture simulations using continuum damage models. Eng. Fract. Mech. 2008, 75, 1921–1943. [Google Scholar] [CrossRef]
- Karihaloo, B.L. Fracture Mechanics and Structural Concrete, 1st ed.; Longman Scientific & Technical: Harlow, UK, 1995; 330p. [Google Scholar]
- RILEM Determination of the fracture energy of mortar and concrete by means of three-point bend tests on notched beams. Mater. Struct. 1985, 18, 287–290. [CrossRef]
- Kumar, S.; Barai, S.V. Concrete Fracture Models and Applications, 1st ed.; Springer: Berlin, Germany, 2011; p. 262. [Google Scholar]
- Novák, D.; Lehký, D. ANN inverse analysis based on stochastic small-sample training set simulation. Eng. Appl. Artif. Intell. 2006, 19, 731–740. [Google Scholar] [CrossRef]
- Atis, C.D.; Bilim, C.; Çelik, Ö.; Karahan, O. Influence of activator on the strength and drying shrinkage of alkali-activated slag mortar. Constr. Build. Mater. 2009, 23, 548–555. [Google Scholar] [CrossRef]
- Bakharev, T.; Sanjayan, J.G.; Cheng, Y.-B. Alkali activation of Australian slag cements. Cem. Concr. Res. 1999, 29, 113–120. [Google Scholar] [CrossRef]
- Kocab, D.; Zitt, P.; Danek, P.; Canek, M.; Alexa, M.; Hanus, P. The influence of specimen size on the dynamic properties of lightweight concrete determined by the resonance method. IOP Conf. Ser. Mater. Sci. Eng. 2019, 583. [Google Scholar] [CrossRef]
- ASTM International. ASTM C215-19: Standard Test Method for Fundamental Transverse, Longitudinal, and Torsional Resonant Frequencies of Concrete Specimens; ASTM International: West Conshohocken, PA, USA, 2020. [Google Scholar]
- Frantík, P.; Mašek, J. GTDiPS Software. 2015. Available online: http://gtdips.kitnarf.cz/ (accessed on 1 October 2020).
- Stibor, M. Fracture Parameters of Quasi-Brittle Materials and Their Determination. Bachelor’s Thesis, Brno University of Technology, Brno, Czech Republic, 2004. (In Czech). [Google Scholar]
- ÚNMZ. ČSN EN 196-1 Methods of Testing Cement–Prat 1: Determination of Strength; ÚNMZ: Prague, Czech Republic, 2016. [Google Scholar]
- Červenka, V.; Jendele, L.; Červenka, J. ATENA Program Documentation–Part 1: Theory; Cervenka Consulting Ltd.: Prague, Czech Republic, 2016. [Google Scholar]
- Lehky, D. A neural network ensemble for the identification of mechanical fracture parameters of Fine-grained Brittle Matrix Composites. In FraMCoS-X 10th International Conference on Fracture Mechanics of Concrete and Concrete Structures; Pijaudie-Cabot, G., Grasll, P., La Bordiere, C., Eds.; IA-FraMCoS: Bayonne, France, 2019; pp. 1–9. [Google Scholar] [CrossRef]
- Lehký, D.; Lipowczan, M.; Šimonová, H.; Keršner, Z. A hybrid artificial neural network-based identification system for fi-ne-grained brittle matrix composites. Comput. Concr. 2021. under review. [Google Scholar]
- Hordijk, D.A. Local Approach to Fatigue of Concrete. Ph.D. Thesis, Technische Universiteit Delft, Delft, The Netherlands, 1991. [Google Scholar]
- Jenq, Y.; Shah, S.P. Two Parameter Fracture Model for Concrete. J. Eng. Mech. 1985, 111, 1227–1241. [Google Scholar] [CrossRef]
- Reinhardt, H.W.; Cornelissen, H.A.W.; Hordijk, D.A. Tensile Tests and Failure Analysis of Concrete. J. Struct. Eng. 1986, 112, 2462–2477. [Google Scholar] [CrossRef]
- Xu, S.; Reinhardt, H.W. Determination of double-K criterion for crack propagation in quasibrittle fracture, Part II: Analyti-cal evaluating and practical measuring methods for three-point bending notched beams. Int. J. Fract. 1999, 98, 151–177. [Google Scholar] [CrossRef]
- Kucharczyková, B.; Topolář, L.; Daněk, P.; Kocáb, D.; Misák, P. Comprehensive Testing Techniques for the Measurement of Shrinkage and Structural Changes of Fine-Grained Cement-Based Composites during Ageing. Adv. Mater. Sci. Eng. 2017, 2017, 1–10. [Google Scholar] [CrossRef] [Green Version]
- Kucharczyková, B.; Šimonová, H.; Misák, P.; Keršner, Z. Development of shrinkage and fracture parameters in selected fine-grained cement-based composites. In MATEC Web of Conferences: Dynamics of Civil Engineering and Transport Structures and Wind Engineering–DYN-WIND’2017; Melcer, J., Kotrasová, K., Eds.; EDP Sciences–Web of Conferences: Les Ulis, France, 2017; Volume 107, pp. 1–7. [Google Scholar] [CrossRef] [Green Version]
- Kucharczyková, B.; Bílek, V.; Kocáb, D.; Karel, O. Shrinkage of Fine-Grained Composites Based on Alkali-Activated Slag. Key Eng. Mater. 2018, 761, 7–10. [Google Scholar] [CrossRef]
- Alexa, M.; Kocáb, D.; Kucharczyková, B.; Kotrla, J. The influence of a shrinkage reducing admixture on the long-term development of dynamic properties in alkali-activated slag. In Acta Polytechnica CTU Proceedings; Czech Technical University in Prague: Prague, Czech Republic, 2019; Volume 22, pp. 1–6. [Google Scholar] [CrossRef]
- Šimonová, H.; Kucharczyková, B.; Lipowczan, M.; Lehký, D.; Bílek, V., Jr.; Kocáb, D. Identification of Mechanical Fracture Parameters of Alkali-activated Slag Based Composites during Specimens Ageing. Trans. VŠB–Tech. Univ. Ostrav. Civ. Eng. Ser. 2019, 19, 59–64. [Google Scholar] [CrossRef]
- Akturk, B.; Akca, A.H.; Kizilkanat, A.B. Fracture response of fiber-reinforced sodium carbonate activated slag mortars. Constr. Build. Mater. 2020, 241, 118128. [Google Scholar] [CrossRef]
- Seitl, S.; Pokorný, P.; Šimonová, H.; Frantík, P.; Kersner, Z.; Domski, J.; Katzer, J. Change of Fatigue and Mechanical Fracture Properties of a Cement Composite due to Partial Replacement of Aggregate by Red Ceramic Waste. Period. Polytech. Civ. Eng. 2019, 63, 152–159. [Google Scholar] [CrossRef]


Publisher’s Note: MDPI stays neutral with regard to jurisdictional claims in published maps and institutional affiliations. |
© 2020 by the authors. Licensee MDPI, Basel, Switzerland. This article is an open access article distributed under the terms and conditions of the Creative Commons Attribution (CC BY) license (http://creativecommons.org/licenses/by/4.0/).
Share and Cite
Šimonová, H.; Kucharczyková, B.; Bílek, V.; Malíková, L.; Miarka, P.; Lipowczan, M. Mechanical Fracture and Fatigue Characteristics of Fine-Grained Composite Based on Sodium Hydroxide-Activated Slag Cured under High Relative Humidity. Appl. Sci. 2021, 11, 259. https://0-doi-org.brum.beds.ac.uk/10.3390/app11010259
Šimonová H, Kucharczyková B, Bílek V, Malíková L, Miarka P, Lipowczan M. Mechanical Fracture and Fatigue Characteristics of Fine-Grained Composite Based on Sodium Hydroxide-Activated Slag Cured under High Relative Humidity. Applied Sciences. 2021; 11(1):259. https://0-doi-org.brum.beds.ac.uk/10.3390/app11010259
Chicago/Turabian StyleŠimonová, Hana, Barbara Kucharczyková, Vlastimil Bílek, Lucie Malíková, Petr Miarka, and Martin Lipowczan. 2021. "Mechanical Fracture and Fatigue Characteristics of Fine-Grained Composite Based on Sodium Hydroxide-Activated Slag Cured under High Relative Humidity" Applied Sciences 11, no. 1: 259. https://0-doi-org.brum.beds.ac.uk/10.3390/app11010259