Article

Combined Investigation of Indoor Climate Parameters and Energy Performance of a Winery

by
Giorgos Panaras
1,*,
Panagiotis Tzimas
1,
Evangelos I. Tolis
1,
Giannis Papadopoulos
1,
Aristeidis Afentoulidis
1 and
Manolis Souliotis
2
1
Department of Mechanical Engineering, University of Western Macedonia, Sialvera & Bakola Street, 50100 Kozani, Greece
2
Department of Chemical Engineering, University of Western Macedonia, Sialvera & Bakola Street, 50100 Kozani, Greece
*
Author to whom correspondence should be addressed.
Submission received: 16 November 2020 / Revised: 22 December 2020 / Accepted: 6 January 2021 / Published: 9 January 2021
(This article belongs to the Special Issue New Challenges for Indoor Air Quality)

Abstract

:
Wineries present significant interest on a research level, combining Indoor Air Quality (IAQ) issues related with substances emitted through the wine production, as well as the need for minimizing conventional energy consumption (optimizing energy performance). In the proposed work, experimental and theoretical analyses are presented which aim to achieve both targets, that of improved indoor climate and energy performance. An extensive measurement campaign was implemented, regarding indoor climate thermal parameters, as well as concentration of substances (CO2, VOCs, NO2) affecting IAQ. The results of the parameters were exploited for the assessment of indoor climate; moreover, data from indoor thermal parameters together with values of specific parameters related to the efficiency of the individual devices were utilized in the development of the energy model. The model was used to formulate and evaluate proposals for reducing the energy consumption of the winery. The proposals include the use of Renewable Energy Sources (RES) and, in particular, the installation of a photovoltaic array on the roof of the premises. Finally, an economic and technical study was carried out to determine the performance of the suggested interventions and the expected payback period.

1. Introduction

The discussion about the global warming and the climate change is very intense lately. The Paris Agreement aimed to restrict the global temperature increase, while adopted the so-called 20/20/20 targets of the EU, as they are reflected in the relevant EU Directives [1,2]. The wine sector is highly vulnerable to climate change, especially due to the dependence of vine growing on climatic and environmental conditions, while their carbon footprint is significant, taking into consideration aspects of energy use, waste management, water use, soil management and transport of production [3]. The need for increasing the sustainability of wineries, as well as the important role of research on achieving this aim, is highlighted in [4]. Regarding energy issues, energy usage in English wineries is reviewed in [5], indicating specific points of the production process where energy efficiency can be implemented. The energy performance of a specific winery in South Italy is investigated in [6]; cooling proves to be the most energy intensive use, while Renewable Energy Sources (RES) solutions are also examined. The elaboration of a methodology for the reduction of energy optimization during cold stabilization, is presented in [7,8] concentrates on the analysis of cooling loads, demonstrating a methodology for indicating seasonal performance indicators for the respective chillers. In [9], shallow undergraduate temperature variations that can be of benefit in the case of energy saving in underground cellars are experimentally investigated. The implementation of RES in Spanish wineries is investigated in [10], focusing on sectoral structural issues for the energy transition, thus, proposing the measures of increasing the information provided to decision makers in the sector, including technical and economic offers, and facilitating access to financing, while in [11], the use of solar energy, thermal and electrical, for wineries is reviewed, along with its perspectives. The operation of a standalone renewable energy system, installed in a winery in the North-east of Spain, is investigated in [12]. PV panels supply a drip irrigation system, as well as the wastewater treatment plant. Provided that energy storage is small, surplus energy is used for the on-site production of hydrogen by the electrolysis of water, fueling a hybrid fuel cell electric vehicle for the mobility of workers in the vineyard. Towards more environmentally friendly strategies, in [13], the potential of producing biogas from thermophilic anaerobic digestion of winery residue is investigated, quantifying the values of energy that can be produced on the level of the installed wineries in Italy; the results demonstrated that the process could be self-sustaining. Biogas and methane production potential is investigated on a winery in Brazil [14] and Chile [15]; the valorization of winery waste is reviewed in [16]. The environmental and economical profits of CO2 recovery in Siena, Italy is presented in [17]; through the implementation of this technology, about 6050 t CO2 can be stored, and potentially used in many production activities (e.g., food grade, dry ice and other manufacturing processes, such as wastewater treatment, welding and cryoextraction/carbonic maceration in wine making). Moreover, Indoor Air Quality (IAQ), especially for workplace environments, is a crucial issue for the health of the occupants. According to the WHO [18], various problems in IAQ are recognized as important risk factors for human health; well established evidence on health effects of air pollution comes from outdoor air studies, but health effects of same pollutants are expected to be similar also indoors, indicating as well the substantial body of research on health effects of indoor exposures. As it is noted, in the indicated document, IAQ management is made difficult not only by the large number and variation of indoor spaces but also the complex relations of indoor air quality and the building design, materials, operation and maintenance, ventilation and behavior of the building users. Thus, the scientific interest focuses on different types of buildings, addressing also IAQ improvement interventions, through ventilation, filtering or the limitation of specific activities the burden indoor air; indicatively, investigations on hospitals [19], schools [20], offices [20,21], athletic centers, namely aquatic [22], but also residences [23], are reported. Relevant, though limited, investigations for agricultural buildings can be detected [24], also addressing biological factors [25]. To the best of our knowledge there has not been published any study for indoor air quality of winery building. The presented work aims to combine an investigation on both indoor climate and energy issues. An extensive measurement campaign was implemented, regarding indoor climate thermal parameters, as well as concentration of substances (CO2, VOCs, NO2) affecting IAQ. The measurements were exploited for the assessment of indoor climate, as well as for the determination of thermal parameters necessary for the energy model developed. It should be noted that most studies investigating wineries energy performance are based on actual consumption or statistical data. The indicated model provides an insight on the respective processes, while it is used in order to formulate and evaluate proposals for reducing the energy consumption of the winery. The proposals include the use of RES and, in particular, the installation of a photovoltaic array on the roof of the premises.

2. Materials and Methods

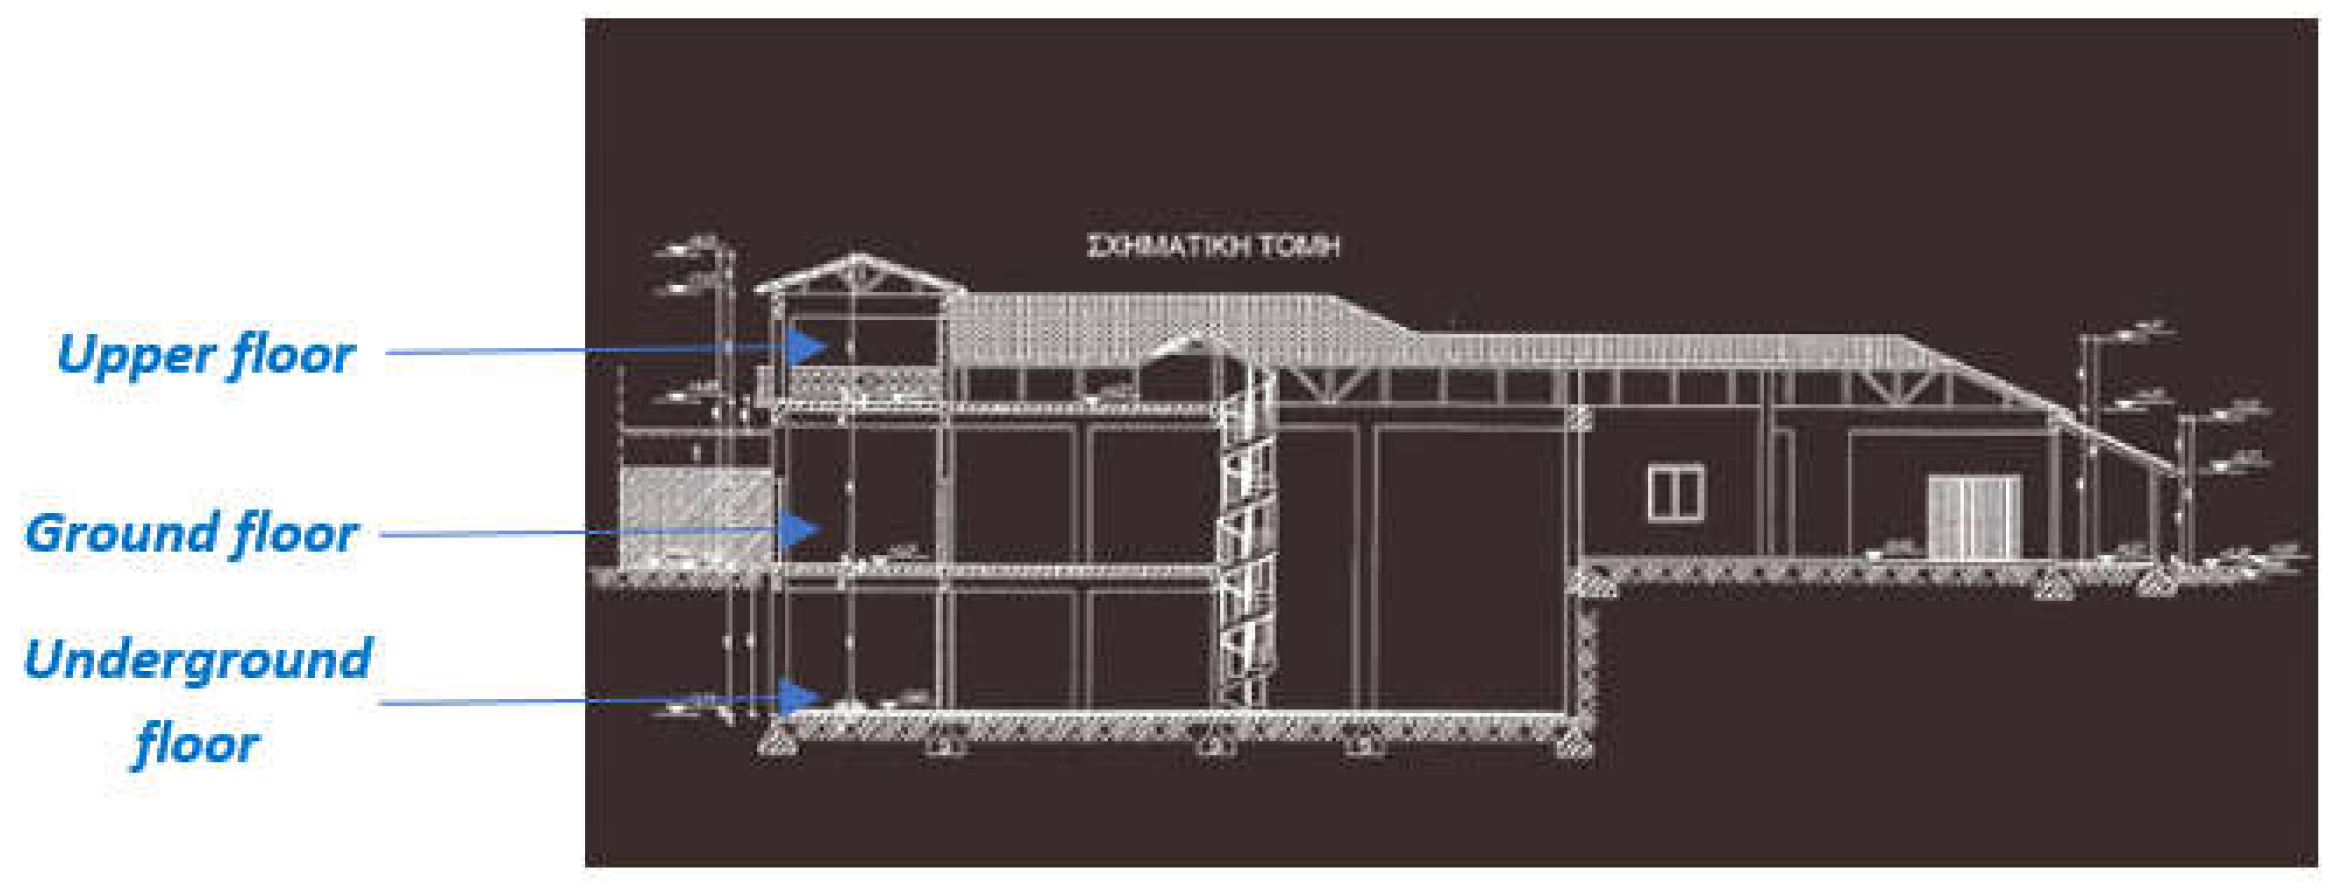
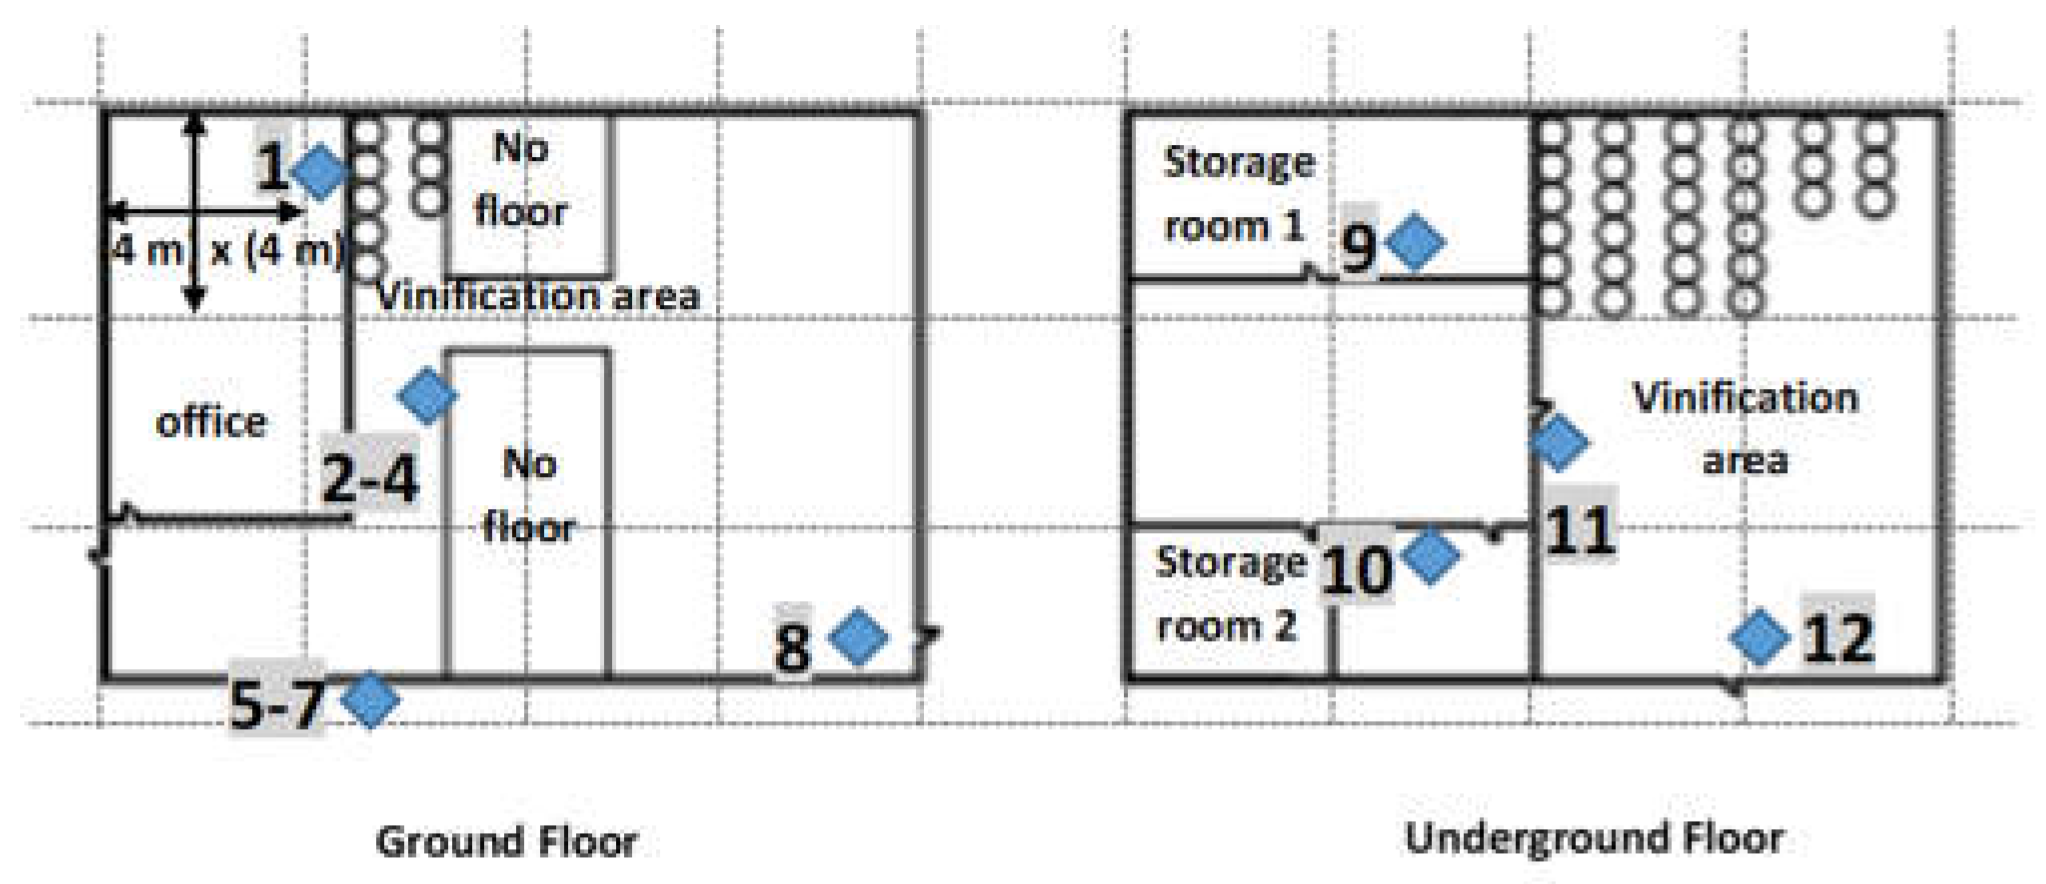
2.1. Description of the Building

The premises are located 3 km away from the town of Amyntaio, and 30 km from the town of Florina, in Western Macedonia, a perfection of Northern Greece. The climate of the respective site is characterized as the coldest one, regarding Greece, noting that Western Macedonia is ranked on D climate zone according to the Greek version of the European Performance of Buildings Directive (EPBD) [26]; rainfall is generally moderate, summers are mild and snowfall is frequent in the winter months. An average annual temperature of 12 °C is reported [27], while in the winter months, the temperature may reach −20 °C or even lower. As can be seen in Figure 1, the building has three floors, and a house is attached to the premises; the screening of the grapes takes place on the upper floor, while the grapes fall on the stainless tank located on the ground floor, with the help of gravity. This floor is the main place of vinification, where most of the tanks lie; on this floor, the only office room of the premises is also located. On the mostly underground floor lie the remaining vinification tanks (architecturally constituting a common place with the ground floor), and two storage rooms for the conservation of the wine bottles, as well as a room where the bottling process takes place.
The studied winery specializes in brut sparkling wine, mostly occupying production volume, while red wine is also produced. Regarding vinification process, as in all cases, this depends on several parameters, the most important one being related to the kind of wine produced, while the variety of grapes strongly depended on the climatic conditions of the winery site, as well as the targeted quality are also of importance. Focusing on the specific industry, the main stages are briefly described, together with the respective equipment requirements:
  • Grape collection and insertion into the press; procedure takes place by the end of August and September;
  • Precooling of the produced juice in the heat exchanger; temperature falls at around 12 °C from ambient temperature, which is at least 4–5 degrees Kelvin higher by this period of the year. This stage requires operation of the cooling system;
  • Insertion of juice into the vinification tanks; constant temperature of 18 °C has to be conserved for the juice in the vinification tanks. Initially the juice remains for 24 h into the tanks. At the end of these hours, transfusion takes place, as the must has to be separated from the mud which has been produced. The tanks get cleaned and the must is reinserted; it stays there for 2 weeks, in order for the fermentation to take place. With regard to the complete production, the tanks are full of must until the end of December;
  • By the new year, the employees lay the tanks alternately inside the fridge. The fridge room is around 10 m2. A water cooler produces the required cooling power, in order to maintain the temperature at about −4 °C. The tanks remain in this place for 8–10 days. This process lasts until April for the complete production, depending on its amount;
  • Yeast is inserted to the wine; it stays for one day in the tanks, suitably conditioned at 18 °C;
  • The wine/yeast mixture is inserted into the bottles; two storage rooms are used for this purpose. The temperature in each storage room remains at 15 °C, through the operation of air-to-air heat pumps, one in each room;
  • The final stage refers to the removal of the sediment and sealing of the bottles with cork. An air-to-air heat-pump is also used in the bottling room.
Given the above, it is evident that the dominating energy use refers to cooling, refrigeration and air conditioning, noting that natural ventilation takes place through the opening of windows and doors. In the following analysis, the energy consumption in the respective appliances, i.e., heat exchanger (cooler), fridge and heat pumps, would be investigated.

2.2. Experimental Measurements Setup

The measuring quantities, in terms of thermal comfort, are the temperature (T) and the relative humidity (RH) of indoor air. In terms of IAQ, CO2 concentration was measured, as well as VOCs and NO2 concentration. Instrumentation is presented in Table 1; the information provided in the table includes the type of instrument, its measuring characteristics, along with the indication referring to its position. The position of the instruments is presented in Figure 2; a 4 m to 4 m grid is added, in order to better indicate space dimensions. The measuring period covers complete year 2019, including December 2018; the measurements have been implemented on the office, the main vinification space, fridge and storage room.

2.3. Field Sampling and Analysis for VOCs

Air samples for VOC analysis were taken using low volume personal pumps (SKC) and pre-conditioned glass tubes filled with Tenax TA (Chrompack, Middelburg, Netherlands) at flow ratios of about 80 mL/min for 30 min. Moreover, duplicate samples were taken and blank tubes were analyzed for quality assurance/quality control purposes. Samples were analyzed using a thermal desorption unit (Gerstel TDS2, Mülheim an der Ruhr, Germany) coupled to a gas chromatograph (Agilent 6890N, Santa Clara, USA), equipped with a mass spectroscopy detector. Tenax tubes were thermally desorbed using Gerstel thermodesorption system TDS2 with autosampler TDSA, in splitless mode using the following programme: initial temperature: 40 °C, raised to 250 °C at 30 °C/min, held at 2.5 min and final temperature of 280 °C. The transfer temperature to the Cryocooling injection system (CIS) was 280 °C. The desorbed compounds were trapped at the CIS at −120 °C and then underwent rapid heating to 280 °C to enter the gas chromatography capillary column. The initial oven temperature was kept at 35 °C for 5 min and then increased at 80 °C with a rate of 8 °C/min and kept there for 6 min. After that the temperature increased up to 100 °C with a rate of 20 °C/min and kept there for 3 min. The total run time was 30.63 min.

2.4. Energy Model

The energy model aims to simulate the operation of the devices serving the respective processes in terms of energy consumption. The devices are listed in Table 2, together with the main parameters of the adopted model for each process. More specifically:
  • Cooling processes: it has been preferred to adopt the simplified model:
    E e l = P c · t S E E R
    where:
    -
    Eel, the electrical energy consumed for the process;
    -
    Pc, the cooling power;
    -
    t, the time of operation;
    -
    SEER, the efficiency of the cooling device.
The above approach is implemented for the cooler (supplying heat exchanger and vinification tanks), and the fridge.
Especially regarding the operation time of the cooling system and the fridge, this has been calculated with regard to the production quantity, while the exact time the compressor is operating for each system has been determined through measurement of the temperature into the fridge cell, or of the time itself for the cooling system.
In terms of the SEER, given that the value of this index depends on ambient temperature (heat source temperature) and chilled water temperature (heat sink temperature), as well as to the working load imposed, the determination of this index is too demanding, requiring measurements over a sufficient period.
For the heat exchanger chiller, there are available performance data from the manufacturer, indicating SEERR = 3.24. According to the Greek version for the adoption of European Performance Buildings Directive (EPBD) [26,28], a value of SEER = 2.7 is proposed for chillers installed between year 1990 and 2001. Given that the device is quite old, while its maintenance is not proper, this value has been considered more suitable for the calculations, than manufacturer’s indication.
For the chiller of the fridge, manufacturer data were not available, while the referred Technical Directive [26] does not make any proposition for user temperatures below 0 °C. It has been preferred to use a value of SEER = 2.2, as this the suggestion of the Technical Directive in case of not available performance data.
  • Heating/Cooling of storage spaces; the energy consumed for the heating/cooling of storage spaces has been calculated on the basis of the respective demand and the performance of the heat pump:
    E e l = E d t h S C O P ( S E E R )
    where:
    -
    Edth, the thermal energy load (demand) of the storage spaces;
    -
    SCOP (SEER), the seasonal efficiency of the heat pump for heating or cooling, respectively.
The thermal energy demand of the storage spaces has been calculated according to EN ISO13790 monthly method [29], as adopted by the Greek version for the adoption of EPBD [26,28]. The method indicates the calculation of heat losses and heat gains, due to the solar source (external) and indoor sources, namely human, lighting and equipment (internal); individual quantities sum up, respectively, to the total load, taking into account heat gain and heat losses utilization factor, with regard to the heating or cooling load respectively. The model requires the ambient temperature (Ta), room temperature (Tb), as well as the thermal loss coefficient of the walls (Um) and their surface (A).
The SCOP of the heat pump refers to seasonal performance; given that the value of this index depends on ambient temperature (heat source temperature) and room temperature (heat sink temperature), as well as to the working load imposed, the determination of this index is too demanding, requiring measurements over a sufficient period. In the proposed approach, it has been preferred to use a representative value, based on the manufacturer’s data and the treatment of similar devices according to the Greek version for the adoption of EPBD [26,28]. The rated value provided by the manufacturer is SCOPR = 4, while the Technical Directive suggests that S C O P = S C O P R · 0.93 .
Respectively, for the cooling process, noting that the cooling period refers to months June–August, according to the Technical Directive of the Technical Chamber [26], the rated value provided by the manufacturer is SEERR = 6.3, while the Technical Directive suggests that S E E R = S E E R R · 0.6 .
  • On site processes: these refer to various devices that are installed, and are listed in Table 2. Their energy consumption is calculated according to the simplified approach:
    E e l = P e l · t
    where:
    -
    Pel, the installed power of the devices;
  • Labeling device: the labeling device operates by the time wine production is not active, i.e., by summer period. The approach imposed by Equation (3) has been adopted.
From the above, it is obvious that despite the intense effort to determine all the parameters involved in the calculations, uncertainty factors are strong (devices operation times, heat pumps/chillers performance, etc.) and may affect the reliability of estimations.

3. Results

3.1. Thermal Comfort and IAQ Parameters

In Table 3, the values of thermal comfort and IAQ parameters (namely CO2 concentration) are presented for the office; values refer to working hours (9:00–17:00). As can be seen by the demonstrated values, the heating of the office, especially during the period following fermentation (wintertime) is responsible for the satisfaction of thermal comfort conditions. Relative humidity values are rather high, nevertheless lie within acceptable limits for the case of the office; the inadequate ventilation can be related to the above. This is verified by the fact of the CO2 concentration exceeding acceptable limits, noting the sensor measurement limitation of 2500 ppm (see note 3 in Table 1), due to the fermentation (office communicates with the main area, as can be seen in Figure 2) or the presence of people (especially regarding the period after fermentation). It should be noted that the observed values lie above the indicated limit of 800 ppm, according to the relevant Directive by the Greek Government [30], verifying the need for the increase of ventilation rate.
Moreover, in Figure 3, the concentration of CO2 is presented over a period within the fermentation one (the measurement days have been numbered with regard to complete year 2019, i.e., Day 1 refers to January 1st 2019; this is valid for Figure 4 as well). As can be seen, during the fermentation phase, the high values of CO2 decrease by late hours, as by that time the owner of the place opens the door in order to put some fresh air (night ventilation). The doors close again by early morning time, even though, due to the mild outside temperatures they do not stay firmly closed, allowing some ventilation. On the other hand, as demonstrated in Table 3, by the period fermentation does not take place, the CO2 values are lower, depending on the presence of personnel during regular working hours (9:00–17:00).
Regarding the main area, in Figure 4 the CO2 concentration during fermentation period is presented. Again, one may see the effect of night ventilation on decreasing CO2 concentration, while the values of the various sensors are quite close, demonstrating rather homogeneous environment in terms of (unfortunately not acceptable) air quality.
In Table 4, the values of thermal comfort and IAQ parameters (namely CO2 concentration) are presented for the main area. The values of the MX sensor (Vin(11)) have been used, as their CO2 concentration range is higher, thus allowing the more accurate monitoring of the phenomenon. As one may see, during fermentation, indoor conditions lie close to thermal comfort ones on a temperature level; nevertheless, after fermentation period, which is by wintertime, the non-conditioning of the vinification area is responsible for the temperature decreasing and lying below thermal comfort level. Relative humidity is high, on the edge of the thermal comfort limits; this can be potentially attributed to the rather low temperatures of the specific space. Inadequate ventilation combined with the fermentation or the presence of people leads to values of the CO2 concentration exceeding acceptable limits.
In Table 5, the values of thermal comfort and IAQ parameters (namely CO2 concentration) are presented for the storage room of bottles, referring to wintertime (January to March). Values demonstrate that the set-point of 15 °C is not strictly maintained, while CO2 values exceed suggested limits; this can be attributed to the preparation of yeast on open tanks at the storage rooms, as well as to the presence of personnel, noting that these rooms are not ventilated at all. The case for relative humidity is similar to the one for the vinification space.
Regarding other parameters related to IAQ, the outdoor values of NO2 concentration, as presented in Table 6, are higher than the indoor values; this can be attributed to the lack of NO2 sources inside the winery.
VOC compounds measured in this study are namely illustrated at Table 7. More specifically, the concentration of measured VOC in the different rooms of the winery for the two seasons of measurements are included. The concentration of VOCs at the winter period of 2018–19 (non-winemaking period) was at higher values compared to the winemaking period of the 2019 (Table 7). This is probably due to the heating period of December of 2018, in contrast to the non-heating period of early October 2019. The closed windows and doors of the whole building led to a higher concentration, in contrast with the winemaking period, when the doors and windows were completely open by night time, and semi-open by the day time, as indicated also above. The heating period and the low temperatures are probably the reason that the VOCs outdoor concentration of the winery at the non-winemaking period is higher than the winemaking period. In general, the outdoor VOC concentrations in both periods are at low levels as the winery is located at rural area. The predominant compounds of the outdoor area are, as expected, benzene, toluene and hexane for the non-winemaking (heating) period, while for the winemaking period benzene and toluene are the substances with the higher concentration. Comparing these compounds concentration at the different rooms of the winery, regarding the storage room which is the room with the lowest ventilation mode, the high concentration of benzene, toluene and hexane might be due to the movement of the hand pallet truck that took place at the vinification place at the non-winemaking period. This is also reflected for the winemaking period. Except those values, the predominant compounds for the storage room are a-pinene and 3-carene, i.e., terpenes, which are naturally emitted compounds and their concentration mainly come from the cork and wood (pine) made barrels of the wine storage tanks. For the office room, the VOC concentrations for both measurement periods present differences with regard to those of the vinification area, as office constitutes a separate, “isolated” space from this area (Figure 1 and Figure 2); separation is more intense by wintertime as, due to heating purposes, the connecting door remains strictly closed. Especially, by wintertime (non-wine making period), the indicated high values for Benzene and Toluene are related to the occasional use of a woodstove for heating purposes of the office. Moreover, the high concentration of d-limonene in the office by non-winemaking period is probably due to the presence of some person wearing a personal care product which emits such terpenes [31].
With regard to the detection of compounds which are directly related to the wine making procedure, the GC-MS analysis of the sampling air of the basement room detected compounds such as iso-amyl alcohol, ethylacetate, iso-amylacetate, hexanoic acid ethyl ester, N-hexyl acetate, octanoic acid ethylester and decanoic acid ethyl ester [32,33]. These compounds are not found at the non-winemaking period for the vinification area which is the place of wine making procedure.

3.2. Energy Analysis

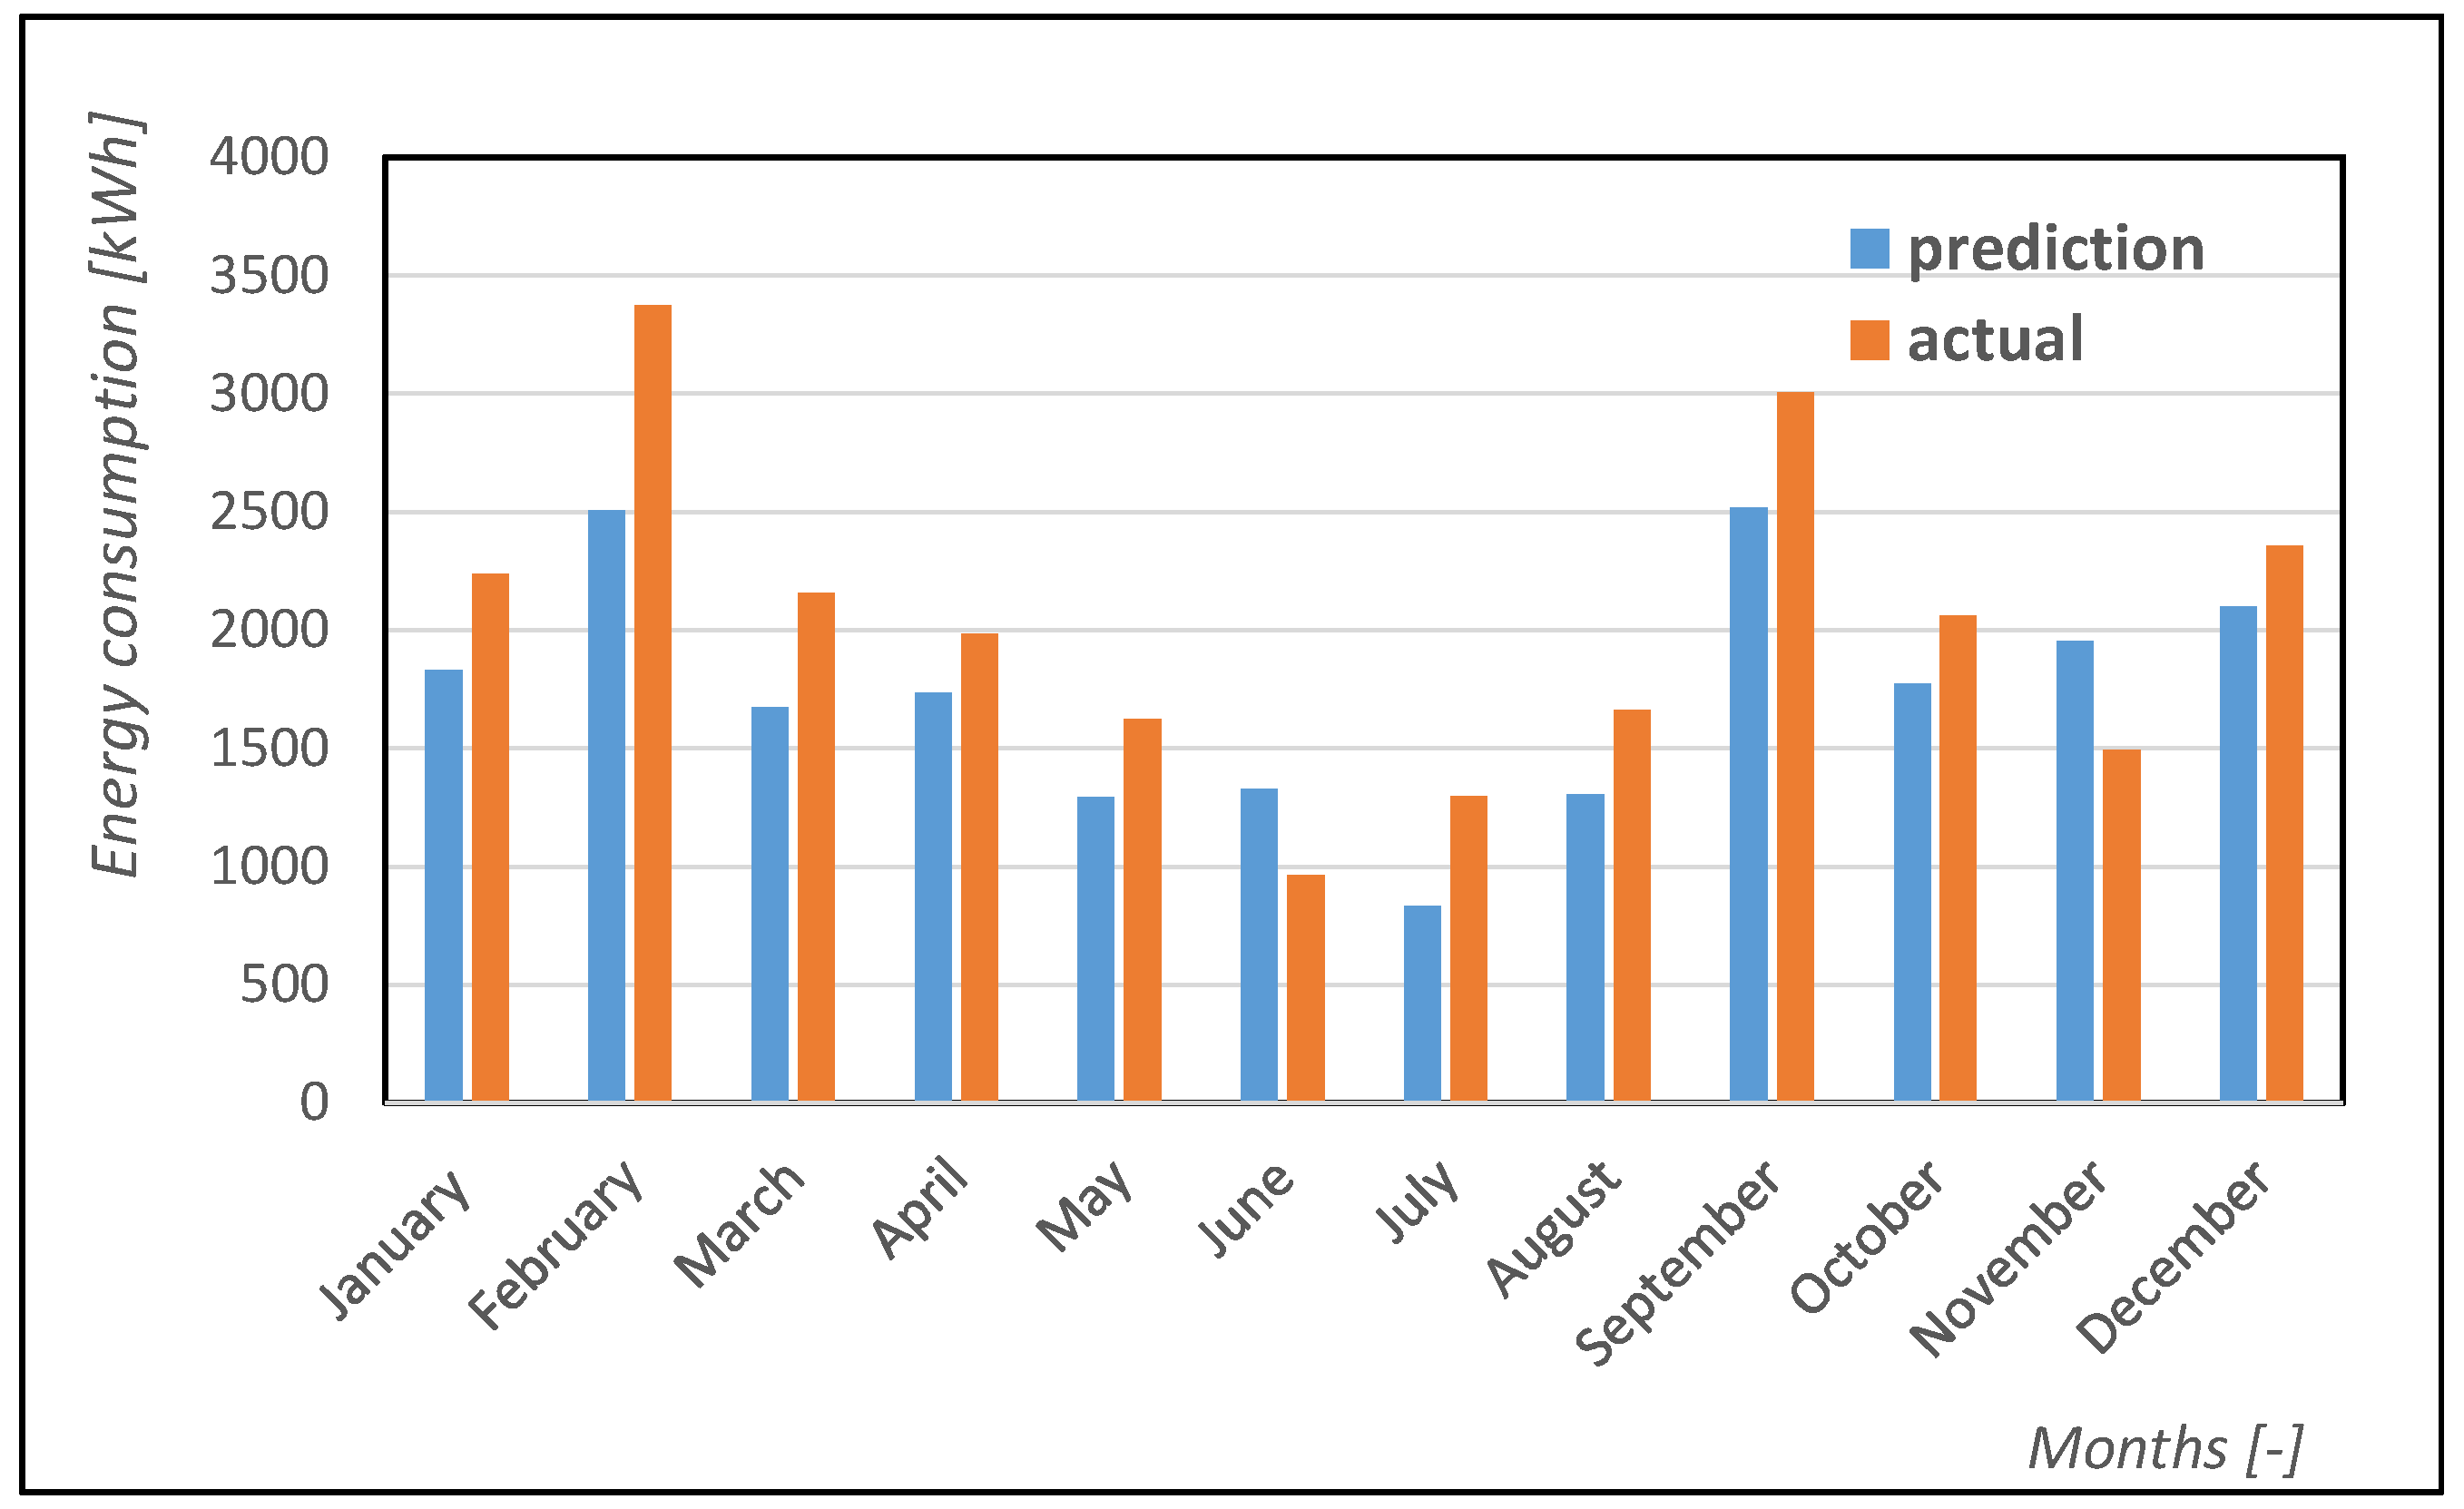
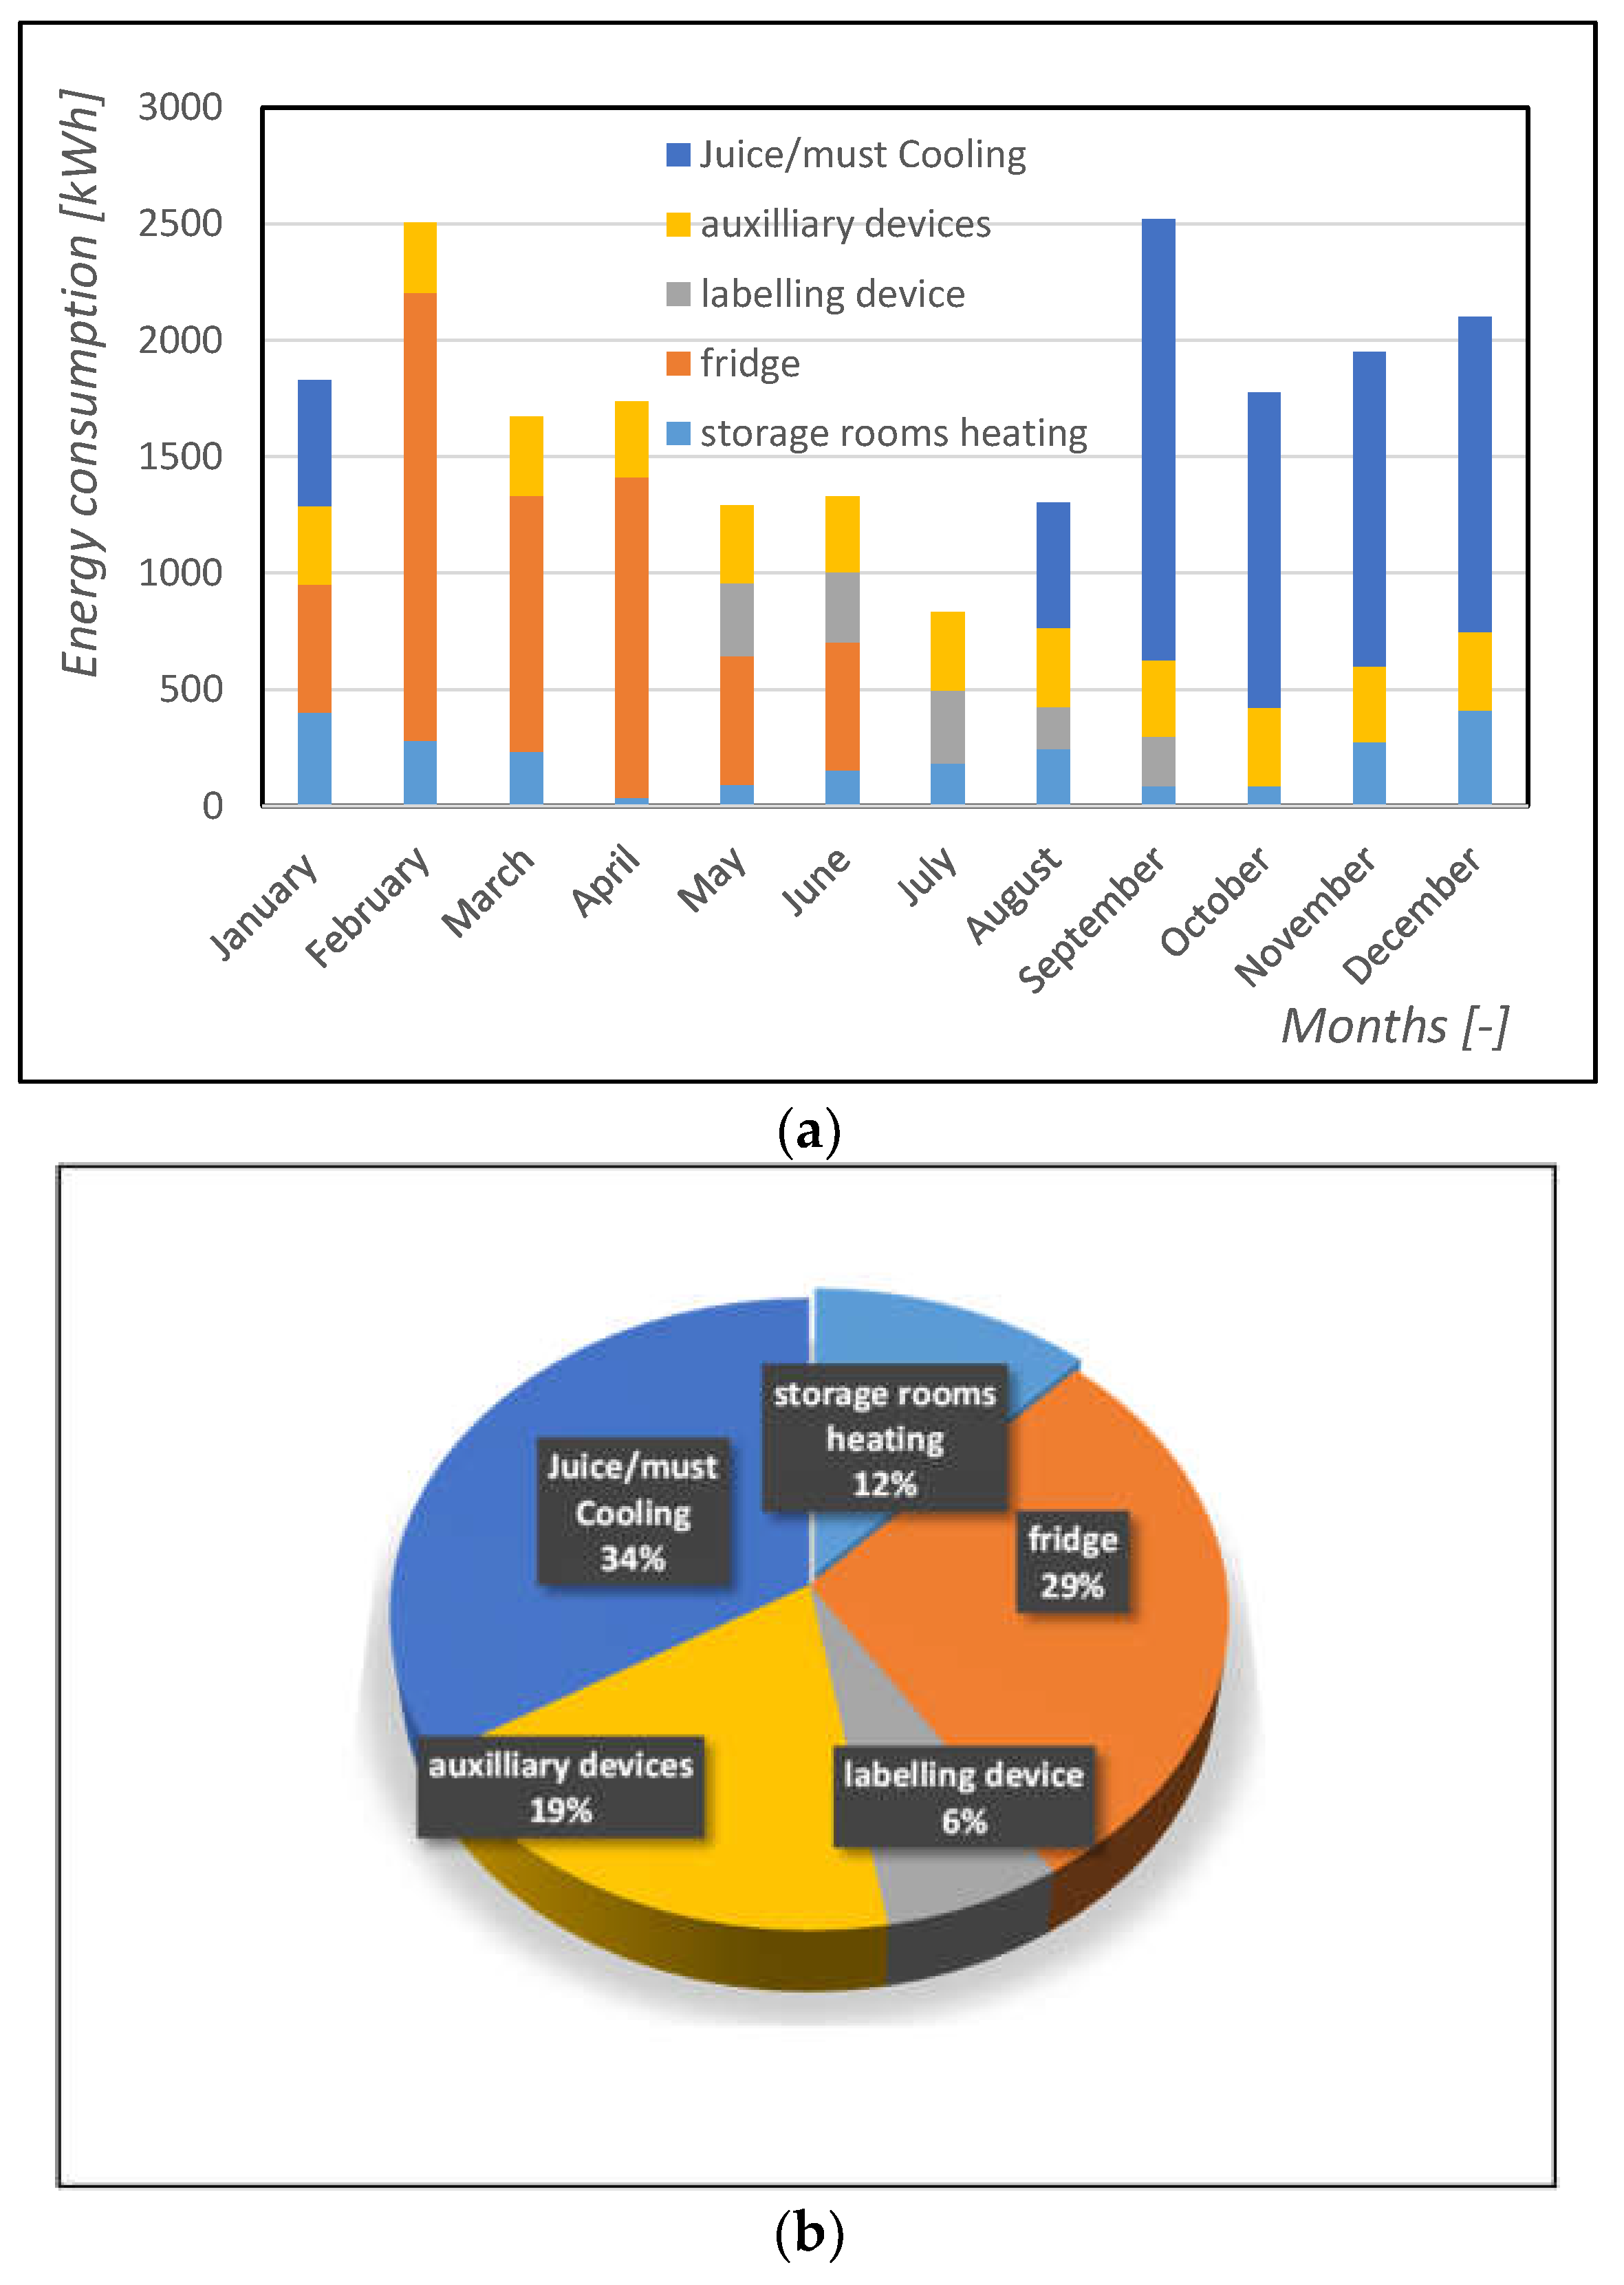
3.2.1. Present Situation

In Figure 5, one may see the monthly consumption of energy according to the model, as well as according to the energy bills. The agreement is quite satisfactory, given the discussion in Section 2.3 for the related uncertainties and modeling difficulties; the deviation on annual level being 16.1%. Estimated consumed energy reaches 0.42 kWh/L, which is in agreement to the values proposed in [5] for the English wineries in average; it should be noted though that in [6], significantly lower values are proposed through the case study of an Italian winery.
In Figure 6a, the share of the main processes to the total energy consumption is presented on monthly basis; Figure 6b presents the annual share. It is evident that the cooling and refrigeration processes, together with heating, constitute the most important share, in agreement with the findings of the existing literature [5,6].

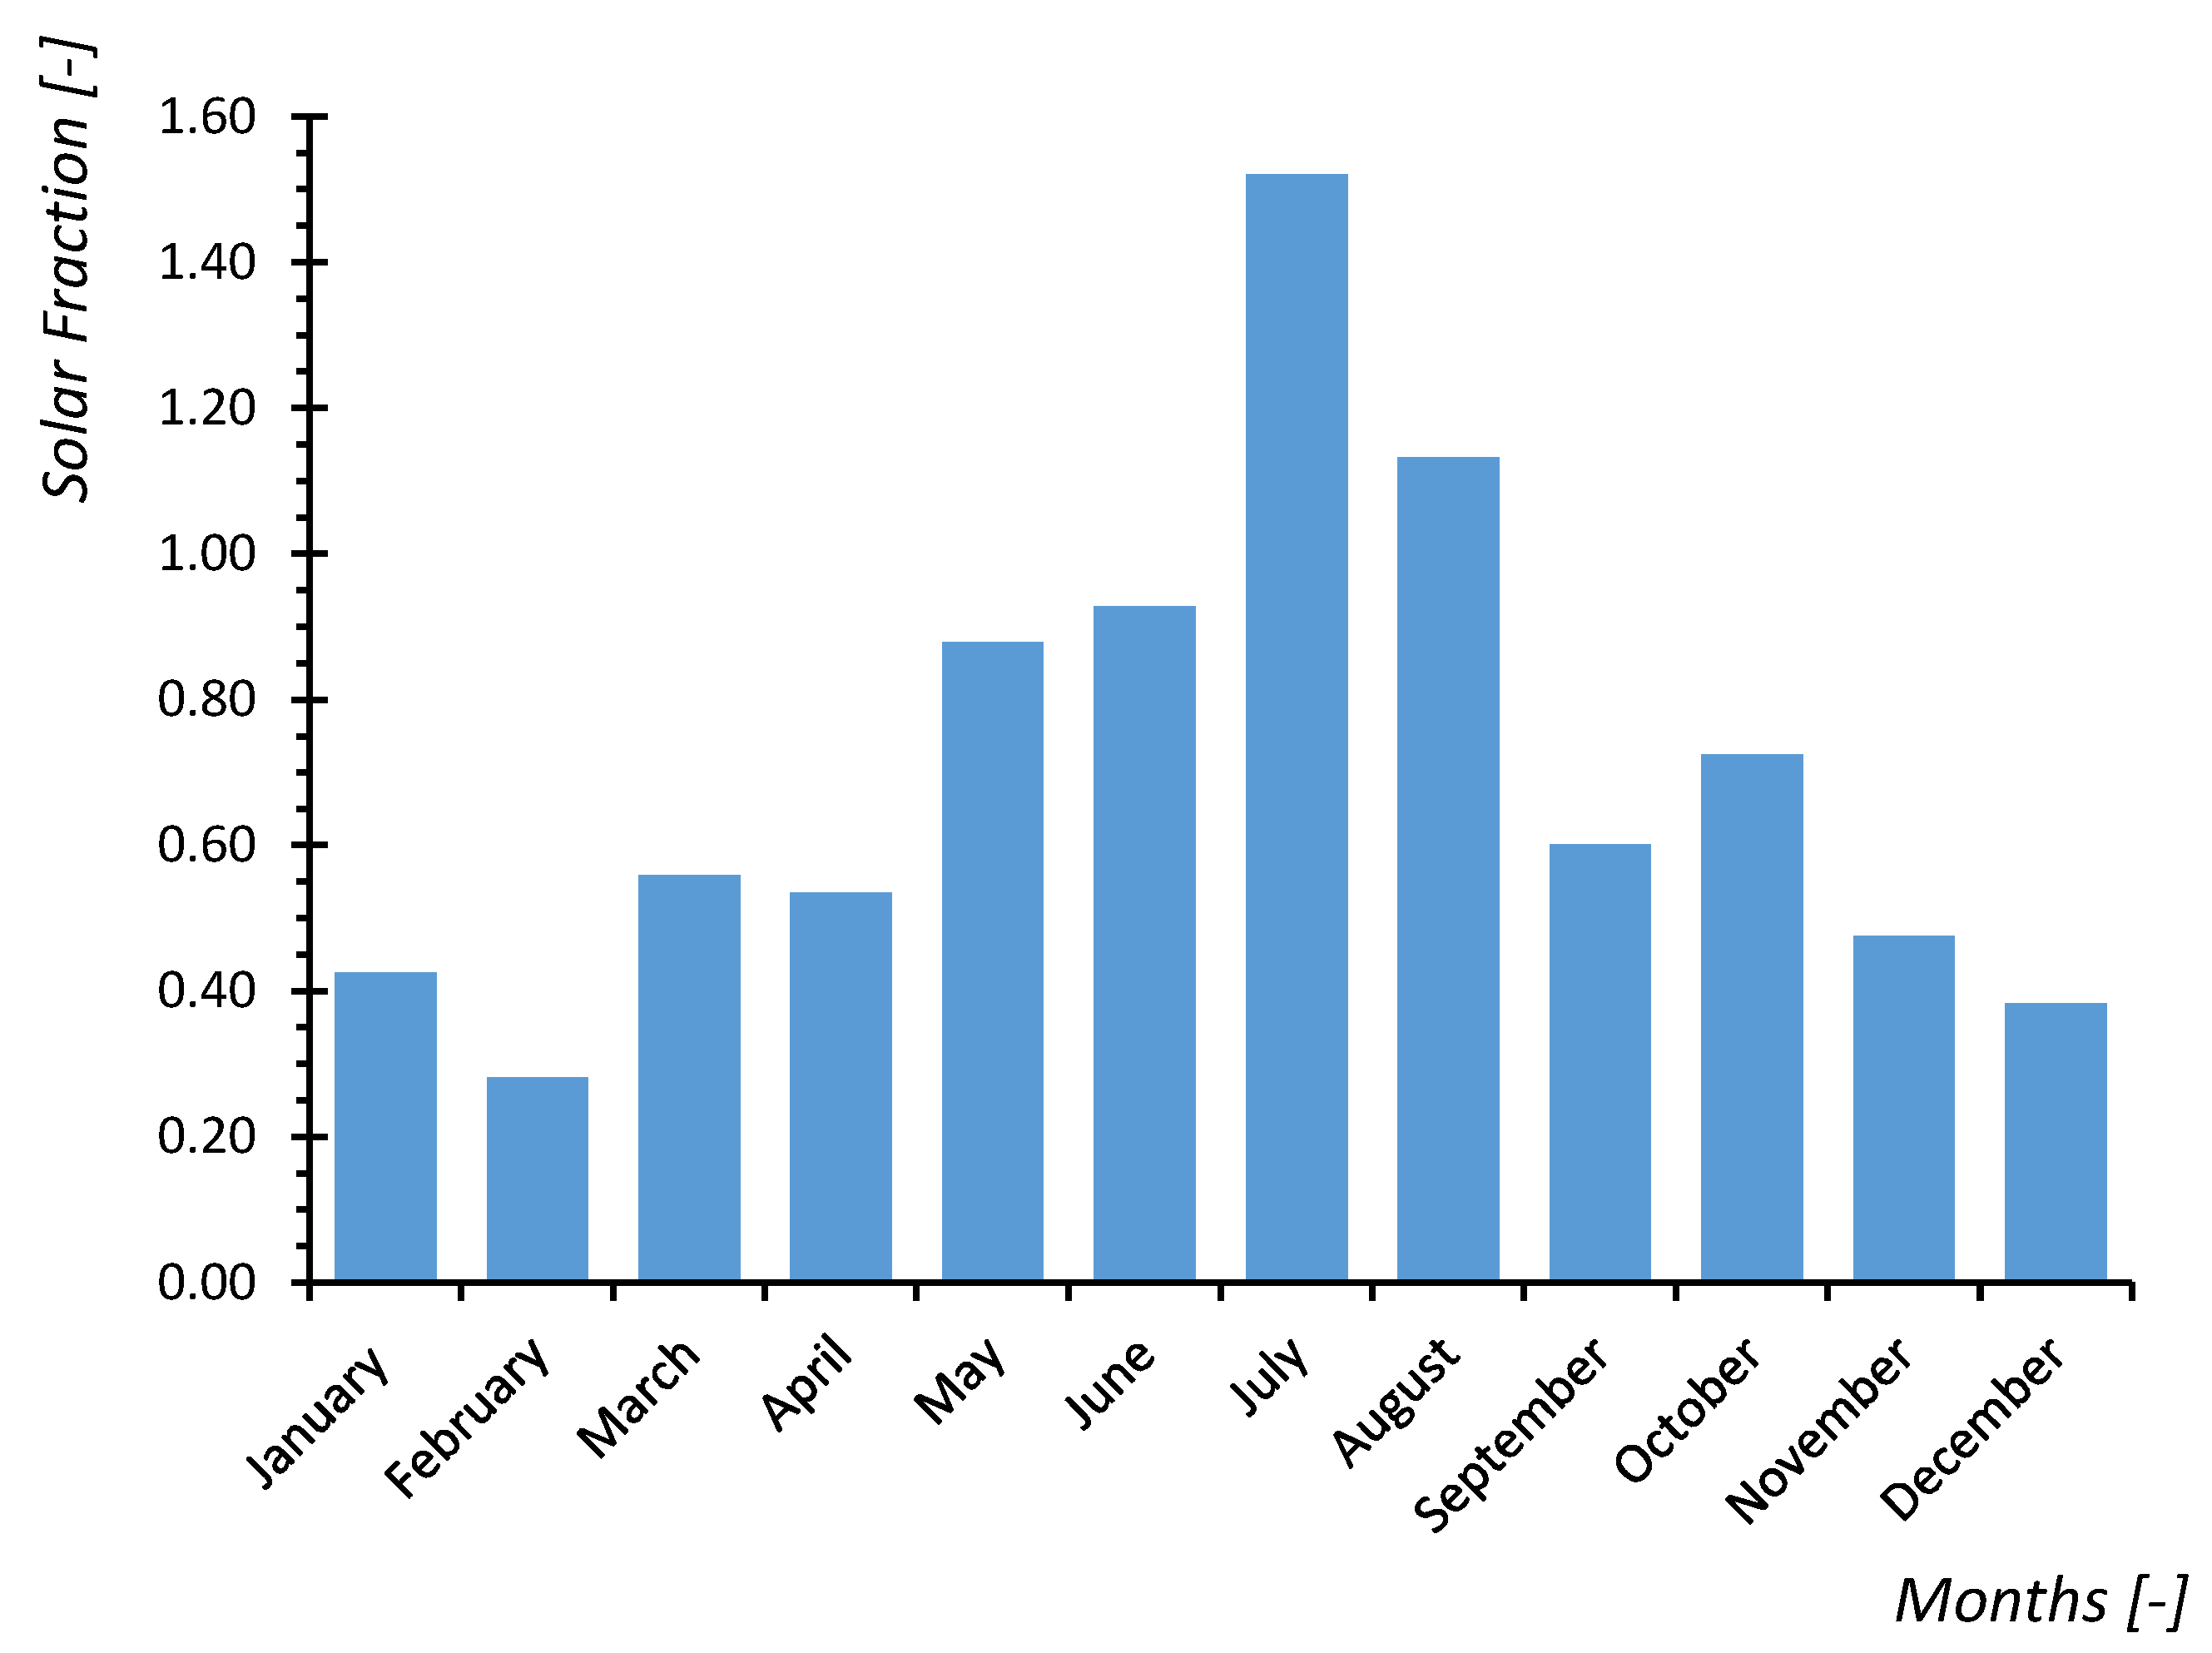
3.2.2. Conventional Energy Decrease Scenario

The energy upgrade scenario includes two basic interventions, that of replacing the compressor of the air-to-liquid cooling unit, performing poorly, as well as investigating the potential of installing PV panels for substituting electricity produced by conventional fuel.
The energy model allows the calculation of the energy saving by the aforementioned interventions; the total amount of consumed electricity by the new chiller is 4326.4 kWh, with an achieved reduction of 38.5%. Moreover, it has been preferred that the area occupied by the photovoltaic system is equal to 50 m2, as this area is available, while leading to significant conventional energy reduction and satisfactory payback period, as it will be discussed hereafter.
Given that the PVs would be installed on horizontal surface (South orientation), as there is availability of free area on the premises, their inclination results through the recommendation of the Greek Directive for EPBD [26]. The transformation of the solar radiation data from horizontal [27], to that of the installation, has been based on the Liu-Jordan method [34]. The energy analysis has been based on a monthly based method, proposed by the Greek Directive for EPBD [26]. In Figure 7, the solar fraction is presented.
Given that the installation of the PVs is planned according to the net metering mechanism, which allows the clearing of produced energy on annual basis, Solar Fraction values above 1 have been considered acceptable; payback period of 3.4 years are estimated for the PVs. The conventional energy saving percentage, through the aforementioned interventions, is 54.6%, and the respective payback period 3.6 years, which can be considered quite satisfactory.

4. Conclusions

The experimental investigation of indoor climate parameters through a complete year of winery operation resulted to the following findings:
-
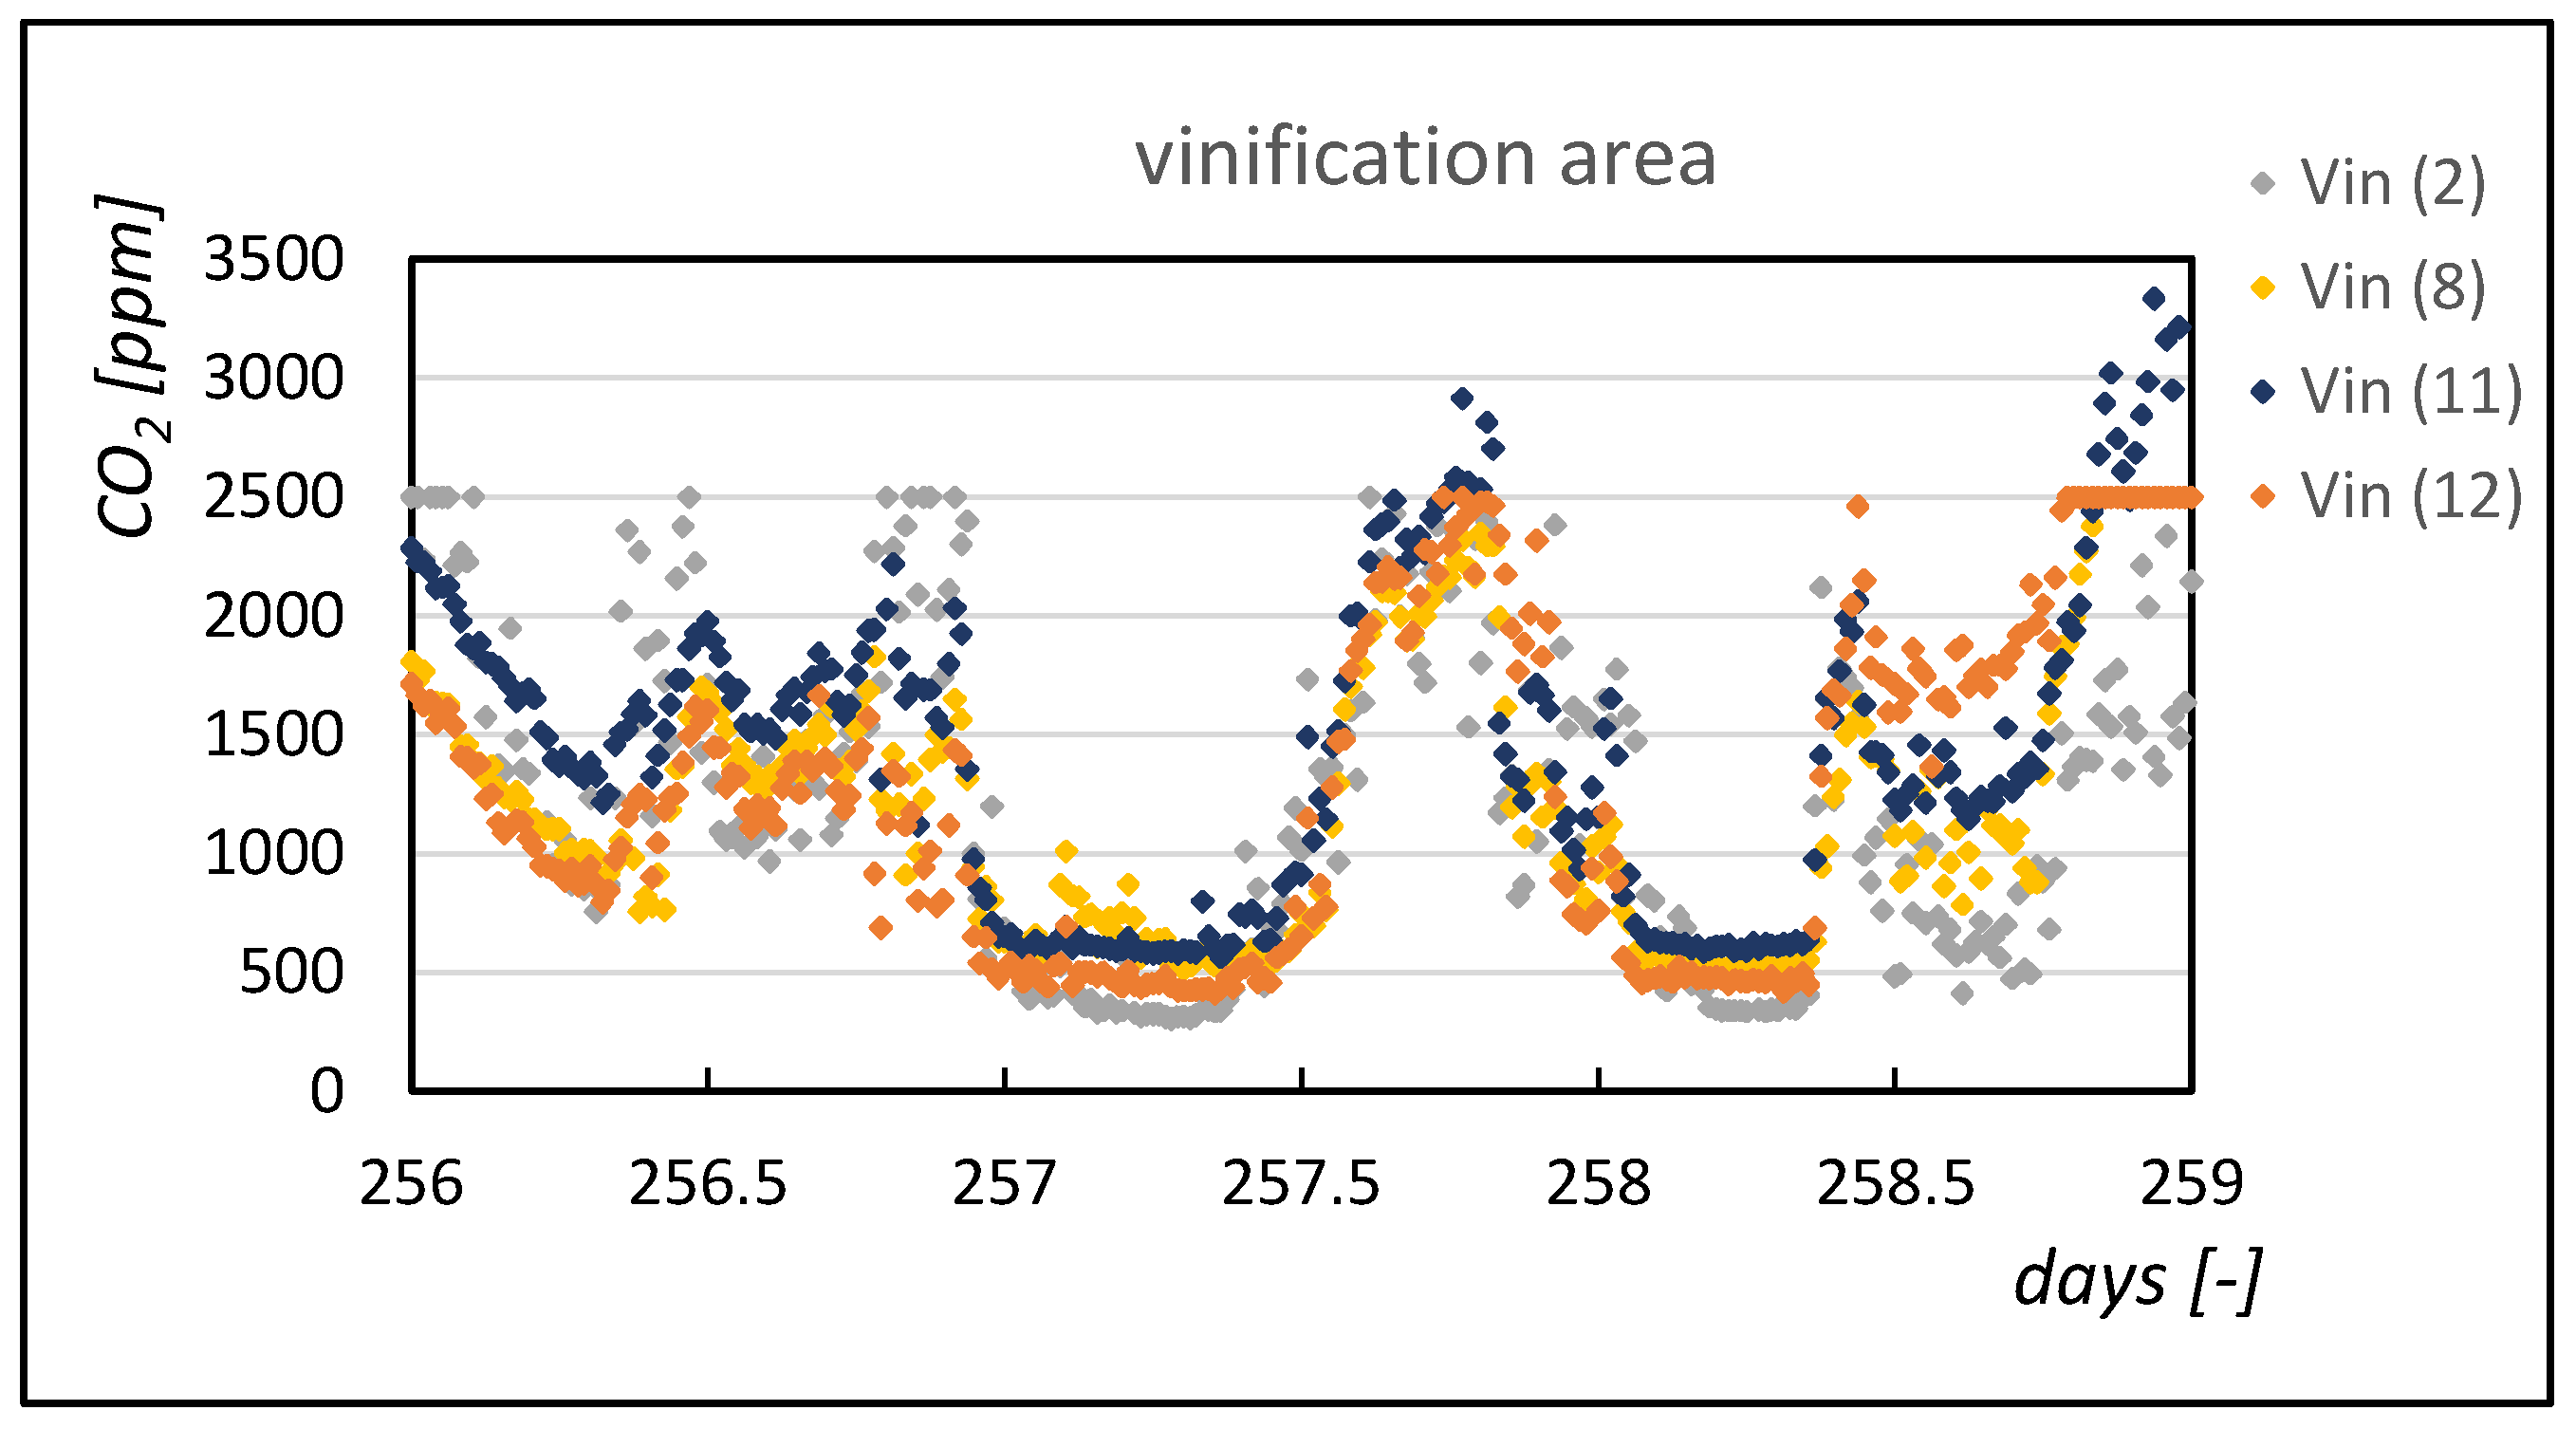
Quite high CO2 concentration values during the periods of fermentation at the vinification area.
-
Night ventilation contributed to the decrease of the respective CO2 concentration values.
-
The effect of night (and partially daily) ventilation resulted also to the detection of higher VOCs concentrations for the non-winemaking period, taking place by wintertime.
-
The preparation of yeast led to high CO2 concentration values at the storage rooms, while the predominant VOCs for the storage room are a-pinene and 3-carene, i.e., terpenes, naturally emitted from the cork and wood (pine) made barrels of the wine storage tanks.
-
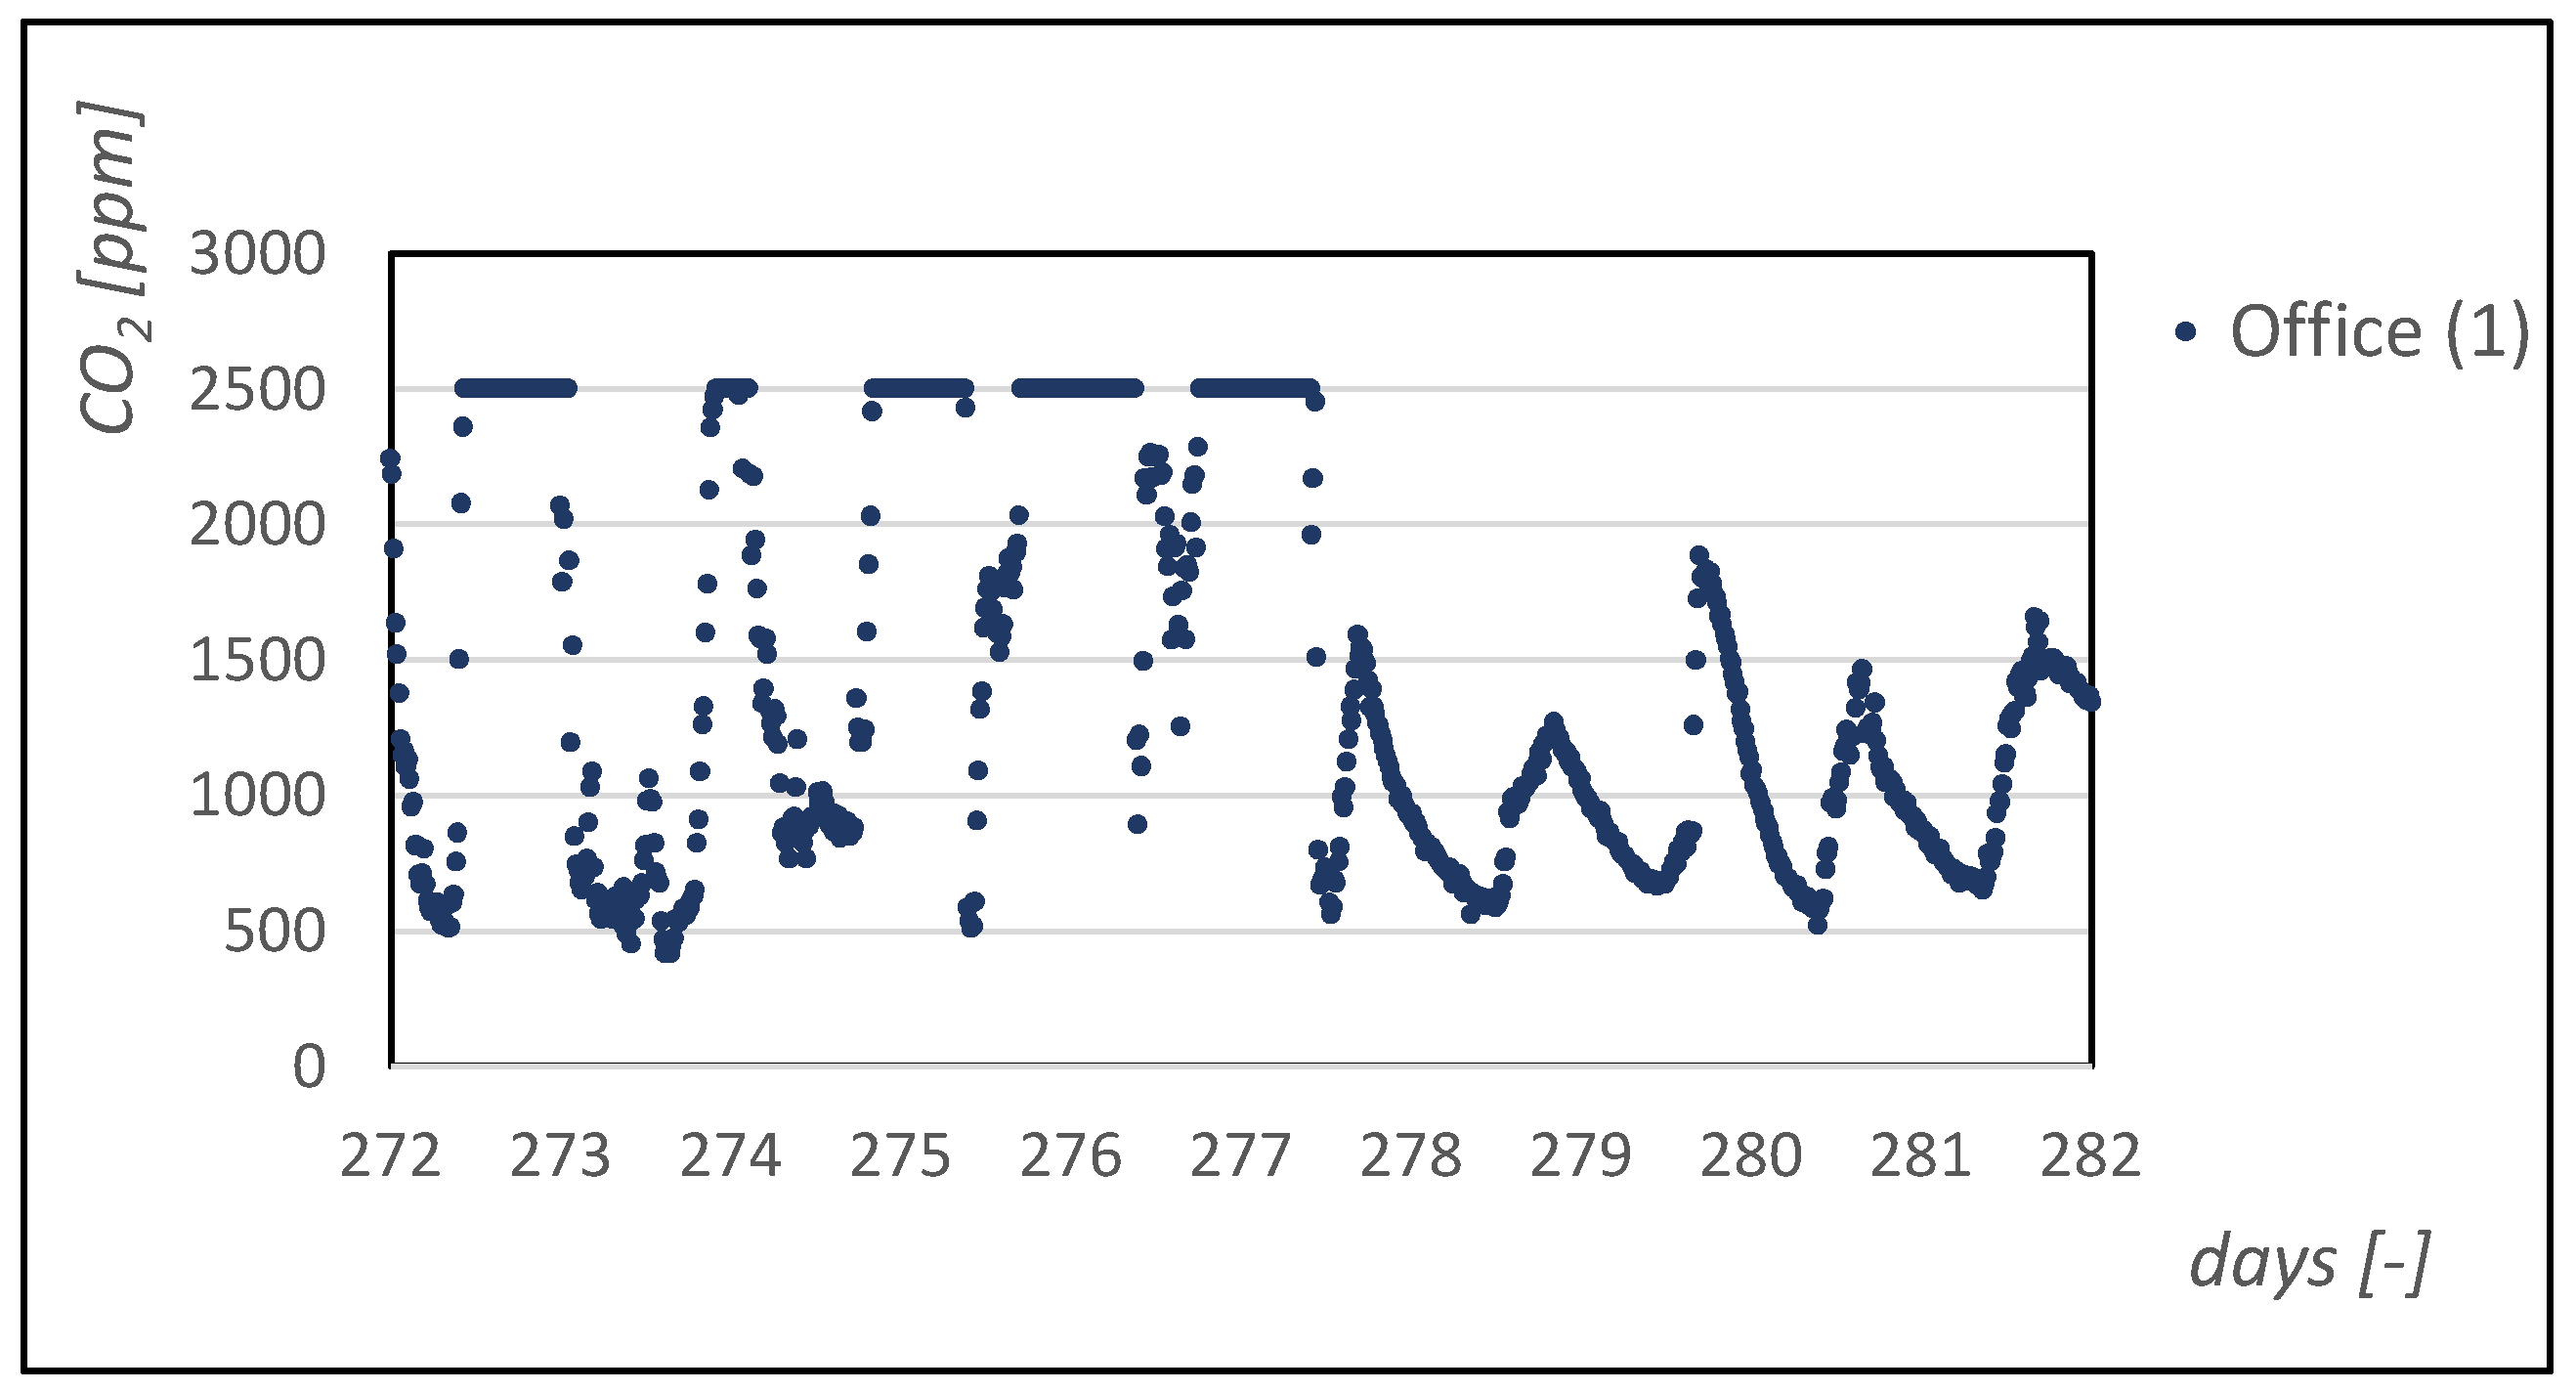
In the office, CO2 concentration values were affected by both the presence of people and fermentation process. The determined CO2 concentration values exceeded the respective exposure limits of the respective regulations, demonstrating inadequate ventilation.
-
Thermal parameters, and especially temperature, proved to be well regulated in the respective spaces (office, storage rooms) were caution was implemented.
The formulated energy model, having incorporated determined indoor climate and energy performance parameters, and validated through actual consumption data, allowed an insight on the involved processes. The assessment of energy interventions, through the model, namely the replacement of the air-to-liquid cooling unit, and the installation of PV panels with a total area of 50 m2, demonstrated 54.7% energy saving and 3.6 payback period.
The proposed methodology can be, through proper adjustment, exploited for relevant units, i.e., premises combining building uses and agro-industrial processes, allowing the assessment of indoor environment and energy performance, as well as the evaluation of interventions towards the reduction of energy consumption and improvement of the environmental footprint of the respective units.

Author Contributions

Conceptualization, G.P. (Giorgos Panaras); Data curation, E.I.T.; Formal analysis, E.I.T., A.A. and M.S.; Investigation, P.T. and G.P. (Giannis Papadopoulos); Project administration, G.P. (Giorgos Panaras); Supervision, G.P. (Giorgos Panaras); Writing—original draft, G.P. (Giorgos Panaras); Writing—review & editing, E.I.T. and M.S. All authors have read and agreed to the published version of the manuscript.

Funding

This research received no external funding.

Institutional Review Board Statement

Not applicable.

Informed Consent Statement

Not applicable.

Acknowledgments

The authors of this work would like to thank Laurens M. Hartman—Karanika and Annette van Kampen, owners of Domaine Karanika, for allowing their access and work on the premises, as well as for the provision of all necessary data for the analysis.

Conflicts of Interest

The authors declare no conflict of interest.

References

  1. EU. Directive (EU) 2018/2002 of the European Parliament and of the Council of 11 December 2018 amending Directive 2012/27/EU on Energy Efficiency; EU: Brussels, Belgium, 2018. [Google Scholar]
  2. EU. Directive (EU) 2018/2001 of the European Parliament and of the Council of 11 December 2018 on the Promotion of the Use of Energy from Renewable Sources; EU: Brussels, Belgium, 2018. [Google Scholar]
  3. Carroquino, J.; Garcia-Casarejos, N.; Gargallo, P. Classification of Spanish wineries according to their adoption of measures against climate change. J. Clean. Prod. 2020, 244, 118874. [Google Scholar] [CrossRef]
  4. Santini, C.; Cavicchi, A.; Casini, L. Sustainability in the wine Industry: Key questions and research trends. Agric. Food Econ. 2013, 1, 9–23. [Google Scholar] [CrossRef] [Green Version]
  5. Smyth, M.; Nesbitt, A. Energy and English wine production: A review of Energy use and benchmarking. Energy Sustain. Dev. 2014, 23, 85–91. [Google Scholar] [CrossRef]
  6. Malvoni, M.; Congedo, P.-M.; Laforgia, D. Analysis of energy consumption: A case study of an Italian winery. Energy Procedia 2017, 126, 227–233. [Google Scholar] [CrossRef]
  7. Celorrio, R.; García, J.L.; Martínez, E.; Jiménez, E.; Blanco, J. Methodology for the reduction of energy demand during cold stabilization in the wine industry. Energy Build. 2017, 142, 31–38. [Google Scholar] [CrossRef]
  8. Tinti, F.; Barbaresi, A.; Benni, S.; Torreggiani, D.; Bruno, R.; Tassinari, P. Experimental analysis of shallow underground temperature for the assessment of energy efficiency potential of underground wine cellars. Energy Build. 2014, 80, 451–460. [Google Scholar] [CrossRef]
  9. Catrini, P.; Panno, D.; Cardona, F.A.; Piacentino, A. Characterization of cooling loads in the wine industry and novel seasonal indicator for reliable assessment of energy saving through retrofit of chillers. Appl. Energy 2020, 266, 114856. [Google Scholar] [CrossRef]
  10. Garcia-Casarejos, N.; Gargallo, P.; Carroquino, J. Introduction of Renewable Energy in the Spanish Wine Sector. Sustainability 2018, 10, 3157. [Google Scholar] [CrossRef] [Green Version]
  11. Jia, T.; Dai, Y.; Wang, R. Refining energy sources in winemaking industry by using solar energy as alternatives for fossil fuels: A review and perspective. Renew. Sust. Energ. Rev. 2018, 88, 278–296. [Google Scholar] [CrossRef]
  12. Carroquino, J.; Roda, V.; Mustata, R.; Yago, J.; Valiño, L.; Lozano, A.; Barreras, F. Combined production of electricity and hydrogen from solar energy and its use in the wine sector. Renew. Energy 2018, 122, 251–263. [Google Scholar] [CrossRef] [Green Version]
  13. Da Ros, C.; Cavinato, C.; Bolzonella, D.; Pavan, P. Renewable energy from thermophilic anaerobic digestion of winery residue: Preliminary evidence from batch and continuous lab-scale trials. Biomass Bioenergy 2016, 91, 150–159. [Google Scholar] [CrossRef]
  14. Filho, M.G.; Lumi, M.; Hasan, C.; Marder, M.; Leite, L.C.S.; Konrad, O. Energy recovery from wine sector wastes: A study about the biogas generation potential in a vineyard from Rio Grande do Sul, Brazil. Sustain. Energy Technol. Assess. 2018, 29, 44–49. [Google Scholar]
  15. Montalvo, S.; Martinez, J.; Castillo, A.; Huiliñira, C.; Borja, R.; García, V.; Salazar, R. Sustainable energy for a winery through biogas production and its utilization: A Chilean case study. Sustain. Energy Technol. Assess. 2020, 37, 100640. [Google Scholar] [CrossRef]
  16. Ahmad, B.; Yadav, V.; Yadav, A.; Rahman, M.U.; Yuan, W.Z.; Li, Z.; Wang, X. Integrated biorefinery approach to valorize winery waste: A review from waste to energy perspectives. Sci. Total Environ. 2020, 719, 137315. [Google Scholar] [CrossRef] [PubMed]
  17. Marchi, M.; Neri, E.; Pulselli, F.M.; Bastianoni, S. CO2 recovery from wine production: Possible implications on the carbon balance at territorial level. J. Co2 Util. 2018, 28, 137–144. [Google Scholar] [CrossRef]
  18. WHO. Development of WHO Guidelines for Indoor Air Quality; WHO: Copenhagen, Denmark, 2006. [Google Scholar]
  19. Chamseddine, A.; Alameddine, I.; Hatzopoulou, M.; El-Fadel, M. Seasonal variation of air quality in hospitals with indoor–outdoor correlations. Build. Env. 2019, 148, 689–700. [Google Scholar] [CrossRef] [Green Version]
  20. Kalimeri, K.K.; Bartzis, J.G.; Sakellaris, I.A.; Fernandes de Oliveira, E. Investigation of the PM2.5, NO2 and O3 I/O ratios for office and school microenvironments. Environ. Res. 2019, 179, 108791. [Google Scholar] [CrossRef]
  21. Mandin, C.; Trantallidi, M.; Cattaneo, A.; Canha, N.; Mihucz, V.G.; Szigeti, T.; Mabilia, R.; Perreca, E.; Spinazzè, A.; Fossati, S.; et al. Assessment of indoor air quality in office buildings across Europe–The OFFICAIR study. Sci. Total Env. 2017, 579, 169–178. [Google Scholar] [CrossRef] [Green Version]
  22. Tolis, E.I.; Panaras, G.; Bartzis, J.G. A comprehensive air quality investigation at an aquatic centre: Indoor/outdoor comparisons. Env. Sci. Pollut. Res. 2018, 25, 16710–16719. [Google Scholar] [CrossRef]
  23. Stamatelopoulou, A.; Asimakopoulosa, D.N.; Maggos, T. Effects of PM, TVOCs and comfort parameters on indoor air quality of residences with young children. Build. Env. 2019, 150, 233–244. [Google Scholar] [CrossRef]
  24. Banhazi, T.M.; Aland, A.; Hartung, J. Air Quality and Livestock Farming; Taylor & Francis Group: London, UK, 2018. [Google Scholar]
  25. Švajlenka, J.; Kozlovská, M.; Pošiváková, T. Biomonitoring the indoor environment of agricultural buildings. Ann. Agric. Environ. Med. 2018, 25, 292–295. [Google Scholar]
  26. TEE. Technical Directive of the Technical Chamber of Greece (TEE) 20701-1: Analytical Technical Specifications of Parameters for the Calculation of buildings’ Energy Performance and The Issuing of Energy Performance Certificate; TEE: Athens, Greece, 2017. [Google Scholar]
  27. TEE. Technical Directive of the Technical Chamber of Greece (TEE) 20701-3: Climatic Data for Greek Areas; TEE: Athens, Greece, 2010. [Google Scholar]
  28. EU. Directive 2010/31/Eu of the European Parliament and of The Council of 19 May 2010 on The Energy Performance of Buildings; EU: Brussels, Belgium, 2010. [Google Scholar]
  29. CEN. En Iso 13790-2008 Energy Performance of Buildings—Calculation of Energy Use for Space Heating and Cooling; European Committee for Standardisation: Brussels, Belgium, 2008. [Google Scholar]
  30. Greek Government. Safety and Health in Labor. Code of Practice for Air quality in Indoor Places; Greek Government: Athens, Greece, 2014.
  31. Bartzis, J.; Wolkoff, P.; Stranger, M.; Efthimiou, G.; Tolis, E.I.; Maes, F.; Nørgaard, A.W.; Ventura, G.; Kalimeri, K.K.; Goelen, E.; et al. On organic emissions testing from indoor consumer products’ use. J. Hazard. Mater. 2015, 285, 37–45. [Google Scholar] [CrossRef] [PubMed]
  32. Spangenberg, J.E.; Vogiatzaki, M.; Zufferey, V. Gas chromatography and isotope ratio mass spectrometry of PinotNoir wine volatile compounds (δ13C) and solid residues (δ13C, δ15N) for the reassessment of vineyard water-status. J. Chromatogr. A 2017, 1517, 142–155. [Google Scholar] [CrossRef] [PubMed]
  33. Englezos, V.; Rantsiou, K.; Cravero, F.; Torchio, F.; Pollon, M.; Fracassetti, D.; Ortiz-Julien, A.; Gerbi, V.; Rolle, L.; Cocolin, L. Volatile profile of white wines fermented with sequential inoculation of Starmerella bacillaris and Saccharomyces cerevisiae. Food Chem. 2018, 257, 350–360. [Google Scholar] [CrossRef] [PubMed]
  34. Liu, B.Y.H.; Jordan, R.C. Daily Insolation on Surfaces Titled Toward and Equator. Ashrae Trans. 1962, 67, 526–541. [Google Scholar]
Figure 1. Layout of the examined winery.
Applsci 11 00593 g001
Figure 2. Layout of the installation, including measuring instrumentation position.
Applsci 11 00593 g002
Figure 3. CO2 concentration in office over a specific period of measurements.
Applsci 11 00593 g003
Figure 4. CO2 concentration in vinification area over a specific period of measurements.
Applsci 11 00593 g004
Figure 5. Energy consumption prediction and actual values (monthly basis).
Applsci 11 00593 g005
Figure 6. (a) Energy consumption share of main processes (monthly basis). (b) Energy consumption.
Applsci 11 00593 g006
Figure 7. Monthly solar PV fraction.
Applsci 11 00593 g007
Table 1. Measuring instrumentation characteristics and position.
Measuring Quantity/Instrument TypePosition (Instrument) IndicationMeasuring Characteristics
T-RH-CCO2/Telaire 7001, Hobo ONSET U12-012 1Office (1)Accuracy: ±0.5 °C (T) 2, ±5% (RH) 2, ±5% or ±50 ppm (CCO2)
Range: −20–70 °C (T), 5–95% (RH), 0–2500 ppm (CCO2) 3
T-RH-CCO2/Telaire 7001, Hobo ONSET U12-012Vin (2)Accuracy: ±0.5 °C (T) 2, ±5% (RH) 2, ±5% or ±50 ppm (CCO2)
Range: −20–70 °C (T), 5–95% (RH), 0–2500 ppm (CCO2) 3
AEROQUAL(NO2)Vin (3), Out (5)-
air sampling (SKC) and chromatography (VOC)Vin (4), Out (6)-
T-RH/Hobo ONSET H08-003-02Out (7)Accuracy: ±0.5 °C (T) 2, ±5% (RH) 2
Range: −20–70 °C (T), 25–95% (RH)
T-RH-CCO2/Telaire 7001, Hobo ONSET U12-012Vin (8)Accuracy: ±0.5 °C (T) 2, ±5% (RH) 2, ±5% or ±50 ppm (CCO2)
Range: −20–70 °C (T), 5–95% (RH), 0–2500 ppm (CCO2) 3
T-RH-CCO2/Telaire 7001, Hobo ONSET U12-012Stor1 (9)Accuracy: ±0.5 °C (T) 2, ±5% (RH) 2, ±5% or ±50 ppm (CCO2)
Range: −20–70 °C (T), 5–95% (RH), 0–2500 ppm (CCO2) 3
T-RH-CCO2/Telaire 7001, Hobo ONSET U12-012Stor2 (10)Accuracy: ±0.5 °C (T) 2, ±5% (RH) 2, ±5% or ±50 ppm (CCO2)
Range: −20–70 °C (T), 5–95% (RH), 0–2500 ppm (CCO2) 3
T-RH-CCO2/Hobo ONSET MX1102Vin (11)Accuracy: ±0.21 °C (T) 2, ±2% (RH) 2, ±5% or ±50 ppm (CCO2)
Range:0–50 °C (T), 1–95% (RH), 0–5000 ppm (CCO2)
T-RH-CCO2/Telaire 7001, Hobo ONSET U12-012Vin (12)Accuracy: ±0.5 °C (T) 2, ±5% (RH) 2, ±5% or ±50 ppm (CCO2)
Range: −20–70 °C (T), 5–95% (RH), 0–2500 ppm (CCO2) 3
1 The Telaire 7001 instrument was connected to HOBO ONSET U12-012 in order to measure and record CO2 concentration. 2 Aging effects have been considered. 3 The Hobo ONSET upper limit is indicated (Telaire upper limit: 10,000 ppm).
Table 2. Technical characteristics of winery’s equipment.
Device CategoryEquipment Type (Number)ParameterSource
CoolingAir-to-liquid Cooling unit (1)Pc = 46.8 kW, EER = 2.7, Ta (varying; Aug to Dec)Manufacturer data/literature, Inspection/measurement
FridgeAir-to-air Cooling Unit (1)Pc = 10.5 kW, EER = 2.2, t (depending on the production; Jan to April)Manufacturer data, Literature, Inspection/measurement
Heating/Cooling of storage spaces and bottling roomAir-to-air Heat pump (3)SCOP = 3.72/SEER = 3.78, Pth = 22,000 Btu/h, Um = 0.54 W/m2K, Ta (varying; all year), Tb = 15 °CManufacturer data/literature, Manufacturer data, Inspection, Measurements, Inspection/measurement
Miscellaneous equipmentPersonal Computer (3) Lights (25) Radio (1) Refrigerator (1)Pel = 0.3 kW, t = 8 h/d, Pel = 0.05 kW, t = 4 h/d, Pel = 0.015 kW, t = 6 h/d, Pel = 0.09 kW, t = 8 h/d (mid Aug to Jul)Manufacturer data, inspection
LabellingElectrical devicePel = 0.9 kW, t = 8 h/d (May to Sep)Manufacturer data, inspection
Table 3. Meteorological and environmental parameters at the installation site and at the office throughout fermentation period (September 10th–October 20th) and after fermentation (7 November–31 December).
ParameterDuring FermentationAfter Fermentation
IndoorAmbientIndoorAmbient
MeanMin–MaxMeanMin–MaxMeanMin–MaxMeanMin–Max
T (°C)21.417.9–24.617.89.6–27.919.512.2–21.98.2−2.8–18.4
RH (%)59.540.5–70.765.220.2–10060.745.4–70.874.335.8–100.0
CO2 (ppm)1414.84355.9–2500--1040.9315–2500--
Table 4. Environmental parameters at the main vinification area.
During FermentationAfter Fermentation
MeanMin–MaxMeanMin–Max
T (°C)18.314.6–22.014.511.4–16.1
RH (%)70.840.6–10071.054.2–99.4
CO2 (ppm)1966.9239–5000562.7325.0–1155.0
Table 5. Meteorological and environmental parameters at the installation site and at the storage rooms (1 January to 7 March).
ParameterStorage Room 2Ambient
MeanMin–MaxMeanMin–Max
T (°C)17.010.2–20.83.6−7.3–17.4
RH (%)73.156.5–89.767.928.9–100.0
CO2 (ppm)740.5305.0–1586.0--
Table 6. NO2 concentration indoors and outdoors during a typical day.
NO2 Indoor Concentration (mg/m3)NO2 Outdoor Concentration (mg/m3)
Average0.0730.127
Max0.1090.213
Min0.0270.054
Table 7. VOC concentrations (in μg/m3) for the different winery rooms and period.
CompoundsWinemaking (3/10/2019)Non-Winemaking (13/12/2018)
OfficeVinification AreaStorageOutOfficeVinification AreaStorageOut
Benzene0.461.760.810.4627.5116.2312.493.89
Toluene0.771.203.280.5232.4221.9313.203.37
OctaneNDNDND0.081.071.140.790.25
Ethylbenzene0.190.100.960.062.161.140.600.21
p,m-xylene0.520.333.240.206.673.922.160.55
o-xylene0.240.161.730.093.572.111.150.32
a-pinene1.130.476.85ND5.401.229.490.03
1,2,4-trimethylbenzene0.220.140.820.101.811.570.470.18
d-limonene0.220.062.88ND273.767.387.320.38
Naphthalene0.060.040.060.010.470.220.120.12
Hexane0.250.520.470.2014.1915.416.316.94
TrichloroehyleneNDNDNDNDNDNDND0.15
TetrachloroethyleneNDNDND0.01NDNDND0.07
Styrene0.100.050.690.020.940.440.800.25
b-pineneNDNDNDND0.37NDNDND
3-carene0.460.333.360.049.991.9810.980.41
1,3,5-trimethylbenzene0.090.070.430.043.531.850.540.21
Publisher’s Note: MDPI stays neutral with regard to jurisdictional claims in published maps and institutional affiliations.

