1. Introduction
According to the PBL Netherlands Environmental Assessment Agency report [
1], Portland cement clinker production is one of the key drivers of global CO
2 emissions. Production of Ordinary Portland Cement (OPC), which consists of more than 95% Portland cement clinker, exceeded a level of 4 billion metric tons in 2019 and is expected to increase by 25% over in the next 10 years [
2,
3]. Since the production of 1 ton of OPC generates nearly 900 kg of CO
2 [
4], the global trend is to reduce the amount of OPC in concrete mixes by using binary cements, as well as partially replacing it with supplementary cementitious materials (SCMs) such as Ground Granulated Blast Furnace Slag (GGBFS), Siliceous Fly Ash (SFA) and Silica Fume (SF) [
5,
6,
7]. Slag cement CEM III/B (as per EN 197-1) is characterized by an embodied CO
2 value of 232–359 kg CO
2e/t, which is more than two times lower than OPC. For GGBFS and fly ash, these values are significantly lower: 79.6 kg CO
2e/t and 0.1 kg CO
2e/t, respectively [
4]. The environmental impact of OPC production is an issue that cannot be ignored, especially in the design process of High-Performance Concretes (HPC), which are not only characterized by high compressive strength (from 50–60 MPa to 100–120 MPa at 28 days) as a result of low water/binder ratio, but also by the high modulus of elasticity, high density and enhanced durability in comparison to normal strength concretes [
8].
Based on the literature review, it can be stated that the above-mentioned criteria can be met using binary cements with a high GGBFS amount (e.g., CEM III/B). Thanks to the latent hydraulic properties of GGBFS, its activation in the presence of cement clinker occurs at an appropriate concentration of Ca
2+, OH
−, SO
42− ions and alkali in the solution. As reported by Pal et al. [
9], GGBFS C-S-H hydrates add density to the cement paste, as they are more gel-like than the OPC hydration products. The incorporation of GGBFS in normal, high-strength and ultra-high-strength concretes results in the improvement in the pore structure and durability properties of the composite, such as increased electrical resistivity and reduced chloride penetration, as stated by many researchers [
10,
11,
12,
13,
14]. As reported by Shi [
15] and Zhang [
16], in HPC design, particular attention should be paid to the qualitative and quantitative selection of SCMs due to the high sensitivity of durability to changes in mineral additives content and water/binder ratio. The use of GGBFS in low emission HPCs can also be potentially beneficial in terms of an effective reduction of the water/binder ratio. As reported in the review article of Matthes et al. [
5], CEM III/B with 72% content of GGBFS presented higher sensitivity to polycarboxylate-based superplasticizer dosage than OPC. These observations encouraged researchers to design low-clinker and high-GGBFS HPCs with the use of highly effective superplasticizers. However, the effectiveness of GGBFS to reduce superplasticizer demand is considered to decrease with an increase of GGBFS fineness and/or at low water/binder ratios (<0.30) [
5].
As reported by Teng et al. [
12], the use of Ultra-Fine GGBFS (UFGGBFS) improves the mechanical and durability properties of High Strength Concretes (HSC). The researchers observed that the 30% replacement of OPC with UFGGBFS made it possible to increase the HSC compressive strength at a very early age and achieve a higher modulus of elasticity after 28 days of curing compared to mixes with 100% OPC. Moreover, the effectiveness of UFGGBFS was greater for mixtures with a lower water/cementitious materials ratio. However, HPCs with a low water/binder ratio are especially prone to cracking due to the autogenous shrinkage under restrained conditions. This could be prevented by incorporating fibers into the cement matrix, i.e., polymer or steel fibers. The use of fibers significantly enhances the tensile strength and ductility of the cement-based materials and hence improves their durability [
17].
According to the research conducted by Giergiczny et al. [
18], low CO
2 emission High-Performance Concretes reaching a compressive strength of 100 MPa after 90 days of curing can be successfully designed using multicomponent Portland and slag cements. The non-air-entrained HPCs with a clinker content of 211–269 kg per 1 m
3 of concrete and addition of silica fume were considered to be frost-resistant after 28 days of curing with an average compressive strength loss not greater than 3.5% after 150 cycles of freezing and thawing (according to Polish procedure PN-B-06265). High resistance to water penetration under pressure was also observed for these low-clinker High-Performance Concretes. In the paper of Atis and Bilim [
19], high-strength concretes with a water/binder ratio equal to 0.30 and 20–40% replacement of OPC with GGBFS were characterized by a compressive strength above 80 MPa after 28 days of curing, exceeding the values obtained for a reference concrete mixture with 100% OPC as a binder. Lämmlein et al. [
20] stated that it was possible to obtain low-clinker self-compacting HPCs with OPC content of 134–204 kg in 1 m
3 of concrete mix by incorporating fly ash, limestone, silica fume, and metakaolin. The designed HPCs reached compressive strength ranging from 77 to 88 MPa after 28 days of curing. Research into the synergistic effect of GGBFS, FA and SF addition on the microstructure, as well as mechanical and durability properties, has already been conducted for normal strength concretes by Dave et al. [
21].
Based on the literature search, it can be stated that in the vast majority of studies, the properties of low-clinker concretes are evaluated for up to 90 days. The amount of research concerning longer periods of curing is limited. Therefore, further investigation needs to be done in this field, especially in the case of low-clinker HPC.
In this paper, the properties of High-Performance Concretes with low Portland cement clinker content were investigated. Slag cement (CEM III/B) was used as the main binder in the designed concrete mixtures. SCMs such as Ground Granulated Blast Furnace Slag (GGBFS), Siliceous Fly Ash (SFA) and Silica Fume (SF) were added in various proportions, maintaining a low water/binder ratio (0.30) in order to achieve high compressive strength in the composite. The concretes’ long-term mechanical performance was investigated on the basis of compressive strength and modulus of elasticity tests conducted 2 years after specimen preparation. Additionally, SEM microstructure analysis was performed on 2-year-old samples. Durability properties were assessed on the basis of freeze–thaw tests and water penetration under pressure tests, along with a hardened concrete pH value testing after 56 days of curing.
2. Materials and Methods
2.1. Materials
Slag cement CEM III/B 42.5 L–LH/SR/NA containing from 66 to 80% of ground granulated blast furnace slag (GGBFS) was used as a main binder in the HPC mix design. Additionally, SCMs such as Ground Granulated Blast Furnace Slag (GGBFS), Siliceous Fly Ash (SFA), and Silica Fume (SF) were used in ternary and quaternary binder systems. The physical and mechanical properties of cement are shown in
Table 1.
Table 2 presents the specific surface area and chemical composition of cement and supplementary cementitious materials.
Hydraulic reactivity of GGBFS was assessed by means of hydraulic modulus (CaO + MgO)/SiO2 and the total amount of CaO + MgO + SiO2 calculations as proposed in EN 15167-1. As the hydraulic modulus of the used GGBFS was equal to 1.39 and the total amount of CaO + MgO + SiO2 was greater than 67%, it can be stated that the material met the European standard requirements for use in concrete and was characterized by a satisfactory reactivity.
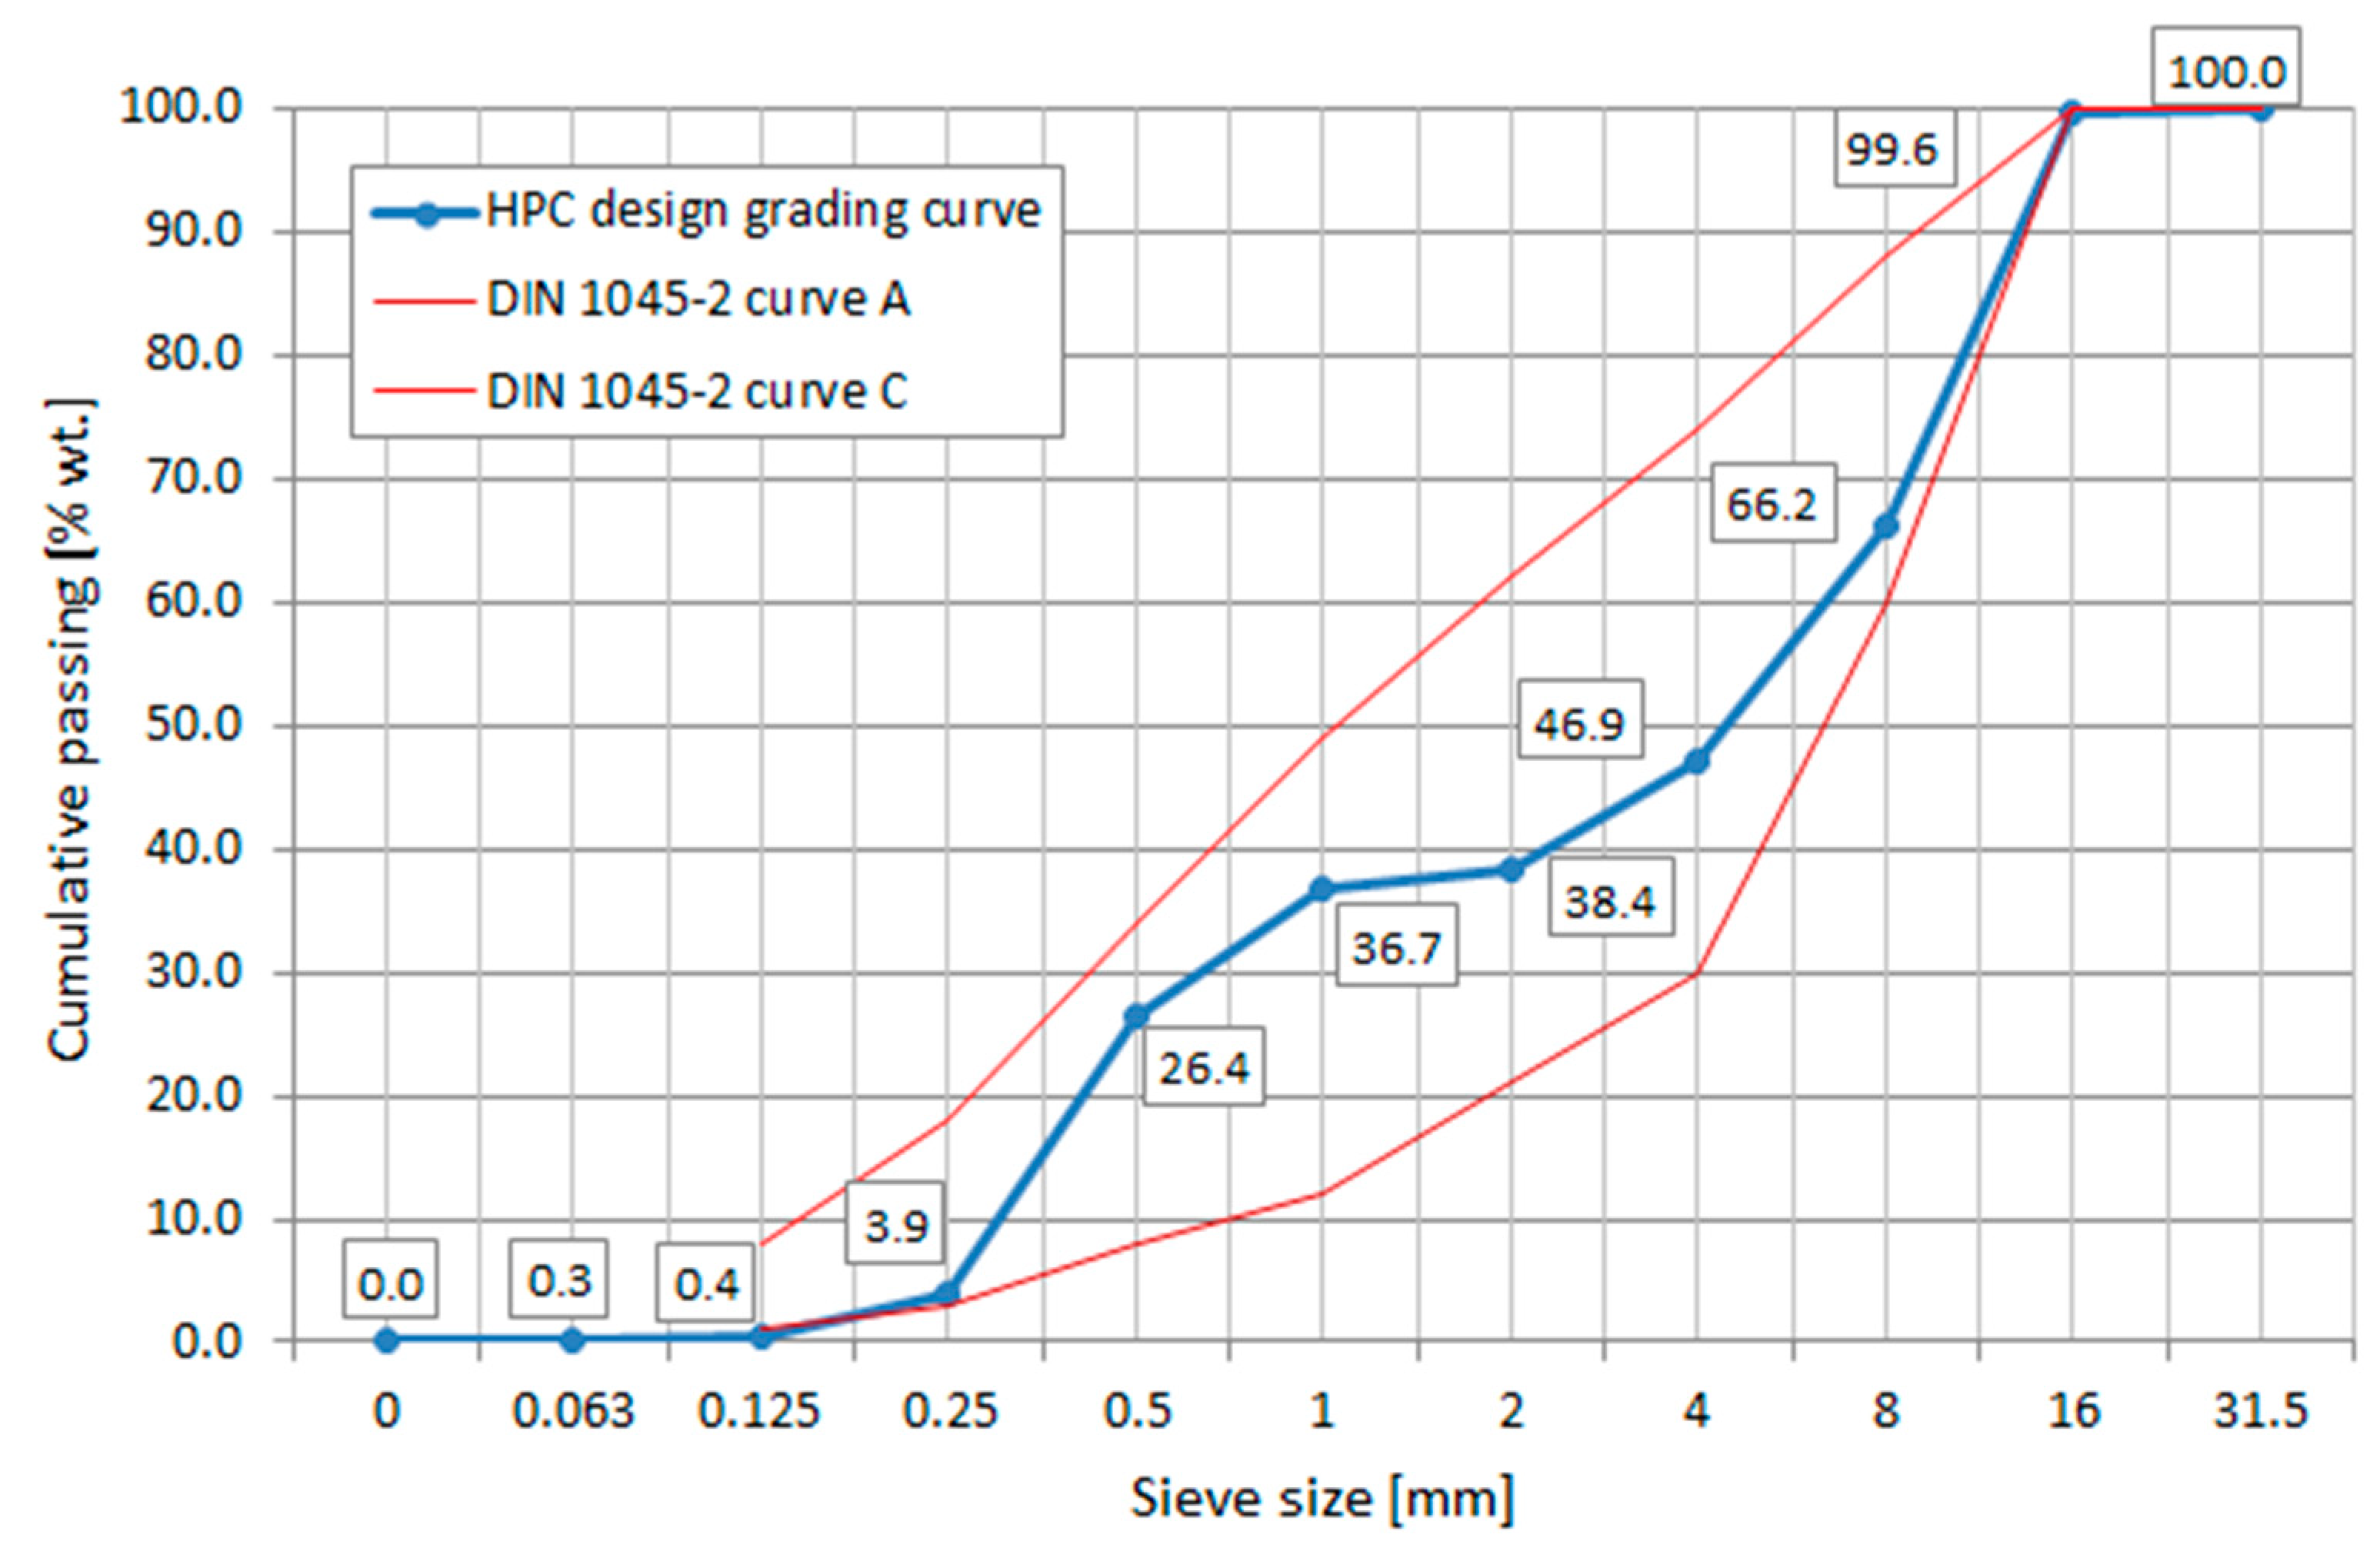
HPC grading curve (
Figure 1) was designed to match DIN 1045-2 standard requirements using river sand 0/2 mm (specific gravity of 2.63) (FA 0–2) and two fractions of coarse basalt aggregates, 2–8 mm (CA 2–8) and 8–16 mm (CA 8–16), with specific gravities of 3.05 and 3.04, respectively.
The main goal of the grading curve design process was to obtain minimum void content and the maximum packing density of the aggregate skeleton. To obtain a satisfactory degree of workability and maintain the low water/binder ratio of the concrete mix, highly effective polycarboxylate ether-based superplasticizers (SP) were used. No air-entraining admixtures were added.
2.2. Mixture Proportions and Specimen Preparation
Three High-Performance Concrete mixtures with a limited Portland cement clinker content were designed, as reported in
Table 3.
For C100_SFA15_SF3 and C100_SFA30_SF3 mixtures, ternary binder systems were applied (i.e., cement (C), fly ash (FA) in an amount of 15% or 30% cement mass and silica fume (SF) in an amount of 3% cement mass). In the case of the C55_SFA15_SF3 mixture, a quaternary binder system was designed by additionally replacing 45% of the cement (C) with GGBFS. Therefore, assuming 34% to be the maximum content of Portland cement clinker in the mass of CEM III/B 42,5 L–LH/SR/NA main components (as per EN 197-1), the maximum content of Portland cement clinker in the designed HPC mixes was estimated to be at levels of 26 wt% and 29 wt% of total cementitious materials for C100_FA15_SF and C100_SFA30_SF3, respectively. The maximum Portland cement clinker content in C55_SFA15_SF3 mixtures was stated to be equal to 16 wt% of total cementitious materials. The water/binder ratio was defined as a ratio of the mass of water to the total mass of cement and SCMs. Similar workability of all mixes was assumed, with a slump value range of 100–150 mm according to the PN-EN 12350-2 standard requirements of the S3 slump consistency class.
Cylindrical (d = 150 mm, h = 300 mm) and cubic (100 × 100 × 100 mm and 150 × 150 × 150 mm) specimens were prepared for testing the mechanical and durability properties of HPC according to EN 12390-2. All samples except the cylindrical specimens for the modulus of elasticity tests were cured in water at (20 ± 1) °C until the tests. Specimens for the modulus of elasticity tests were cured under the above-mentioned conditions for 90 days and then moved to the laboratory room (temperature = (22 ± 2) °C, relative humidity = 30–50%), where they were stored until testing.
2.3. Testing Methods
The consistency of fresh concrete mixes was evaluated by conducting slump tests in accordance with EN 12350-2.
The compressive strength of HPC was tested on 100 × 100 × 100 mm specimens after 2, 7, 14, 28, 56, and 90 days of curing following the EN 12390-3 standard. Compression tests were conducted on the three-sample series using a CONTROLS MC66 press. Specimens smaller than the standard 150 × 150 × 150 mm size were used due to the expected high concrete strengths and, consequently, high values of maximum force to be applied to samples.
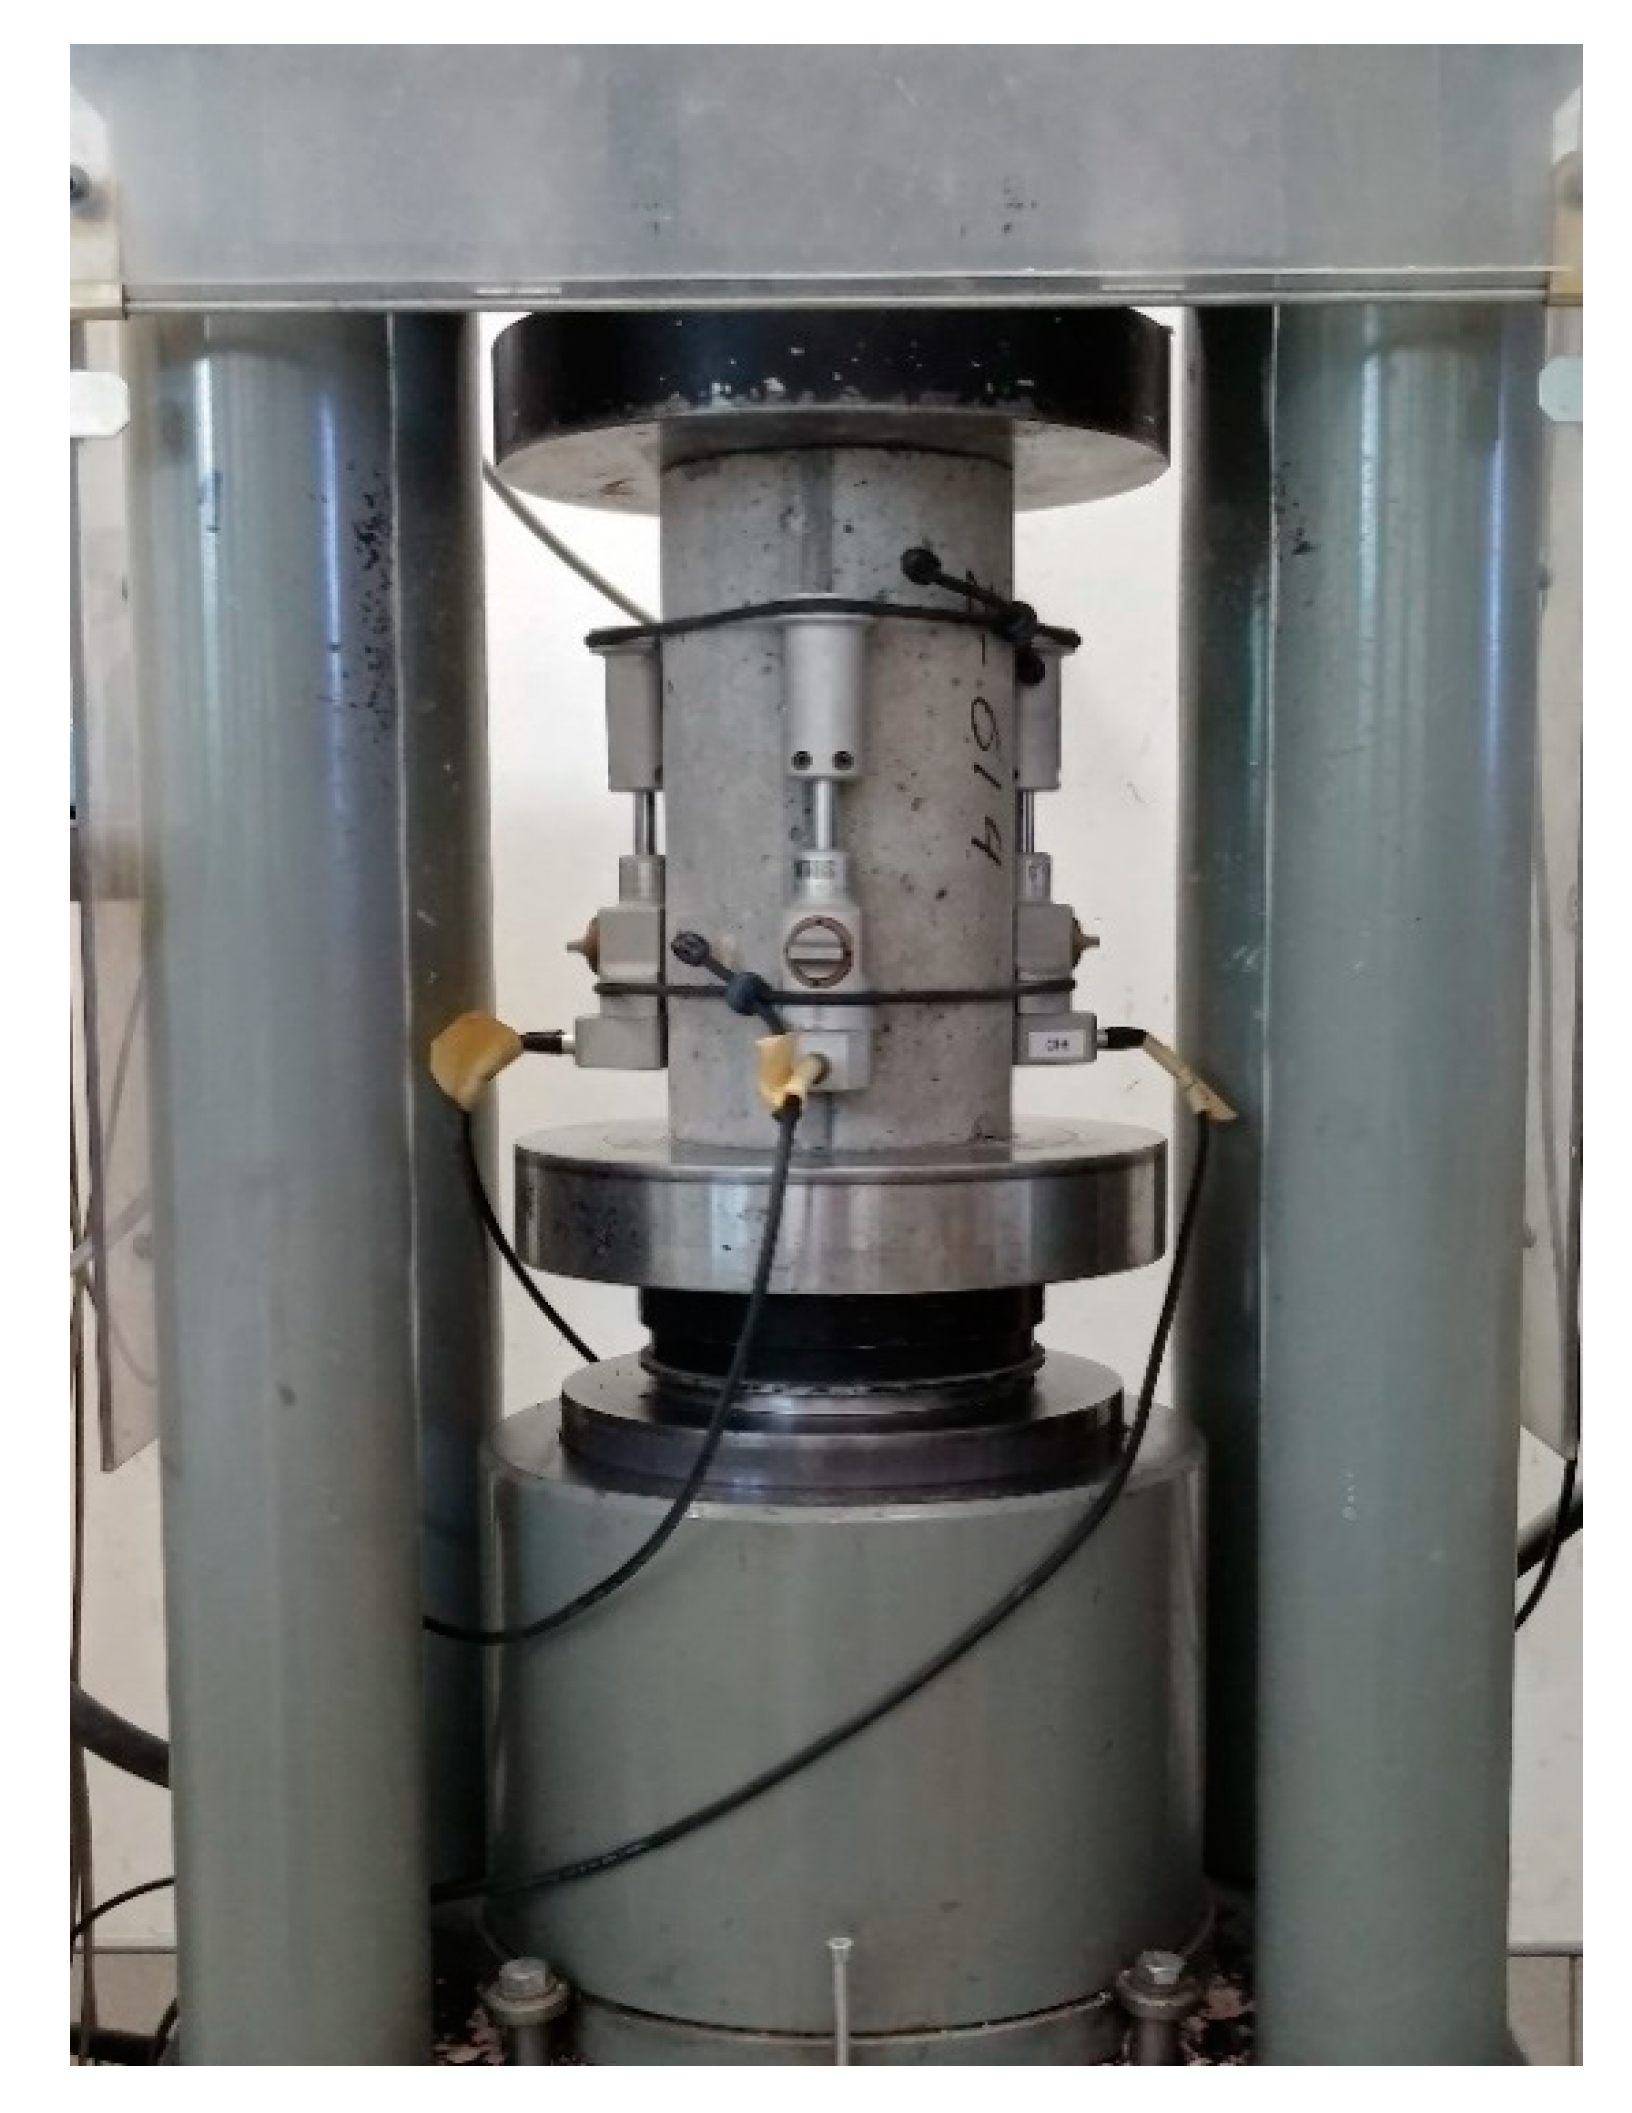
The modulus of elasticity was determined in compression tests on 2-year-old cylindrical specimens (d = 150 mm, h = 280 mm) according to the procedure described in EN 12390—13 Method A. Cylindrical specimens with a height of 300 mm were trimmed to 280 mm in order to obtain 2-cm-thick slice specimens for SEM/EDS testing. The compressed surface of samples was prepared by grinding. Three electronic compressometers (
Figure 2) with a gauge length of 150 mm and 0.02 μm sensitivity were used to measure longitudinal strains. Each test consisted of two preloading checks (wiring stability and specimen positioning check) and three loading cycles with a maximum loading equal to one-third of the estimated mix design compressive strength. The modulus of elasticity was calculated as the stabilized secant modulus of elasticity. Tests were performed on CONTROLS MC66 press on two-sample series. To estimate compressive strength, two cylindrical samples of each mix design were tested according to the EN 12390-3 procedure.
Freeze–thaw resistance tests were carried out following the procedure presented in the Polish standard PN-B-06265 after 56 days of curing. Two six-sample series of the 100 mm concrete cubes were subjected to cyclic freezing and thawing. After saturation in the water at (+18 ± 2) °C for 7 days, the first series of specimens was weighed, and then subjected to 150 cycles of freezing at (−18 ± 2) °C for 4 h and thawing at (+18 ± 2) °C for 2–4 h. The second series of six specimens was stored in water at a temperature of (+18 ± 2) °C during the entire period of freeze–thaw resistance testing. After the last freeze–thaw cycle, the specimens from series 1 were again weighed, and their compressive strength was tested and compared to the compressive strength of the reference specimens. The test results were average mass loss and average percentage reduction in sample compressive strength after freezing and thawing. Concrete is regarded as being resistant to frost if the average mass loss is less or equal to 5% and the reduction of compressive strength is no greater than 20%.
Depth of water penetration under pressure tests were conducted on two 150 mm cube samples after 56 days of curing according to EN 12390-8. After the application of water pressure to the specimen surface, the penetration depth was measured. A maximum water penetration depth of 30 mm was set as the limit value.
The Scanning Electron Microscope (SEM) with Electron Dispersion Spectroscopy (EDS) method was used to evaluate the concrete microstructure and phase composition. FEI Nova NanoSEM 200 microscope equipped with EDAX Octane Elect EDS was used. The observations were made in a low vacuum mode (80 Pa), operating at 15 kV voltage using a vCD detector. Cross-sectional slice samples obtained from the upper 2 cm of the cylindrical specimens for the modulus of elasticity tests were used in the analysis. Before the SEM/EDS tests, the samples’ surfaces were prepared by polishing using Struers Tegramin automatic polisher, and the samples were dried.
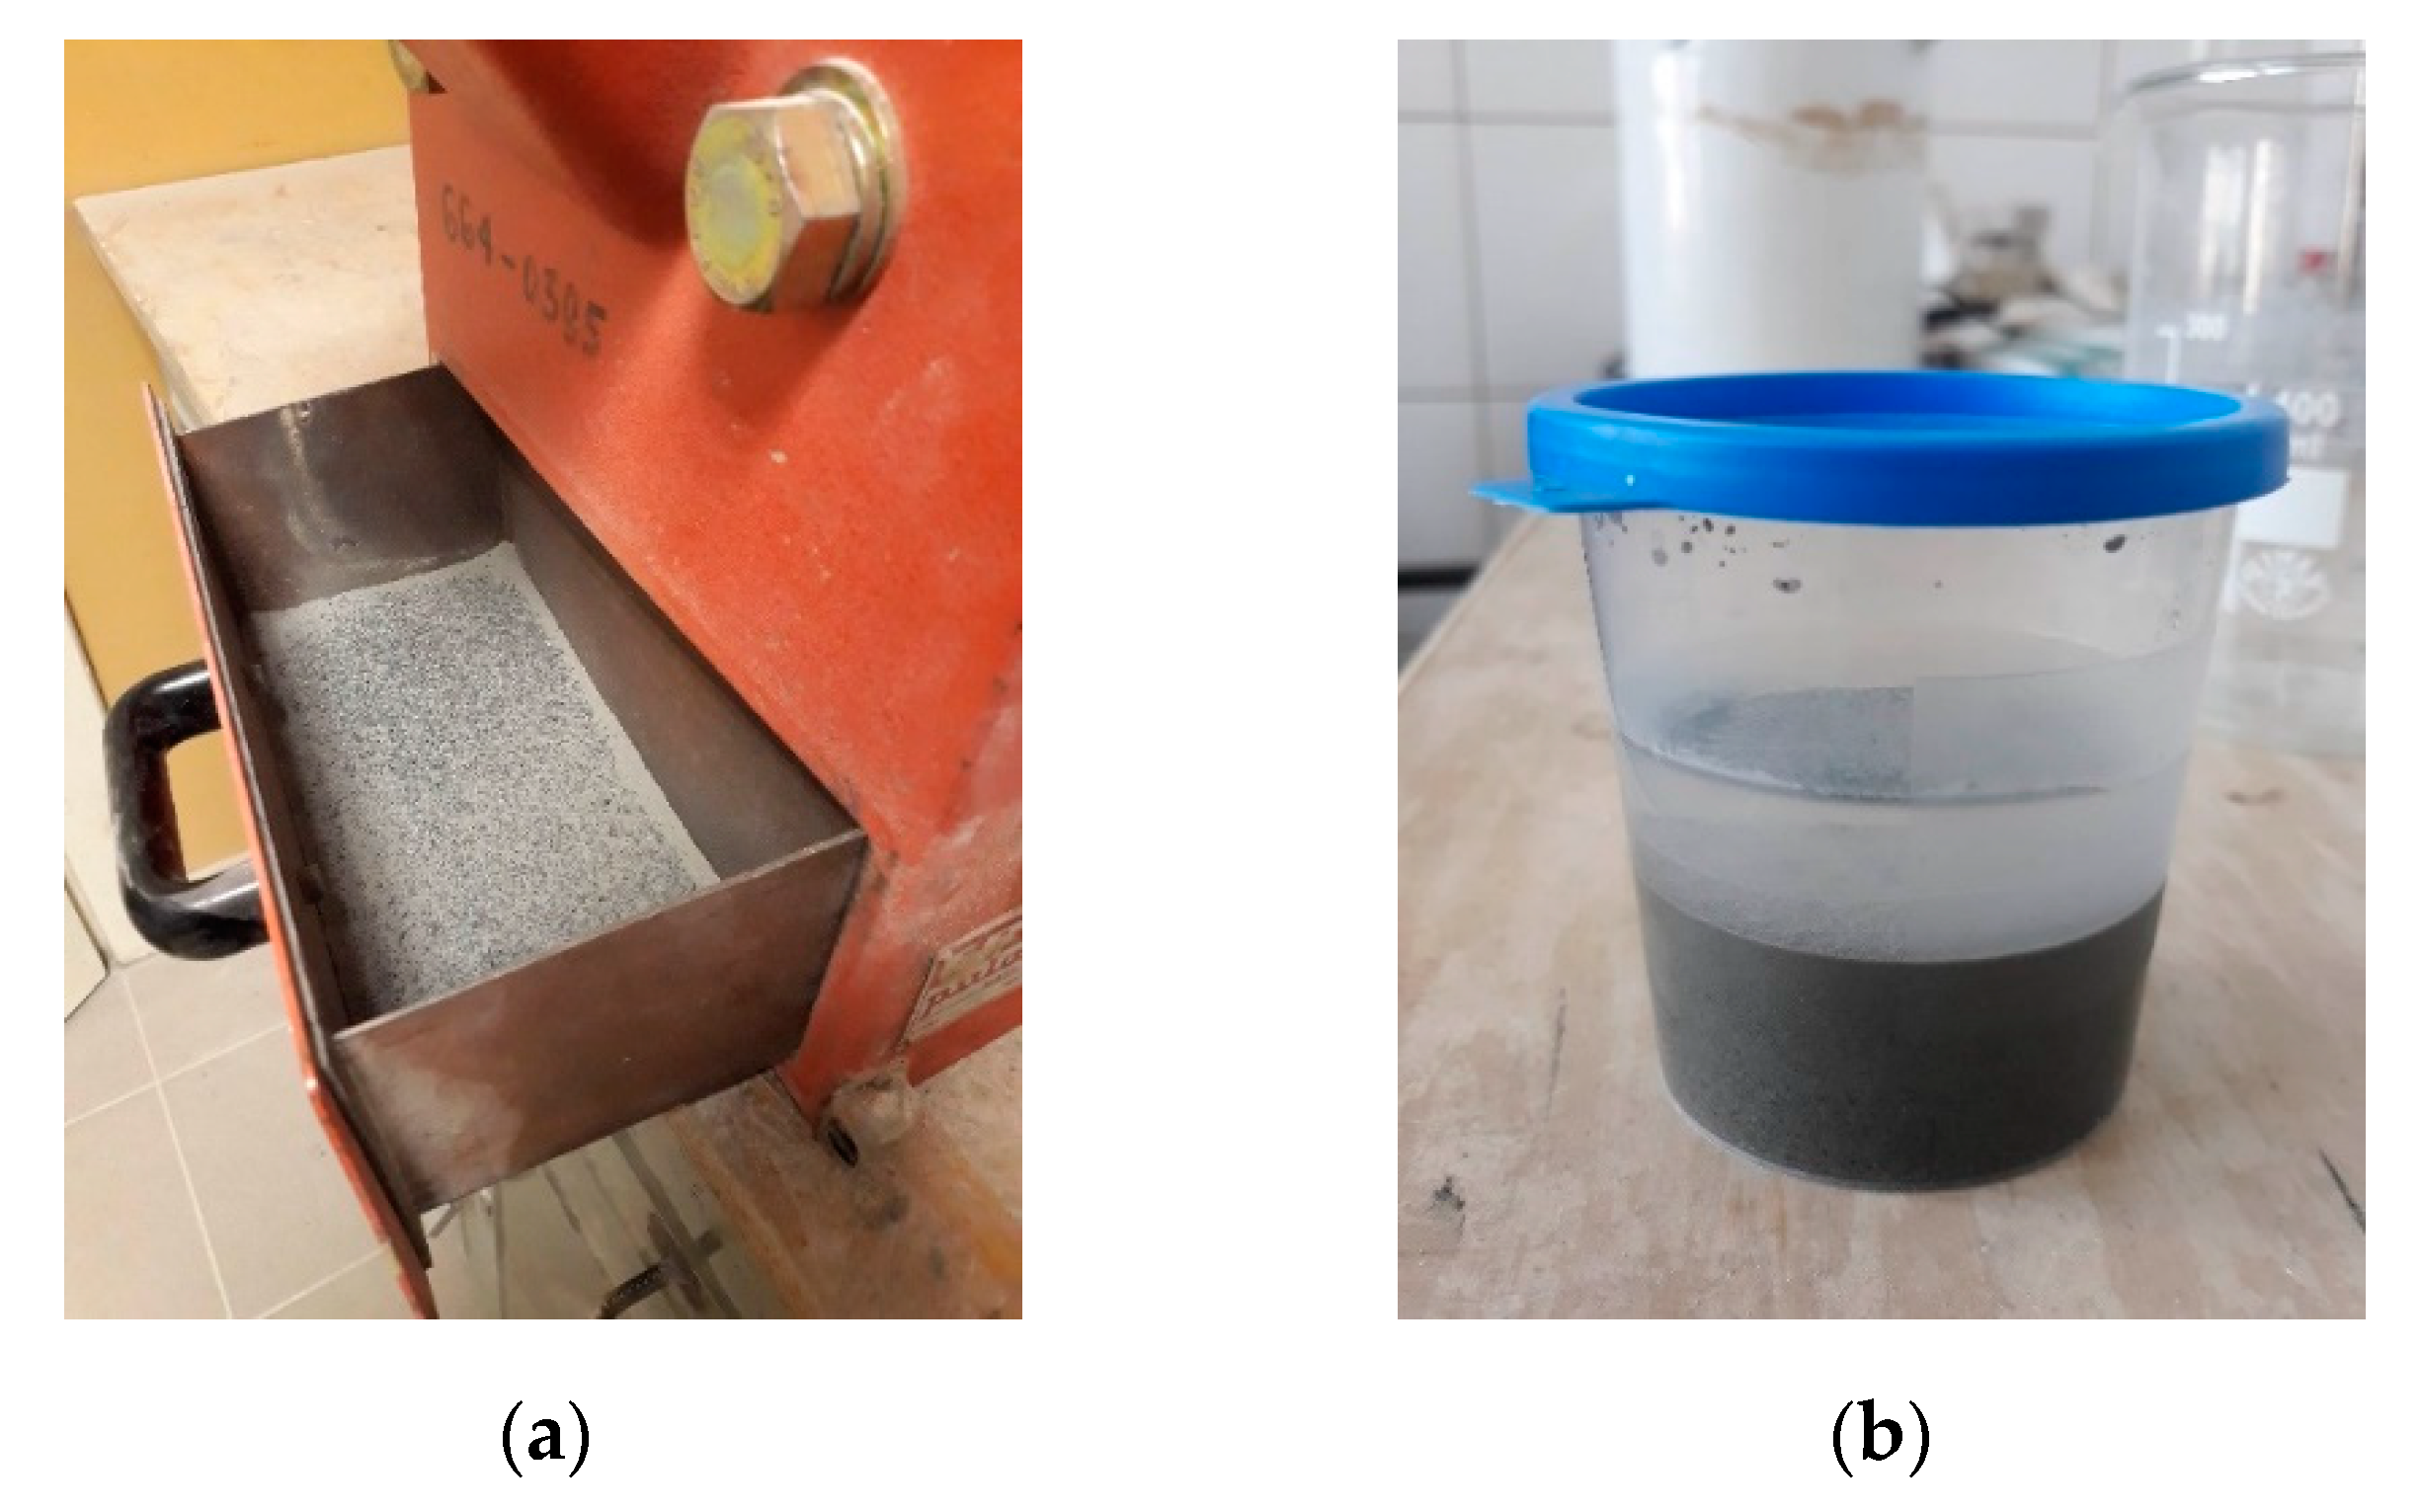
The pH values of hardened concrete were measured after 56 days of curing on two samples for each mix design. After grinding the specimens in a crusher, 1:1 solutions of finely crushed concrete combined with distilled water were prepared (
Figure 3) and subjected to pH value tests in the Metrohm 781 ph/Ion Meter device after 24 h of conditioning under laboratory conditions.
The chemical composition of cement and SCMs was determined by the X-Ray Fluorescence (XRF) method using a Bruker S4 EXPLORER spectrometer.
The specific surface area of cement was measured by the Blaine method according to the EN 196-6 procedure and, in the case of GGBFS, SFA and SF, using the BET method from the nitrogen adsorption at 78 K using ASAP 2020 Micromeritics apparatus.
3. Results and Discussion
3.1. Consistency of Fresh Concrete
All low-clinker HPC mixtures met the requirements of the S3 slump class, with slump values equal to 150 mm for C55_SFA15_SF3 mixture, 130 mm for C100_SFA15_SF3 mixture and 120 mm for C100_SFA30_SF3 mixture. It can be stated that the use of highly effective superplasticizers made it possible to obtain satisfactory workability of the mixtures while maintaining a low water/binder ratio. However, fresh concrete mixtures were characterized by high cohesiveness, which is considered typical for concretes containing a low amount of water and major amounts of GGBFS as well as silica fume addition [
22]. Comparing slump test results obtained for mixtures C55_SFA15_SF3 and C100_SFA15_SF3, it can be stated that a partial replacement of cement with GGBFS had a positive effect on the workability of the concrete mixture. One of the causes of this phenomenon could be the lower specific surface area and glassy surface texture of GGBFS particles, which results in lower water demand for the cementitious binder blend. In the case of the C100_SFA30_SF3 mixture with an increased share of siliceous fly ash, no significant deterioration of the concrete mixture workability was observed compared to the C100_SFA15_SF3 mixture.
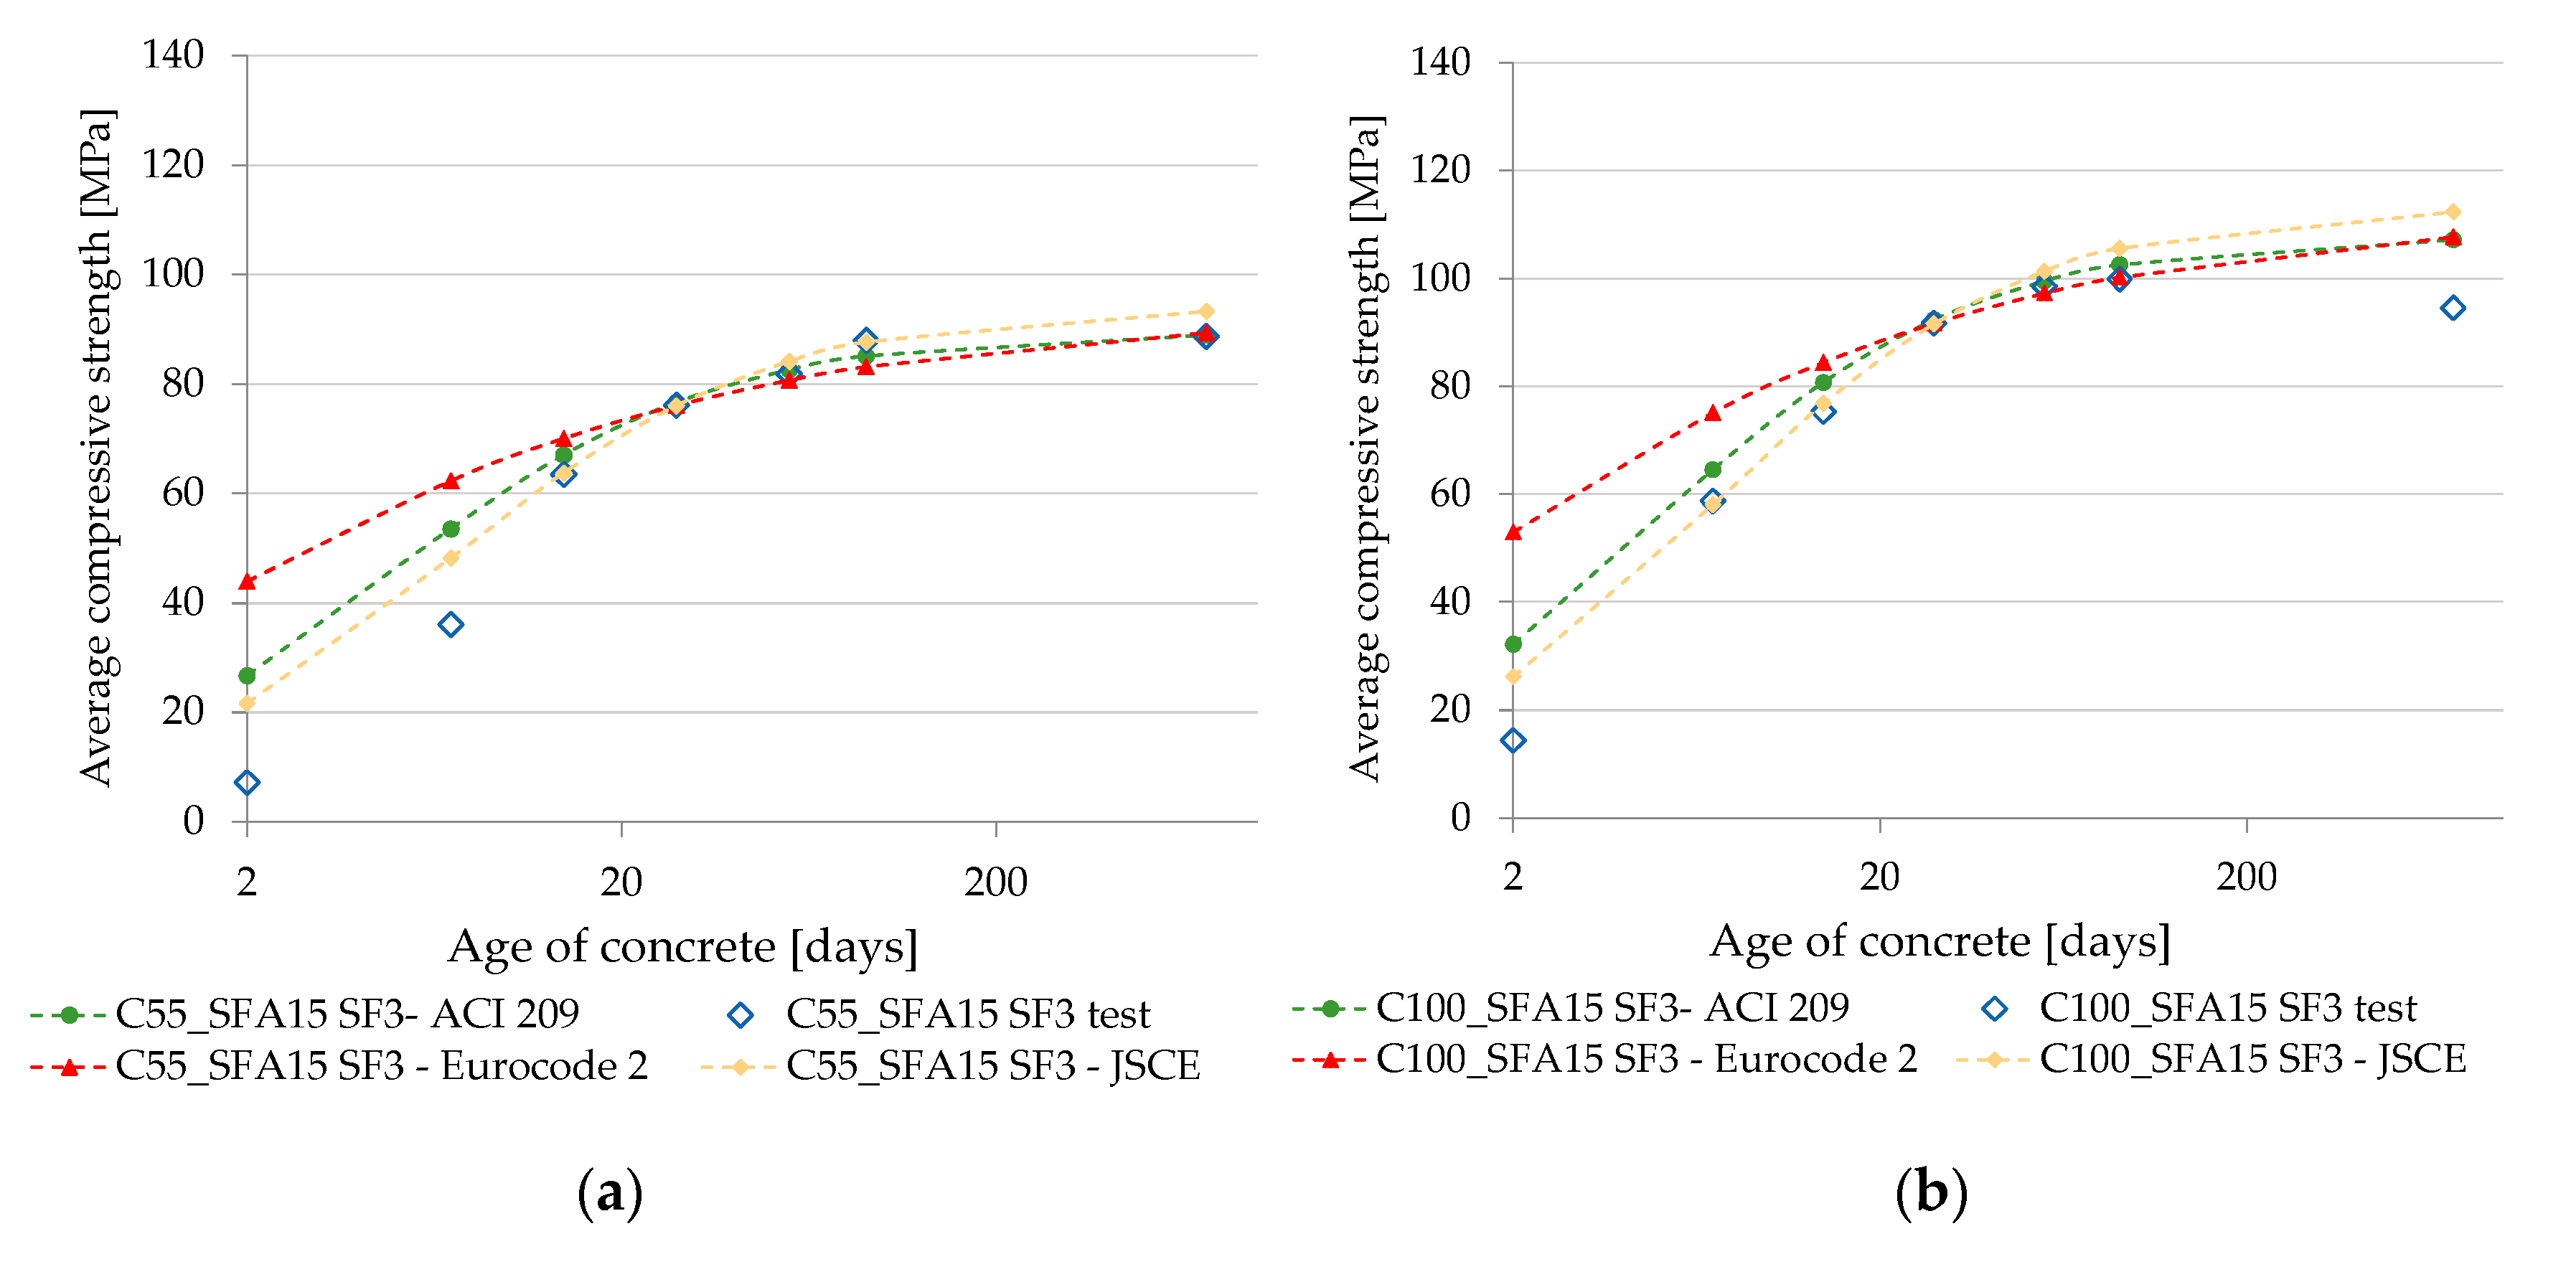
3.2. Compressive Strength
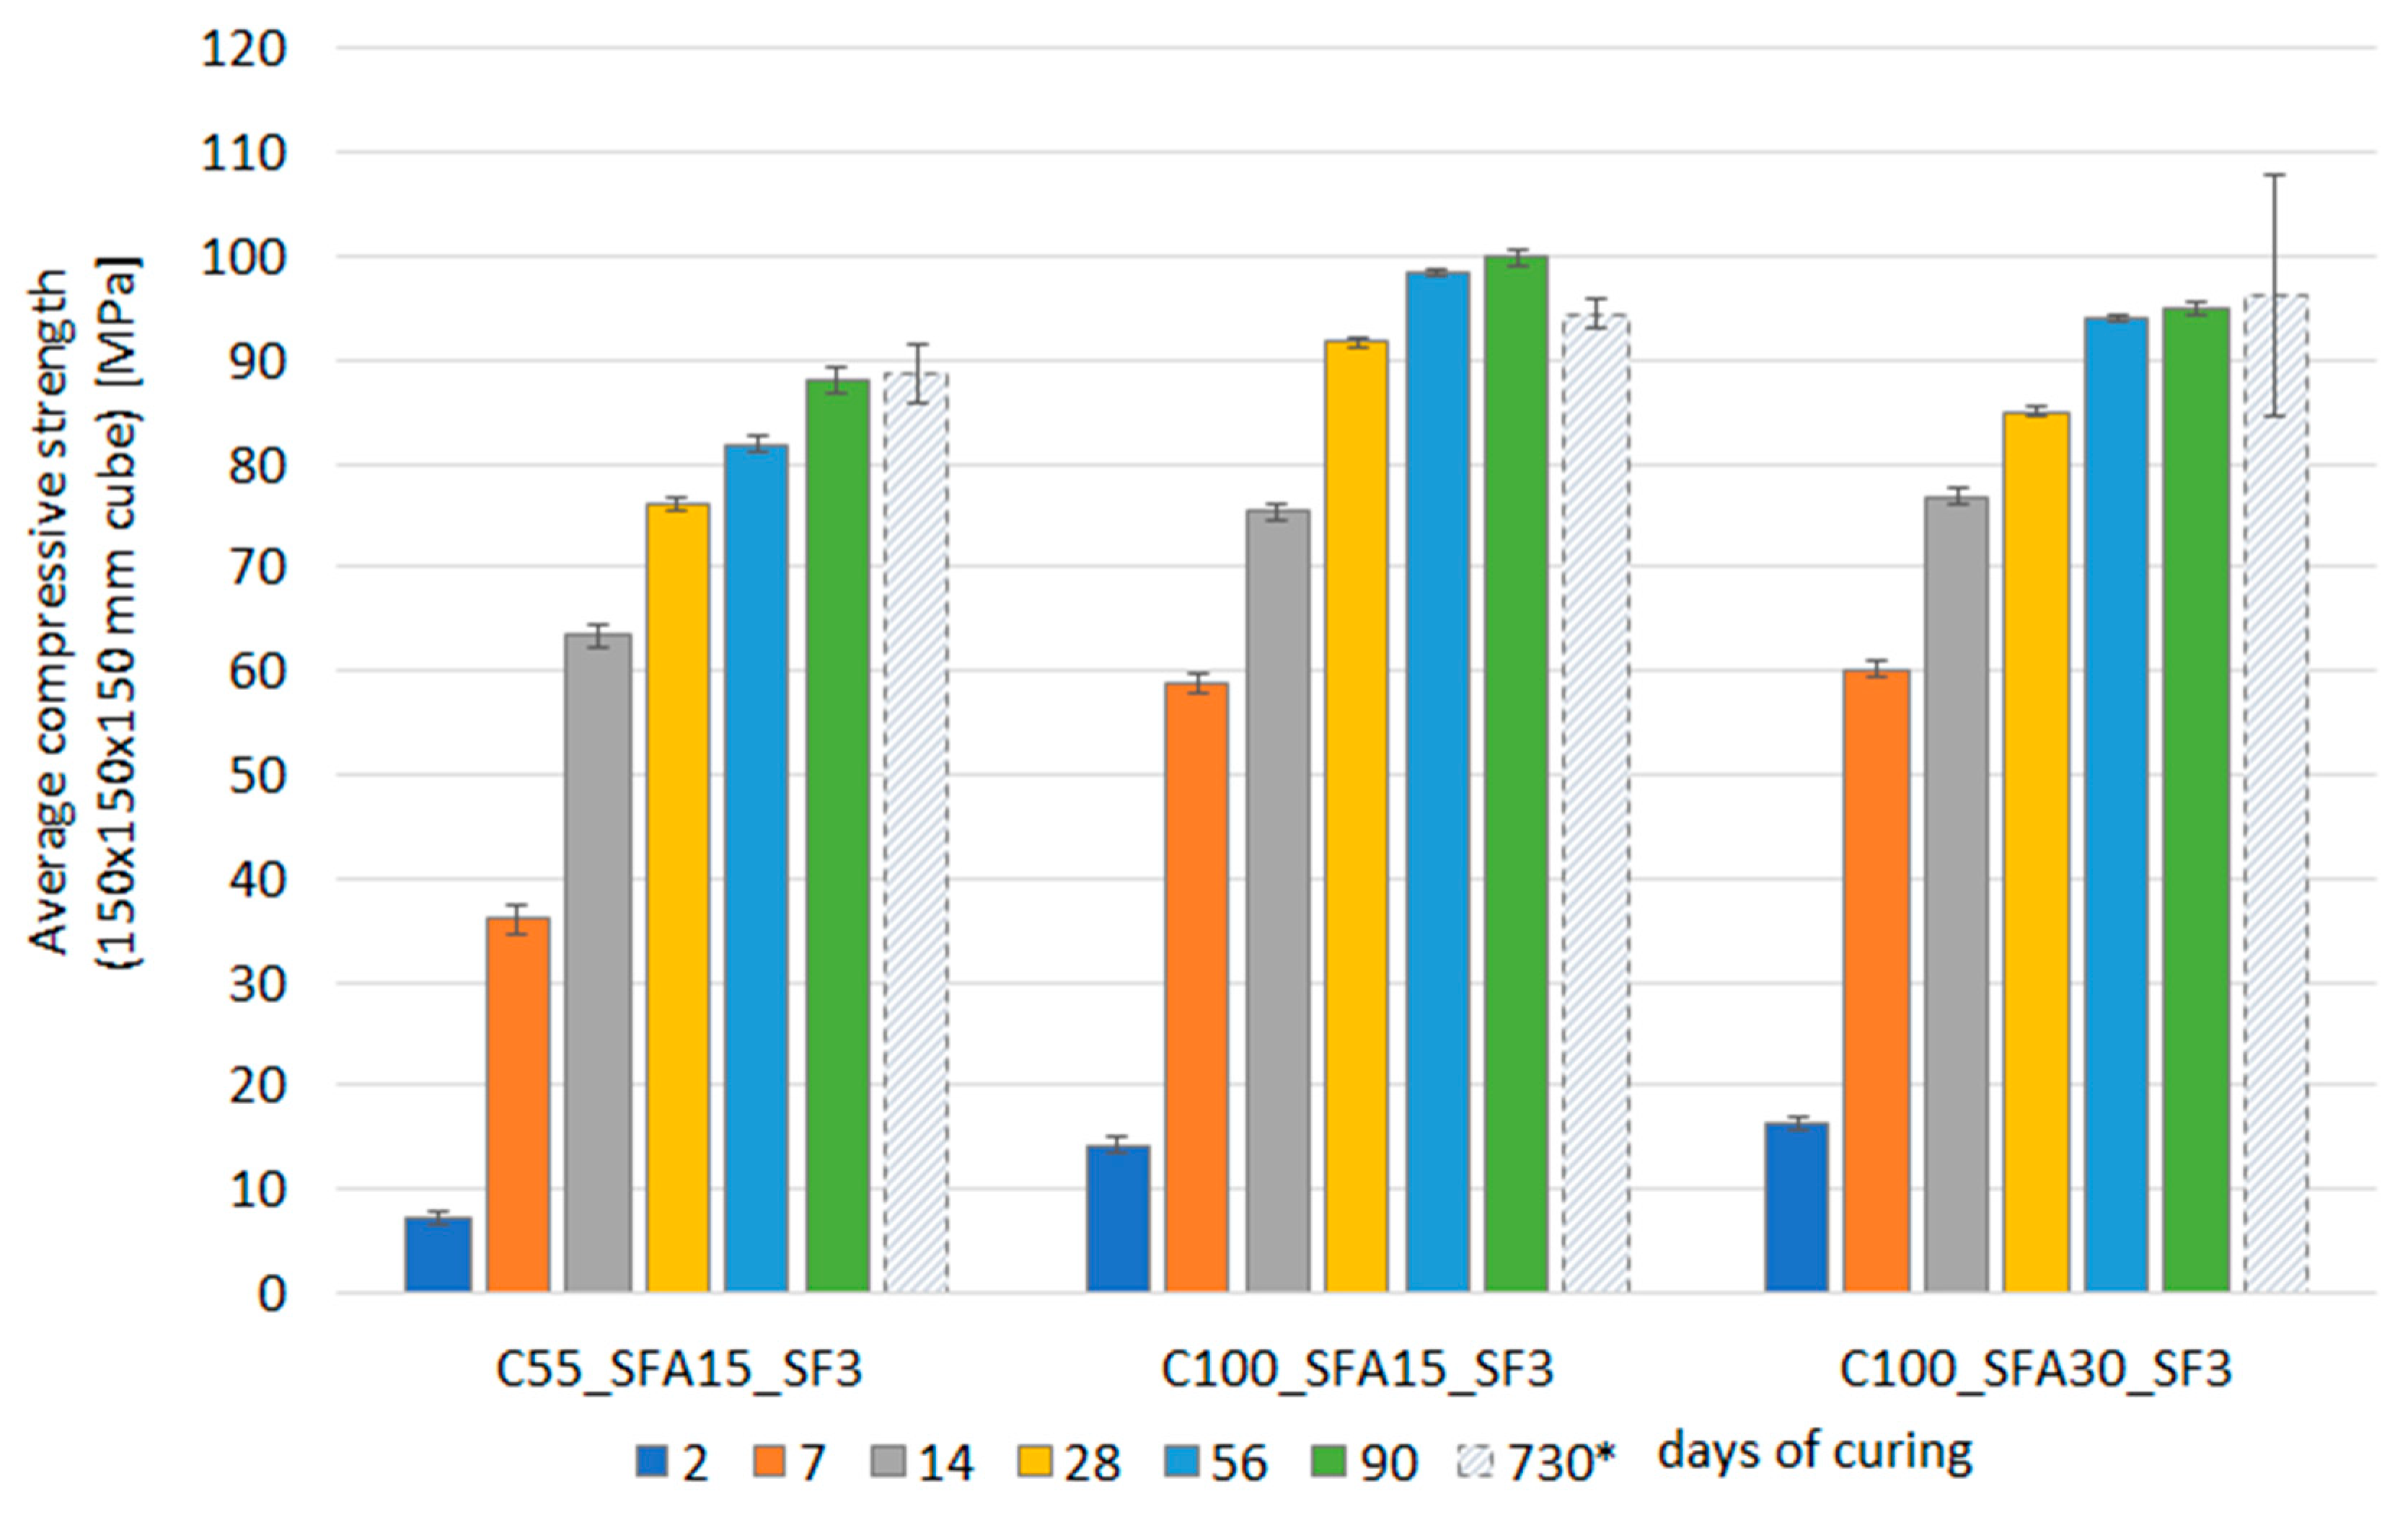
Figure 4 presents average compressive strength values of HPC after 2, 7, 14, 28, 56 and 90 days of curing (tested on 100 mm cube specimens), as well as 2 years (730 days) after specimen preparation (tested on 150 mm/300 mm cylinders). To unify the analysis process, the tested compressive strength values were converted into those corresponding to 150 mm cubic specimens using conversion factors for HPC: 0.99 and 0.86 for 100 mm cubic and cylindrical specimens, respectively [
23].
Due to the possible lower accuracy of the cylinder-cube strength value conversion and dispersion of the results obtained on cylindrical specimens, it can be concluded that the compressive strength of low-clinker HPC mixtures increased continuously over time. Additionally, it can be stated that within the period of 90 days to 730 days after specimen preparation, a less significant increase in concrete strength was observed (0.8–1.4%) than within the 28–90 days curing period (9–16%). This could be caused by a change in the storage conditions of cylindrical specimens. Comparing compressive strength values of C100_SFA15_SF3 mixture and a corresponding mixture C55_SFA15_SF3 with a 45% replacement of cement by GGBFS, it can be seen that the compressive strength of HPC decreased with an increase of GGBFS content. The biggest differences between these two mixtures were found in the case of early strength, with 50% and 39% lower strength values at 2 and 7 days of curing being obtained for the C55_SFA15_SF3 mixture. After 28 days of curing, the compressive strength of the designed low-clinker HPC varied between 76.1 and 91.7 MPa. It should be highlighted that for the C100_SFA30_SF3 mixture, the increase in the FA content in comparison to C100_SFA15_SF3 mixture did not lead to an increase in the compressive strength.
All concretes were characterized by relatively low early strength (7.2–16.3 MPa after 2 days of curing). According to the EN 206 standard, the rate of compressive strength development of the designed HPC at 20 °C was assessed by calculating the ratio of the average compressive strength after 2 days of curing (
fcm,2) to the average compressive strength after 28 days of curing (
fcm,28). The calculation results are presented in
Table 4.
Based on the calculations, the rate of compressive strength development for HPC mixtures containing 100% CEM III/B as the main binder was described as slow, whereas the C55_SFA15_SF3 mixture with a reduced amount of Portland cement clinker was characterized by a very slow increase in compressive strength. The evaluation of the long-term compressive strength development rate was done by comparing the values of compressive strength on the 28th and 90th days of concrete curing. The following values of the fcm,28/fcm,90 ratio were obtained: 0.87 for the C55_SFA15_SF3 mixture, 0.89 for the C100_SFA15_SF3 mixture and 0.92 for the C100_SFA30_SF3 mixture. It can be stated that the compressive strength development rates were similar, unlike in the case of the fcm,2/fcm,28 ratio. The average increase in the compressive strength between the 28th and 90th days of curing was equal to 12%, while the highest value of 16% was obtained for the C55_SFA15_SF3 mixture.
The obtained compressive strength values have been compared with time-dependent concrete strength development models proposed in:
and Eurocode 2 (EN 1992-1-1), MC 2010 [
26,
27]:
where
fc(
t) is the compressive strength of concrete at an age of
t days in MPa,
fc28 is the compressive strength of concrete at an age of 28 days, and
are coefficients, the values of which depend on cement type and strength class.
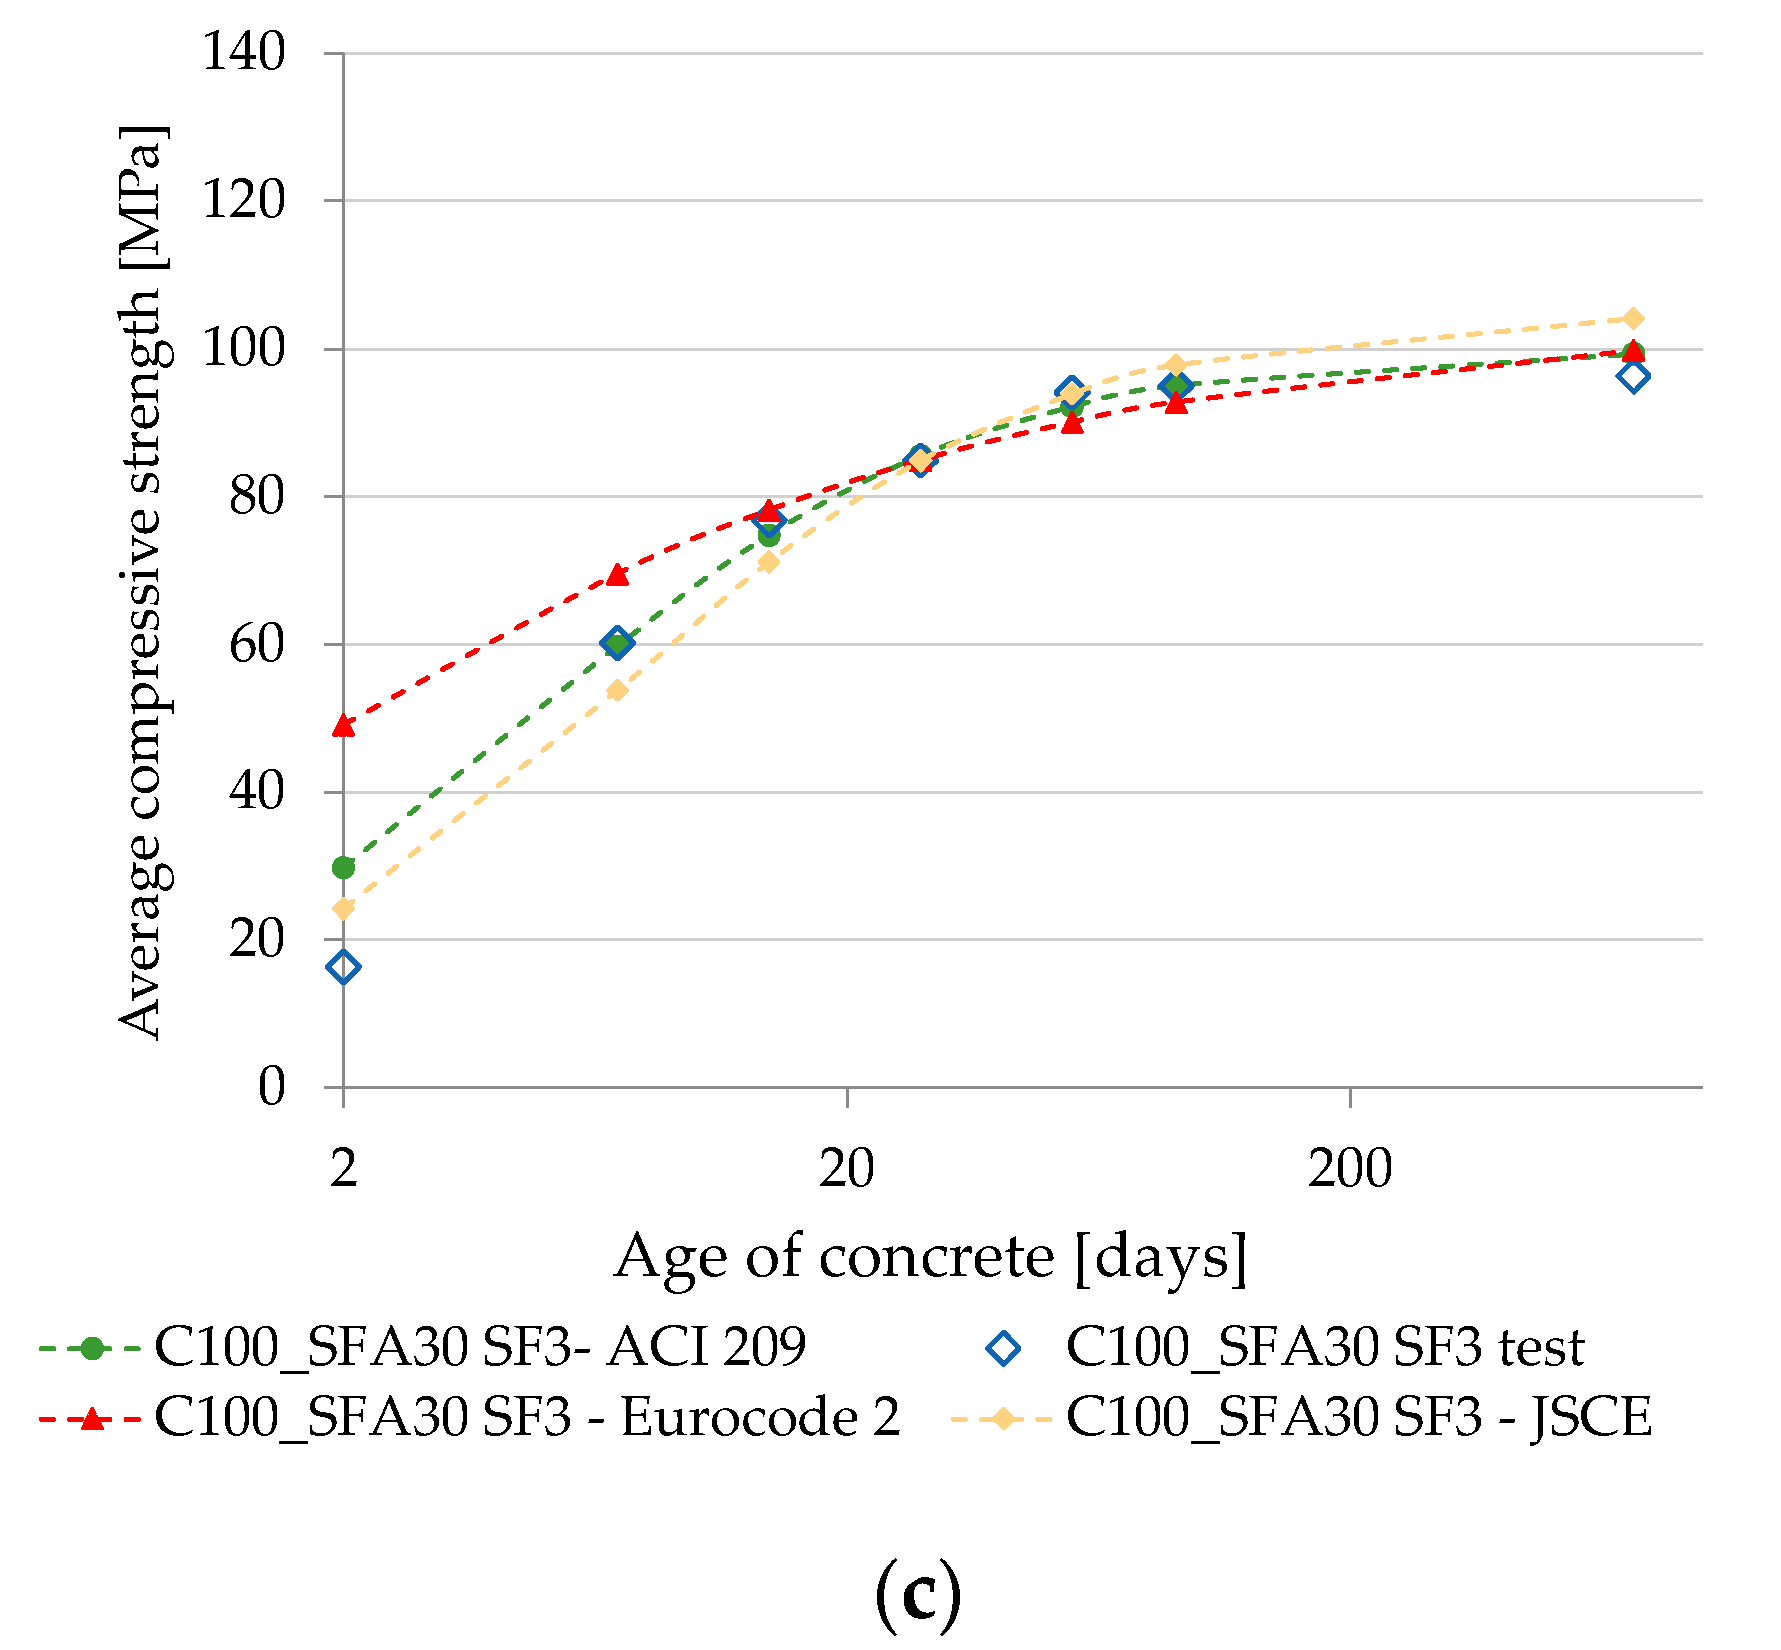
As the above-mentioned models were created to predict compressive strength development of concretes containing mainly OPC, the strength development of the designed HPC was predicted using coefficients suggested by Klemczak et al. [
28] and Mierzwa [
29] for concretes containing GGBFS, as reported in
Table 5. A comparison of the test results with the models is presented in
Figure 5 and
Table 6.
Analyzing the results obtained in an early curing period, it can be stated that the predicted 2-day compressive strength values were vastly greater than the experimental values for each of the time-dependent models. The most significant overestimation of early compressive strength was observed for the Eurocode 2 and MC 2010 standards. Significant differences between early strength test results and values predicted using this model were also observed for High-Strength Concretes with slag cement CEM III/A 32.5 N in the article of Mierzwa [
29]. Starting from the 7th day of curing for the C100_SFA15_SF3 and C100_SFA30_SF3 mixtures and the 14th day for the C55_SFA15_SF3 mixture, a gradual decrease in the difference between the tested and calculated values was observed. This observation confirms the conclusion presented in
Table 4 regarding the slow and very slow compressive strength development of HPCs with a low Portland cement clinker content. Based on the predicted strength values after 28 days of curing, it can be confirmed that HPC containing slag and mineral additives can achieve compressive strength comparable to concretes with OPC in the long curing period. However, the commonly used time-dependent strength development models do not describe the rate of low-clinker HPC strength gain sufficiently, especially in an early curing period.
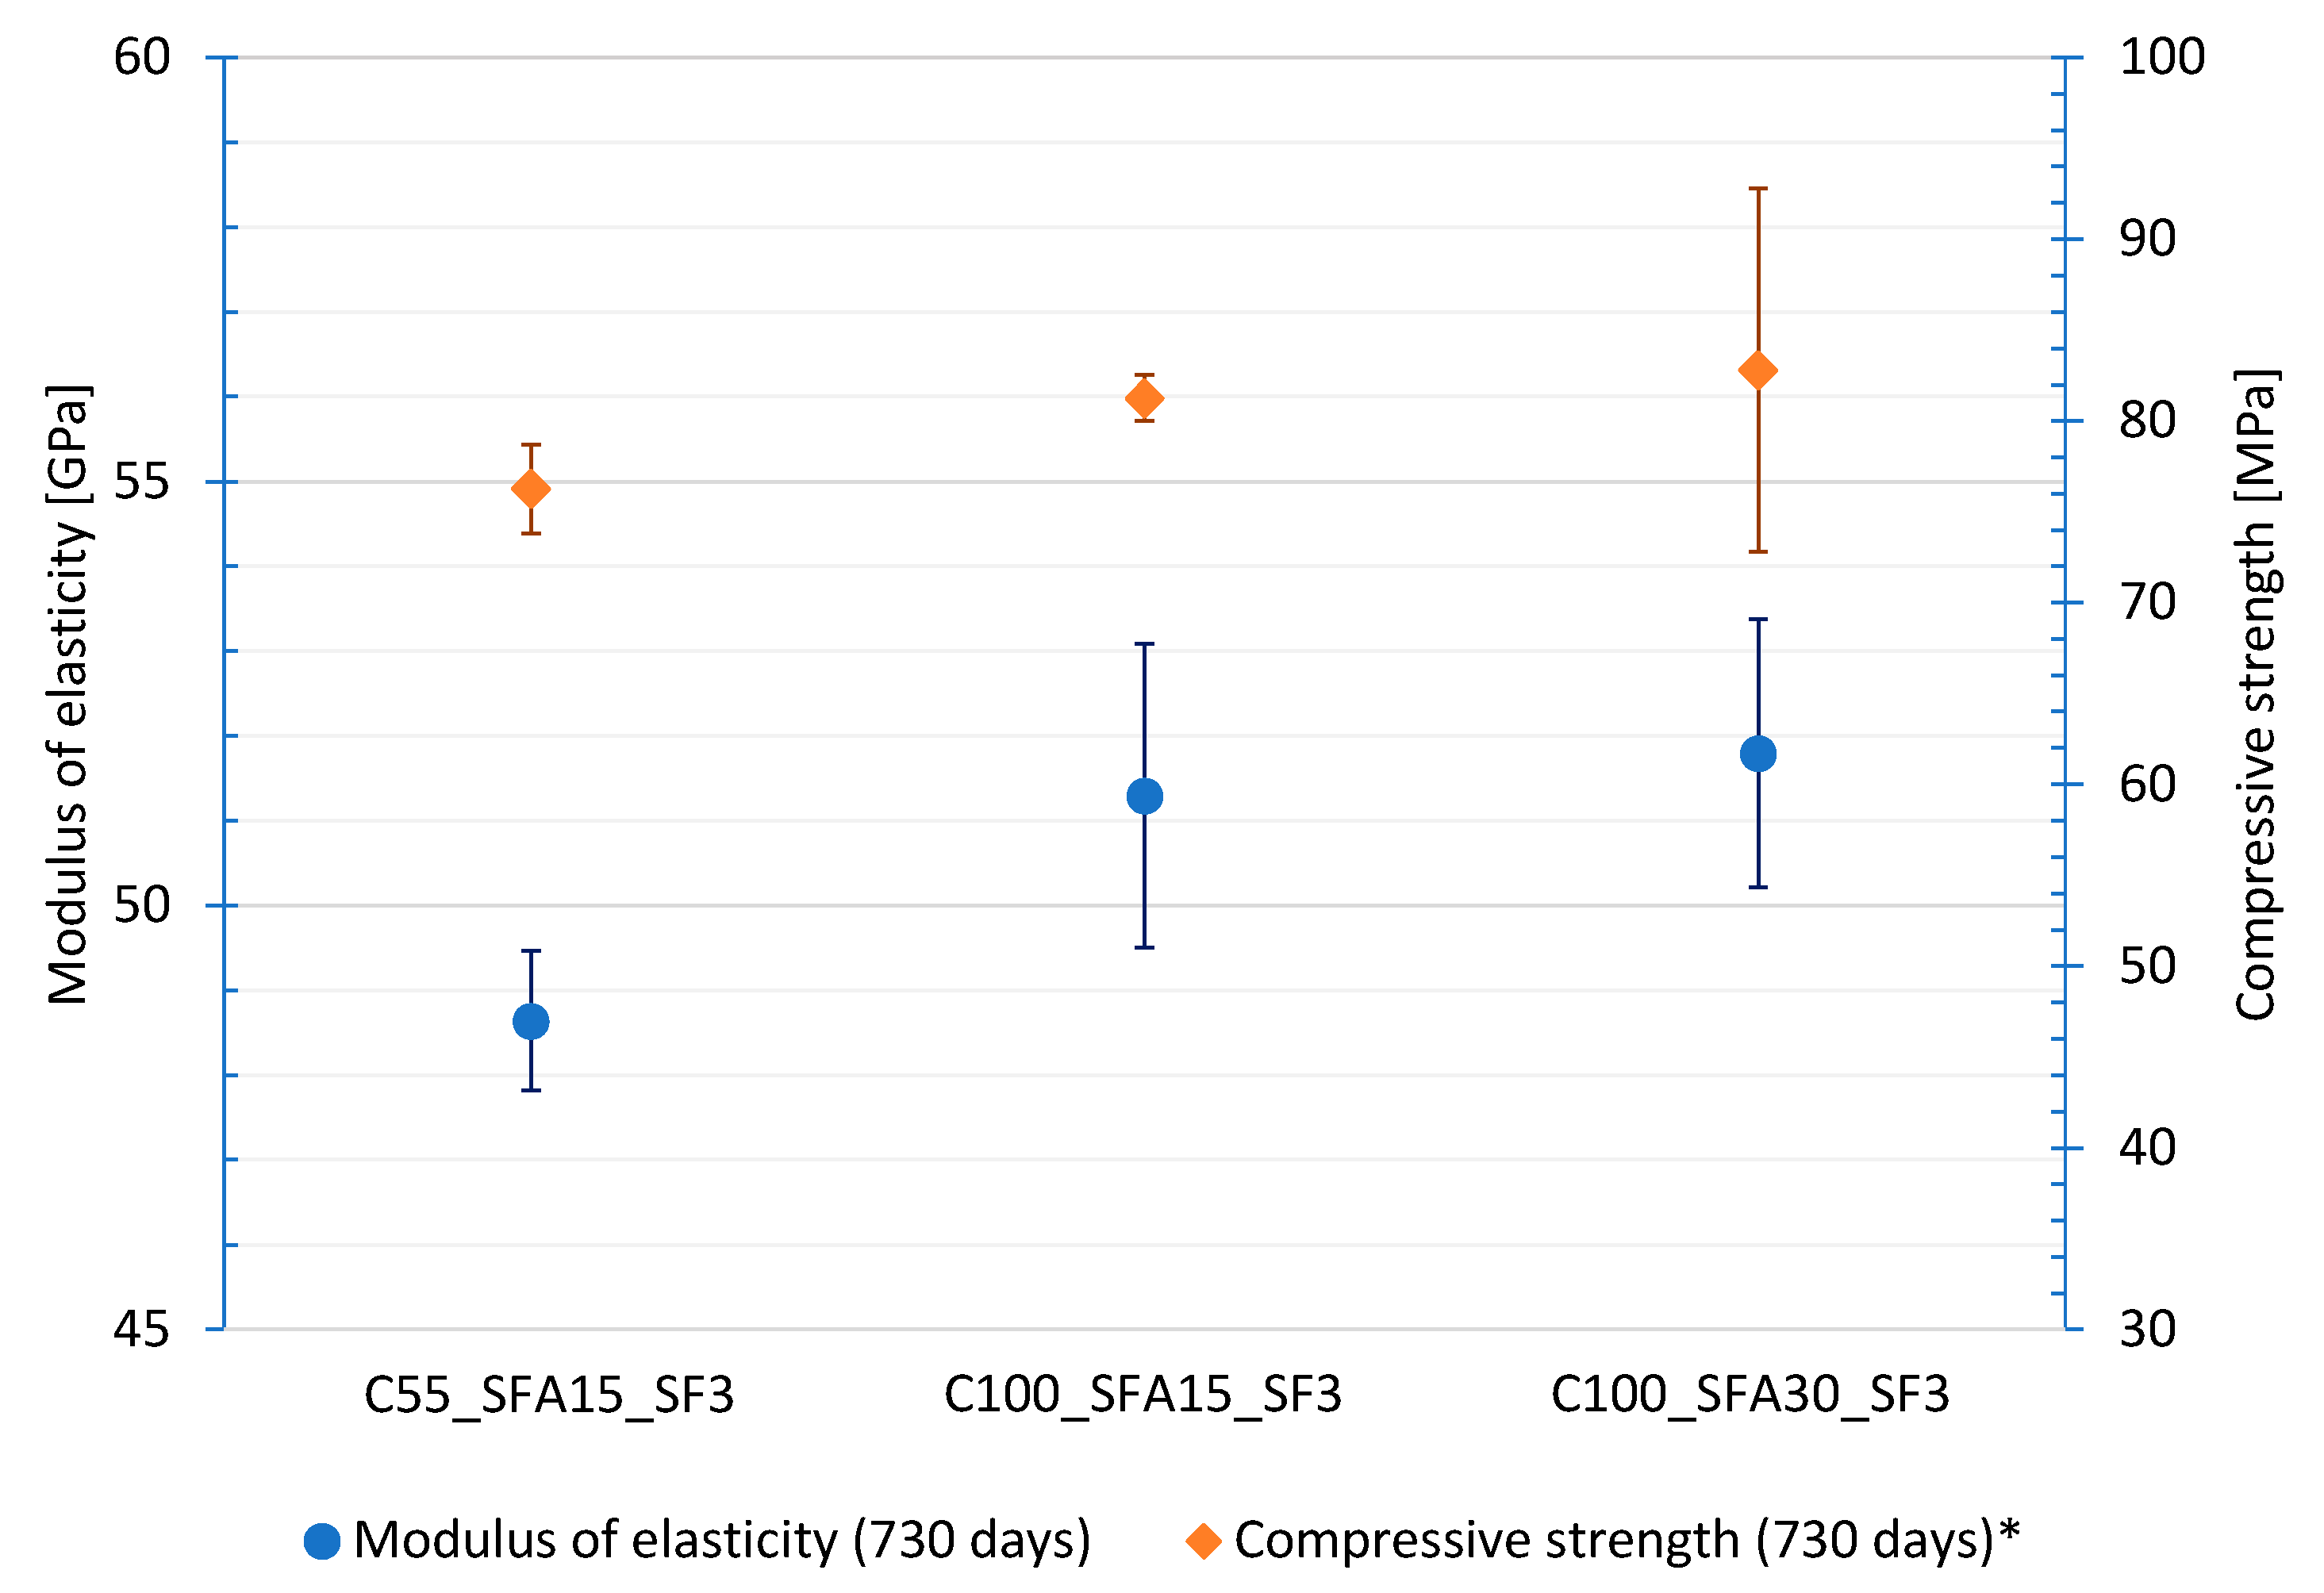
3.3. Modulus of Elasticity
The results of the modulus of elasticity tests are shown in
Figure 6. The mean values obtained on 730-day-old specimens ranged from 48.64 GPa (C55_SFA15_SF3) to 51.80 GPa (C100_SFA30_SF3). A correlation between compressive strength and elastic modulus values was observed: the HPC with the lowest mean compressive strength (C55_SFA15_SF3) was also the one with the lowest mean elastic modulus. For the mixtures with higher compressive strengths (C100_SFA30_SF3 and C100_SFA15_SF3), the mean values of elastic modulus were approximately 6% higher than those obtained for C55_SFA15_SF3.
The obtained results were compared (
Table 7) with the values estimated by the three different models recommended for HSC by ACI 363 [
30], Eurocode 2 (EN 1992-1-1) [
26] and NS 3473 [
31] standards, respectively:
where
is the cylinder mean compressive strength in MPa, and
is the modulus of elasticity in GPa.
The significant differences observed between obtained and estimated values could be explained by the use of coarse basalt aggregate and the fact that modulus of elasticity was tested on 730-day-old samples. The Eurocode 2 (EN 1992-1-1) [
26] indicates that the modulus of elasticity estimated from Equation (8) should be increased by 20% when basalt coarse aggregate is used in concrete. In such cases, the recalculated estimated values would be 51.90 GPa (C55_SFA15_SF3), 53.04 GPa (C100_SFA15_SF3) and 53.41 GPa (C100_SFA30_SF3).
In the same standard [
26], it has been pointed out that the concrete age has a significant influence on its modulus of elasticity. Thus, the secant modulus of elasticity of concrete at the age of
t days should be estimated from the following equation:
where
Ecm(
t) is the modulus of elasticity at the age of t days in GPa,
fc(
t) is the cylinder compressive strength of concrete at the age of
t days in MPa,
fc is the compressive strength of concrete at the age of 28 days, and
Ecm is the modulus of elasticity at the age of 28 days in GPa estimated from Equation (8).
Given Equation (10), the estimated modulus of elasticity values of concrete at the age of 730 days would be equal to 52.41 GPa (C55_SFA15_SF3), 57.36 GPa (C100_SFA15_SF3) and 54.18 GPa (C100_SFA30_SF3).
It could be concluded that none of the recommended models allows the estimation of the modulus of elasticity of tested concretes with acceptable precision. Estimated values were 26–28% lower (ACI 363) or 17–20% lower (NS 3473) than the tested values. In the case of EN 1992-1-1, the values estimated from Equation (8) were 11–14% lower than those tested, but given the correction regarding used coarse aggregate and age of concrete, the recalculated values were 5–12% higher than those tested, leading to the conclusion that the C100_SFA15_SF3 mixture could be characterized by a modulus of elasticity equal to 57.37 GPa, which is highly unlikely to be obtained for concrete composites.
3.4. Frost Resistance
The results of the HPC internal frost resistance after 56 days of curing are presented in
Table 8. It can be stated that all the designed non-air-entrained concretes met the requirements of maximum average mass loss (5%) and the maximum reduction of compressive strength (20%) after 150 cycles of freezing and thawing. No cracks were found on the surfaces of the samples. The C55_SFA15_SF3 concrete with quaternary binder mix combination showed the best performance with the lowest value of mass loss and fully maintained compressive strength after testing. The reason for the high observed internal frost resistance in the designed low-clinker HPC was considered to be the formation of a dense binder (cement-GGBFS-FA-SF) matrix with low porosity and high homogeneity.
3.5. Depth of Water Penetration under Pressure
For the two HPC mixtures with the lowest internal frost resistance, as described in
Section 3.3, the depth of water penetration under pressure was determined on two specimens. Based on the results presented in
Table 9, it can be concluded that the designed HPCs were characterized by high resistance to water penetration under pressure and met the requirement for penetration depth not exceeding 30 mm after 56 days of curing. The HPC mixture with 30% fly ash content (C100_SFA30_SF3) showed slightly greater resistance to water penetration than C100_SFA15_SF3 concrete, which is consistent with the results obtained in the frost resistance tests and indicates the important role of SCMs (FA) in creating a dense concrete structure. No leakage was observed in any of the samples.
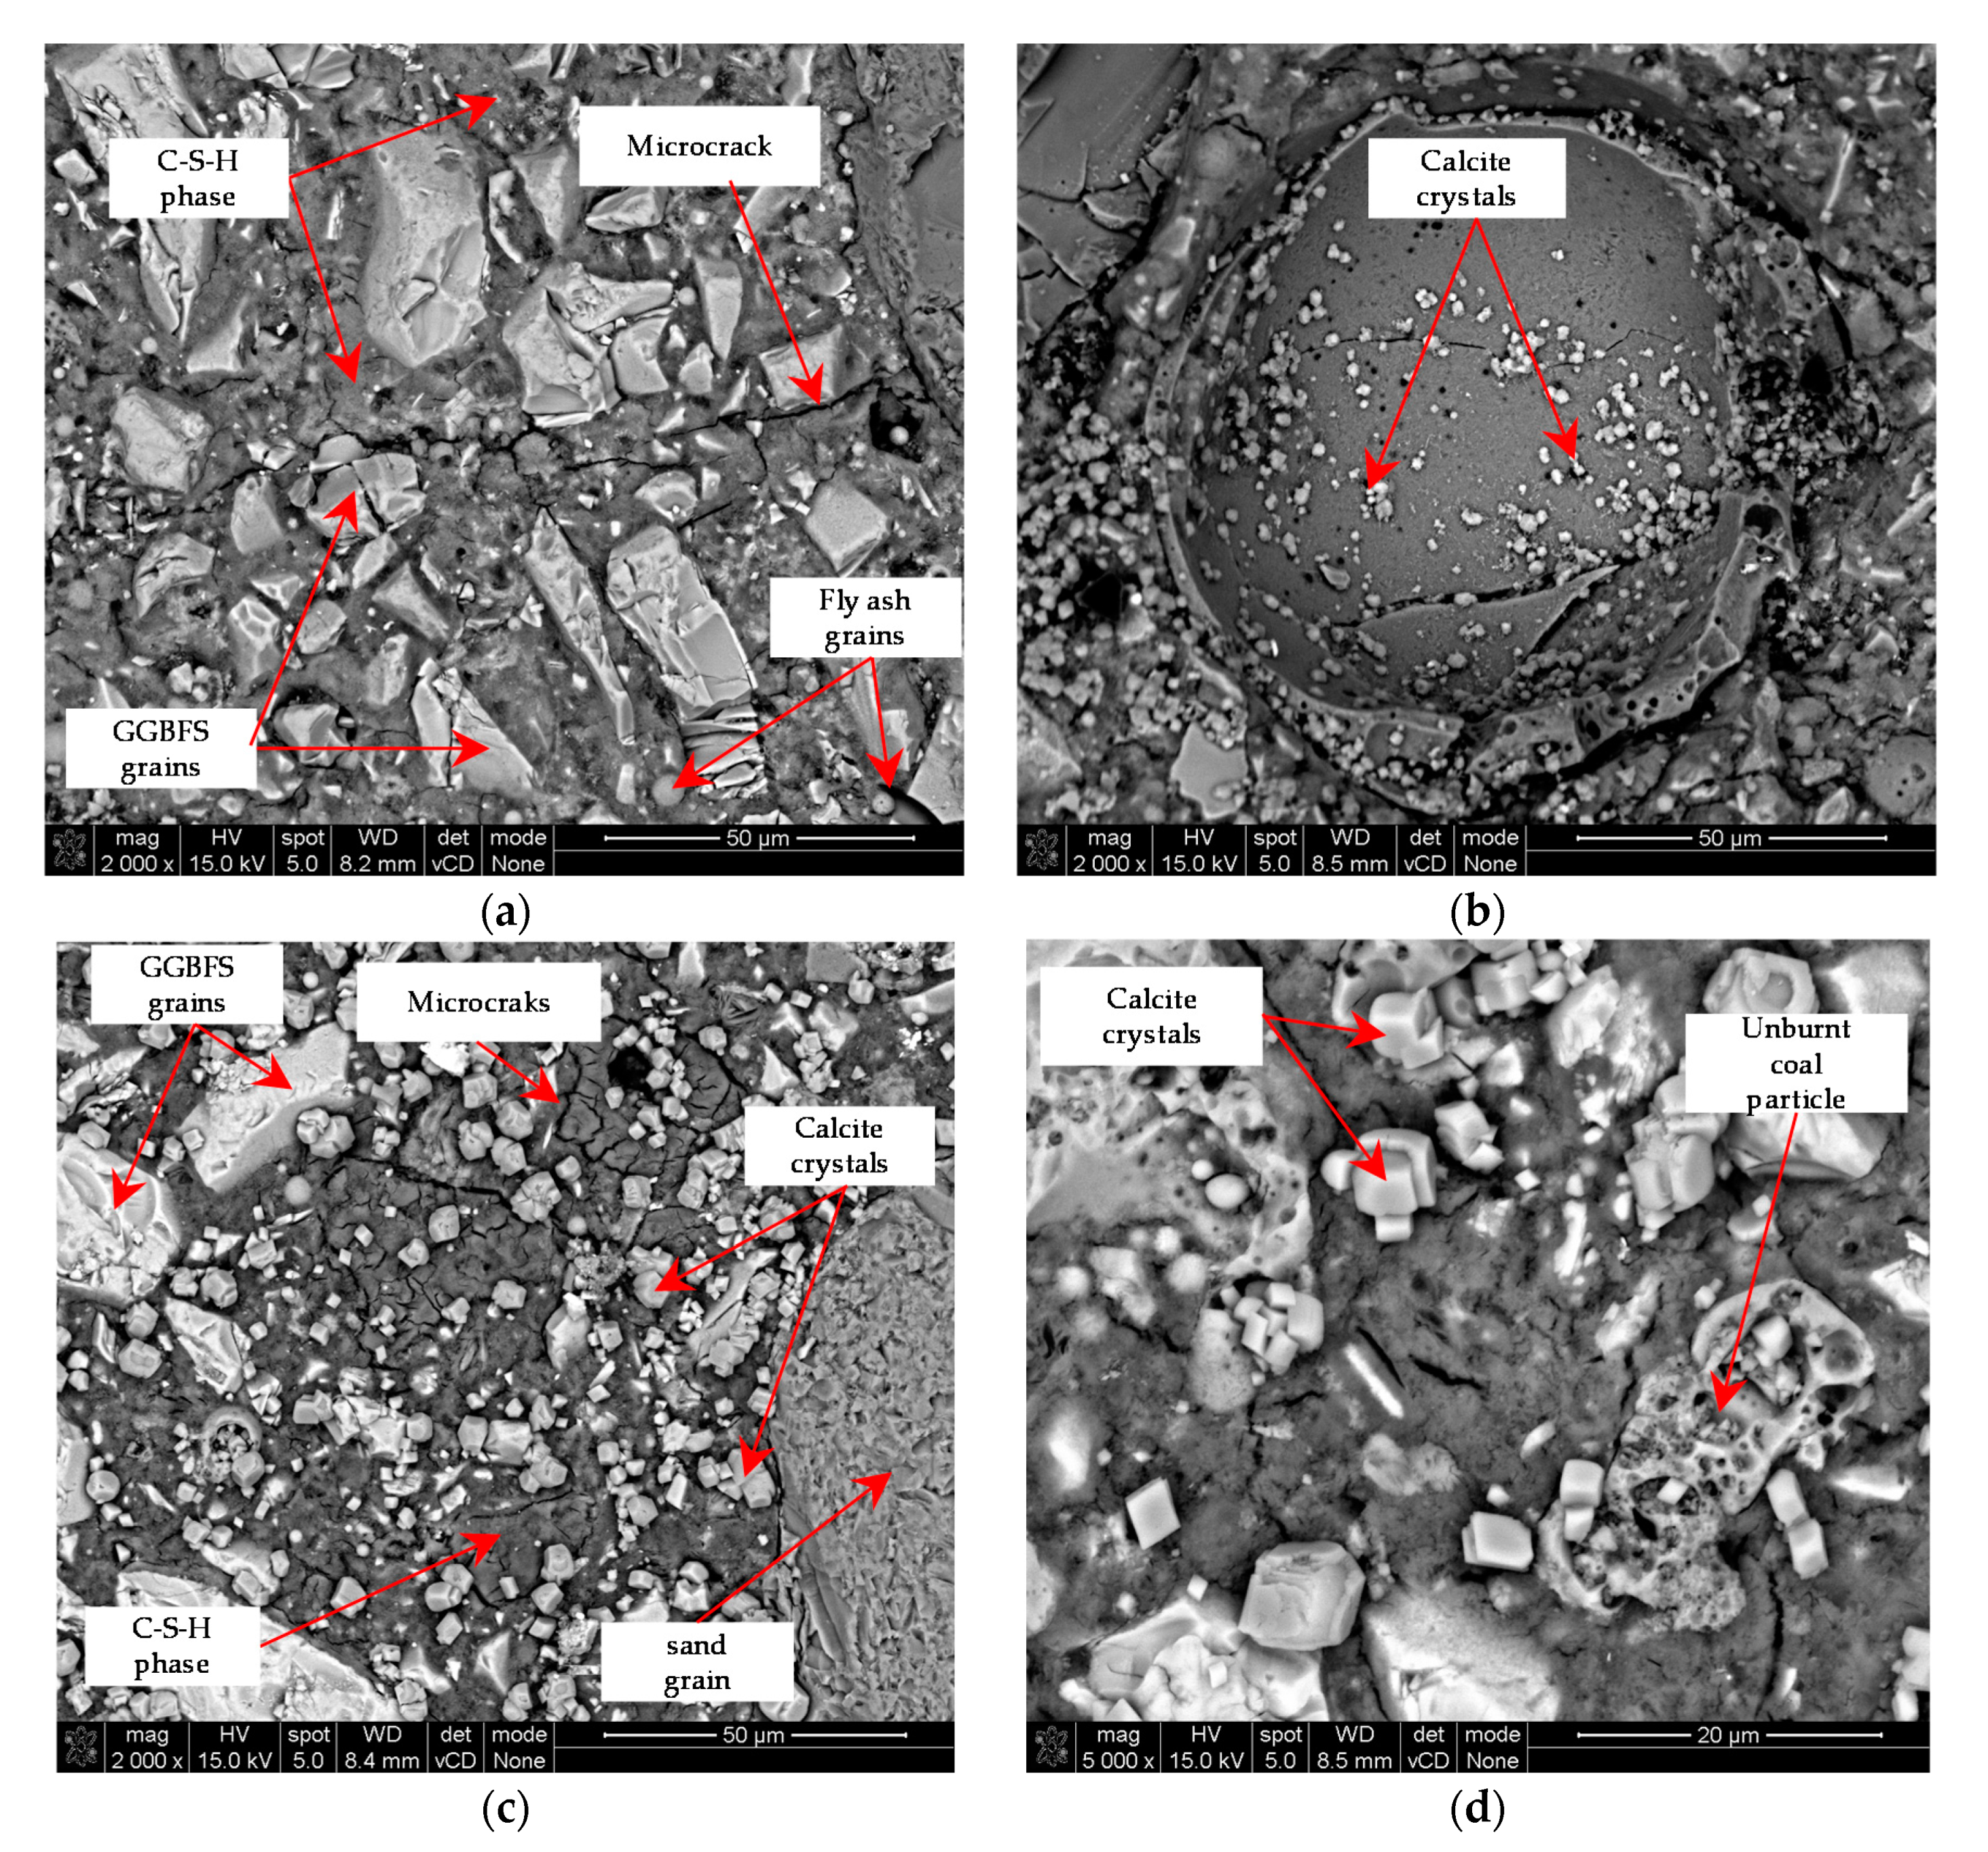
3.6. Scanning Electron Microscopy (SEM) with EDS Analysis
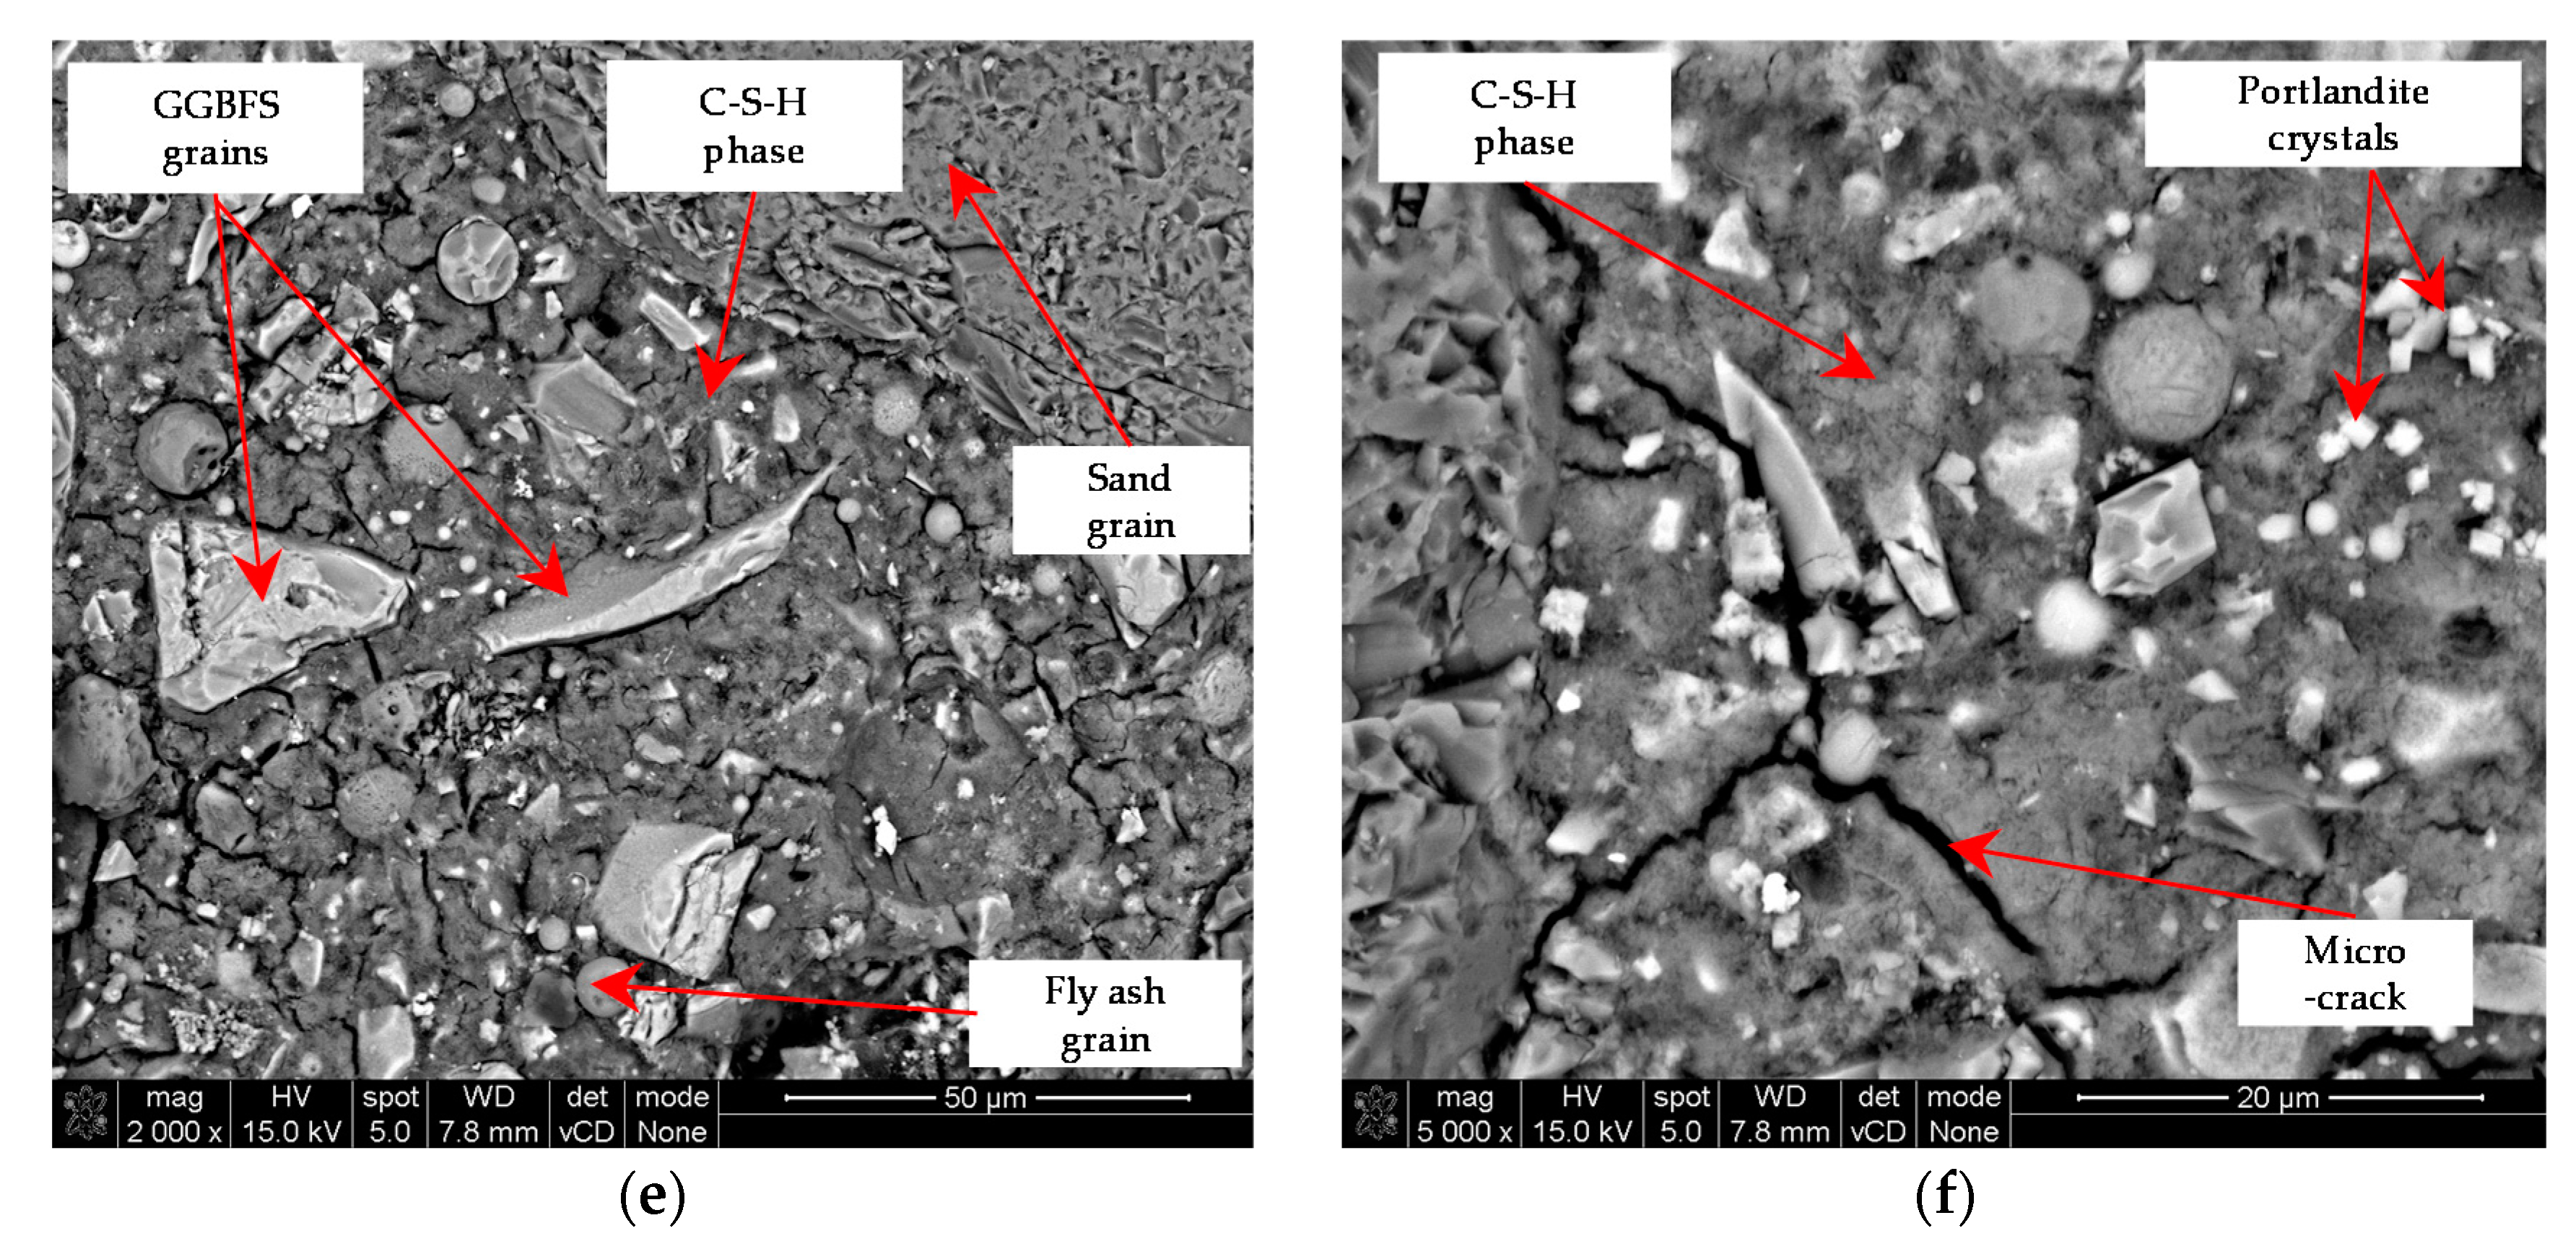
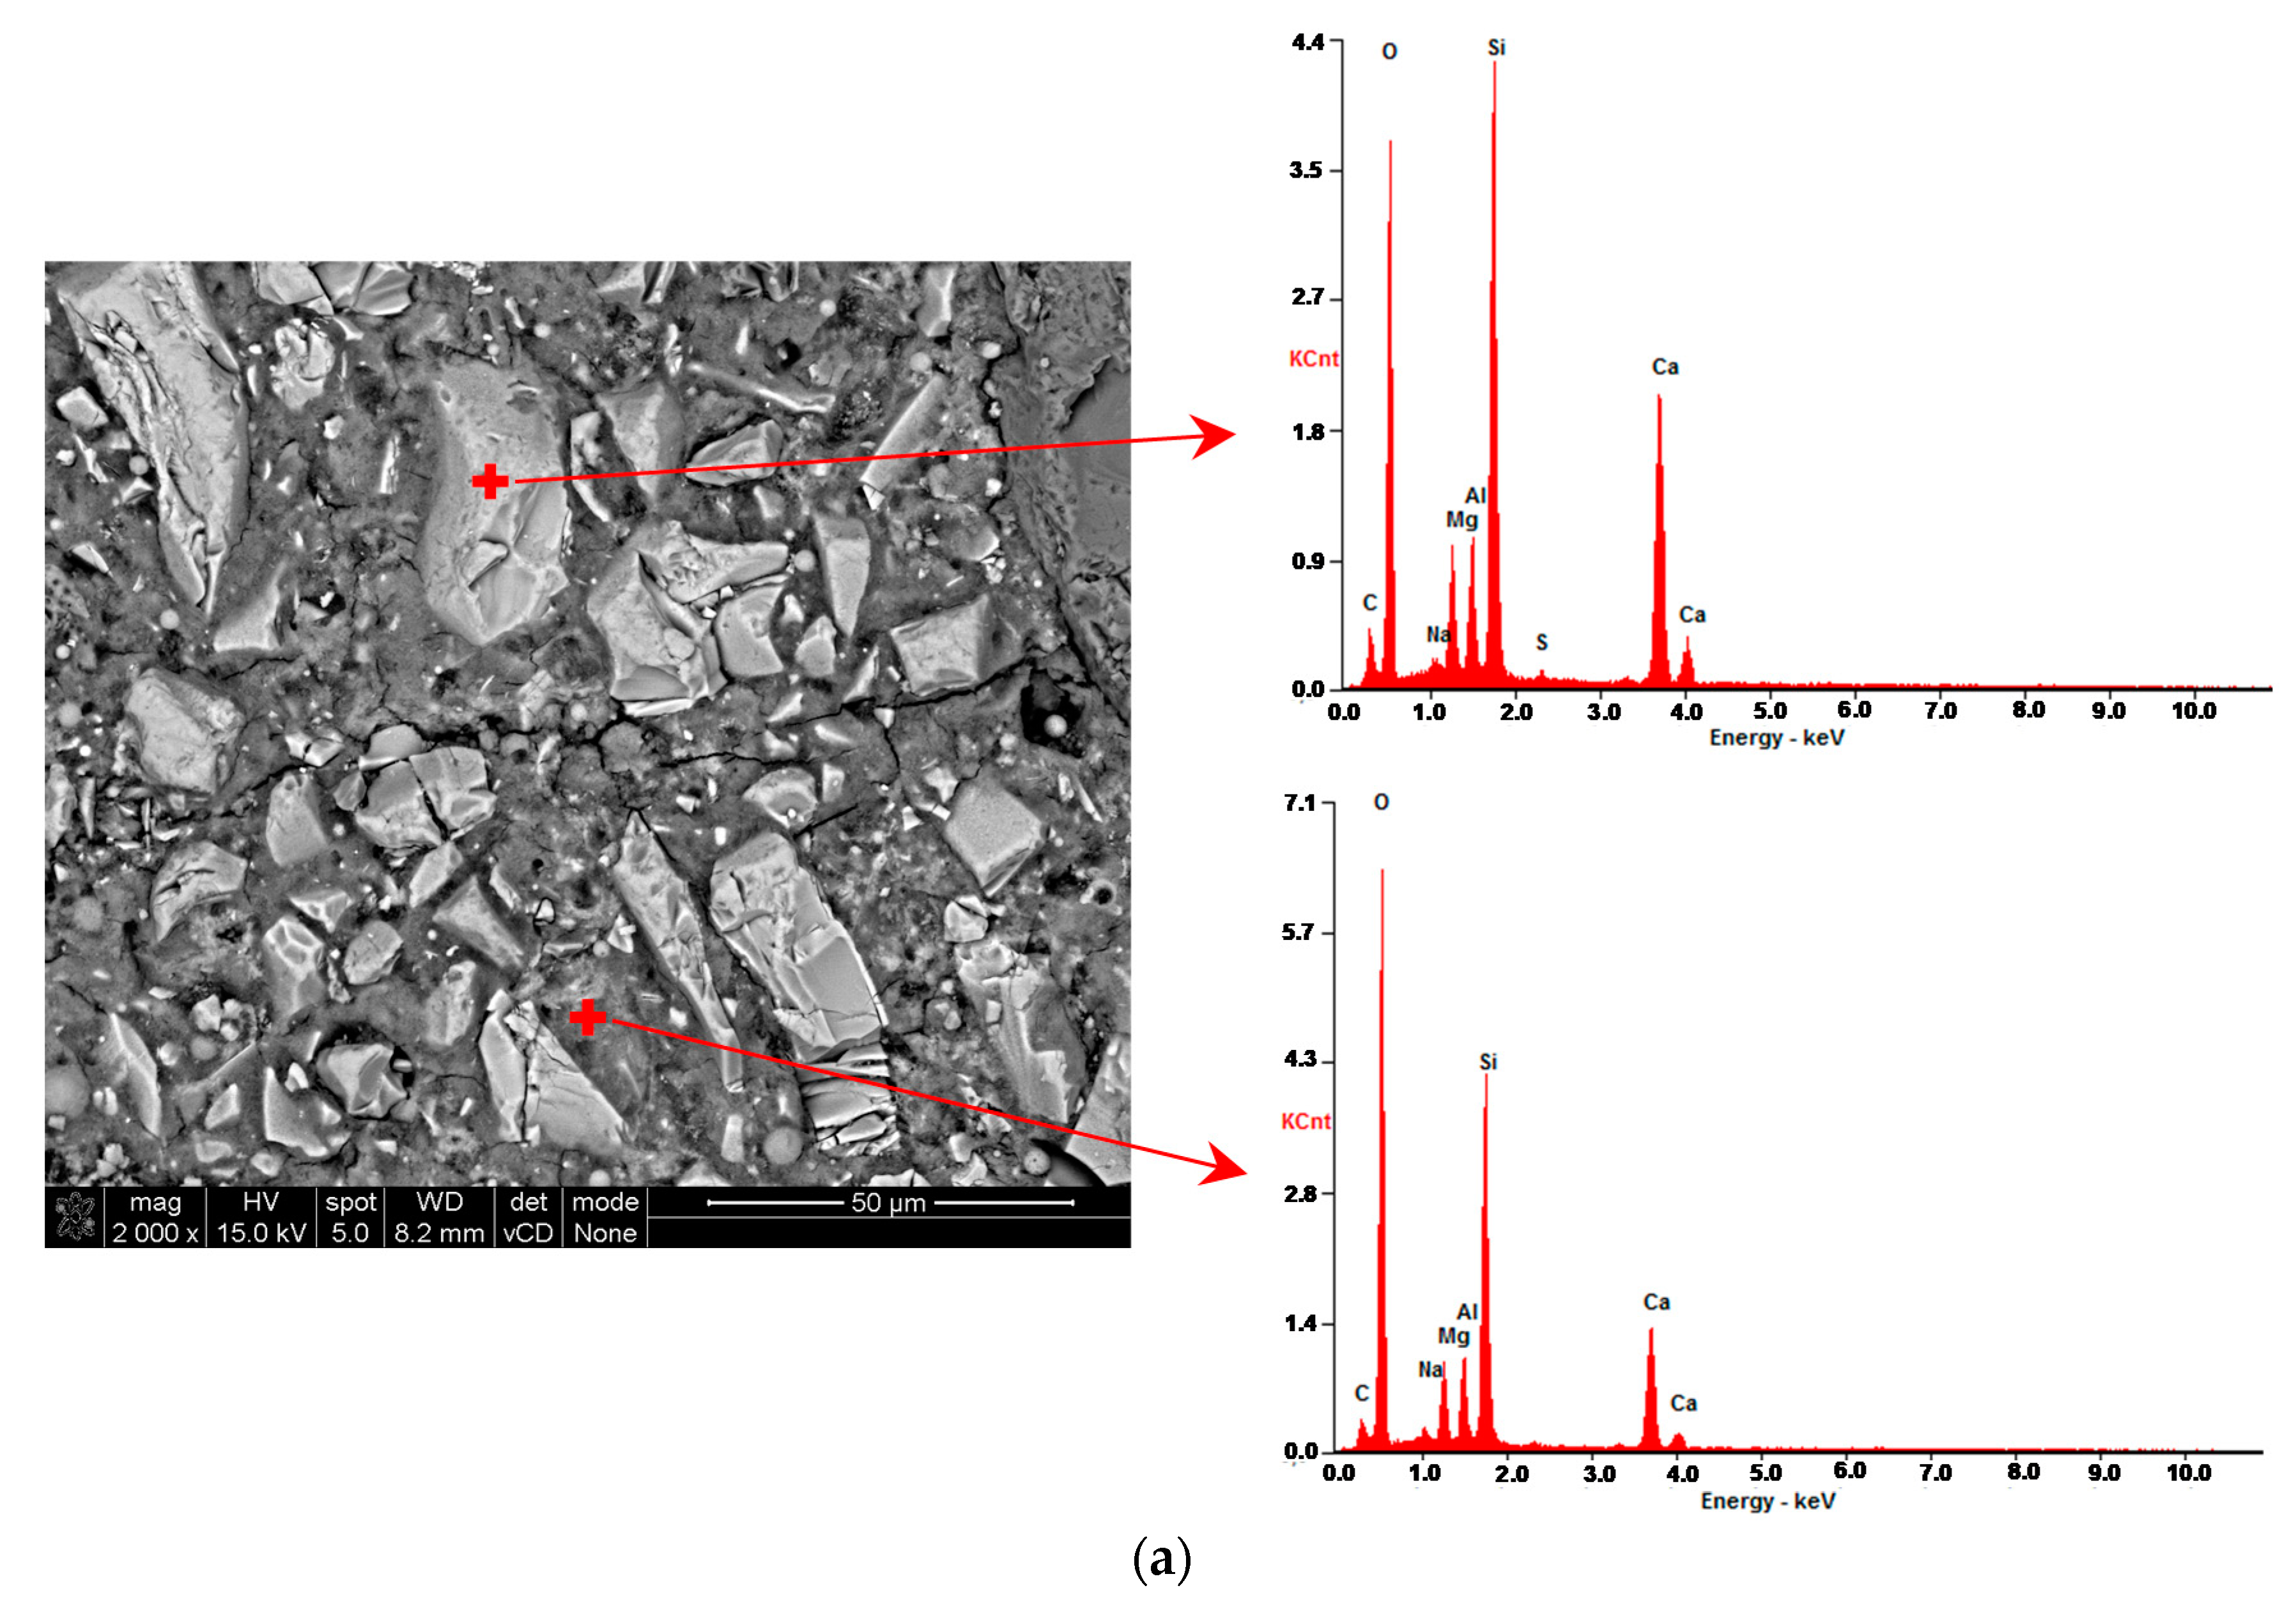
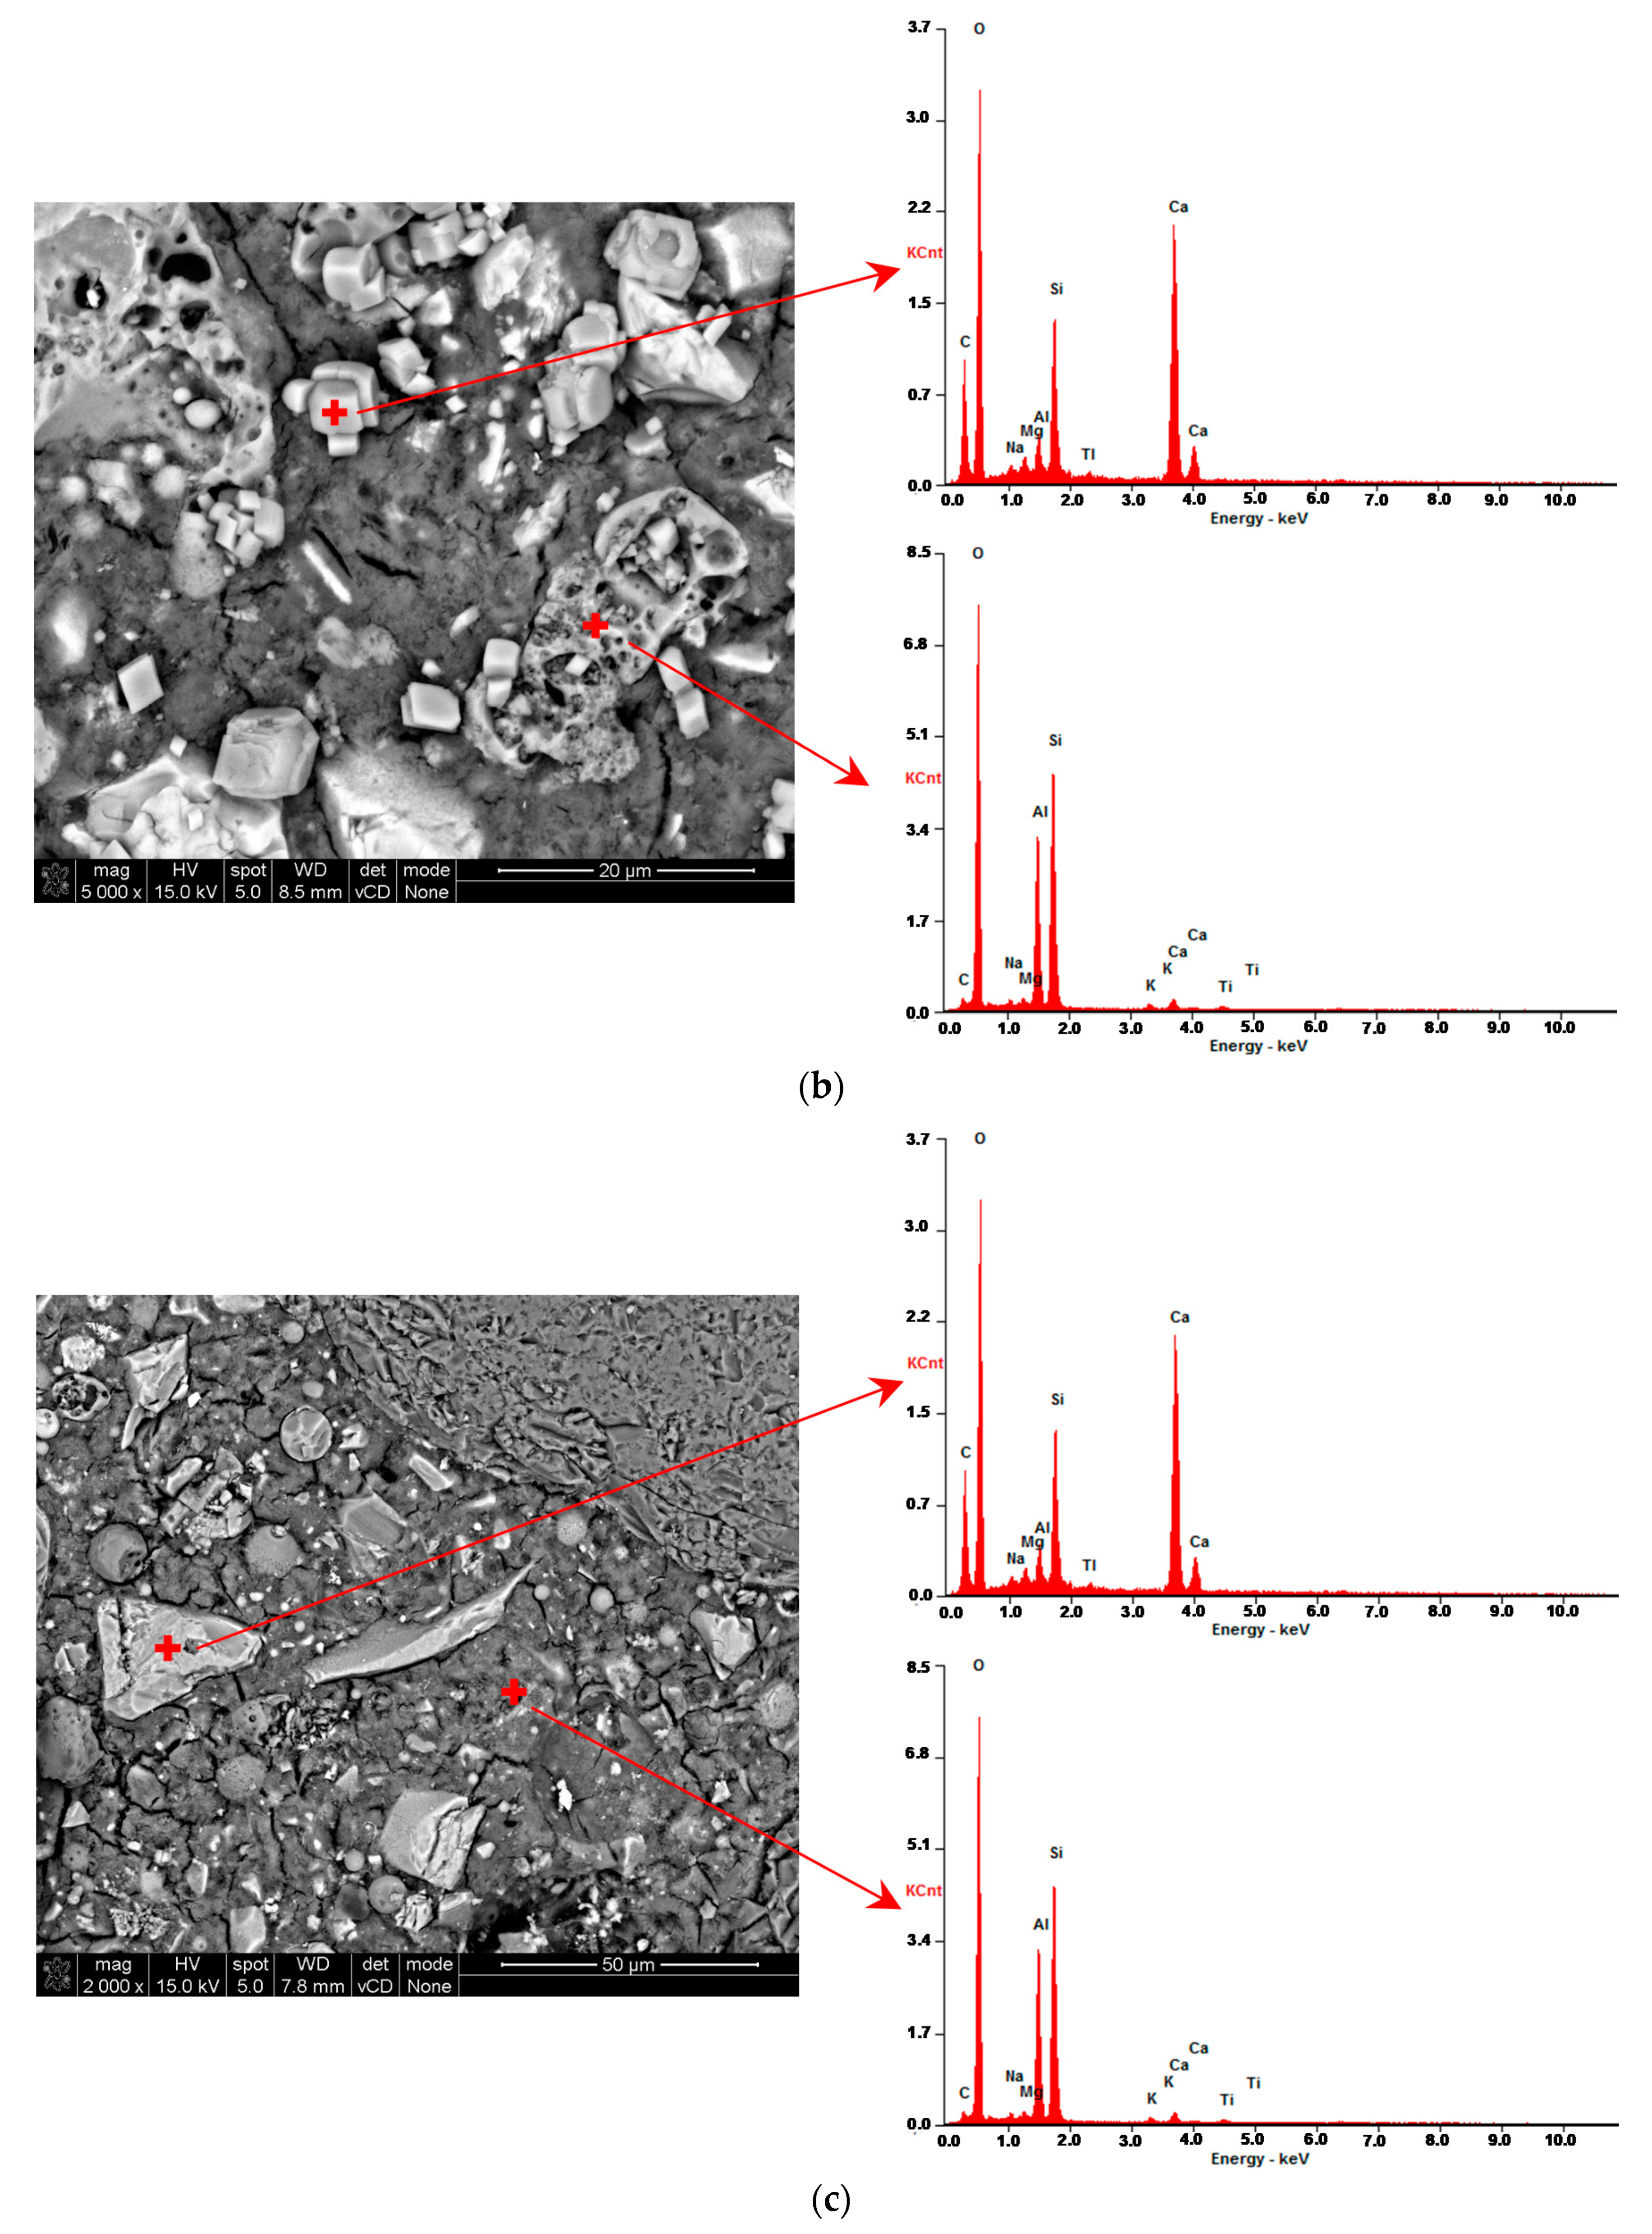
Backscattered Electron (BSE) SEM images presenting the microstructure of samples from each mixture are shown in
Figure 7. Phase compositions of cement matrices were confirmed by means of the EDS analysis, the results of which are shown in
Figure 8.
The cement matrix structure in all samples was dense and consisted mainly of the C-S-H phase and unhydrated GGBFS grains (
Figure 7a–f). The highest number of unhydrated GGBFS grains was observed in the C55_SFA15_SF3 sample, as it contained the highest amount of GGBFS. Some unreacted fly ash grains (
Figure 7a,c,e) and unburnt coal particles (
Figure 7d) were also visible, but in much lower quantities. Characteristic cubic crystals of calcite (
Figure 7d), as an effect of portlandite carbonation, were present inside pores and in the cement matrix of all samples, but in different amounts. The sample with the lowest amount of GGBFS and SFA (C100_SFA15_SF3) contained significantly more calcite crystals at the same depth compared with other mixes. This could be explained by previous studies indicating that the reduction of the amount of Portland cement clinker is associated with the reduction of the amount of portlandite (Ca(OH)
2) in concrete [
32]. Some Portlandite crystals (
Figure 7f) were identified in all samples, but the amounts were not significant.
Microcracks in the cement matrix were present in all mixes, though with a different intensity. The sample with the lowest amount of Portland cement clinker (C55_SFA15_SF3) contained a significantly lower number of microcracks than the other mixes. The high amount of microcracks might be associated with the fact that the SEM samples were obtained from the near-to-surface layer of concrete, which is especially prone to shrinkage-induced microcracking. However, due to the sample preparation method and the lack of shrinkage measurements, it is impossible to clearly determine whether the observed differences were associated with the higher amount of Portland cement clinker. Microcracks in the cement-based composites have easily been induced by the sample cutting and drying prior to SEM observations [
33]. The cutting process generates a direct mechanical impact on the sample, while during drying, a moisture gradient is developed, causing tensile stresses associated with drying shrinkage.
3.7. pH Value
The pH values of 1:1 solutions of fine crushed concrete in distilled water were equal to 12.1 for the mixtures C100_SFA15_SF3, C100_SFA30_SF3, and 12.0 for the mixture C55_SFA15_SF3. Therefore, it can be stated that the alkalinity of the concrete decreases with increasing GGBFS amount. An increase in the FA content to 30% in C100_SFA30_SF3 did not reduce the pH value of HPC. The tested pH values did not limit the use of designed HPC in aggressive carbonation environments considering the ability to protect the passive film on the surface of steel reinforcement bars.


