
Design and Calibration of a Tri-Directional Contact Force Measurement System


Dipartimento di Ingegneria Meccanica e Aerospaziale, Politecnico di Torino, Corso Duca degli Abruzzi, 24, 10129 Torino, Italy
*
Author to whom correspondence should be addressed.
Appl. Sci. 2021, 11(2), 877; https://0-doi-org.brum.beds.ac.uk/10.3390/app11020877
Submission received: 30 November 2020
/
Revised: 28 December 2020
/
Accepted: 14 January 2021
/
Published: 19 January 2021
(This article belongs to the Special Issue Experimental Mechanics, Instrumentation and Metrology)
Abstract
:In low pressure turbine stages, adjacent blades are coupled to each other at their tip by covers, called shrouds. Three-dimensional periodic contact forces at shrouds strongly affect the blade vibration level as energy is dissipated by friction. To validate contact models developed for the prediction of nonlinear forced response of shrouded blades, direct contact force measurement during dynamic tests is mandatory. In case of shrouded blades, the existing unidirectional and bi-directional contact force measurement methods need to be improved and extended to a tri-directional measurement of shroud contact forces for a comprehensive and more reliable validation of the shroud contact models. This demands an accurate and robust measurement solution that is compatible with the nature and orientation of the contact forces at blade shrouds. This study presents a cost effective and adaptable tri-directional force measurement system to measure static and dynamic contact forces simultaneously in three directions at blade shrouds during forced response tests. The system is based on three orthogonal force transducers connected to a reference block that will eventually be put in contact with the blade shroud in the test rig. A calibration process is outlined to define a decoupling matrix and its subsequent validation is demonstrated in order to evaluate the effectiveness of the measurement system to measure the actual contact forces acting on the contact.
1. Introduction
In low pressure turbine (LPT) stages, high static loads caused by centrifugal forces and oscillating forces of working fluid result in highly pre-stressed forced vibrations [1]. In order to avoid high cycle fatigue (HCF), there is a need to estimate and reduce these vibration amplitudes. Friction damping is commonly utilized in turbomachinery [2] in the form of under platform dampers, snubbers, and shrouds to reduce the blade vibration amplitude at resonance due to its efficacy, simplicity, and reliability. In case of shrouded blades, friction forces act at the blade tip, where adjacent blade covers, called shrouds, are in contact with each other (Figure 1). Each blade shroud has therefore two contact surfaces, where tangential relative displacements determine stick/slip phenomena [3]. The frictional contact surfaces are characterized by hysteresis loops that indicate the variation of tangential contact forces with respect to relative displacements. The area bounded by the hysteresis loop depicts the energy dissipation at the contact surface and the slope of hysteresis loop defines the contact stiffness. These two parameters, i.e., the dissipated energy and contact stiffness influence the dynamic characteristics of the shrouded blade assembly.
For the numerical prediction of LPT blade response levels, contact models [4,5,6] are implemented in nonlinear solvers for forced response analysis whose experimental validation is mandatory to describe the contact parameters accurately. For shrouded blades, the experimental validation is usually performed in test rigs where one blade is put in contact with supports that simulate the adjacent blades. Numerous experimental test rigs were developed where the dynamic response of the shrouded blades in contact was measured [7,8,9,10,11,12,13]. These studies emphasized on the measurement of displacements or accelerations along with the excitation forces to compute and analyze the effects of shroud contacts on vibration amplitudes and resonant frequencies. Although these methods are useful to assess the advantages offered by the shrouded blades with respect to friction damping, they do not provide a complete in-depth understanding of the dynamic behavior at the shroud contacts, as they do not measure the contact forces.
On the other hand, several experimental test rigs were developed to facilitate the measurement of unidirectional [14,15,16,17] and two directional contact forces [18,19] for flat contact surfaces and under platform dampers under laboratory conditions. Apart from the dynamic response, these techniques were useful in measuring the contact parameters, i.e., the coefficient of friction and the contact stiffness of two surfaces in contact. While the two directional contact force measurement methods are limited to one normal component and one tangential component, this is not enough for shrouded blades due to the three-dimensional characteristics of shroud contacts. For this reason, the second orthogonal tangential component should also be measured. Therefore, the measurement of three directional contact forces is mandatory for a detailed representation of the shroud contact parameters and is essential for a more reliable experimental validation of the simulation tools and its effect on the system dynamics. Such an experimental setup that allows simultaneous measurement of the response of the blade and three directional contact forces between the blade shroud and adjacent supports has not yet been studied and implemented to the authors’ knowledge. Hence, this study will present a design of a force measurement system capable of measuring contact forces in three directions that will be integrated in an experimental test rig to accommodate a shrouded blade with two shroud contacts.
Design considerations for the tri-directional contact force measurement relies on the nature of the contact forces and the orientation of contact forces in vibrating blades depends on the vibration mode being investigated. Therefore, when multiple resonances are investigated, two types of tri-directional force measurement systems can be considered, i.e., (i) a multi-axis force sensor; (ii) a set of single axis force sensors mechanically connected to each other which is proposed in this study. Multi-axis force sensors are being broadly used in aerospace and automation industries these days. However, the commercially available multi-axis force sensors are very expensive and can be intricate considering their mounting requirements and calibration with respect to the shrouded blades. Alternatively, numerous studies have been carried out on the development of multi-axial force measurement technologies [20,21,22,23,24,25,26,27,28] that involved different arrangements of multiple strain gauges and various designs of the load transferring elements to achieve valued outcomes. Similarly, several three directional contact force measurement systems have been studied and implemented for different applications like surgical robots [29], tactile sensors [30,31], clinical examination [32], and measurement of ground reaction force (GRF) [33,34]. Nevertheless, the dimensions of most of these multi axial force sensors are not small enough to be placed in the constricted space where the blade shroud contact forces must be measured. Other multi-axis load cells lack the dynamic characteristics required to measure the periodic contact forces acting on the blade shroud. On the other hand, to achieve the required accuracy, reliability, and robustness, the set of single axis sensors and the elastic structure on which they are mounted on must be carefully designed [20].
Multiple axis force sensors can be constructed or arranged in a way that they can be mechanically decoupled or mechanically coupled. In mechanically decoupled force sensors, the applied loads are directly measured as the output of the sensor, i.e., minimum or no crosstalk. However, their complex geometry results in manufacturing complications. Mechanically coupled force sensors on the other hand also measure lateral force components upon load application requiring the computation of a decoupling matrix to obtain the actual loads. This also means that they can be designed with simple geometries [21]. Hence, an important design aspect to be considered is that the precision of a multi-axis force measurement system (both multi axis sensor and set of uniaxial force sensors mechanically connected) significantly depends on the configuration of force sensing components and minimization of errors arising due to coupling or noise. Therefore, accuracy must be ensured during the calibration process of a multi-axis force measurement system that involves logging the measured values corresponding to the known load set. In view of all the above-mentioned factors and limitations, it is necessary to design an accurate and robust measurement solution and test an alternate decoupled multi-axial force sensing method of combining three uniaxial force sensors capable of measuring the three orthogonal components of shroud contact forces simultaneously during the dynamic forced response tests of shrouded blade.
The purpose of this study is to analyze the effectiveness of a cost effective and adaptable design configuration, calibration and decoupling process of a tri-directional force measurement system comprising of three uniaxial force sensors arranged orthogonally, that would be employed to measure static and dynamic shroud contact forces applied in three orthogonal directions simultaneously. The efficacy of orthogonal arrangement of the force sensors in a tripod configuration to reduce the mechanical coupling is investigated. The usefulness of the calibration procedure followed by the decoupling method to improve accuracy is also evaluated. Finally, the results are used to determine the feasibility of the proposed tri-directional force measurement system to measure shroud contact forces.
2. Sensor Configuration Setup
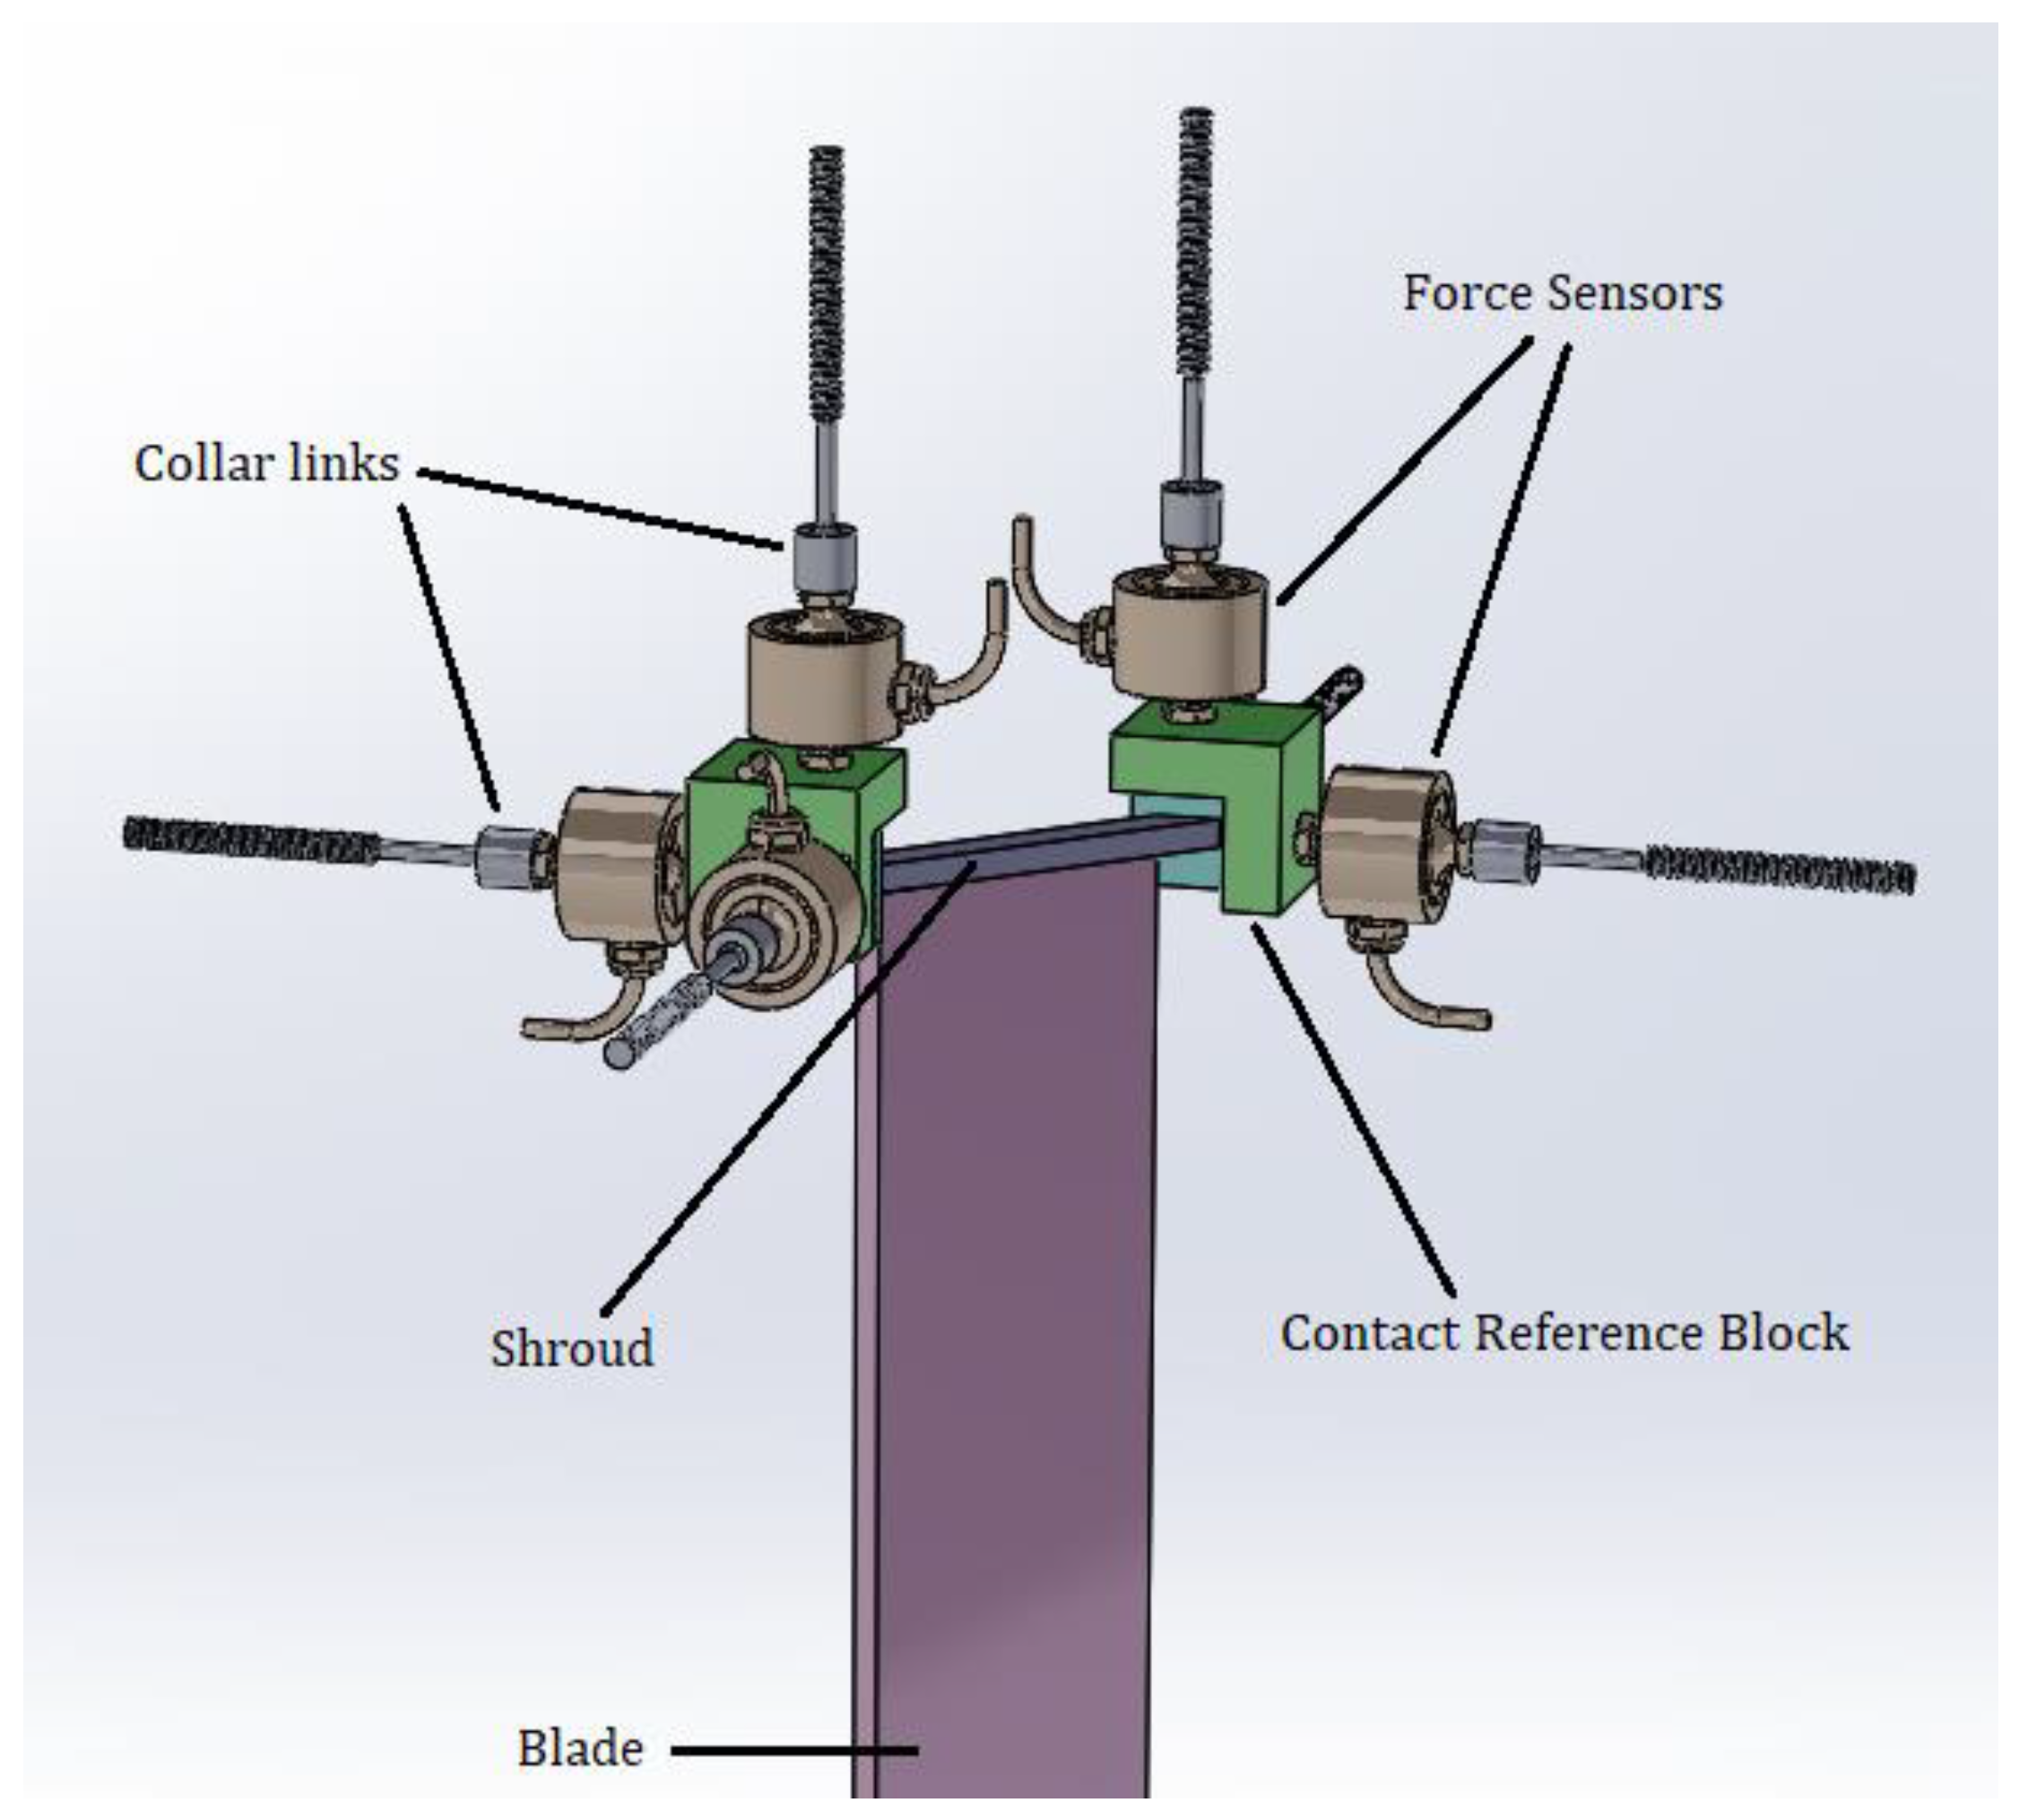
The tri-directional force measurement system under study has been developed for being installed in a customized test rig for the shroud contact force measurement during blade forced response tests, as shown in Figure 2.
The force measurement system consists of three strain gauge based uniaxial force sensors HBM U9C (0.5 kN) assembled in a tripod configuration having three mutually orthogonal branches, where each branch will include a force sensor attached to a contact reference block on one end and collar link on the other. In the proposed test rig, the blade shrouds will be in contact with the contact reference block that is especially designed with a contact surface centrally aligned with the shroud contact surface. The three branches will be fixed to the test rig frame with the help of three collar links. As a whole, two of these force measurement systems based on the tripod sensor configuration will be installed in the test rig for each blade shroud end.
A single force sensor of this type is compact and can measure both tensile and compressive forces. Because of its high stiffness and high natural frequency, it can measure static as well as dynamic forces applied in axial direction with good accuracy and minimum crosstalk. Due to the design of the configuration and the nature of the contact forces being 3D point forces, it is assumed that the bending moment is negligible.
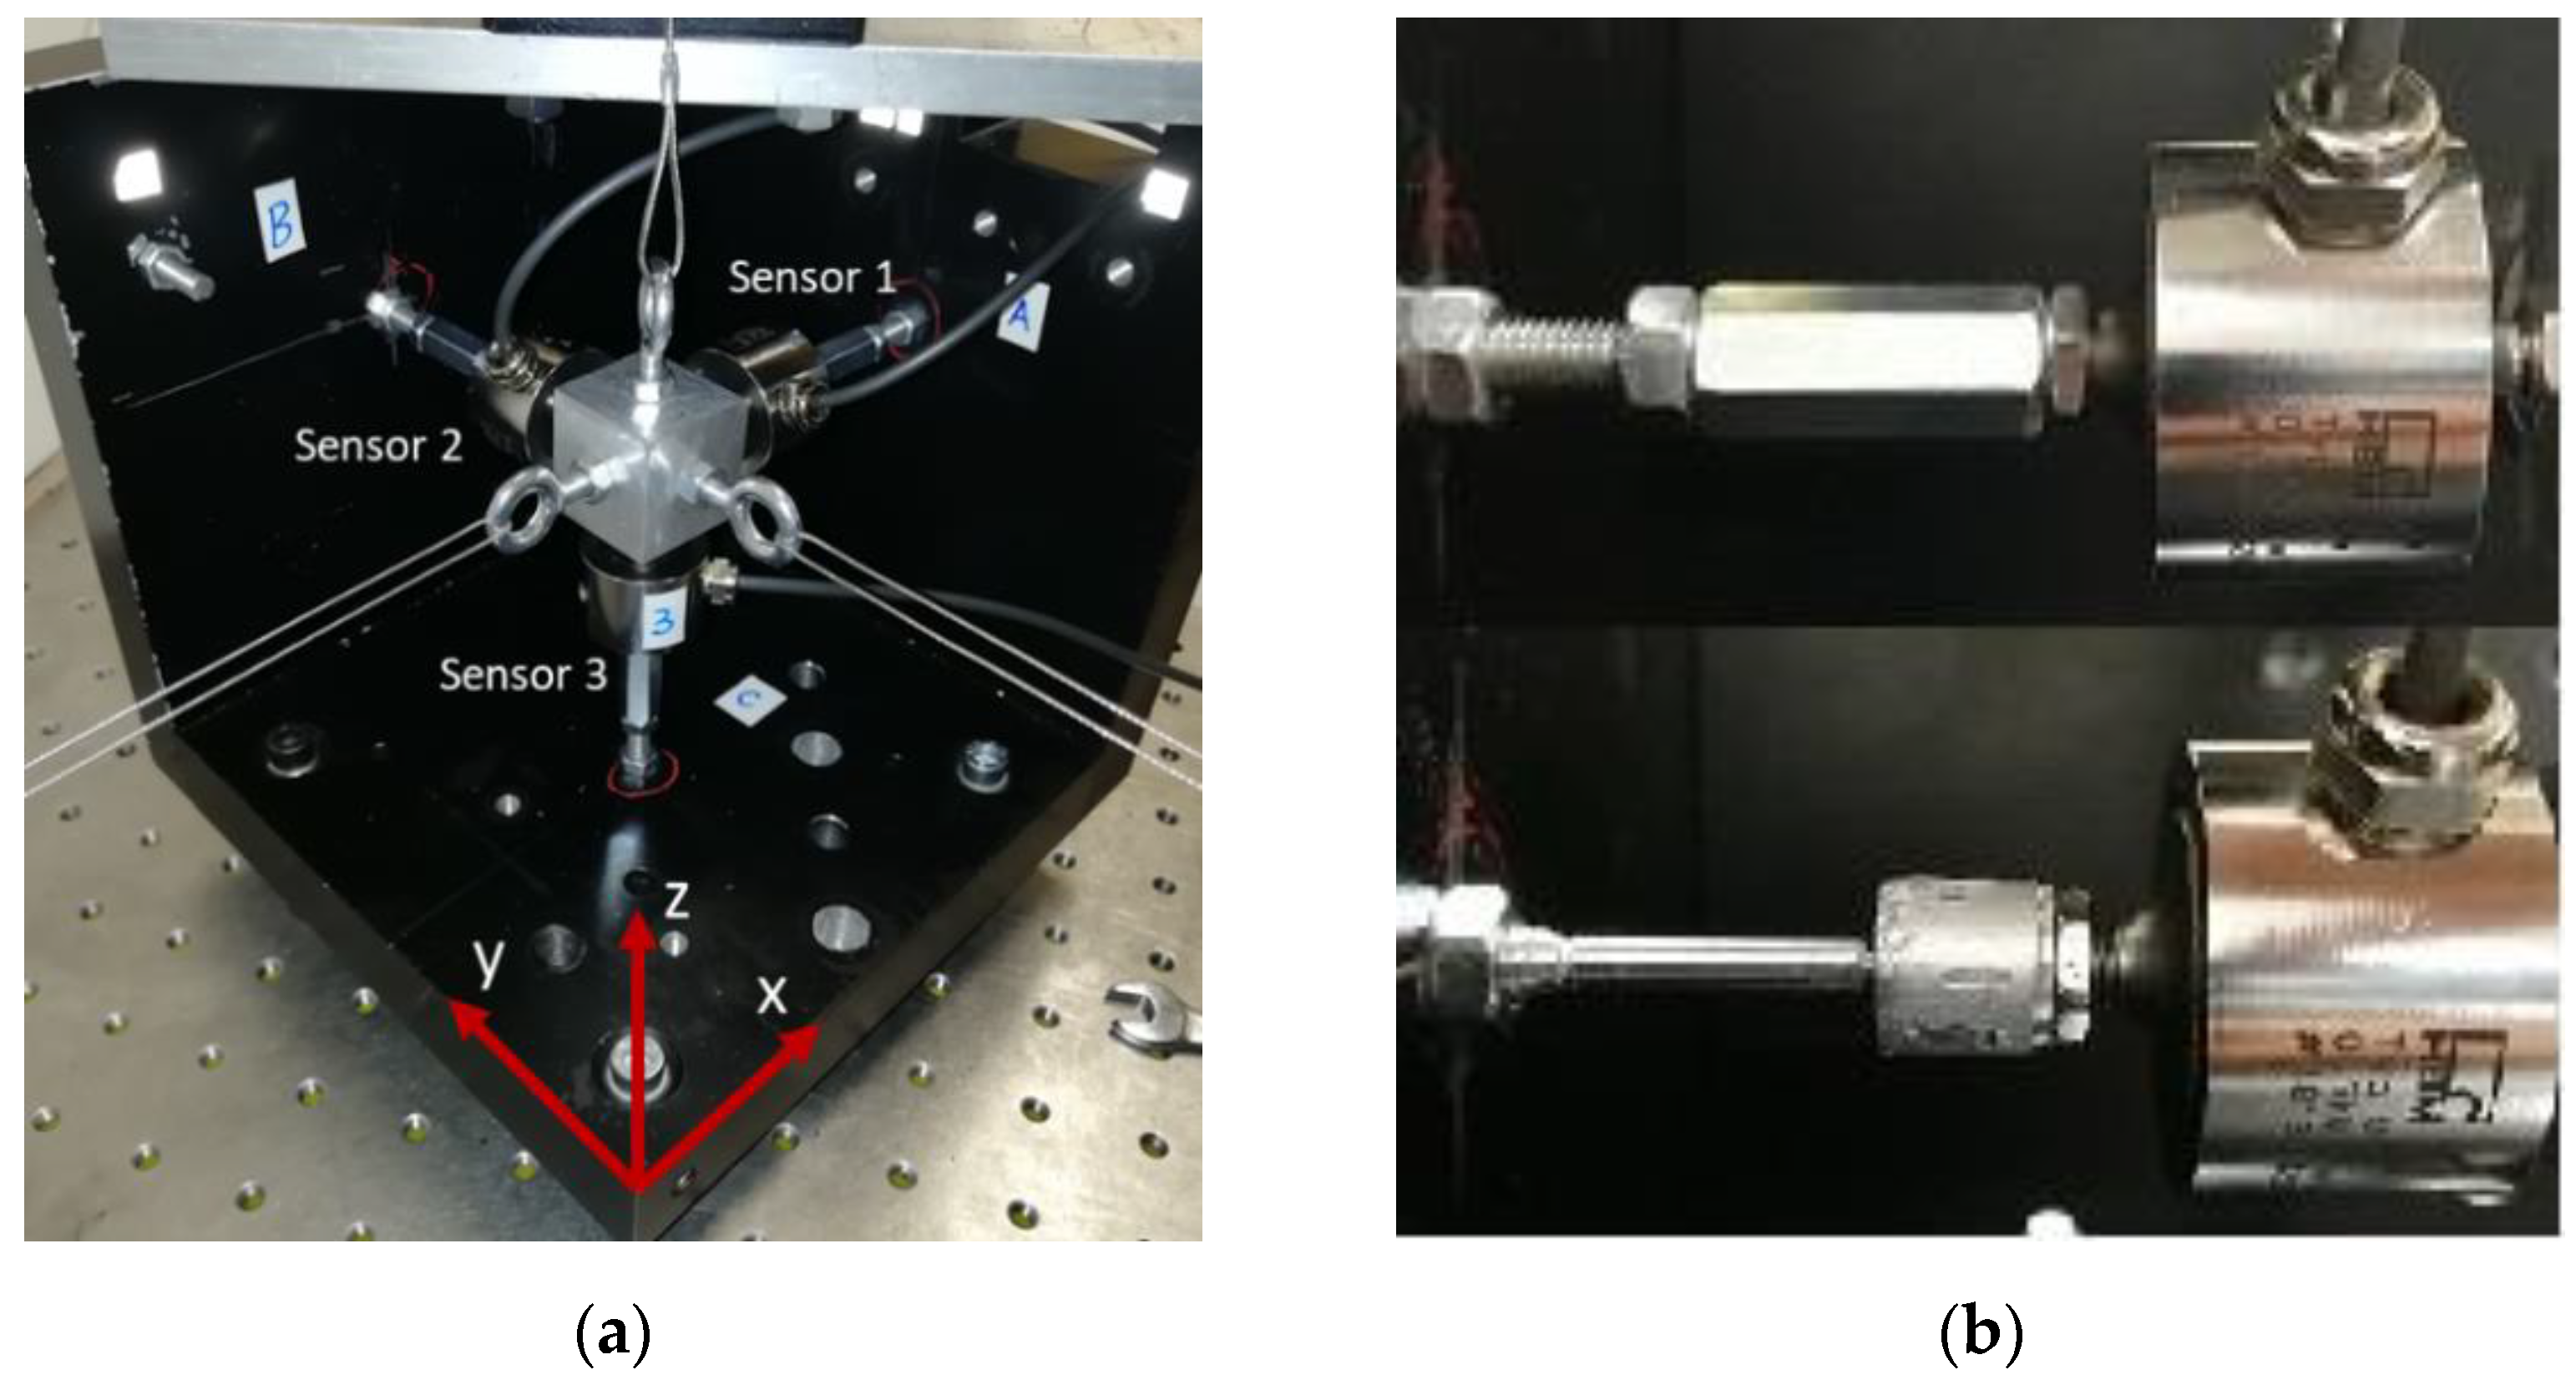
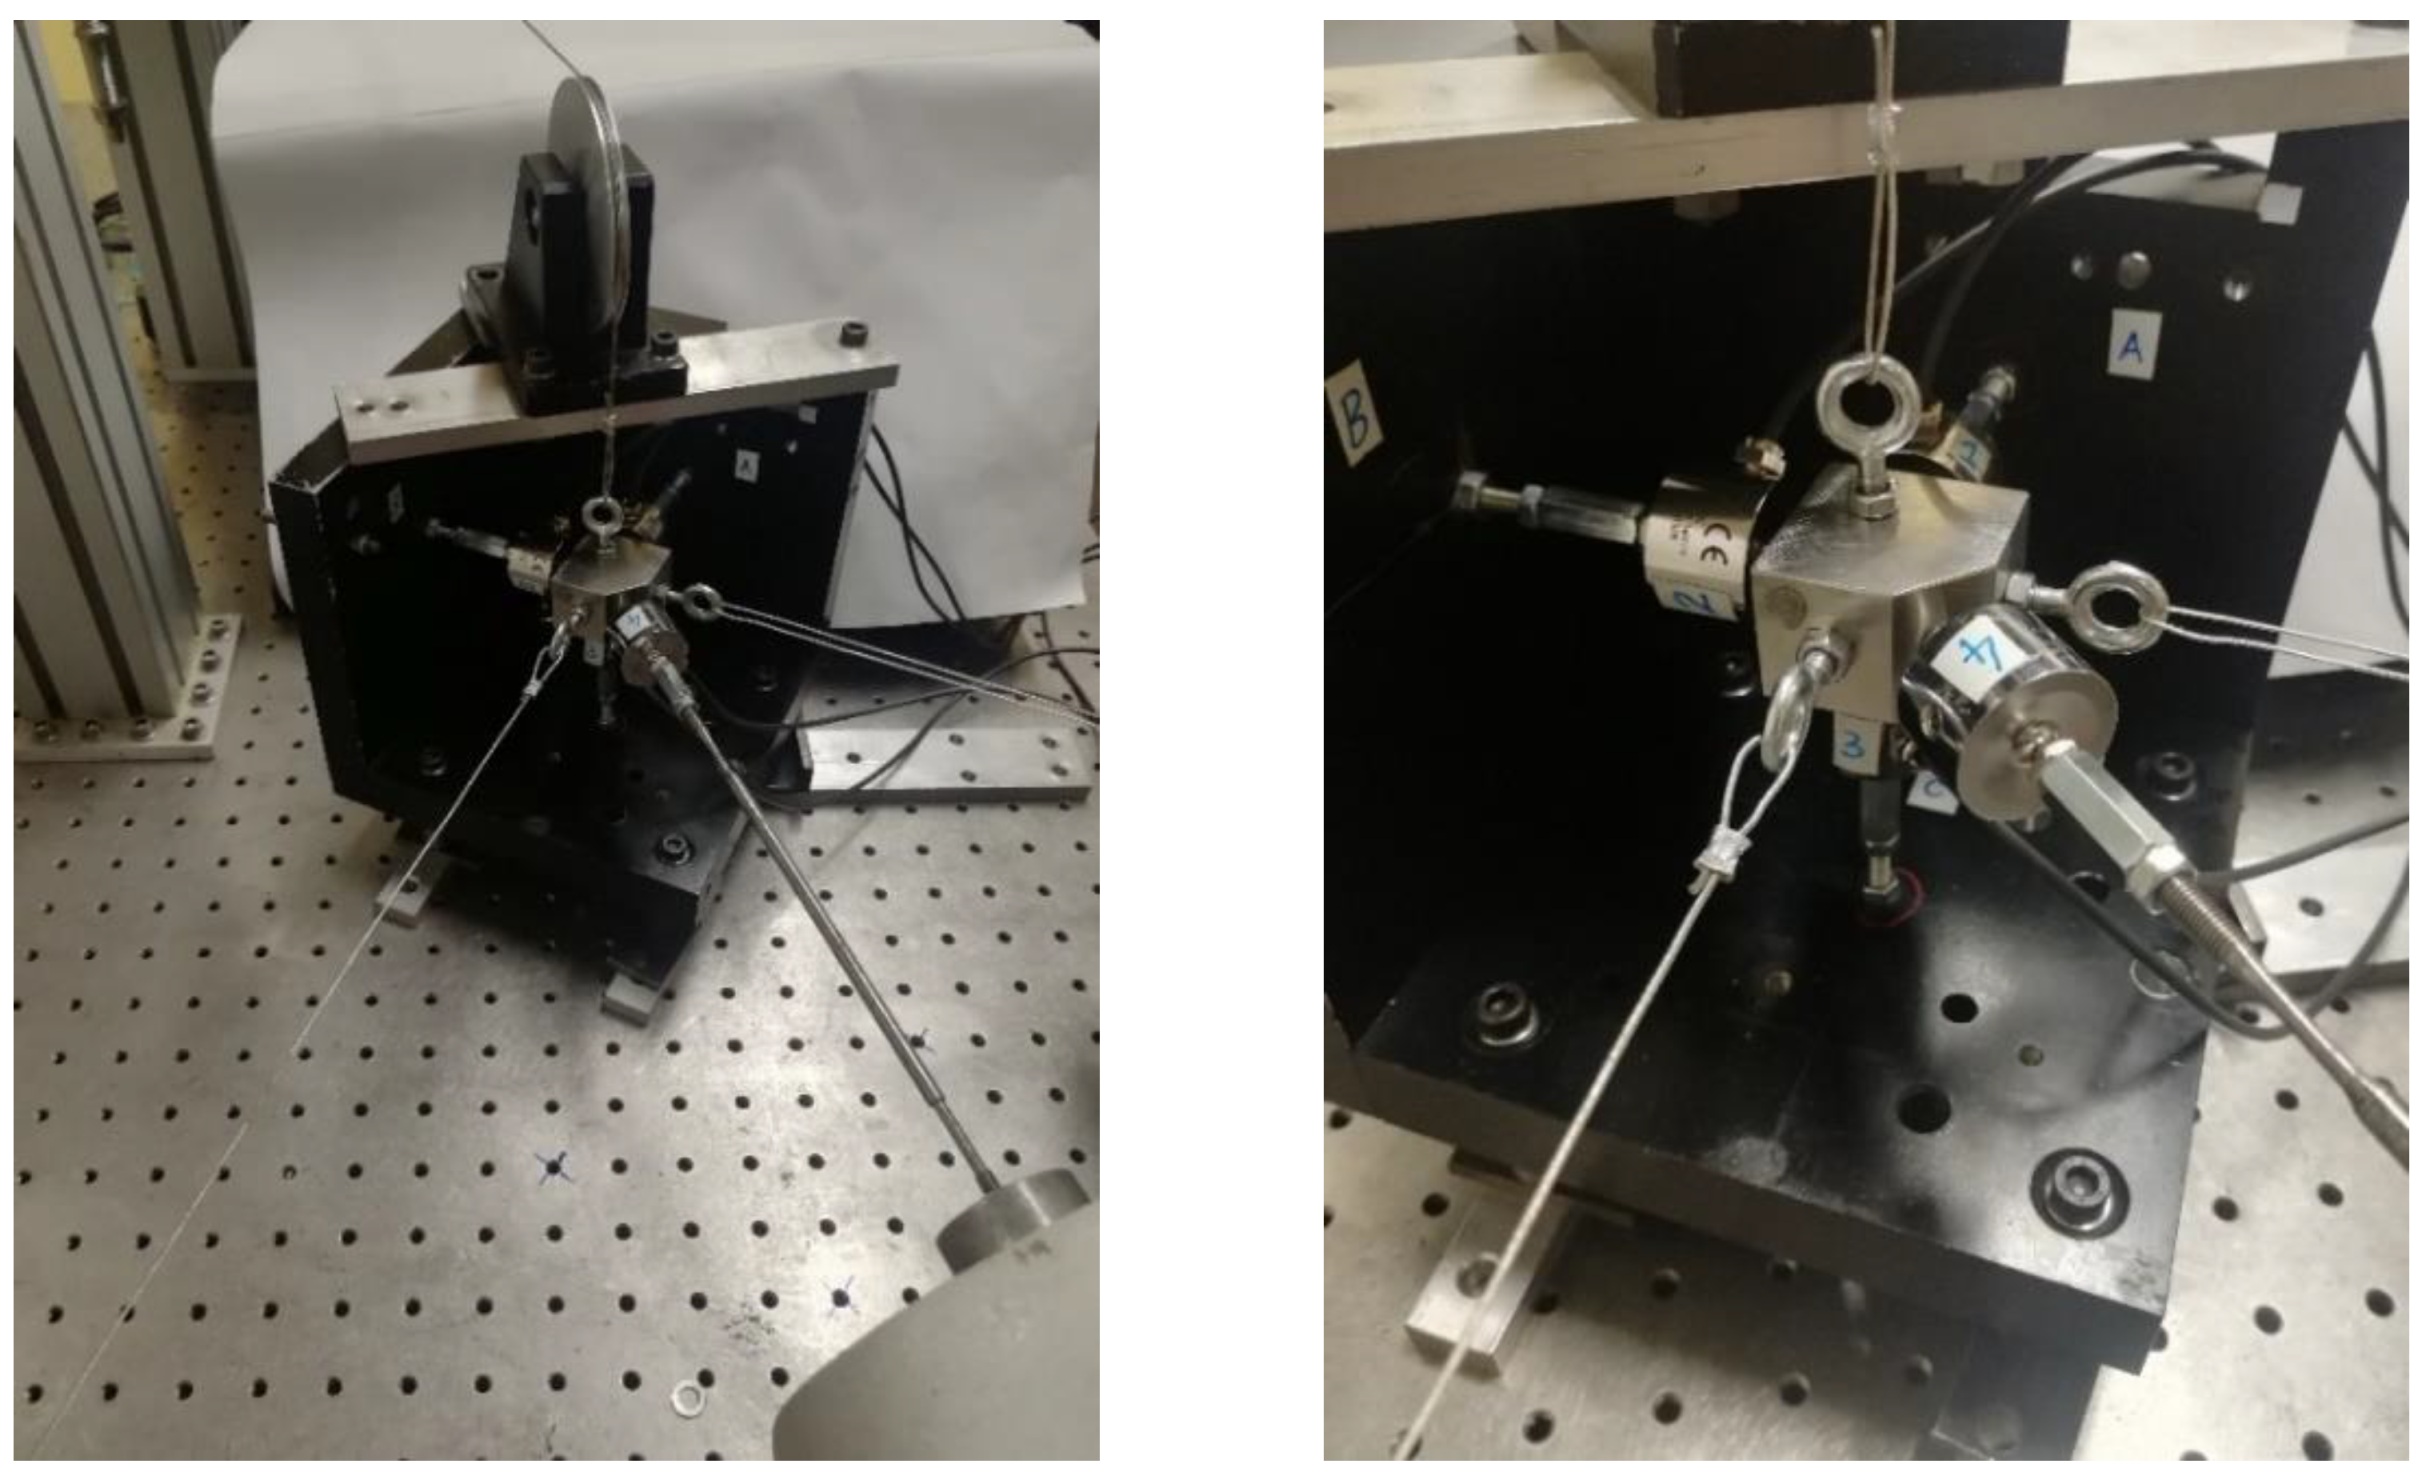
For the calibration of the force measurement system, the tripod sensor configuration was fitted on a two walled frame with bolted base, as shown in Figure 3a, with the following configuration: Sensor 1//x-axis, Sensor 2//y-axis, Sensor 3//z-axis). Each force sensor was connected to a cube instead of the contact reference block to be used in the proposed test rig. This was done in order to facilitate the application of forces in the axial direction of the sensors by using deadweights and wire-pulley systems during the calibration. The other end of the force sensor was screwed in collar link which was then connected to a wall. Two different types of collar links were used and tested (Figure 3b), i.e., locknut collar and necked collar, in order to assess their effect on the mechanical coupling of the three branches, and therefore on the measurement accuracy. The locknut collar link was assembled using a standard M5 bolt screwed in an extended locknut whereas the necked collar consisted of a slender section machined in cylinder attachment to cater for the lateral component of the force and allow bending.
3. Calibration
3.1. Calibration Setup and Procedure
In order to check the feasibility of the proposed measurement system, a classical calibration procedure was performed to assess the level of mechanical coupling between the three branches and to define a decoupling matrix to be used during the experiment to measure actual contact forces. For the calibration, three wire-pulley systems were setup to apply tensile forces in the axial direction of each sensor with the help of dead weights. The dead weights were suspended with wires over pulleys, connected to hooks that were fastened on the face of the cube opposite to the face where the force sensor was attached as seen in Figure 3a. The measurement setup consisted of HBM QuantumX MX410 measurement amplifier that was used with MX Assistant software to acquire and record force sensor output values. HBM QuantumX MX410 was used because it is a highly dynamic 4-channel data acquisition module that offers high precision with accuracy class of up to 0.05%, high resolution of up to 200 kS/s and noise suppression capabilities using the Bessel filter. The force measurements were acquired at the rate of 4800 Hz.
The calibration procedure involved sequential application of pure forces in the form of known loads in one direction at a time using a set of dead weights with no eccentricity. Before the loads were applied, all the force sensors were reset and zeroed after the mounting and assembly. The weights suspended using the wire-pulley systems, were then gradually increased with a fixed force interval from 0 to 100 N and sensor output values were recorded for each force sensor for each orthogonal direction. Only tensile forces were applied to each force sensor assuming linear behaviour in both the axial directions. The calibration procedure was carried out for the measurement system with locknut collar links and necked collar links alternatively. In order to investigate the repeatability of force measurement system, the calibration procedure was also repeated after disassembling and reassembling the calibration setup.
3.2. Calibration Matrix
It is expected that, due to the mechanical coupling between the three orthogonal branches, a linear relationship between the measured force values and the actual applied loads can be expressed as
where represents the 3 × 3 calibration matrix in this case and can be defined as follows:
where , and represent the force measured by Sensor 1, Sensor 2, and Sensor 3, respectively, when load i.e., , or was applied along the x-axis, y-axis, and z-axis, respectively. The columns of the calibration matrix were determined using the sensor output values recorded during the calibration procedure. In other words, when was applied the coefficients of the first column of were determined and so on for the remaining columns. The above mentioned calibration procedure was performed at multiple force levels obtaining a set of calibration matrices whose coefficients can be interpolated to determine the calibration matrix for a given load.
3.3. Calibration Results
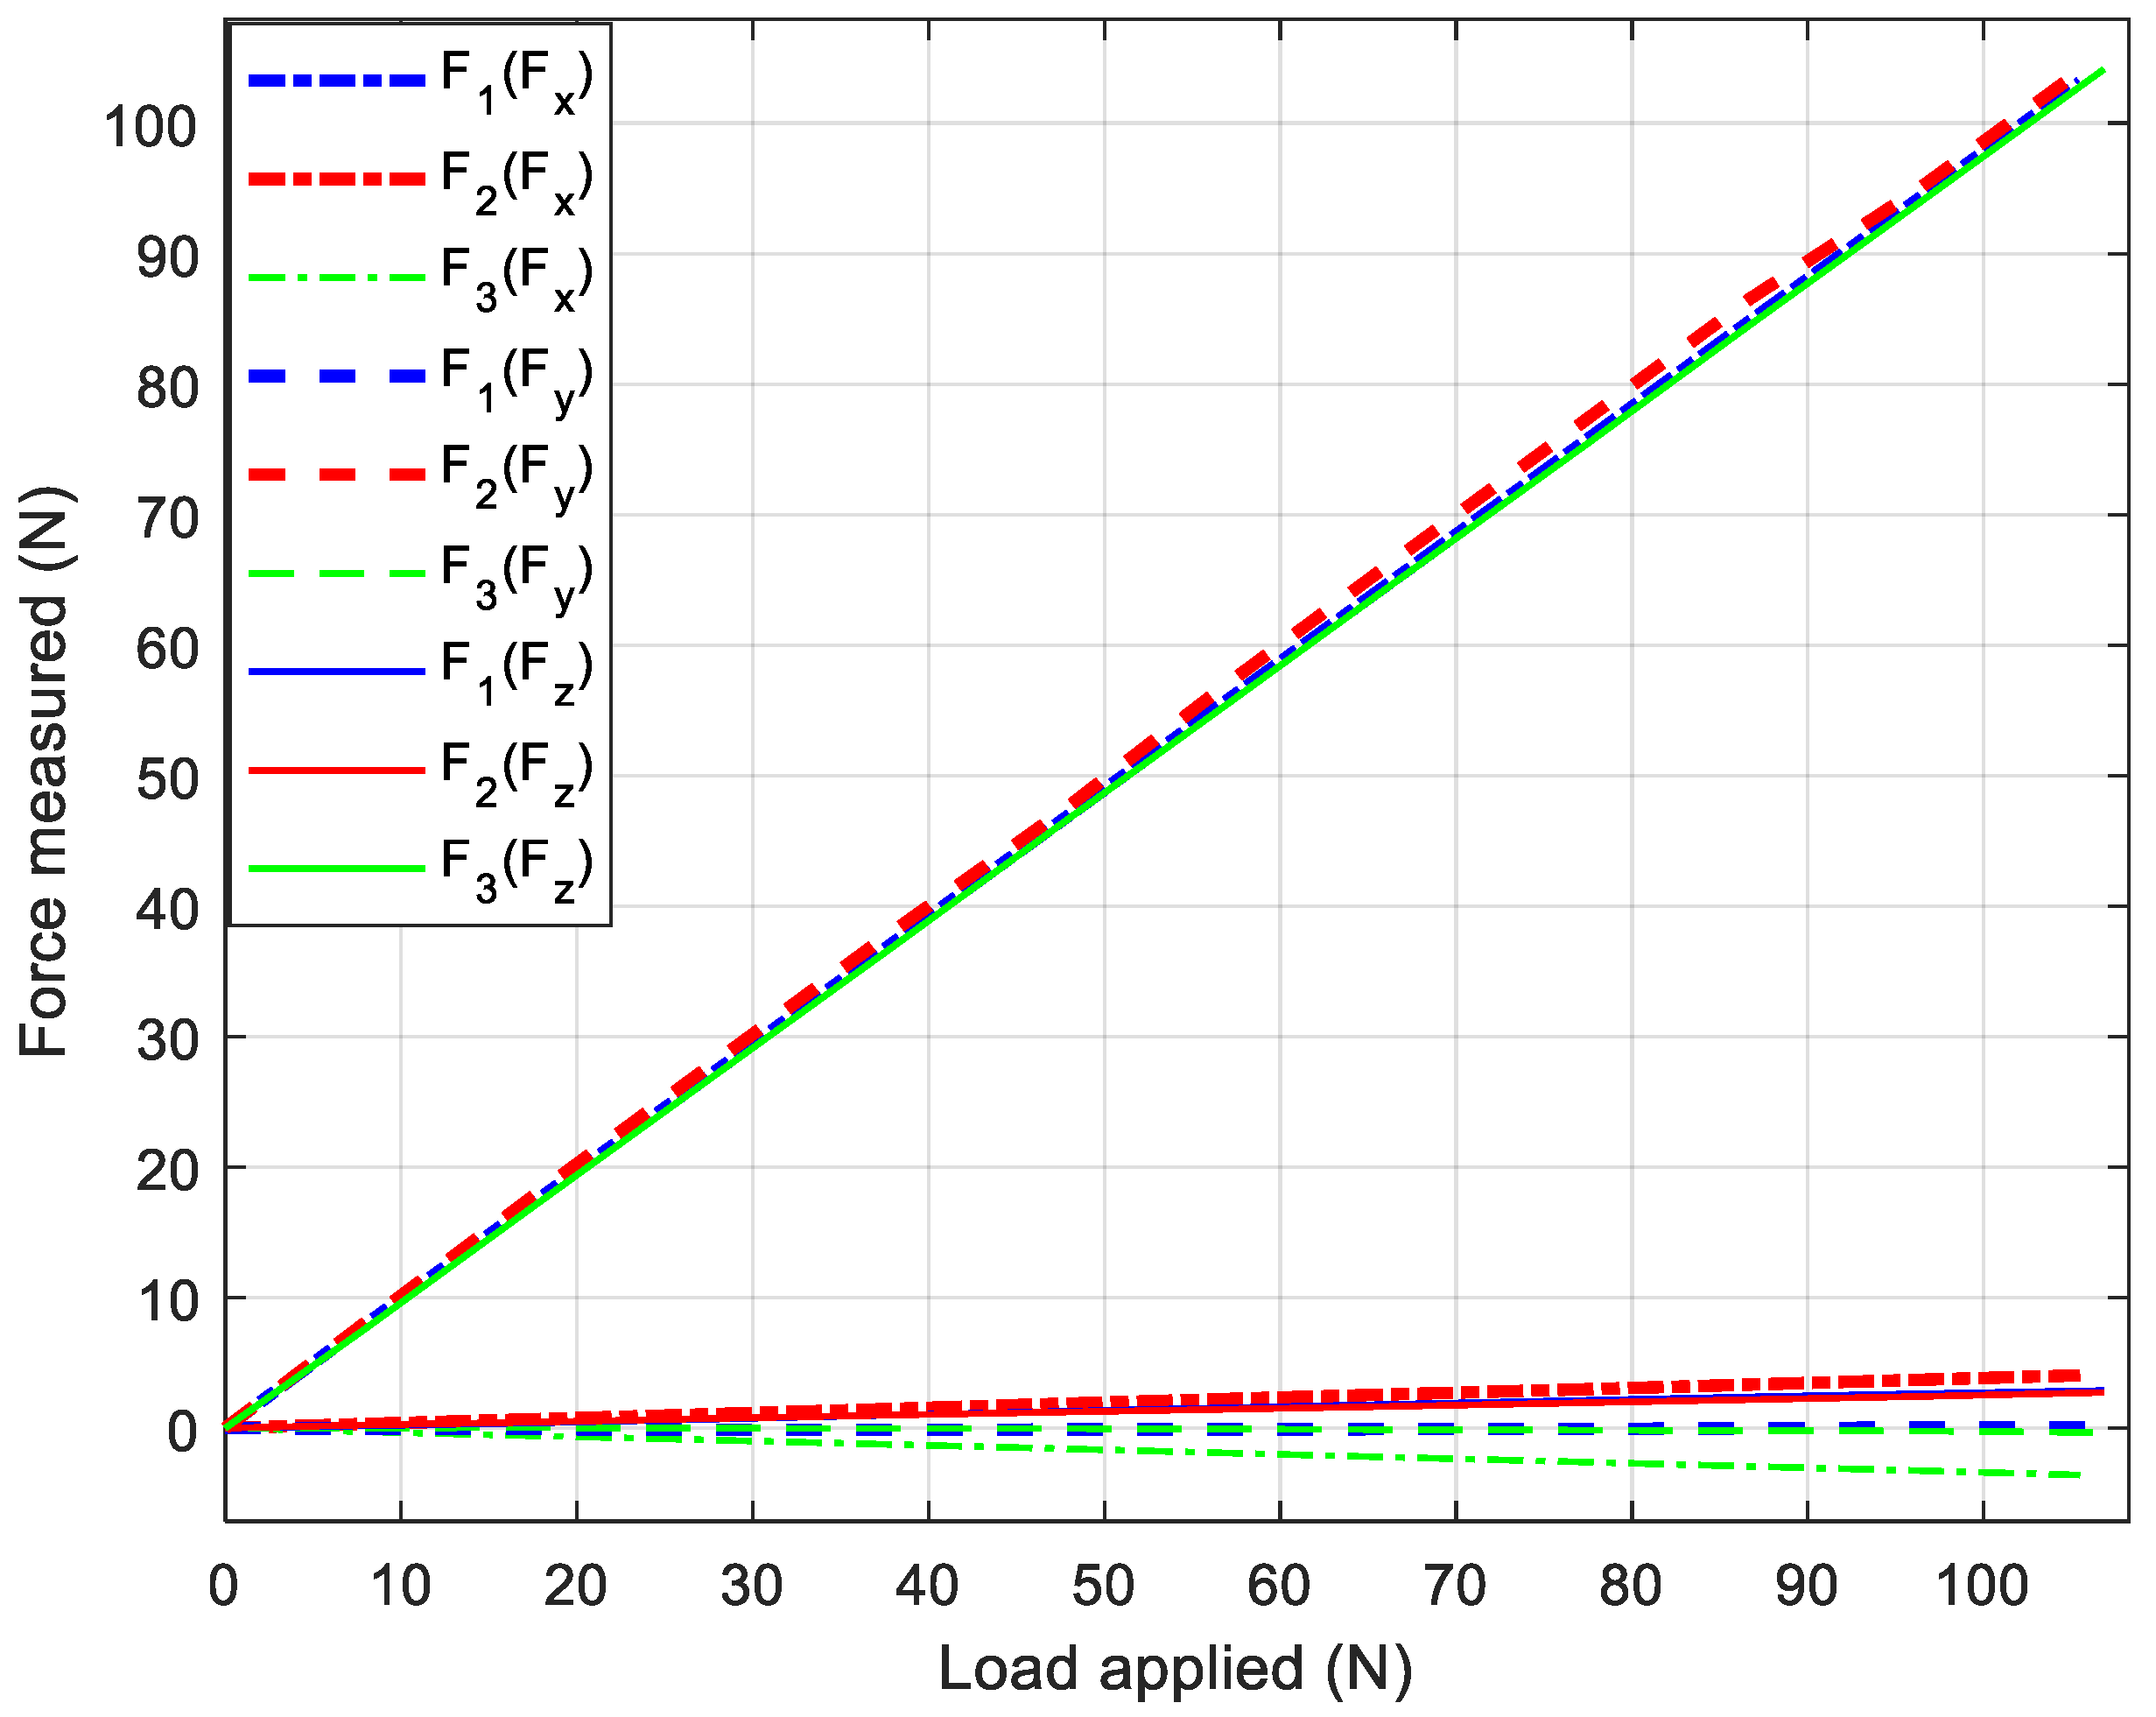
Results of calibration procedure exhibit a linear relationship between applied and measured loads, as shown in Figure 4 and Figure 5, that refer to locknut and necked collar links respectively. As summarized in Table 1, where the average normalized calibration matrices are shown with standard deviation stated in parenthesis, the mechanical coupling between the branches of the measurement system is very low (less than 4% in the worst case). In particular, the necked collar link, more flexible in the transverse direction than the locknut, shows better performances with a lower coupling. The standard deviation for measurements with necked collar link were lower as compared with the locknut collar link. In case of a perfect decoupling between the sensors, the matrices shown in Table 1, would be diagonal with 100% values along the main diagonal.
4. Static Loading Experiment
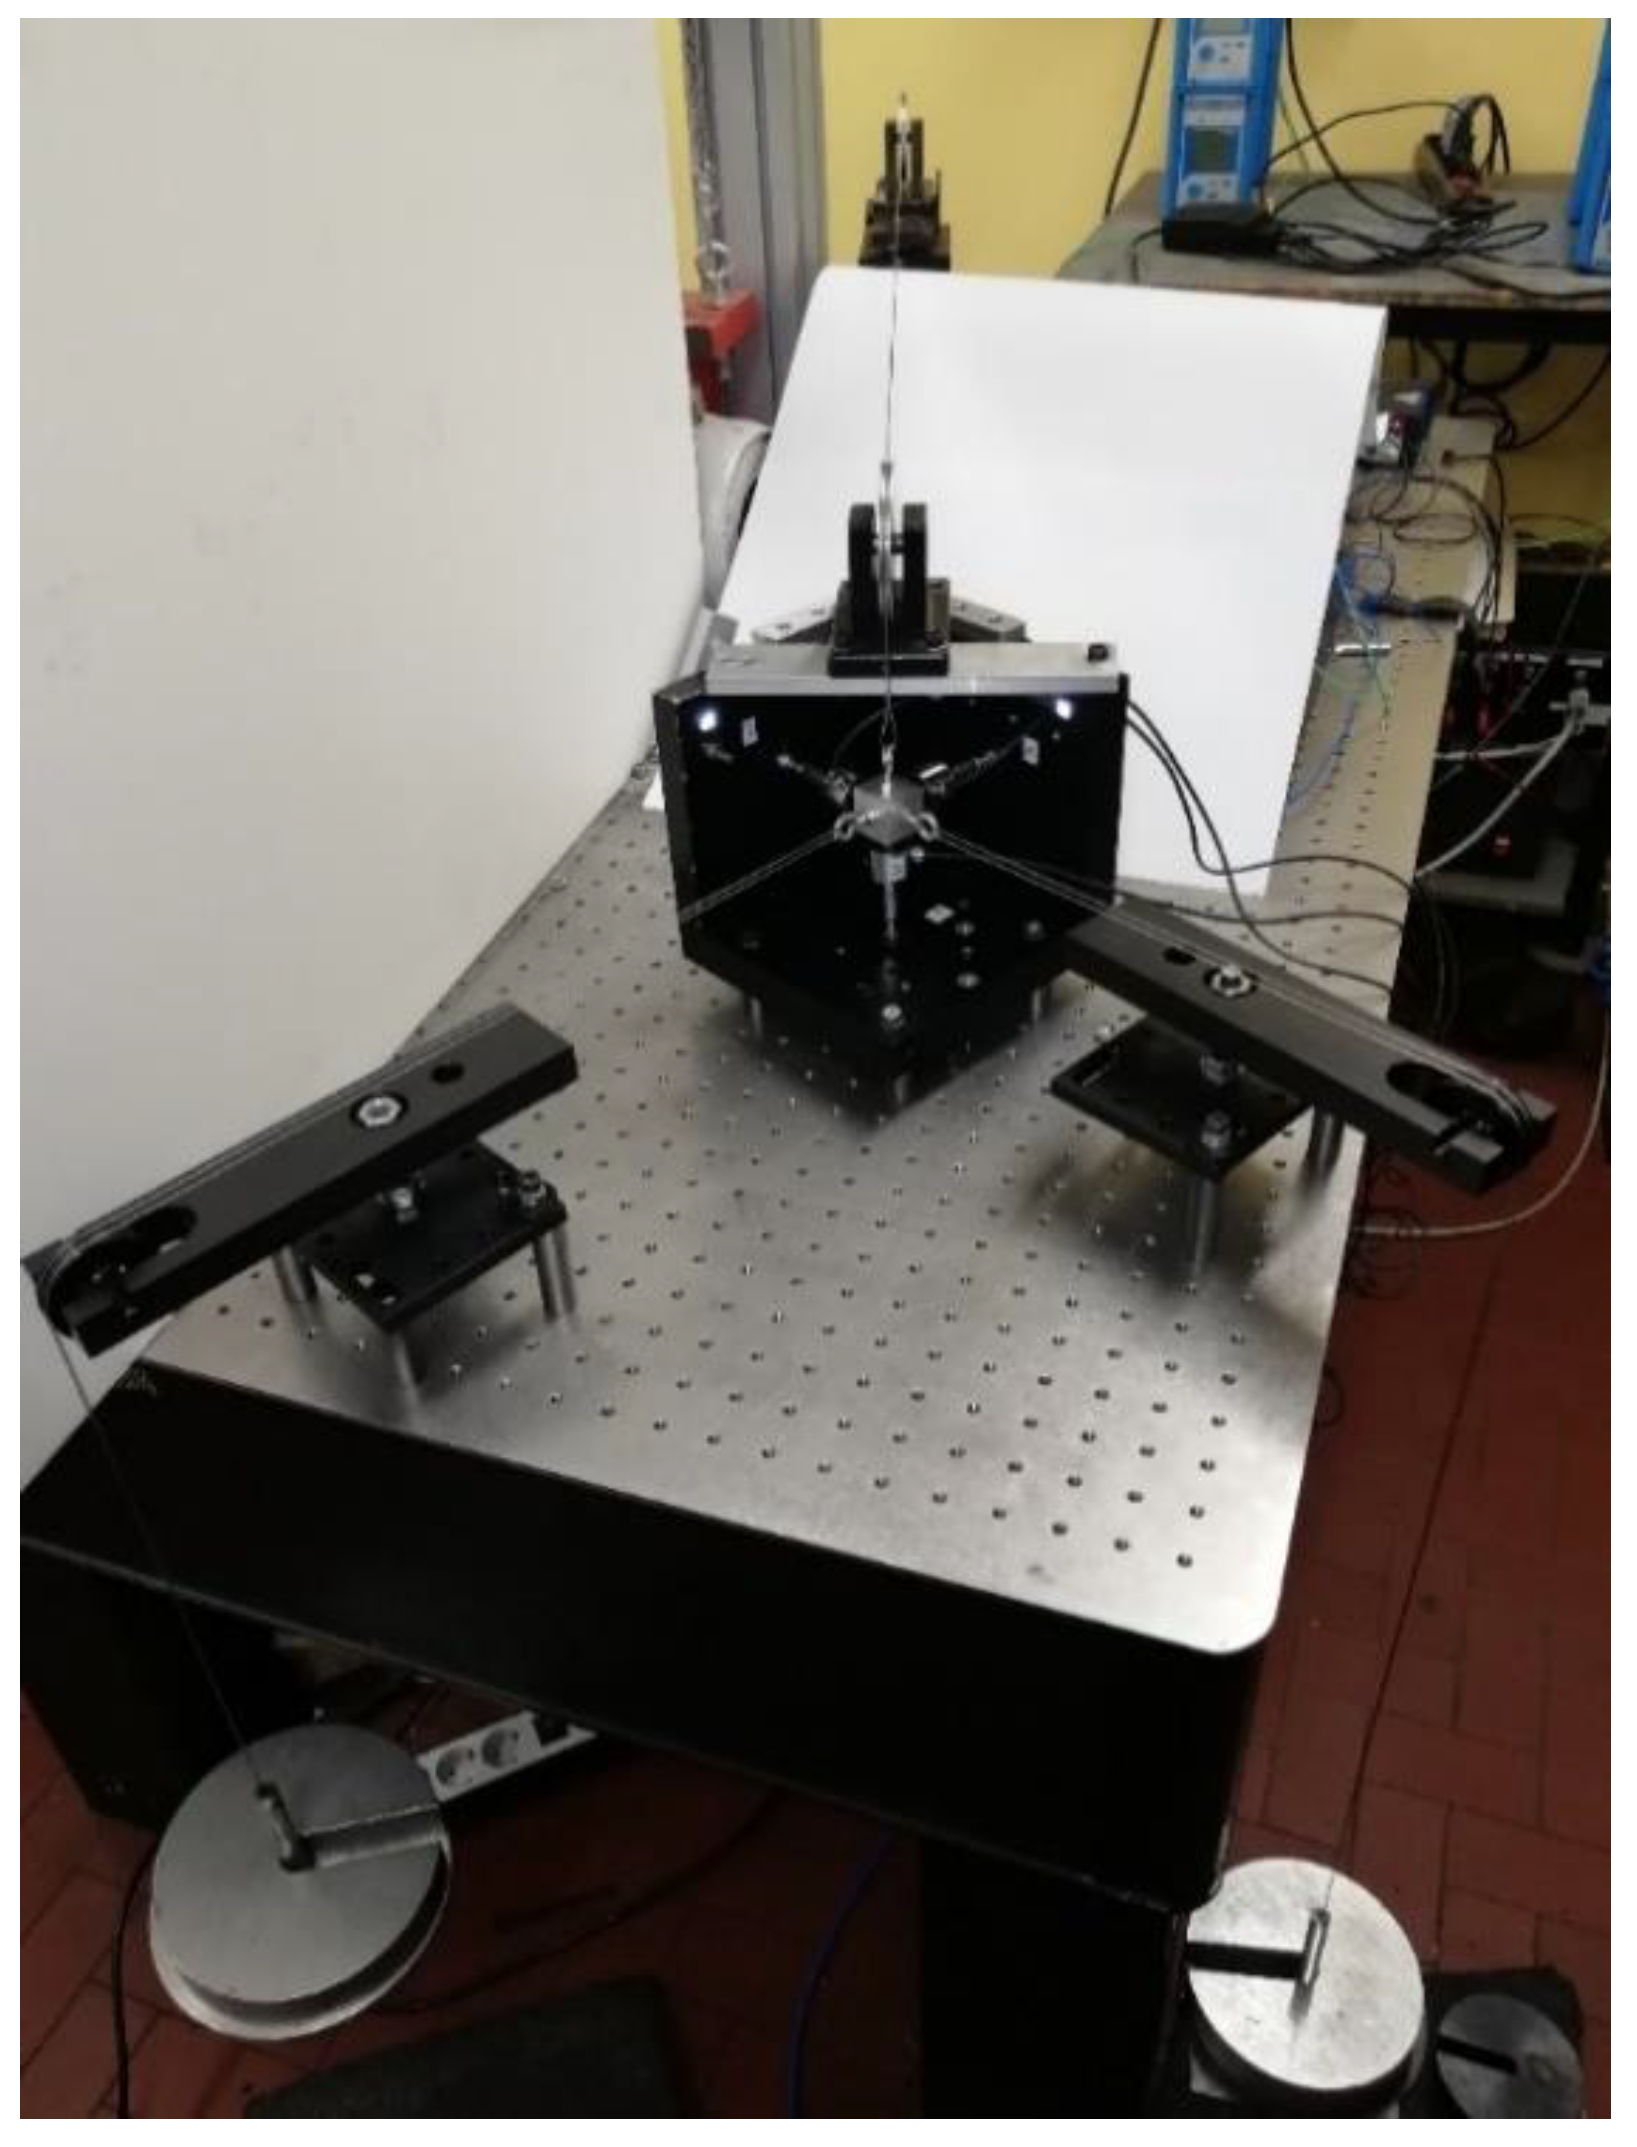
For the validation of the calibration process, the calibrated tri-directional force measurement system was appropriately loaded in three orthogonal directions simultaneously using the wire-pulley setups as seen in Figure 6. Several load cases consisting of different load combinations along x, y and z axis ( and ) were applied and the output force values read by sensors ( and ) were logged for each set of simultaneously applied loads. The calibrated tri directional force measurement system was zeroed before commencing the load cases to eliminate the possibility of any offset errors.
4.1. Decoupling Matrix
From Equation (1), the following expression was derived to compute the decoupled applied forces,
where the inverse of the calibration matrix forms representing the decoupling matrix. The decoupled applied forces for Sensor 1 along x-axis, Sensor 2 along y-axis and Sensor 3 along z-axis, respectively, were calculated by multiplying the decoupling matrix with the vector of measured force values for each case. Finally, these decoupled applied forces were compared with the actual applied forces for each sensor to validate the effectiveness of the calibration test and the decoupling matrix.
4.2. Results of the Static Loading Experiment
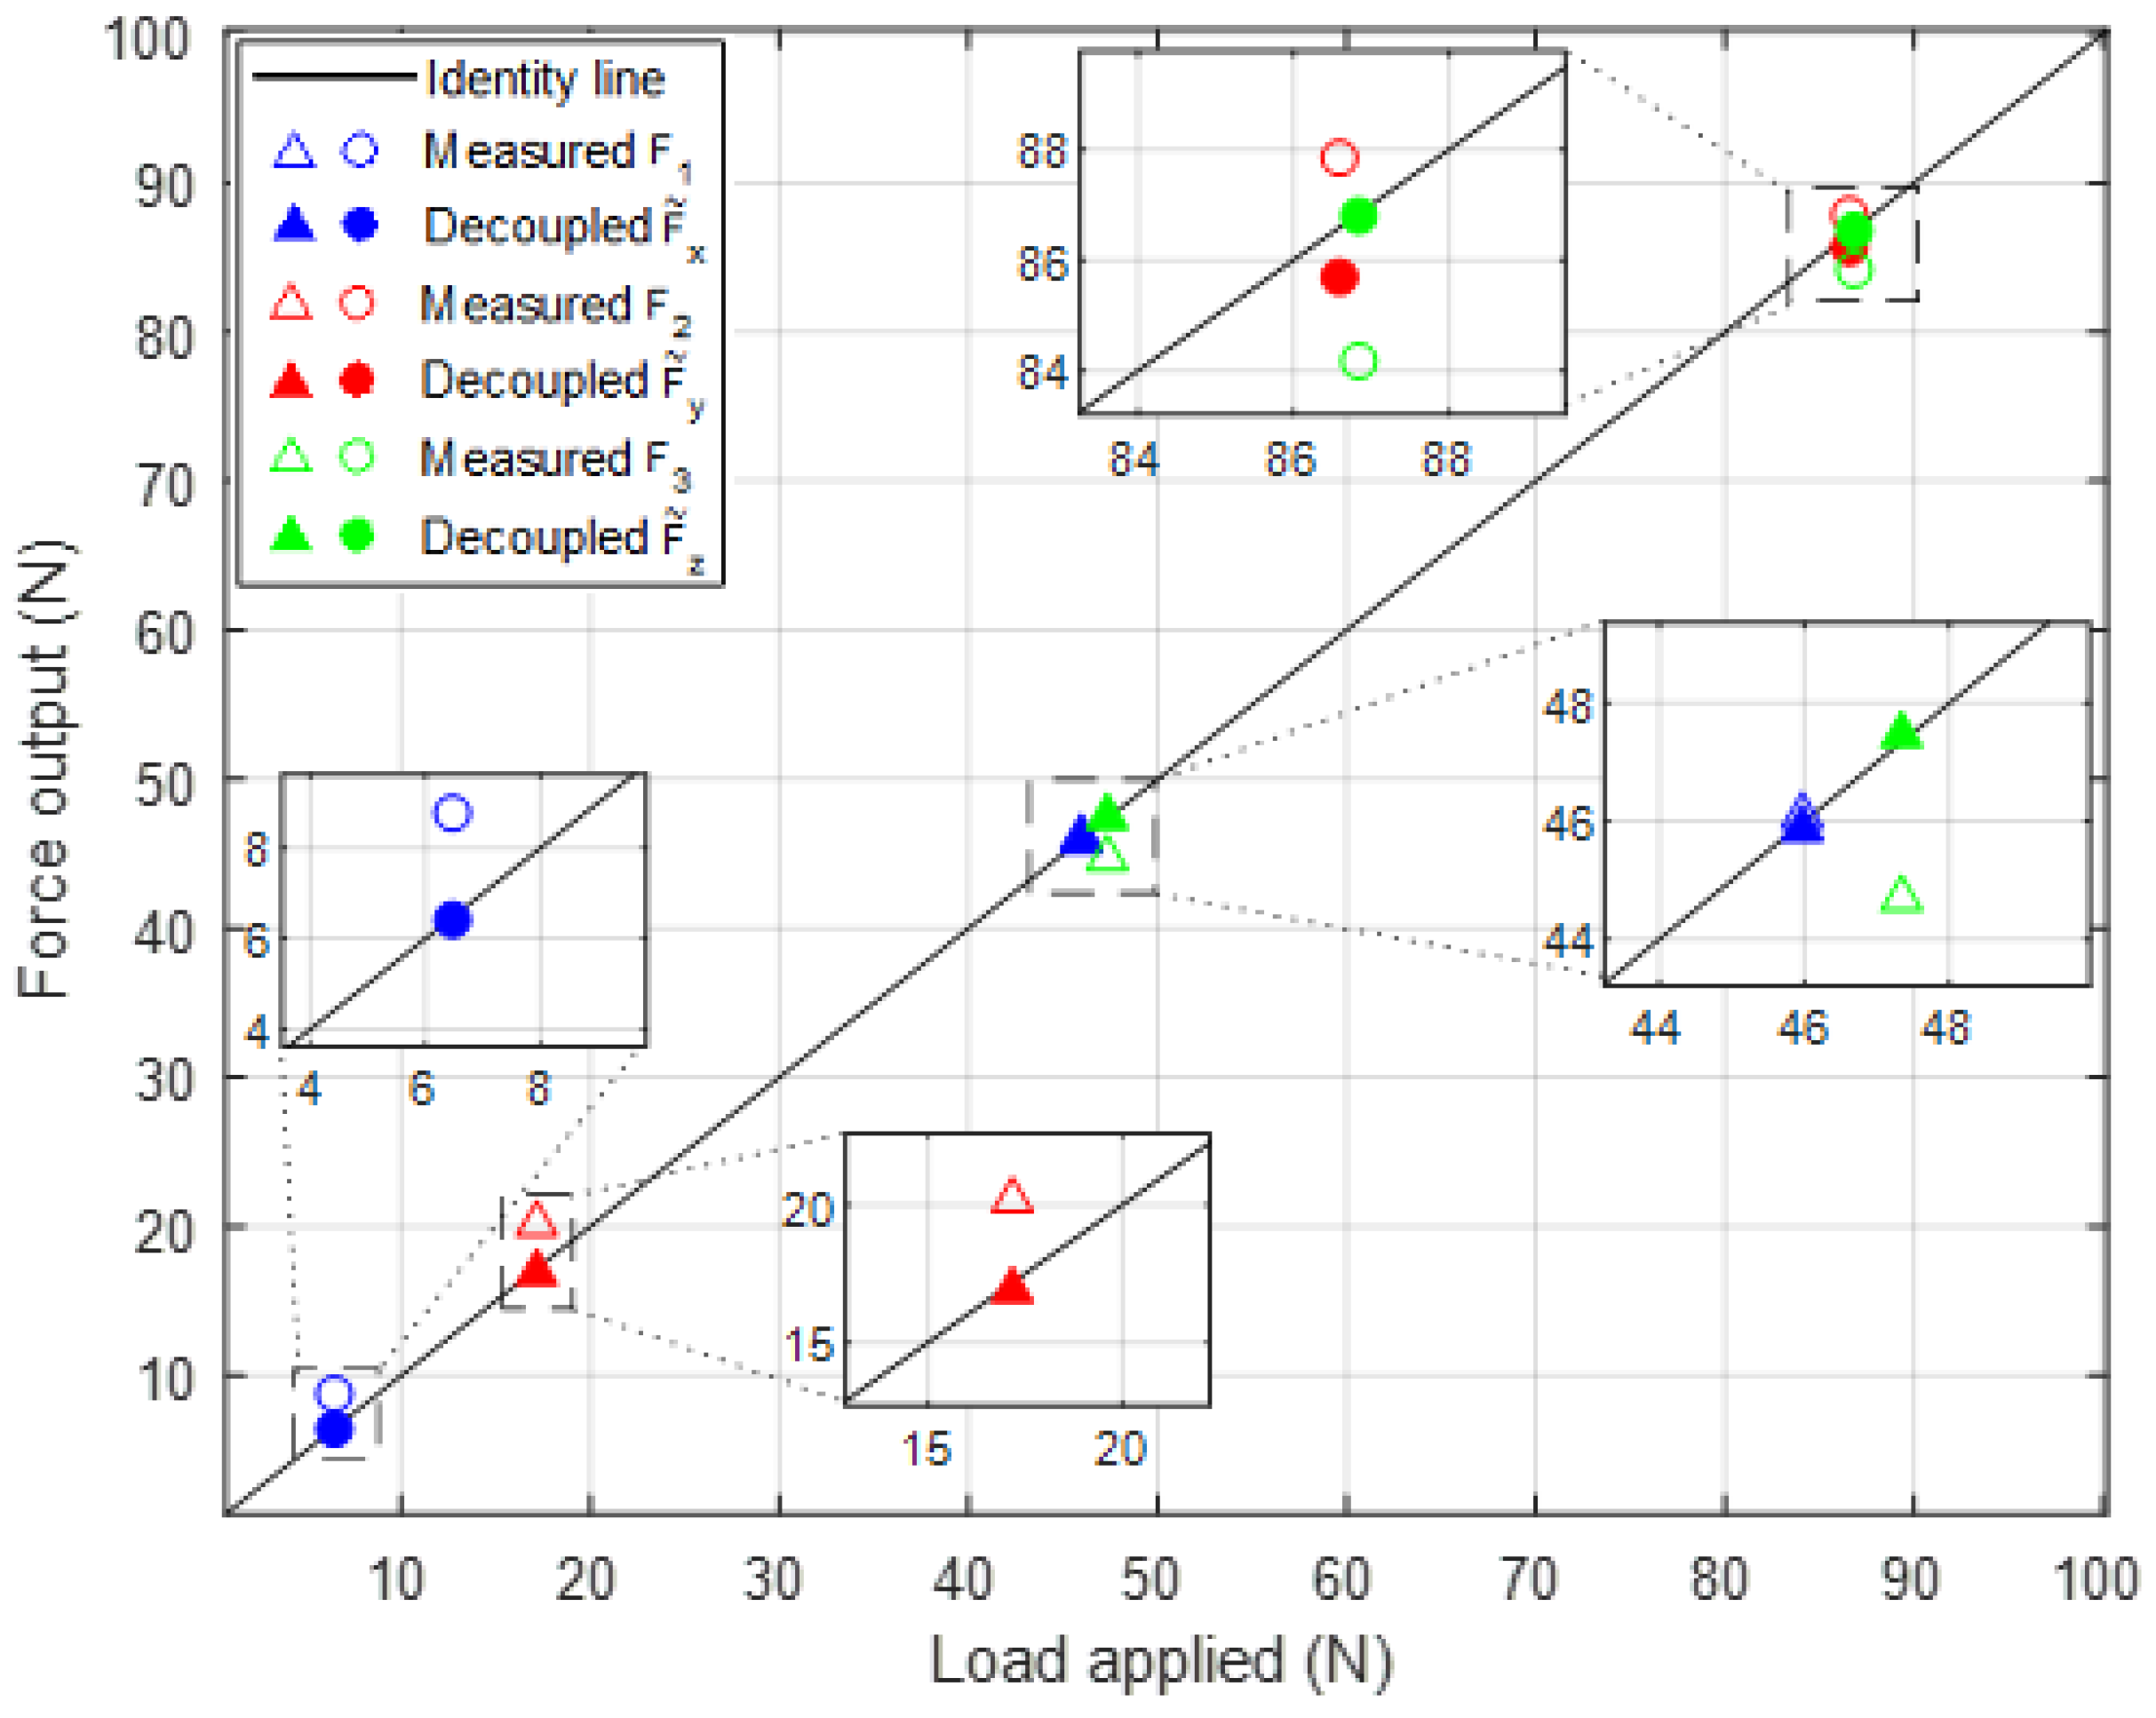
The results shown in Table 2 refer to two different load cases: Load case 1 ( = 6.47 N; = 86.59 N; = 86.84 N) and Load case 2 ( = 45.97 N; = 17.17 N; = 47.34 N). These load cases were selected since they showed the largest coupling errors that need to be recovered. In the two load cases, the measurement error is relevant with both the locknut and necked collar links if no decoupling is performed, while it decreases significantly (less than 2% in the worst case), after the application of the decoupling matrix, which is defined in Equation (2). On top of that, it is observed, as expected, that the maximum relative errors (35.52% and 17.33%) occur in the direction of the lowest force component (x in load case 1 and y in load case 2).
For the sake of comparison, the measured forces and the decoupled forces, obtained after application of Equation (2), are shown in Figure 7 (locknut collar link) and Figure 8 (necked collar link), where each point coordinates are the applied load (x-axis) and the measured force (y-axis). It is clear that full symbols, representing the decoupled forces, lie closer to the bi-sector line of the plot, demonstrating the need for a decoupling process of the measured quantities.
5. Dynamic Loading Experiment
5.1. Dynamic Loading Experiment Setup and Procedure
In the previous experiment, the calibrated force measurement system was subjected to static loading with the help of wire-pulley systems and dead weights. Since the system is envisaged to be employed for the measurement of periodic contact forces at blade shrouds, it was necessary to examine the behavior of the system with dynamic forces. In order to investigate the performance of the calibrated tri-directional force measurement system with dynamic loading, an experiment was devised to apply dynamic forces to two force sensors simultaneously while one force sensor was loaded statically.
This configuration (Figure 9) was designed to simulate the three directional contact forces typical of oscillating friction contacts, which includes a static normal preload and two oscillating tangential components. In order to accommodate an LDS V408 permanent magnet shaker driven through an LDS amplifier by LMS Testlab system, necessary to provide harmonic excitation, a new reference block with a 45°-chamfered edge has been designed. In order to measure the actual dynamics force provided by the shaker a 4th force sensor was placed between the shaker stinger and the chamfered block.
A static calibration of the modified force measurement system was also performed by means of the wire-pulley setups and a set of standard weights, generating a new set of calibration and decoupling matrices, as described in Section 3.
Before the dynamic tests, a preliminary experimental modal analysis of the assembly was performed with the aim of assessing the natural frequencies and the associated mode shapes of the system. In particular, the lower natural frequency of the system becomes a threshold frequency value, above which the inertia forces of the tripod itself would start affecting the contact force measurements, thus making the measurement system unreliable. As a consequence, a lower accuracy of the measurement system is expected when the excitation frequency exceeds that threshold value, which has to be experimentally identified in advance.
During the dynamic loading experiment, a controlled excitation force was applied in the (x,y) plane, while a static force was applied in the z direction. In case of a fully uncoupled measurement system, Sensors 1 and 2 would measure the two components of the oscillating force, also measured by Sensor 4, while Sensor 3 would measure the applied static force. Of course, due to the mechanical coupling, coupling errors actually occur and they were analyzed for each data set and consequently decoupled during the post-processing phase.
5.2. Results of the Dynamic Loading Experiment
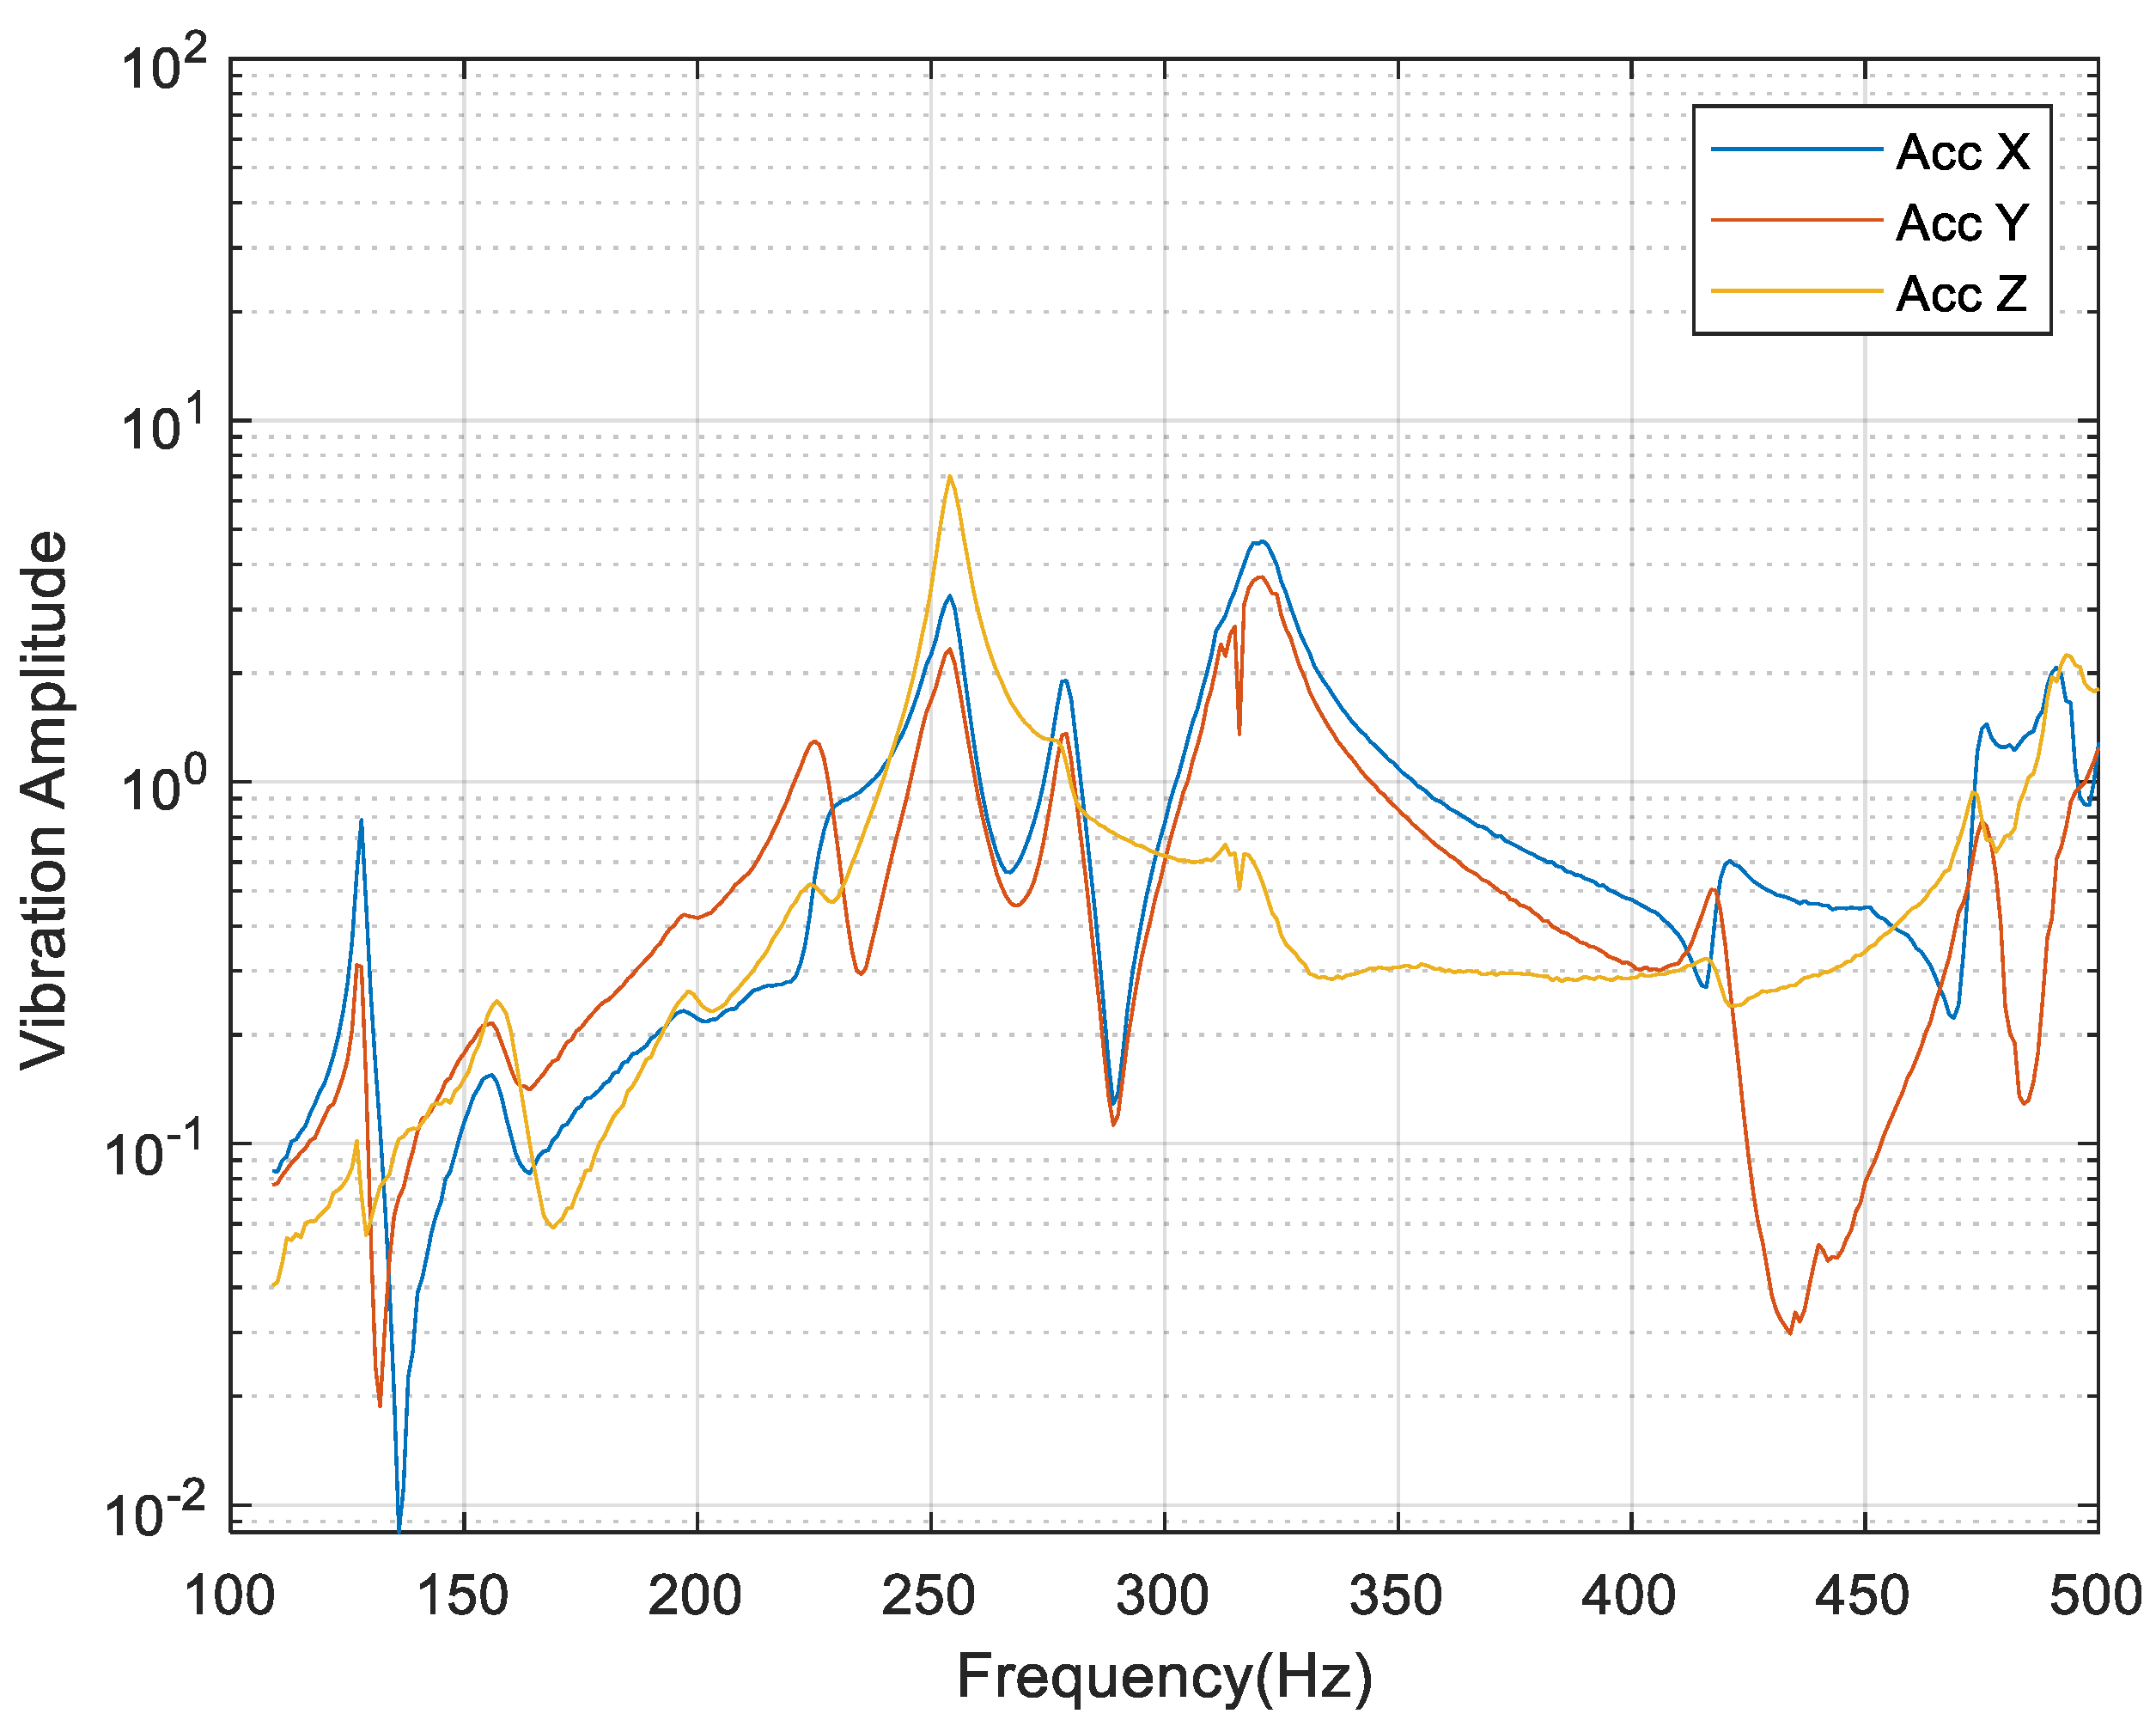
To identify the threshold frequency, a preliminary experimental modal testing was performed. Excitation was provided by the shaker, while response of the system was measured by three accelerometers placed on the chamfered block oriented along X, Y, and Z directions. Frequency Response Function (FRF) curves (Figure 10) were obtained to determine the natural frequencies of the measurement system and to determine the maximum allowable excitation frequency.
Based on the results in Figure 10, the first natural frequency of the system is around 130 Hz; as a consequence excitation frequencies of 100 Hz and 200 Hz were defined. At 100 Hz the system dynamics is not expected to affect the measurement accuracy, while at 200 Hz, significant periodic inertia forces of the system are expected.
After determining the natural frequencies of the setup, dynamic loading experiment was performed by simultaneous application of a harmonic force in the (x,y), while a static force was applied in the z direction. The mean absolute error of both measured and decoupled forces was computed over 100 cycles and results are shown in Table 3, at the two selected excitation frequencies and two different load cases.
Furthermore, in this case, the application of the decoupling method to the raw measurements generally improves the accuracy of the measurement. In detail, in the first load case, at both the excitation frequencies, a relative error reduction of 61% and 43% is observed, respectively, except for Sensor 1 at 200 Hz where a marginal increase (12%) is observed. A similar behavior is observed for the second load case, with a relative error reduction up to 84% and 47%, respectively. As expected, at 200 Hz the mean absolute error is larger than at 100 Hz for both the load cases.
A more detailed investigation about the effect of the excitation frequency on the measurement accuracy is shown in Figure 11, where the periodic measured and decoupled forces are plotted vs. the applied loads. The plots confirm the higher accuracy of the measurements at 100 Hz. It is worth noting that at 200 Hz, the decoupling method is not able to remove the artificial periodic component measured by Sensor 3.
Having ruled out the 200 Hz frequency, due to the inaccuracy of the resulting measurements, the effect of the force amplitude on the accuracy of the measurement was performed at 100 Hz only. Results in Table 4 show that the initial measurement error increases as the amplitude of the excitation forces increases. Nevertheless, the decoupling method stays effective for all the combination of external inputs tested in the experimental campaign.
6. Discussion of Results
Results of the calibration procedure showed the expected linear behavior of the force sensors that measured the applied axial forces with reasonable accuracy but it also showed coupling error in the unloaded sensor branches due to the mechanical coupling. Apart from the transmission of mechanical coupling, the error can also be attributed to the slight inaccuracy in positioning of the sensors during the assembly. Nevertheless, for necked collar links, the coupling error was observed to be slightly less as compared to the locknut collar links due to its geometry with slender section that allowed bending and acted as hinge. Repeatability test indicated that the disassembling and reassembling process affects the calibration matrix, which means that for accurate measurement, the calibration of the force measurement system will have to be performed once it is installed on the experimental test rig and will have to be repeated if the sensors are disassembled and reassembled.
Results of the simultaneous loading test yet again proved the existence of the coupling between the three branches. Coupling errors were found to be substantial after examining the force measured by each force sensor for each load case. However, it was observed once more that the coupling error for the necked collar link was less than that for the locknut collar. Alternatively, the decoupling matrix was used to compute the decoupled applied forces that considerably reduced the error percentage and were checked to be within 2% of the actual values. The decoupling method was marginally more effective for measurement system with necked collar links as compared with locknut collar links because of the relatively less coupling error in the first place.
The dynamic loading experiment demonstrated the ability of the measurement system to measure the dynamic forces. Generally, the three force sensors independently displayed good dynamic characteristics with fast response and with no delay. However, operating in the tripod configuration, dynamic errors were observed that can also be attributed to the mechanical coupling and to the slight misalignment during the assembly and during the loading of the third sensor. The decoupling method was effective in computing the decoupled forces from the measured dynamic forces irrespective of their amount. The mean absolute errors evaluated for the decoupled forces were fairly less as compared to the mean absolute errors calculated with the forces measured directly during the dynamic loading experiment. However, the performance of the tri-directional force measurement system was adversely affected when the excitation frequency was above the first natural frequency of the system. This factor limited the range of excitation frequency at which the force measurement system could be dynamically tested. Nevertheless, this is not a general threshold frequency of the force measurement system and it depends on the structure where the force measurement system is mounted. The study demonstrated that the proposed force measurement system was able to measure dynamic forces with good accuracy for excitation frequency less than the first natural frequency of the system. Therefore, it is mandatory to pre-determine the natural frequencies of the system on which the measurement system is mounted to avoid that the inertial forces of the system affect the measurement.
7. Conclusions
Experimental validation of numerical contact models, that are developed to predict the LPT blade response levels, is vital to accurately define the non-linear dynamic behavior of friction damping components. In case of shrouded blades, the need to measure the contact forces at the shroud contacts must be addressed during the experimental campaign. In this study, a tri-directional contact force measurement system consisting of three uniaxial force sensors arranged in a tripod configuration was developed. The following conclusions can be drawn:
- The proposed solution is cost effective and adaptable without any complex assembly and with a straightforward calibration procedure.
- Although a complete mechanically decoupled measurement system could not be fully achieved, good results were obtained by using the decoupling matrix of the calibrated system to compute the decoupled applied forces for the static as well as for dynamic forces.
- The tri-directional contact force measurement system investigated in this study can be effectively used to measure the actual three directional contact forces at blade shrouds, representing an improvement with respect to the existing contact force measurement systems currently limited to the uni- and bi-directional force measurements.
As a result, a better and detailed representation of the shroud contact parameters can be achieved, and a more reliable experimental validation of the contact models can be accomplished in future.
Author Contributions
Conceptualization and methodology, R.A., C.M.F., and S.Z.; investigation, R.A.; validation, R.A.; writing—original draft preparation, R.A.; writing—review and editing, C.M.F. and S.Z.; supervision, C.M.F. and S.Z.; funding acquisition, S.Z. All authors have read and agreed to the published version of the manuscript.
Funding
This research was funded by Aer-Mec Laboratory Research Group, DIMEAS, Politecnico di Torino.
Institutional Review Board Statement
Not applicable.
Informed Consent Statement
Not applicable.
Data Availability Statement
The data presented in this study are available on request from the corresponding author.
Conflicts of Interest
The authors declare no conflict of interest.
References
- Srinivasan, A.V. Flutter and Resonant Vibration Characteristics of Engine Blades. J. Eng. Gas Turbines Power 1997, 119, 742–775. [Google Scholar] [CrossRef]
- Griffin, J.H. A Review of Friction Damping of Turbine Blade Vibration. Int. J. Turbo Jet Engines 1990, 7, 297–308. [Google Scholar] [CrossRef]
- Yang, B.-D.; Menq, C.-H. Modeling of Friction Contact and Its Application to the Design of Shroud Contact. J. Eng. Gas Turbines Power 1997, 119, 958–963. [Google Scholar] [CrossRef]
- Sanliturk, K.Y.; Ewins, D.J. Modelling two-dimensional friction contact and its application using Harmonic balance method. J. Sound Vib. 1996, 193, 511–523. [Google Scholar] [CrossRef]
- Yang, B.D.; Chu, M.L.; Menq, C.H. Stick-slip-separation analysis and non-linear stiffness and damping characterization of friction contacts having variable normal load. J. Sound Vib. 1998, 210, 461–481. [Google Scholar] [CrossRef]
- Yang, B.D.; Menq, C.H. Characterization of 3D contact kinematics and prediction of resonant response of structures having 3D frictional constraint. J. Sound Vib. 1998, 217, 909–925. [Google Scholar] [CrossRef]
- Sextro, W. The calculation of the forced response of shrouded blades with friction contacts and its experimental verification. In Proceedings of the ASME Turbo Expo 2000: Power for Land, Sea, and Air, Munich, Germany, 8–11 May 2000; Volume 4, pp. 1–8. [Google Scholar] [CrossRef]
- D’Ambrosio, F.; Chatelet, E.; Ravoux, J.; Jacquet-Richardet, G. Forced response of shrouded bladed disc assemblies: A jointed experimental numerical approach. In Proceedings of the ASME Turbo Expo 2004: Power for Land, Sea, and Air, Vienna, Austria, 14–17 June 2004; Volume 6, pp. 337–347. [Google Scholar] [CrossRef]
- Jie, H.; Dayi, Z.; Yajie, S.; Zigen, Z. Experimental study of damping characteristic of shrouded blade. In Proceedings of the ASME Turbo Expo 2007: Power for Land, Sea, and Air, Montreal, QC, Canada, 14–17 May 2007; Volume 5, pp. 485–491. [Google Scholar] [CrossRef]
- Pešek, L.; Hajžman, M.; Půst, L.; Zeman, V.; Byrtus, M.; Brůha, J. Experimental and numerical investigation of friction element dissipative effects in blade shrouding. Nonlinear Dyn. 2014, 79, 1711–1726. [Google Scholar] [CrossRef]
- Kaptan, F.; Panning-von Scheidt, L.; Wallaschek, J. Numerical and Experimental Study of Shrouded Blade Dynamics Considering Variable Operating Points. In Proceedings of the ASME Turbo Expo 2018: Turbomachinery Technical Conference and Exposition, Oslo, Norway, 11–15 June 2018; Volume 7C, pp. 1–12. [Google Scholar]
- Savchenko, K.; Zinkovskii, A.; Tokar, I. Determination of contact interaction influence on forced vibrations of shrouded blades. In Proceedings of the 25th International Congress on Sound and Vibration. Sound of Peace Bell, Hiroshima, Japan, 8–12 July 2018; Volume 5, pp. 2635–2640. [Google Scholar]
- Cui, C.; Ma, H.; Jin, Y.; Xie, F.; Yang, T.; Liu, S. Numerical and experimental investigation on the vibro-impact responses analysis of shrouded blade. J. Low Freq. Noise Vib. Act. Control 2019, 38, 1188–1201. [Google Scholar] [CrossRef] [Green Version]
- Schwingshackl, C.W.; Petrov, E.P.; Ewins, D.J. Validation of Test Rig Measurements and Prediction Tools for Friction Interface Modelling. In Proceedings of the ASME Turbo Expo 2010: Power for Land, Sea, and Air, Glasgow, UK, 14–18 June 2010; Volume 6, pp. 1015–1024. [Google Scholar]
- Tamai, R.; Tanaka, R.; Sato, Y.; Kusterer, K.; Lin, G.; Kemper, M.; Panning-Von Scheidt, L. Vibration analysis of shrouded turbine blades for a 30 MW gas turbine. In Proceedings of the ASME 2013 Turbine Blade Tip Symposium and Course Week TBTS 2013, Hamburg, Germany, 30 September–3 October 2013; American Society of Mechanical Engineers Digital Collection: New York, NY, USA, 2013. [Google Scholar] [CrossRef]
- Filippi, S.; Akay, A.; Gola, M.M. Measurement of tangential contact hysteresis during microslip. J. Tribol. 2004, 126, 482–489. [Google Scholar] [CrossRef]
- Lavella, M.; Botto, D.; Gola, M.M. Test rig for wear and contact parameters extraction for flat-on-flat contact surfaces. In Proceedings of the ASME/STLE 2011 International Joint Tribology Conference, Los Angeles, CA, USA, 24–26 October 2011; pp. 307–309. [Google Scholar] [CrossRef]
- Asai, K.; Gola, M.M. Experimental Verification of Friction Behaviors under Periodically-Varied Normal Force by Developing a Two-Directional Friction Test System. In Proceedings of the ASME Turbo Expo 2015: Turbine Technical Conference and Exposition, Montreal, QC, Canada, 15–19 June 2015; Volume 7B. [Google Scholar]
- Botto, D.; Umer, M. A novel test rig to investigate under-platform damper dynamics. Mech. Syst. Signal Process. 2018, 100, 344–359. [Google Scholar] [CrossRef]
- Templeman, J.O.; Sheil, B.B.; Sun, T. Multi-axis force sensors: A state-of-the-art review. Sens. Actuators A Phys. 2020, 304, 111772. [Google Scholar] [CrossRef]
- Krouglicof, N.; Alonso, L.M.; Keat, W.D. Development of a mechanically coupled, six degree-of-freedom load platform for biomechanics and sports medicine. In Proceedings of the 2004 IEEE International Conference on Systems, Man and Cybernetics, The Hague, The Netherlands, 10–13 October 2004; Volume 5, pp. 4426–4431. [Google Scholar] [CrossRef]
- Beccai, L.; Roccella, S.; Arena, A.; Valvo, F.; Valdastri, P.; Menciassi, A.; Carrozza, M.C.; Dario, P. Design and fabrication of a hybrid silicon three-axial force sensor for biomechanical applications. Sens. Actuators A Phys. 2005, 120, 370–382. [Google Scholar] [CrossRef]
- Vázsonyi, É.; Ádám, M.; Dücs, C.; Vízváry, Z.; Tóth, A.L.; Bársony, I. Three-dimensional force sensor by novel alkaline etching technique. Sens. Actuators A Phys. 2005, 123–124, 620–626. [Google Scholar] [CrossRef]
- Oddo, C.M.; Valdastri, P.; Beccai, L.; Roccella, S.; Carrozza, M.C.; Dario, P. Investigation on calibration methods for multi-axis, linear and redundant force sensors. Meas. Sci. Technol. 2007, 18, 623–631. [Google Scholar] [CrossRef]
- Song, A.; Wu, J.; Qin, G.; Huang, W. A novel self-decoupled four degree-of-freedom wrist force/torque sensor. Meas. J. Int. Meas. Confed. 2007, 40, 883–891. [Google Scholar] [CrossRef]
- Fontana, M.; Marcheschi, S.; Salsedo, F.; Bergamasco, M. A three-axis force sensor for dual finger haptic interfaces. Sensors 2012, 12, 13598–13616. [Google Scholar] [CrossRef] [Green Version]
- Zhao, Y.; Jiao, L.; Weng, D.; Zhang, D.; Zheng, R. Decoupling principle analysis and development of a parallel three-dimensional force sensor. Sensors 2016, 16, 1506. [Google Scholar] [CrossRef] [Green Version]
- Mencattelli, M.; Donati, E.; Cultrone, M.; Stefanini, C. Novel universal system for 3-dimensional orthodontic force-moment measurements and its clinical use. Am. J. Orthod. Dentofac. Orthop. 2015, 148, 174–183. [Google Scholar] [CrossRef]
- Shimachi, S.; Kameyama, F.; Hakozaki, Y.; Fujiwara, Y. Contact force measurement of instruments for force-feedback on a surgical robot: Acceleration force cancellations based on acceleration sensor readings. In International Conference on Medical Image Computing and Computer-Assisted Intervention; Springer: Berlin/Heidelberg, Germany, 2005; Volume 3750, pp. 97–104. [Google Scholar] [CrossRef] [Green Version]
- Lee, H.K.; Chung, J.; Chang, S., II; Yoon, E. Real-time measurement of the three-axis contact force distribution using a flexible capacitive polymer tactile sensor. J. Micromech. Microeng. 2011, 21. [Google Scholar] [CrossRef] [Green Version]
- Yu, P.; Liu, W.; Gu, C.; Cheng, X.; Fu, X. Flexible piezoelectric tactile sensor array for dynamic three-axis force measurement. Sensors 2016, 16, 819. [Google Scholar] [CrossRef] [Green Version]
- Van Zoest, G.G.J.M.; Van den Berg, H.T.C.M.; Holtkamp, F.C. Three-dimensionality of contact forces during clinical manual examination and treatment: A new measuring system. Clin. Biomech. 2002, 17, 719–722. [Google Scholar] [CrossRef] [Green Version]
- Moriyasu, K.; Nishiwaki, T.; Yamaguchi, T.; Hokkirigawa, K. New technique of three directional ground reaction force distributions. Footwear Sci. 2010, 2, 57–64. [Google Scholar] [CrossRef]
- Liu, T.; Inoue, Y.; Shibata, K.; Hirota, Y.; Shiojima, K. A mobile force plate system and its application to quantitative evaluation of normal and pathological gait. In Proceedings of the 2010 IEEE/ASME International Conference on Advanced Intelligent Mechatronics, Montreal, QC, Canada, 6–9 July 2010; pp. 272–277. [Google Scholar] [CrossRef]
Figure 1.
Shrouded blades (left) and the shroud contact surfaces (right).

Figure 2.
Blade shrouds in contact with force measurement system in the proposed test rig.

Figure 3.
(a) Force sensors in tripod configuration, (b) Locknut Collar (above) and Necked collar (below).
Figure 3.
(a) Force sensors in tripod configuration, (b) Locknut Collar (above) and Necked collar (below).

Figure 4.
Calibration plot for system with locknut collars.

Figure 5.
Calibration plot for system with necked collars.

Figure 6.
Simultaneous application of static loads in three orthogonal directions.

Figure 7.
Decoupling method applied to locknut collar links (Load case 1: Circles; Load case 2: Triangles).
Figure 7.
Decoupling method applied to locknut collar links (Load case 1: Circles; Load case 2: Triangles).

Figure 8.
Decoupling method applied to necked collar links (Load case 1: Circles; Load case 2: Triangles).
Figure 8.
Decoupling method applied to necked collar links (Load case 1: Circles; Load case 2: Triangles).

Figure 9.
Modified experimental setup for dynamic loading with chamfered block and shaker.

Figure 10.
Frequency Response Function (FRF) plot of the tri-directional force measurement calibration setup.
Figure 10.
Frequency Response Function (FRF) plot of the tri-directional force measurement calibration setup.

Figure 11.
Decoupling method applied in dynamic loading experiment at (a) 100 Hz and (b) 200 Hz.


Table 1.
Calibration matrices indicating distribution of loads applied in the directions x, y, and z onto sensors 1, 2, and 3. Locknut collar and necked collar cases.
Table 1.
Calibration matrices indicating distribution of loads applied in the directions x, y, and z onto sensors 1, 2, and 3. Locknut collar and necked collar cases.
| Averaged Percentage—% (Standard Deviation) | Applied Loads | |||
|---|---|---|---|---|
| Lock Nut Collar Link | ||||
| Measured Force Outputs (%) | 98.12 (0.61) | 0.17 (0.17) | 2.61 (0.2) | |
| 3.89 (0.065) | 99.89 (0.91) | 2.60 (0.15) | ||
| −3.36 (0.053) | 0.12 (0.15) | 97.16 (0.55) | ||
| Averaged Percentage—% (Standard Deviation) | Applied Loads | |||
| Necked Collar Link | ||||
| Measured Force Outputs (%) | 99.51 (0.23) | −0.34 (0.065) | −0.50 (0.28) | |
| 1.98 (0.26) | 98.76 (0.47) | 2.08 (0.34) | ||
| −3.34 (0.10) | 0.11 (0.13) | 99.00 (0.12) | ||
Table 2.
Percentage error of the measured forces and decoupled forces for simultaneous loading experiment.
Table 2.
Percentage error of the measured forces and decoupled forces for simultaneous loading experiment.
| Percentage Error | Measured Force Outputs (%) | Decoupled Applied Forces (%) | ||||
|---|---|---|---|---|---|---|
| Lock Nut Collar Link | ||||||
| Load Case 1 | 35.52 | 1.45 | −3.07 | −0.75 | −1.04 | −0.041 |
| Load Case 2 | 0.27 | 17.33 | −5.62 | −0.22 | −1.65 | 0.25 |
| Necked Collar Link | ||||||
| Load Case 1 | −10.51 | 0.54 | −1.45 | 1.16 | −0.22 | −0.32 |
| Load Case 2 | −1.29 | 9.81 | −4.39 | −0.02 | −0.26 | −0.37 |
Table 3.
Dynamic loading test result comparison and effect due to variation in excitation frequency.
Table 3.
Dynamic loading test result comparison and effect due to variation in excitation frequency.
| Applied Forces (N) | Mean Absolute Error (N) | |||||||
|---|---|---|---|---|---|---|---|---|
| Freq | Amp | Static | Measured Force Outputs | Decoupled Applied Forces | ||||
| Hz | ||||||||
| 100 | 6.5 | 7.8 | 0.2218 | 0.4966 | 0.3642 | 0.1630 | 0.2269 | 0.1403 |
| 200 | 6.5 | 7.8 | 0.3008 | 1.0378 | 0.7806 | 0.3377 | 0.7563 | 0.4419 |
| 100 | 12 | 17.8 | 0.5290 | 1.1998 | 0.7268 | 0.3244 | 0.1880 | 0.1732 |
| 200 | 12 | 17.8 | 0.6468 | 1.6479 | 1.1920 | 0.5984 | 0.8607 | 0.6917 |
Table 4.
Dynamic loading test results due to variation in excitation force amplitudes and static force Fz.
Table 4.
Dynamic loading test results due to variation in excitation force amplitudes and static force Fz.
| Applied Forces (N) | Mean Absolute Error (N) | |||||||
|---|---|---|---|---|---|---|---|---|
| Freq | Amp | Static | Measured Force Outputs | Decoupled Applied Forces | ||||
| Hz | ||||||||
| 100 | 6.5 | 7.8 | 0.2218 | 0.4966 | 0.3642 | 0.1630 | 0.2269 | 0.1403 |
| 100 | 12 | 17.8 | 0.5290 | 1.1998 | 0.7268 | 0.3244 | 0.1880 | 0.1732 |
| 100 | 17.5 | 27.8 | 0.6686 | 2.0222 | 0.9254 | 0.0986 | 0.1161 | 0.0371 |
| 100 | 31.5 | 47.3 | 1.3155 | 3.2154 | 1.5284 | 0.3416 | 0.2689 | 0.0475 |
Publisher’s Note: MDPI stays neutral with regard to jurisdictional claims in published maps and institutional affiliations. |
© 2021 by the authors. Licensee MDPI, Basel, Switzerland. This article is an open access article distributed under the terms and conditions of the Creative Commons Attribution (CC BY) license (http://creativecommons.org/licenses/by/4.0/).
Share and Cite
MDPI and ACS Style
Ahmed, R.; Firrone, C.M.; Zucca, S. Design and Calibration of a Tri-Directional Contact Force Measurement System. Appl. Sci. 2021, 11, 877. https://0-doi-org.brum.beds.ac.uk/10.3390/app11020877
AMA Style
Ahmed R, Firrone CM, Zucca S. Design and Calibration of a Tri-Directional Contact Force Measurement System. Applied Sciences. 2021; 11(2):877. https://0-doi-org.brum.beds.ac.uk/10.3390/app11020877
Chicago/Turabian StyleAhmed, Rizwan, Christian Maria Firrone, and Stefano Zucca. 2021. "Design and Calibration of a Tri-Directional Contact Force Measurement System" Applied Sciences 11, no. 2: 877. https://0-doi-org.brum.beds.ac.uk/10.3390/app11020877
Note that from the first issue of 2016, this journal uses article numbers instead of page numbers. See further details here.