Article

Ultrasound Extraction Mediated Recovery of Nutrients and Antioxidant Bioactive Compounds from Phaeodactylum tricornutum Microalgae

by
Fadila Al Khawli
,
Francisco J. Martí-Quijal
,
Noelia Pallarés
,
Francisco J. Barba
* and
Emilia Ferrer
Department of Preventive Medicine and Public Health, Food Science, Toxicology and Forensic Medicine, Faculty of Pharmacy, Universitat de València, Avda. Vicent Andrés Estellés, s/n 46100 Burjassot (València), Spain
*
Author to whom correspondence should be addressed.
Submission received: 31 January 2021 / Revised: 7 February 2021 / Accepted: 8 February 2021 / Published: 14 February 2021
(This article belongs to the Collection Ultrasound in Extraction Processing)

Abstract

:
In recent years, a growing interest has been shown in the use of microalgae due to their interesting nutritional and bioactive profiles. Green innovative processing technologies such as ultrasound-assisted extraction (UAE) avoid the use of toxic solvents and high temperatures, being a sustainable alternative in comparison with traditional extraction methods. The present study aims to evaluate the recovery of high added-value compounds from Phaedoactylum tricornutum assisted by ultrasound. To optimize the UAE of proteins, carbohydrates, pigments and antioxidant compounds, a response surface methodology was used. Carbohydrate extraction was positively affected by the temperature. However, for the extraction of carotenoids, the most influential factor was the extraction time. The total polyphenols were only significantly affected by the extraction time. Finally, the antioxidant capacity, measured by 2,2′-azino-bis-3-ethylbenzothiazoline-6-sulfonic acid (ABTS), was strongly modulated by the extraction time, while for the oxygen radical antioxidant capacity (ORAC) assay, the most important parameter was the temperature, followed by the extraction time. The optimal conditions for the maximum extraction of nutrients, bioactive compounds and antioxidant capacity were 30 min, 50 ºC and a pH of 8.5. Finally, it has been seen that with these conditions, the extraction of fucoxanthin is allowed, although no differences were found between an ultrasound-assisted extraction and a shaking extraction (control).

1. Introduction

Over the last two decades, there has been growing interest in the use of microalgae as food to partially replace conventional food products (e.g., meat) or to be used as a source of high added-value compounds [1]. Marine microalgae consist of prokaryotic or eukaryotic photosynthetic microorganisms that are able to grow rapidly due to their unicellular or simple multicellular structures [2]. The main reason for the increased microalgae exploitation is due to their interesting nutritional and bioactive profiles (e.g., high protein content, healthy lipid profile and micronutrient (vitamins and minerals) composition) [3]. Moreover, microalgae is considered a sustainable biomass and can be also used to remove heavy metals from marine waters and industrial waste [4,5]. However, the nutritional and bioactive profiles of microalgae differ according to the target species. For that reason, there is a need to explore and evaluate each microalgae species separately.
Phaedoactylum. tricornutum consists of a unicellular marine diatom with a high growth rate under optimal conditions. It is considered an important source of n-3 polyunsaturated fatty acids (PUFAs), particularly eicosapentaenoic acid (EPA), being an interesting alternative in the industry for EPA production [6]. Moreover, P. tricornutum is a promising source of other interesting bioactive components such as fucoxanthin, a primary marine carotenoid [7].
In order to recover the different high added-value compounds from microalgae, different approaches have been taken into account. For example, traditionally, the use of liquid–liquid or solid–liquid extraction using organic solvents and high temperatures has been used. However, due to recent concerns regarding the use of toxic solvents and non-sustainable approaches, there is a growing search for green and efficient methods to avoid them [8,9,10].
Nowadays, innovative alternative technologies, such as supercritical fluid extraction (SFE), pressurized liquid extraction (PLE), ultrasound-assisted extraction (UAE), pulsed electric field-assisted extraction (PEF) and microwave-assisted extraction (MAE), are being studied to extract interesting compounds from microalgae [11,12,13,14,15]. These techniques produce a low environmental impact, since no organic solvents are used and there is less volume consumption. Moreover, they operate under low extraction temperatures and short extraction times, being a sustainable alternative in comparison with traditional extraction methods [16].
Among the different techniques, ultrasound has been used by different authors to ex-tract high added-value compounds from microalgae species (e.g., Nannochloropsis spp., Spir-ulina spp. and Chlorella spp.). Parniakov et al. [17] obtained an efficient recovery of phenolic compounds and chlorophylls from the microalgae Nannochloropsis spp. after ultrasound (USN) pretreatment. Adam et al. [18] reported the effective extraction of lipids from Nannochloropsis oculata under USN treatment. On the other hand, Vernès et al. [11] and Hildebrand et al. [19] proposed USN technology as an effective tool for the rapid extraction of proteins from Spirulina and Chlorella vulgaris microalgae, respectively. In general, all these authors obtained better results employing ultrasound than those obtained with conventional extraction. However, there is a lack of information regarding the effects of this technology on the recovery of nutrients and bioactive compounds from Phaedoactylum tricornutum.
Ultrasound research is focused on various applications, such as food preservation, the stimulation of fermentation and enzyme reactions and the modification of food constituents or product structures, as well as the improvement of mass and heat transfer during the drying or extraction processes. This technology implies the application of ultrasound waves with a range of frequencies between 20 kHz and 100 MHz, thus leading to a constant growth of gas bubbles in the medium, resulting in the collapse and cavitation of the bubbles. This phenomenon causes the breakdown of liquid–solid interfaces, with the consequent release of bioactive compounds from the food matrix [20]. In recent years, this technology has also shown promising applications in cleaning and decreasing chemical contaminants in food, such as mycotoxins or pesticides [21].
Taking into account the extraction yield and profile differences according to each microalgae species, in a previous review, Barba et al. [8] established the need to evaluate each microalgae species separately.
Therefore, the present study aims to evaluate the recovery of high added-value compounds from Phaedoactylum tricornutum using an optimization strategy. Moreover, the influence of ultrasound on the protein molecular size distribution will be evaluated using SDS-PAGE electrophoresis.

2. Materials and Methods

2.1. Chemicals and Reagents

Ethanol (99.8%) and glacial acetic acid were obtained from Panreac (Castellar del Vallés, Barcelona, Spain). Sodium carbonate (Na2CO3), dimethyl sulfoxide (DMSO) and methanol (99.9%) were acquired from VWR (Saint-Prix, France). The 2,2′-azino-bis-3-ethylbenzothiazoline-6-sulfonic acid (ABTS), Folin–Ciocalteu reagent, gallic acid, D-glucose, Trolox (6-hydroxy-2,5,7,8-tetramethylchroman-2-carboxylic acid), phenol, 2,2′-azobis-(2-amidinopropane) dihydrochloride (AAPH) and potassium persulfate (K2S2O8) were purchased from Sigma–Aldrich (Steinheim, Baden-Württemberg, Germany). The Tris-HCl, sodium dodecyl sulfate (SDS) and Trizma® base and glycerol were obtained from Sigma-Aldrich (St. Louis, MO, USA). A quantity of 5−250 kDa of molecular weight pattern Precision Plus Protein™, 8–16% Mini-PROTEAN® TGX™ Precast gels and Coomassie brilliant blue R-250 were purchased from BioRad (Hercules, CA, USA). Dithiothreitol (DTT) and acetonitrile were obtained from VWR (Leuven, Belgium). Methanol and sulfuric acid (96%) were purchased from Merck (Whitehouse Station, NJ, USA). Tris(hydroxymethyl) aminomethane, potassium phosphate monobasic (Na2HPO4), potassium phosphate dibasic (K2HPO4) and sodium phosphate dibasic (Na2HPO4) were purchased from Merck (Darmstadt, Germany). Sodium fluorescein was obtained from Fluka Chemie AG (Bunds, Switzerland). Deionized water (resistivity >18 MΩ cm−1) was prepared in the laboratory using a Milli-Q SP reagent water system (Millipore Corporation, Bedford, MA, USA).

2.2. Samples

Phaedoactylum tricornutum microalgae were produced in four 800 L GemTube (LGEM, Rotterdam, The Netherlands) photobioreactors at the National Algae pilot plant in Mongstad (NAM), Norway, located in a greenhouse exposed to natural light and additionally equipped with artificial illumination (EAX 170W LED lights, Evolys AS, Oslo, Norway). The photobioreactors operated in dual mode under the conditions of a pH of 7.8, on-demand CO2 addition and culture temperatures in the range of 15–35 °C. The microalgae were grown in a modified WUR (Wageningen University & Research) medium, which was based on natural seawater (Fensfjorden, Mongstad, salinity of 31 ppt) enriched with a nutrient stock solution. After harvesting, the biomass was dewatered by employing a spiral plate centrifuge (Evodos 25, Evodos b.v., Raamsdonksveer, The Netherlands), resulting in a paste of approximately 22% dry weight which was vacuum packed and stored until at −20 °C.

2.3. Ultrasound-Assisted Extraction (UAE) Technology

A Branson 5200 ultrasonic bath (Branson Ultrasonic Corp., Danbury, CT, USA) was employed to carried out the experiments. The instrument operated under a frequency of 20 KHz, power of 100 W and treatment time of 0.5, 15 or 30 min. The bath temperature was set at 20, 30 or 50 °C and was checked during all the extractions. For the extraction experiments, two grams of microalgae were weighed and placed with 30 mL of distilled water in a 100 mL beaker. Prior to the extractions, the water pH was adjusted to 5.5, 7 or 8.5. The resulting extracts were placed in 15 mL tubes and preserved at −20 °C until further determinations.

2.4. Total Protein Content and Profile by SDS-PAGE Electrophoresis

The protein content (mg of bovine serum albumin equivalent/g of dry sample) was obtained by a bicinchoninic acid (BCA) microtiter plate assay, in accordance with the work of Smith et al. [22] and adapted by Parniakov et al. [23]. For this, 0.1 mL of the sample extract was mixed with 2 mL of the solution of a BCA protein assay kit (Pierce Biotechnology, Inc., Waltham, MA, USA). Then, the samples were kept at room temperature (20 °C) for 2 h. Finally, the absorbance of each sample was read at 562 nm, employing a VICTOR3 1420 multilabel plate counter (PerkinElmer, Turku, Finland). Bovine serum albumin (Thermo scientific, Waltham, MA, USA) was used for calibration.
The different sizes of proteins contained in the extracts were evaluated after the UAE treatment by SDS-PAGE electrophoresis, according to the method previously described in [24]. Briefly, the proteins were precipitated by adding acetone to the sample (1:4 ratio, v/v for the acetone sample), and then they were centrifuged at 11,000× rpm at 4 °C for 10 min. The pellet was resuspended in deionized water. The resulting suspension was mixed with the same volume of sample buffer (62.5 mM Tris-HCl (pH 6.8), 20% glycerol, 2% SDS, 50 mM dithiothreitol and 0.01% bromophenol blue) and heated for 5 min at 95 °C. Then, 10 µL of this mixture was loaded on the prepared gel (8–16% Mini-PROTEAN® TGX™ Precast gels, Bio-Rad). Electrophoresis was carried out in a Mini-PROTEAN® tetra cell (Bio-Rad) at 120 V for the first 30 min and then at 80 V until the front line was arriving at the end of the gel. Precision Plus Protein™ in the amount of 5–250 kDa was used to estimate the molecular weight. The running buffer used during electrophoresis was prepared with SDS (0.1%), glycine (192 mM) and Trizma® base (25 mM) in deionized water. Once the electrophoresis process was finished, the gel was stained with 0.125 % Coomassie brilliant blue R-250 for 30 min. After this, it was destained using methanol:acetic acid:water (deionized) at a ratio of 2:1:7 (v/v/v). Finally, the picture of the gel was analyzed using ImageJ® (National Institutes of Health, Bethesda, MD, USA).

2.5. Carbohydrate Determination

The total carbohydrate content was measured, employing the phenol–sulfuric acid method [25]. First, a 5% phenol solution was prepared. Then, 500 μL of it was placed with 500 μL of a sample extract or standard in a tube and they were mixed. The tubes were kept at room temperature for 15 min, allowing a phenol reaction with glucose. After the incubation time, 60 μL of this mixture was transferred to a 96-well plate, 150 μL of 96% sulfuric acid was added to each well containing the calibration solution or the sample, and they were mixed well by upward pipetting. Then, the 96-well plate was incubated at room temperature for 5 min. A D-glucose calibration curve was performed in the range of 25–500 μg/L. Finally, the absorbance of each sample was read at 490 nm by a VICTOR3 1420 multilabel plate counter (Perkin-Elmer, Turku, Finland), and the concentration of carbohydrates was calculated based on a D-glucose calibration curve. Analyses were performed in triplicate.

2.6. Antioxidant Capacity and Compounds

The ABTS assay was performed according to the methodology proposed by Parniakov et al. [23]. An ABTS radical cation (ABTS) was produced by reacting 25 mL of ABTS (7 mM) with 440 µL of potassium persulphate (K2S2O8) (140 mM). The mixture was kept in darkness at room temperature for 12–16 h. Then, the ABTS radical cation was diluted with ethanol at a ratio of 1:100 (v/v) to obtain an absorbance of 0.700 (±0.020) at a wavelength of 734 nm. The Trolox standard curve at different concentrations (0, 50, 100, 150, 200, 250 and 300 µM) was prepared, using ethanol as a solvent. The absorbance of 2 mL of the ABTS*+ working solution was the initial point of reaction (A0). Then, 0.1 mL of diluted sample extracts or Trolox standards were added, and the absorbance was determined after 3 min (Af). All absorbances were read at a wavelength of 734 nm in a Perkin-Elmer UV/Vis Lambda 2 spectrophotometer (Perkin-Elmer, Rodgau-Jügesheim, Germany). The percentage of inhibition was calculated with the following equation:
% Inhibition = (1 − (Af/A0)) * 100
The antioxidant activity was calculated using a Trolox standard curve and expressed as µM rolox equivalents (TEs). Experiments were performed in triplicate.
The oxygen radical antioxidant capacity (ORAC) method was evaluated, following the methodology proposed by De la Fuente et al. [26] with some modifications. Sodium fluorescein and an AAPH working solution were prepared at a concentration of 0.015 mg/mL and 120 mg/mL, using a 75 mM phosphate buffer (pH 7). In a 96-well microplate, 50 µL of the sample extract was mixed with 50 µL of fluorescein, and the mixture was pre-incubated at 37 °C for 10 min. Then, 25 µL of the AAPH solution were added, and the plates were immediately placed in the VICTOR3 1420 multilabel plate counter reader (PerkinElmer, Turku, Finland), and the fluorescence was recorded every minute for 60 min under an excitation wavelength of 485 nm and an emission wavelength of 528 nm. The phosphate buffer was used as a blank, and Trolox (100 µM) was used as the antioxidant standard. Each extract was analyzed in five replicates, and the differences in areas under the curve (AUCs) of the fluorescein decay between the blank and the samples were used to calculate the antioxidant activity. The results were expressed as µM Trolox equivalents (TEs).
For the total phenolic compound (TPC) determination, the Folin−Ciocalteu method was employed according to Parniakov et al. [12]. Briefly, a 50% v/v Folin-Ciocalteu reagent, 2% Na2CO3 and the gallic acid diluted standards were prepared. First, 100 μL of the sample extract or standard were mixed with 3 mL of Na2CO3. Then, 100 μL of a Folin-Ciocalteu reagent solution was added to the mixture, and the samples were incubated at room temperature for 1 h. Finally, the absorbance of the samples was read at a wavelength of 750 nm using a Perkin-Elmer UV/Vis Lambda 2 spectrophotometer (Perkin-Elmer, Rodgau-Jügesheim, Germany). The gallic acid calibration curve was used for quantification of the total phenols. Analyses were performed in triplicate.
The total carotenoid and chlorophyll A contents were obtained spectrophotometrically in a Perkin-Elmer UV/Vis Lambda 2 spectrophotometer (Perkin-Elmer, Rodgau-Jügesheim, Germany). This method consisted of the determination of the carotenoid and chlorophyll contents based on their maximum absorbances: chlorophyll A λ ≈ 664.1 nm, chlorophyll B λ ≈ 648.6 nm and total carotenoids λ ≈ 470 nm. The sample extracts were diluted with distilled water, and the absorbance (A) was read at wavelengths of 470, 648.6 and 664.1 nm, respectively. Finally, the chlorophyll A, chlorophyll B and carotenoid contents were obtained according to the following equations:
C chlorophyll A (µg/mL) = 13.36 A664.1 – 5.19A648.6
C chlorophyll B (µg/mL) = 27.43 A648.6 – 8.12A664.1
C total carotenoids (µg/mL) = (1000A470 − 2.13 Ca − 97.64 Cb)/209

2.7. Experimental Design and Statistical Analyses

The ultrasound-assisted extraction conditions were optimized using a response surface method, with a Box–Behnken experimental design with two central points. The studied parameters were as follows: extraction time 0.5–30 min, temperature 20–50 °C and pH 5.5–8.5, with 3 levels each one (minimum, central and maximum) leading to 15 different combinations of these variables, with repetition of the central conditions to check the stability and reproducibility of the results. Table 1 shows the randomized design of the 16 experiments.
In order to obtain significant differences (p < 0.05) between the results, an analysis of variance (ANOVA) was performed, followed by the least significant differences (LSD) test in order to indicate the samples with significant differences.
For comparison of the 23 kDa band in the SDS-PAGE gel, a Student’s paired t-test was performed. For this purpose, GraphPad Prism 8.0.2® (GraphPad Software, San Diego, CA, USA) was used, and values of p < 0.05 were considered significant.
The response surface methodology design and the rest of statistical analyses were performed using Statgraphics Centurion XV® software (Statpoint Technologies, Inc., The Plains, VA, USA).

3. Results

3.1. Impact of Extraction Time, Temperature and pH on the Selective Extraction of Nutrients and Antioxidants

The ultrasound-assisted extraction (UAE) was optimized using a response surface methodology Box–Behnken design with two central points. The optimization was carried out to obtain the maximum values of all the studied responses: proteins, carbohydrates, chlorophyll A, total carotenoids, total phenolic compounds, TEAC (Trolox Equivalent Antioxidant Capacity) and ORAC (Oxygen Radical Absorbance Capacity). For the optimization, the following parameters were taken into account: extraction time 0.5–30 min, temperature 20–50 ºC and pH 5.5–8.5.

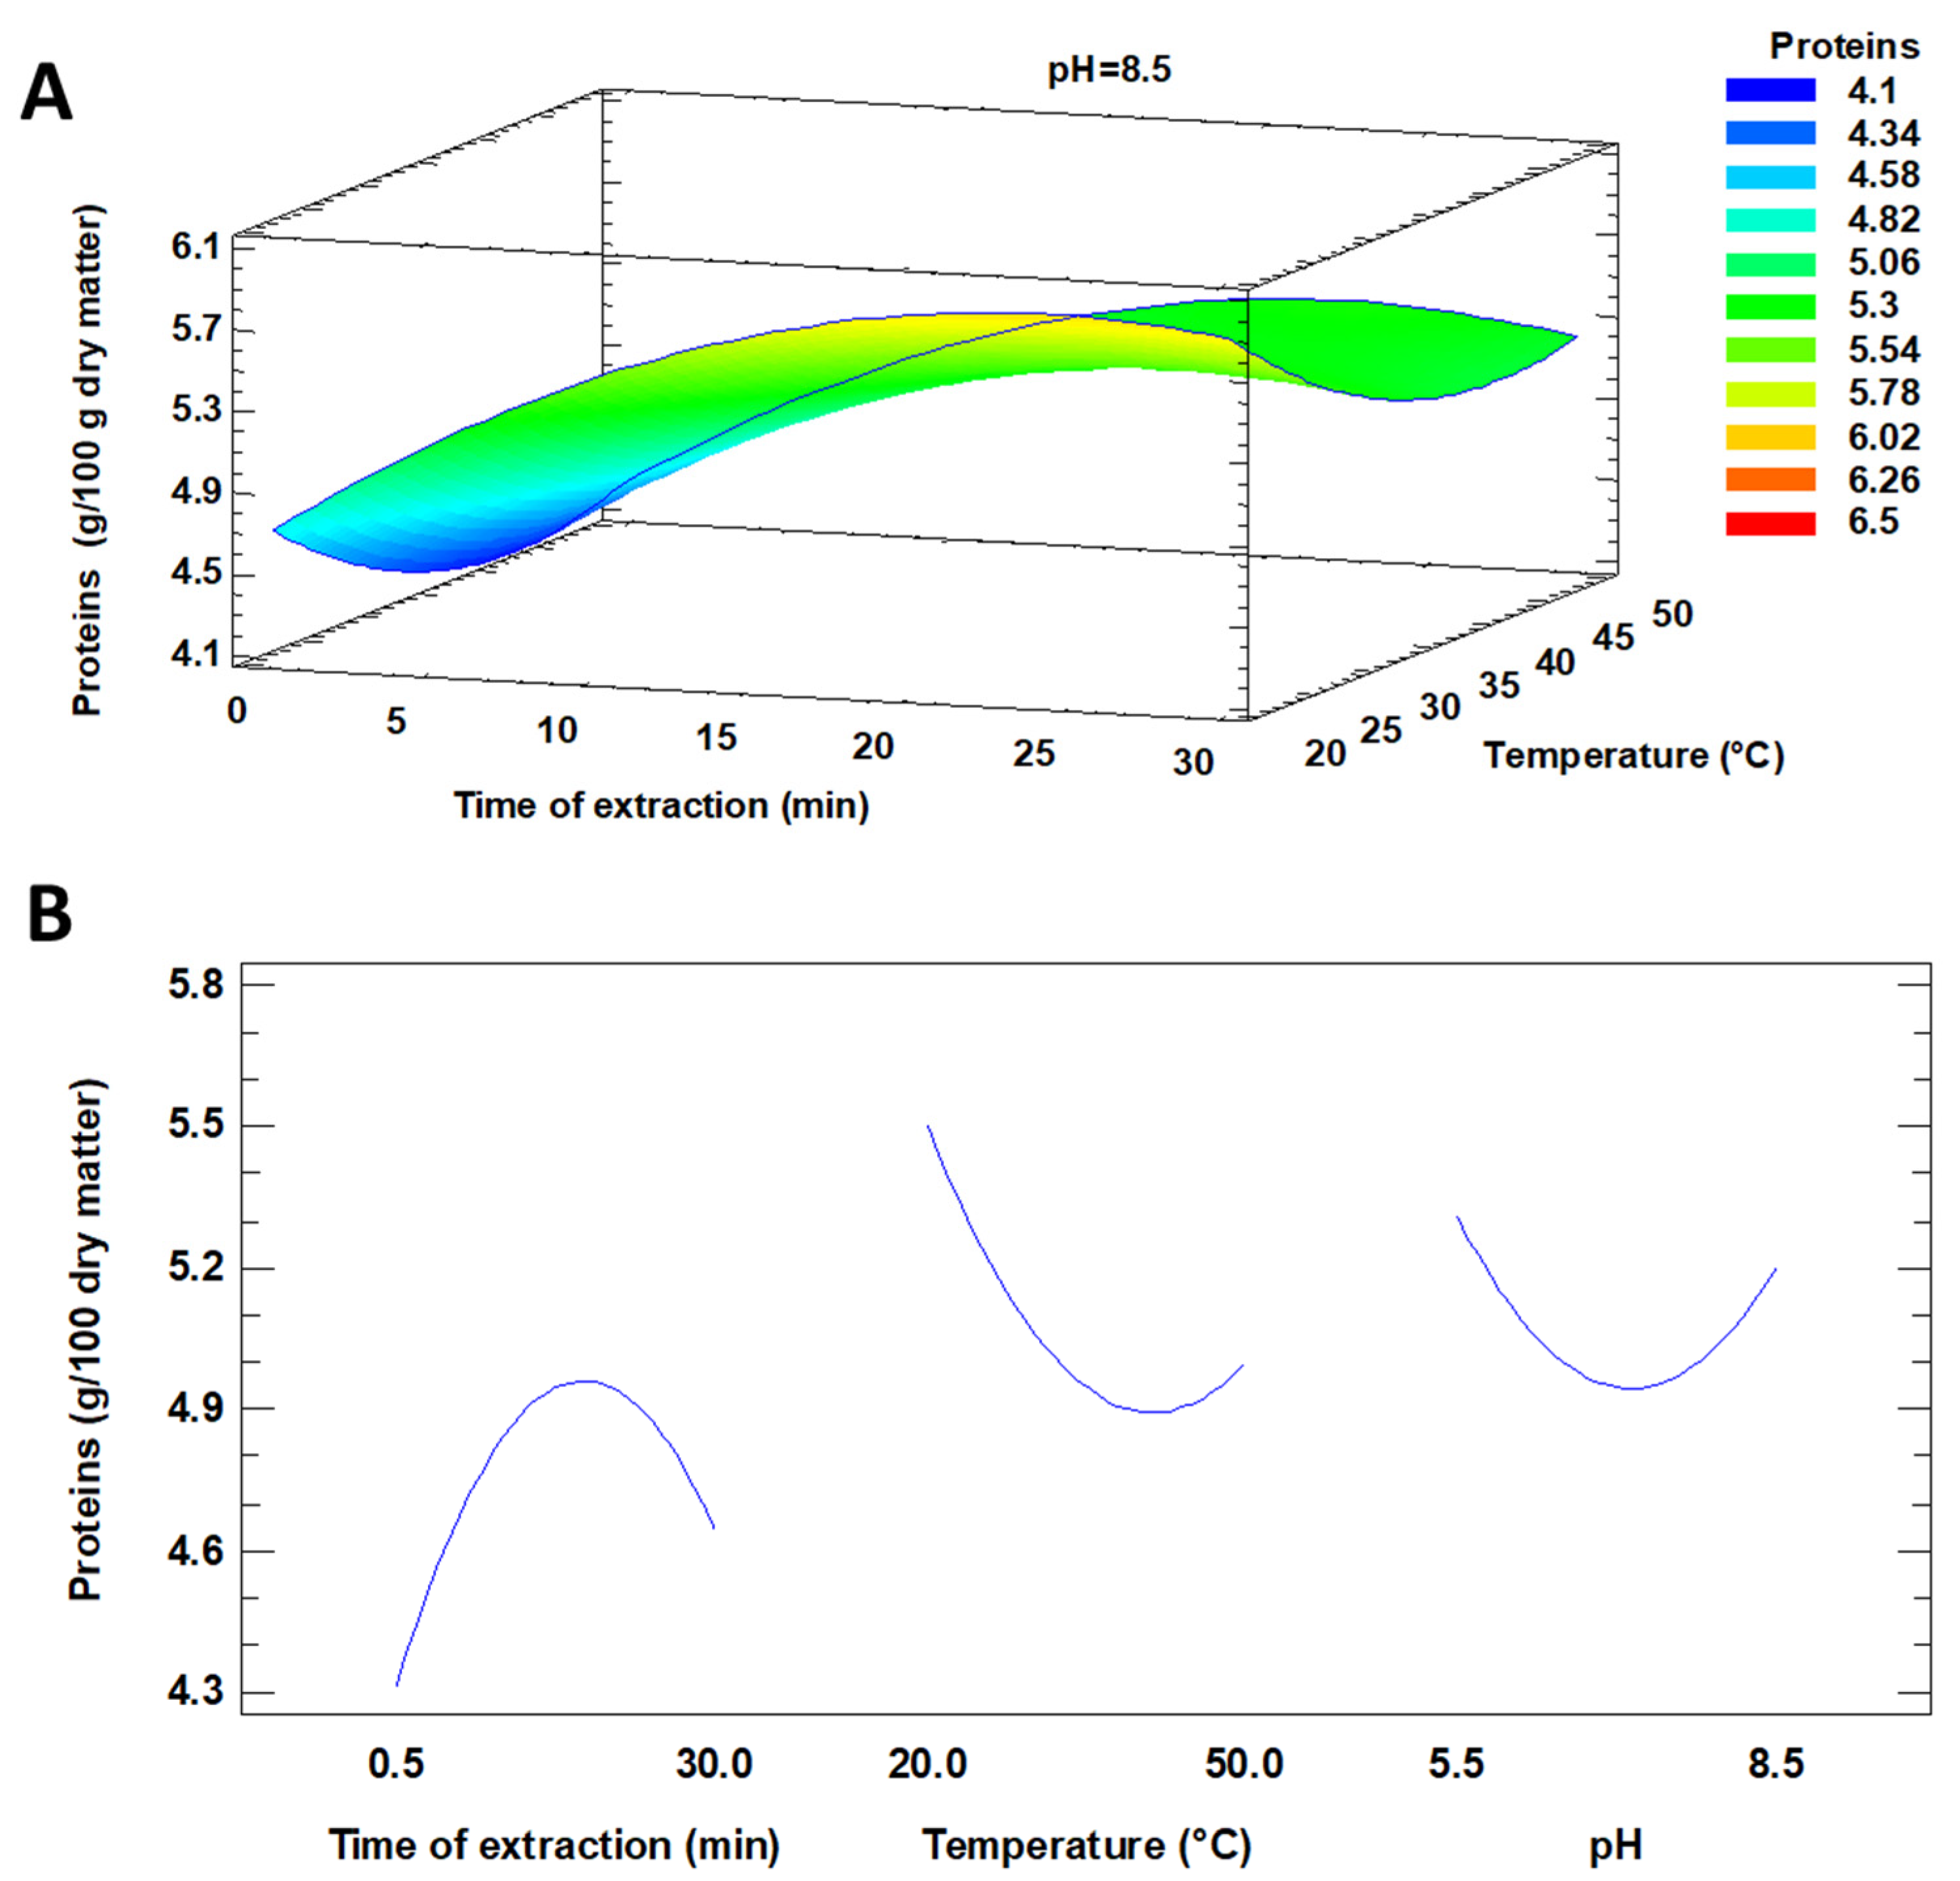
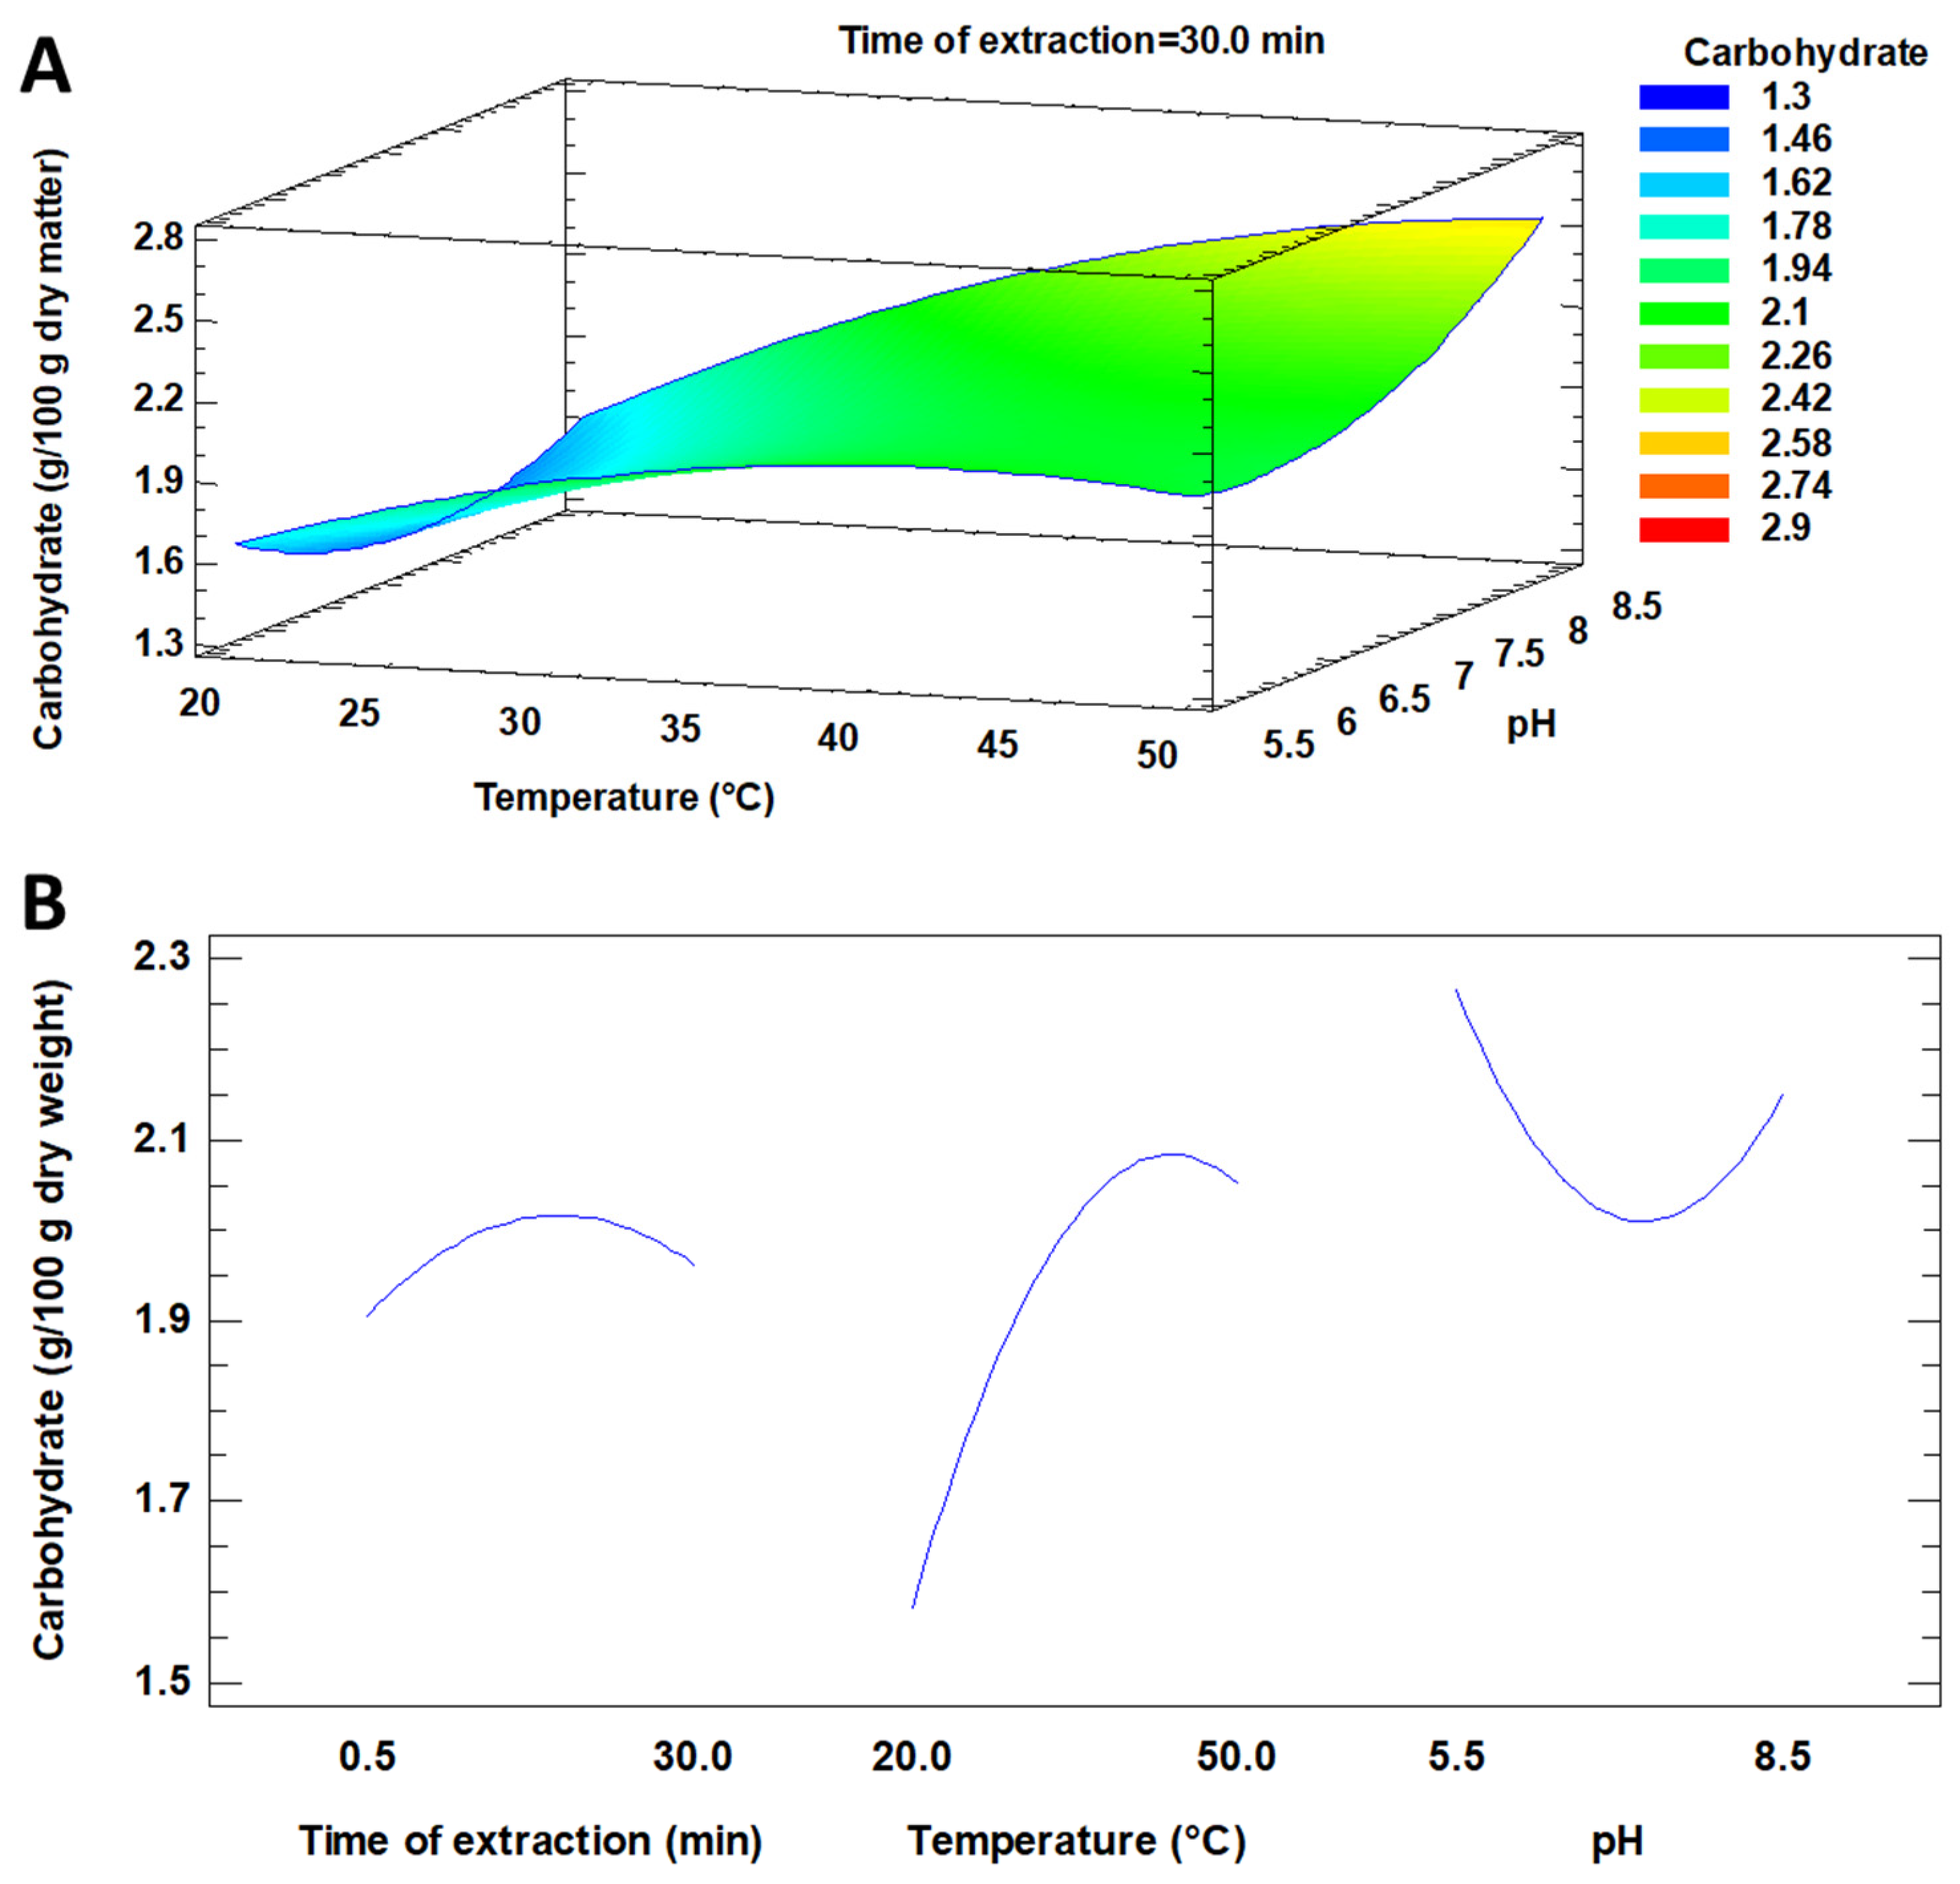
3.1.1. Nutrients (Proteins and Carbohydrates)

The protein and carbohydrate values for each extraction condition are shown in Table 2. As can be seen in the table, the protein values ranged from 4.14 to 6.10 g/100 g of dry matter, being the optimal conditions for the maximal protein recovery (24.4 min, 20 °C and pH 8.5) obtained under this condition: 5.96 g of proteins/100 g dry matter. On the other hand, the values for the carbohydrates ranged from 1.39 g/100 g dry matter to 2.52 g/100 g dry matter. In this case, the optimal conditions for the highest carbohydrate extraction were 30 min, 50 °C and a pH of 8.5, obtaining 2.53 g of carbohydrates/100 g dry matter.
The influence of the extraction time, temperature and pH for the proteins and carbohydrates is shown in Figure 1 and Figure 2, respectively. Regarding the protein, as can be seen in Figure 1, although it seems that both the temperature and time affected protein extraction, the ANOVA analysis revealed that these changes were not significant (p = 0.0553 for temperature and 0.1690 for the time of extraction). The pH did not show any significant influence (p = 0.6355). On the contrary, regarding the carbohydrate extraction, the temperature clearly influenced the extraction (p = 0.0040), while the pH and time of extraction did not have a significant influence (p = 0.2954 and 0.6061, respectively). Regarding the temperature, as can be seen in Figure 2, an important increase in carbohydrate extraction was found, obtaining the maximum yield at temperatures between 45–50 °C. This fact can be explained due to the modification of the integrity of the cell wall after the increase in temperature, then the solvent solution contact with the intracellular compounds was facilitated, thus improving their extraction [27].
In a similar way, other authors did not observe any significant influence of these parameters for protein extraction from microalgae. In this sense, Lupatini et al. [28] did not find a significant effect from the sonication time, temperature or pH when extracting proteins from Spirulina platensis. Moreover, the same authors reported a significant and positive influence of the temperature for carbohydrate extraction. On the other hand, Sánchez-Zurano et al. [29] optimized the UAE of protein extraction from Spirulina microalgae, using a response surface method with a central composite design. They found that the extraction time (10–120 min) and pH (9–11) had a significant effect on protein solubilization. Finally, Hildebrand et al. [19] also reported that ultrasound treatment increased the protein extraction from Chlorella vulgaris, especially at a basic pH (in a NaOH medium).

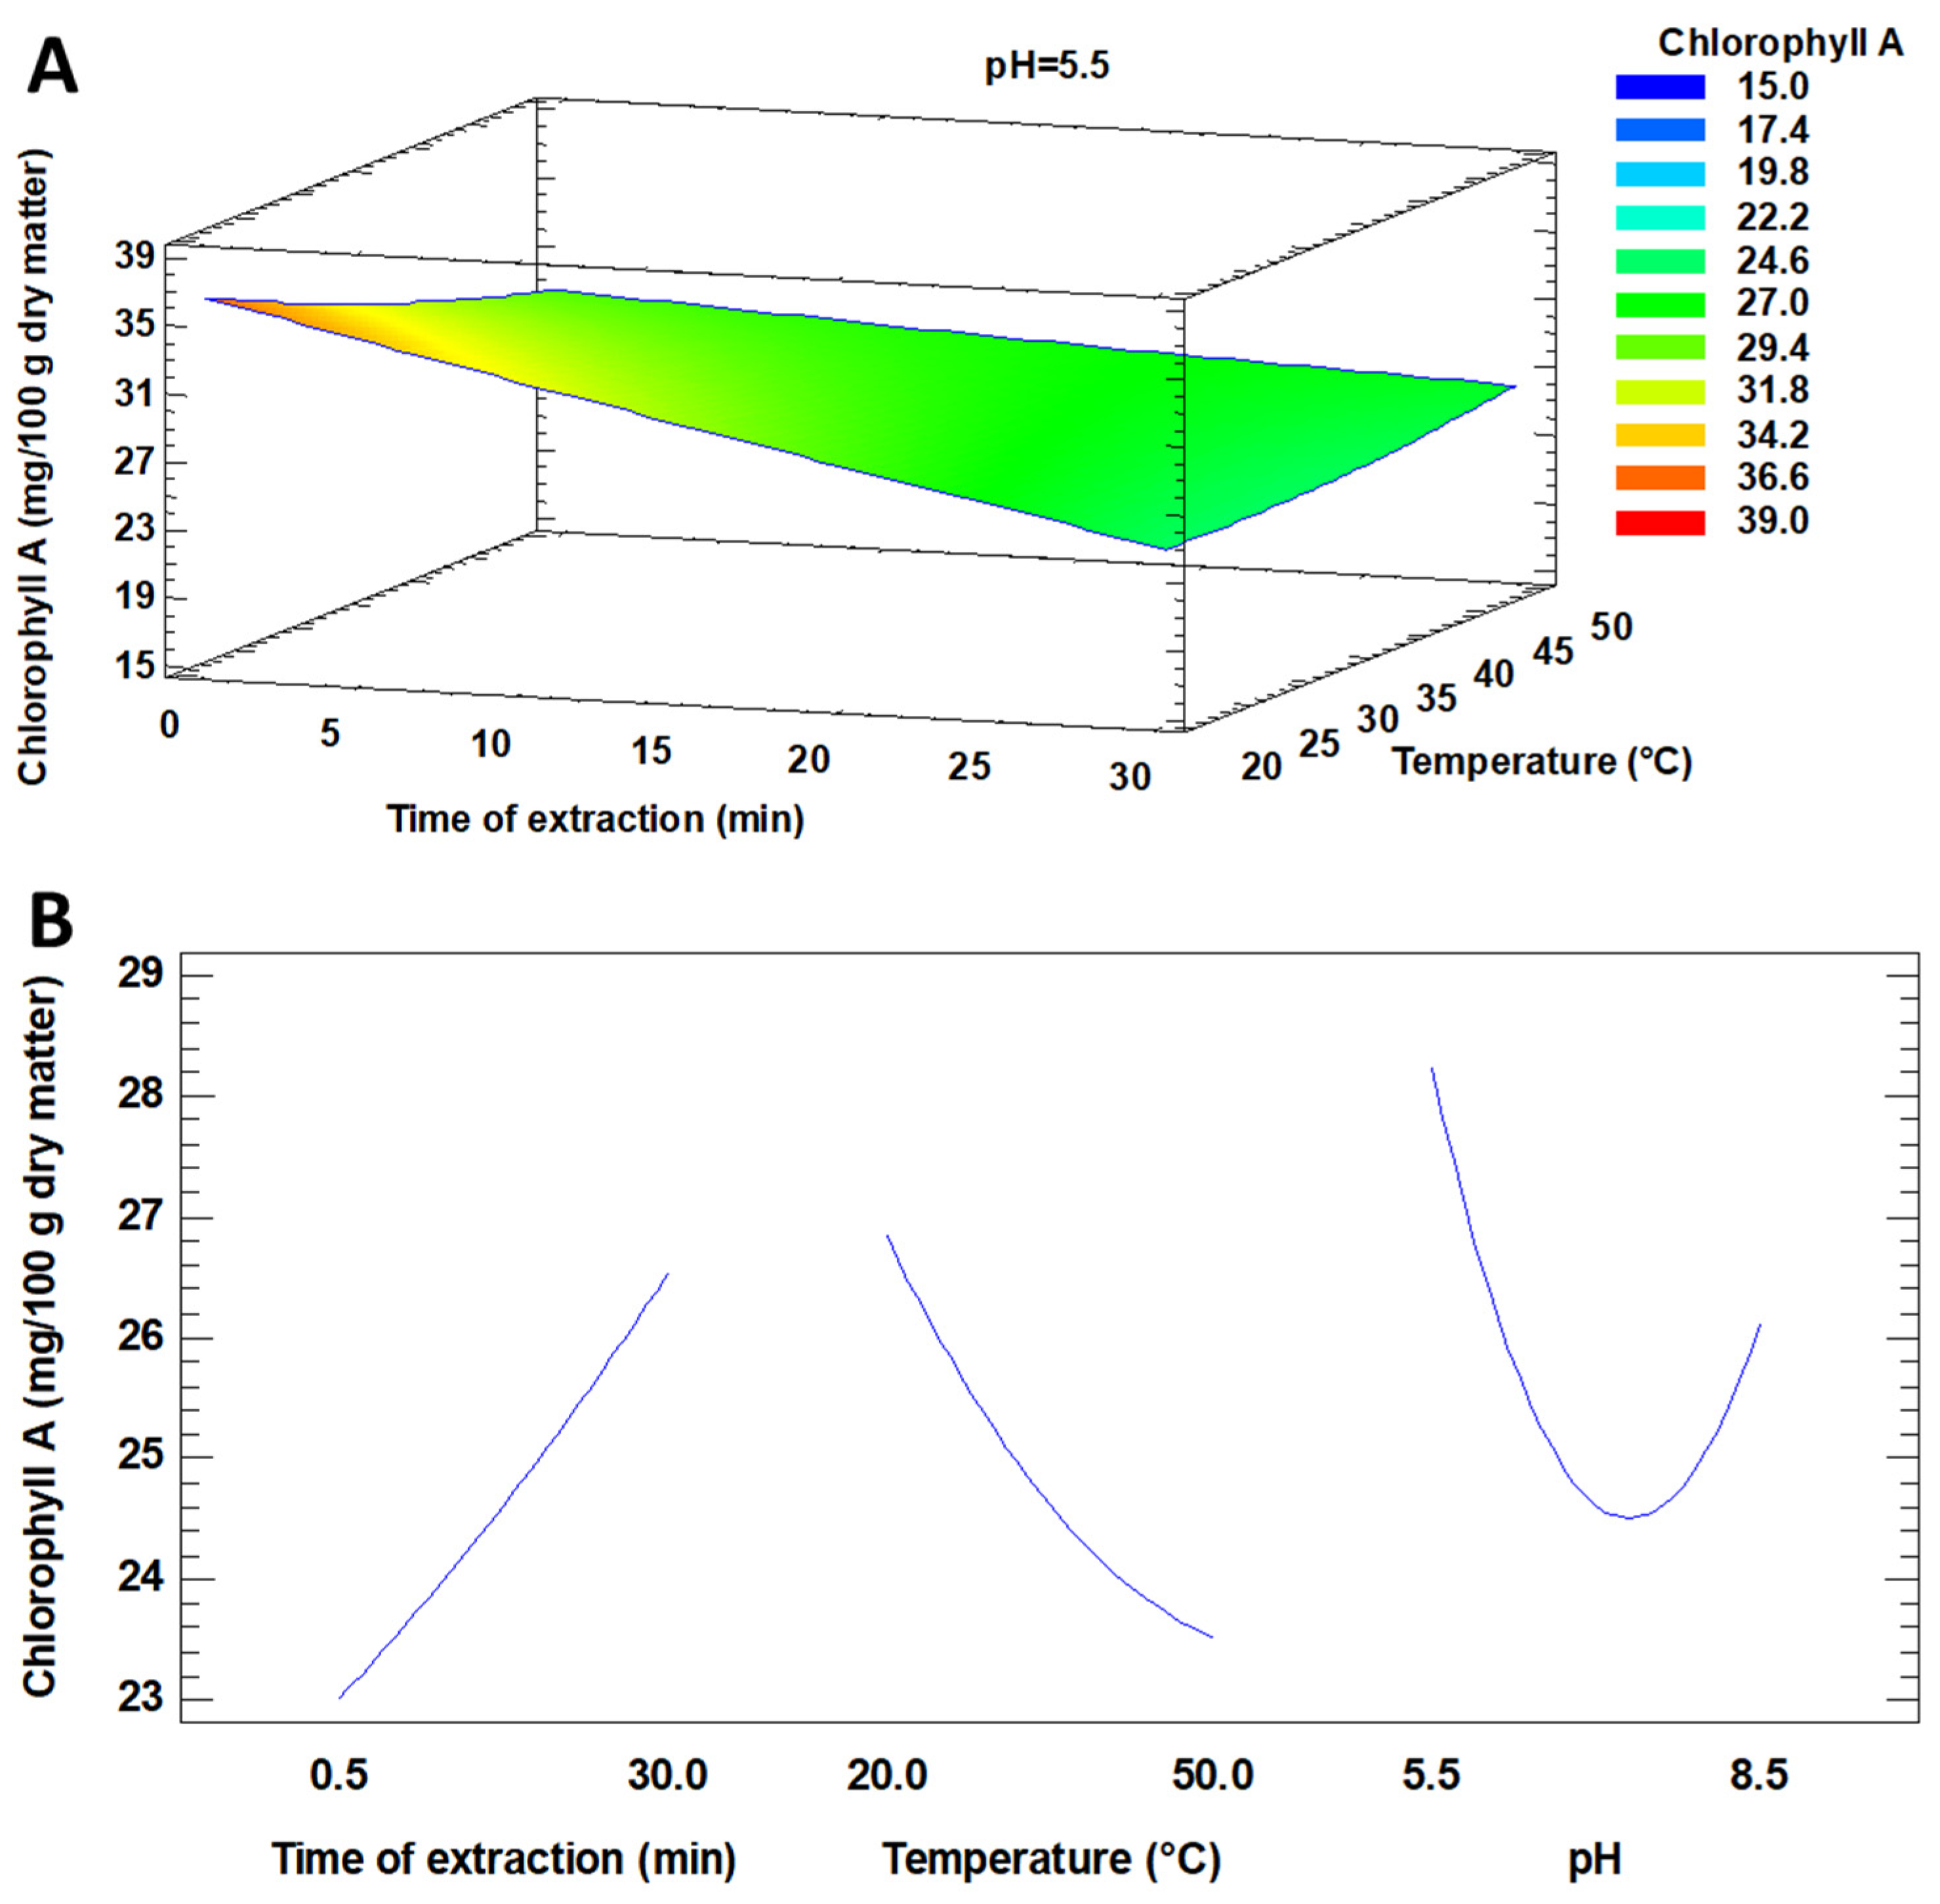
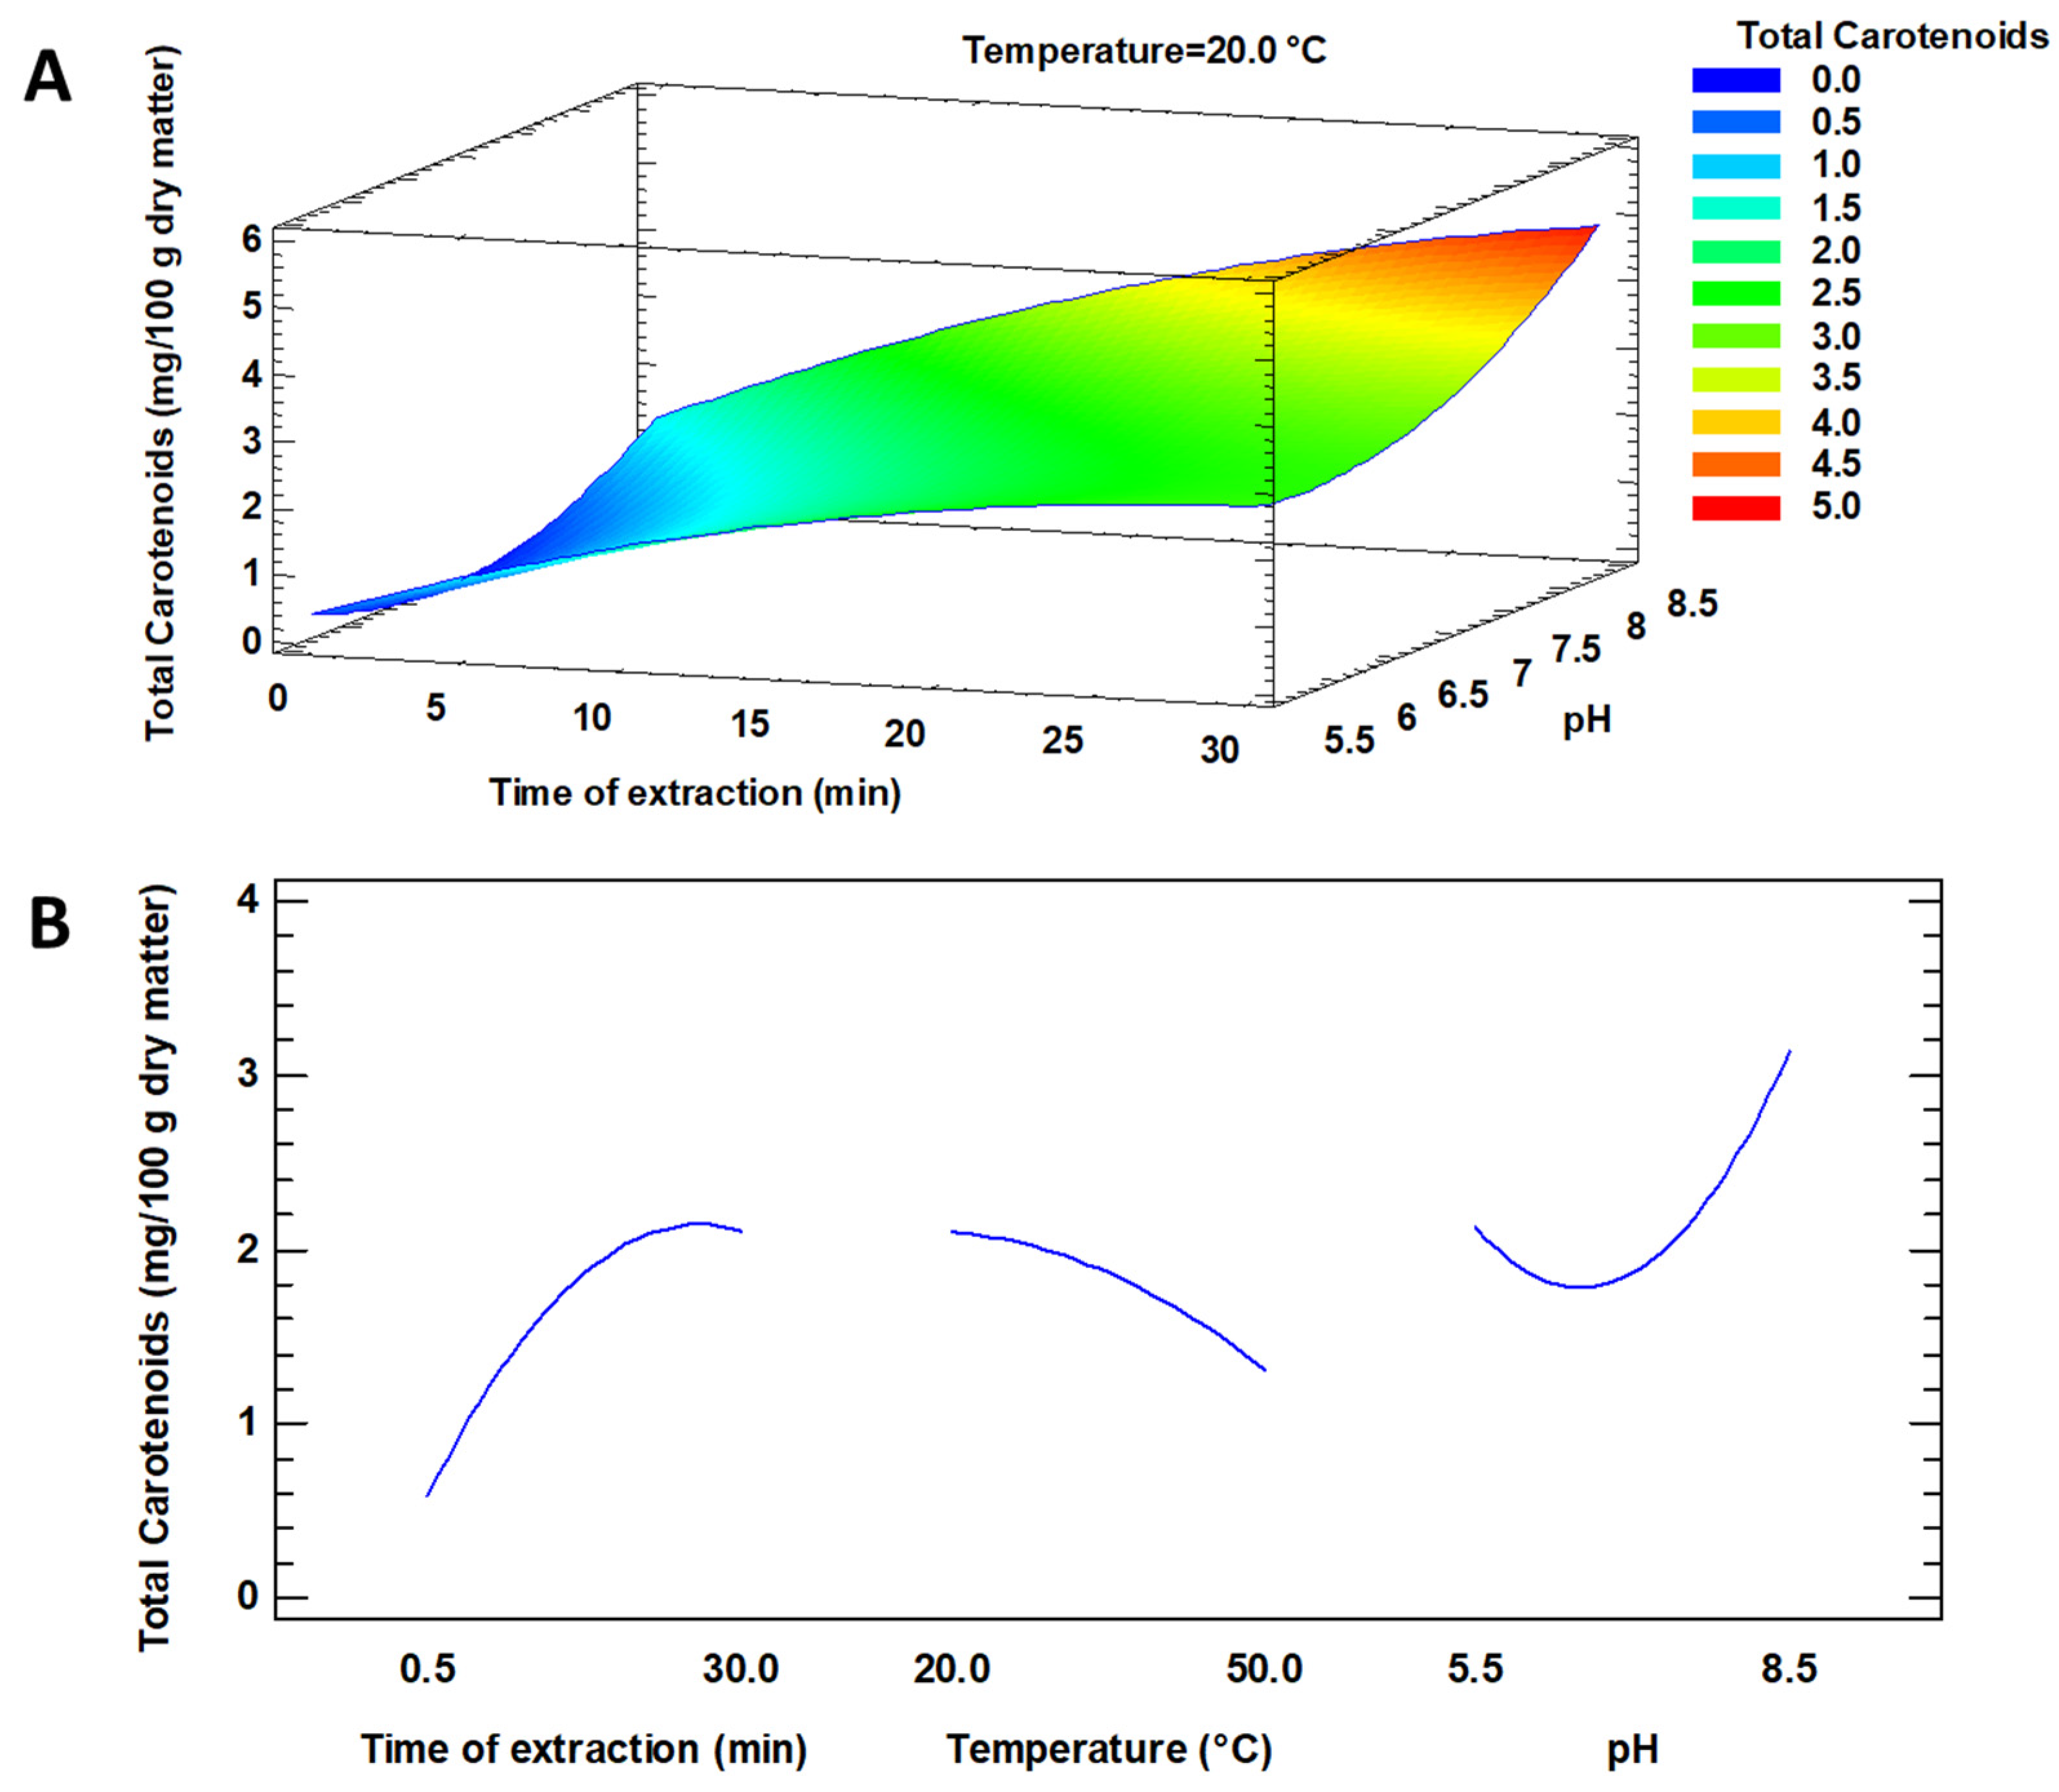
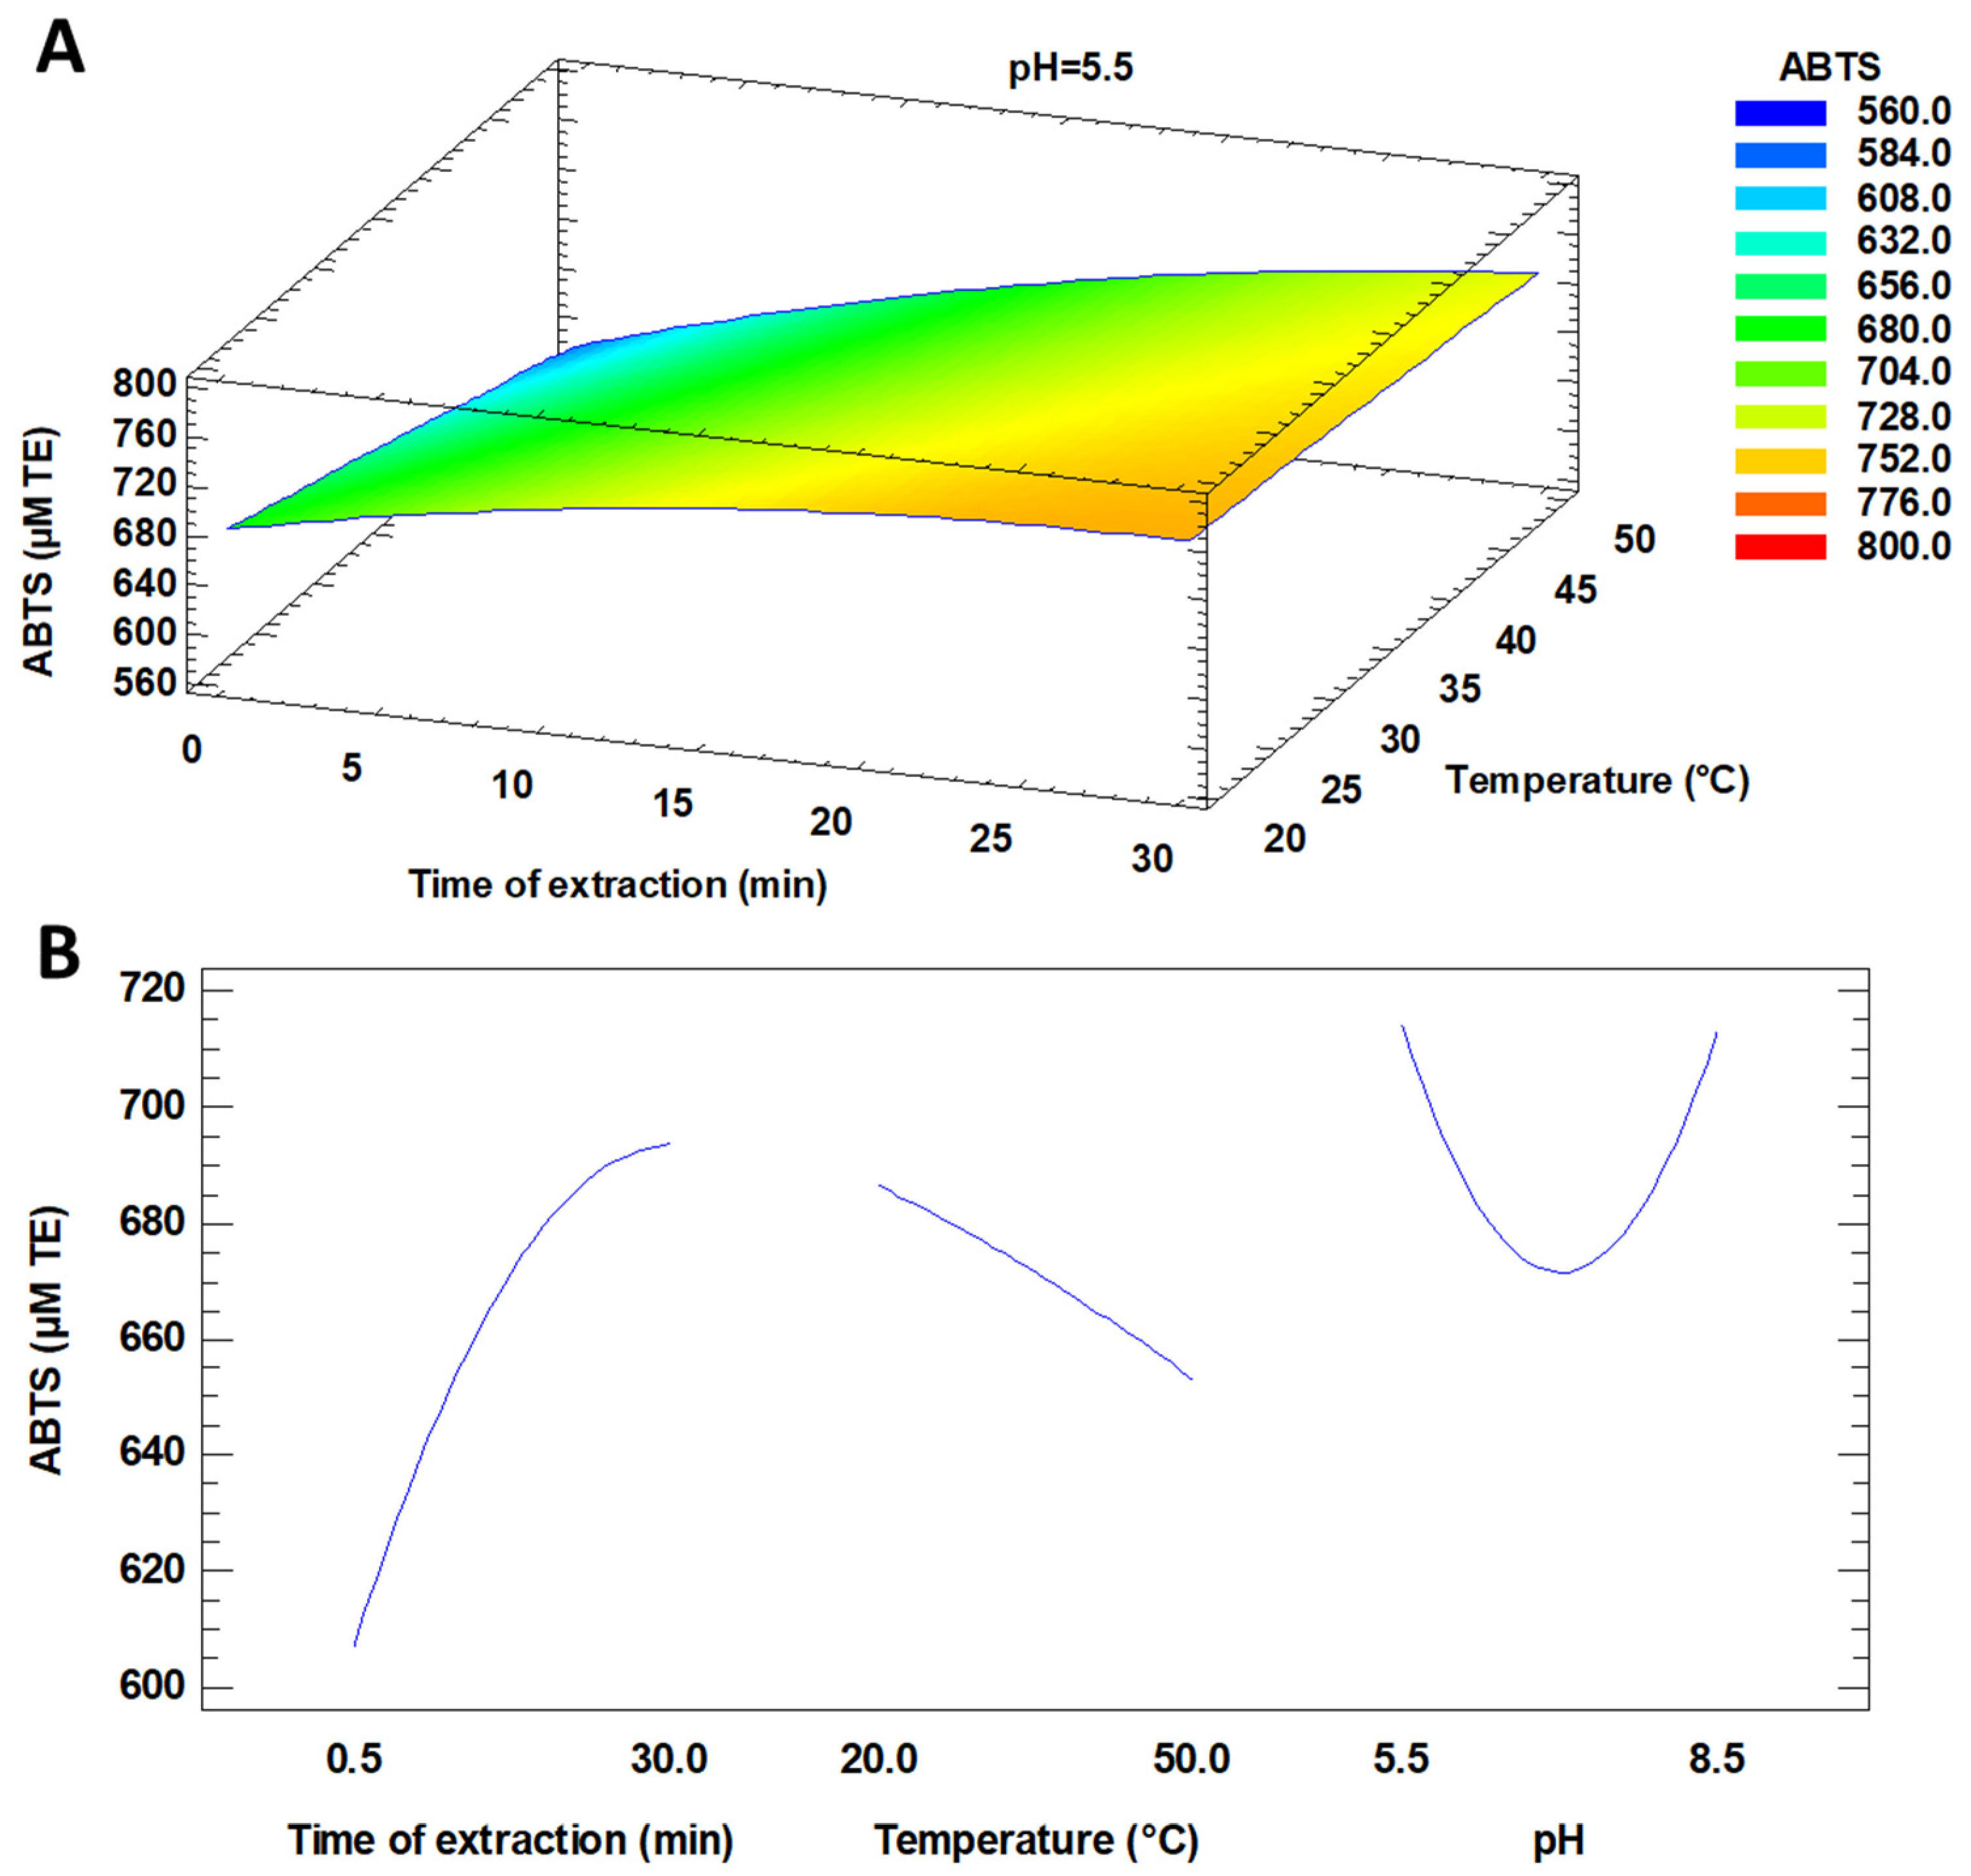
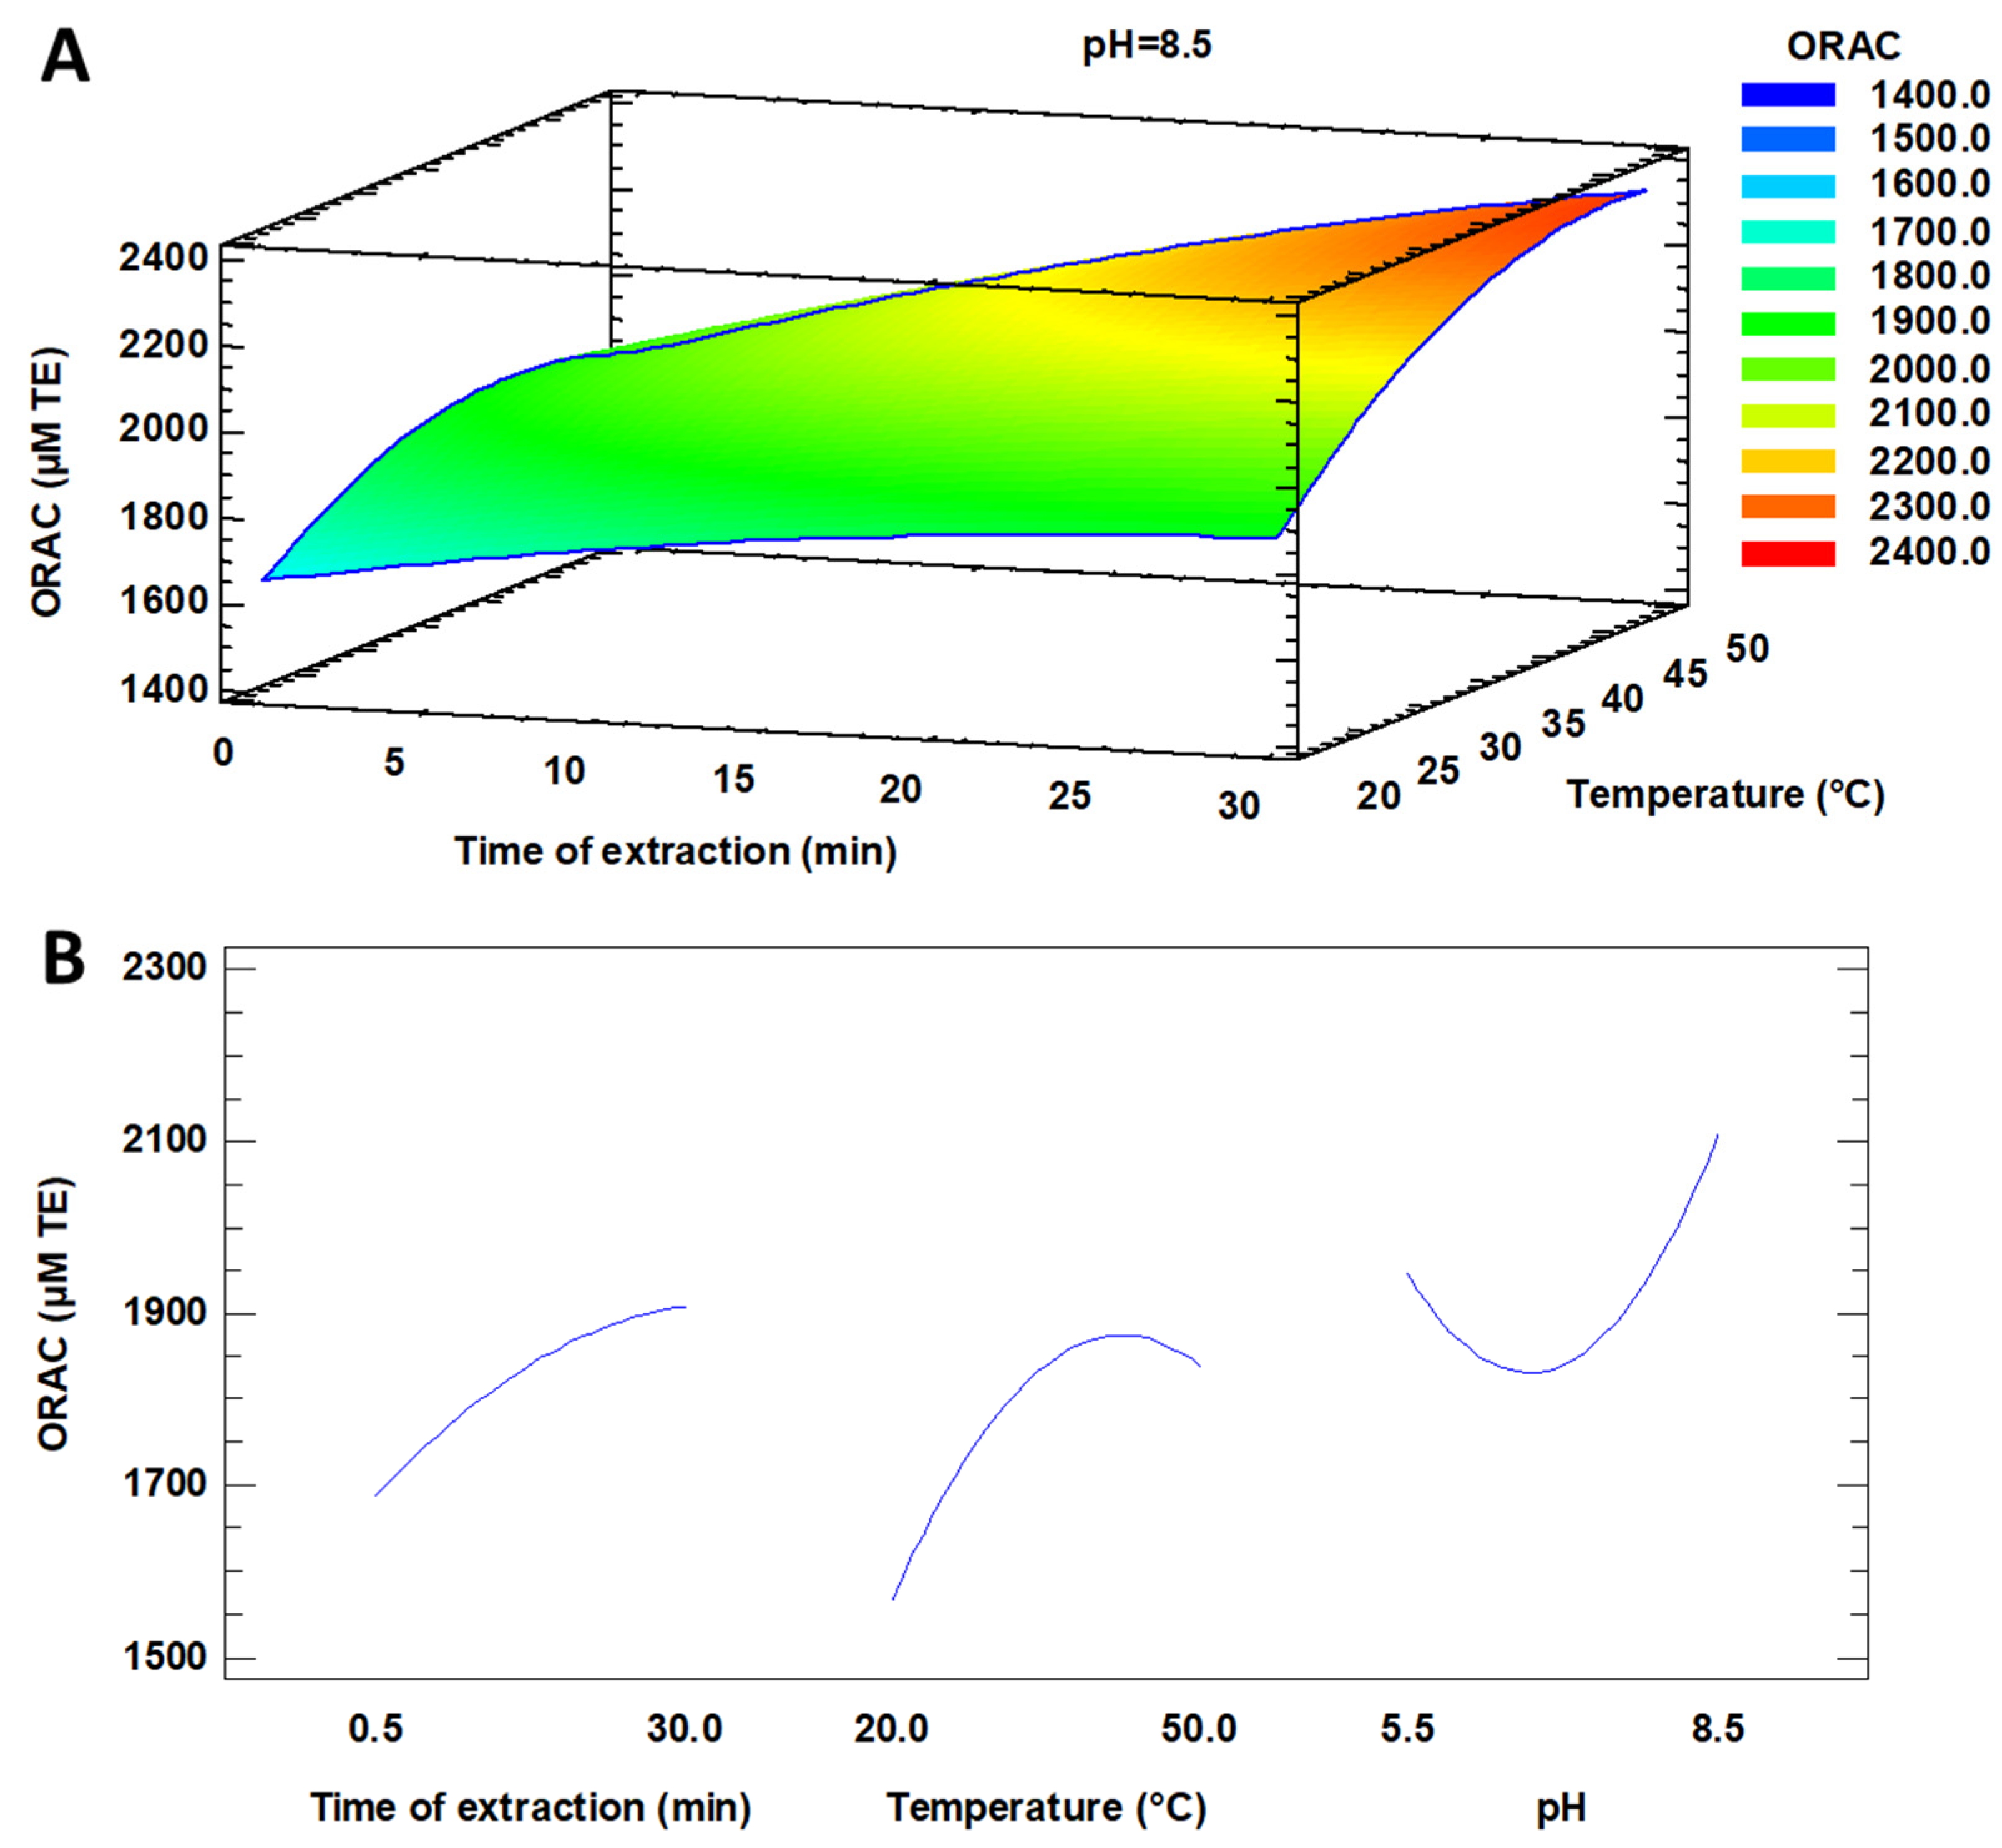
3.1.2. Antioxidant Capacity and Compounds
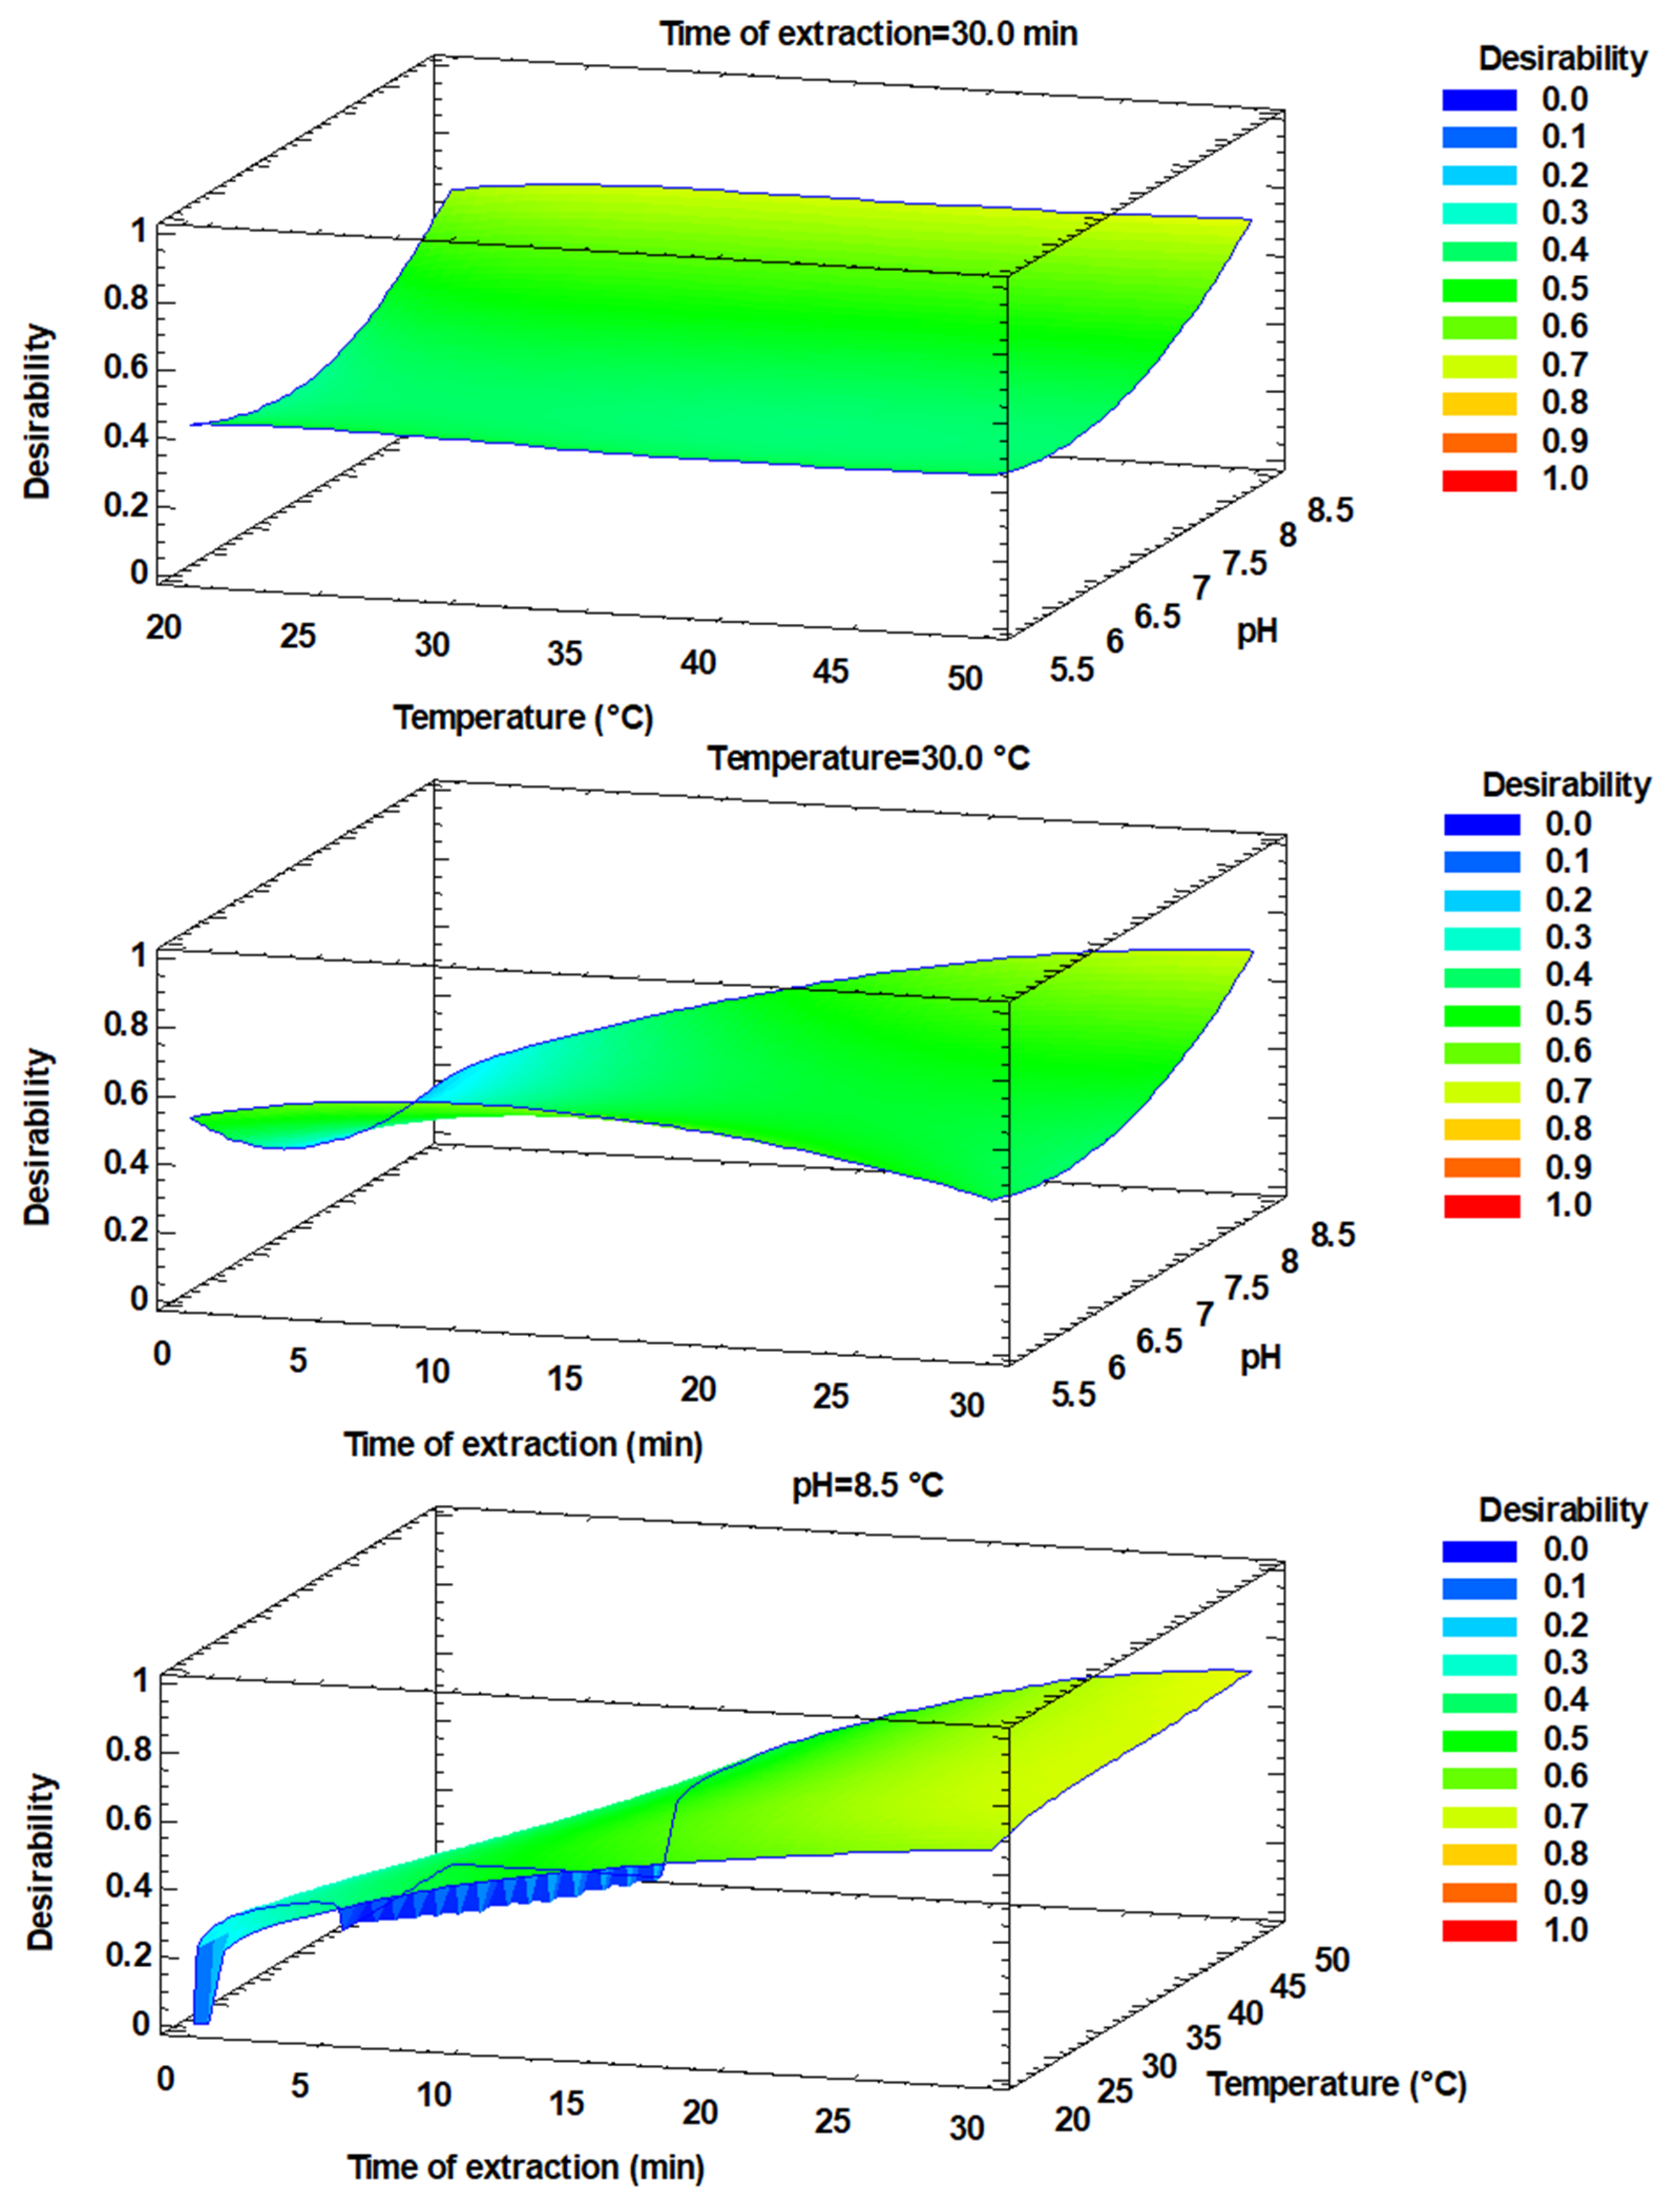
Regarding pigment extraction, the chlorophyll A values ranged from 17.99 to 37.95 mg/100 g dry matter, and the carotenoid values were quite smaller, ranging from 0 to 4.93 mg/100 g dry matter (Table 3). The optimal conditions for the highest extraction of chlorophyll A were 0.5 min, 20 °C and a pH of 5.5, obtaining a theoretical value of 36.28 mg/100 g dry matter. The optimal conditions for carotenoid recovery were 30 min, 20 °C and a pH of 8.5, reaching a theoretical value of 4.87 mg/100 g dry matter. As can be observed in the table, the theoretical optimal values were really close to those obtained experimentally with the same conditions (36.28 vs. 35.56 for chlorophyll A and 4.87 vs. 4.93 mg/100 g dry matter for the carotenoids).
On the other hand, the total phenolic compounds (TPCs) ranged from 316.76 to 761.55 mg GAE/100 g dry matter (Table 3). The optimal conditions for their extraction were 16.07 min, 20.05 °C and a pH of 5.5, obtaining a value of 854.70 mg GAE/100 g dry matter.
For chlorophyll A, none of the parameters studied significantly influenced its extraction, obtaining p values much higher than 0.05. In this sense, Parniakov et al. [17] did not find differences in the chlorophyll extraction in aqueous media for Nannochloropsis spp. when increasing the time of the ultrasound treatment. Although they were not significant, it seemed that the extraction time had a positive influence on the chlorophyll A extraction, while the temperature increase had a negative effect on it (Figure 3).
For the carotenoids, the extraction time had a strong influence (p = 0.0192), although the temperature and pH did not have a significant effect (p = 0.1493 and 0.0815, respectively). The extraction time clearly improved carotenoid extraction, while the temperature had a slight impact, decreasing carotenoid recovery. Additionally, at pH = 7, the carotenoid extraction was at its minimum, while the maximum value was obtained at a pH level of 8.5 (Figure 4). Gilbert-López et al. [30], who optimized the microwave and pressurized liquid extraction of carotenoids from P. tricornutum, also described a reduction in carotenoid extraction when the temperatura increased, probably due to compound degradation.
Regarding the TPC, the most influential parameter in their extraction was the time (p = 0.0496). The efficiency of the extraction increased with the passage of time (up to 16 min) when the TPC value was at its maximum. After 16 min, this value decreased (Figure 5). This is in close agreement with the results reported by Parniakov et al. [17] for Nannochloropsis spp., who found that the optimal extraction of the total phenolic compounds assisted by ultrasound (W= 400 W) was achieved after 15 min. Martínez-Sanz et al. [31] also found a huge increase in the TPC extraction from Nannochloropsis gaditana, Scenedesmus almeriensis and Spirulina platensis after ultrasound treatment for 5 min. The temperature and pH did not significantly influence the polyphenol extraction (p = 0.5568 and 0.2021, respectively). Other authors, such as Yucetepe et al. [32], also reported that neither the temperature nor the pH had a significant influence on the UAE of TPC from Spirulina platensis.
Finally, regarding the total antioxidant activity, the ABTS values ranged from 563.82 to 760.11 µM TE, while the ORAC values where higher, ranging from 1416.81 to 2340.01 µM TE. The optimal conditions for the maximum antioxidant capacity measured by the ABTS method were 28.36 min, 20 °C and pH = 5.5, obtaining a theoretical value of 758.28 µM TE. On the other hand, for the ORAC assay, the best conditions were 30 min, 47.65 °C and pH = 8.5. The theoretical antioxidant activity measured by the ORAC assay applying the optimal conditions was 2338.54 µM TE, really close to the experimental values obtained with the extraction for 30 min at 50 °C and pH = 8.5 (2340.01 µM TE) (Table 4). These values of the antioxidant capacity are in the same range as those described in the literature for P. tricornutum [30,33].
As can be seen in Figure 6, the antioxidant activity measured by the ABTS assay was strongly influenced by the extraction time (p = 0.0044), but the temperature (p = 0.1386) and pH (p = 0.9547) did not show a great impact. The increase of the extraction time led to a clear improved antioxidant capacity, from 698.57 µM at 0.5 min to 760.11 µM at 30 min (at the optimal conditions for the temperature and pH, 20 °C and 5.5, respectively). This can be explained by the increase in the antioxidant compounds´ extraction with the passage of time. Akyıl et al. [34] also found a significant influence of the extraction time on the antioxidant activity, measured by DPPH, when they optimized the bioactive compound extraction from P. tricornutum. However, Kokkali et al. [15] found a minimal decrease in antioxidant activity, measured by ABTS in P. tricornutum aqueous extracts, comparing 4 h and 24 h of extraction. The differences with our study can be explained regarding the huge time interval. For instance, in the present study, a time range was established from 0.5 min up to 30 min, while in the study conducted by Kokkali et al. [15], the time range was from 4 h to 24 h.
On the other hand, the extraction time also significantly influenced (p = 0.0364) the the antioxidant activity, measured by the ORAC method. Moreover, the temperature also affected the ORAC value even stronger (p = 0.0167) than the extraction time (Figure 7). Concerning the extraction time, it can be seen that at 20 °C and pH = 8.5, the antioxidant activity was 1766.48 µM TE at 0.5 min. However, when the time increased up to 30 min, the antioxidant activity was augmented (1842.10 µM TE). Furthermore, increasing the temperature also resulted in an improvement of the antioxidant activity. In our study, at pH = 8.5 and after 30 min of extraction (optimal conditions), the antioxidant activity measured by the ORAC assay was enhanced from 1842.10 µM TE at 20 °C up to 2340.01 µM TE at 50 °C. As can be seen, the ORAC values increased with the increasing temperature and extraction time, despite the fact that all the possible antioxidant compounds studied in the present work decreased under these conditions. This may be due to the presence of other compounds not identified in this study that may have had an impact on the antioxidant capacity measured by the ORAC method. It has been seen that the ORAC assay had a higher affinity for lipophilic compounds. Therefore, it could be that with these conditions, the amount of antioxidant lipid compounds extracted increased, contributing to the enhanced antioxidant capacity values measured by the ORAC assay [33].
German-Baez et al. [35] found lower values for the ABTS and ORAC assays when measuring the antioxidant capacity of P. tricornutum residual biomass (67.93 and 106.22 µM TE/g dry weight, respectively). However, this difference can be explained by their use of a microalgae by-product from biofuel production instead of full microalgae. Then, the presence of the antioxidant compounds would be lower than in the original microalgae.

3.1.3. Optimization

Once the optimal conditions for each response studied were obtained, the method was optimized to achieve the maximum yield in all of them. After multiple optimizations, the overall optimal conditions obtained were 30 min of extraction at 50 °C and a pH level of 8.5 (Table 5). As can be seen in Figure 8, the desirability obtained at the optimal conditions was 0.72. This low result can be due to the different behavior of the studied responses. For instance, in this study, pigment extraction decreased when the temperature increased, while the antioxidant activity had the opposite behavior. This could explain why the temperature did not influence the overall response.
It would be necessary to further investigate whether longer extraction times could improve the recovery of these compounds and the total antioxidant capacity. However, it must be taken into account that prolonged ultrasound treatment could end up degrading the extracted compounds. On the other hand, it is not advisable to increase the temperature further because it can degrade bioactive compounds, such as pigments [17]. Finally, a broader range of pH should be also studied.

3.2. Influence of the Extraction Method on the Protein Profile and Molecular Weight Distribution

After obtaining the optimal conditions for the UAE of the nutrients and bioactive compounds with antioxidant capacity, the protein extraction was compared with a control sample. To obtain the control sample, an extraction was carried out with the same optimal parameters (30 min, 50 °C and pH = 8.5) by shaking and without ultrasound treatment.
In Figure 9A, the protein profiles of both the optimal and control samples are shown. As can be seen in the figure, there is a strongly marked band above 23 kDa in all of them. According to previous studies, this band fit with fucoxanthin, which has a molecular weight of 17–23 kDa from the fucoxanthin–chlorophyll complex [36,37,38,39]. The quantification of these bands, based on the BSA (Bovine Serum Albumin) standard of 60 µg/mL, is shown in Figure 9B. As can be appreciated, there were no significant differences between the control samples and the optimal ones. Then, it can be concluded that both treatments had a similar fucoxanthin extraction efficiency. Moreover, both treatments were also similar concerning the protein profile, due to there being only one marked band in both treatments.

4. Conclusions

The optimization of the extraction of nutrients, pigments and polyphenols, in addition to the antioxidant activity, using the response surface methodology gave the optimal extraction conditions of a time of 30 min, a temperature of 50 °C and a pH of 8.5. The influence of the parameters studied (extraction time, temperature and pH) differed according to the target compounds, showing different behaviors depending on the nutrients and antioxidant high added-value components. Therefore, it can be concluded that the microalgae P. tricornutum is a good source of nutrients, chlorophyll and phenolic compounds. However, the limitations of the present work are related to the use of relatively short extraction times, as well as a narrow pH range. It should be also mentioned that UAE conditions were applied only at a frequency of 20 kHz and a power of 100 W, so it would be interesting to investigate other treatments and UAE modalities (sonotrode) in future studies. More studies are needed in order to improve the efficiency of the extraction of high added-value compounds from P. tricornutum, reducing costs, increasing the yield and evaluating the potential scalability of the UAE process.

Author Contributions

Conceptualization, E.F. and F.J.B.; methodology, F.A.K. and N.P.; formal analysis, F.A.K. and F.J.M.-Q.; software, F.J.M.-Q. and N.P.; resources, F.J.B. and E.F.; writing—original draft preparation, F.A.K., F.J.M.-Q., N.P. and F.J.B.; writing—review and editing, F.J.B. and E.F.; supervision, E.F. and F.J.B.; funding acquisition, F.J.B. and E.F. All authors have read and agreed to the published version of the manuscript.

Funding

This research was partially funded by the EU Commission and BBI-JU Horizon H2020, through the AQUABIOPRO-FIT project (aquaculture and agriculture biomass side stream proteins and bioactives for feed, fitness and health promoting nutritional supplements) grant number 790956.

Institutional Review Board Statement

Not applicable.

Informed Consent Statement

Not applicable.

Data Availability Statement

Not applicable.

Acknowledgments

F.J.M.-Q. would like to thank the pre-PhD scholarship program of the University of Valencia, Atracció de Talent. Moreover, the authors also would like to acknowledge Katerina Kousoulaki and Marielena Kokkali, as well as Dorinde Kleingris and her team at the National Algae pilot plant in Mongstad (NAM) in Norway for cultivating and providing the P. tricornutum biomass samples to carry out the experiments. Finally, the authors also thank the Research Council of Norway, which provided funding through the A2F (Algae 2 Future) project (Project No. 267872/E50) for the production of the microalgae biomass used in this study.

Conflicts of Interest

The authors declare no conflict of interest.

References

  1. Gullón, B.; Gagaoua, M.; Barba, F.J.; Gullón, P.; Zhang, W.; Lorenzo, J.M. Seaweeds as promising resource of bioactive compounds: Overview of novel extraction strategies and design of tailored meat products. Trends Food Sci. Technol. 2020, 100, 1–18. [Google Scholar] [CrossRef]
  2. Jalilian, N.; Najafpour, G.D.; Khajouei, M. Macro and micro algae in pollution control and biofuel production—A review. ChemBioEng Rev. 2020, 7, 18–33. [Google Scholar] [CrossRef]
  3. De Jesus Raposo, M.F.; De Morais, R.M.S.C.; De Morais, A.M.M.B. Health applications of bioactive compounds from marine microalgae. Life Sci. 2013, 93, 479–486. [Google Scholar] [CrossRef] [PubMed]
  4. Chauton, M.S.; Olsen, Y.; Vadstein, O. Biomass production from the microalga Phaeodactylum tricornutum: Nutrient stress and chemical composition in exponential fed-batch cultures. Biomass Bioenergy 2013, 58, 87–94. [Google Scholar] [CrossRef]
  5. Schmitt, D.; Müller, A.; Csögör, Z.; Frimmel, F.H.; Posten, C. The adsorption kinetics of metal ions onto different microalgae and siliceous earth. Water Res. 2001, 35, 779–785. [Google Scholar] [CrossRef]
  6. Yang, Y.-H.; Du, L.; Hosokawa, M.; Miyashita, K.; Kokubun, Y.; Arai, H.; Taroda, H. Fatty acid and lipid class composition of the microalga Phaeodactylum tricornutum. J. Oleo Sci. 2017, 66, 363–368. [Google Scholar] [CrossRef] [Green Version]
  7. Hualian, W.; Tao, L.; Guanghua, W.; Shikun, D.; Hui, H.; Wenzhou, X. A comparative analysis of fatty acid composition and fucoxanthin content in six Phaeodactylum tricornutum strains from different origins. Chin. J. Oceanol. Limnol. 2016, 34, 391–398. [Google Scholar]
  8. Barba, F.J.; Grimi, N.; Vorobiev, E. New approaches for the use of non-conventional cell disruption technologies to extract po-tential food additives and nutraceuticals from microalgae. Food Eng. Rev. 2014, 7, 45–62. [Google Scholar] [CrossRef]
  9. Michalak, I.; Chojnacka, K. Algal extracts: Technology and advances. Eng. Life Sci. 2014, 14, 581–591. [Google Scholar] [CrossRef]
  10. Chemat, F.; Vian, M.A.; Fabiano-Tixier, A.-S.; Nutrizio, M.; Jambrak, A.R.; Munekata, P.E.S.; Lorenzo, J.M.; Barba, F.J.; Binello, A.; Cravotto, G. A review of sustainable and intensified techniques for extraction of food and natural products. Green Chem. 2020, 22, 2325–2353. [Google Scholar] [CrossRef] [Green Version]
  11. Vernès, L.; Abert-Vian, M.; El Maâtaoui, M.; Tao, Y.; Bornard, I.; Chemat, F. Application of ultrasound for green extraction of proteins from spirulina. Mechanism, optimization, modeling, and industrial prospects. Ultrason. Sonochemistry 2019, 54, 48–60. [Google Scholar] [CrossRef]
  12. Parniakov, O.; Barba, F.J.; Grimi, N.; Marchal, L.; Jubeau, S.; Lebovka, N.; Vorobiev, E. Pulsed electric field and pH assisted selective extraction of intracellular components from microalgae nannochloropsis. Algal Res. 2015, 8, 128–134. [Google Scholar] [CrossRef]
  13. Pasquet, V.; Chérouvrier, J.-R.; Farhat, F.; Thiéry, V.; Piot, J.-M.; Bérard, J.-B.; Kaas, R.; Serive, B.; Patrice, T.; Cadoret, J.-P.; et al. Study on the microalgal pigments extraction process: Performance of microwave assisted extraction. Process. Biochem. 2011, 46, 59–67. [Google Scholar] [CrossRef] [Green Version]
  14. Pieber, S.; Schober, S.; Mittelbach, M. Pressurized fluid extraction of polyunsaturated fatty acids from the microalga Nanno-chloropsis oculata. Biomass Bioenergy 2012, 47, 474–482. [Google Scholar] [CrossRef]
  15. Kokkali, M.; Martí-Quijal, F.J.; Taroncher, M.; Ruiz, M.-J.; Kousoulaki, K.; Barba, F.J. Improved extraction efficiency of anti-oxidant bioactive compounds from Tetraselmis chuii and Phaedoactylum tricornutum using pulsed electric fields. Molecules 2020, 25, 3921. [Google Scholar] [CrossRef] [PubMed]
  16. Poojary, M.; Barba, F.; Aliakbarian, B.; Donsì, F.; Pataro, G.; Dias, D.; Juliano, P. Innovative alternative technologies to extract carotenoids from microalgae and seaweeds. Mar. Drugs 2016, 14, 214. [Google Scholar] [CrossRef]
  17. Parniakov, O.; Apicella, E.; Koubaa, M.; Barba, F.J.; Grimi, N.; Lebovka, N.; Pataro, G.; Ferrari, G.; Vorobiev, E. Ultrasound-assisted green solvent extraction of high-added value compounds from microalgae Nannochloropsis spp. Bioresour. Technol. 2015, 198, 262–267. [Google Scholar] [CrossRef]
  18. Adam, F.; Abert-Vian, M.; Peltier, G.; Chemat, F. “Solvent-free” ultrasound-assisted extraction of lipids from fresh microalgae cells: A green, clean and scalable process. Bioresour. Technol. 2012, 114, 457–465. [Google Scholar] [CrossRef]
  19. Hildebrand, G.; Poojary, M.M.; O’Donnell, C.; Lund, M.N.; Garcia-Vaquero, M.; Tiwari, B.K. Ultrasound-assisted processing of Chlorella vulgaris for enhanced protein extraction. J. Appl. Phycol 2020, 32, 1709–1718. [Google Scholar] [CrossRef]
  20. Knorr, D.; Froehling, A.; Jaeger, H.; Reineke, K.; Schlueter, O.; Schoessler, K. Emerging technologies in food processing. Annu. Rev. Food Sci. Technol. 2011, 2, 203–235. [Google Scholar] [CrossRef] [Green Version]
  21. Gavahian, M.; Pallares, N.; Al Khawli, F.; Ferrer, E.; Barba, F.J. Recent advances in the application of innovative food processing technologies for mycotoxins and pesticide reduction in foods. Trends Food Sci. Technol. 2020, 106, 209–218. [Google Scholar] [CrossRef]
  22. Smith, P.; Krohn, R.; Hermanson, G.; Mallia, A.; Gartner, F.; Provenzano, M.; Fujimoto, E.; Goeke, N.; Olson, B.; Klenk, D. Measurement of protein using bicinchoninic acid. Anal. Biochem. 1985, 150, 76–85. [Google Scholar] [CrossRef]
  23. Parniakov, O.; Barba, F.J.; Grimi, N.; Marchal, L.; Jubeau, S.; Lebovka, N.; Vorobiev, E. Pulsed electric field assisted extraction of nutritionally valuable compounds from microalgae Nannochloropsis spp. using the binary mixture of organic solvents and water. Innov. Food Sci. Emerg. Technol. 2015, 27, 79–85. [Google Scholar] [CrossRef]
  24. Martí-Quijal, F.J.; Tornos, A.; Príncep, A.; Luz, C.; Meca, G.; Tedeschi, P.; Ruiz, M.-J.; Barba, F.J. Impact of fermentation on the recovery of antioxidant bioactive compounds from sea bass byproducts. Antioxidants 2020, 9, 239. [Google Scholar] [CrossRef] [Green Version]
  25. Zavřel, T.; Očenášová, P.; Sinetova, M.A.; Červený, J. No title determination of storage (starch/glycogen) and total saccharides content in algae and cyanobacteria by a phenol-sulfuric acid method. Bio Protoc. 2018, 8, 1–13. [Google Scholar] [CrossRef]
  26. De la Fuente, B.; López-García, G.; Máñez, V.; Alegría, A.; Barberá, R.; Cilla, A. Evaluation of the bioaccessibility of antioxidant bioactive compounds and minerals of four genotypes of Brassicaceae microgreens. Foods 2019, 8, 1–16. [Google Scholar] [CrossRef] [PubMed] [Green Version]
  27. Roselló-Soto, E.; Martí-Quijal, F.J.; Cilla, A.; Munekata, P.E.S.; Lorenzo, J.M.; Remize, F.; Barba, F.J. Influence of temperature, solvent and pH on the selective extraction of phenolic compounds from tiger nuts by-products: Triple-TOF-LC-MS-MS characterization. Molecules 2019, 4, 797. [Google Scholar] [CrossRef] [Green Version]
  28. Lupatini, A.L.; de Oliviera Bispo, L.; Colla, L.M.; Costa, J.A.V.; Canan, C.; Colla, E. Protein and carbohydrate extraction from S. platensis biomass by ultrasound and mechanical agitation. Food Res. Int. 2017, 99, 1028–1035. [Google Scholar] [CrossRef] [PubMed]
  29. Sánchez-Zurano, A.; Morillas-España, A.; González-López, C.V.; Lafarga, T. Optimisation of protein recovery from Arthrospira platensis by ultrasound-assisted isoelectric solubilisation/precipitation. Processes 2020, 8, 1586. [Google Scholar] [CrossRef]
  30. Gilbert-López, B.; Barranco, A.; Herrero, M.; Cifuentes, A.; Ibáñez, E. Development of new green processes for the recovery of bioactives from Phaeodactylum tricornutum. Food Res. Int. 2017, 99, 1056–1065. [Google Scholar] [CrossRef] [Green Version]
  31. Martínez-Sanz, M.; Garrido-Fernández, A.; Mijlkovic, A.; Krona, A.; Martínez-Abad, A.; Coll-Marqués, J.M.; López-Rubio, A.; Lopez-Sanchez, P. Composition and rheological properties of microalgae suspensions: Impact of ultrasound processing. Algal Res. 2020, 49, 101960. [Google Scholar] [CrossRef]
  32. Yucetepe, A.; Saroglu, O.; Bildik, F.; Ozcelik, B.; Daskaya-Dikmen, C.; Aysun, Y.; Oznur, S.; Ceren, D.-D.; Fatih, B.; Beraat, Ö. Optimisation of ultrasound-assisted extraction of protein from Spirulina platensis using RSM. Czech J. Food Sci. 2018, 36, 98–108. [Google Scholar] [CrossRef] [Green Version]
  33. Banskota, A.H.; Sperker, S.; Stefanova, R.; McGinn, P.J.; O’Leary, S.J.B. Antioxidant properties and lipid composition of selected microalgae. J. Appl. Phycol. 2018, 31, 309–318. [Google Scholar] [CrossRef]
  34. Akyıl, S.; Ilter, I.; Koç, M.; Demirel, Z.; Erdoğan, A.; Dalay, M.C.; Ertekin, F.K. Effects of extraction methods and conditions on bioactive compounds extracted from Phaeodactylum tricornutum. Acta Chim. Slov. 2020, 67, 1250–1261. [Google Scholar] [CrossRef]
  35. German-Báez, L.J.; Valdez-Flores, M.A.; Félix-Medina, J.V.; Norzagaray-Valenzuela, C.D.; Santos-Ballardo, D.U.; Reyes-Moreno, C.; Shelton, L.M.; Valdez-Ortiz, A. Chemical composition and physicochemical properties of Phaeodactylum tricor-nutum microalgal residual biomass. Food Sci. Technol. Int. 2017, 23, 681–689. [Google Scholar] [CrossRef] [PubMed]
  36. Stack, J.; Le Gouic, A.V.; Tobin, P.R.; Guihéneuf, F.; Stengel, D.B.; Fitzgerald, R.J. Protein extraction and bioactive hydrolysate generation from two microalgae, Porphyridium purpureum and Phaeodactylum tricornutum. J. Food Bioact. 2018, 1, 153–165. [Google Scholar] [CrossRef] [Green Version]
  37. Chia, S.R.; Chew, K.W.; Leong, H.Y.; Manickam, S.; Show, P.L.; Nguyen, T.H.P. Sonoprocessing-assisted solvent extraction for the recovery of pigment-protein complex from Spirulina platensis. Chem. Eng. J. 2020, 398, 125613. [Google Scholar] [CrossRef]
  38. Veith, T.; Büchel, C. The monomeric photosystem I-complex of the diatom Phaeodactylum tricornutum binds specific fucoxanthin chlorophyll proteins (FCPs) as light-harvesting complexes. Biochim. Biophys. Acta Bioenerg. 2007, 1767, 1428–1435. [Google Scholar] [CrossRef] [PubMed] [Green Version]
  39. Gelzinis, A.; Butkus, V.; Songaila, E.; Augulis, R.; Gall, A.; Büchel, C.; Robert, B.; Abramavicius, D.; Zigmantas, D.; Valkunas, L. Mapping energy transfer channels in fucoxanthin–chlorophyll protein complex. Biochim. Biophys. Acta Bioenerg. 2015, 1847, 241–247. [Google Scholar] [CrossRef]
Figure 1. Influence of the different extraction conditions (A) and main effects chart for these conditions (B) on the protein recovery yield (g/100 g dry matter). The least relevant factor (highest p-value) has been set at its optimal value.
Applsci 11 01701 g001
Figure 2. Influence of the different extraction conditions (A) and main effects chart for these conditions (B) on the carbohydrate recovery yield (g/100 g dry matter). The least relevant factor (highest p-value) has been set at its optimal value.
Applsci 11 01701 g002
Figure 3. Influence of the different extraction conditions (A) and main effects chart for these conditions (B) on chlorophyll A’s recovery yield (mg/100 g dry matter). The least relevant factor (highest p-value) has been set at its optimal value.
Applsci 11 01701 g003
Figure 4. Influence of the different extraction conditions (A) and main effects chart for these conditions (B) on the total carotenoid recovery yield (mg/100 g dry matter). The least relevant factor (highest p-value) has been set at its optimal value.
Applsci 11 01701 g004
Figure 5. Influence of the different extraction conditions (A) and main effects chart for these conditions (B) on the total phenolic compounds (TPC) recovery yield (mg/100 g dry matter). The least relevant factor (highest p-value) has been set at its optimal value.
Applsci 11 01701 g005
Figure 6. Influence of the different extraction conditions (A) and main effects chart for these conditions (B) on the total antioxidant activity (µM TE), measured by the ABTS method. The least relevant factor (highest p-value) has been set at its optimal value.
Applsci 11 01701 g006
Figure 7. Influence of the different extraction conditions (A) and main effects chart for these conditions (B) on the total antioxidant activity (µM TE), measured by the ORAC method. The least relevant factor (highest p-value) has been set at its optimal value.
Applsci 11 01701 g007
Figure 8. Influence of the different extraction conditions on the optimization desirability for the higher yield of all the studied responses. The fixed factor in each graph has been set at its optimal value.
Applsci 11 01701 g008
Figure 9. (A) Protein profile and molecular weight distribution of the P. tricornutum extracts, comparing the ultrasound-assisted extraction (UAE) optimal conditions vs. the control conditions (shaking). The optimal conditions with UAE had six replicates, while the control conditions for extraction (shaking) had two replicates. (B) Relative quantification of the band at 23 kDa (fucoxanthin) based on a BSA sample at 60 µg/mL.
Applsci 11 01701 g009
Table 1. Conditions of time of extraction (min), temperature ( °C) and pH for the 16 experiments included in the response surface optimization.
Run #Time of Extraction (min)Temperature ( °C)pH
115207
230208.5
330205.5
40.5208.5
50.5205.5
615357
715357
815358.5
915355.5
1030357
110.5357
1215507
1330508.5
1430505.5
150.5508.5
160.5505.5
Table 2. Proteins and carbohydrates (g/100 g dry matter) obtained after ultrasound-assisted extraction at different times, temperatures and pH levels.
Run #Time of Extraction (min)Temperature
( °C)
pHProteins
(g/100 g Dry Matter)
Carbohydrates
(g/100 g Dry Matter)
1152075.191.48
230208.56.101.56
330205.55.371.79
40.5208.54.741.39
50.5205.55.472.16
6153575.032.13
7153574.802.01
815358.55.142.33
915355.55.402.03
10303574.281.90
110.53574.711.91
12155075.342.10
1330508.55.232.52
1430505.54.692.03
150.5508.54.141.84
160.5505.54.952.22
Table 3. Chlorophyll A, total carotenoids (mg/100 g dry matter) and total phenolic compounds (TPC) (mg GAE/100 g dry matter) obtained after ultrasound-assisted extraction at different times, temperatures and pH levels. GAE: Gallic Acid Equivalent
Run #Time of Extraction (min)Temperature ( °C)pHChlorophyll A (mg/100 g Dry Matter)Carotenoids (mg/100 g Dry Matter)TPC (mg GAE/100 g Dry Matter)
11520727.441.91731.00
230208.537.954.93761.55
330205.522.532.76659.63
40.5208.521.571.91474.73
50.5205.535.560.00645.69
61535726.751.67689.54
71535722.471.95680.89
815358.520.902.11707.85
915355.533.453.22672.36
103035721.222.16461.25
110.535728.340.59316.76
121550722.941.55736.82
1330508.535.072.64599.00
1430505.528.350.49598.96
150.5508.517.991.38514.40
160.5505.524.161.48719.68
Table 4. Antioxidant activity (µM TE) measured by the ABTS and oxygen radical antioxidant capacity (ORAC) methods, obtained after ultrasound-assisted extraction at different times, temperatures and pH levels.
Run #Time of Extraction (min)Temperature ( °C)pHABTS (µM TE)ORAC (µM TE)
115207658.891416.81
230208.5701.411842.10
330205.5760.111681.80
40.5208.5696.021766.48
50.5205.5698.571693.02
615357673.391972.92
715357690.401863.11
815358.5715.772048.95
915355.5700.561924.95
1030357726.471973.97
110.5357563.821541.58
1215507670.331910.16
1330508.5721.492340.01
1430505.5718.511892.14
150.5508.5638.031812.60
160.5505.5600.731805.78
Table 5. Time of extraction, temperature and pH ranges and optimal values obtained after the optimization of the response surface model.
ParameterMinMaxOptimal
Time of extraction (min)0.530.030.0
Temperature ( °C)20.050.050.0
pH5.58.58.5
Publisher’s Note: MDPI stays neutral with regard to jurisdictional claims in published maps and institutional affiliations.

