In Situ Measurement of Sound Attenuation by Fish Schools (Japanese Horse Mackerel, Trachurus japonicus) at Mid-Frequency Bands


1
Maritime Security and Safety Research Center, Korea Institute of Ocean Science & Technology (KIOST), Busan 49111, Korea
2
Department of Ocean System Engineering, Jeju National University, Jeju 63243, Korea
*
Author to whom correspondence should be addressed.
Appl. Sci. 2021, 11(4), 1944; https://0-doi-org.brum.beds.ac.uk/10.3390/app11041944
Submission received: 11 January 2021
/
Revised: 8 February 2021
/
Accepted: 19 February 2021
/
Published: 23 February 2021
(This article belongs to the Collection Fishery Acoustics)
Abstract
:Acoustic waves are attenuated by fish schools as they propagate through the ocean. The attenuation by fish schools is not currently considered in fishery acoustics and sonar applications, especially at mid-frequency bands. In this study, fish school attenuation experiments were conducted with a number of individual fish in situ in a net cage at mid-frequency bands (3–7 kHz). The target fish species was the Japanese horse mackerel (Trachurus japonicus), which typically forms fish schools in the coastal ocean of northeastern Asia. The attenuated acoustic waves were measured for the cases of non-net, only net (0), 100, 200, 300, 400, and 500 individual horse mackerels in the net cage. Results showed that the acoustic signal attenuation increased with the number of horse mackerels. The mean and maximum attenuation coefficients were approximately 6.0–15.4 dB/m and 6.5–21.8 dB/m for all frequencies, respectively. The measured attenuation coefficients were compared with the ones from previous studies to propose new regression models with normalized extinction cross-sections of weight and length of fish. This study confirmed that the fish school attenuation could not be ignored and compensated at mid-frequencies in the ocean. These results would be useful for fishery acoustics, especially in the development of scientific echo-sounder, and naval applications of sonar operations and analysis.
1. Introduction
Sound propagation is influenced by the complex interference of reflection, refraction, transmission, and attenuation in ocean media [1]. Sonar systems when operating in marine environments are affected by sound propagation through physical parameters including the sound speed and density of seawater, geological parameters such as bottom topography and sediment types, and sea surface, which can cause reflections and scattering [1]. Prior studies have extensively covered the propagation of acoustic waves by physical and geological parameters, but few studies have explored biological parameters affecting sound propagation, such as fish schools [2].
Fish schools are randomly and largely distributed in the ocean and they are able to alter the sound propagation pattern [3,4]. Fish with swim bladders produce a large impedance difference compared with seawater, and the acoustic waves are scattered when passing through the fish body [5]. The propagation of acoustic waves is affected by the positions, orientations, and sizes of fish schools, which act as scatterers that attenuate incident waves. Fish schools result in acoustic energy loss, as the sound propagates through the water column [6,7,8]. Fish schools in the ocean are formed in various sizes and densities with a single fish school varying from a few hundred to tens of thousands of fish. In the case of a well-formed ocean area, very large fish schools are distributed and inhabited [9]. Therefore, the attenuation of fish schools cannot be ignored and needs to be investigated.
Japanese horse mackerel (Trachurus japonicus) is one of the representative fish species that typically form schools [10]. This fish is a warm-flowing migratory fish and an important commercial species in the coastal waters of the Northeastern Pacific Ocean of Korea, Japan, Taiwan, and China [10]. According to fisheries’ statistical data in Korea, about 43,053 tons of horse mackerels were cultured in 2019, which was 4.7% of the total amount of coastal and offshore fish culturing [11]. It continues to appear and inhabit the coasts of Korea, and the fishery volume gradually increased from 2014 to 2019 [11]. The horse mackerel forms small to large schools in the ocean, which are known to reach a maximum of 150 and 15 m in length and width, respectively [12,13]. However, the acoustic characteristics of horse mackerel schools have never been measured.
Some studies have shown the relationship between sound attenuation and fish populations at different frequencies through direct measurements of culture nets [14,15] and net cages [5,16], and indirect estimation methods [17,18,19]. Davies (1973) performed ex situ attenuation measurements by using the direct sphere method from Northern anchovy (Engraulis mordax) at 1–20 kHz and measured the attenuation at relatively low frequency to observe the swim bladder resonance effects [5]. Ishii et al. (1983) and Ishii et al. (1985) measured attenuation by using the direct culture net method at 25, 50, 100, and 200 kHz from yellowtail (Seriola quinqueradiata), sea breams (Pagrus major), and spotted mackerel (Scomber australasicus) [15,16]. Foote (1978) estimated the extinction cross-section using the indirect cage method and applied the parameter fitting method from Saithe (Pollachius virens) at 38 and 120 kHz [17]. Burczynski et al. (1990) conducted the acoustic estimation of Pacific herring in sea pens for attenuation measurements at 420 kHz [19]. Other relevant research works were analyzed and reviewed by Furusawa et al. (1992) [6]. Diachok (2005) conducted a study on estimating the number density from the attenuation of anchovy schools during the day and night at the mid-frequency range of 1–3 kHz in shallow water environments through transmission loss measurements [20]. Raveau and Feuillade (2015) recently studied sound extinction by fish schools on the basis of the forward scattering theory [21]. However, these previous studies mainly focused on attenuation by individuals or schools of fish at high-frequency bands. The analysis of fish schools to measure the attenuation coefficient with the number of individual fish has not been performed yet. Furthermore, the attenuation of live Japanese horse mackerel has not been measured at the mid-frequency band.
A recent trend in fish finders and sonar systems is to lower the frequency for detecting targets at a longer distance. The naval sonar system has mainly used mid-frequency bands until today. Omnidirectional sonar or multi-beam echo-sounder for the fishery is also being developed at a lower frequency. It is necessary to study fish attenuation to improve the accuracy of various fishery acoustic equipment and its signal analysis, especially at mid-frequency bands.
This study aims to measure the sound attenuation by dense fish schools of Japanese horse mackerel at a mid-frequency range (3–7 kHz) to understand the sound attenuation characteristics of fish schools. The sound attenuations with the various densities of fish were measured through in situ net cages. The attenuation coefficients in the experiments were analyzed and compared with those in the previous studies, and new regression models were suggested for normalized extinction cross-sections of the wet weight (W) and the total length (L) of fish. These results are expected to be helpful in developing the scientific echo-sounder and increasing the accuracy of estimating biomass and abundance of fish species for the fishery. They will also serve as a basis to improve the accuracy of the target detection for naval sonar operations and analysis.
2. Theory and Experimental Methods
2.1. Extinction Cross-Section and Attenuation Coefficient
Sound attenuates while propagating underwater, and its attenuation can be divided into sound scattering and absorption. In general, extinction cross-section () is a measure of the effect of an individual finite object on taking energy out of forward propagating acoustic waves in accordance with scattering and absorption [22]. is the sum of the scattering cross-section () and the absorption cross-section () [23].
where per unit distance in volume in water is denoted by the attenuation coefficient (α), which is expressed as Equation (2) [23]:
where is the density per unit volume of a fish school, and α describes the sound attenuation per unit distance. Given the difference between the theoretical and experimental values [3], must be quantified according to the measured .
2.2. Experimental Apparatus
In situ attenuation experiments were conducted in floating fish farm cages in March 2019. These cages were built for research purposes in the Tongyeong area at the Korean South Sea. The sea depth of the experimental site was about 14 m. The attenuation experiments were performed under artificial conditions. Movement in the ocean water was minimized by performing the experiments at neap tides for the least influence in the net cage.
The target fish were live horse mackerels. The total length (L) of the fish was measured using 12 randomly sampled mackerels. L ranged from 20 to 35 cm, with a mean of 27.7 cm. L of the fish showed a Gaussian distribution, and it appeared as a colony similar to actual fish schools. A previous study calculated the mean weight (W) of fish to be approximately 217 g [24].
Direct net cage methods were used for quantitative attenuation measurements. The net cage was fabricated using a thin mesh, which was small and rectangular, thereby minimizing its influence on acoustic waves. A detachable door was cut at the top to place the fish in the net cage, which had a volume of 1 m3 (1 × 1 × 1 m). The experiments were performed in seven ways: Exp1, non-net; Exp2, only net (individual fish: 0 ind.); Exp3, 100 ind.; Exp4, 200 ind.; Exp5, 300 ind.; Exp6, 400 ind.; and Exp7, 500 ind. in the net cage. Table 1 lists the details of the attenuation experiments according to the number of individual fish. In the attenuation experiment, the fish were released into the net cage and allowed to form schools. An underwater camera was installed to observe the shape and condition of the net cage.
2.3. Experimental Measurement and Signal Processing
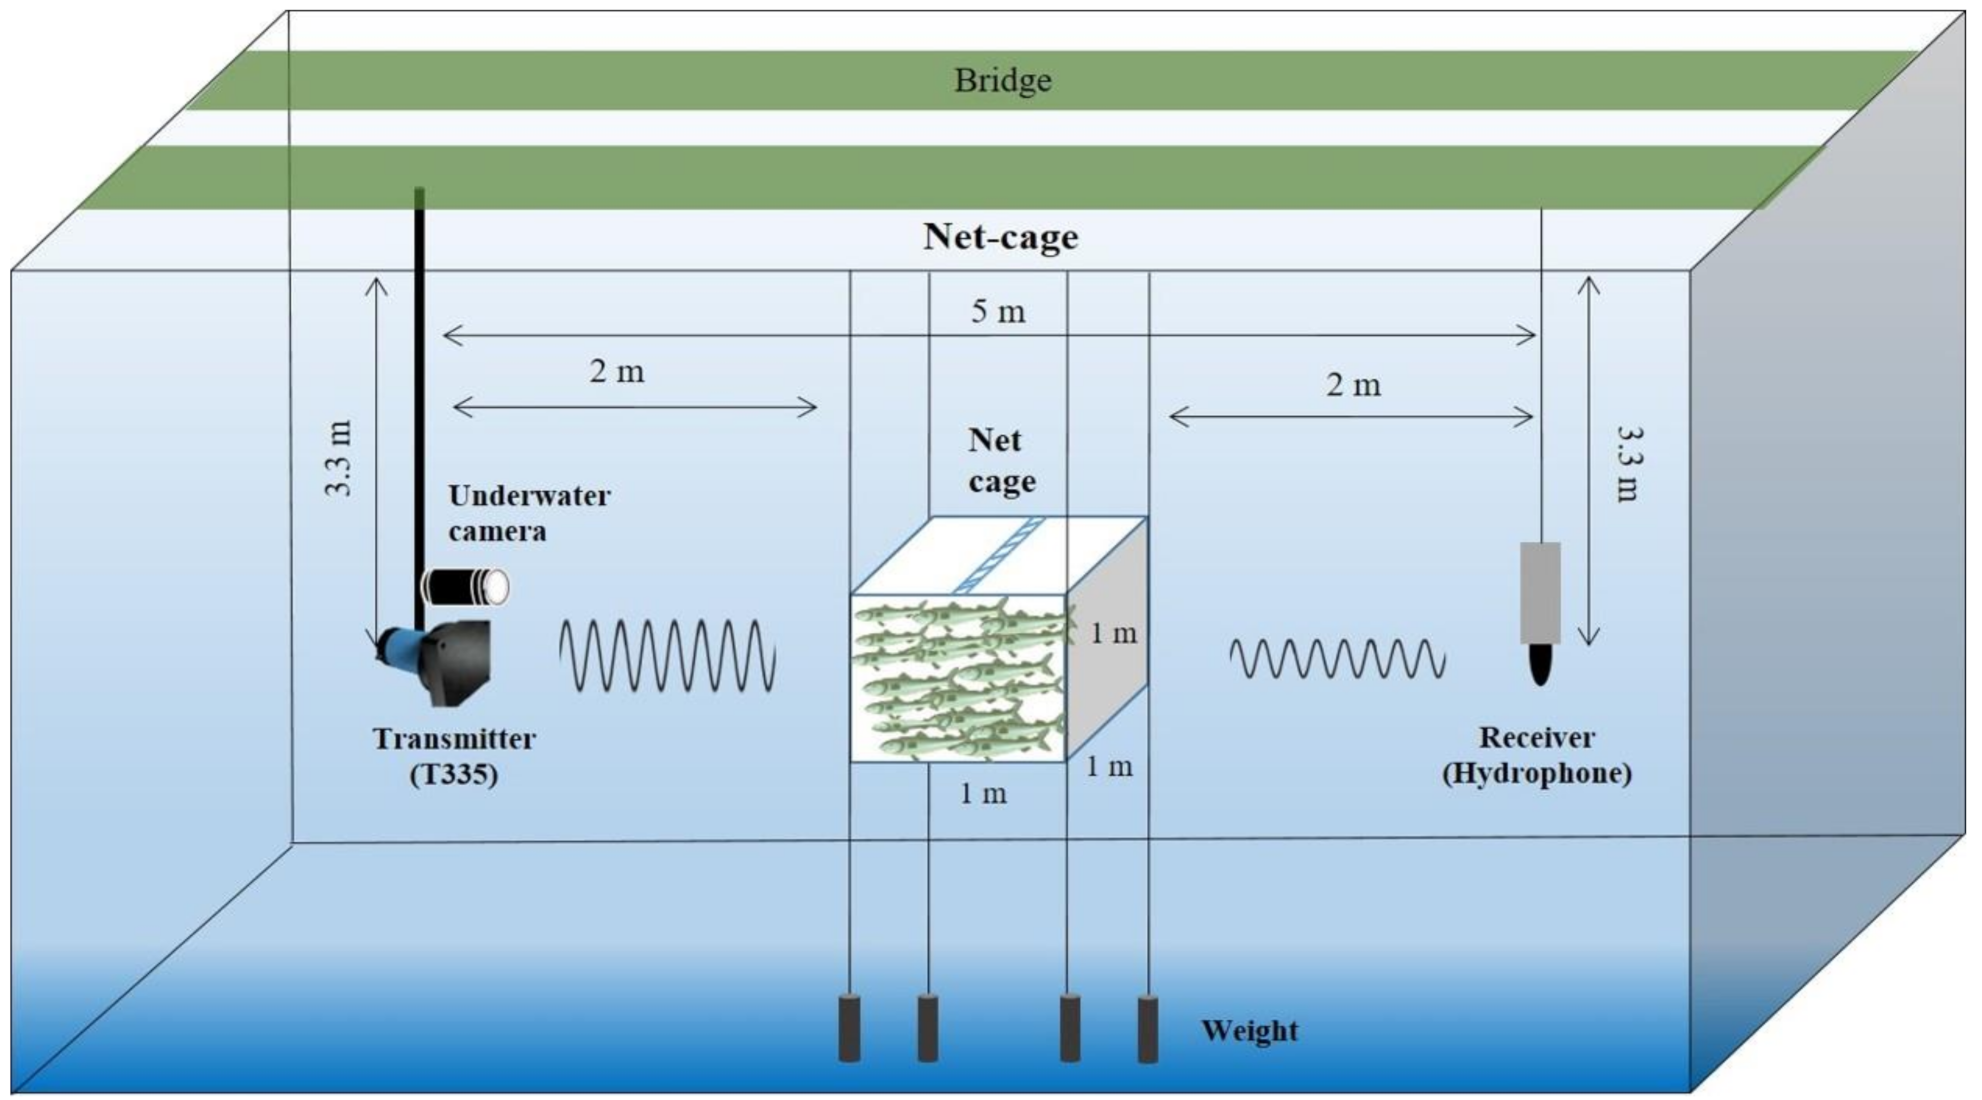
A schematic of the attenuation experiments is illustrated in Figure 1. The acoustic transmitter was a half-omnidirectional transducer (T335, Neptune Sonar; Kelk Lake, Kelk, UK) in the mid-frequency band range of 3–7 kHz. The receiver was a hydrophone (TC-4032, Teledyne RESON; Slangerup, Denmark). The transmitter and receiver were installed at a depth of approximately 3.3 m, and the net cage was positioned at 2.8–3.8 m below the sea surface and between the transmitter and the receiver at a distance of 2 m.
The transducer transmitted the pulse wave signals every 1 s, and the pulse length was 1 ms. The pulse signals that traveled through the net cage with and without the fish schools were received by the hydrophone [6]. A total of 100 and 300 pings were received at 0–300 and 400–500 individual fish, respectively. The sampling frequency was 100 kHz. Direct current (DC) noises were removed from all the received signals. The signals used a band-pass filter range of ±1 kHz on the basis of each frequency. The filtered signals were enveloped using Hilbert transform and converted into the received level (RL) in decibel scales. In this study, the 90% confidence limits for reliability were extracted from the RLs; the mean RL was calculated by applying the cumulative sum because the attenuation characteristics of fish schools were the main purpose of this work [25].
To calculate the attenuation of fish schools, the insertion losses (ILs) with and without the fish schools were incorporated in the experiment [26,27]. The IL was present between the transmitter and the receiver from the mean RL (see Equation (3)):
where is the mean RL without the fish school (only net cage), and is the mean RL with the fish schools. IL was converted to α (dB/m) when the net cage with fish school size was 1 m.
During the attenuation measurements, the seawater temperature was 13.4 °C, and the salinity was 31.6 psu at a depth of 3.3 m. Thus, the sound speed was 1497.6 m/s. Table 2 lists the details of the transmitter, receiver, and measured environmental factors.
3. Experimental Results
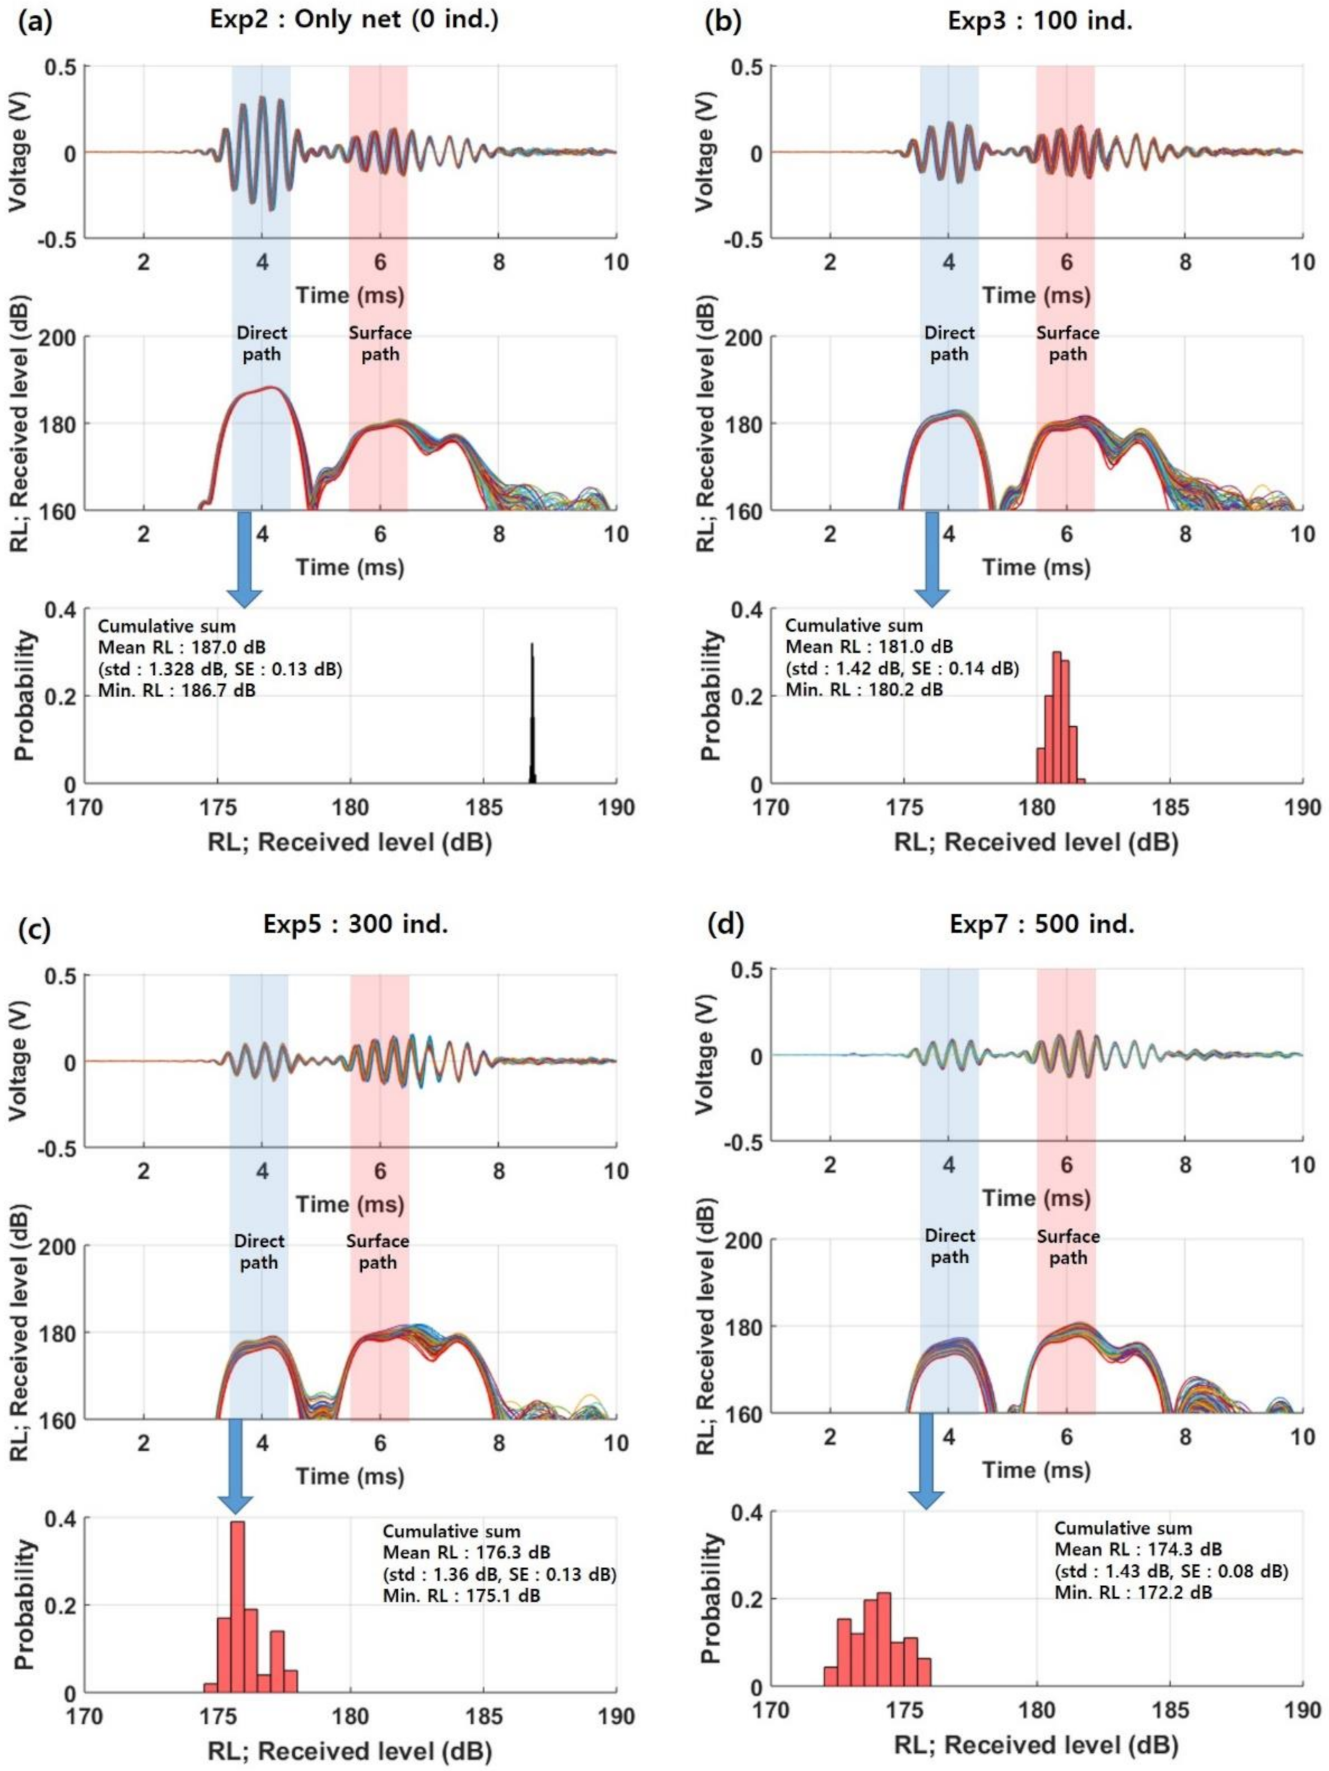
In this experiment, each live horse mackerel was determined to be in good condition during the experiments. Figure 2 shows the received voltage signals (top), RLs (middle), and histogram (bottom) of mean RLs of the direct path of Exp2 (only net, without fish), Exp3 (100 ind. fish in the net cage), Exp5 (300 ind. fish in the net cage), and Exp7 (500 ind. fish in the net cage) at 3 kHz. The blue and red areas show the received signals from the direct and surface paths, and their time intervals were 3.5–4.5 and 5.5–6.5 ms, respectively. The red lines of RL show the local minimum values.
As a result, the direct and surface paths were fully separated. The received voltage signals of the direct path were approximately 0.32, 0.16, 0.1, and 0.07 V in Exp2, Exp3, Exp5, and Exp7, respectively (Figure 2, top). The signals from the direct paths decreased as the number of individual fish increased. For all 100–300 pings acquired in experiments, the RLs were averaged for comparative analysis. The mean RLs of the cumulative sum from the direct paths were 187.0 (Exp2), 181.0 (Exp3), 176.3 (Exp5), and 174.3 dB (Exp7) (Figure 2, middle). The standard deviations (std) were 1.3–1.4 dB, and standard errors (SE) were 0.08–0.14 dB. The histograms from all mean RLs showed the Gaussian distribution (Figure 2, bottom). The RLs of all pings changed slightly in Exp2, but those of Exp7 fluctuated at 10 dB. The signals from the surface path varied with waves and the passing ship. The RLs from the direct path were less affected compared with those from the surface path. The RL of surface paths in all experiments was about 180 dB. However, the surface path was not analyzed because this work focused on the effect of attenuation on the direct path.
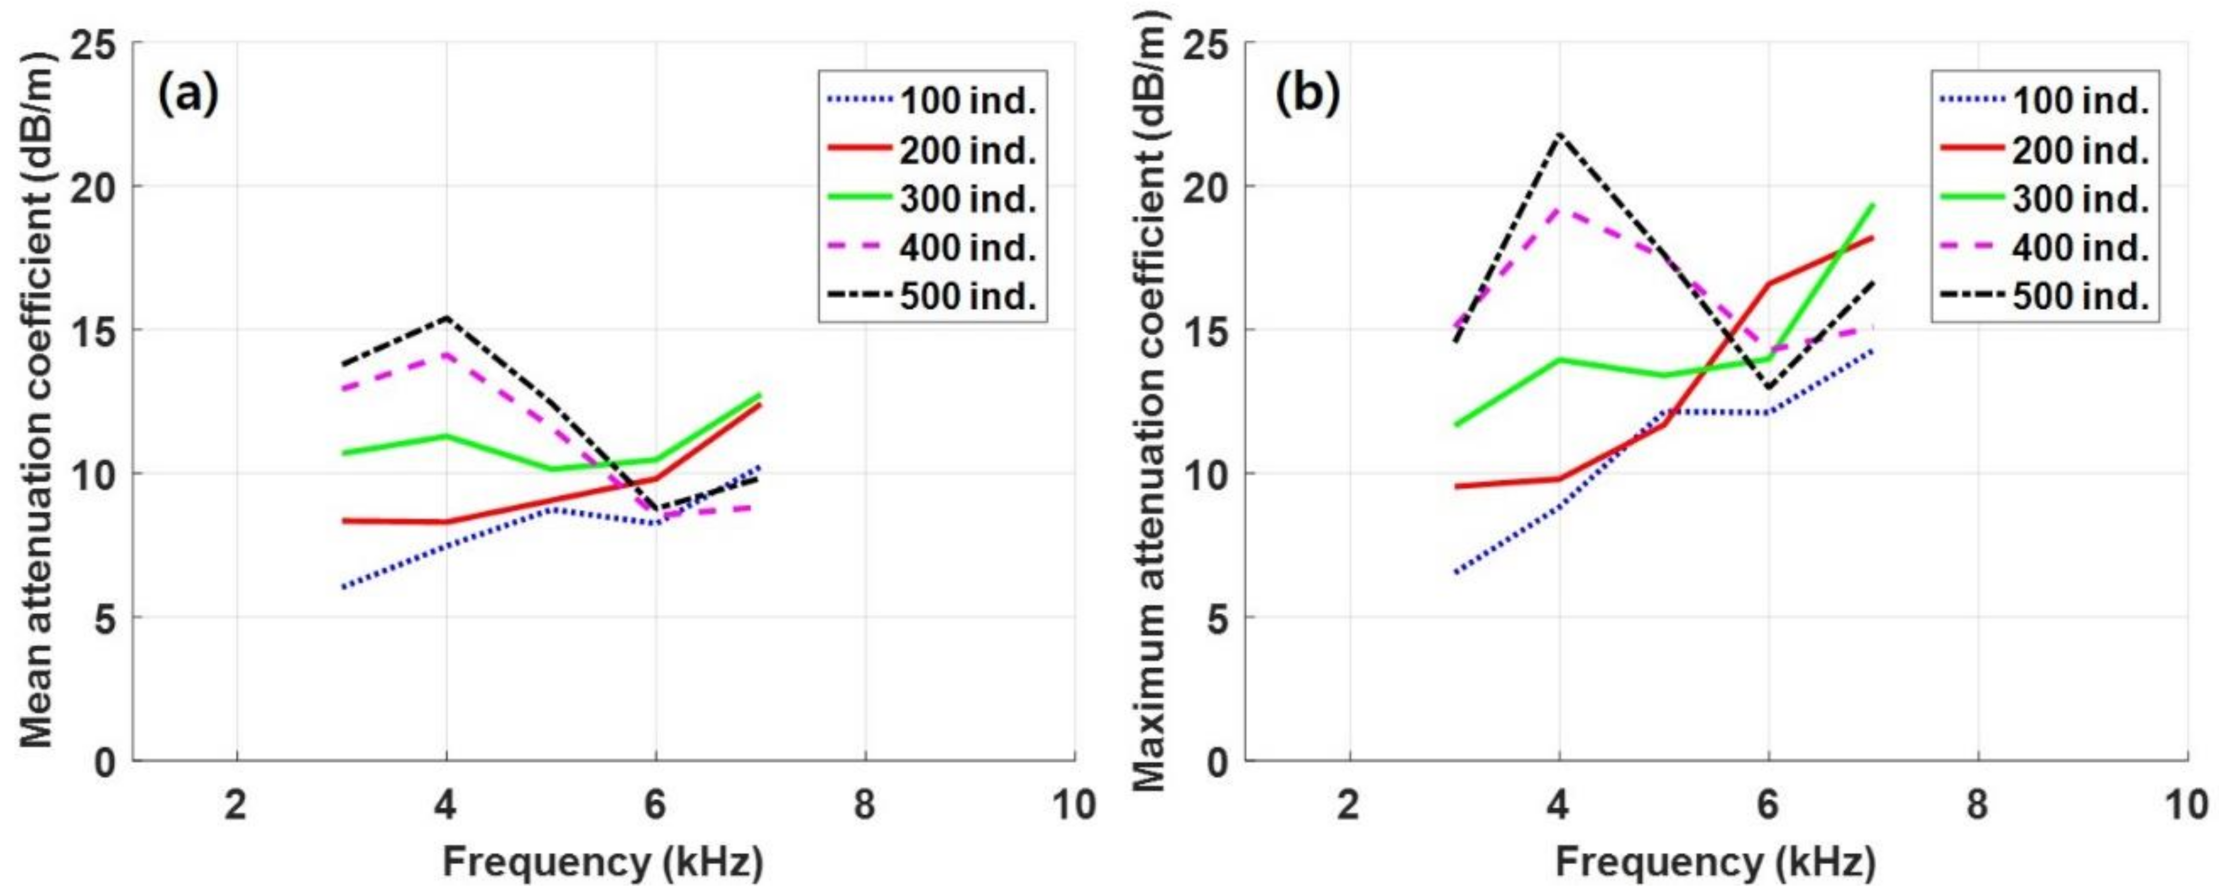
Figure 3 indicates the measured mean α and maximum α, which were dependent on the frequency and number of individual fish. The mean α linearly increased with the number of individual fish at the relatively low frequency of 3–4 kHz. At 3 kHz, the mean α and maximum α were 6.0 and 6.5, 8.3 and 9.5, 10.7 and 11.7, 12.9 and 15.1, and 13.8 and 14.6 dB/m at 100, 200, 300, 400, and 500 ind., respectively. The ranges of mean α and maximum α for all frequencies were approximately 6.0–15.4 dB/m and 6.5–21.8 dB/m, respectively. At a low number of individual fish below 400 ind., the mean α and maximum α increased with frequency. At a high number of 400 ind. and 500 ind., the mean and maximum α and their variation with the number of individual fish peaked at 4 kHz. The mean and maximum α did not linearly increase at 6–7 kHz and high density of fish (400–500 ind.). The attenuation variation with the number of individual fish was small at such high frequencies (6–7 kHz).
4. Comparison with Previous Studies
The values of α from the in situ experiments were analyzed and compared with those in previous studies. For comparison with the present and previous studies, was calculated from α. α was normalized by density to yield , which differs from W and L depending on fish species. Given that varies with the fish body, must be normalized by W ( or L ( for comparison. and are as follows [6]:
where and are and non-dimension, respectively. The normalized values were calculated from the measured α in the in situ experiments (see Equation (2)). The present study calculated the normalized only for 100 ind., which was similar to the ocean environments. The values were 0.0033, 0.00041, 0.0048, 0.0046, and 0.0057 , while the values were 0.0154, 0.0191, 0.0223, 0.021, and 0.0261 at 3, 4, 5, 6, and 7 kHz, respectively. All the calculated and values are shown in Table 3 and plotted in Figure 4.
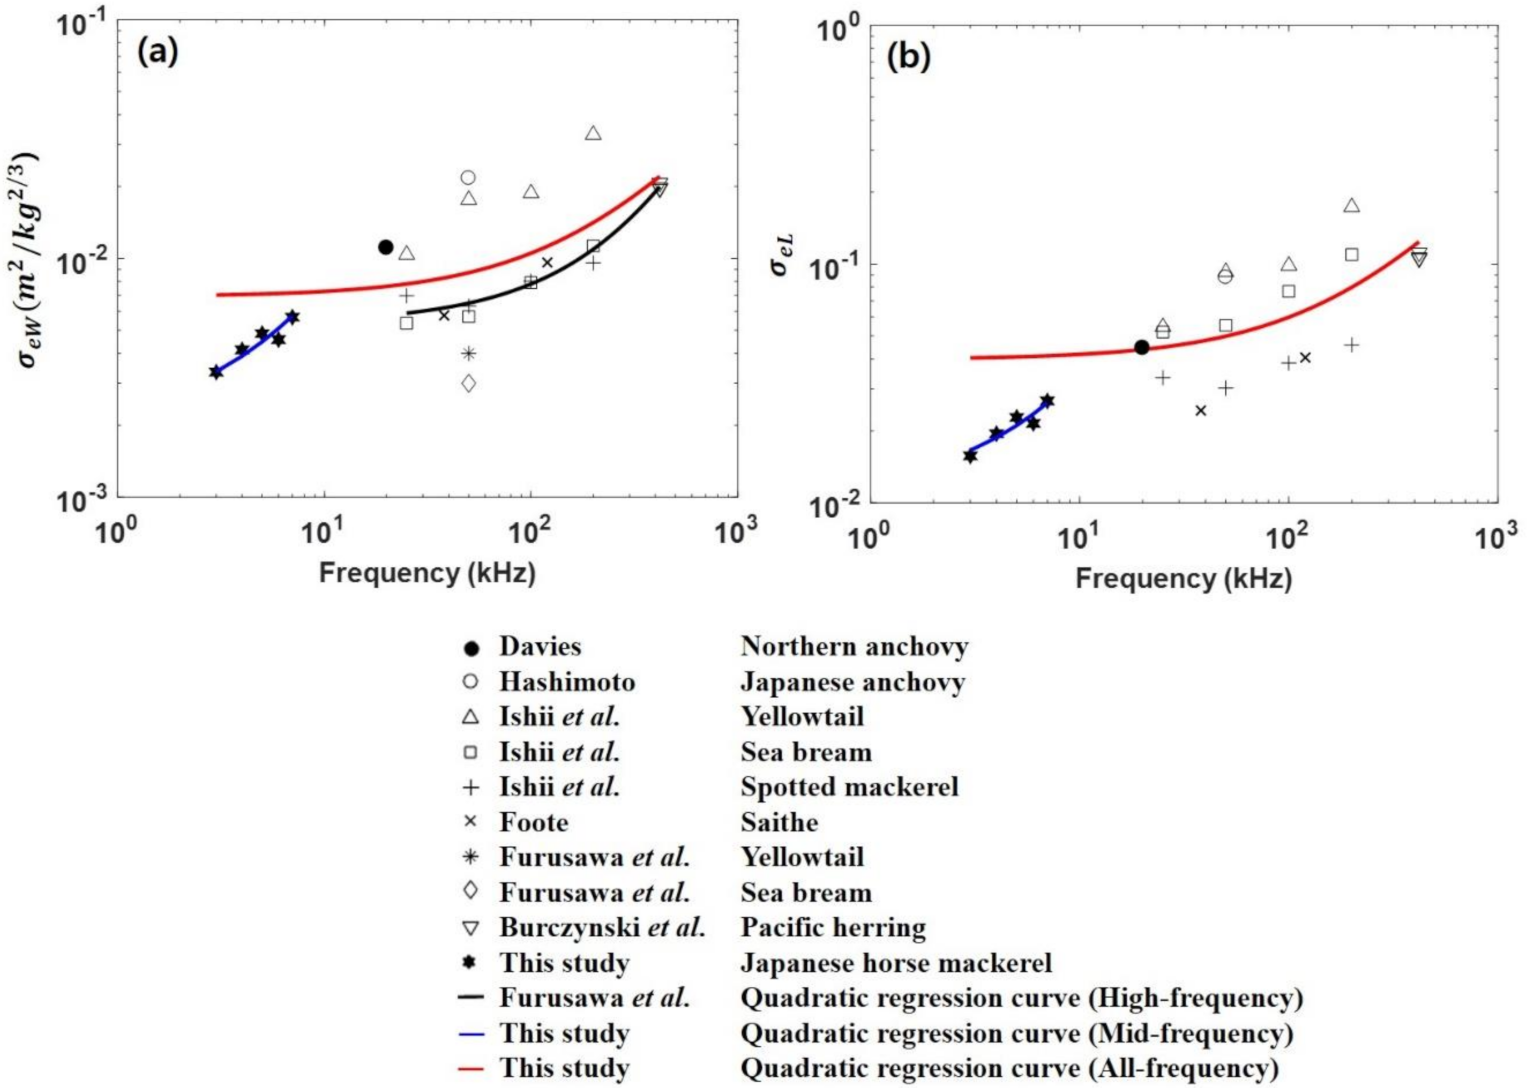
Some of the previous extinction or attenuation experiments showed the relationship between attenuation with the fish populations from several fish species at different frequencies. The previous studies mainly focused on the high-frequency band at 38–420 kHz for fishery acoustics or the scattering theory. Figure 4 shows the results of and with frequency in the previous and present studies. Each symbol represents and , and the black line shows the regression model from Furusawa et al. (1992) [6]. The values of sea bream and spotted mackerel were similar in spite of the apparent difference in their body shapes, as demonstrated by W and L at 50 and 100 kHz [15,16]. However, of yellowtail using the direct method was considerably higher than the above result. It was similar to that of Northern anchovy at 20 kHz and Japanese anchovy at 50 kHz [5,14]. converged to a regression curve even for different species and methods. The previous regression model was not calculated for all values and only showed a regression formula for more than 25 kHz of the high-frequency band [6].
On the basis of the experimental results, the new regression models for the mid-frequency range were suggested to normalize extinction cross-sections of W and L of fish. The new regression model for the mid-frequency band from the present study is shown as a blue line in Figure 4. Given that the study and are unknown, the regression model was calculated using the measured data in the present study. Quadratic regression analysis was performed for these well-converged data only for the mid-frequency band. Thus, the regression curve of with the mid-frequency band was proposed using fish schools (Japanese horse mackerel) in the present paper (see Equations (6) and (7); Figure 4, blue lines).
where f represents the frequency in units of kilohertz (kHz). The coefficients of determination (r2) are 0.84 and 0.87 from the regression curves of and , respectively [28].
Furthermore, when including the present study to the previous ones, the new regression models were calculated from all the data, ranging from the mid-to-high frequencies based on the previous and present data (see Equations (8) and (9); Figure 4, red lines).
In Figure 4, the curve of the Japanese horse mackerel (blue lines) differed considerably from the curve of other fishes (black lines). In the results of previous studies, an increasing tendency was observed for each frequency, but and varied depending on the species even at the same frequency. In these results, the resonance effect was not considered because the resonance of horse mackerel fish should be in the lower frequency band. The results of the attenuation experiments in fish schools depending on fish species, frequency, W, L, W/L3, number density (n), , , , and references from previous and present studies are shown in Table 3. The attenuation of slightly increased with the frequencies of 3–420 kHz. Because r2 was low because of a broadband frequency ranges, and should be used by each frequency band.
Comprehensively, and α can be calculated through Equations (6)–(9), the fish school attenuation can be numerically calculated according to densities and frequencies.
5. Discussion
To accurately estimate the amount of fish biomass, it is necessary to conduct continuous field investigation using acoustics. When using a scientific echo-sounder to investigate biomass estimation with the current technology, quantitative biomass estimation is possible only when many field surveys are performed. When estimating the quantitative biomass, sound attenuation is important. The attenuation by fish schools must be elucidated for variations in received acoustic signal and compensated in sound propagation in the water column [29]. Estimation of fish biomass is possible through the correction factor of the attenuation coefficient of fish schools [6], and will increase the efficiency of fishery surveys and monitoring. The amount of biomass can be calculated more accurately by compensating the α from the scientific echo-sounder, which will be helpful in terms of quantitative calculation of maximum sustainable fisheries.
If large fish schools appear, the attenuation will be generally high. However, the attenuation by the fish schools is related not only to the size but also to the volume density. The fish school density per volume is generally about 145 ind./m3 when calculating the void fraction () [21,30], and about 126 ind./m3 based on the theoretical aggregative packing model of fish school density () [31] of the mean standard length (SL) of horse mackerel in this experiment. The previous study was compared intensively with the Exp3 results of about 100 ind./m3 in this study (Figure 2b). However, attenuation as a function of size and volume density needs to be further investigated as future work.
The scattering of sound mainly by swim bladders filled with air should be considered in addition to attenuation. According to scattering theory, scattering is dependent on the angles between the incident and scattered directions, the wavenumber (k), and the equivalent spherical radius (a) of a fish school [4]. The attenuation coefficient (α) obtained from our experiments linearly increased with the number of individual fish at low frequencies but not at high frequencies. The reason for α fluctuations is thought to be an interaction between the wavelengths (25 cm at 6 kHz and 21 cm at 7 kHz) and the fish L. Given a high ka value in high frequency, forward scattering energy is high, resulting in low α [2,23,32]. The effect of multiple scattering on the gas-filled swim bladder and the density within the fish schools should also be considered for accurate modeling and measurements of scattering [33].
The mean α and maximum α were measured to be 6.0–15.4 and 6.5–21.8 dB/m at all frequencies, respectively. α is mainly generated by L of the fish body or swim bladder. The depth dependence of the target strength (TS) of a fish has long been recognized with the adjustable size of the swim bladder. A previous study showed that the depth dependence of TS of fish follows Boyle’s law [34,35], and α of fish schools is predicted to decrease as the depth increases. For the attenuation by the fish schools, the depth effects must be considered.
There are some limitations to apply this result to the various fields, because the fish schools are artificially located in the net cage, and the attenuation effects may differ depending on the number of individual fish. Additionally, attenuation experiments were performed using the cage size of 1 × 1 × 1 m, and the fish schools appeared densely, which may be different from the actual marine environment in the case of high density. In order to represent the ocean environment more accurately, experiments with different densities in a larger net size are required. It was also not possible to reveal the resonance characteristics of the fish schools. For the equivalent spherical radius of the swim bladder (1.71 cm) of horse mackerel used in the experiments, the resonance frequencies for individual horse mackerel and fish schools are estimated to be about 300 Hz and about 300 Hz to 1 kHz assuming fish swim bladders clouds, respectively [36,37].
Attenuation by fish schools could act as a disturbing factor when detecting, investigating, and communicating using acoustic waves in the ocean, and the study of this phenomenon is believed to be helpful in understanding the biological factors of underwater acoustics. The results of this study can be applied to various fields and practical applications for fishery acoustics, especially in developing scientific echo-sounder and improving the accuracy of estimating fish biomass [38]. It will also be helpful for naval acoustics of sonar operations and analysis, such as understanding signal loss reducing the probability of detection or prevent identification with false targets.
Further studies on fish species that form schools in ocean areas, the ecological characteristics of fish species, and the attenuation coefficients by fish species are needed in the field of biological and acoustical research. It is necessary to analyze the sound attenuation characteristics through experiments in a wider range of frequency bands including resonance frequency with important commercial fish species and high densities of fish. In addition, the effects of sound attenuation are required to study a large population of organisms as well as large fish schools in the ocean.
6. Conclusions
This study proposes the characteristics of sound attenuation by fish schools of Japanese horse mackerel at mid-frequencies measured in situ net cages. The experimental results demonstrated that the ranges of mean and maximum attenuation coefficients for frequencies of 3–7 kHz were measured to be 6.0–15.4 dB/m and 6.5–21.8 dB/m, respectively. The attenuation coefficients from fish schools increased with the number of individual fish and were influenced by their size and density at the low frequency. It was confirmed that the attenuation coefficients were similar to those from previous studies using comparative analysis, and a new normalized extinction cross-section for the mid-frequency band was proposed. The results of this study will provide a better understanding of the attenuation characteristics of spatiotemporally varying fish schools that can be useful for studying acoustic propagation in the ocean. These results could be used in the fishery and naval sonar operations and analysis by knowing the sound propagation characteristics of organisms.
Author Contributions
Conceptualization, H.K.; data curation, H.K.; formal analysis, H.K. and D.-G.P.; funding acquisition, H.K. and D.-G.P.; methodology, H.K.; supervision, D.-G.P.; writing—original draft, H.K. and D.-G.P.; writing—review and editing, H.K. and D.-G.P. All authors have read and agreed to the published version of the manuscript.
Funding
This work was supported by a grant for the Development of Maritime Defense and Security Technology (PE99941) promoted by the Korea Institute of Ocean Science and Technology (KIOST). This research was also supported by Basic Science Research Program to Research Institute for Basic Sciences (RIBS) of Jeju National University through the National Research Foundation of Korea (NRF) funded by the Ministry of Education (2019R1A6A1A10072987).
Institutional Review Board Statement
Not applicable.
Informed Consent Statement
Not applicable.
Data Availability Statement
The data presented in this study are available on request from the corresponding author. The data are not publicly available due to the data also forms part of an ongoing study.
Conflicts of Interest
The authors declare no conflict of interest.
References
- Urick, R.J. Principle of Underwater Sound, 3rd ed.; McGraw-Hill: New York, NY, USA, 1975; pp. 1–423. ISBN 8780932146625. [Google Scholar]
- Simmonds, E.J.; MacLennan, D.N. Fisheries Acoustics: Theory and Practice, 2nd ed.; Blackwell Science: Oxford, UK, 2005; pp. 1–437. ISBN 9780632059942. [Google Scholar]
- Ye, Z. On acoustic attenuation by swimbladder fish. J. Acoust. Soc. Am. 1996, 100, 669–672. [Google Scholar] [CrossRef]
- Ye, Z.; Farmer, D.M. Acoustic scattering by fish in the forward direction. ICES J. Mar. Sci. 1996, 53, 249–252. [Google Scholar] [CrossRef] [Green Version]
- Davies, I.E. Attenuation of sound by schooled anchovies. J. Acoust. Soc. Am. 1973, 54, 213–217. [Google Scholar] [CrossRef]
- Furusawa, M.; Ishii, K.; Miyanohana, Y. Attenuation of sound by schooling fish. J. Acoust. Soc. Am. 1992, 92, 987–994. [Google Scholar] [CrossRef] [PubMed]
- Alvarez, A.; Ye, Z. Effects of fish school structures on acoustic scattering. ICES J. Mar. Sci. 1999, 56, 361–369. [Google Scholar] [CrossRef]
- Marras, S.; Killen, S.S.; Lindstrom, J.; McKenzie, D.J.; Steffensen, J.F.; Domenici, P. Fish swimming in schools save energy regardless of their spatial position. Behav. Ecol. Sociobiol. 2015, 69, 219–226. [Google Scholar] [CrossRef] [Green Version]
- Kim, H.; Kang, D.; Cho, S.; Kim, M. Mid-frequency sound attenuation by dense fish schools. In Proceedings of the OCEANS 2019 MTS/IEEE Seattle, Seattle, WA, USA, 27–31 October 2019. [Google Scholar] [CrossRef]
- Jang, K.N. Fishing Culture; Sam-Kwang Publisher: Seoul, Korea, 2002; pp. 318–378. ISBN 9788982530944. (In Korean) [Google Scholar]
- Statistics Korea, Fishery Production Trend Survey. 2019. Available online: http://kostat.go.kr/portal/korea/kor_nw/1/1/index.board?bmode=read&aSeq=380812 (accessed on 21 February 2020).
- Pavlov, D.; Kasumyan, A.O. Patterns and mechanisms of schooling behavior in fish: A review. J. Ichthyol. 2000, 40, S163–S231. [Google Scholar]
- Hara, I. Moving direction of Japanese Sardine school of the basis of aerial surveys. Nippon Suisan Gakk. 1985, 51, 1939–1945. [Google Scholar] [CrossRef] [Green Version]
- Hashimoto, T. Characteristics of ultrasonic waves transmitted horizontally in the water. Rep. Fish. Boat Lab. 1955, 2, 55–58. (In Japanese) [Google Scholar]
- Ishii, K.; Furusawa, M.; Miyanohana, Y. Measurements of attenuation of sound by schooling fish (young yellowtail and red sea bream). Tech. Rep. Nat. Res. Inst. Fish. Eng. 1983, 4, 73–94. (In Japanese) [Google Scholar]
- Ishii, K.; Furusawa, M.; Miyanohana, Y. Measurement of attenuation of sound by schooling fish. In Proceedings of the Acoustical Society of Japan, Tokyo, Japan, 29–31 March 1985; pp. 715–716. (In Japanese). [Google Scholar]
- Foote, K.G. Analysis of empirical observations on the scattering of sound by encaged aggregations of fish. Fiskeridir. Skr. Ser. Havunders. 1978, 16, 422–455. [Google Scholar]
- Ishii, K.; Furusawa, M.; Miyanohana, Y.; Maniwa, Y. Experimental investigation of an acoustic method to estimate fish abundance using culture nets. Jpn. J. Appl. Phys. 1984, 23, 101–103. [Google Scholar] [CrossRef]
- Burczynski, J.J.; Johnson, R.L.; Kreiberg, H.; Kirchner, W.B. Acoustic estimation of dense aggregation of fish in sea pens. Rapports et Procès-Verbaux des Réunions du Conseil International pour l’Exploration de la Mer 1990, 189, 54–64. [Google Scholar]
- Diachok, O.; Wales, S. Concurrent inversion of geo- and bio-acoustic parameters from transmission loss measurements in the Yellow Sea. J. Acoust. Soc. Am. 2005, 117, 1965–1976. [Google Scholar] [CrossRef]
- Raveau, M.; Feuillade, C. Sound extinction by fish schools: Forward scattering theory and data analysis. J. Acoust. Soc. Am. 2015, 137, 539–555. [Google Scholar] [CrossRef]
- Born, M.; Wolf, E. Principles of Optics, 7th ed.; Cambridge University Press: Cambridge, UK, 1998; pp. 1–836. ISBN 9781139644181. [Google Scholar]
- Medwin, H.; Clay, C.S. Fundamentals of Acoustical Oceanography, 2nd ed.; Academic Press: Boston, MA, USA, 1997; pp. 1–712. ISBN 9780080532165. [Google Scholar]
- Lee, D.J.; Kang, S.; Jung, K.M.; Cha, H.K. Age and growth of Jack mackerel Trachurus japonicus off Jeju island, Korea. Korean J. Fish. Aquat. Sci. 2016, 49, 648–656. [Google Scholar] [CrossRef] [Green Version]
- Williams, R.; Veirs, S.; Veirs, V.; Ashe, E.; Mastick, N. Approaches to reduce noise from ships operating in important killer whale habitats. Mar. Pol. Bull. 2019, 139, 459–469. [Google Scholar] [CrossRef] [PubMed] [Green Version]
- Dolder, C. Direct Measurement of Effective Medium Properties of Model Fish School. Ph.D. Thesis, The University of Texas at Austin, Austin, TX, USA, 2014. [Google Scholar]
- Raveau, M. A review of theoretical models for attenuation of sound by bubble clouds. In Proceedings of the 22nd International Conference on Acoustics, Buenos Aires, Argentina, 5–9 September 2016; pp. 1–10. [Google Scholar]
- Kva Lseth, T.O. Note on the R2 measure of goodness of fit for nonlinear models. Bull. Psychon. Soc. 1983, 21, 79–80. [Google Scholar] [CrossRef] [Green Version]
- Kinsler, L.E.; Frey, A.R.; Coppens, A.B.; Sanders, J.V. Fundamentals of Acoustics, 4th ed.; Wiley: New York, NY, USA, 1999; pp. 1–560. ISBN 9780471847892. [Google Scholar]
- Mukai, T.; Iida, K. Depth dependence of target strength of live kokanee salmon in accordance with Boyle’s law. ICES J. Mar. Sci. 1996, 53, 245–248. [Google Scholar] [CrossRef] [Green Version]
- Pitcher, T.J.; Partridge, B.L. Fish school density and volume. Mar. Biol. 1979, 54, 383–394. [Google Scholar] [CrossRef]
- Stanton, T. Sound scattering by cylinders of finite length. I. Fluid cylinders. J. Acoust. Soc. Am. 1987, 83, 55–63. [Google Scholar] [CrossRef]
- D’Agostino, L.; Brennen, C.E. Acoustical absorption and scattering cross sections of spherical bubble clouds. J. Acoust. Soc. Am. 1988, 84, 2126–2134. [Google Scholar] [CrossRef]
- Zhao, X.; Wang, Y.; Dai, F. Depth-dependent target strength of anchovy (Engraulis japonicus) measured in situ. ICES J. Mar. Sci. 2008, 65, 882–888. [Google Scholar] [CrossRef] [Green Version]
- Foote, K.G. Extinction cross-section of Norwegian spring-spawning herring. ICES J. Mar. Sci. 1999, 56, 606–612. [Google Scholar] [CrossRef] [Green Version]
- Minnaert, M. On musical air-bubbles and the sounds of running water, London Edinburgh Dublin Philos. Mag. J. Sci. 1933, 16, 235–248. [Google Scholar] [CrossRef]
- Meseguer, F.; Manzano, F.R. Acoustic resonance by fish schools. A proposal for the schooling mechanism. arXiv 2017, arXiv:1706.02632. [Google Scholar]
- Sthapit, P.; Kim, M.; Kim, K. A Method to Accurately Estimate Fish Abundance in Offshore Cages. Appl. Sci. 2020, 10, 3720. [Google Scholar] [CrossRef]
Figure 1.
Schematic of the experimental system used to measure sound attenuation from the fish schools (Japanese horse mackerel) at mid-frequency bands. Transmitter, receiver, net cage, and underwater camera were set at a depth of 3.3 m below the sea surface.
Figure 1.
Schematic of the experimental system used to measure sound attenuation from the fish schools (Japanese horse mackerel) at mid-frequency bands. Transmitter, receiver, net cage, and underwater camera were set at a depth of 3.3 m below the sea surface.

Figure 2.
Representative attenuation experimental results of (a) Exp2 (only net, fish without in the net cage), (b) Exp3 (100 ind. fish in the net cage), (c) Exp5 (300 ind. fish in the net cage), and (d) Exp7 (500 ind. fish in the net cage) at 3 kHz; the top figures are the received voltage signals, middle ones are received levels (RLs), and bottom ones are the histogram of the RLs from the direct paths. The transmission losses in seawater were compensated for the RLs.

Figure 3.
(a) and (b) are mean and maximum attenuation coefficients at 3–7 kHz for the different number of individual fish, respectively (100 ind.: blue dotted line, 200 ind.: red straight line, 300 ind.: green straight line, 400 ind.: pink dashed line, and 500 ind.: black dashed line).
Figure 3.
(a) and (b) are mean and maximum attenuation coefficients at 3–7 kHz for the different number of individual fish, respectively (100 ind.: blue dotted line, 200 ind.: red straight line, 300 ind.: green straight line, 400 ind.: pink dashed line, and 500 ind.: black dashed line).

Figure 4.
Results of normalized extinction cross-section of (a) the wet weight () and (b) the total length ( ) of fish with frequency in previous and present studies. The black line is the previous regression model [6], the blue lines are the new quadratic regression models for mid-frequency from the present study, and the red lines are the total quadratic regression models for all-frequency.


Table 1.
Attenuation experiments with varying number of individual fish (Japanese horse mackerel).
| Experiments | Individual Fish | Explanation | Remark |
|---|---|---|---|
| Exp1 | 0 ind. | Non-net (empty) | |
| Exp2 | 0 ind. | Only-net (net) | Figure 2a |
| Exp3 | 100 ind. | Fish schools in a net cage | Figure 2b |
| Exp4 | 200 ind. | ||
| Exp5 | 300 ind. | Figure 2c | |
| Exp6 | 400 ind. | ||
| Exp7 | 500 ind. | Figure 2d |
Table 2.
Transmitter, receiver, and measured environmental factors for sound attenuation by fish schools.
Table 2.
Transmitter, receiver, and measured environmental factors for sound attenuation by fish schools.
| Transmitter | Frequency (kHz) | 3, 4, 5, 6, 7 |
| Pulse length (ms) | 1 | |
| Ping rate (pps) | 1 | |
| Total pings (ping) | 100, 300 | |
| Receiver | Sampling frequency (kHz) | 100 |
| Hydrophone RVS (dB/V) | −170 | |
| Gain (dB) | 0 | |
| Environments | Water temperature (°C) | 13.4 |
| Salinity (psu) | 31.6 | |
| Sound speed (m/s) | 1497.6 |
Table 3.
Summary and comparison of the attenuation experiments in fish schools; fish species, frequency, wet weight (W), total length (L), relationship W-L (W/L3), number density (n), extinction cross-section (), normalized extinction cross-section of W ( ) and L ( ), and references from previous and present studies.
| Number | Fish Species | Frequency (kHz) | W (g) | L (cm) | W/L3 | n | Ref. | |||
|---|---|---|---|---|---|---|---|---|---|---|
| 1 | Northern anchovy | 20 | 9.6 | 10.6 | 8.1 | 650 | 5.0 | 0.0111 | 0.0445 | [5] |
| 2 | Japanese anchovy | 50 | 5.2 | 8.6 | 8.2 | 250 | 6.5 | 0.0217 | 0.0879 | [14] |
| 3 | Yellowtail | 25 50 100 200 | 4500 | 72.0 | 12.1 | 10 | 282.7 479.8 510.7 897.9 | 0.0104 0.0176 0.0187 0.0329 | 0.0545 0.0926 0.0985 0.1732 | [15] [16] |
| Sea bream | 25 50 100 200 | 900 | 31.0 | 30.2 | 21 | 49.9 53.2 73.8 105.2 | 0.0054 0.0057 0.0079 0.0113 | 0.0519 0.0554 0.0768 0.1095 | ||
| Spotted mackerel | 25 50 100 200 | 261 | 29.2 | 10.5 | 170 | 28.5 25.8 32.8 39.1 | 0.0070 0.0063 0.0080 0.0096 | 0.0334 0.0303 0.0385 0.0459 | ||
| 4 | Saithe | 38 120 | 375 | 35.1 | 8.7 | 100 | 30.0 50.0 | 0.0058 0.0096 | 0.0244 0.0406 | [17] |
| Atlantic herring | 38 | - | 33.9 | - | - | 22.7 | - | 0.0198 | ||
| 5 | Yellowtail | 50 | - | - | 15.6 | - | - | 0.0040 | - | [18] |
| Sea bream | 50 | - | - | 30.5 | - | - | 0.0030 | - | ||
| 6 | Pacific herring | 420 | 100 | 20 | 12.5 | 92 | 42.6 42.1 44.6 | 0.0198 0.0195 0.0207 | 0.1065 0.1053 0.1115 | [19] |
| 7 | Japanese horse mackerel | 3 4 5 6 7 | 217 | 27.7 | 10.2 | 100 | 12.1 14.9 17.5 16.5 20.5 | 0.0033 0.0041 0.0048 0.0046 0.0057 | 0.0154 0.0191 0.0223 0.0210 0.0261 | This study |
Publisher’s Note: MDPI stays neutral with regard to jurisdictional claims in published maps and institutional affiliations. |
© 2021 by the authors. Licensee MDPI, Basel, Switzerland. This article is an open access article distributed under the terms and conditions of the Creative Commons Attribution (CC BY) license (http://creativecommons.org/licenses/by/4.0/).
Share and Cite
MDPI and ACS Style
Kim, H.; Paeng, D.-G. In Situ Measurement of Sound Attenuation by Fish Schools (Japanese Horse Mackerel, Trachurus japonicus) at Mid-Frequency Bands. Appl. Sci. 2021, 11, 1944. https://0-doi-org.brum.beds.ac.uk/10.3390/app11041944
AMA Style
Kim H, Paeng D-G. In Situ Measurement of Sound Attenuation by Fish Schools (Japanese Horse Mackerel, Trachurus japonicus) at Mid-Frequency Bands. Applied Sciences. 2021; 11(4):1944. https://0-doi-org.brum.beds.ac.uk/10.3390/app11041944
Chicago/Turabian StyleKim, Hansoo, and Dong-Guk Paeng. 2021. "In Situ Measurement of Sound Attenuation by Fish Schools (Japanese Horse Mackerel, Trachurus japonicus) at Mid-Frequency Bands" Applied Sciences 11, no. 4: 1944. https://0-doi-org.brum.beds.ac.uk/10.3390/app11041944
Note that from the first issue of 2016, this journal uses article numbers instead of page numbers. See further details here.