Article

Performances Assessment of Tricalcium Aluminate as an Innovative Material for Thermal Energy Storage Applications

1
Department of Engineering, University of Messina, 98166 Messina, Italy
2
National Interuniversity Consortium of Materials Science and Technology (INSTM), 50121 Firenze, Italy
3
Istituto per i Processi Chimico Fisici, Consiglio Nazionale delle Ricerche (CNR), 98158 Messina, Italy
*
Authors to whom correspondence should be addressed.
Submission received: 7 February 2021 / Revised: 17 February 2021 / Accepted: 18 February 2021 / Published: 23 February 2021
(This article belongs to the Special Issue Materials for Thermal Energy Storage-Volume II)

Abstract

:

Featured Application

Innovative material for thermochemical energy storage applications.

Abstract

In this paper, tricalcium aluminate hexahydrate (Ca3Al2O6·6H2O), thanks to its appropriate features, was assessed as an innovative, low-cost and nontoxic material for thermochemical energy storage applications. The high dehydration heat and the occurring temperature (200–300 °C) suggest that this material could be more effective than conventional thermochemical storage materials operating at medium temperature. For these reasons, in the present paper, Ca3Al2O6·6H2O hydration/dehydration performances, at varying synthesis procedures, were assessed. Experimentally, a co-precipitation and a solid–solid synthesis were studied in order to develop a preparation method that better provides a performing material for this specific application field. Thermal analysis (TGA, DSC) and structural characterization (XRD) were performed to evaluate the thermochemical behavior at medium temperature of the prepared materials. Furthermore, reversibility of the dehydration process and chemical stability of the obtained materials were investigated through cycling dehydration/hydration tests. The promising results, in terms of de/hydration performance and storage density (≈200 MJ/m3), confirm the potential effectiveness of this material for thermochemical energy storage applications and encourage further developments on this topic.

1. Introduction

The great changes that are affecting our planet have undeniably led to a significant and radical transformation of the energy system, which needs to be remodeled on the basis of better efficiency, especially in regards to the industrial sector. From this point of view, improving energy efficiency means principally acting on the recovery of low-grade (100–200 °C) and medium-grade (200–300 °C) waste heat, which represent about 90% of the thermal energy lost in industrial processes [1]. To this purpose, in the last twenty years, the awareness of an urgent upgrade of thermal energy storage systems has led to the development of chemical heat pumps (CHPs), devices whose operation is based on a thermochemical storage material (TCM) capable of accumulating and releasing energy through a reversible reaction, schematized in Equation (1).
A + heat⇄B + C
where the direct process (endothermic) represents the thermal charge, in which the waste heat allows the reaction to take place and the energy is therefore recovered. On the contrary, the reverse (exothermic) process represents the thermal discharge, in which the products (B and C), when mixed together, regenerate the initial compound (A), releasing the previously stored energy. Thermochemical storage promises to offer numerous advantages over latent heat and sensible heat technologies, despite these technologies currently being in an advanced stage of development [2,3]. Firstly, the conversion of thermal energy into chemical energy ensures a long-term durability; in addition, the typical high-storage densities allow for significantly reduced volumes, making the storage systems easier to handle [4,5]. Although it is relatively easier with sorption materials (which involve intermolecular bonding) to set up a system that operates cyclically with high performances, thermochemical storage materials (TCMs), which operate through proper chemical reactions, present many issues related to several factors, like chemical and structural stability of each reagent and product [6,7,8]. Within this research field, materials based on solid–gas reactions are the most investigated, ascribed to the possibility of collecting, in an isolated tank, the formed gas when the thermal charge ends, subsequently keeping the products separated until the thermal discharge is needed [9,10,11,12]. In recent years, many charge/discharge working pairs operating by reduction/oxidation [13,14,15,16] (oxides, salts), decarbonation/carbonation [17] (carbonates) and dehydration/hydration (hydroxides) [18] have been assessed. However, among these materials, it could be noted that the range between 200–250 °C has the greatest lack of developments; in fact, there is no material operating in this range that can be competitive, in relation to the storage density, with pairs operating at higher temperature and which are currently in an advanced stage of application (magnesium hydroxide, calcium hydroxide [19,20,21,22,23,24]). As mentioned above, chemical and structural stability play a fundamental role, and it is not always easy to find systems capable of providing a good compromise between a high storage capacity and a long-term durability. Hence, the development of new TCMs operating in the 200–250 °C temperature range is still an open challenge. The purpose is to identify new materials that possibly meet the Thermal Energy Storage (TES) technological expectations in terms of performances, stability and economic industrial applicability [25]. Indeed, the heat storage at medium temperature represents a crucial technology that still requires an improvement of knowledge. In this context, the aim of this work is to investigate the calcium aluminate compounds as potentially effective and practical alternatives to conventional TES materials. Calcium aluminates are cheap and nontoxic compounds; they are basic components of cements called calcium aluminate cements (CAC) [26] and often related to construction materials [27,28]. They generally provide suitable mechanical properties to the concrete and play a fundamental role in the hydration process of the cements, releasing a high amount of heat during the product hydration. In cement technology, the release of heat is an issue that needs to be avoided, although, for other applications, such as energy storage, this aspect could be a key factor, if properly exploited. From this point of view, the main compound responsible for heat release is the most thermodynamically stable tricalcium aluminate Ca3Al2O6, when it forms the corresponding hexahydrate specie with a standard reaction enthalpy (ΔH0) equal to −258.6 kJ/mol [29,30].
Tricalcium aluminate hexahydrate, Ca3Al2O6·6H2O, known as katoite mineral, belongs to the hydrogarnet group [31]. Studies on thermal decomposition [32] reported a two-step process in which the first dehydration takes place at 240–300 °C and the 1.5-hydrate product is formed.
The reaction is reversible; indeed, Ca3Al2O6·1.5H2O is used as drying agent due to the high tendency to adsorb water vapor from the surrounding atmosphere (Equation (2)) [33]. At higher temperature, Ca3Al2O6·1.5H2O transforms into mayenite (Ca12Al14O33) [34].
Ca3Al2O6·6H2O(s)⇄Ca3Al2O6·1.5H2O(s) + 4.5H2O(g)
In this work, katoite was prepared via hydration starting from synthetic Ca3Al2O6. In order to achieve, selectively, the Ca3Al2O6 formation, several preparation methods have been investigated, such as co-precipitation and solid–solid reaction. Morphological and structural characterization were necessary to underline the differences between the samples. Therefore, the characterization was carried out on the anhydrous and hydrated batches. Moreover, the materials were analyzed by means of differential scanning calorimetry and thermogravimetry. The coupling of these techniques, in fact, allowed us to determine operating temperature and endothermic heat associated with the dehydration process. These studies were useful to highlight how the preparation process affects the features of the thermochemical storage material. Finally, the stability during low-term operating cycles was studied through consecutive dehydration/hydration reactions.

2. Materials and Methods

2.1. Samples Preparation

Tricalcium aluminate was prepared by solid–solid synthesis and co-precipitation. Solid–solid synthesis was carried out using a mixture of calcium oxide (CaO, anhydrous powder, ≥99.0%, Sigma–Aldrich, Darmstadt, Germany) and aluminum oxide (Al2O3, ≥99.0%, Carlo Erba, Cornaredo (MI), Italy) at molar ratio CaO:Al2O3 = 3:1, then calcined in air at 1100 °C for 2 h.
The co-precipitation was carried out by adding sodium hydroxide solution (NaOH, pellets, Sigma–Aldrich, Germany) to a solution containing calcium nitrate (Ca(NO3)2·4H2O, ≥99.0%, Sigma–Aldrich, Germany) and aluminium nitrate (Al(NO3)3·9H2O, ≥99.0%, Carlo Erba, Italy). Two different Ca/Al molar ratios were used, respectively, 1:1 and 3:2. The procedure, represented in Figure 1, can be described as follows: The nitrate salts were weighted and dissolved in distilled water, up to a final volume (100 mL), and the solution was kept under magnetic stirring. Then, the sodium hydroxide solution (50 mL) was added (2 mL/min) through a peristaltic pump. At the end of the reaction, the pH values were 12÷13. The formed white solid was aged for 24 h, filtered, washed with distilled water (150 mL), dried at 105 °C for 12 h and then calcined at 1100 °C for 2 h. Table 1 shows the sample code and the preparation method.

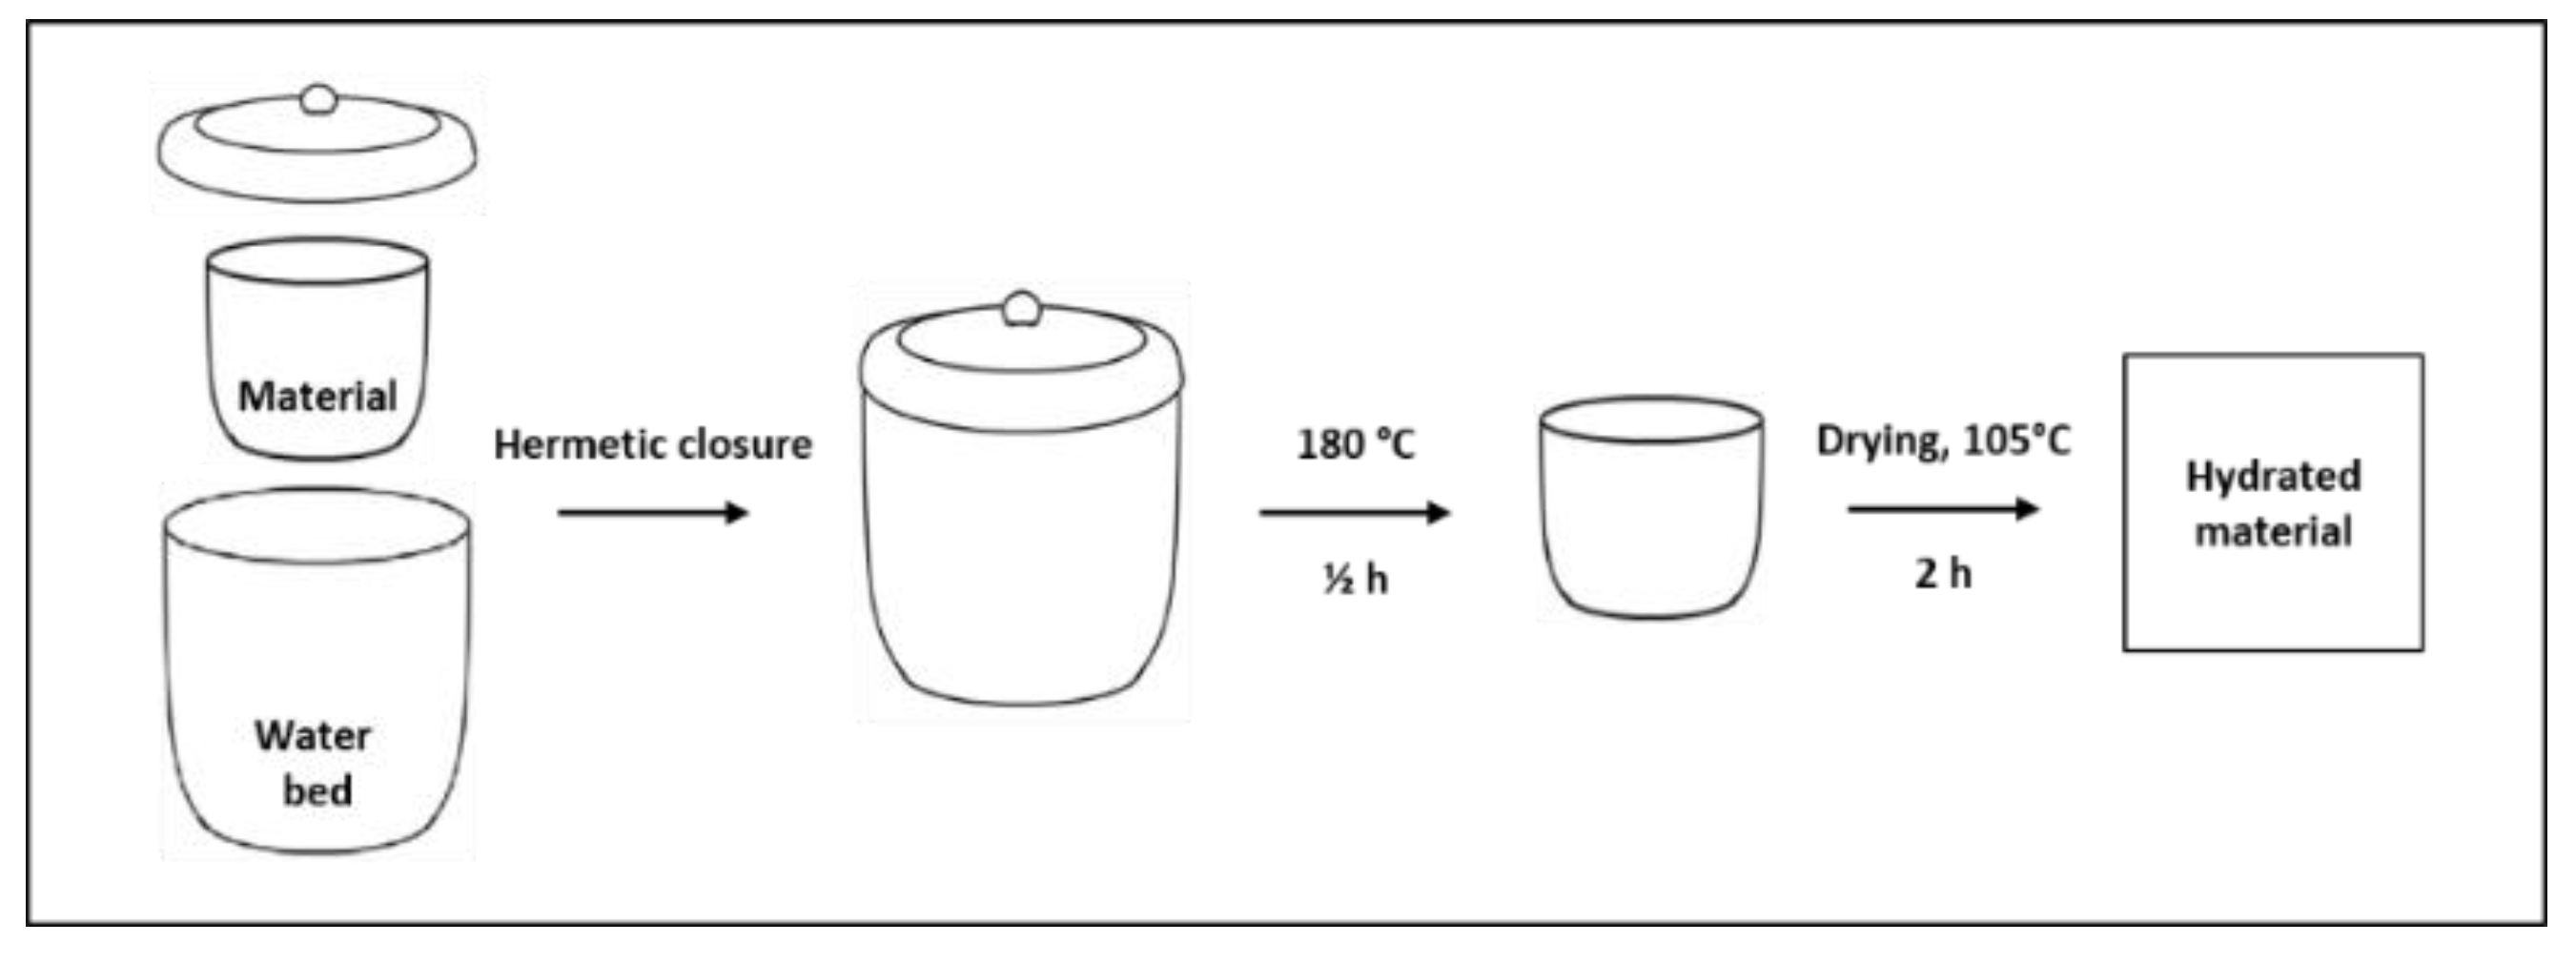
2.2. Samples Hydration

Hydration of calcium aluminates generally involves a large and complex variety of secondary processes, and it is strongly dependent on temperature. Although the most stable hydrate form is Ca3Al2O6·6H2O, its nucleation can be very slow at low temperatures, and it is usually preceded by the formation of metastable hydrates, which could persist for a long time before a thermodynamic conversion process occurs. Previous studies demonstrated that, during the early stage of hydration, at temperatures between 15 and 70 °C, CaAl2O4·10H2O and Ca2Al2O5·8H2O are mainly formed, while Ca3Al2O6·6H2O becomes the most prominent when the process occurs at temperatures higher than 70 °C [35]. A correlation between the hydration temperature and the primary calcium aluminate phase is summarized in Table 2.
Following these considerations, the samples obtained by the synthesis procedure were hydrated via the procedure described below: In the internal and external sides of a double shell crucible, the sample (≈100 mg) and a bed of water were placed, respectively. The system was hermetically closed and heated for 30 min at 180 °C. Under these conditions, the generated high-pressure water vapor favored the material hydration. As the last step, drying is carried out at 105 °C to eliminate the nonchemically bonded water. The samples were weighed before and after this treatment, thus verifying the occurred mass change. In order to validate the procedure repeatability, for each batch, three replicas were carried out. The hydrated samples were codified based on Table 1, adding a letter “H” to the codes: e.g., CA-32H indicates a hydrated sample obtained by co-precipitation process by using a 3:2 Ca/Al ratio. Figure 2 reports a schematization of the described procedure.

2.3. Characterization

2.3.1. Structural and Morphological Characterization

In order to explain the chemical transformation of the materials during the preparation and after the cycling tests, these have been structurally and morphologically characterized by means of X-ray diffraction (XRD) and scanning electron microscopy (SEM). XRD measurements were conducted by using a D8 Advance Bruker instrument equipped with a monochromatic Cu Kα radiation source (40 kV, 40 mA). Bragg–Brentano theta–2theta configuration and a scanning speed of 0.1°/s were used to examine the samples in the 2θ range 10–80°. The phases identification was done using the PDF-4+ database. SEM micrographs were collected by a Quanta 450 FEI with a large-field detector (LFD), on Cr-coated samples, with an accelerating voltage of 5 kV in high vacuum (106 mbar). Energy dispersive X-ray analysis (EDX) was also used to collect punctual elemental analysis.

2.3.2. Differential Scanning Calorimetry (DSC)

DSC analysis (Q100, TA Instruments) was performed to evaluate the amount of involved dehydration heat. Specifically, 6–7 mg hydrated sample was put in an aluminum pan, covered with an aluminum cap and pressed in a sample crimper. On the cap, a micro hole was made to ensure that the formed water vapor exited during the analysis. This precaution avoids a pressure increase inside the pan due to water vapor formation. Measurements were performed in inert gas flow (N2, 50 mL/min). Preliminarily, all samples were maintained at 105 °C for 5 min to remove the moisture content, and subsequently, a constant heating step (10 °C/min) up to 400 °C was carried out.

2.3.3. Thermogravimetric Analysis (TGA)

Thermogravimetric analysis (TGA), performed by a STA 449 F3 Jupiter (Netzsch, Selb, Germany), was used to study the dehydration/hydration cycles and stability. The Thermo-Gravimetric (TG) unit is coupled with an evaporation system for the water vapor supply. After a preliminary sample (≈20 mg) drying at 125 °C in inert gas flow (N2 flow rate: 100 mL/min) for 60 min, each dehydration/hydration cycle was performed by the following procedure: (i) Heating. The temperature was increased (10 °C/min) up to the chosen dehydration temperature (Td = 250 °C); (ii) Isothermal. The sample was held at these conditions for 120 min, allowing for the complete dehydration reaction; (iii) Cooling. The temperature was decreased (−10 °C/min) to the hydration temperature (Th = 125 °C); (iv) Stabilization step. Performed after cooling the temperature down to the preset value, and therefore, this interval is essential to stabilize the system temperature before the following step. (v) Hydration reaction. A gas mixture flow of water vapor (2.22 g/h) and N2 (35 mL/min) was supplied (pH2O/p = 0.58), and the isothermal hydration reaction proceeded for 120 min; (vi) Release of adsorbed water. Finally, the water vapor supply was stopped, and the sample was kept at 125 °C for 30 min under a constant N2 flow (100 mL/min) to remove the physically adsorbed water from the sample. Table 3 summarizes a single TG cycle.

3. Results and Discussion

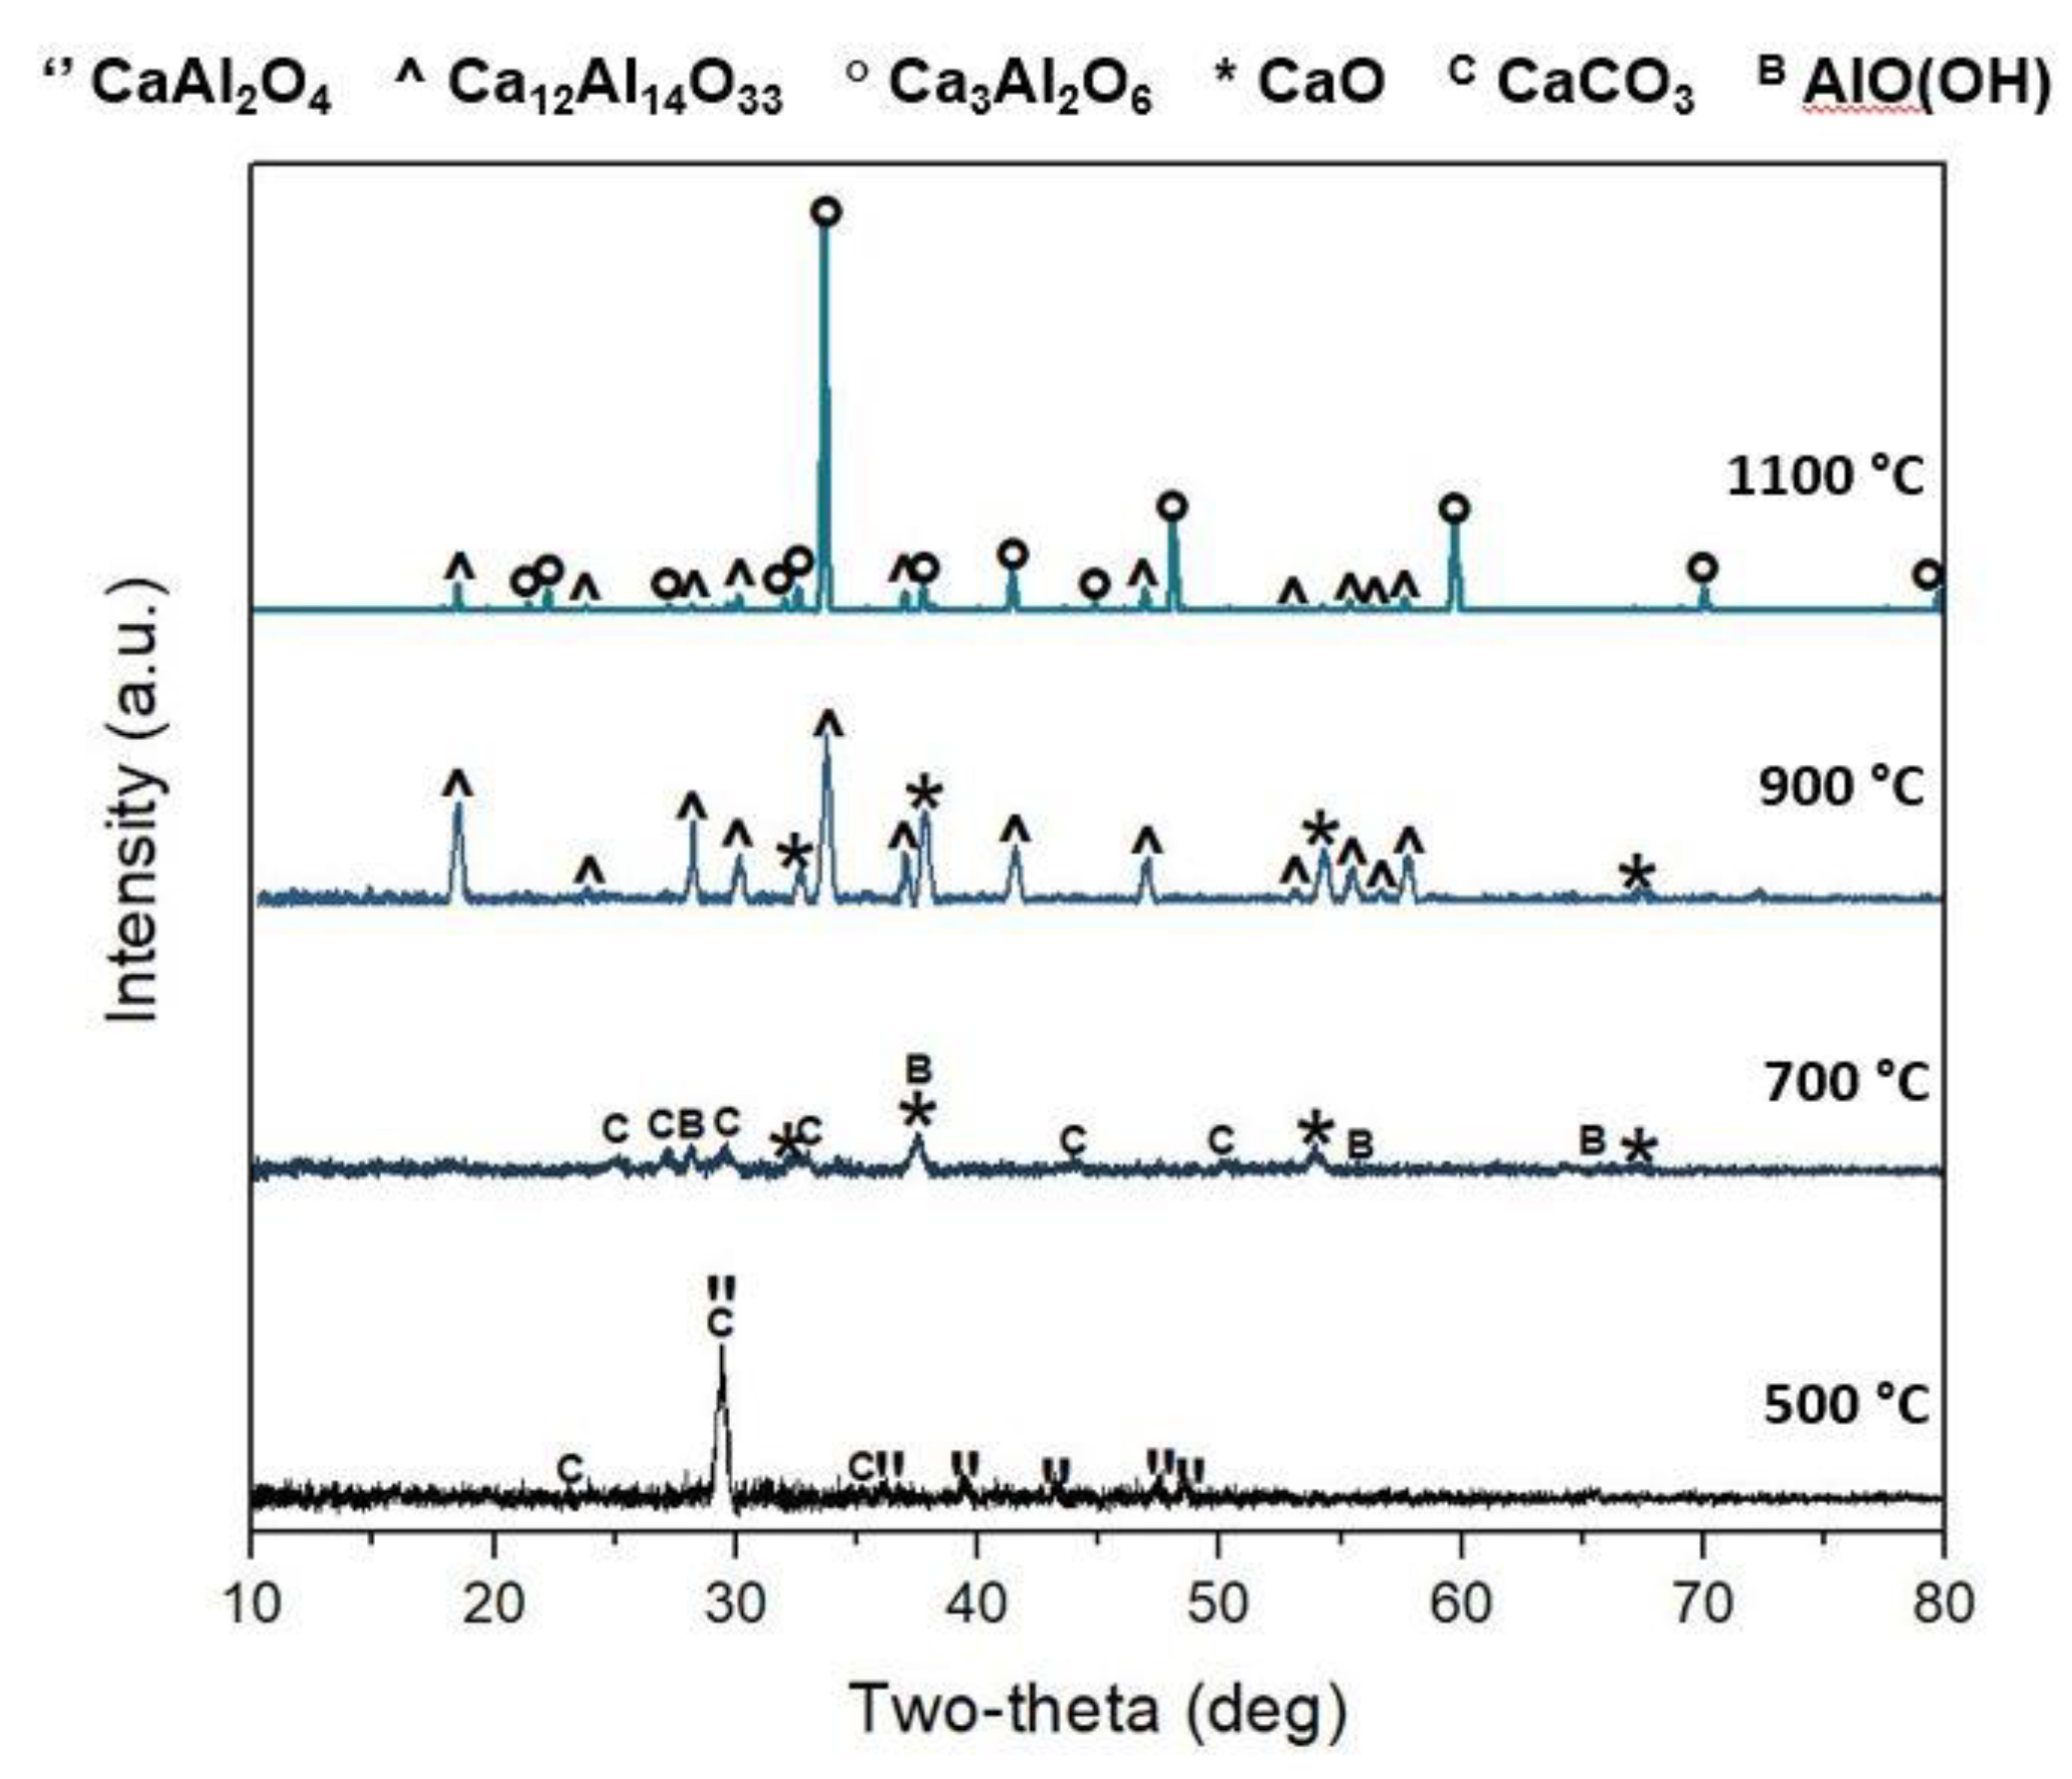
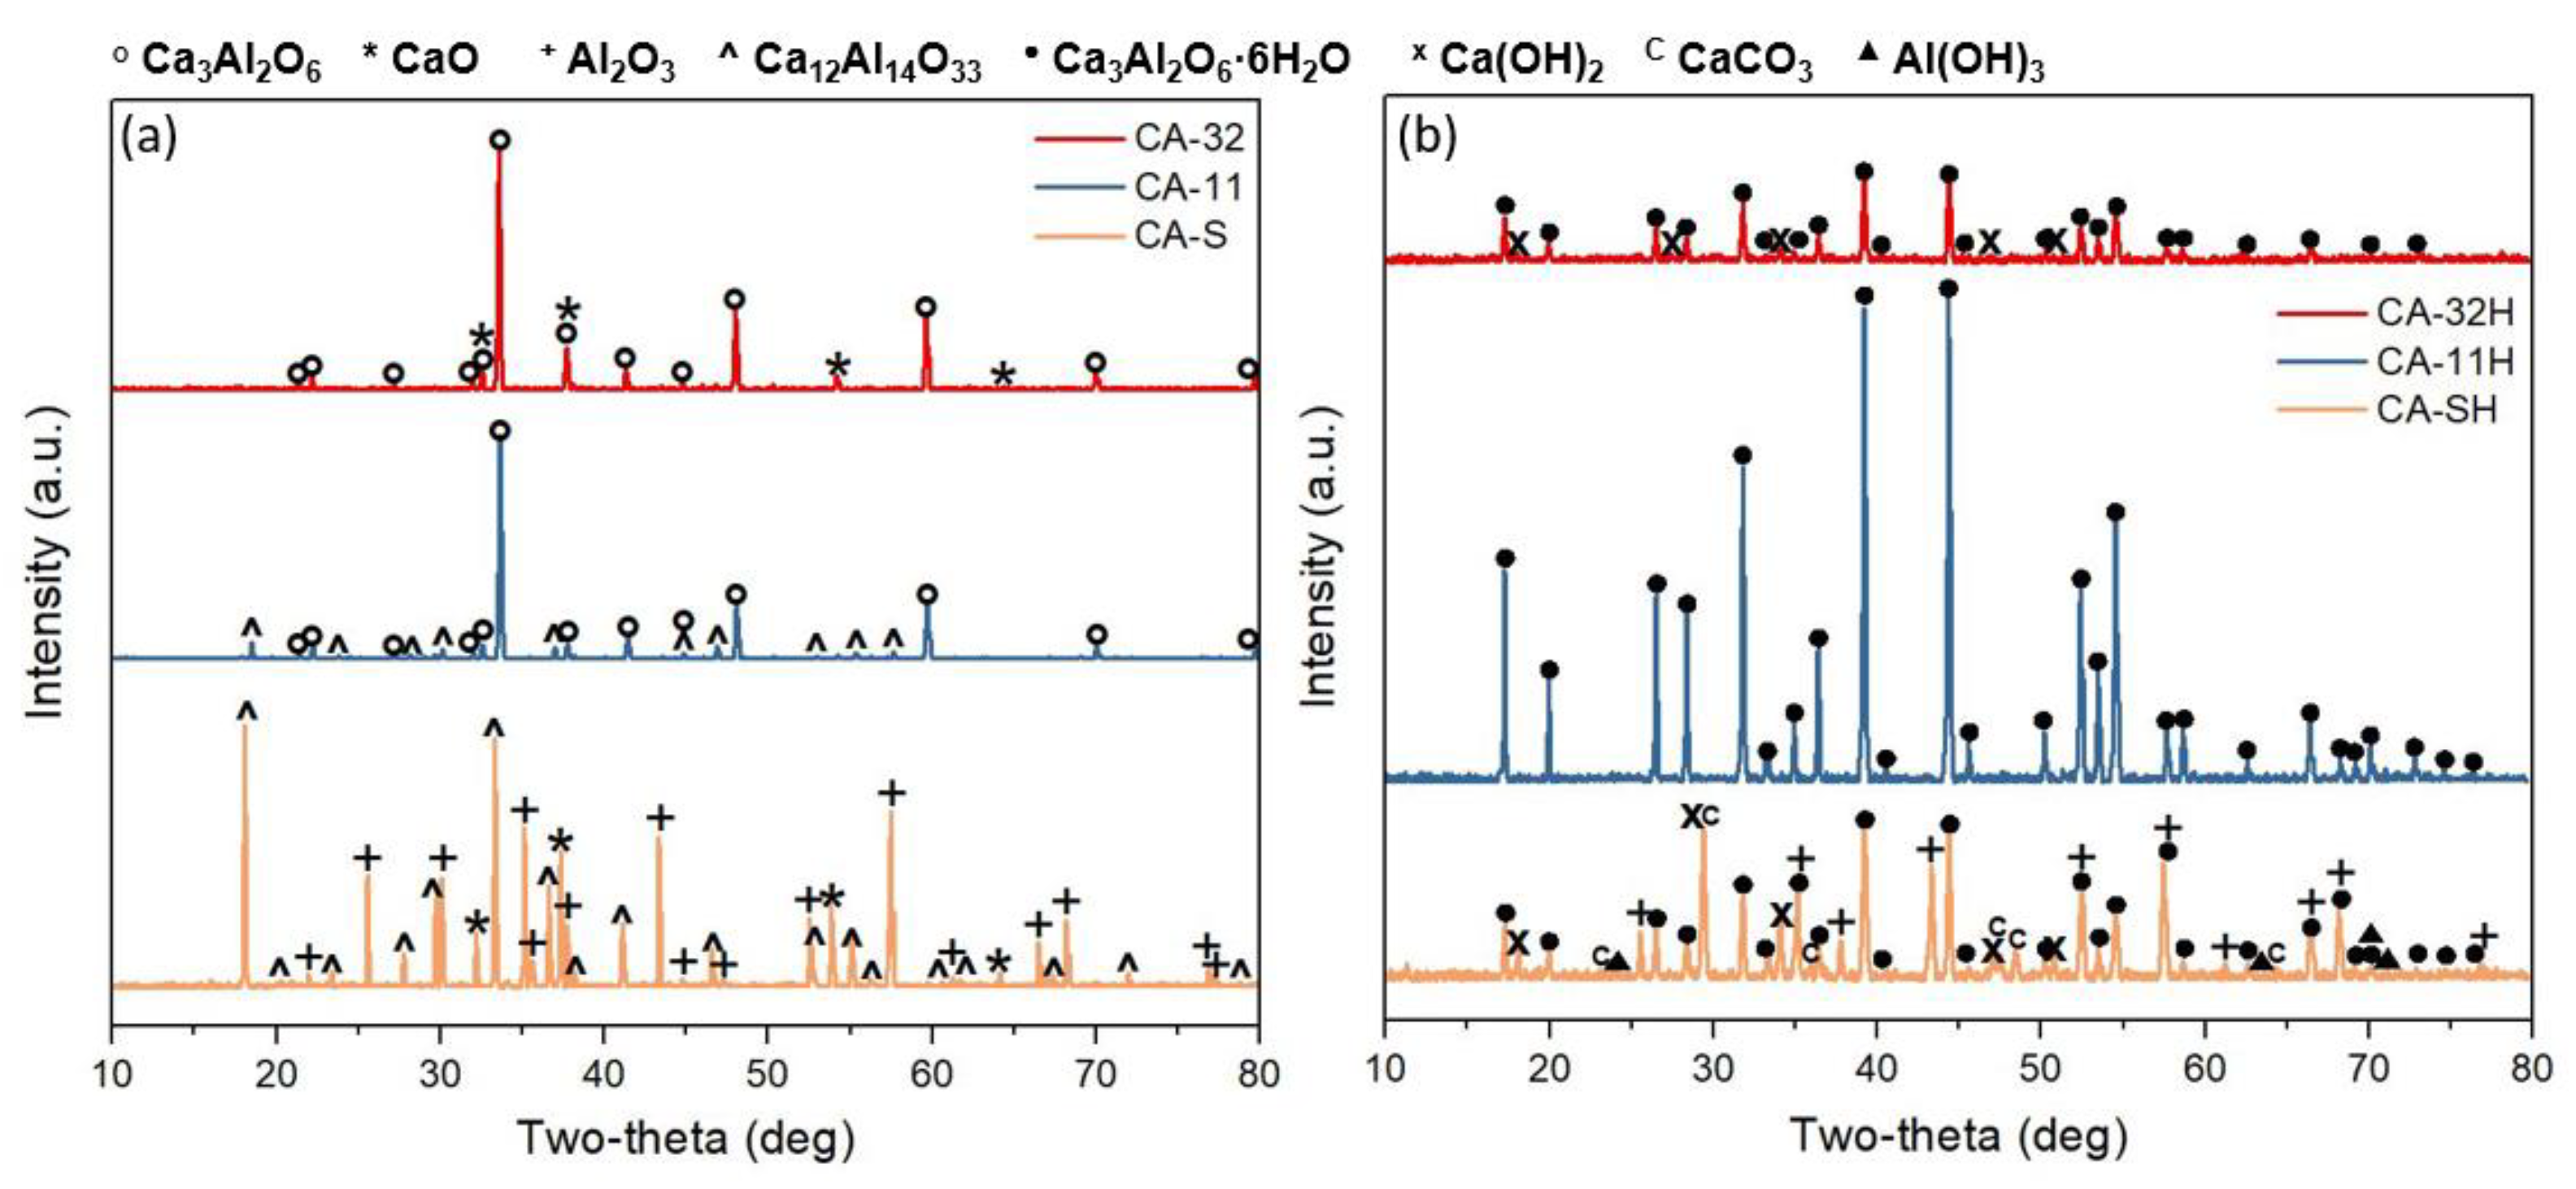
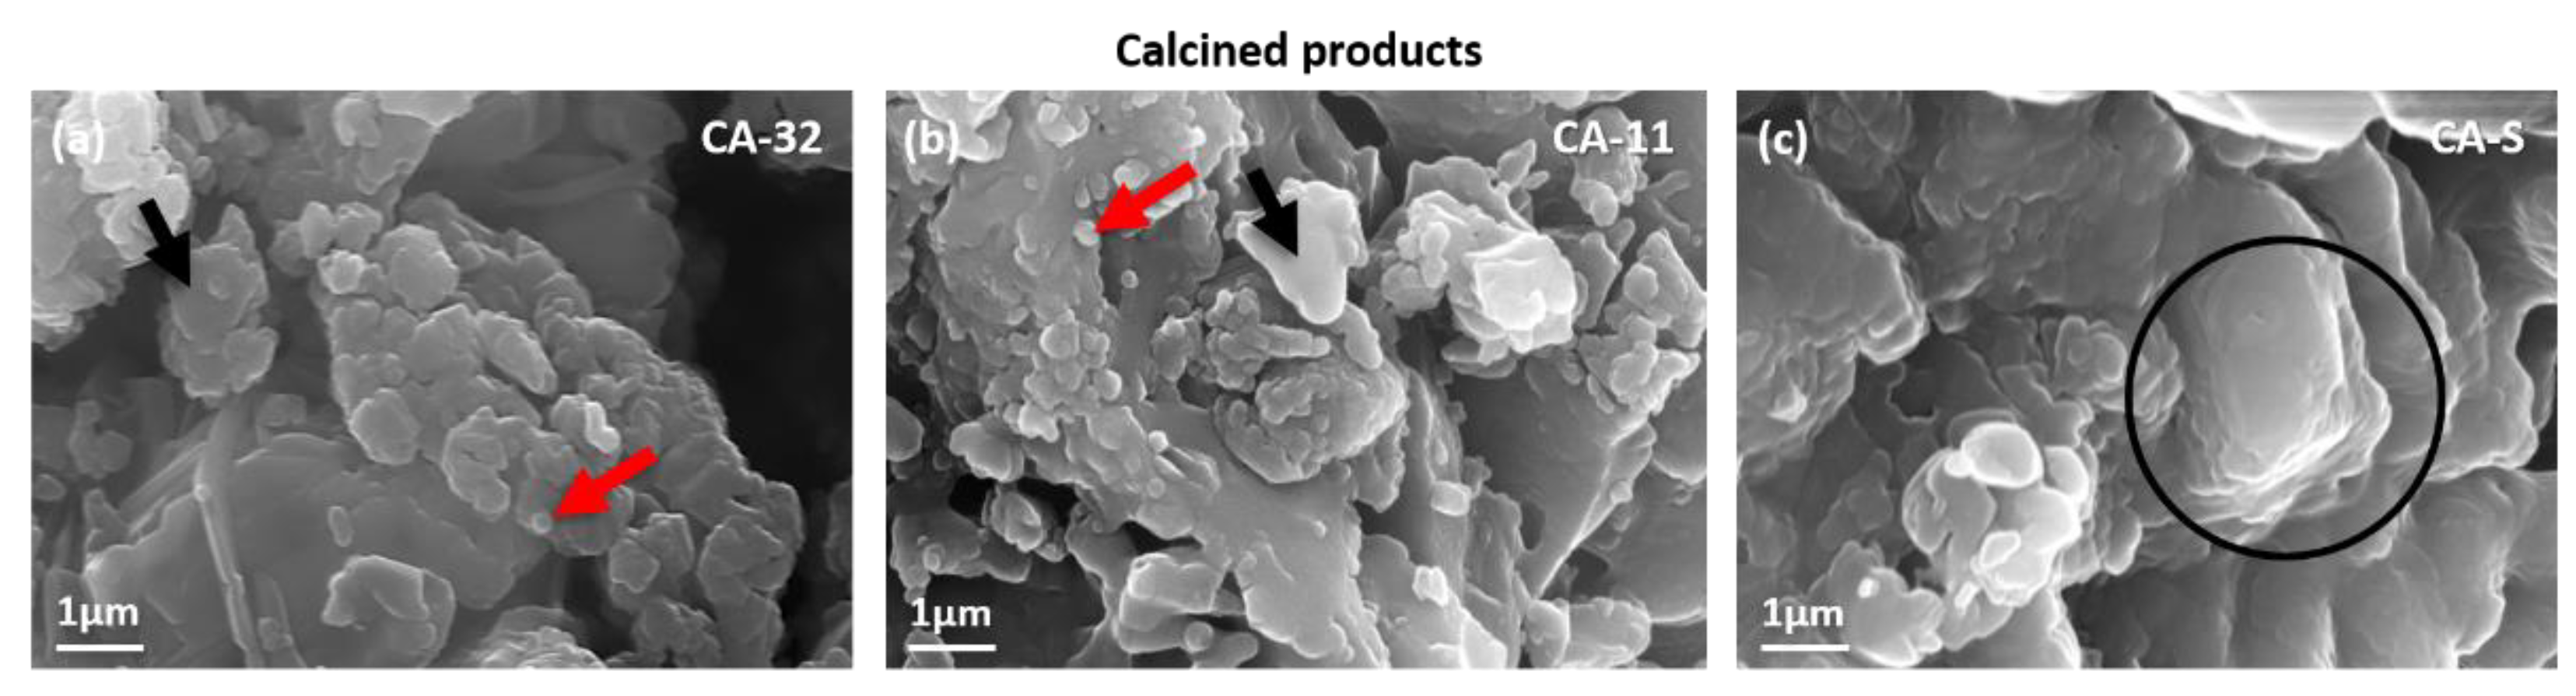
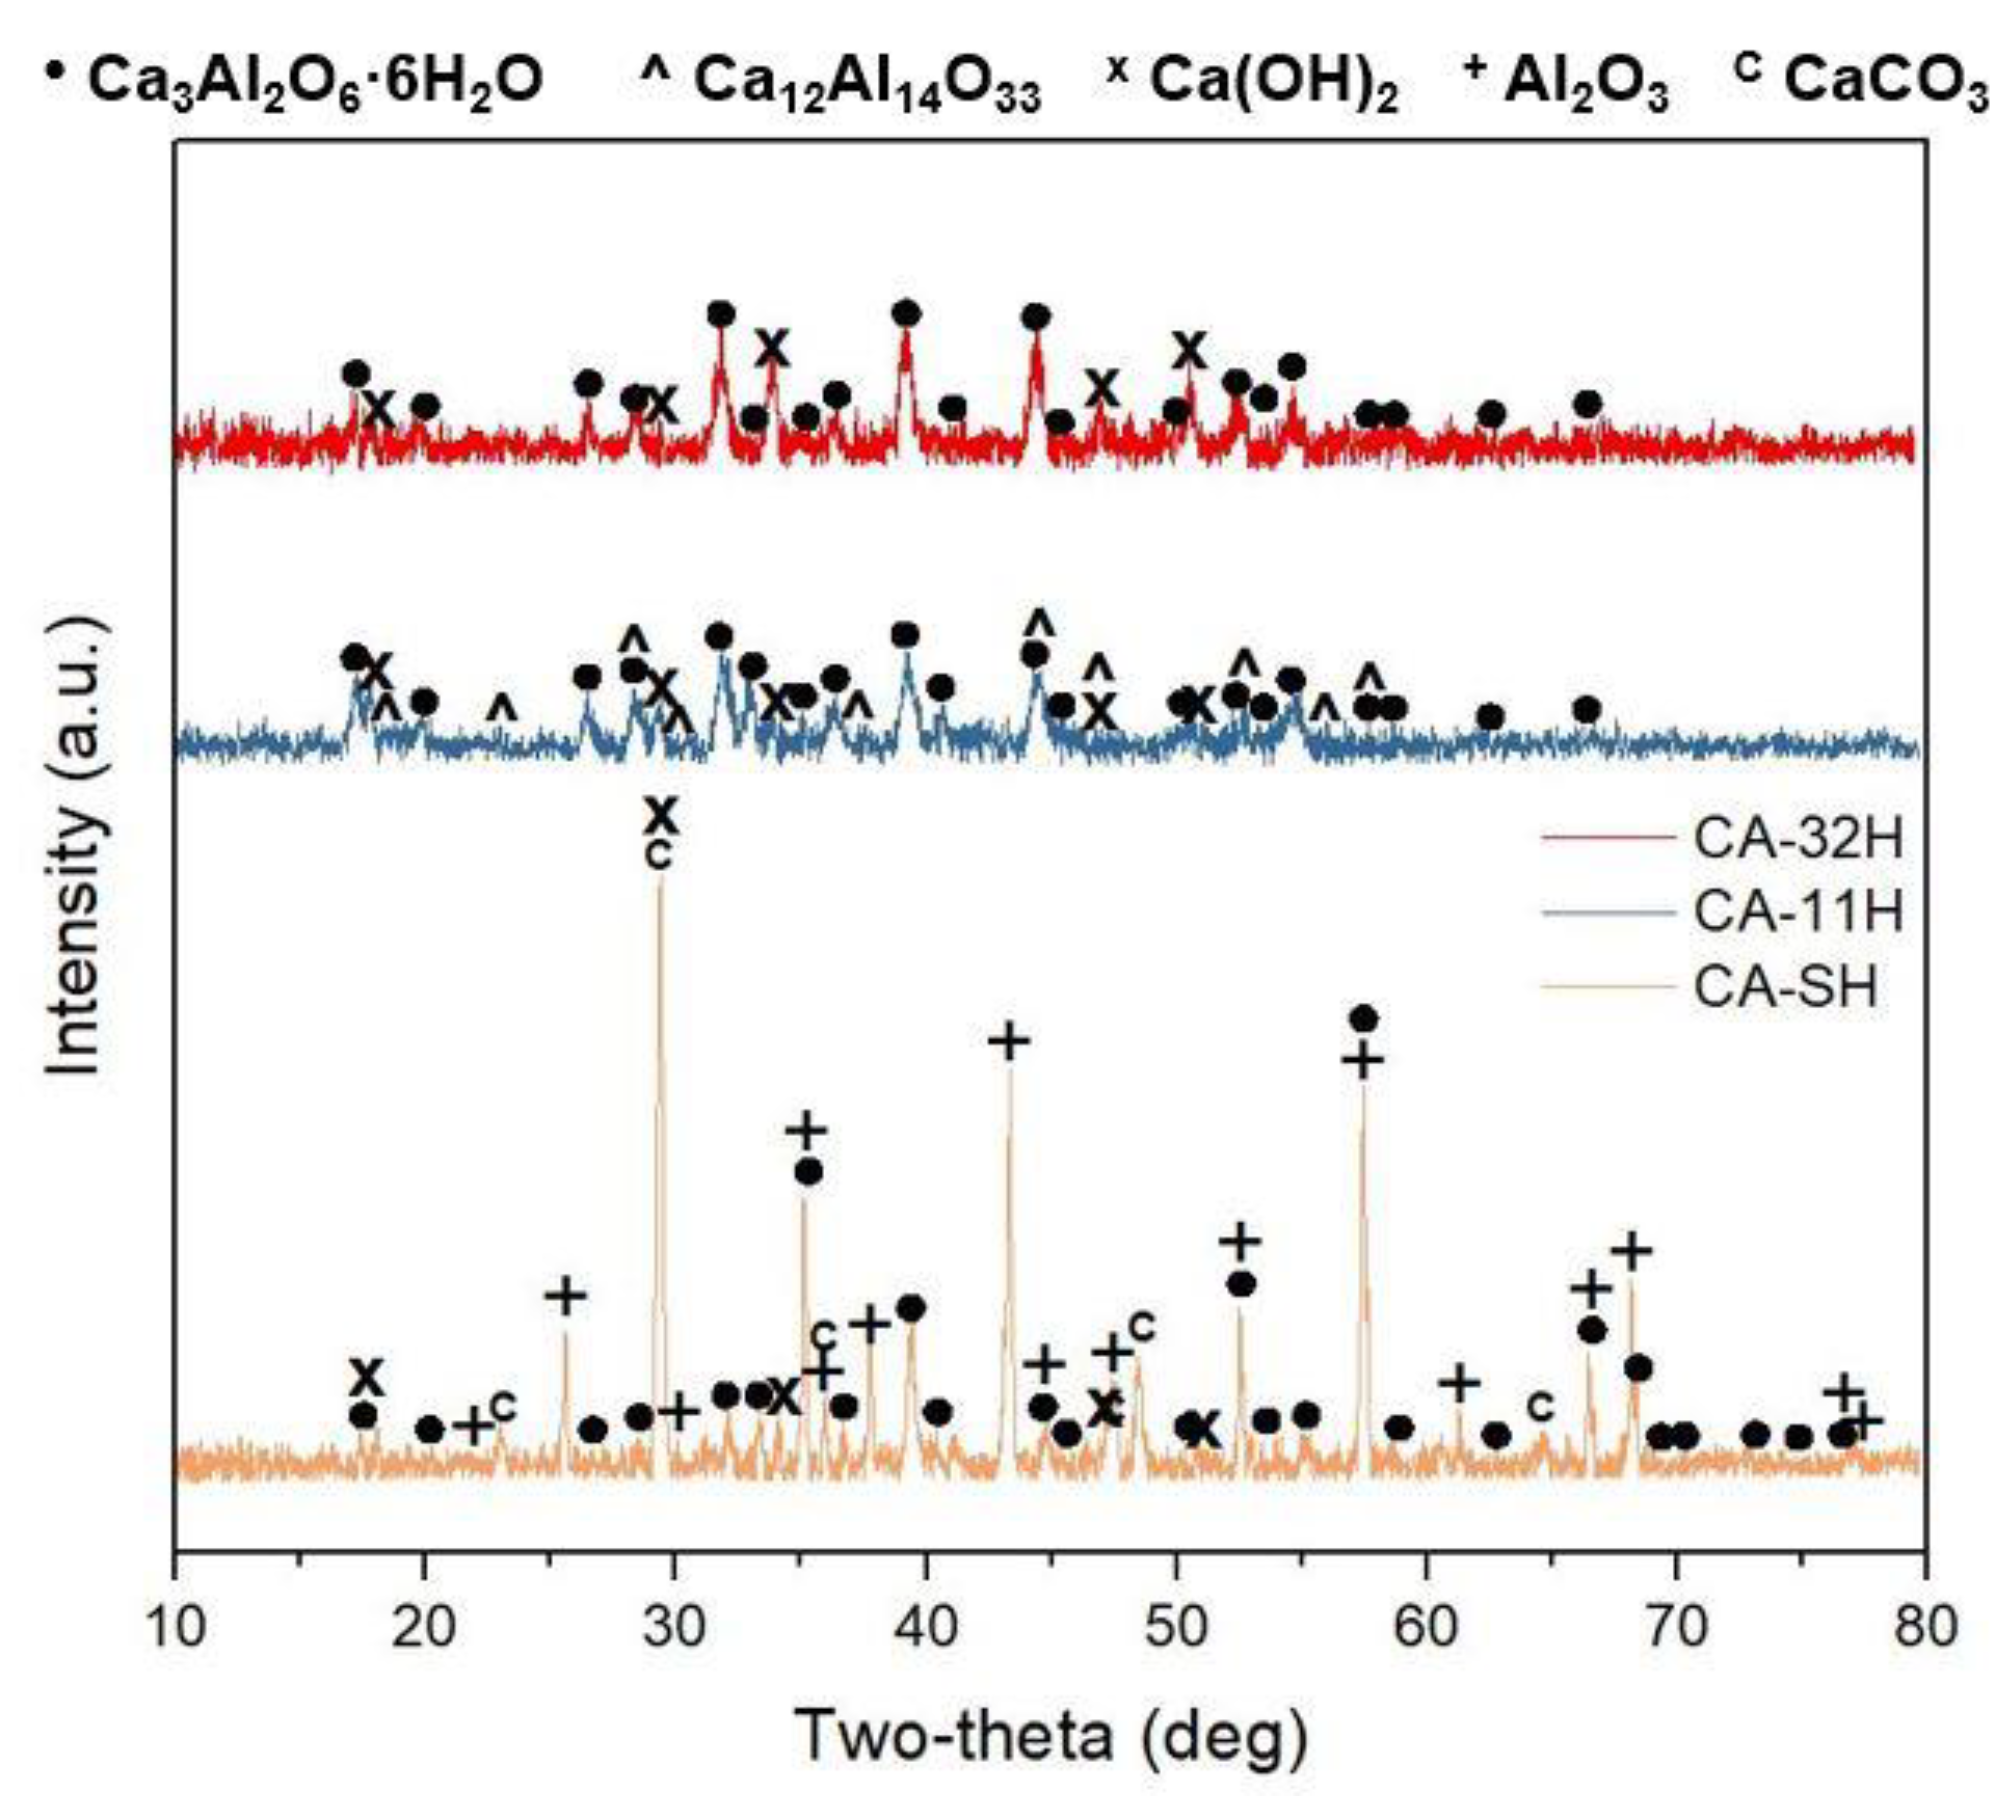
3.1. Ca3Al2O6 Synthesis in Anhydrous and Hydrated Forms

As shown in Table 1, two preparation methods were attempted to achieve Ca3Al2O6: (i) solid–solid reaction at 1100 °C and (ii) co-precipitation followed by thermal treatment at 1100 °C. In the case of solid–solid reaction, a Ca2+/Al3+ molar ratio 3:2 was used. In the case of co-precipitation, the Ca2+:Al3+ molar ratios 3:2 and 1:1 were used. Figure 3 shows the representative diffraction spectra of CA-11 as a function of the calcination temperature (in the range 500–1100 °C). It is worth noting that the thermal treatment in static air at 1100 °C allows for Ca3Al2O6 formation. Indeed, by evaluating the XRD spectra evolution at increasing calcination time, a clear relationship between thermal treatment and sample crystallinity can be observed. A calcination temperature of 500 °C leads to a poor crystallinity. The aluminum is mainly present in the form of calcium dialuminate, CaAl2O4 (JCPDS # 01-0888), and calcite, CaCO3 (JCPDS # 83-1762).
After calcination at 700 °C, the sample still presented amorphous phases; however, some peaks related to crystalline phases were identifiable. Calcium carbonate underwent a partial decomposition into calcium oxide (JCPDS # 70-4068), while the remaining portion was converted into vaterite, CaCO3 (JCPDS # 19-3758). Aluminum was observable only as boehmite, AlO(OH) (JCPDS # 78-4581). The diffraction pattern continued its evolution after calcination at 900 °C, where the crystallinity increased and the main phase was mayenite, Ca12Al14O33 (JCPDS #09-0413). Additionally, peaks of calcium oxide were also observable, demonstrating a complete decarbonation of the previously detected calcium carbonate phases. As the latest diffraction pattern showed, tricalcium aluminate, Ca3Al2O6 (JCPDS # 38-1429), appeared predominantly only after calcination at 1100 °C; however, a low amount of mayenite was still present. In order to better correlate the phase transformations with the production process, the diffraction patterns of the calcined products CA-32, CA-11 and CA-S at 1100 °C are compared in Figure 4a. For CA-32, the main crystal phase was tricalcium aluminate, Ca3Al2O6 (JCPDS # 38-1429). At the same time, a small presence of calcium oxide, CaO, was confirmed (JCPDS # 70-4068). For CA-11, as described before, the main phase was Ca3Al2O6, and a moderate amount of mayenite was also appreciable. CA-S, after calcination, did not show tricalcium aluminate peaks, while it was possible to mainly identify the presence of unreacted CaO and aluminum oxide, Al2O3 (JCPDS # 34-0440). Furthermore, peaks related to mayenite, Ca12Al14O33, could be identified. The solid–solid synthesis, therefore, did not lead to the formation of tricalcium aluminate, as observed for the co-precipitation products, at 1100 °C for 2 h. Probably, temperatures close to melting point (above 1350 °C) are necessary to obtain this product through this method [37].
For TES application, a relevant aspect that requires attention to assess the potential suitability of the material in this context is to evaluate the hydrated phases that are formed due a hydration process. In particular, Figure 4b shows the diffraction patterns after the hydration step (as described in Section 2.2). Hydrated samples are named CA-32H, CA-11H and CA-SH. For CA-32H, katoite, Ca3Al2O6·6H2O (JCPDS # 24-0217) was detected. A small amount of calcium hydroxide, Ca(OH)2, was also observed (JCPDS # 44-1481), formed by the hydration of calcium oxide previously observed in CA-32. The diffractogram showed a low peak intensity. In the CA-11H diffraction pattern, only the characteristic peaks of katoite, Ca3Al2O6·6H2O, were present, thus indicating that, besides the hydration of the Ca3Al2O6 phase, mayenite was also converted into the most thermodynamically stable katoite. Mayenite-to-katoite conversion was also observed for the CA-SH sample. Gibbsite, Al(OH)3 (JCPDS # 33-0018) and calcium hydroxide, Ca(OH)2, were also present as hydrated products. Moreover, the characteristic peaks of unreacted Al2O3 were still evident, and calcium oxide was partially converted into calcite, CaCO3 (JCPDS # 83-1762). The obtained results demonstrated that Ca3Al2O6 was almost quantitatively achieved by the co-precipitation method using a Ca2+/Al3+ molar ratio 1:1, which was in defect of the amount of calcium with respect the stoichiometry of Ca3Al2O6, and it was fully converted into the hexahydrate form. With regard to the co-precipitation products, it is important to point out the discrepancy between what could be expected from the initial Ca/Al ratio and what is shown by the diffraction patterns of materials CA-32 and CA-11, in terms of phase composition. A rational explanation is given by the acid–base behavior of aluminium cations: amphoterism of Al3+ makes its solubility increasingly relevant after pH ~9, in accordance with the tetrahydroxy aluminate ion formation [38], as described in Equation (3).
Al(OH)3(s) + OH(aq)⇄Al(OH)4(aq)
It is therefore understandable that part of the initially employed aluminum is not found in the final product. Consequently, in CA-32, some of Ca2+ precipitates as Ca(OH)2 (dehydrated to CaO, subsequently, during calcination), while in CA-11, the initial aluminum excess led to the formation of tricalcium aluminate. The morphology of the samples after calcination, evaluated by SEM micrographs, is shown in Figure 5. A similar morphology is observable for samples CA-32 and CA-11 after calcination (Figure 5a,b), in which rounded particles (red arrows) and flat hexagonal particles of different sizes (black arrows), ascribable to tricalcium aluminate, are present [39]. CA-S shows particles relatively bigger than the co-precipitates (black circle) after calcination (Figure 5c).
Furthermore, Figure 6 reports the products viewed with SEM micrographs after hydration. For a better clarity, punctual EDX elemental analysis on the hydrated products was useful to estimate the chemical composition on a specified point by means of the Ca/Al molar ratio (see the attached table in Figure 6). Hexagonal katoite plates can be noted for all the samples (black arrows); these have a more regular shape in CA-11 batch (a), in which katoite XRD peaks were also more intense (Figure 4b). The punctual elemental analysis on these particles (spots n° 2,3,4 and 5) confirmed a Ca/Al ratio close to 1.5, corresponding to the Ca3Al2O6·6H2O one. CA-32H (b) clearly shows a significant amount of calcium hydroxide nanoparticles (blue arrow), where the elemental analysis (spot n° 1) gives a significantly increased Ca/Al molar ratio. For the solid–solid product (c), the presence of bigger particles can still be noted (black circle); however it is also possible to observe other morphologies, the most evident of which is the typical cubic shape of α-alumina [40] (green arrow). The spot n° 6 on a cubic particle confirms a local large excess of aluminum, with a Ca/Al molar ratio < 0.1.

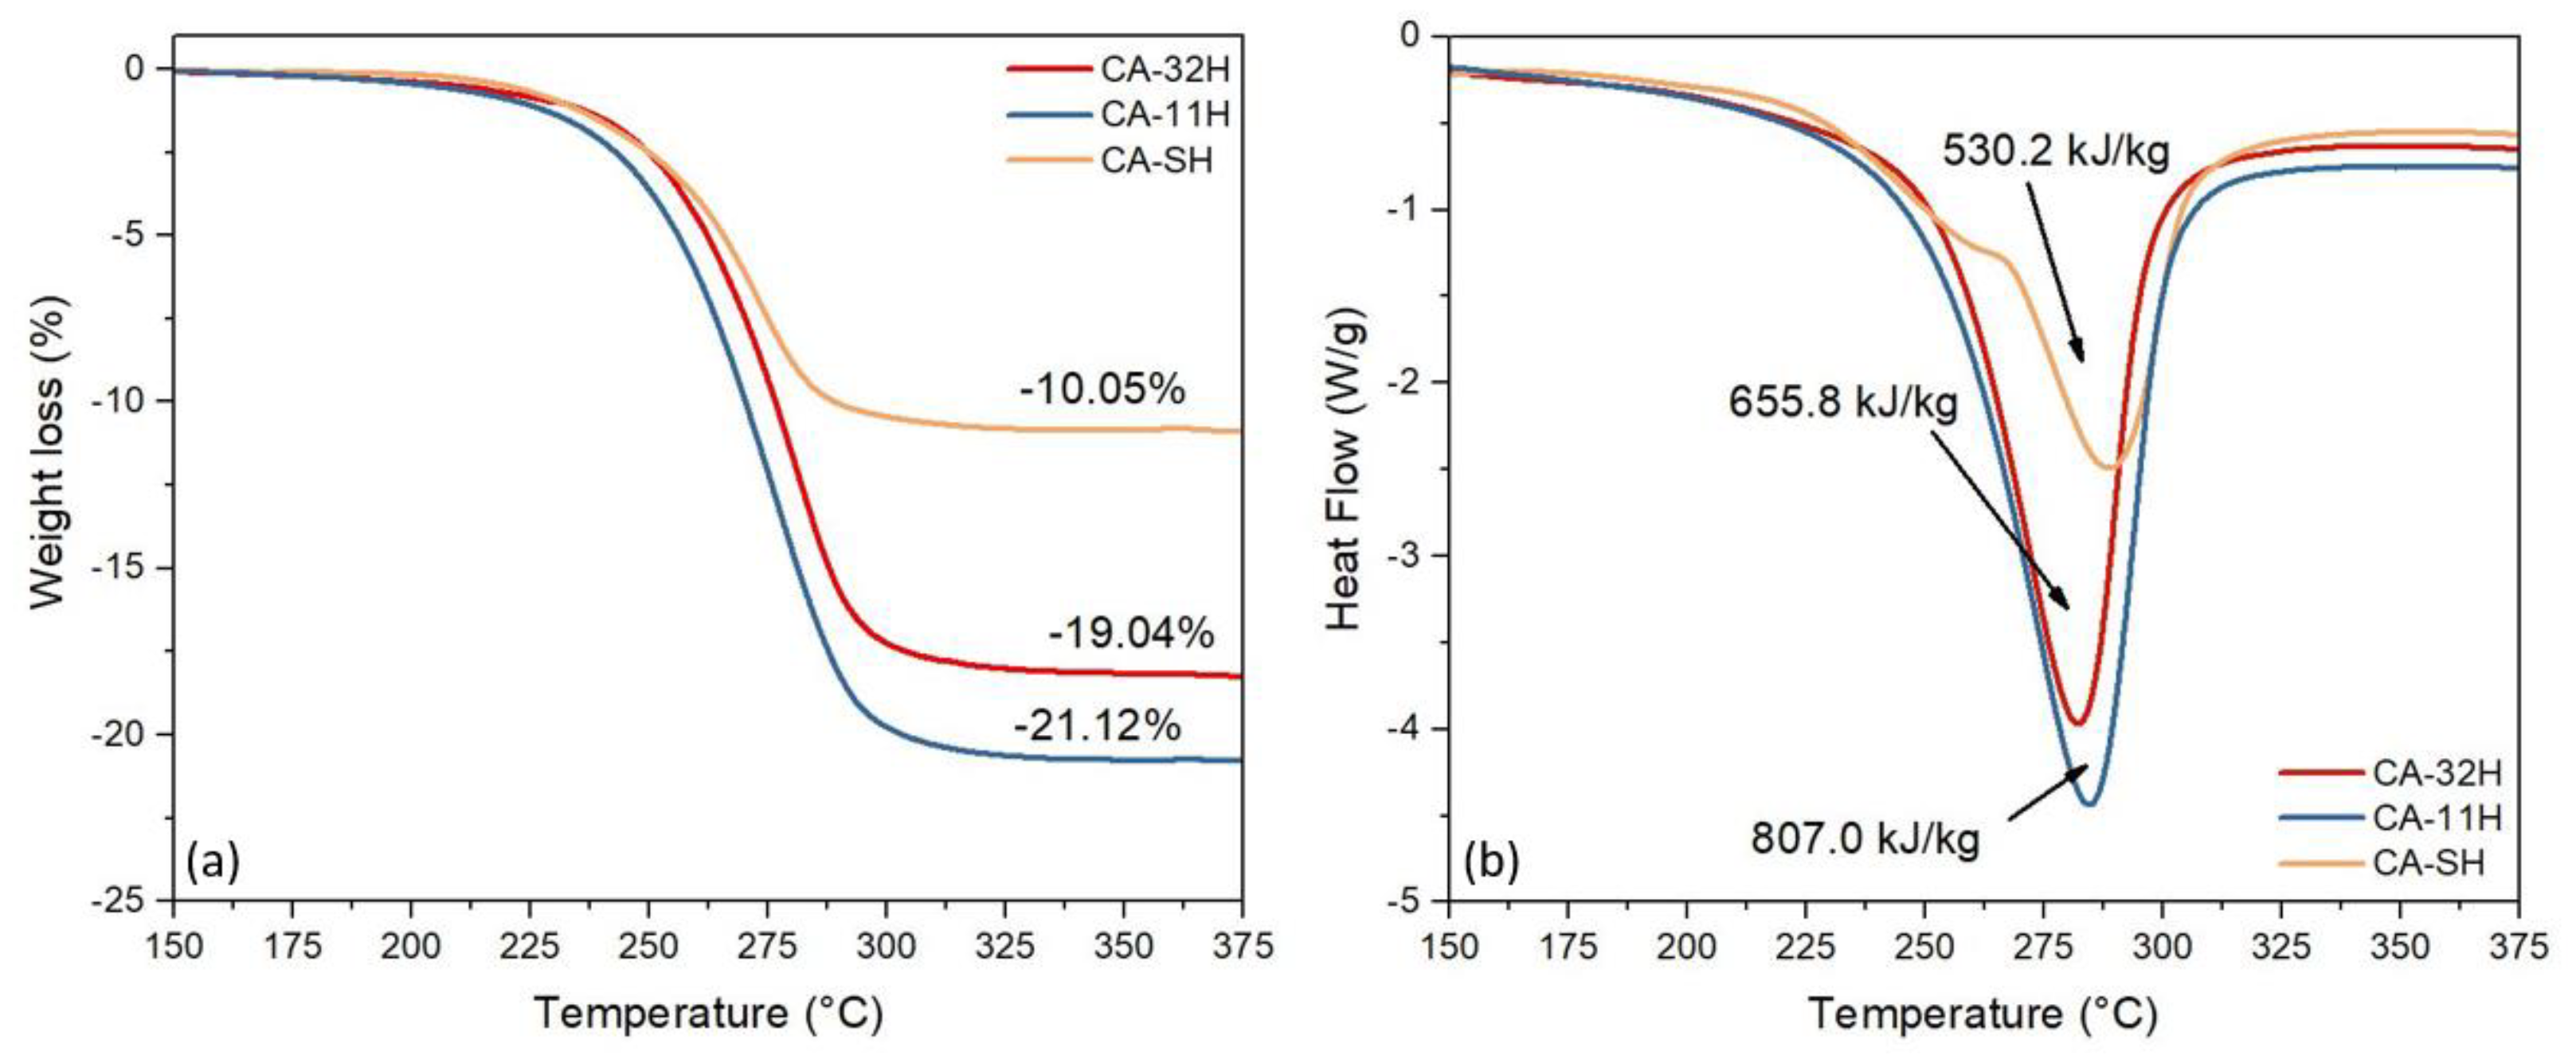
3.2. Dehydration and Heat of Reaction

In order to thermally characterize the hydrated materials, thermogravimetric analysis and differential scanning calorimetry measurements were performed. TGA scan of the first dehydration process enabled the evaluation of the operating temperature range and the quantification of the related weight loss. At the same time, DSC scan measured the amount of involved endothermic heat of the observed processes. The comparison of the thermogravimetric dehydration results of the different tricalcium aluminate hexahydrate samples, shown in Figure 7a, demonstrates that the dehydrated fraction at 375 °C is significantly influenced by synthesis process. Indeed, CA-11H sample shows the highest weight reduction equal to 21.12%, quite close to the theoretical mass loss due to the katoite partial dehydration (Equation (4)):
Ca3Al2O6·6H2O(s)→Ca3Al2O6·1.5H2O(s) + 4.5H2O(g)
The mass loss decreases about 19.04% for CA-32H batch and 10.05% for CA-SH one due to a lower amount of hydrated calcium aluminate compound in the latter (see Figure 7a). Consequently, the thermogravimetric curves show a clearly more effective behavior for the co-precipitated specimens compared to the solid–solid one.
Furthermore, the heat of dehydration has been determined through integration of the peak obtained by calorimetric analysis (Figure 7b). The results confirmed what was highlighted by TGA measurements. CA-11H revealed a dehydration heat of 807.0 kJ/kg, higher than CA-32H and CA-SH, respectively, 655.8 kJ/kg and 530.2 kJ/kg. Based on these considerations, a preliminary explanation of the dehydration process can be assessed. According to XRD phase identification, the observed chemical process is mainly related to the thermal decomposition of katoite, which leads to 4.5 water molecules loss (See Equation (4)). This process represents the only one observed for co-precipitated products. In contrast, it is still possible to perceive that for CA-SH product there is the presence of an additional process, as a secondary DSC peak shows clearly, ascribed to the decomposition of aluminum hydroxide to boehmite (Equation (5)):
Al(OH)3(s)→AlO(OH)(s) + H2O(g)
This result confirms that this batch is characterized by a relevant microstructural heterogeneity that hinders the hydration/dehydration efficiency. In contrast, the CA-11H and CA-32H samples show a microstructural homogeneity which acts effectively on the vapor phase mass exchange processes. The phenomenon, managed almost exclusively by Equation (3), allows for high thermal capacities in a very narrow temperature range, enhancing the selectivity of the material for a suitable and efficient use of thermal waste. Table 4 summarizes the results obtained from the analysis.
The last column shows the amount of katoite on the respective material. It was determined as the conversion percentage compared to the theoretical reference value for pure katoite (−21.42 wt.%), calculated as follows (Equation (6)):
Δ m t h = 4.5 · M W H 2 O M W C a 3 A l 2 O 6 · 6 H 2 O · 100
Regarding the material obtained by solid–solid synthesis, the amount of katoite cannot be determined quantitatively, due to the existence of two simultaneous processes. Thus, in lack of further experimental evidence, it is only possible to claim that the sample has a katoite content lower than 46.9% (calculated assuming that the whole weight loss is ascribed to the dehydration of the katoite phase).

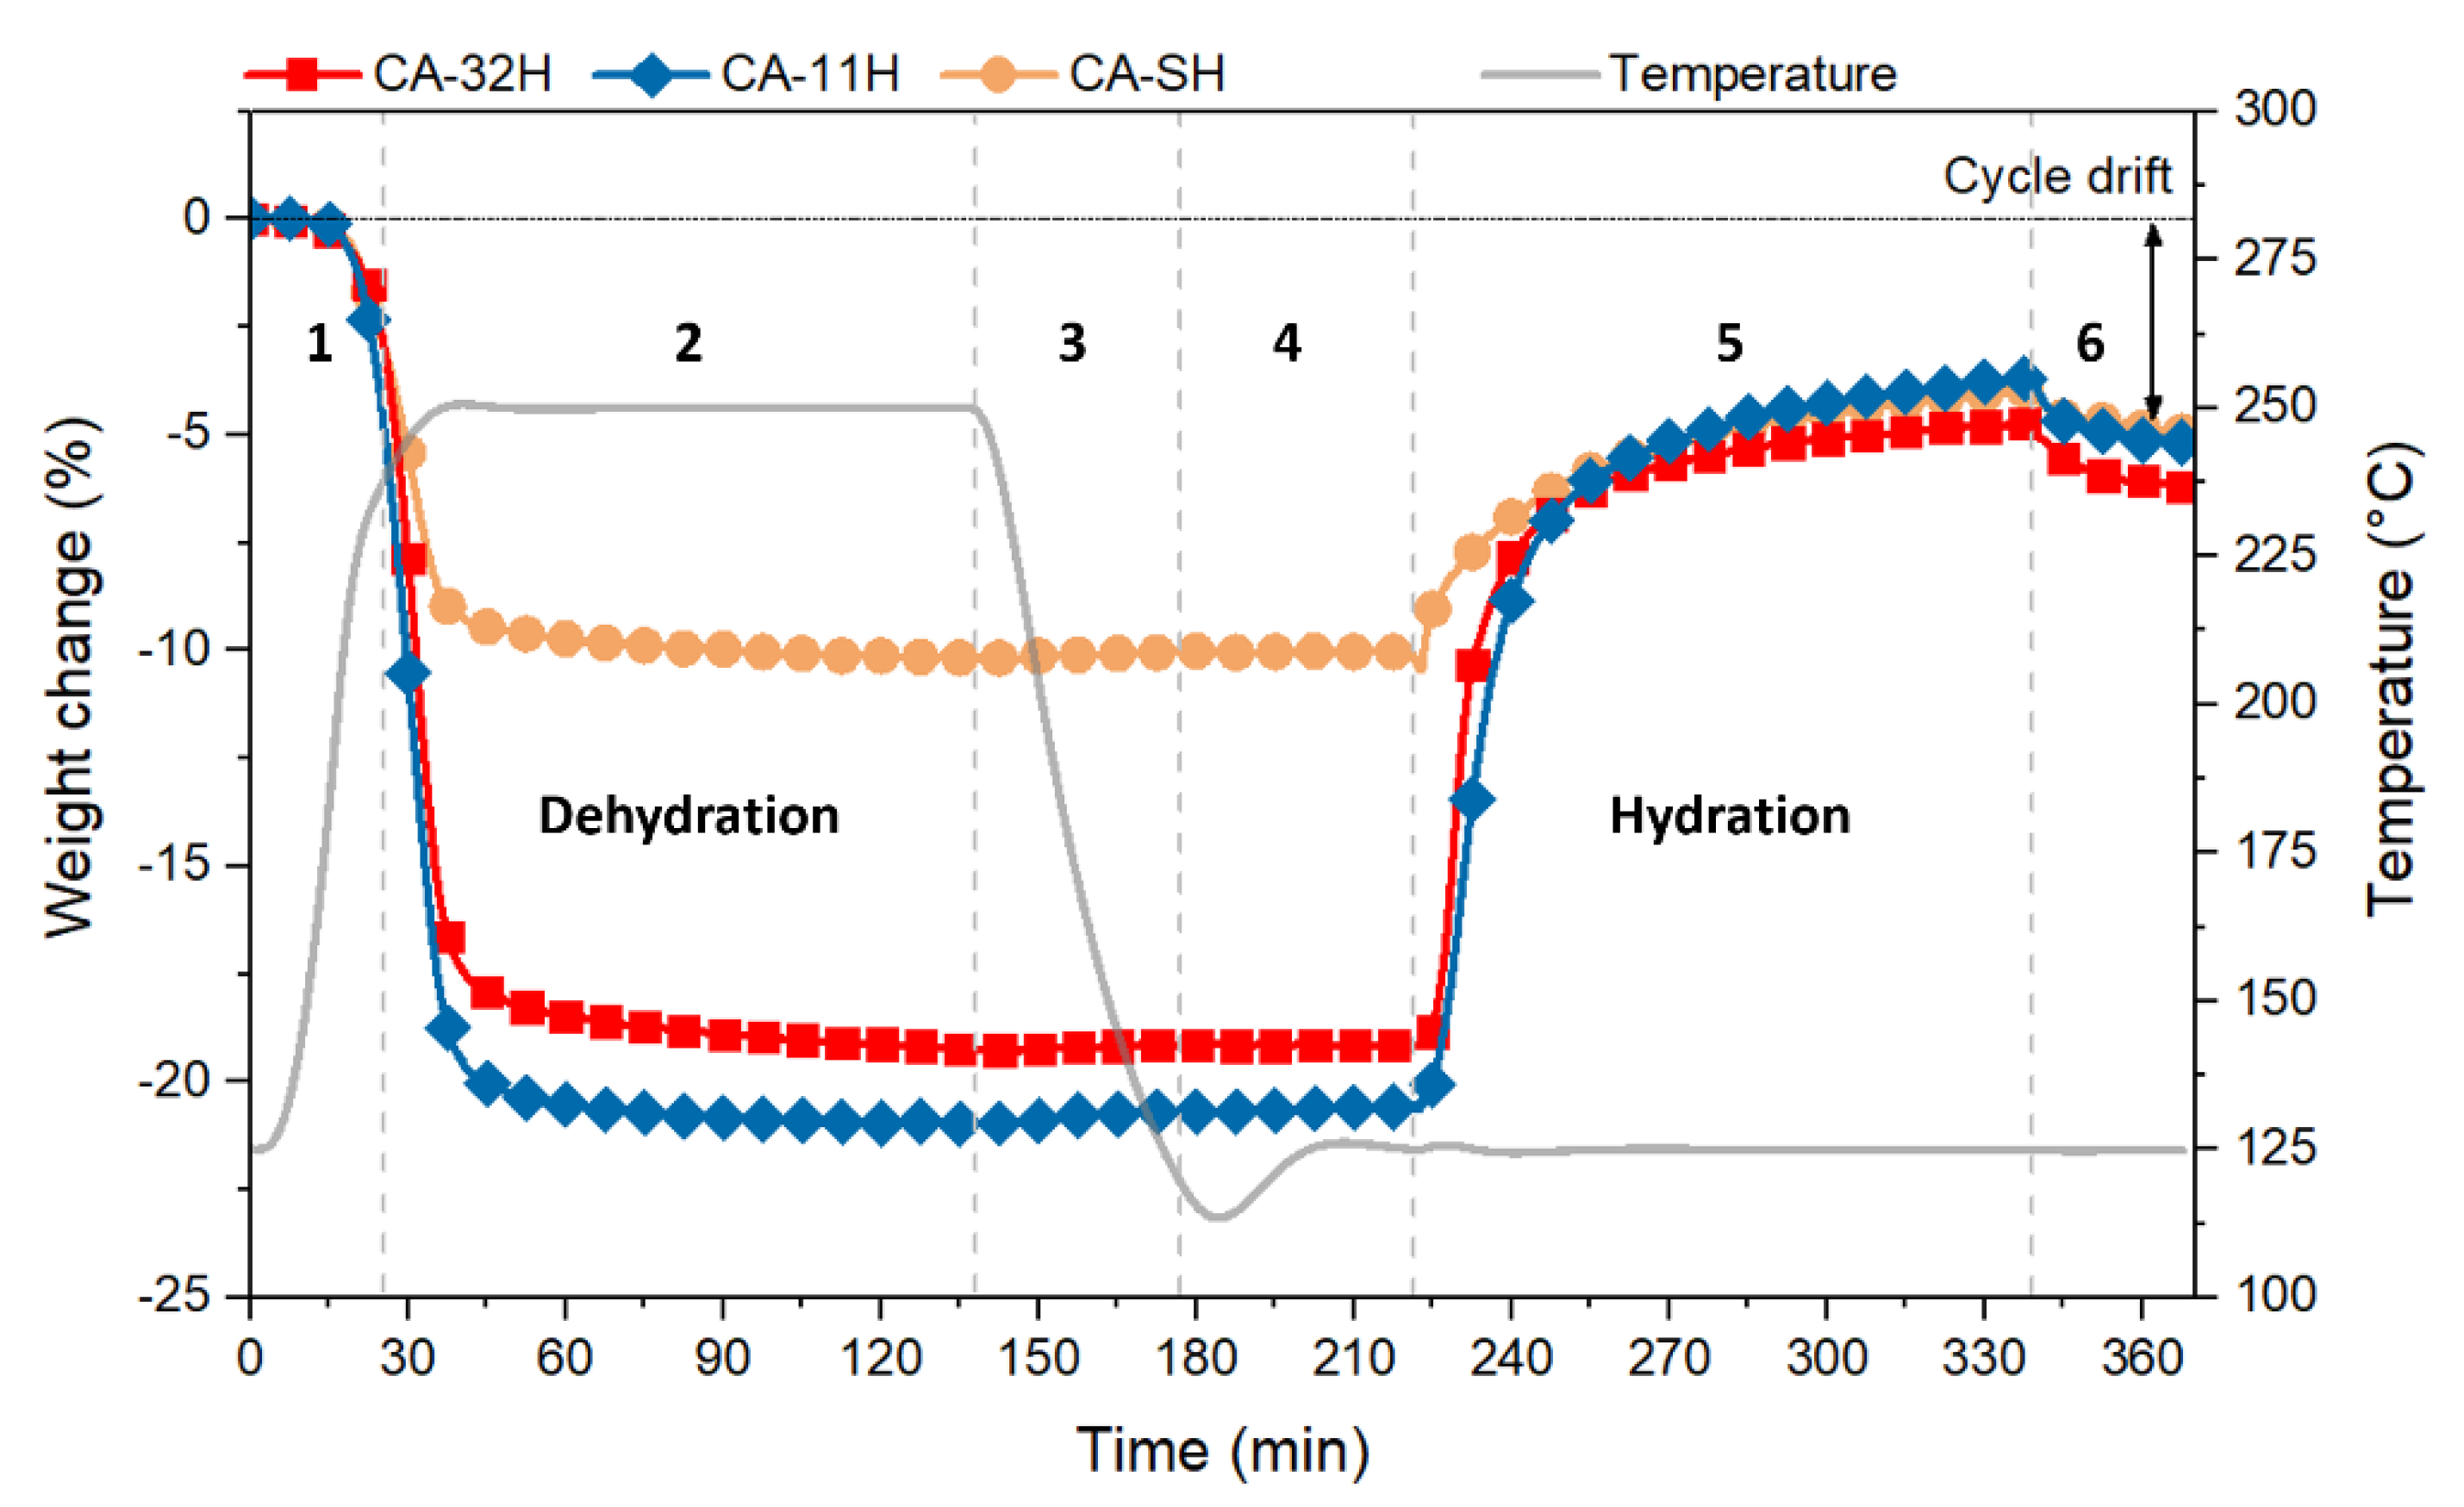
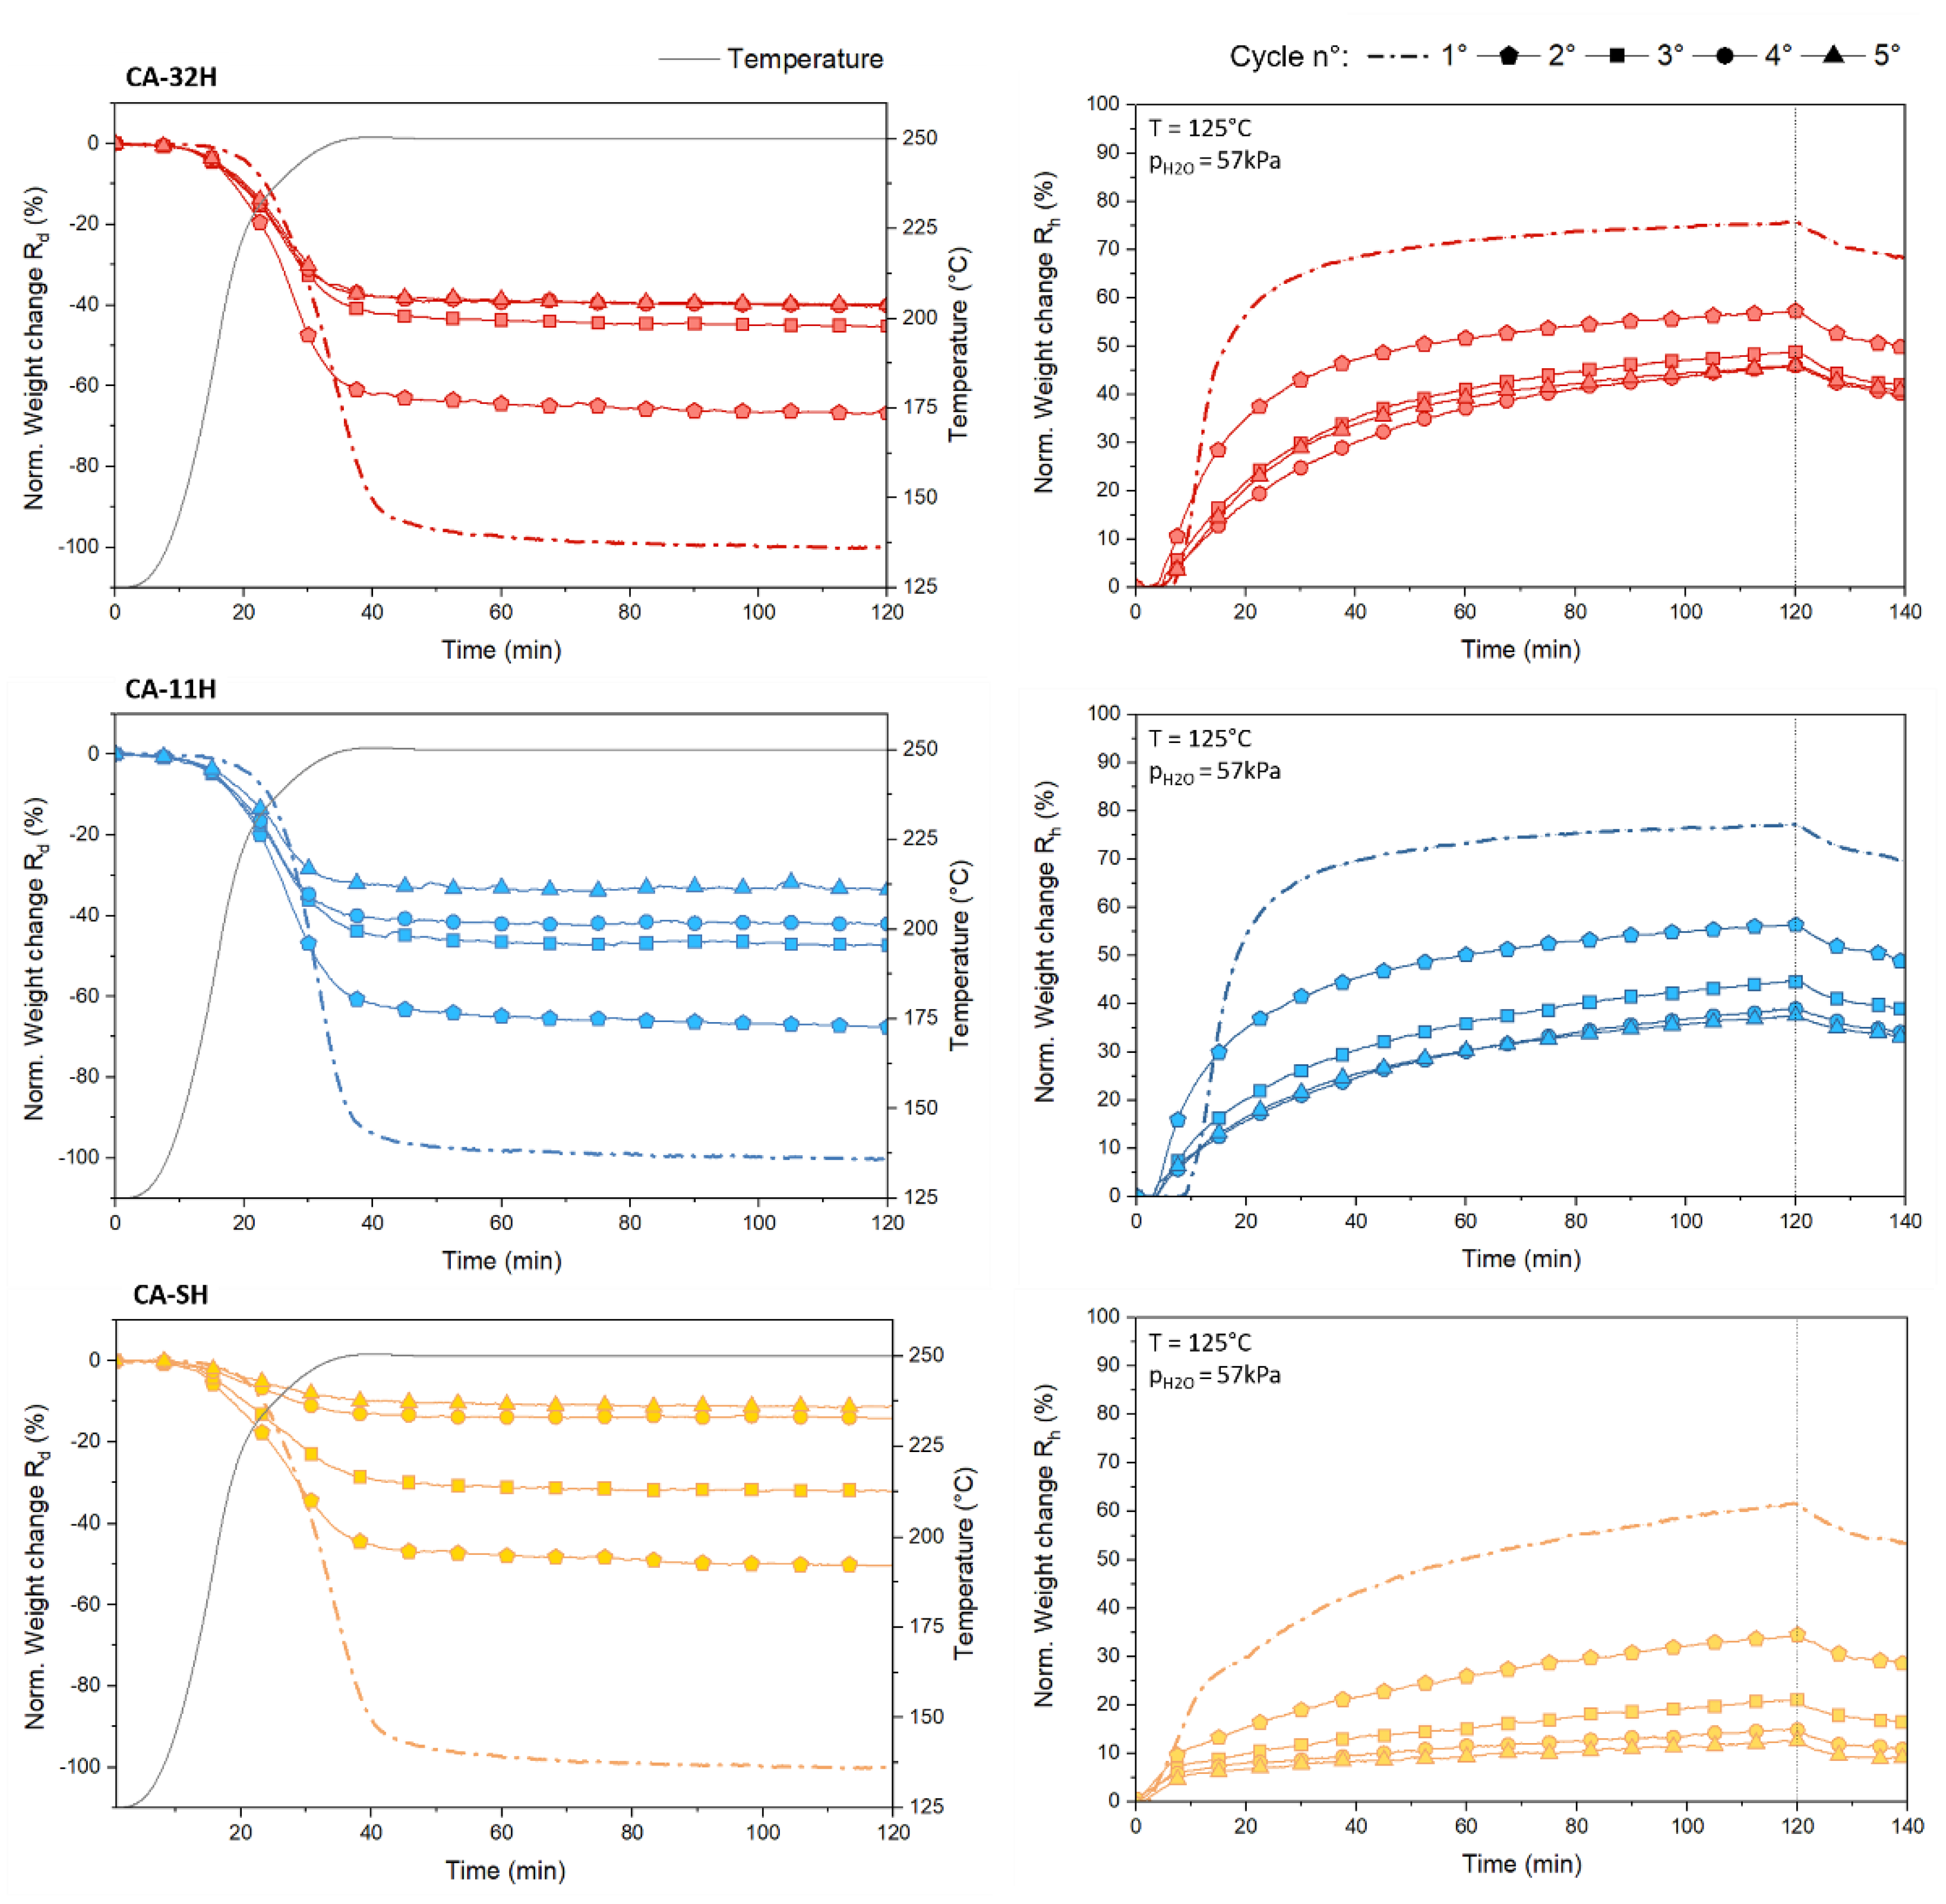
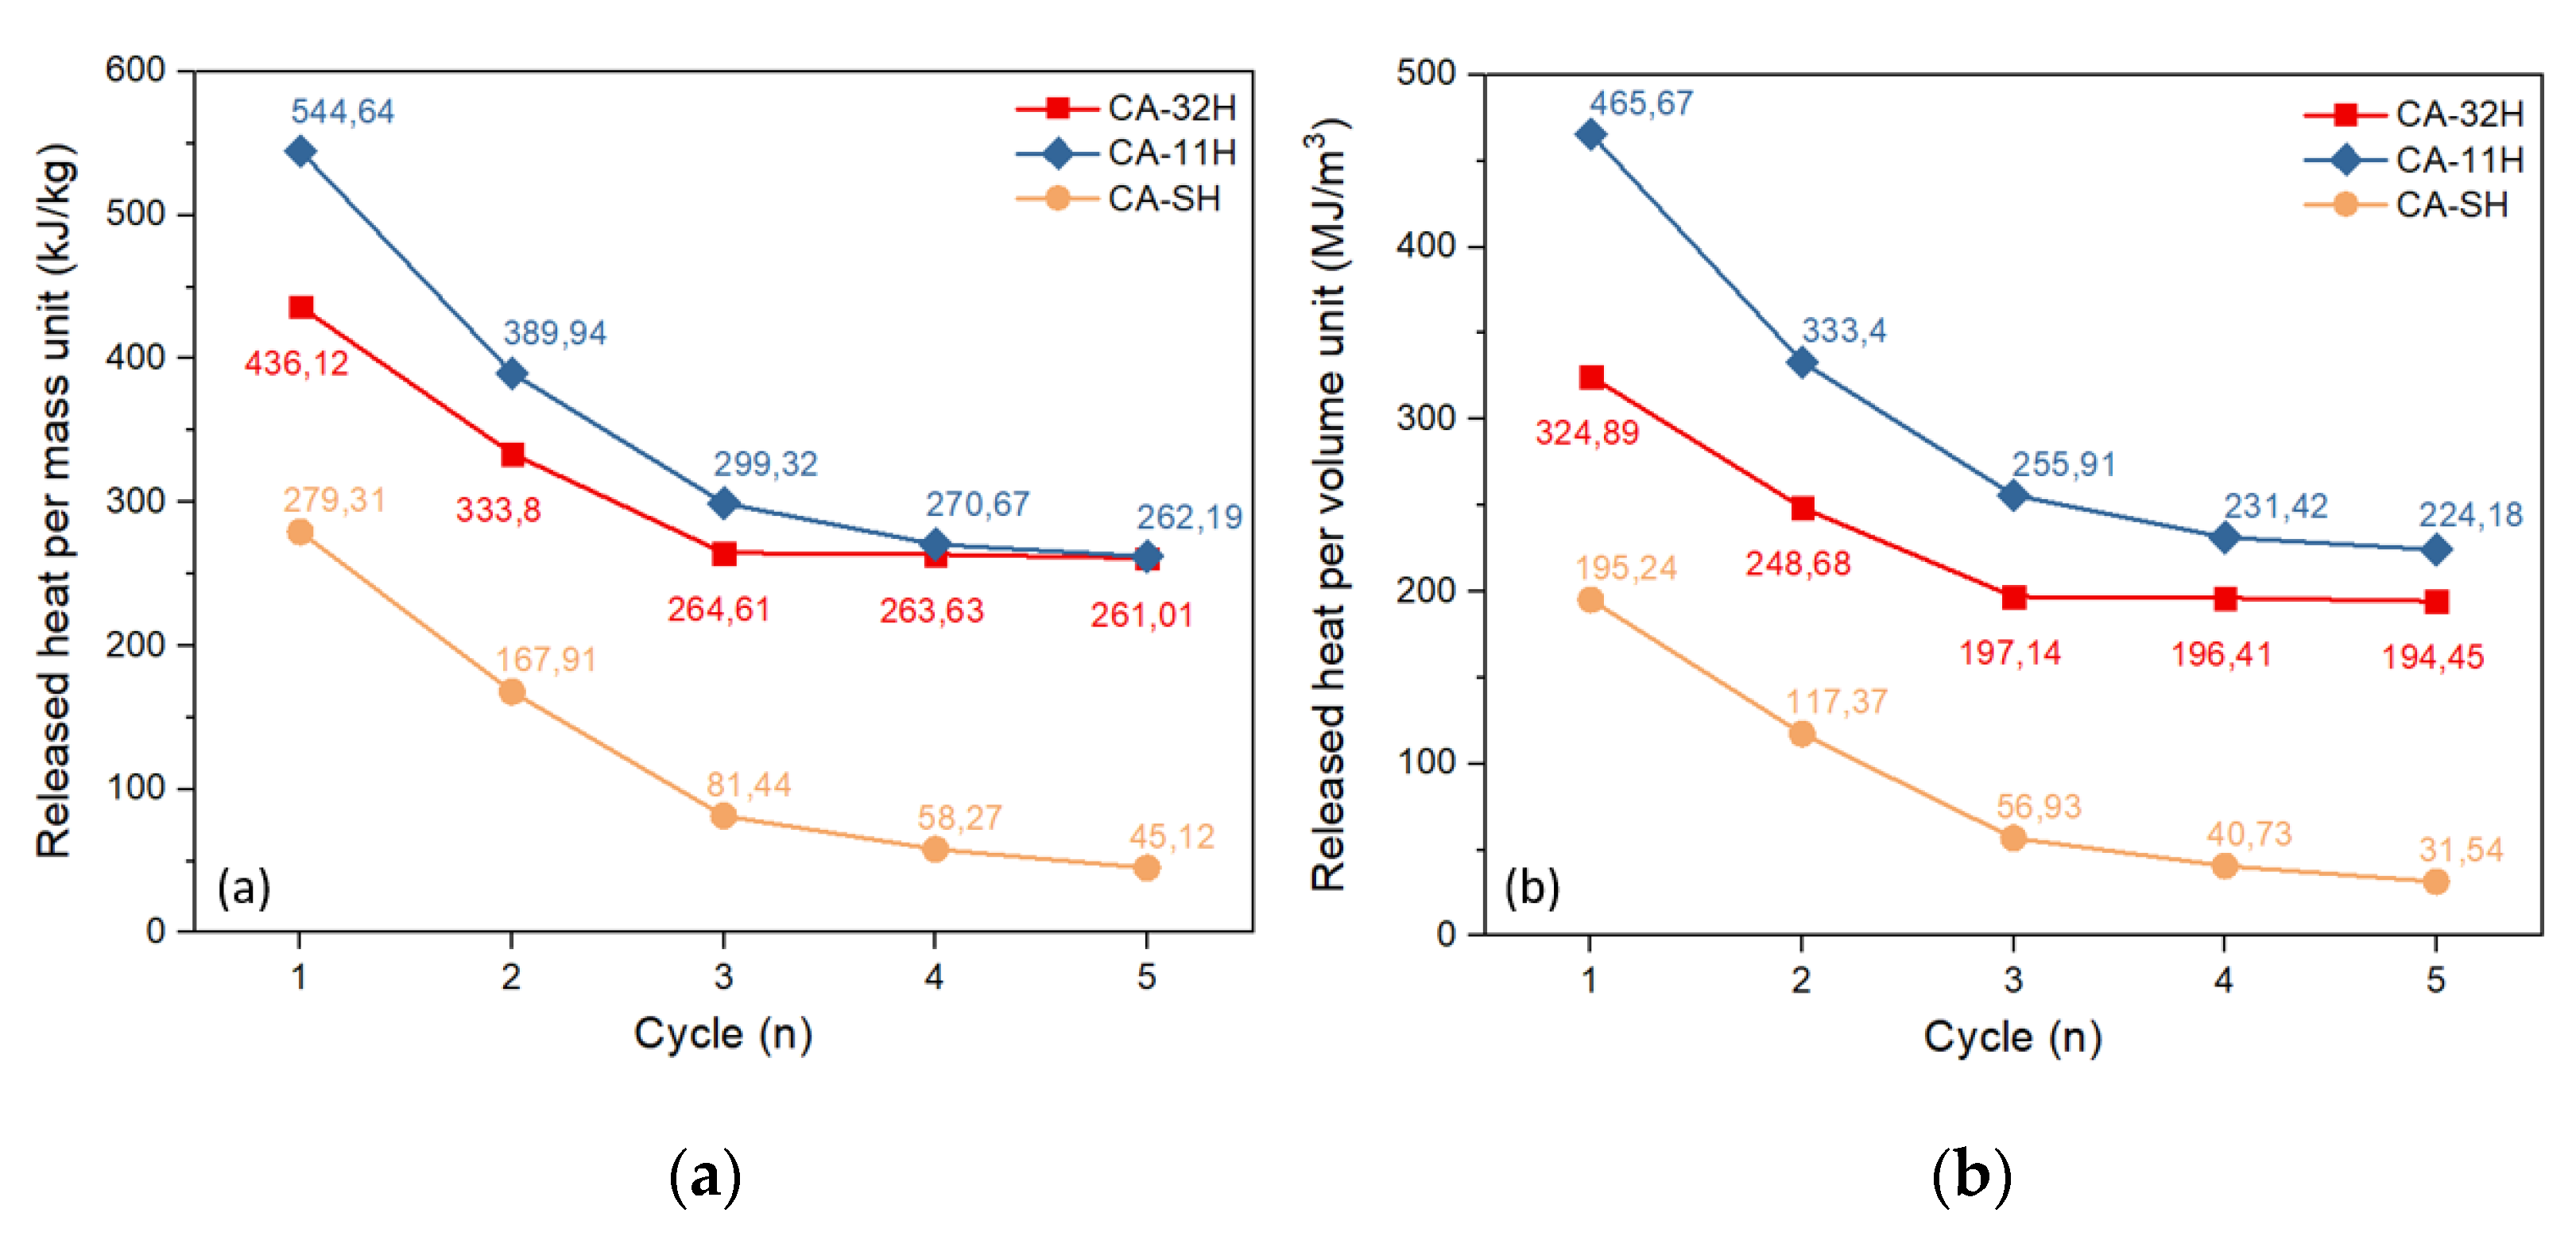
3.3. Dehydration/Hydration Stability

After structural and thermal characterization of as synthesized materials, cyclic TG experiments were carried out in order to assess the dehydration/hydration stability of all batches. Figure 8 shows the whole first thermogravimetric cycle for CA-11H/32H and CA-SH, and the highlighted sections 1–6 correspond to the analysis steps previously reported in Section 2.3.3 and listed in Table 3. The plot is useful to visually perceive how the material’s mass changes along each step, relating these transitions to the dehydration and hydration reactions.
Initially, a heating phase and subsequent sustainment of 250 °C were applied (steps 1 and 2). As shown, this temperature allowed the materials to be dehydrated in a relatively short time. In fact, already at about 200–220 °C the material began to undergo a partial dehydration, which was completed when the temperature plateau is reached. The time that lapsed between the achievement of the onset temperature and the end of the process (identified as weight loss stabilization) was around 40 min. The dehydration results at equilibrium were compatible to TGA ones. This means that the chosen operating temperature was adequate to obtain a complete reaction conversion of the materials into their respective dehydrated forms. Step 3 and 4 are necessary after the dehydration reaction to decrease and stabilize the system at the target hydration temperature (125 °C) before the atmosphere shift. Hydration kinetics on co-precipitated batches was faster; the mass suddenly increased when the water vapor was supplied (5), reaching a plateau after 35–40 min. CA-32H exhibited a slightly higher hydration rate and, at the same time, a more marked slope variation. In contrast, CA-11H exhibited a larger yield at the end of the hydration process. However, both co-precipitated batches exhibited a comparable hydration trend. This behavior could be related to their similar composition (katoite, mostly) and morphology (different sized hexagonal plates). CA-SH had a different hydration kinetic; the mass gain associated to the hydration reaction was more gradual, if compared to the other two batches. This behavior could be related to its structural heterogeneity that kinetically limited the hydration processes. The release of physisorbed water (6) occurred when the water vapor supply was over and led to a small weight loss for all the materials; hence, it was deducted that just a limited portion of adsorbed water was not chemically bonded. However, to estimate the effective yield of the hydration reaction, this surplus of mass was not calculated, since the surface interaction with physisorbed water clearly had a weaker energy than a chemisorption. Hence, to avoid an overestimation of the released heat, the real hydration conversion in mass was calculated as the difference between the mass at the end of Section 6 and the beginning of Section 5. Additionally, in Section 6, the cycle drift is evidenced (double pointed arrow). It shows a less hydration yield than the previous dehydration, which led to an efficiency loss throughout the cycle. This aspect therefore involved an evaluation of the behavior in subsequent cycles. Table 5 lists the conversion values for each dehydration and hydration step, related to a five-cycle experiment. The reported data are expressed by means of Rd/h (%), which is the normalized conversion obtained by Equation (7):
R d / h ( % )   = Δ m d / h Δ m 1 ° d · 100
where d and h refer to the dehydration and hydration steps, respectively. The term Δm refers to the mass variation at the end of the considered process, while Δmd is the mass variation relative to the first dehydration, which is supposed to correspond to a 100% yield.
Normalized conversions represent the most proper method to compare how the materials work along the cycling, taking into account their different katoite content. The previously described cycle drift could be numerically evaluated by observing the hydration yields: co-precipitated presented a similar Rh1° (66.5% and 67.49% for CA-32H and CA-11H, respectively), while the solid–solid one was moderately lower (52.68%) at the first cycle. This effect, however, became less enhanced cycle by cycle. Figure 9 graphically shows the cycle drift reduction, where the single normalized dehydrations and hydrations are plotted for each material. CA-32H (a) reached comparable conversions from the end of the third cycle, corresponding to a Rh around 40%. Similar conversions were also appreciable for CA-11H at the end of the last two cycles, around a Rh of 33%. The solid–solid sample, on the contrary, did not reach a stable conversion throughout the experiment, and its conversion at the end of the fifth cycle was much lower than the other two materials (8.51%). The progressive decrease suggests that the material may have become totally deactivated in the subsequent cycles. The nonpurity of the CA-SH sample had, therefore, a detrimental effect on the thermal stability of the hydration process. Still in Figure 9, it should be noted that the hydration kinetic of the second cycle undergoes a clear change with respect to the first cycle but then remains similar for the following ones.
An explanation could be related to a structural change that occurred during the first cycle, which involved rearrangements that persisted until a condition of stability was achieved. The number of cycles required to achieve a structural stabilization depended on the kind of material and the conditions applied during cycling. The structural change that the materials gradually underwent was coupled with a reduction of the dehydration onset temperature, Tonset, which was observable after the first cycle (Table 5). This temperature was found to be settled at an almost constant value from the third cycle for the co-precipitated batches (around 230 °C), simultaneously with an occurring conversion stabilization, as described before. For CA-SH, contrarily, the onset temperature was still decreasing at the fifth cycle. In order to figure out the heat efficiency of the materials, the amount of released heat per mass unit (Qrel,m) and volume unit (Qrel,V), referred to by the single cycle (n), was calculated by Equations (8) and (9):
Q r e l , m ( n ) = Q D S C · R % ; h ( n ) 100
Q r e l , V ( n ) = Q r e l , m ( n ) · ρ
where QDSC is the previously determined dehydration heat by calorimetric analysis, R%;h(n) is the normalized hydration conversion referred to by the n cycle and ρ is the experimentally determined bulk density for the hydrated materials, corresponding to 745 kg/m3 for CA-32H, 854 kg/m3 for CA-11H and 699 kg/m3 for CA-SH. Figure 10 shows the released heat per mass unit (a) and volume unit (b) as a function of the cycle number (n).
What can be observed in Figure 10a is that CA-11H underwent a notable performance drop during the five cycles, which brought the material to exchange a quantity of heat numerically comparable with the CA-32H one. Furthermore, the trend of CA-11H material suggested that a further small loss in efficiency could be potentially observed in the following cycles. CA-32H, on the other hand, underwent a more moderate performance drop that was greatly softened in the third cycle. In fact, the curve trend between the third and fifth cycles reached an almost constant value. Hence, we expected a stabilization for the following cycles as well. CA-SH showed a progressive decreasing of exchanged heat, reaching the value of 45.12 kJ/kg. Similar considerations regarding the co-precipitated materials can be argued from Figure 10b; however, there is a remarkable difference due to the higher density of CA-11H, which ensures a greater efficiency, despite the lower reaction yield. The materials were structurally and morphologically characterized again by XRD and SEM after cyclic experiment. In Figure 11, the diffraction patterns of the materials are shown. CA-32H, which exhibited the highest conversion and the highest tendency to stabilize (Table 5), showed a similar diffraction pattern to that of the initial material, where katoite, Ca3Al2O6·6H2O, and calcium hydroxide, Ca(OH)2, were recognizable. No additional phases were identified. In CA-11H, originally composed almost exclusively by katoite (98.6%) and still identifiable after five cycles, showed the further presence of characteristic peaks of mayenite, Ca12Al14O33, and calcium hydroxide. This can be justified, considering that katoite suffered a partial decomposition, which was reasonably associated to the formation of mayenite aggregates and the consequent release of calcium oxide, subsequently converted in calcium hydroxide by the water vapor atmosphere. A possible reaction scheme could be (Equations (10) and (11)):
Under heating:
7Ca3Al2O6·6H2O(s)→Ca12Al14O33(s) + 9CaO(s) + 42H2O(g)
Under water vapor supply:
CaO(s) + H2O(g)→Ca(OH)2(s)
Moreover, broadening and less intensity of the peaks, in comparison to the starting materials, indicate a less crystallinity.
CA-SH, characterized by the lowest conversion value, still exhibited typical katoite peaks, although less intense. Similarly to CA-11H, mayenite peaks were visible as a consequence of katoite decomposition. The main crystalline phase was alumina, Al2O3, which prevented the process reversibility. In fact, the high stability of the aluminum oxide inhibited its rehydration step. Calcium oxide, which was present in the initial material, had not been identified anymore; it is very likely that the contact with atmospheric carbon dioxide led to a total conversion of the latter into calcium carbonate (Equation (12)), CaCO3, already detected on the pristine material.
CaO(s) + CO2 (g)→CaCO3(s)
The aluminum hydroxide phase, previously detected in CA-SH sample, was no longer observable because of the decomposition during the cycles; in fact, as mentioned above, boehmite (AlO(OH)) was formed, and subsequently, it is possible to reason that this phase was slowly converted into alumina. This suggestion is also supported by the slow hydration kinetic, which aluminum oxides and oxides hydroxides present [40]. SEM images shown in Figure 12 (magnification = 100 k) lead to further considerations regarding the investigated materials. Comparing samples’ morphologies before (Figure 6) and after (Figure 11) cycling, some differences were observable. In particular, CA-32H was characterized by rounded nanoparticles around 100–200 nm (calcium hydroxide), homogeneously distributed, covering hexagonal plates (katoite). In contrast, CA-11H was characterized by nanoparticles, probably mayenite and calcium hydroxide (red arrows), deposited on coalesced hexagonal plates of katoite (black arrows). Again, the smaller particle size after five cycles could be related to the less crystallinity evidenced in Figure 10. CA-SH still showed less uniformity. Large particles were predominantly observed (white arrows) and different structures, as confirmed by XRD analysis (Figure 11), were present.
The detected morphological and structural materials’ modifications can address the different behavior of the two co-precipitated materials. The absence of decomposition processes of katoite phase in CA-32H could be related to the presence of calcium hydroxide impurities: this phase could play a fundamental role in terms of surface basicity by promoting a better thermodynamic stability of katoite, avoiding the formation of mayenite, as described in Equation (11) for CA-11H and CA-SH, thus guaranteeing a larger conversion. At the same time, it is reasonable to assume that the surface basicity imposed by calcium hydroxide is also responsible for the stabilization observed for CA-11H (in which calcium hydroxide is formed during the cycling), and the difference in percentage conversion is due to the formation of mayenite in this second case, which involves a loss of the active portion of the material.

4. Conclusions

The highlights of this work can be summarized as follows:
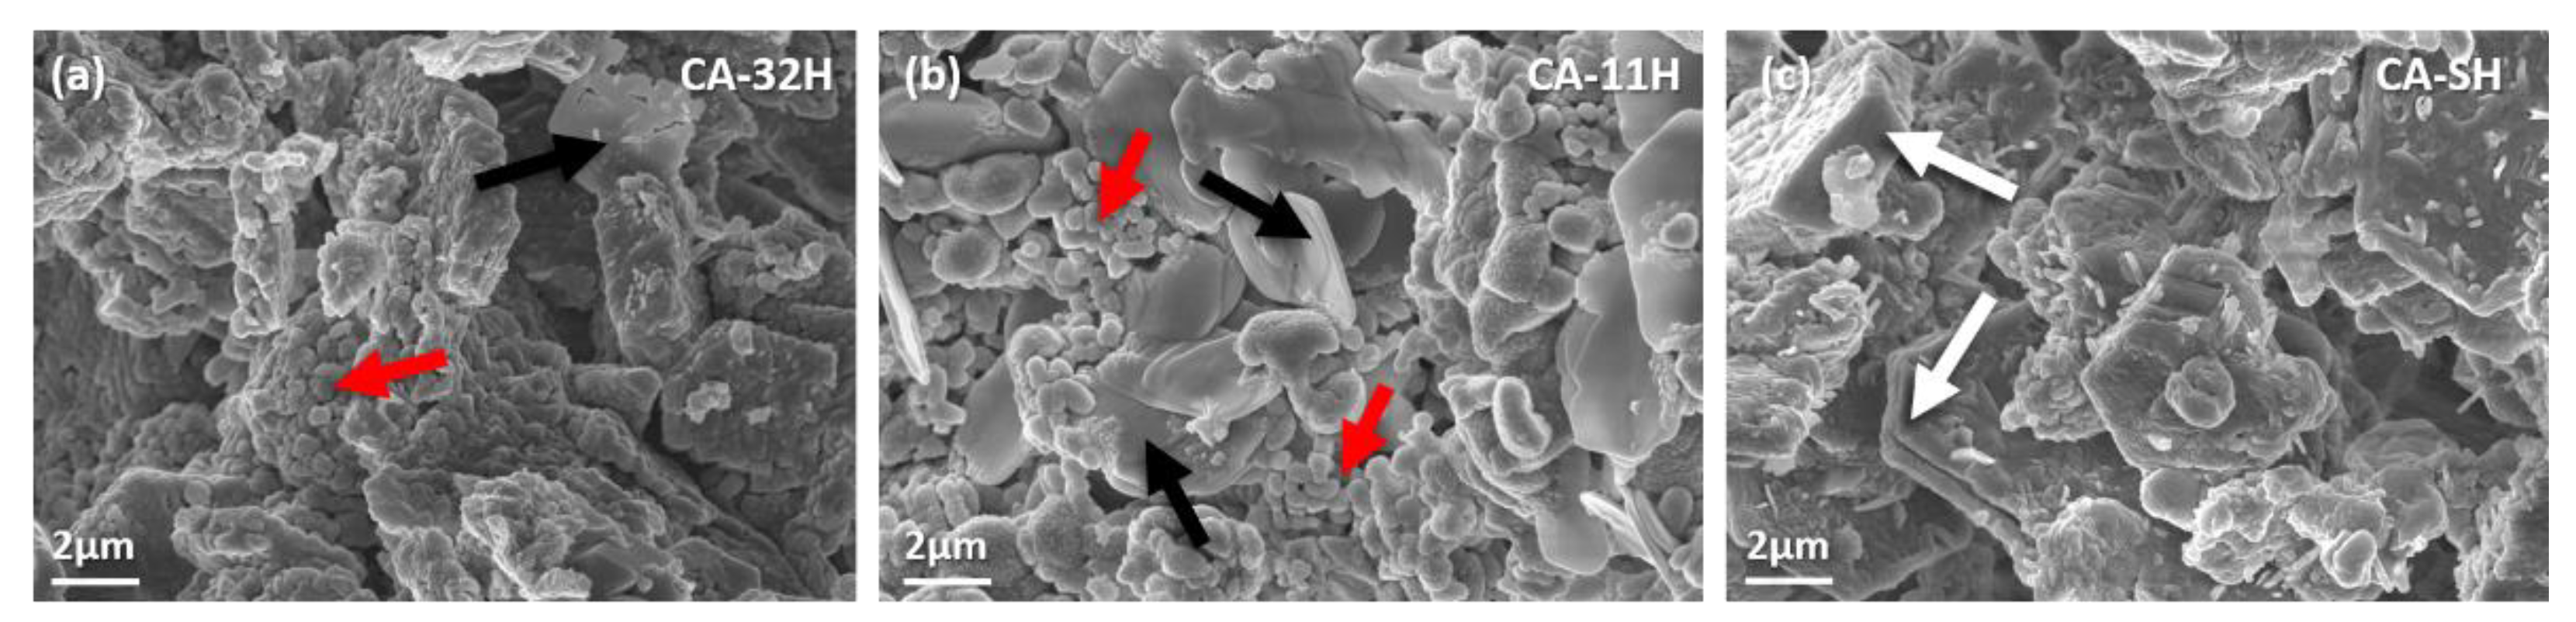
  • Co-precipitation and solid–solid methods have been studied and compared as possible strategies to obtain low-cost tricalcium aluminate hexahydrate materials. The solid–solid reaction pointed out that it is not possible to obtain a material with appropriate thermochemical features without passing through a preliminary synthetic route that leads to a better chemical interaction between Ca2+ and Al3+.
  • The structural and thermochemical characterization showed higher katoite content (98.6%) if a 1:1 Ca/Al ratio was initially used in co-precipitation, which also involves a greater heat of dehydration (807.0 kJ/kg), compared to the other products.
  • The study on dehydration/hydration cycled materials evinced that the initial samples underwent a structural change during the cycles. As a consequence, a decrease in conversion yields and, therefore, in stored–released heat, is observed, with respect to the starting materials.
  • Calcium hydroxide appears to be important on the stabilization of the material, partially preventing decomposition phenomena.
  • Once a cycle stability is reached, the amount of stored/released heat per mass unit is similar for both co-precipitated products (about 260 kJ/kg of hydrated material), while in terms of storage density, CA-11H exhibits the highest capacity (224.2 MJ/m3).
In future development, further studies will aim to enhance the obtained promising results. Cyclic stability will be investigated and improved in order to make this low-cost and nontoxic material a worthy competitor to current thermochemical energy storage systems.

Author Contributions

Conceptualization: C.M., methodology: L.C. and E.P., validation: F.A., E.P. and L.C., formal analysis: F.A., E.L.M. and M.L.; investigation: F.A. and E.L.M.; data curation: F.A., L.C. and E.P.; writing original draft: F.A.; writing review: F.A., L.C. and E.P.; supervision: C.M. All authors have read and agreed to the published version of the manuscript.

Funding

This research received no external funding.

Institutional Review Board Statement

Not applicable.

Informed Consent Statement

Not applicable.

Data Availability Statement

The data presented in this study are available within the article.

Acknowledgments

This study was conducted as part of the project, “Thermochemical materials for heat storage: development and characterization,” sponsored by INSTM (Consorzio Interuniversitario Nazionale per la Scienza e Tecnologia dei Materiali), within the IEA SHC Task 58 “Material and Component Development for Thermal Energy Storage.” Authors thank Emanuela Mastronardo for helpful discussion.

Conflicts of Interest

The authors declare no conflict of interest.

References

  1. Haddad, C.; Périlhon, C.; Danlos, A.; François, M.X.; Descombes, G. Some efficient solutions to recover low and medium waste heat: Competitiveness of the thermoacoustic technology. Energy Procedia 2014, 50, 1056–1069. [Google Scholar] [CrossRef]
  2. Liu, J.; Chang, Z.; Wang, L.; Xu, J.; Kuang, R.; Wu, Z. Exploration of Basalt Glasses as High-Temperature Sensible Heat Storage Materials. ACS Omega 2020, 5, 19236–19246. [Google Scholar] [CrossRef]
  3. McGillicuddy, R.D.; Thapa, S.; Wenny, M.B.; Gonzalez, M.I.; Mason, J.A. Metal-organic phase-change materials for thermal energy storage. J. Am. Chem. Soc. 2020, 142, 19170–19180. [Google Scholar] [CrossRef]
  4. Cabeza, L.F.; Martorell, I.; Miró, L.; Fernández, A.I.; Barreneche, C. Introduction to Thermal Energy Storage (TES) Systems; Woodhead Publishing Limited: Cambridge, UK, 2015; ISBN 9781782420965. [Google Scholar]
  5. Henninger, S.K.; Jeremias, F.; Kummer, H.; Schossig, P.; Henning, H.M. Novel sorption materials for solar heating and cooling. Energy Procedia 2012, 30, 279–288. [Google Scholar] [CrossRef]
  6. Cabeza, L.F.; Solé, A.; Barreneche, C. Review on sorption materials and technologies for heat pumps and thermal energy storage. Renew. Energy 2017, 110, 3–39. [Google Scholar] [CrossRef] [Green Version]
  7. Alva, G.; Lin, Y.; Fang, G. An overview of thermal energy storage systems. Energy 2018, 144, 341–378. [Google Scholar] [CrossRef]
  8. Linder, M. Using Thermochemical Reactions in Thermal Energy Storage Systems; Woodhead Publishing Limited: Cambridge, UK, 2014; ISBN 9781782420965. [Google Scholar]
  9. Sunku Prasad, J.; Muthukumar, P.; Desai, F.; Basu, D.N.; Rahman, M.M. A critical review of high-temperature reversible thermochemical energy storage systems. Appl. Energy 2019, 254, 113733. [Google Scholar] [CrossRef]
  10. Chan, C.W.; Ling-Chin, J.; Roskilly, A.P. A review of chemical heat pumps, thermodynamic cycles and thermal energy storage technologies for low grade heat utilisation. Appl. Therm. Eng. 2013, 53, 160–176. [Google Scholar] [CrossRef]
  11. Neveu, P.; Castaing, J. Solid-gas chemical heat pumps: Field of application and performance of the internal heat of reaction recovery process. Heat Recover. Syst. CHP 1993, 13, 233–251. [Google Scholar] [CrossRef]
  12. Cot-Gores, J.; Castell, A.; Cabeza, L.F. Thermochemical energy storage and conversion: A-state-of-the-art review of the experimental research under practical conditions. Renew. Sustain. Energy Rev. 2012, 16, 5207–5224. [Google Scholar] [CrossRef]
  13. Albrecht, K.J.; Jackson, G.S.; Braun, R.J. Thermodynamically consistent modeling of redox-stable perovskite oxides for thermochemical energy conversion and storage. Appl. Energy 2016, 165, 285–296. [Google Scholar] [CrossRef] [Green Version]
  14. Huo, J.; Ge, R.; Liu, Y.; Guo, J.; Lu, L.; Chen, W.; Liu, C.; Gao, H.; Liu, H. Recent advances of two-dimensional molybdenum disulfide based materials: Synthesis, modification and applications in energy conversion and storage. Sustain. Mater. Technol. 2020, 24. [Google Scholar] [CrossRef]
  15. Zhao, R.; Cui, D.; Dai, J.; Xiang, J.; Wu, F. Morphology controllable NiCo2O4 nanostructure for excellent energy storage device and overall water splitting. Sustain. Mater. Technol. 2020, 24, e00151. [Google Scholar] [CrossRef]
  16. André, L.; Abanades, S.; Cassayre, L. Experimental Investigation of Co-Cu, Mn-Co, and Mn-Cu Redox Materials Applied to Solar Thermochemical Energy Storage. ACS Appl. Energy Mater. 2018, 1, 3385–3395. [Google Scholar] [CrossRef]
  17. Gravogl, G.; Knoll, C.; Artner, W.; Welch, J.M.; Eitenberger, E.; Friedbacher, G.; Harasek, M.; Hradil, K.; Werner, A.; Weinberger, P.; et al. Pressure effects on the carbonation of MeO (Me = Co, Mn, Pb, Zn) for thermochemical energy storage. Appl. Energy 2019, 252, 113451. [Google Scholar] [CrossRef]
  18. André, L.; Abanades, S.; Flamant, G. Screening of thermochemical systems based on solid-gas reversible reactions for high temperature solar thermal energy storage. Renew. Sustain. Energy Rev. 2016, 64, 703–715. [Google Scholar] [CrossRef]
  19. Mastronardo, E.; Bonaccorsi, L.; Kato, Y.; Piperopoulos, E.; Milone, C. Efficiency improvement of heat storage materials for MgO/H2O/Mg(OH)2 chemical heat pumps. Appl. Energy 2016, 162, 31–39. [Google Scholar] [CrossRef]
  20. Kato, Y.; Takahashi, R.; Sekiguchi, T.; Ryu, J. Study on medium-temperature chemical heat storage using mixed hydroxides. Int. J. Refrig. 2009, 32, 661–666. [Google Scholar] [CrossRef]
  21. Sakellariou, K.G.; Karagiannakis, G.; Criado, Y.A.; Konstandopoulos, A.G. Calcium oxide based materials for thermochemical heat storage in concentrated solar power plants. Sol. Energy 2015, 122, 215–230. [Google Scholar] [CrossRef]
  22. Sánchez Jiménez, P.E.; Perejón, A.; Benítez Guerrero, M.; Valverde, J.M.; Ortiz, C.; Pérez Maqueda, L.A. High-performance and low-cost macroporous calcium oxide based materials for thermochemical energy storage in concentrated solar power plants. Appl. Energy 2019, 235, 543–552. [Google Scholar] [CrossRef]
  23. Álvarez Criado, Y.; Alonso, M.; Abanades, J.C. Composite Material for Thermochemical Energy Storage Using CaO/Ca(OH)2. Ind. Eng. Chem. Res. 2015, 54, 9314–9327. [Google Scholar] [CrossRef] [Green Version]
  24. Shkatulov, A.; Krieger, T.; Zaikovskii, V.; Chesalov, Y.; Aristov, Y. Doping magnesium hydroxide with sodium nitrate: A new approach to tune the dehydration reactivity of heat-storage materials. ACS Appl. Mater. Interfaces 2014, 6, 19966–19977. [Google Scholar] [CrossRef]
  25. Wang, X.; Chen, H.; Xu, Y.; Wang, L.; Hu, S. Advances and prospects in thermal energy storage: A critical review. Kexue Tongbao Chin. Sci. Bull. 2017, 62, 1602–1610. [Google Scholar] [CrossRef]
  26. Scrivener, K.L.; Capmas, A. Calcium Aluminate Cements. Lea’s Chem. Cem. Concr. 2003, 713–782. [Google Scholar] [CrossRef]
  27. Kapeluszna, E.; Kotwica, Ł.; Pichór, W.; Nocuń-Wczelik, W. Cement-based composites with waste expanded perlite—Structure, mechanical properties and durability in chloride and sulphate environments. Sustain. Mater. Technol. 2020, 24. [Google Scholar] [CrossRef]
  28. Liiv, J.; Teppand, T.; Rikmann, E.; Tenno, T. Novel ecosustainable peat and oil shale ash-based 3D-printable composite material. Sustain. Mater. Technol. 2018, 17, e00067. [Google Scholar] [CrossRef]
  29. Geiger, C.A.; Dachs, E.; Benisek, A. Thermodynamic behavior and properties of katoite ( hydrogrossular ): A calorimetric study. Am. Mineral. 2012, 97, 1252–1255. [Google Scholar] [CrossRef]
  30. Stein, H.N. Thermodynamic considerations on the hydration mechanisms of Ca3SiO5 and Ca3Al2O6. Cem. Concr. Res. 1972, 2, 167–177. [Google Scholar] [CrossRef]
  31. Lacivita, V.; Mahmoud, A.; Arco, P.D.; Mustapha, S. Hydrogrossular, Ca3Al2(SiO4)3–x(H4O4)x: An ab initio investigation of its structural and energetic properties. Am. Mineral. 2015, 100, 2637–2649. [Google Scholar] [CrossRef] [Green Version]
  32. Cavenett The Dehydration of Tricalcium aluminate exahydrate. J. Chem. Inf. Model. 1941, 19, 1689–1699. [CrossRef]
  33. Ball, M.C.; Ladner, N.G.; Taylor, J.A. The dehydroxylation of tricalcium aluminate 6-hydrate. Thermochim. Acta 1976, 17, 207–215. [Google Scholar] [CrossRef]
  34. Rivas-Mercury, J.M.; Pena, P.; de Aza, A.H.; Turrillas, X. Dehydration of Ca3Al2(SiO4)y(OH)4(3−y) (0 < y < 0.176) studied by neutron thermodiffractometry J.M. J. Eur. Ceram. Soc. 2008, 28, 1737–1748. [Google Scholar] [CrossRef]
  35. Antonovič, V.; Keriene, J.; Boris, R.; Aleknevičius, M. The effect of temperature on the formation of the hydrated calcium aluminate cement structure. Procedia Eng. 2013, 57, 99–106. [Google Scholar] [CrossRef] [Green Version]
  36. Ukrainczyk, N.; Matusinović, T. Thermal properties of hydrating calcium aluminate cement pastes. Cem. Concr. Res. 2010, 40, 128–136. [Google Scholar] [CrossRef]
  37. Mohamed, B.M.; Sharp, J.H. Kinetics and mechanism of formation of tricalcium aluminate, Ca3Al2O6. Thermochim. Acta 2002, 388, 105–114. [Google Scholar] [CrossRef]
  38. Hem, J.D.; Roberson, C.E. Form and Stability of Aluminum Hydroxide Complexes in Dilute Solution. USGS Water Supply Pap. 1967, 1827-A, 55. [Google Scholar] [CrossRef]
  39. Whittington, B.I.; Fallows, T.M.; Willing, M.J. Tricalcium aluminate hexahydrate (TCA) filter aid in the Bayer industry: Factors affecting TCA preparation and morphology. Int. J. Miner. Process. 1997, 49, 1–29. [Google Scholar] [CrossRef]
  40. Wefers, K.; Misra, C. Oxides and Hydroxides of Aluminum. Alcoa Tech. Pap. 1987, 19, 100. [Google Scholar]
Figure 1. Co-precipitation method flowchart.
Applsci 11 01958 g001
Figure 2. Schematized hydration procedure sequences.
Applsci 11 01958 g002
Figure 3. CA-11 diffraction patterns after 2 h calcination under static air at 500 °C, 700 °C, 900 °C and 1100 °C. (JCPDS reference cards: CaAl2O4: 01-0888; Ca12Al14O33: 09-0413; Ca3Al2O6: 38-1429; CaO: 70-4068; CaCO3: 83-1762/19-3758; AlO(OH): 78-4581).
Applsci 11 01958 g003
Figure 4. Diffraction patterns after calcination (a) and after hydration (b) for CA-32/CA-32H (red), CA-11/CA-11H (blue) and CA-S/CA-SH (orange). (JCPDS reference cards: Ca3Al2O6: 38-1429; CaO: 70-4068; Ca12Al14O33: 09-0413; Al2O3: 34-0440; Ca3Al2O6·6H2O: 24-0217; Al(OH)3: 33-0018; Ca(OH)2: 44-1481; CaCO3: 83-1762).
Applsci 11 01958 g004
Figure 5. Scanning electron microscopy (SEM) images at magnification = 100 k of calcined products CA-32 (a), CA-11 (b) and CA-S (c).
Applsci 11 01958 g005
Figure 6. SEM images at magnification = 100 k and punctual energy dispersive X-ray analysis (EDX) estimated Ca/Al molar ratios of hydrated products CA-32H (a), CA-11H (b) and CA-SH (c).
Applsci 11 01958 g006
Figure 7. CA-32H (red), CA-11H (blue) and CA-SH (orange) thermogravimetric (TG) (a) and differential scanning calorimetry (DSC) (b) curves, recorded between 150 °C and 375 °C, scan rate 10 °C/min.
Applsci 11 01958 g007
Figure 8. First dehydration/hydration cycle for CA-32H (red), CA-11H (blue) and CA-SH (orange).
Applsci 11 01958 g008
Figure 9. The 1st, 2nd, 3rd, 4th and 5th normalized dehydration/hydration curves for CA-32H (red), CA-11H (blue) and CA-SH (orange).
Applsci 11 01958 g009
Figure 10. Released heat per mass unit (a) and volume unit (b) per cycle.
Applsci 11 01958 g010
Figure 11. Diffraction pattern after the five-cycle experiment for CA-32H (red), CA-11H (blue) and CA-SH (orange). (JCPDS reference cards: Ca3Al2O6·6H2O: 24-0217; Ca12Al14O33: 09-0413; Ca(OH)2: 44-1481; Al2O3: 04-2852; CaCO3: 12-0489).
Applsci 11 01958 g011
Figure 12. SEM images, magnification = 100 k, for CA-32H (a), CA-11H (b) and CA-SH (c) after five dehydration-hydration cycles.
Applsci 11 01958 g012
Table 1. Sample code and preparation method.
Sample CodenCa (mmol)nAl (mmol)MethodCa/Al Molar Ratio
CA-S1510Solid–solid3:2
CA-111010Co-precipitation1:1
CA-321510Co-precipitation3:2
Table 2. Most-formed calcium aluminates in dependence on the hydration temperature.
Hydration Temperature (°C)Main Formed Phase(s)Ref.
<15CaAl2O4·10H2O[36]
15–27CaAl2O4·10H2O/Ca2Al2O5·8H2O[36]
27–70Ca2Al2O5·8H2O/Ca3Al2O6·6H2O[36]
>70Ca3Al2O6·6H2O[15]
Table 3. Schematization of a single thermogravimetric cycle.
Step n°Temperature (°C)AtmosphereMethodTime (Min)
1125→250N2Heating-
2250N2Isothermal120
3250→125N2Cooling-
4125N2Stabilization-
5125N2/H2OHydration120
6125N2Release of adsorbed water30
Table 4. Thermogravimetric analysis (TGA) and DSC characterization results.
Sample IDTonset (°C)Weight Loss (%)Heat (kJ/kg)Katoite (%)
CA-32H247.5−19.04655.888.9
CA-11H245.8−21.12807.098.6
CA-SH248.7−10.15530.2<46.9
Table 5. Thermogravimetric performances per cycle.
Sample IDCycleDehydration Tonset (°C)Rd (%)Rh (%)
CA-32H1241.510066.5
2231.167.650.9
3229.845.740.4
4230.240.440.2
5230.040.139.8
CA-11H1242.710067.5
2231.468.148.3
3229.447.637.1
4229.342.533.6
5229.633.332.5
CA-SH1241.010052.7
2233.251.031.7
3233.332.115.4
4231.712.211.0
5230.511.48.5
Publisher’s Note: MDPI stays neutral with regard to jurisdictional claims in published maps and institutional affiliations.

