
Facial Paralysis Detection on Images Using Key Point Analysis


Department of Electronics Engineering, Universidad de Guanajuato DICIS, Salamanca 36885, Mexico
*
Author to whom correspondence should be addressed.
†
These authors contributed equally to this work.
Appl. Sci. 2021, 11(5), 2435; https://0-doi-org.brum.beds.ac.uk/10.3390/app11052435
Submission received: 26 January 2021
/
Revised: 19 February 2021
/
Accepted: 5 March 2021
/
Published: 9 March 2021
(This article belongs to the Special Issue Computational Intelligence in Bioinformatics)
Abstract
:The inability to move the muscles of the face on one or both sides is known as facial paralysis, which may affect the ability of the patient to speak, blink, swallow saliva, eat, or communicate through natural facial expressions. The well-being of the patient could also be negatively affected. Computer-based systems as a means to detect facial paralysis are important in the development of standardized tools for medical assessment, treatment, and monitoring; additionally, they are expected to provide user-friendly tools for patient monitoring at home. In this work, a methodology to detect facial paralysis in a face photograph is proposed. A system consisting of three modules—facial landmark extraction, facial measure computation, and facial paralysis classification—was designed. Our facial measures aim to identify asymmetry levels within the face elements using facial landmarks, and a binary classifier based on a multi-layer perceptron approach provides an output label. The Weka suite was selected to design the classifier and implement the learning algorithm. Tests on publicly available databases reveal outstanding classification results on images, showing that our methodology that was used to design a binary classifier can be expanded to other databases with great results, even if the participants do not execute similar facial expressions.
1. Introduction
The face plays an important role in visual communication. By looking at the face, a person can automatically extract many nonverbal messages, such as the identity, intent, and emotion of others [1]. Facial paralysis is known as the inability to move the muscles of the face on one or both sides. This inability can result from nerve damage due to congenital conditions; trauma; or disease, such as stroke, brain tumor, or Bell’s palsy. The problem can affect one or both sides of the face, with the noticeable drooping of the features and problems with speaking, blinking, swallowing saliva, eating, or communicating through natural facial expressions. These physical signs of facial paralysis can provide information to the clinician concerning the state of the patient [2].
The process of detecting facial paralysis is important in assessing the severity of the facial nerve and muscle malfunction and in order to record physical improvements when treating and monitoring the patient. Computer-based automatic facial paralysis detection is important in developing standardized tools for medical assessment, treatment, and monitoring and to reduce healthcare costs through the inclusion of automatic processes [2]. Additionally, computer-based systems are expected to provide user-friendly tools, in the near future, for patient monitoring at home.
Particularly in the field of computer vision, the analysis of facial signs has motivated a lot of studies on automated facial nerve function assessment from the biomedical visual capture of the face. The visual capture of the face extends from traditional images and video to infrared (thermal imaging) and also depth images (stereo photogrammetry). A few methods based on the use of images perform a process for feature extraction that consists of detecting the face region in the image and later extracting key points (also known as facial landmarks) based on a specific model. There are some publicly available models, also known as shape predictors, that extract facial landmarks using Haar cascades. The 68 points predictor proposed by Matthews and Baker in [3] is widely known and employed in the field of facial analysis. In the literature, some authors create their own shape predictor to extract facial landmarks with a better performance of the task [4]. In a common approach, the extraction of facial landmarks is a crucial step, because these key points are used to compute other measures, such as the distances, angles, and areas between the landmarks. In the facial analysis process, those measures are fed into a classifier to train it and to detect facial nerve damage, and, later, its severity.
To achieve the automatic classification of facial nerve damage, it is necessary for a clinical practitioner to evaluate a set of facial images to label them as healthy or unhealthy faces. With annotated data, any classifier could be trained using the extracted facial measures and the labels to detect facial nerve damage in a new image. Although a variety of automated facial nerve function assessment solutions have been proposed, their outcomes fall into two main categories: (1) non-semantic numerical values quantifying static, dynamic, and synkinetic facial features; (2) semantic grade of facial nerve function designed by the clinician [5]. Most existing solutions belong to the first category; however, most of these solutions stay at the method discussion phase, and only a few of them have been implemented into prototypes—for example, the Emotrics software [6]. Solutions in the second category aim to quantify the facial nerve function according to a specific facial nerve grading scale designed by clinicians. To achieve this target, machine learning techniques should be applied to build a predictive model which is trained on labelled data and capable of making predictions on new data. Here, the data are facial images from either a healthy subject or a facial palsy patient, and the prediction is a binary decision (healthy or patient) or it could be the grade of facial nerve function. Classifiers for these applications are based on the methods of support vector machine (SVM), artificial neural network (ANN), k-nearest-neighbor (KNN), or hybrid classifier [5]. For a new subject, a typical system extracts computational features from the facial data then calls a pre-trained classifier to map the features to the facial nerve malfunction.
There are some works that use facial landmarks (i.e., facial key points extraction), before performing facial analysis [6,7,8]. There are other works that specifically intend to detect facial paralysis as a binary classification problem. Kim et al. proposed a smartphone-based automatic diagnosis system that consists of three modules: facial landmark detector, feature extractor based on facial regions, and a classifier [9]. Three facial movements were analyzed: resting, smiling, and raising the eyebrows. The system was evaluated on a private database with 23 facial palsy patients and 13 healthy volunteers. The authors reported their highest classification accuracy at 88.9%. Hsu et al. proposed a deep learning solution for the detection of facial palsy using a regular camera [10]. They formulated the facial palsy identification as an object detection problem and considered the deformation regions cause by facial palsy, or simply the palsy regions, on a patient’s face as the target objects. Their proposed solution is a hierarchical network composed of three components: face detection, facial landmark detection, and local palsy region detection. The authors reported a 93% of prediction accuracy in their private database. Barbosa et al. proposed a method to classify facial paralysis in two stages: the discrimination of healthy from unhealthy subjects, and then, facial palsy classification among unhealthy subjects [11]. They used four facial expressions (at rest, raising the eyebrows, screwing up the nose, and smiling) to measure symmetry. They built a classification model by combining a rule-based approach and a machine learning method (hybrid classifier). The authors reported an up to 98.12% sensitivity in the discrimination among healthy and unhealthy in their private database.
In this work, we aim to detect facial paralysis in a set of face images, meaning that we aim to identify if the subject is healthy or a patient (binary classification). In this methodology, the evaluation of the input image is performed independently of the facial movement executed by the patient, different from other works which use a set of facial gestures to compute symmetry variations between expressions, then they detect facial paralysis. Our system measures extracted facial landmarks using simple mathematical operations that keep the implementation uncomplicated but that are still effective. Our facial measures aim to detect the level of asymmetry between the two sides of the face and also characterize facial gestures so that the learning algorithm is able to relate each asymmetry level with the expression found in the image. The proposed measures extract information from the eyebrows, eyes, nose, and mouth; they are not divided by specific regions and do not have pre-marked zones, as other authors propose. Our classification approach is based on a multi-layer perceptron, which provides a label as an output.
The contributions of this research are: a set of facial measures, easily computed from facial landmarks, for the binary classification of facial paralysis independently of the facial movement performed by the subject; evaluation using two public image databases; and a classification model to detect facial paralysis. The remainder of the paper is organized as follows: Section 2 describes the proposed methodology, Section 3 introduces our findings and discussion, and finally Section 4 provides concluding remarks.
2. Methodology
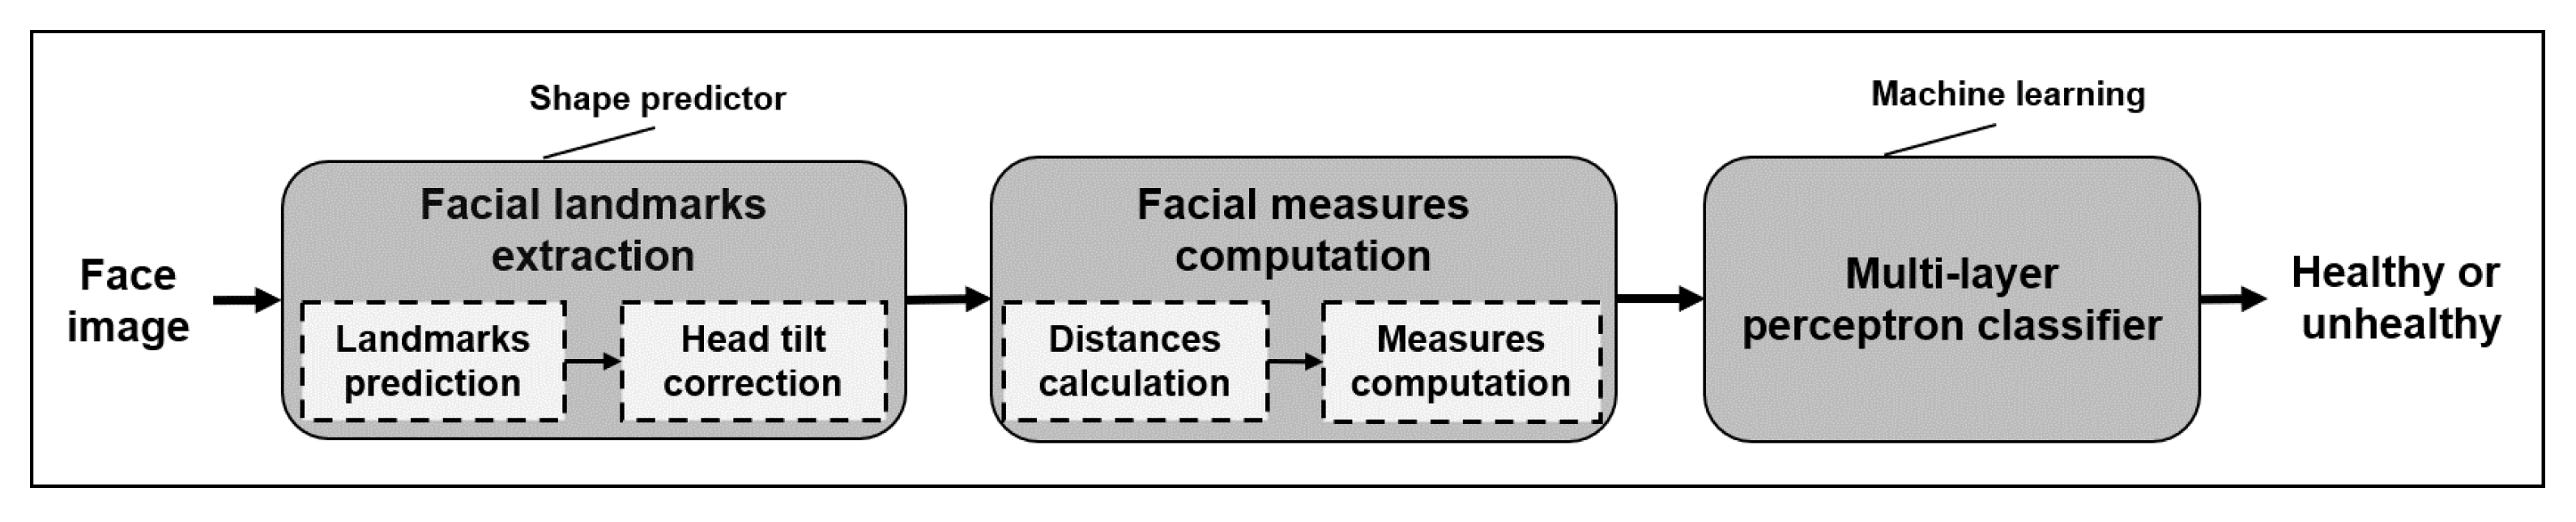
The framework of the proposed facial paralysis detection system is shown in Figure 1. As mentioned before, a typical system starts with the extraction of facial landmarks. However, it has been established by other authors that the available facial models are not suited to analyze subjects suffering from facial impairments [9,11,12]. Therefore, we took advantage of the 68 key points shape predictor developed by Guarin et al. and presented in [12]. Their model, called the MEEshape predictor, is publicly available for testing and comparison. A better performance in predicting facial landmarks in patients’ photographs was observed in preliminary experiments using the MEE shape predictor. This was especially so if comparing the results with two of the available OpenCV implementations [13]: the LBF model [14] or the Kazemi model [15].
2.1. Facial Landmarks Extraction
The process to extract facial landmarks from a face within an input image, preferably a frontal face photograph, is based on the method and model proposed by Guarin et al. in [12]. The full facial landmarks extraction process follows as:
- Convert the color input image to gray scale.
- Resize the gray image using an scale factor () of , where and . W and H refer to the size of the input image (width and height, respectively).
- Detect the face on the resized image using the publicly available dlib libraries.
- Re-scale the detected face area using .
- Predict the facial landmarks on the re-scaled face area.
- Store the extracted data for future data processing.
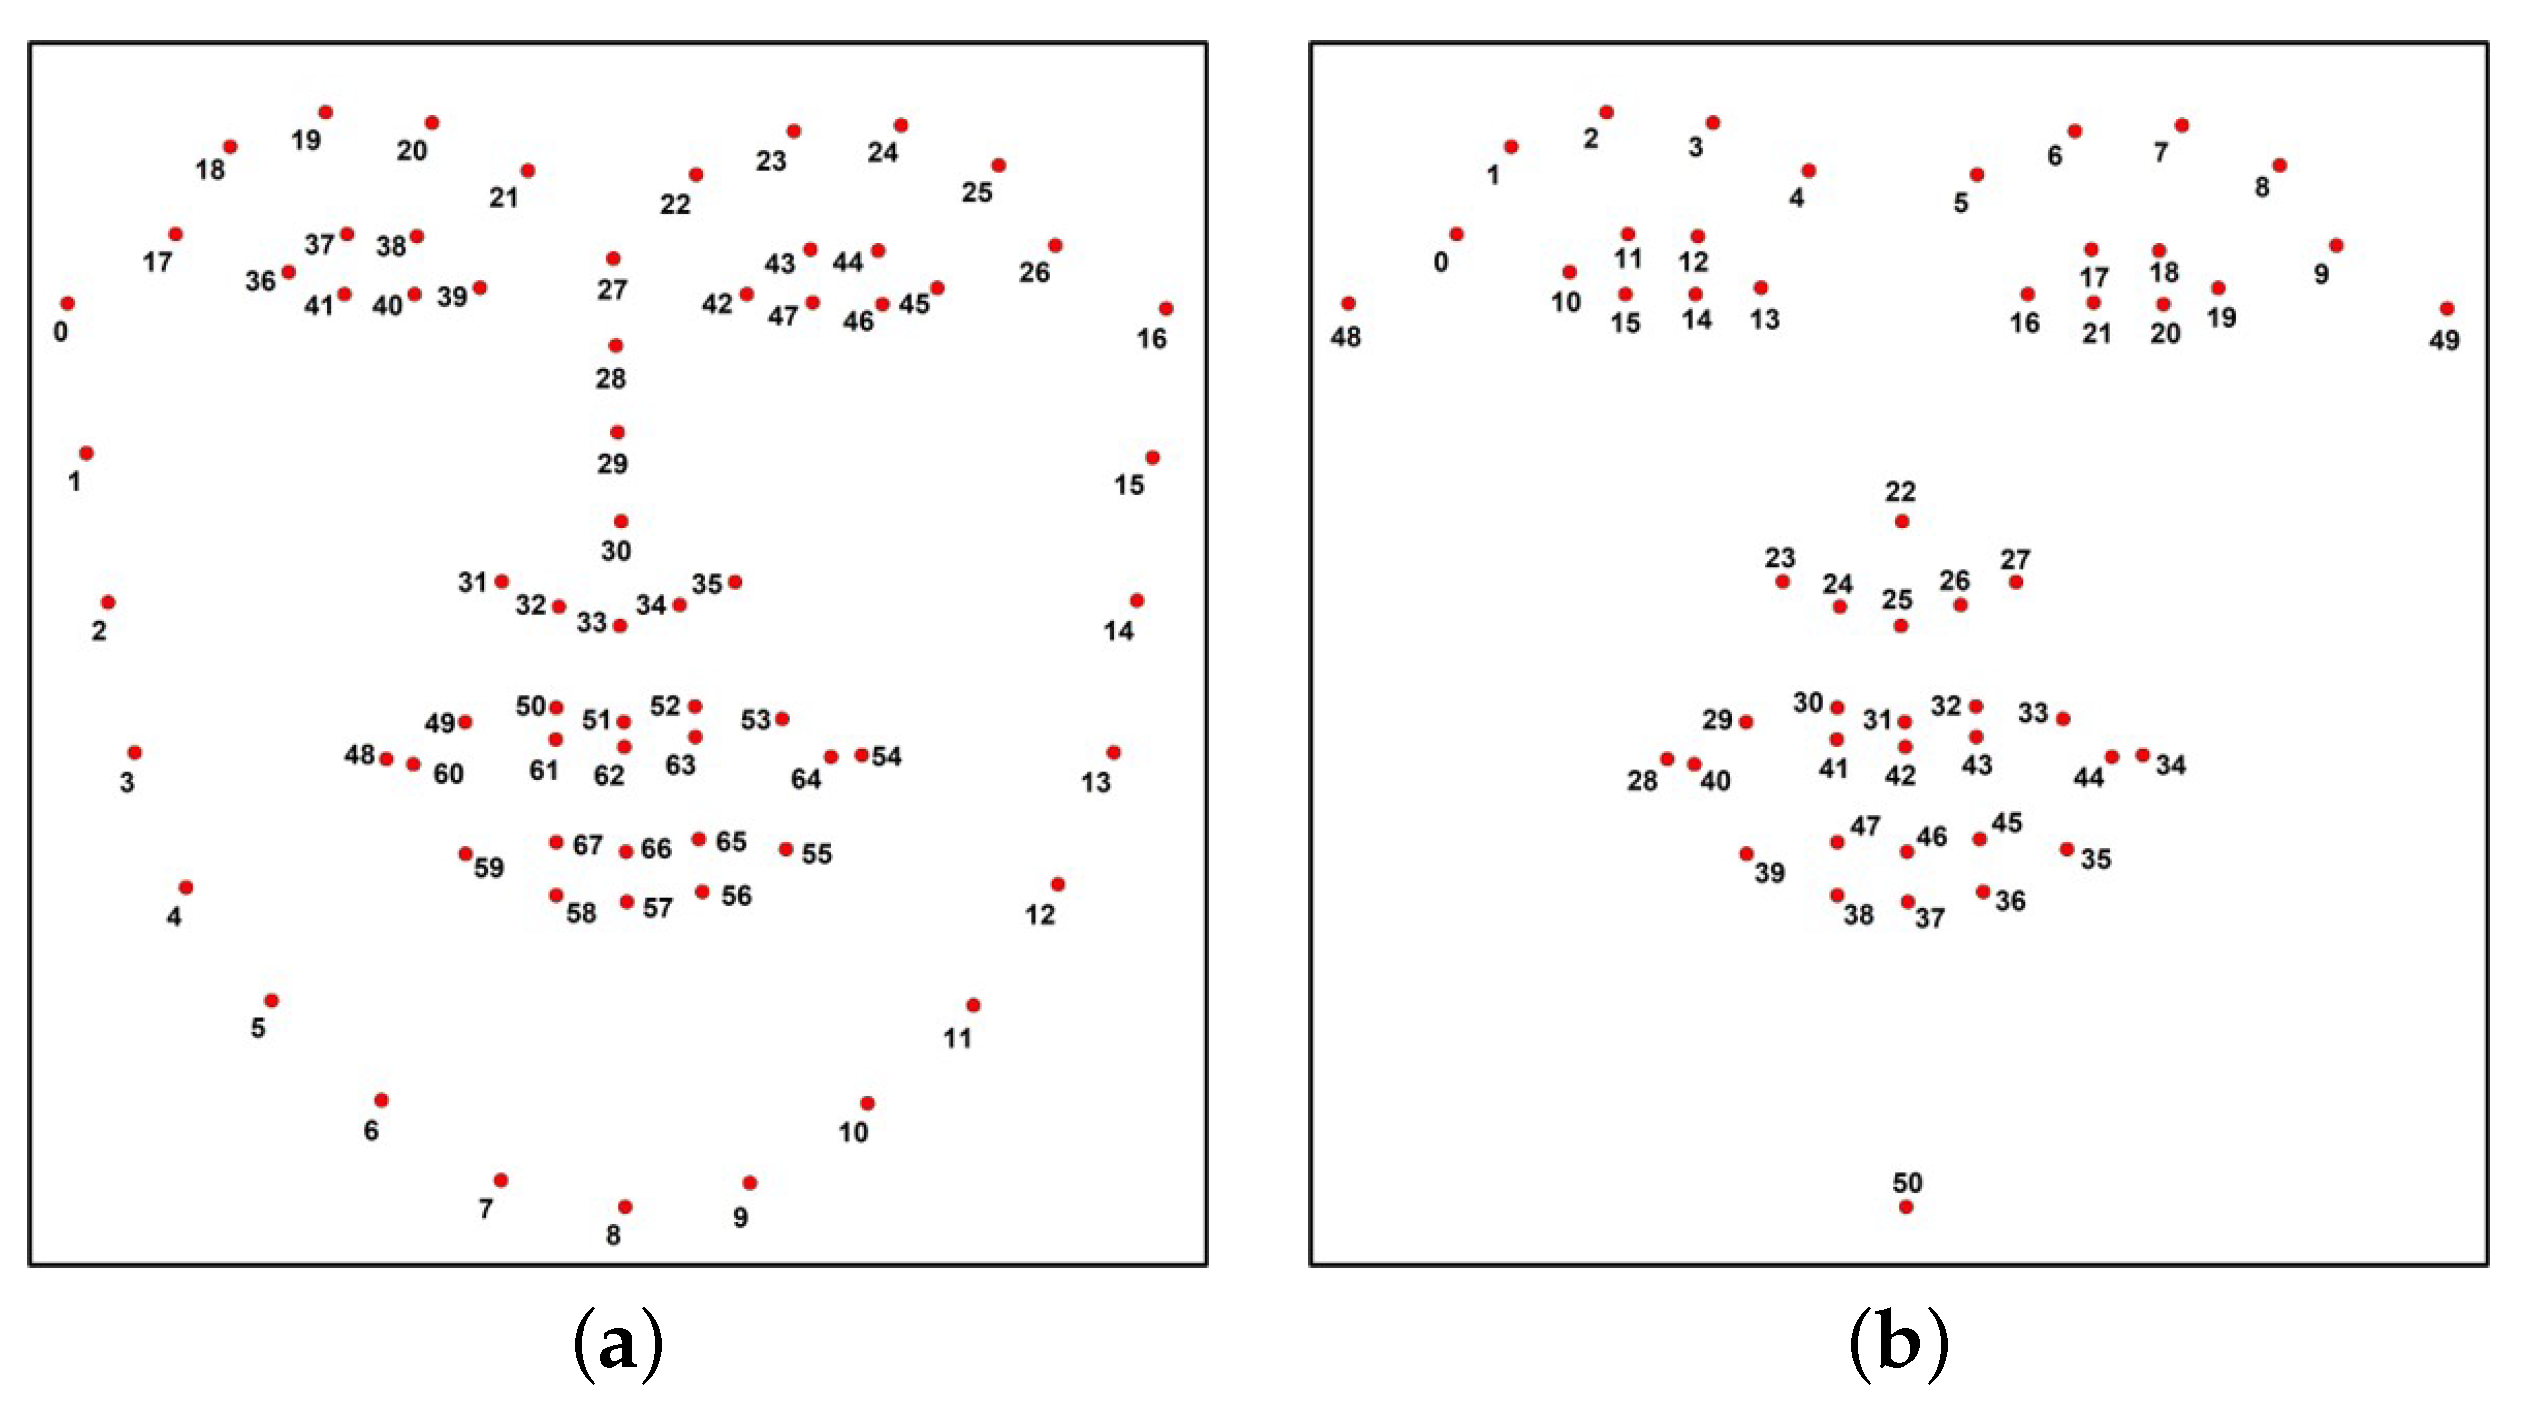
The MEE shape predictor is trained to detect 68 points, but only 51 of them are of interest in this work. As depicted on Figure 2, the 51 points are reorganized to facilitate the computation of measures.
Since the accuracy of the facial symmetry quantification can be affected by the tilt angle of the head [16], before computing any symmetry measures tilt correction was performed using the facial landmarks previously extracted. In this work, the first and last jaw points, points 48 and 49 in Figure 2b, were used to correct the possible tilt of the head. Here, point 48 is set as the origin of the coordinate plane and the angle between it and point 49 is the tilt angle to be corrected, with a geometry rotation of the key points. Notice that the angle between the two points was obtained according to Equation (1):
where and .
The facial landmark rotation process goes as follows:
- Compute a rotation matrix M. The function getRotationMatrix2D from OpenCV [13] can be employed using and the angle between the two jaw points.
- Rotate the 51 key points using M:
- Store the rotated data for future data processing.
2.2. Facial Measures Computation
As stated before, in this methodology the evaluation of the input image was performed aiming to detect a level of asymmetry within the two sides of the face. The proposed measures extract information from the eyebrows, eyes, nose, and mouth. As depicted on Figure 3, 34 distances were calculated using the facial key points. Some of those distances (A to K) were inspired by the work of [17], who aimed to evaluate objective measures from face photographs with a target other than facial paralysis detection, but they seem to be a good reference to characterize the healthy human face. Here, distances A to Q were proposed to detect any level of asymmetry among face sides (or regions), while measures R to Z were proposed to identify the facial movement executed by the patient; then, the asymmetry level was computed.
The proposed facial measures aim to identify any level of asymmetry between the left and right sides of the face, although locating the paralyzed side (or region) of the face is out of the scope of this work. Most measures were compared and ratios were computed to obtain a value in the range of , where 0 means fairly asymmetric and 1 is assumed to be closer to a healthy face. Before describing our proposed measures, it is worth noticing that the angle between two points was computed according to Equation (1), the slope between points was computed following Equation (3), the Euclidean distance was employed in this work according to Equation (4), and the perimeter of a close segment was computed using Equation (5):
where is a close segment, is the start point, and is the last one and represents the end point within the segment.
In this work, it is assumed that a healthy face is symmetric with respect to the position of the face elements (e.g., the eyelids, the mouth corners, the eyebrows) independently of the face gesture. In the case where those elements are not symmetric to each other, it is assumed that a level of paralysis will be diagnosed. Therefore, 29 symmetry measures are proposed and described in Table 1; please refer to Figure 2 and Figure 3 if further detail is required.
2.3. Multi-Layer Perceptron Classifier
Classification is a long-established problem in machine learning, and the use of artificial neural networks is fairly common. In this work, we employed the Weka (Waikato Environment for Knowledge Analysis) [18] suite of machine learning to train a binary classifier based on the multi-layer perceptron approach. The Weka function known as the Multilayer Perceptron (MLP) requires at least five parameters to learn: learning rate (L), momentum (M), training time (N), hidden layers (H), and seed (S). Both, the learning rate and the momentum are used to update the weights of the connections between nodes. The training time is the number of epochs to train through. Hidden layers refers to the number of layers within the MLP and the number of neurons for each. The seed is a number used to randomly initialize the weights of the connections between nodes. This classifier uses backpropagation to learn a multi-layer perceptron to classify instances. For more information regarding the Weka software, refer to [18].
3. Experiments and Results
There are a number of methodologies aiming to detect facial paralysis in a photograph. However, collaboration among the research community has been difficult due to the unavailability of public datasets, mainly because of patient privacy as many patients would prefer not to share their biometrical data. This situation motivated us to test our classification system on two different databases that recently became publicly available. Some remarks on such databases are given here.
First, we used the Massachusetts Eye and Ear Infirmary (MEEI) database, which is an open source set of facial photographs and videos representing the entire spectrum of flaccid and nonflaccid facial palsy collected by Greene et al. and introduced in [19]. The MEEI database was released to serve as a resource for facial palsy education and research. Initially, to demonstrate the utility of the database the relationship between the level of facial function and the perceived emotion expression was successfully characterized using a machine learning-based algorithm [19]. Later, the MEEI database was employed to develop a novel machine learning algorithm for the fast and accurate localization of facial landmarks in photographs of facial palsy patients; the improved shape predictor represents the first step toward an automatic system for computer-aided assessment in facial palsy [12]. In order to determine an agreement between the facial function evaluation using high-quality photographs and using in-person evaluation, the MEEI database was employed. The authors demonstrated that facial symmetry in facial palsy patients can be monitored using standardized frontal photographs [20]. Recently, the MEEI database was also employed to compare a clinician evaluation against machine learning–derived automated assessments in frontal photographs. The authors of [21] concluded that automated scores predicted more asymmetry in normal patients and less asymmetry in patients with flaccid palsy and synkinesis compared to clinician grading. Automated assessments hold promise for the standardization of facial palsy outcome measures and may eliminate the observer bias seen in clinician-graded scales. The database is composed of 480 high-resolution images from 60 participants, 10 healthy subjects, and 50 patients (25 suffering from flaccid and 25 from nonflaccid paralysis), each one performing 8 different facial movements: (1) at rest, (2) eyebrow elevation, (3) light effort eye closure, (4) full effort closure, (5) light effort smile, (6) full effort smile, (7) pucker, and (8) lip depression. This image database was used to design our classification system. To the best of our knowledge, there is no other publicly available database with these characteristics.
Second, the Toronto NeuroFace (TNF) is also a publicly available dataset, collected by Bandini et al. and introduced in [22], which aims to assess neurological disorders. Similarly to the MEEI dataset, the Toronto NeuroFace dataset was released to foster the development of novel and robust approaches for face alignment and oro-facial assessments that can be used to track and analyze facial movements in clinical populations suffering from amyotrophic lateral sclerosis and other neurological diseases. Authors in [22] analyzed the importance of using algorithms trained with data from the target population in order to improve the localization of facial landmarks and also the accuracy in face alignment. The TNF dataset consists of 261 videos, clinical scores per video, and more than 3300 annotated frames of faces from individuals performing oro-facial tasks typical of the clinical assessment.
To the best of our knowledge, neither the MEEI database or the TNF dataset have been employed to specifically detect facial paralysis in frontal face photography. It is worth noticing that both databases intend to facilitate information for the development of clinical applications; however, they are not equivalent in terms of image quality, lighting, and pose conditions, and the tasks performed by the participants are not equivalent. In other words, both databases are not directly comparable for our classification problem, but they were helpful in the design process.
As stated before, in Section 2.3, the Weka suite was employed at the design stage of our MLP classifier. The suite allowed us to analyze the performance of the MLP classifier parameters—in this case the function named CVParameterSelection was employed [18]. As a result of the analysis, the configuration values were set as learning rate , momentum , training time , seed , and hidden layers . It might be relevant to mention that the 29 features were selected from a set of symmetry measures after evaluating the worth of the features using the strategy implemented by the function named ClassifierAttributeEval [18].
Using the 10-fold cross-validation technique, the MLP classifier was trained with 640 samples computed from the MEEI database. Cross-validation is a statistical method used to estimate the performance of machine learning models on new data; it is a widely known technique used to train and evaluate. Later, it was observed that the MLP function did not perform sequential learning, resulting in a negative impact on the classifier performance because the available dataset was unbalanced. That is, there were fewer healthy samples compared to the unhealthy ones (80 vs. 400). To overcome this situation, the healthy set was replicated three times with a sample augmentation process. Similar to the process suggested in [9,16], the healthy images were rotated in two opposite directions, increasing the amount of available data and also verifying that our algorithm was invariant to rotation. In previous experiments, it was observed that increasing the amount of healthy instances by three times is enough to learn and discriminate this class without over fitting. In the end, the training of the MLP classifier was executed with 640 samples (240 healthy and 400 unhealthy instances).
In Table 2, the performance of the model for the testing part of the data for each fold is presented. There, TN stands for true negative (i.e., healthy samples), TP stands for true positive (i.e., unhealthy samples), and false negative (FN) and false positive (FP) are incorrectly classified samples. Here, the worst performance is 84.37% for the 1st fold and the best is 100% for the 5th fold. The average performance of this methodology is 94.06%, as shown in Table 2. After evaluating our MLP classifier with the original 480 samples, there is a 99.79% correct classification of the MEEI database, yielding a sensitivity of 99.75% and a specificity of 100%. The confusion matrix of test on the actual MEEI database is given in Table 3.
It was already mentioned that the Toronto NeuroFace (TNF) is a database collected for clinical assessment, and to the best of our understanding and the information provided by the authors, the subset called Stroke can be used to evaluate our methodology. There are 8 subjects with facial asymmetry and 3 participants without it—in total, 817 asymmetrical samples and 219 symmetrical ones. It is important to notice that the TNF images refer to frames extracted from the subjects videos performing oro-facial tasks. Following the proposed methodology, a 10-fold cross-validation technique was employed to train another MLP classifier using samples computed from the TNF database. In Table 4, the performance of the model on the testing part of the data for each fold is presented. Here, the worst performance was 94.56% for the 5th fold and the best was 98.65% for the 3rd fold. The average performance of this methodology for the second dataset was 97.22%, as shown in Table 4. A 98.55% correct classification was found after evaluating the MLP classifier with the original 1036 samples. The confusion matrix of the test on the actual TNF database is described in Table 5, which yields a sensitivity of 98.29% and a specificity of 99.54%, proving that our methodology to design a binary classifier to detect facial paralysis can be extended to other databases of face photographs with an outstanding performance.
Our methodology detects facial asymmetry levels within an image independently of the gesture performed by the subject, while most of the other methods compute facial asymmetry levels from a set of different facial gestures from the same subject. If we focus on the facial paralysis detection systems (i.e., a binary classification) that compute facial landmarks at some point of their processing, we can put together a summary of three methodologies, as previously introduced in Section 1; such relation is shown in Table 6. We observe that a direct comparison of methods in this table is not feasible because of discrepancies in the goals and metrics used; nonetheless, we include the results of works closer to ours. Those methods compute facial landmarks at some point of their process but train their shape predictor model on their own private dataset (e.g., [9,10,11]). Those different performance measures obtained from our tests and shown in Table 6 lead us to suggest that our method exhibits a better performance or, at least, one similar to that of other approaches.
4. Conclusions and Future Work
A methodology to detect facial paralysis in an image, assuming that it can be interpreted as a problem of asymmetry levels among face elements, was proposed. The system consists of a set of 29 facial measures easily computed from predicted landmarks and a binary classifier based on a multi-layer perceptron approach, which provides a healthy or unhealthy label as a result. The performance of the methodology was evaluated in two image databases. In the first one, consisting of 480 images of 60 subjects, the approach attained a 94.06% correct classification; a performance of 97.22% was reached on the second database, showing that our methodology to design a binary classifier can be expanded to other databases with excellent results. Future work can be oriented to more specific classification tasks on image databases.
Author Contributions
Conceptualization, G.S.P.-D. and R.E.S.-Y.; formal analysis, R.E.S.-Y. and C.H.G.-C.; investigation, G.S.P.-D.; methodology, G.S.P.-D., R.E.S.-Y., and C.H.G.-C.; project administration, R.E.S.-Y. and C.H.G.-C.; supervision, R.E.S.-Y.; validation G.S.P.-D., R.E.S.-Y., and C.H.G.-C.; writing—original draft, G.S.P.-D.; writing—review and editing, G.S.P.-D., R.E.S.-Y., and C.H.G.-C. All authors have read and agreed to the published version of the manuscript.
Funding
This research received no external funding.
Institutional Review Board Statement
Not applicable.
Informed Consent Statement
Not applicable.
Data Availability Statement
There are no available data.
Acknowledgments
This research has been supported by the National Council of Science and Technology of Mexico (CONACYT) through the scholarship 302076.
Conflicts of Interest
The authors declare no conflict of interest.
References
- Wu, Y.; Ji, Q. Facial landmark detection: A literature survey. Int. J. Comput. Vis. 2019, 127, 115–142. [Google Scholar] [CrossRef] [Green Version]
- Thevenot, J.; López, M.B.; Hadid, A. A survey on computer vision for assistive medical diagnosis from faces. IEEE J. Biomed. Health Inform. 2018, 22, 1497–1511. [Google Scholar] [CrossRef] [Green Version]
- Matthews, I.; Baker, S. Active appearance models revisited. Int. J. Comput. Vis. 2004, 60, 135–164. [Google Scholar] [CrossRef] [Green Version]
- Wang, N.; Gao, X.; Tao, D.; Yang, H.; Li, X. Facial feature point detection: A comprehensive survey. Neurocomputing 2018, 275, 50–65. [Google Scholar] [CrossRef] [Green Version]
- Lou, J.; Yu, H.; Wang, F.Y. A review on automated facial nerve function assessment from visual face capture. IEEE Trans. Neural Syst. Rehabil. Eng. 2020, 28, 488–497. [Google Scholar] [CrossRef] [PubMed]
- Guarin, D.L.; Dusseldorp, J.; Hadlock, T.A.; Jowett, N. A machine learning approach for automated facial measurements in facial palsy. JAMA Facial Plast. Surg. 2018, 20, 335–337. [Google Scholar] [CrossRef] [PubMed]
- Jiang, C.; Wu, J.; Zhong, W.; Wei, M.; Tong, J.; Yu, H.; Wang, L. Automatic facial paralysis assessment via computational image analysis. J. Healthc. Eng. 2020, 2020. [Google Scholar] [CrossRef] [PubMed]
- Wang, T.; Zhang, S.; Dong, J.; Liu, L.A. Automatic evaluation of the degree of facial nerve paralysis. Multimed. Tools Appl. 2016, 75, 11893–11908. [Google Scholar] [CrossRef] [Green Version]
- Kim, H.S.; Kim, S.Y.; Kim, Y.H.; Park, K.S. A smartphone-based automatic diagnosis system for facial nerve palsy. Sensors 2015, 15, 26756–26768. [Google Scholar] [CrossRef] [Green Version]
- Hsu, G.S.J.; Huang, W.F.; Kang, J.H. Hierarchical network for facial palsy detection. In Proceedings of the 2018 IEEE/CVF Conference on Computer Vision and Pattern Recognition Workshops (CVPRW), Salt Lake City, UT, USA, 18–22 June 2018; pp. 693–6936. [Google Scholar] [CrossRef]
- Barbosa, J.; Seo, W.K.; Kang, J. paraFaceTest: An ensemble of regression tree-based facial features extraction for efficient facial paralysis classification. BMC Med. Imaging 2019, 19. [Google Scholar] [CrossRef] [PubMed] [Green Version]
- Guarin, D.L.; Yunusova, Y.; Taati, B.; Dusseldorp, J.R.; Mohan, S.; Tavares, J.; van Veen, M.M.; Fortier, E.; Hadlock, T.A.; Jowett, N. Toward an automatic system for computer-aided assessment in facial palsy. Facial Plast. Surg. Aesthetic Med. 2020, 22, 42–49. [Google Scholar] [CrossRef] [PubMed] [Green Version]
- Bradski, G. The OpenCV Library. Dobb’s J. Softw. Tools 2000. [Google Scholar]
- Ren, S.; Cao, X.; Wei, Y.; Sun, J. Face alignment at 3000 FPS via regressing local binary features. In Proceedings of the IEEE Conference on Computer Vision and Pattern Recognition (CVPR), Columbus, OH, USA, 23–28 June 2014; pp. 1685–1692. [Google Scholar] [CrossRef]
- Kazemi, V.; Sullivan, J. One Millisecond Face Alignment with an Ensemble of Regression Trees. In Proceedings of the IEEE Conference on Computer Vision and Pattern Recognition (CVPR), Columbus, OH, USA, 23–28 June 2014; pp. 1867–1874. [Google Scholar] [CrossRef] [Green Version]
- Guo, Z.; Dan, G.; Xiang, J.; Wang, J.; Yang, W.; Ding, H.; Deussen, O.; Zhou, Y. An unobtrusive computerized assessment framework for unilateral peripheral facial paralysis. IEEE J. Biomed. Health Inform. 2018, 22, 835–841. [Google Scholar] [CrossRef] [PubMed]
- Ostrofsky, J.; Cohen, D.J.; Kozbelt, A. Objective versus subjective measures of face-drawing accuracy and their relations with perceptual constancies. Psychol. Aesthetics Creat. Arts 2014, 8, 486–497. [Google Scholar] [CrossRef]
- Witten, I.H.; Frank, E.; Hall, M.A. Data Mining: Practical Machine Learning Tools and Techniques, 3rd ed.; Morgan Kaufmann Publishers: Burlington, MA, USA, 2011; ISBN 978-0-12-374856-0. [Google Scholar]
- Greene, J.J.; Guarin, D.L.; Tavares, J.; Fortier, E.; Robinson, M.; Dusseldorp, J.; Quatela, O.; Jowett, N.; Hadlock, T. The spectrum of facial palsy: The MEEI facial palsy photo and video standard set. Laryngoscope 2020, 130, 32–37. [Google Scholar] [CrossRef] [PubMed]
- Malka, R.; Miller, M.; Guarin, D.; Fullerton, Z.; Hadlock, T.; Banks, C. Reliability Between In-Person and Still Photograph Assessment of Facial Function in Facial Paralysis Using the eFACE Facial Grading System. Facial Plast. Surg. Aesthetic Med. 2020. [Google Scholar] [CrossRef] [PubMed]
- Miller, M.; Hadlock, T.; Fortier, E.; Guarin, D.L. The Auto-eFACE: Machine Learning–Enhanced Program Yields Automated Facial Palsy Assessment Tool. Plast. Reconstr. Surg. 2021, 147, 467–474. [Google Scholar] [CrossRef] [PubMed]
- Bandini, A.; Rezaei, S.; Guarin, D.; Kulkarni, M.; Lim, D.; Boulos, M.I.; Zinman, L.; Yunusova, Y.; Taati, B. A new dataset for facial motion analysis in individuals with neurological disorders. IEEE J. Biomed. Health Inform. 2020. [Google Scholar] [CrossRef] [PubMed]
Figure 1.
Framework of the proposed facial paralysis classification system.

Figure 2.
Facial model adapted from the work proposed by Matthews and Baker [3]. (a) Standard 68 key points model; (b) our 51 key points model.
Figure 2.
Facial model adapted from the work proposed by Matthews and Baker [3]. (a) Standard 68 key points model; (b) our 51 key points model.

Figure 3.
Facial distances to compute spatial relations between facial landmarks. (a) Distances A to K; (b) distances L to Q; (c) distances R to Z.
Figure 3.
Facial distances to compute spatial relations between facial landmarks. (a) Distances A to K; (b) distances L to Q; (c) distances R to Z.


Table 1.
Proposed symmetry measures.
| Feature | Face Element | Description | Formula |
|---|---|---|---|
| f0 | Eyebrows | Angle | |
| f1 | Eyebrows | Angle | |
| f2 | Eyebrows | Angle | |
| f3 | Eyebrows | Maximum value | |
| f4 | Eyebrows | Slope | |
| f5 | Eyebrows | Slope | |
| f6 | Eyebrows | Slope | |
| f7 | Eyes | Angle | |
| f8 | Eyes | Maximum value | |
| f9 | Eyes | Maximum value | |
| f10 | Eyes | Maximum value | |
| f11 | Eyes | Maximum value | |
| f12 | Eyes | Maximum value | |
| f13 | Eyes | Maximum value | |
| f14 | Mouth | Angle | |
| f15 | Mouth | Maximum value | |
| f16 | Mouth | Maximum value | |
| f17 | Mouth | Maximum value | |
| f18 | Mouth | Maximum value | |
| f19 | Mouth | Maximum value | |
| f20 | Mouth | Maximum value | |
| f21 | Mouth | Maximum value | |
| f22 | Nose | Angle | |
| f23 | Combined | Angle | |
| f24 | Combined | Maximum value | |
| f25 | Combined | Maximum value | |
| f26 | Combined | Maximum value | |
| f27 | Combined | Ratio | |
| f28 | Combined | Ratio |
In f19, f20 and f21, W is the distance depicted in Figure 3c, being the perimeter values and calculated as and .
Table 2.
Cross-validation results for tests on the MEEI database.
| n-Fold | TN | TP | FN | FP | Accuracy [%] |
|---|---|---|---|---|---|
| 1 | 22 | 32 | 8 | 2 | 84.37 |
| 2 | 24 | 37 | 3 | 0 | 95.31 |
| 3 | 24 | 33 | 7 | 0 | 89.06 |
| 4 | 24 | 38 | 2 | 0 | 96.87 |
| 5 | 24 | 40 | 0 | 0 | 100 |
| 6 | 23 | 38 | 2 | 1 | 95.31 |
| 7 | 24 | 38 | 2 | 0 | 96.87 |
| 8 | 22 | 38 | 2 | 2 | 93.75 |
| 9 | 24 | 35 | 5 | 0 | 92.19 |
| 10 | 24 | 38 | 2 | 0 | 96.87 |
| Average | - | - | - | - | 94.06 |
Table 3.
Resulting confusion matrix of the test on the actual MEEI database.
| Healthy = 0 | Unhealthy = 1 | Correct Label |
|---|---|---|
| 80 | 0 | healthy |
| 1 | 399 | unhealthy |
Table 4.
Cross-validation results for tests on the TNF database.
| n-Fold | TN | TP | FN | FP | Accuracy [%] |
|---|---|---|---|---|---|
| 1 | 66 | 78 | 4 | 0 | 97.30 |
| 2 | 65 | 78 | 4 | 1 | 96.62 |
| 3 | 66 | 80 | 2 | 0 | 98.65 |
| 4 | 65 | 80 | 2 | 1 | 97.97 |
| 5 | 64 | 75 | 6 | 2 | 94.56 |
| 6 | 65 | 79 | 2 | 1 | 97.96 |
| 7 | 66 | 79 | 2 | 0 | 98.64 |
| 8 | 65 | 77 | 5 | 0 | 96.60 |
| 9 | 65 | 78 | 4 | 0 | 97.28 |
| 10 | 64 | 78 | 4 | 1 | 96.60 |
| Average | - | - | - | - | 97.22 |
Table 5.
Resulting confusion matrix of the test on the actual TNF database.
| Healthy = 0 | Unhealthy = 1 | Correct Label |
|---|---|---|
| 218 | 1 | healthy |
| 14 | 803 | unhealthy |
Table 6.
Relation between the methods and databases used for the performance metrics on classification tests, as reported by the authors.
Table 6.
Relation between the methods and databases used for the performance metrics on classification tests, as reported by the authors.
| Method | Database | Sensitivity | Specificity | Precision | Accuracy |
|---|---|---|---|---|---|
| Kim et al. [9] | * | 80.0% | - | 92.3% | 88.9% |
| Hsu et al. [10] | * | 88.0% | - | 93.0% | - |
| Barbosa et al. [11] | * | 98.12% | 94.06% | - | - |
| Our methodology | MEEI | 91.75% | 97.92% | 98.66% | 94.06% |
| Our methodology | TNF | 95.72% | 99.09% | 99.24% | 97.22% |
* Tested on their private dataset, not available due to patient privacy. Note that test cases cannot be compared in a
straightforward way.
Publisher’s Note: MDPI stays neutral with regard to jurisdictional claims in published maps and institutional affiliations. |
© 2021 by the authors. Licensee MDPI, Basel, Switzerland. This article is an open access article distributed under the terms and conditions of the Creative Commons Attribution (CC BY) license (http://creativecommons.org/licenses/by/4.0/).
Share and Cite
MDPI and ACS Style
Parra-Dominguez, G.S.; Sanchez-Yanez, R.E.; Garcia-Capulin, C.H. Facial Paralysis Detection on Images Using Key Point Analysis. Appl. Sci. 2021, 11, 2435. https://0-doi-org.brum.beds.ac.uk/10.3390/app11052435
AMA Style
Parra-Dominguez GS, Sanchez-Yanez RE, Garcia-Capulin CH. Facial Paralysis Detection on Images Using Key Point Analysis. Applied Sciences. 2021; 11(5):2435. https://0-doi-org.brum.beds.ac.uk/10.3390/app11052435
Chicago/Turabian StyleParra-Dominguez, Gemma S., Raul E. Sanchez-Yanez, and Carlos H. Garcia-Capulin. 2021. "Facial Paralysis Detection on Images Using Key Point Analysis" Applied Sciences 11, no. 5: 2435. https://0-doi-org.brum.beds.ac.uk/10.3390/app11052435
Note that from the first issue of 2016, this journal uses article numbers instead of page numbers. See further details here.