Article

Optical Coherence Tomography Angiography Monitors Cutaneous Wound Healing under Angiogenesis-Promoting Treatment in Diabetic and Non-Diabetic Mice

by
Martin Pfister
1,2,3,
Kornelia Schützenberger
1,2,
Bhavapriya J. Schäfer
1,2,
Stefan Puchner
1,2,
Hannes Stegmann
1,2,
Christine Hohenadl
2,4,
Michael Mildner
5,
Gerhard Garhöfer
6,
Leopold Schmetterer
1,2,6,7,8,9,10 and
René M. Werkmeister
1,2,*
1
Center for Medical Physics and Biomedical Engineering, Medical University of Vienna, Waehringer Guertel 18-20, 1090 Vienna, Austria
2
Christian Doppler Laboratory for Ocular and Dermal Effects of Thiomers, Medical University of Vienna, Waehringer Guertel 18-20, 1090 Vienna, Austria
3
Institute of Applied Physics, Vienna University of Technology, Wiedner Hauptstr. 8-10, 1040 Vienna, Austria
4
Croma Pharma GmbH, Cromazeile 2, 2100 Leobendorf, Austria
5
Department of Dermatology, Medical University of Vienna, Waehringer Guertel 18-20, 1090 Vienna, Austria
6
Department of Clinical Pharmacology, Medical University of Vienna, Waehringer Guertel 18-20, 1090 Vienna, Austria
7
Singapore Eye Research Institute, The Academia, 20 College Road, Discovery Tower Level 6, Singapore 169856, Singapore
8
School of Chemical and Biomedical Engineering, Nanyang Technological University, Novena Campus, 11 Mandalay Road, Singapore 308232, Singapore
9
Ophthalmology and Visual Sciences Academic Clinical Program, Duke-NUS Medical School, 8 College Road, Singapore 169857, Singapore
10
Institute of Molecular and Clinical Ophthalmology, 4031 Basel, Switzerland
*
Author to whom correspondence should be addressed.
Submission received: 22 January 2021 / Revised: 4 March 2021 / Accepted: 4 March 2021 / Published: 9 March 2021
(This article belongs to the Special Issue Applications of Advanced Imaging Technology in Biomedical Engineering)

Abstract

:

Featured Application

Optical coherence tomography angiography can provide biomarkers for vascular remodeling in preclinical wound healing studies.

Abstract

During wound healing, the rapid re-establishment of a functional microcirculation in the wounded tissue is of utmost importance. We applied optical coherence tomography (OCT) angiography to evaluate vascular remodeling in an excisional wound model in the pinnae of C57BL/6 and db/db mice receiving different proangiogenic topical treatments. Analysis of the high-resolution OCT angiograms, including the four quantitative parameters vessel density, vessel length, number of bifurcations, and vessel tortuosity, revealed changes of the microvasculature and allowed identification of the overlapping wound healing phases hemostasis, inflammation, proliferation, and remodeling. Angiograms acquired in the inflammatory phase in the first days showed a dilation of vessels and recruitment of pre-existing capillaries. In the proliferative phase, angiogenesis with the sprouting of new capillaries into the wound tissue led to an increase of the OCT angiography parameters vessel density, normalized vessel length, number of bifurcations, and vessel tortuosity by 28–47%, 39–52%, 33–48%, and 3–8% versus baseline, respectively. After the peak observed on study days four to seven, the parameters slowly decreased but remained still elevated 18 days after wounding, indicating a continuing remodeling phase. Our study suggests that OCT angiography has the potential to serve as a valuable preclinical research tool in studies investigating impaired vascular remodeling during wound healing and potential new treatment strategies.

1. Introduction

Cutaneous wounds are very common [1] and can be differentiated into acute and chronic wounds. In healthy subjects, acute wounds can be related to incisions, abrasions, or burns and usually heal uneventfully and without complications. In patients with underlying pathologies, for example, peripheral arterial and venous diseases or diabetes, these acute wounds can exhibit an impaired healing pattern, possibly leading to a chronic wound [2,3,4,5,6]. In developed countries, it has been estimated that 1–6% of the general population will experience such a chronic wound during their lifetime [7,8,9,10].
Normal wound healing is a well-organized, dynamic process with four overlapping phases: hemostasis, inflammation, proliferation and tissue formation, and tissue remodeling. A fundamental step in normal wound healing is the rapid re-establishment of a functional microcirculation in hypoxic tissue [11], realized by the process of angiogenesis, which refers to the growth of new capillaries from pre-existing blood vessels via sprouting [12]. The vasculature does not only provide the blood supply for the affected tissue but is also the site for the initiation of inflammatory events [13,14], which are a prerequisite for the healing of the wound. Multiple physiological and biochemical factors can lead to a deregulation or interruption of one or more of the normal healing phases and thus result in a chronic wound.
Clinical assessment of cutaneous wounds uses dermatoscopy, wound photography, or measuring tape. In preclinical research, histology and immunohistochemistry (IHC) can provide an insight into morphological changes and both cellular and molecular events [15,16]. However, for visualization of larger sections of the vascular network and, in particular, for the evaluation of the dynamic vascular remodeling during wound healing and the investigation of the pathophysiologic mechanisms of non-healing wounds, accurate, quantitative, and non-invasive imaging techniques are needed. Here, various imaging modalities for investigation of the cutaneous perfusion have been employed.
Non-optical methods like magnetic resonance imaging [17,18], micro-computed tomography (µCT) [19], or µCT angiography [20] can be employed for the assessment of angiogenesis but lack the spatial resolution for the visualization of capillary remodeling during wound healing. Additionally, the latter requires the injection of a contrast medium.
In recent years, ultrasound-based techniques like contrast-enhanced ultrasound [21] and acoustic angiography [22,23] have been used for vascular imaging. Based on the injection of a non-ionizing contrast agent into the blood stream and detection of the ultrasound signal with high-frequency receiver elements, the latter provides resolutions of a few hundred microns and allows characterization of the vascular architecture.
Also, non-invasive optical methods have been widely used for microvascular imaging. Photoacoustic (PA) imaging provides favorable penetration depth and sufficient resolution for visualizing the cutaneous vasculature in animals [24] and humans [25]. Beyond pure imaging of the vascular network, the technology has been employed for the assessment of quantitative vascular [26,27,28] and hematologic [29] parameters.
Optical coherence tomography (OCT), based on the principle of low coherence interferometry, provides label-free, non-contact, noninvasive, high spatial and temporal resolution cross-sectional imaging of biological tissues. Analyzing intrinsic dynamic changes in the OCT signal due to moving red blood cells, OCT angiography (OCTA) as a functional extension of OCT enables visualization of the vascular network in the probed tissue without the need for a contrast agent [30,31,32]. The technology’s high resolution provided an insight into vascular changes related to ocular diseases like diabetic retinopathy [33,34] or age-related macular degeneration [35,36] and allowed for the analysis of the vasculature in lesions of the skin [37,38,39].
Animal models are essential for investigating both the physiological and pathological mechanisms involved in tissue repair after wounding [40,41]. Here, due to their relatively low cost and their simple handling, mice represent the most widely used species for preclinical wound healing studies [42,43]. Despite various molecular [44,45] and immunological [46,47] differences between humans and mice, the healing of skin wounds in the two species is similar considering the aforementioned four overlapping phases of wound healing [48,49]. In addition, human and murine skin possess the same layers of cells in the dermis and epidermis; they differ, however, in terms of thickness and number of cell layers [47]. The relatively thin structure of the mouse ear pinna skin makes this location ideally suited for an investigation with optical imaging methods, which is why the mouse pinna model has been employed for in vivo assessment of normal [13,50,51] and impaired [52] wound healing in a longitudinal manner.
OCTA has also been used to monitor wound healing in humans. For example, Gong et al. applied OCTA to monitor the vasculature after a burn injury [53], Deegan et al. took repeated OCT/OCTA measurements after skin injury caused by a drop of molten plastic [54], and Holmes et al. investigated leg ulcers in 11 patients with OCT/OCTA [55]. Although the aforementioned studies demonstrated the applicability of OCTA for monitoring of wound healing in humans, for studies that compare multiple treatments of artificially set wounds, animal studies are preferable.
Topical applications of different agents are utilized to enhance angiogenesis and healing outcome. Vascular endothelial growth factor (VEGF), in addition to attracting leukocytes to the wound site, plays an essential role in vascular and lymphatic growth and was shown to significantly improve the healing outcome in diabetic mouse dorsal wound models [56,57]. Platelet derived growth factor (PDGF) was reported to increase the rate of cellular infiltration and capillary ingrowth into dorsal wounds of diabetic mice [58]. Beside these well-studied pro-angiogenic growth factors, the effect of different biological polymers on the wound healing outcome has been investigated [59]. For example, chitosan, a positively charged linear polysaccharide composed of randomly distributed β -(1→4)-linked D-glucosamine and N-acetyl-D-glucosamine was reported to enhance the function of inflammatory cells and promotes granulation during the proliferative stage of wound healing [60]. In addition, its hemostatic and antimicrobial activities [61] together with its excellent biocompatibility make it well suited for the use in wound healing dressings [59].
The current exploratory study aimed to investigate whether optical imaging via OCT/OCTA can be employed for the evaluation of dermal wound healing in diabetic db/db and healthy C57BL/6 mice receiving different proangiogenic treatments. Longitudinal assessment of angiogenesis and vascular remodeling during wound healing was performed using OCTA, with the goal of evaluating quantitative OCTA-based parameters and their applicability for objective assessment of the healing status. The primary objective was to investigate whether OCTA imaging allows for the detection of differences in the adaptational changes of the microvasculature due to the treatment.

2. Methods

2.1. Animals

Twenty-four female C57BL/6 and 24 db/db mice (Charles River Laboratories, Sulzfeld, Germany) with an age of approximately ten weeks on the first measurement day were included in the study. The animals were kept under controlled, standardized conditions (artificial L/D cycle 12:12, room temperature 22 ± 2 C , humidity 45 ± 10 %) at the Animal Care Facility at the Center for Biomedical Research, Medical University of Vienna, Vienna, Austria. The animals had ad libitum access to water and complete feed for mice (sniff R/M-H, sniff Spezialdiäten GmbH, Soest, Germany).

2.2. Mouse Model of Diabetes

BKS.Cg-Dock7m+/+ Leprdb/J mice—commonly referred to as db/db mice—are a murine model for Type 2 diabetes mellitus (T2DM) and the most commonly used strain for wound healing studies [62]. Due to the mutation in the gene encoding the leptin receptor, the leptin deficiency leads to increased appetite, obesity, insulin resistance, and hyperglycemia in these mice.
Mice with a blood glucose level > 250 m g /dL were included in the study. At the last measurement time point, db/db mice had an average blood glucose level > 500 m g /dL. C57BL/6 mice served as a control.

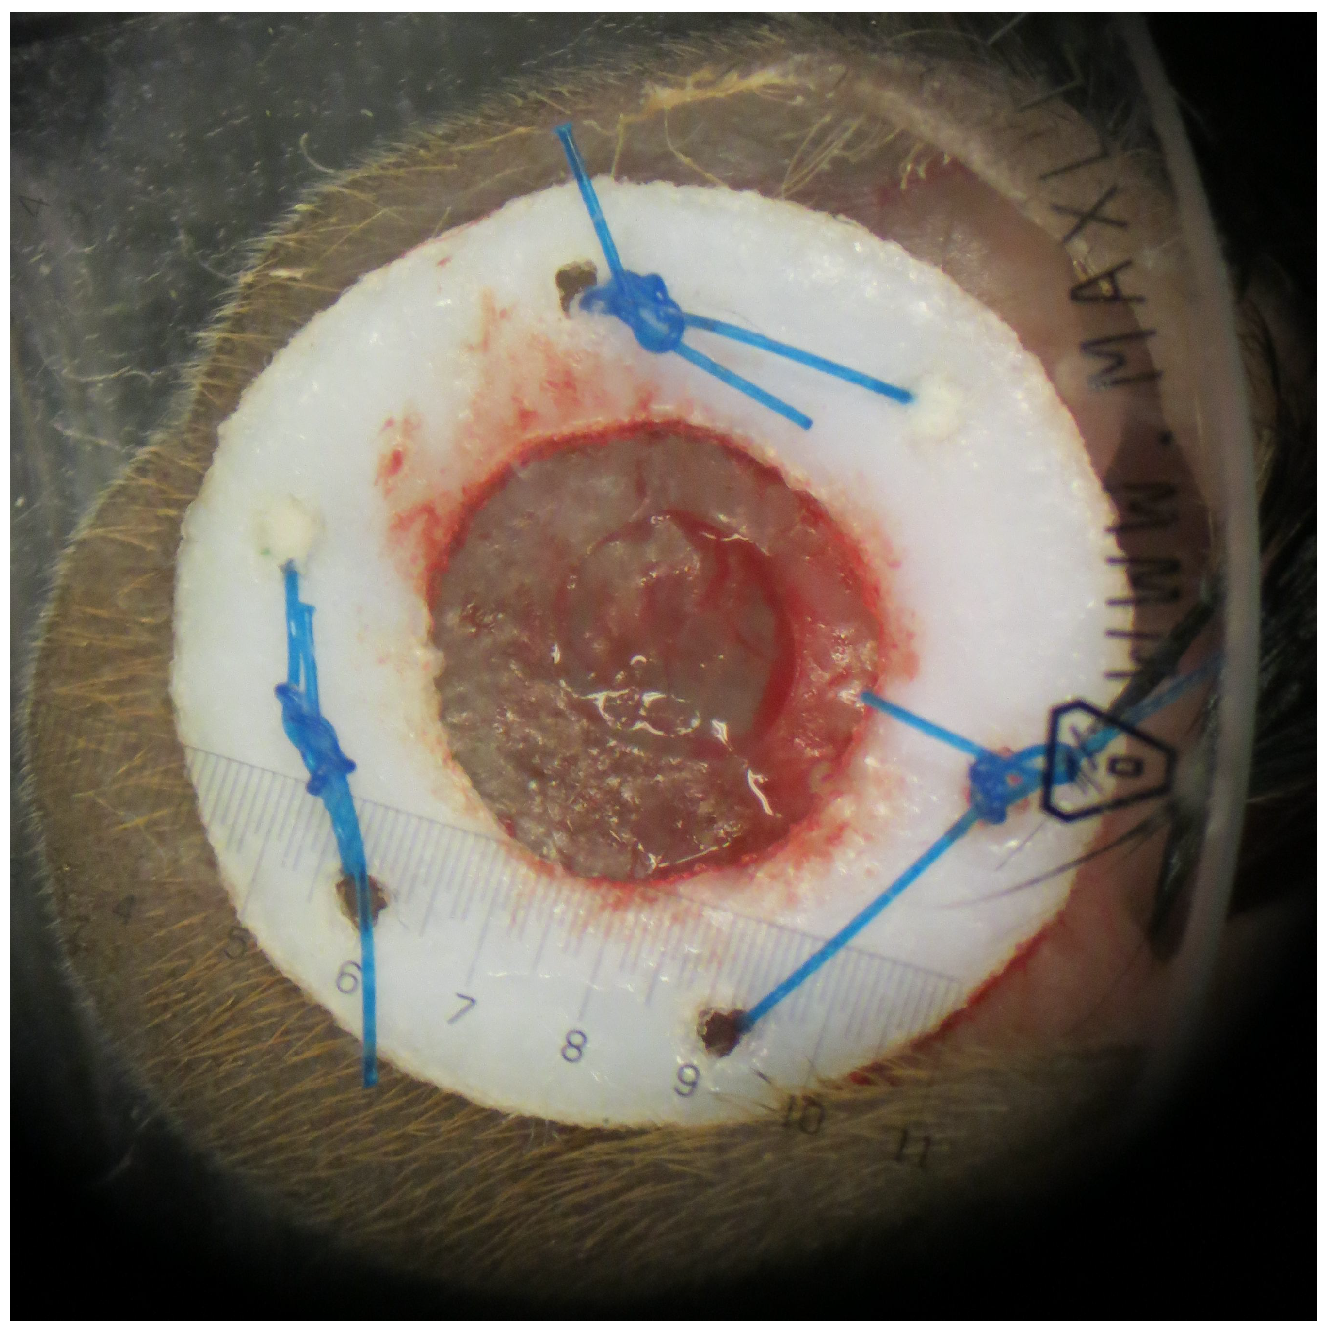
2.3. Murine Model of Wound Healing

A mouse ear pinna wound healing model [13,63] was used to study cutaneous wound healing in non-diabetic and diabetic mice. To assess the wound healing progression and changes in the microvasculature, imaging was performed before, immediately after wounding (T0), and 1, 4, 7, 12, and 18 days later by means of repeated OCT/OCTA imaging.
Animals were kept under general anesthesia (xylazine 5 m g / k g , ketamine 90 m g / k g , intraperitoneal administration) for baseline imaging, surgery, and imaging post wounding. Mouse ears were depilated prior to the first measurement in order to avoid shadowing by body hair. The cutaneous wound was created immediately after the baseline measurement under aseptic conditions. After marking the edge of the circular wound area ( ϕ = 1   m m ) on the ventral side of the pinna through slight twisting of a biopsy punch, skin layers were gently removed using a hockey knife (sclerotomy knife straight 2.5 m m , Alcon Grieshaber AG, Schaffhausen, Switzerland). Particular attention was paid to avoid perforating the ear. A 3D-printed donut-shaped plastic ring was sutured to the ear (Prolene 8711H 6-0 polypropylene suture, Ethicon, Johnson & Johnson Medical GmbH, Norderstedt, Germany) for wound splinting in order to minimize tissue contraction during wound healing. For imaging at time points 1, 4, 7, 12, and 18 days after wounding, animals were anaesthetized using 2% isoflurane ( 1 L/ min O2). Before imaging, wounds were carefully examined under a stereoscope and gently cleaned with saline solution. Additionally, digital photographs (Canon PowerShot G15, Canon Deutschland GmbH) were acquired at each time point to calculate the wound area.
Non-diabetic and diabetic animals were divided into four substance groups (Table 1) by cage unit and topically treated after each imaging time point.
After each OCTA acquisition except the baseline and the final measurement, mice received topical treatment with one drop of a chitosan hydrogel (Croma Pharma GmbH, Leobendorf, Austria), fibrin sealant (Tisseel, Baxter, Unterschleißheim, Germany), or fibrin sealant with rhVEGF165 and rhPDGF-BB (PeproTech, Rocky Hill, CT, USA). For the latter, 200 n g of each growth factor were dissolved in 1 m l of the fibrinogen component, before mixed with the thrombin component of the fibrin sealant. The wound was covered with a wound dressing (Suprasorb F, Lohmann&Rauscher, Vienna, Austria) to provide a moist wound environment.
All measurements were conducted at 22.0 ± 0.5 C room temperature. For all procedures including OCTA measurements, animals were placed on a flat heating plate (Uno Roestvaststaal BV, Zevenaar, The Netherlands). Via its control unit (Uno Control Unit 02, Uno Roestvaststaal BV), the temperature was set to 36 C in order to minimize heat loss of the animals during experiments.

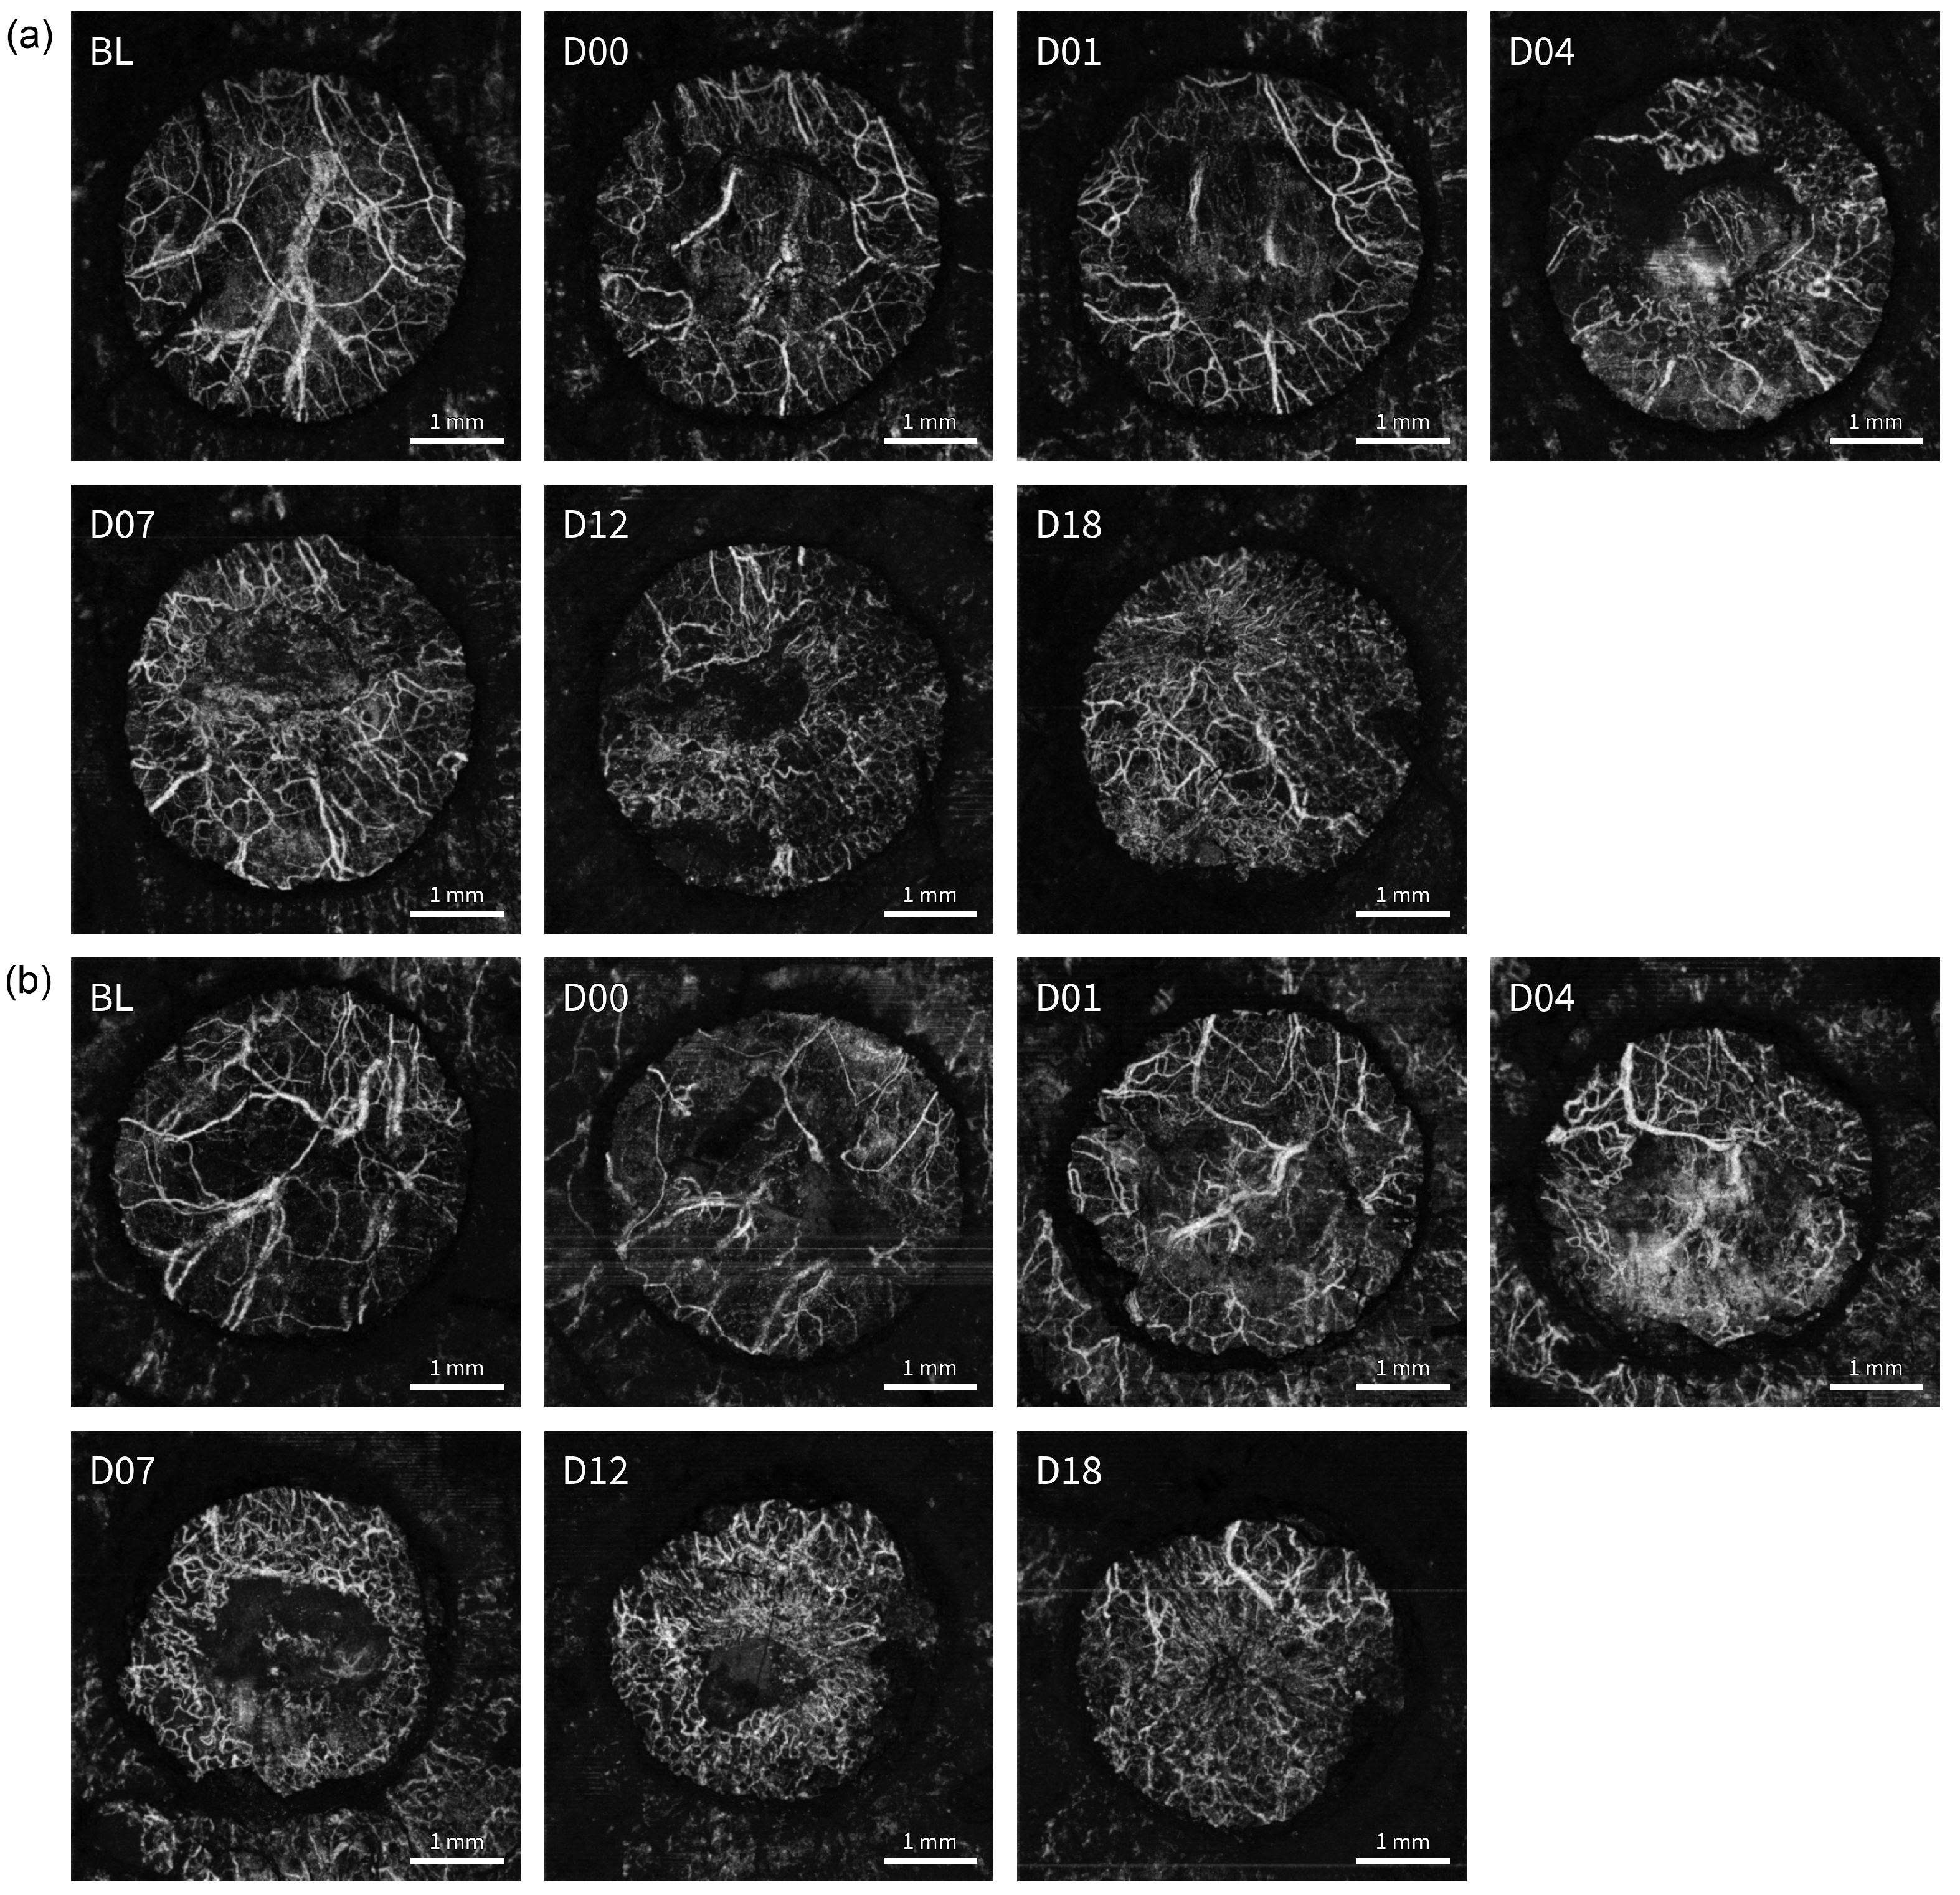
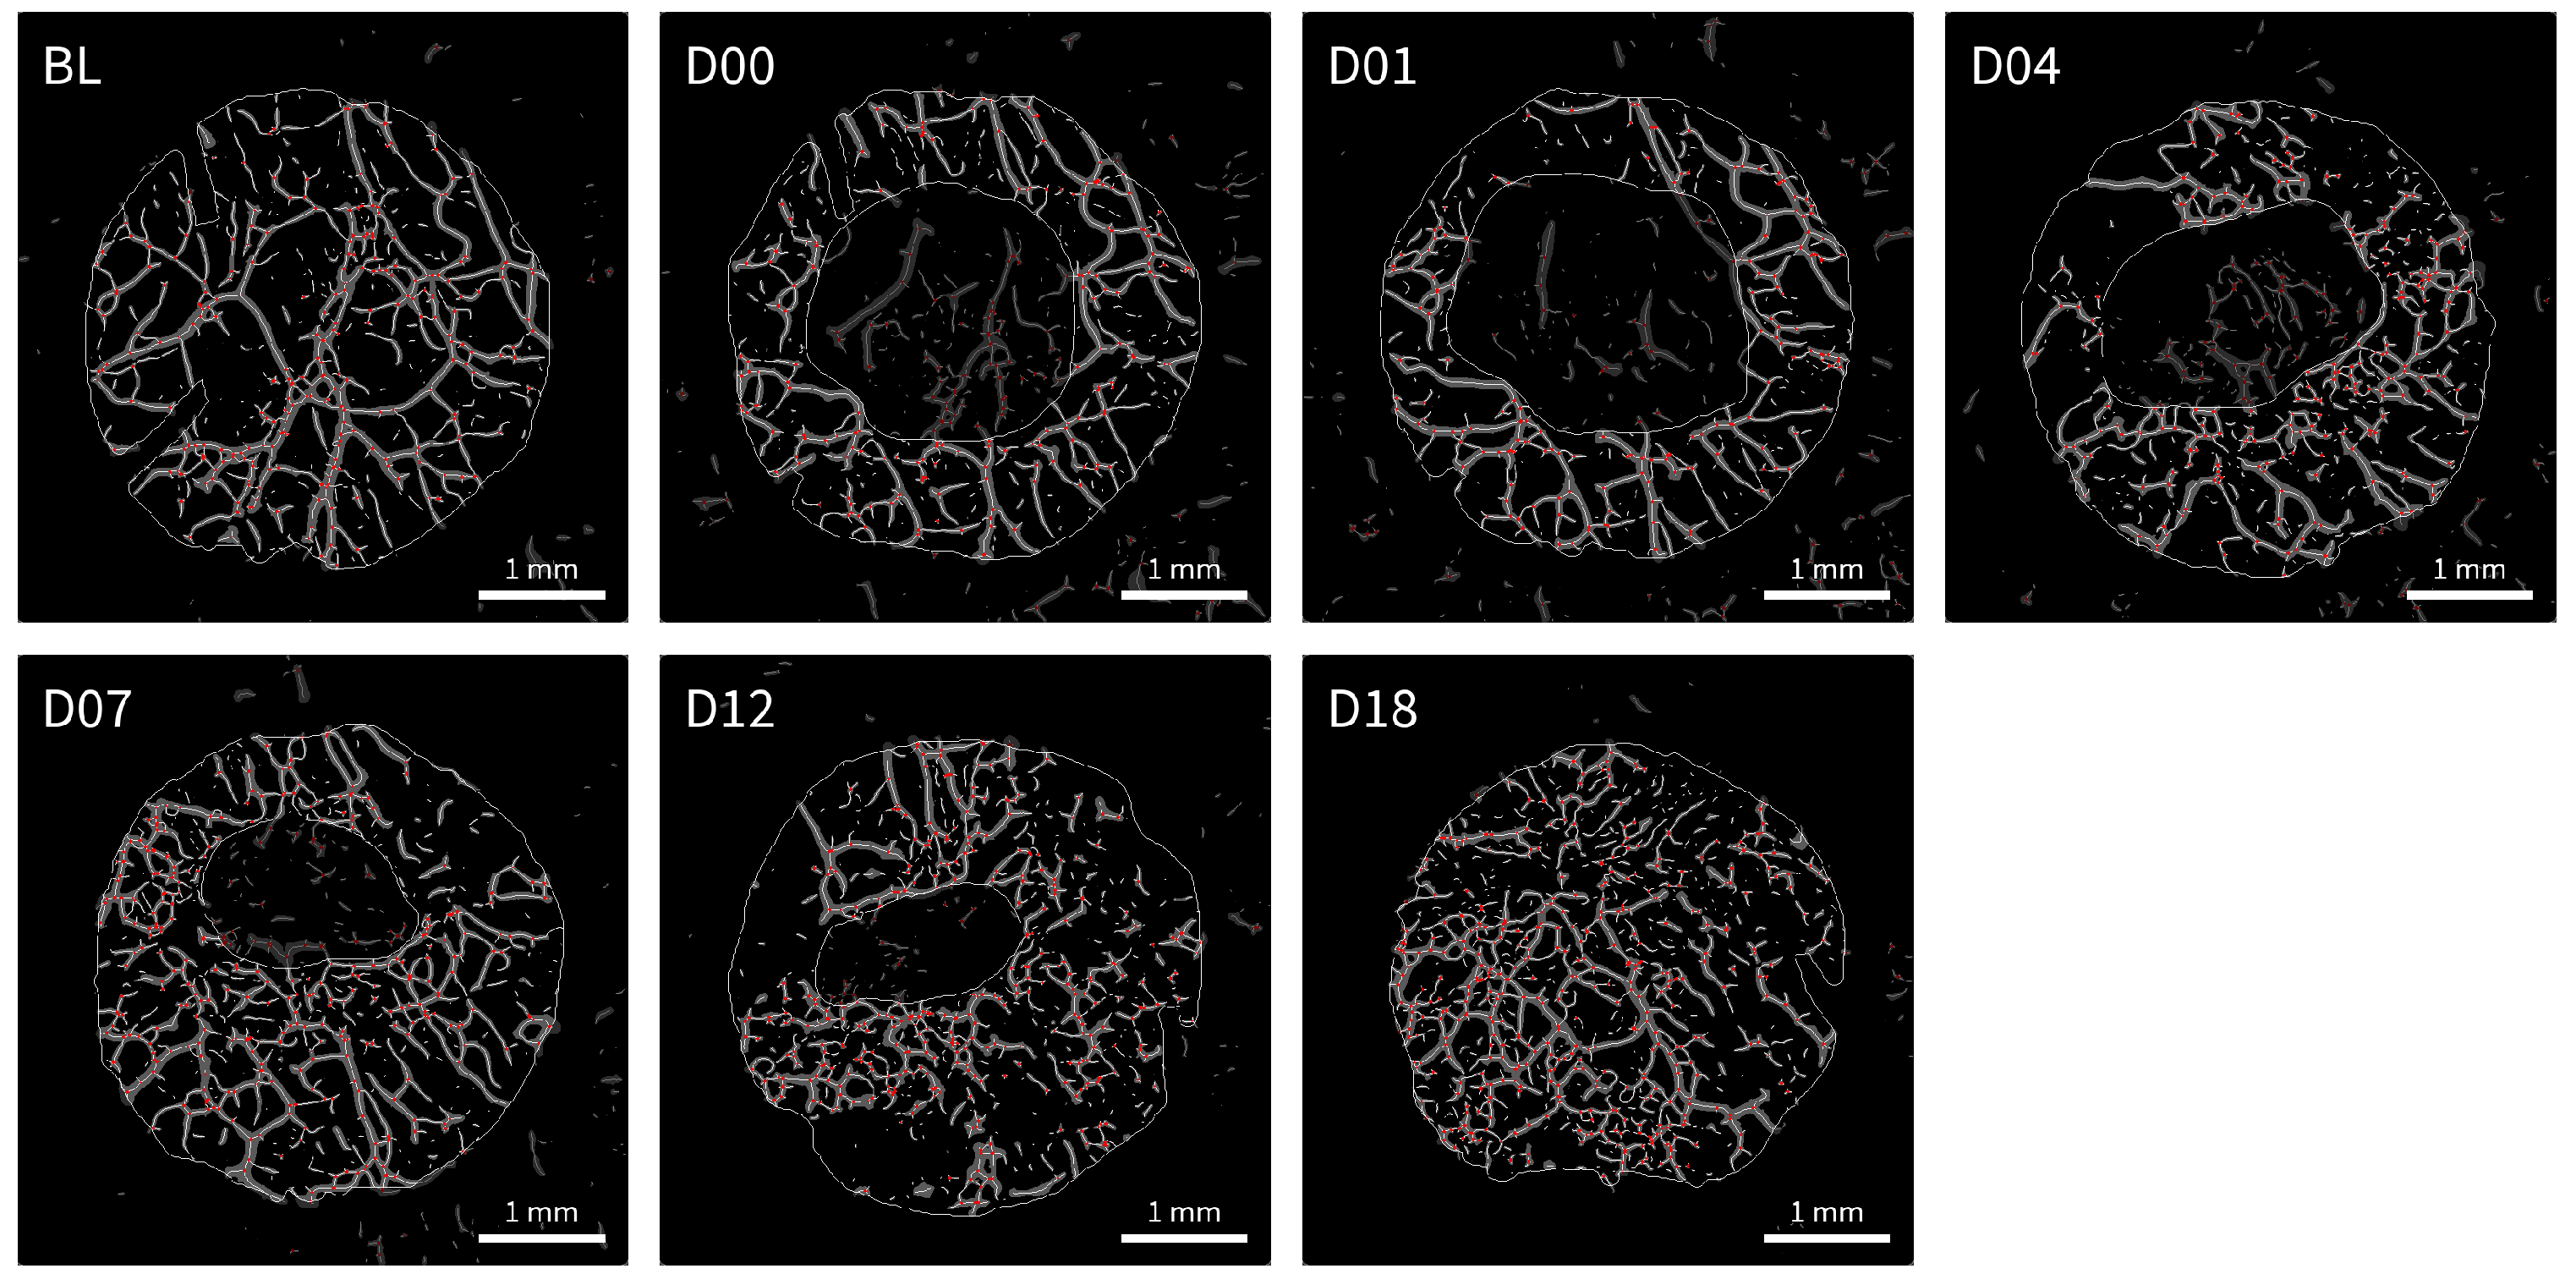
2.4. OCT Imaging and Data Processing

Volumetric OCT data sets of the wound area were acquired using a custom-built dermal swept-source OCT system. A detailed description of the OCT system can be found elsewhere [64]. The system employs an akinetic light source (Insight Photonic Solutions, Inc., Lafayette, CO, USA) operating at a central wavelength of 1322 n m with a spectral bandwidth of 62 n m . Considering the numerical aperture of the optical fiber and focal length of the scan lens (Thorlabs LSM02, f = 18   m m , Thorlabs GmbH, Bergkirchen, Germany), the system provides a lateral resolution of 13 μ m and a depth of focus of 200 μ m . Split-spectrum amplitude decorrelation [65] was used to generate the angiography images from the acquired spectral OCT data. In vivo data acquisition was performed over a rectangular skin patch covering an area of 4.86 × 4.86 m m . Imaging data was recorded with 768 A-scans per B-scan and 4 consecutive B-scans at each of 768 positions in slow scanning direction. After applying the thresholded structural image data as a mask, maximum projection of the angiography data in axial direction produced en-face angiograms with a size of 768 × 768 pixel. Binary angiograms were created by applying Sato filter of curvilinear structures [66] and contrast limited adaptive histogram equalization [67], followed by thresholding using Otsu’s method [68].
For characterization of the vascular network, four OCTA parameters were analyzed: (1) The vessel density giving the percentage of pixels that belong to vessels and being calculated from the binarized angiograms. (2) The vessel length determined from a morphological skeleton of the binarized angiogram and normalized to a skin area of 1 m m 2 . (3) The number of bifurcations in the vascular network normalized to vessel length. (4) The vessel tortuosity, sometimes also referred to as distance metric [69], which was calculated as the weighted average of the path length divided by the linear distance between the endpoints of each vessel segment. It was determined from angiograms from which the shortest vessel segments had been removed. The wound site itself was excluded from the analysis of the four vascular parameters.
Figure 1 illustrates the post-processing steps applied: In the 2D OCT angiogram (Figure 1a), the region of interest was manually marked to exclude the wound site itself and any areas covered by the splint (Figure 1b). After applying the Sato filter of curvilinear structures (Figure 1c), thresholding produced the binary angiogram (Figure 1d) that was used to calculate vessel density. Skeletonization of this binary angiogram led to the image that was evaluated for vessel length and number of bifurcations (Figure 1e). The skeletonized angiogram was cleaned from very short vessel segments (Figure 1f) before determining the vessel tortuosity.

2.5. Digital Measurement of Wound Size

Wound size progression over time was assessed from digital photographs by an experienced operator, who was blinded to animal ID and time of acquisition when determining wound size. Wound area in pixels was assessed and converted into absolute values based on a millimeter scale placed in the imaging plane next to the wound during acquisition of the pictures. Finally, the wound area was expressed as the percentage of the initial wound size. Segmentation of the wound sizes was performed using the software MITK Workbench (German Cancer Research Center, software available at http://mitk.org/, accessed on 9 March 2021).

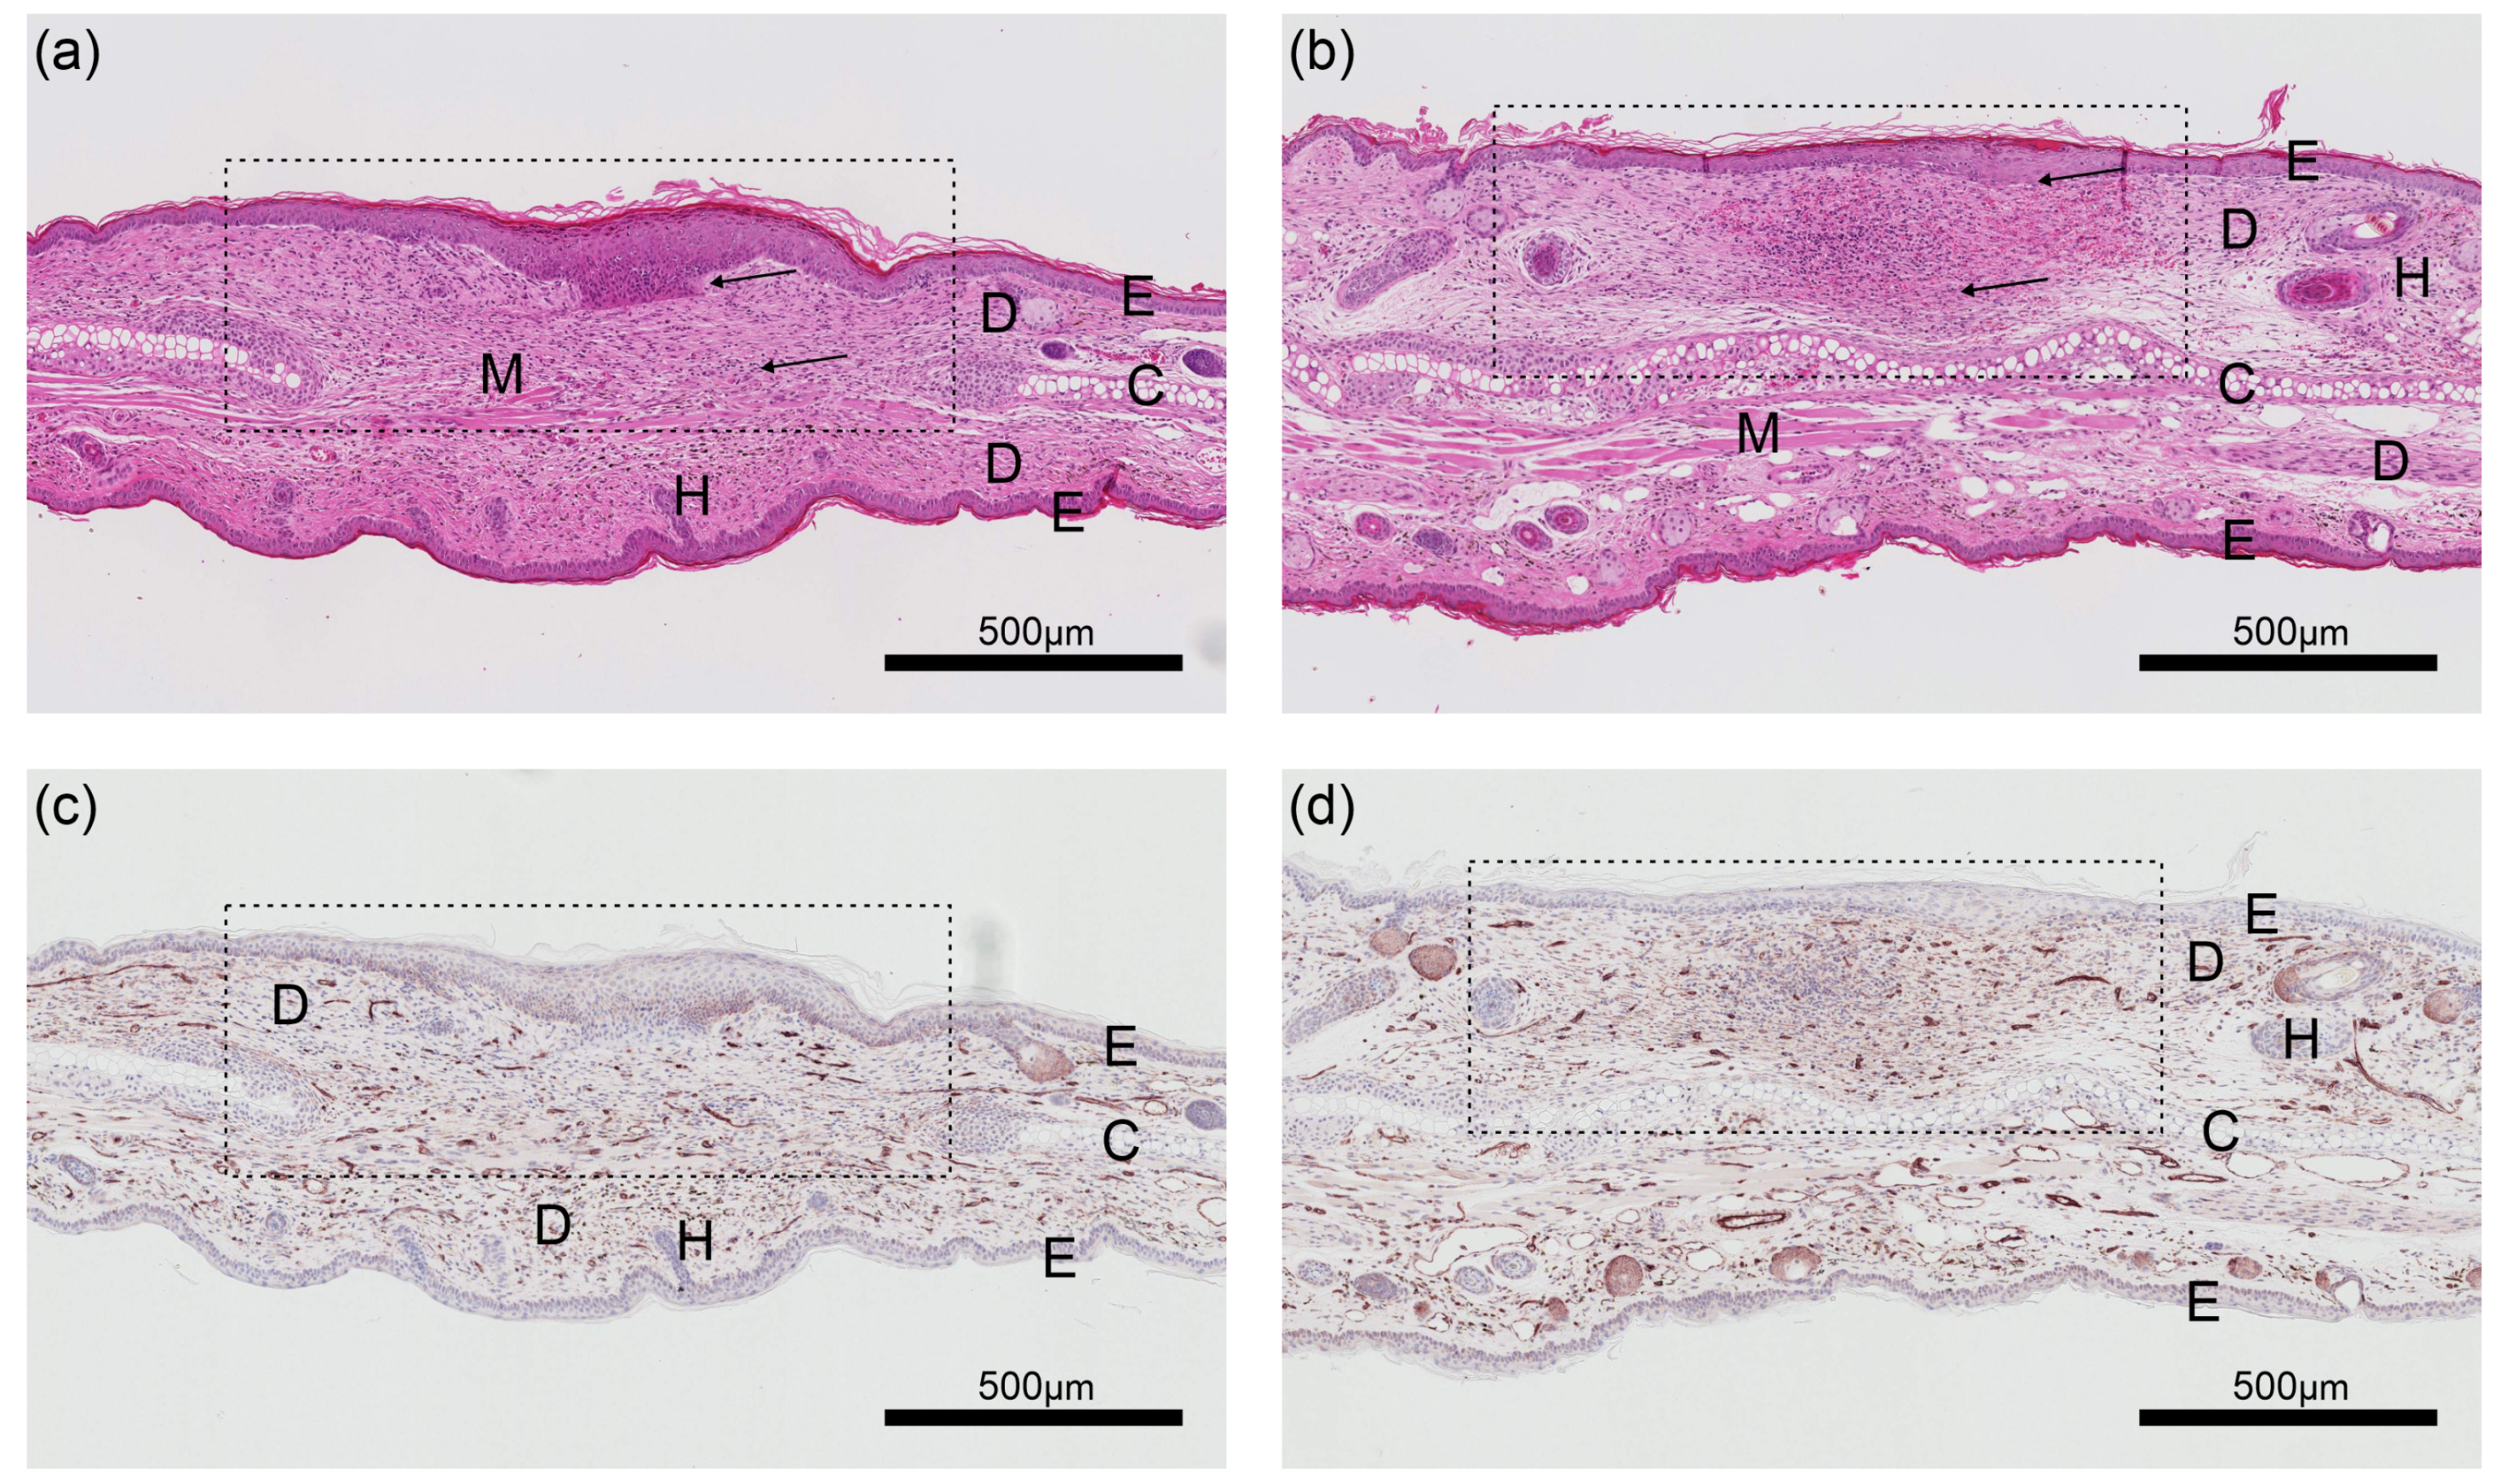
2.6. Histology and Immunohistochemistry

On day 18, tissues were harvested for histologic and IHC analysis. Ears were fixed in 4% formalin (Roti-Histofix 4%, Carl Roth GmbH + Co. KG, Karlsruhe, Germany) for 24 h and subsequently embedded in paraffin. The histological sections were stained with haematoxylin and eosin (HE). In addition, rabbit monoclonal anti-CD31 antibody (1:200, Medac GmbH, Wedel, Germany) and rabbit anti-alpha-smooth muscle actin (α-SMA) polyclonal antibody (1:150, Medac GmbH) were used for IHC. Control immunostaining was performed to verify staining and non-specific binding by excluding primary or secondary antibodies. Histology and IHC were performed at the Ludwig Boltzmann Institute for Experimental und Clinical Traumatology, Vienna, Austria. A Hamamatsu NanoZoomer 2.0 HT slide scanner (Hamamatsu Photonics Deutschland GmbH, Ammersee, Germany) was used to scan the HE slides. The histological analyses were conducted via light microscopy and by inspection of the digital slides.

2.7. Statistical Methods

To detect differences in the time course between the four study groups, a repeated measures ANOVA model was applied. A post-hoc analysis (Tukey’s honestly significant difference test) was performed to correct for multiple testing and identification of differences between specific groups and time points. Baseline values of non-diabetic and diabetic animals were compared using the independent two-sample t-test. Statistical significance was accepted at p < 0.05 for all tests. All statistical analyses were performed in SPSS (IBM SPSS Statistics, Version 26).

3. Results

Cutaneous wound healing was studied employing a mouse ear pinna model in healthy and diabetic animals. Forty-seven animals—24 non-diabetic and 23 diabetic—were included in the analysis. The premature death of one diabetic mouse led to the reduction of the group size ( n = 5 ) in the chitosan hydrogel treatment group.
To minimize wound contraction, a donut-shaped splint was sutured to the pinna with a nylon thread through six equidistant holes. Figure 2 shows an example photograph of the wound splinting with the wound at the center of the circular opening of the splint. Angiographic OCT imaging was performed before and immediately after wounding and on five additional time points within the next 18 days.
Example OCT angiograms from one non-diabetic (Figure 3a) and one diabetic mouse (Figure 3b) acquired at the different time points of the study are given in Figure 3. The top left image in Figure 3a was acquired at baseline before wounding, while the subsequent images present the angiograms immediately after wounding and 1, 4, 7, 12, and 18 days later. The circular measurement area defined by the donut-shaped ring can be easily recognized in each of the angiograms. In Figure 3b, the same timeline is depicted for the wound healing in a diabetic animal. Images provide a clear visualization of the vascular network in the mouse pinna with vessels in a size range between 20 μ m and 80 μ m .
In the angiograms shown in Figure 3a,b, various vessels of different diameters are visible within the open circular area provided by the plastic ring. The top left image (BL) shows the baseline measurement before wounding. In the next image (D00) acquired immediately after wounding, most of the vessels outside the wound area can be recognized when compared with the baseline image. At the wound site at the center, however, many predominantly small vessels belonging to the upper removed skin layers are missing. Instead, OCTA signals of deeper-lying vessels previously not visible can be seen. When comparing the image directly after wounding (D00) with the next image one day later (D01), formation of anastomoses to restore blood circulation can be observed. Images in the following days (D04 to D18) show a fine network of small vessels of various orientation formed at the wound margin and slowly closing in on the wound area. The wound site itself reveals only a weak OCTA signal that arises from vessels in deeper layers and is excluded from the calculation of the vascular parameters. The OCT angiograms were processed in order to analyze the vascular network of the investigated tissue region. Figure 4 depicts the vascular network derived from the OCT angiograms shown in Figure 3a. Here, vessels are shown in unicolor grey and the non-vessel background is black. A thin white line at the center of the vessels indicates the network graph, with red dots highlighting bifurcations.
Comparison of the vessel network parameters derived from OCTA measurements performed on the first study day before wounding revealed no significant difference between non-diabetic and diabetic animals. Data are summarized in Table 2.
Figure 5a,b show the vessel density in the ears of both non-diabetic and diabetic mice and the different study groups. In non-diabetic animals, vessel density significantly increased in the first days (D4 to D7) after wounding by 28% (fibrin group) to 45% (VEGF/PDGF group) ( p < 0.02 for all groups). Thereafter, measured values decreased again. The difference between groups’ average time courses did not reach statistical significance ( p = 0.56 ). A similar increase of 37% to 47% was also found in diabetic animals ( p < 0.005 for all groups), reaching the maximum four days after setting of the wound. After day 4, vessel density as assessed via OCTA slowly decreased with again no statistically significant difference between groups ( p = 0.34 ).
The normalized vessel length plotted in Figure 5c,d revealed a similar time course with a significant increase of 39% to 52% ( p < 0.015 for all groups) in non-diabetic and 43% to 52% ( p < 0.01 ) in diabetic animals in the first time interval of the study period. In course of wound healing, all groups showed a slow decline of vessel length values. The average time courses of the normalized vessel length did not differ significantly between groups, neither in non-diabetic ( p = 0.46 ) nor in diabetic ( p = 0.36 ) animals.
In Figure 5e,f, the number of bifurcations normalized to the vessel length for both non-diabetic and diabetic animals is plotted. A maximum number of bifurcations was detected at study day four or seven with relative increases versus baseline of 33% to 48% ( p 0.002 for all groups). Within the study period, particularly in diabetic animals, no trend towards a decrease in bifurcation numbers was observed. There was no statistically significant difference between time courses of the control and three different treatment groups ( p = 0.34 , non-diabetic animals; p = 0.20 , diabetic animals).
Figure 5g,h show the time courses of the tortuosity parameter calculated based on the OCTA data for non-diabetic and diabetic animals, respectively. In the first time interval of the study (D1 to D4), an increase of the tortuosity by 3% to 7% in non-diabetic and 4% to 8% in diabetic animals was observed. This change was statistically significant for all treatment groups ( p 0.032 ) except the VEGF/PDGF group ( p = 0.06 ) in the non-diabetic and the chitosan hydrogel group ( p = 0.06 ) in the diabetic animals. The average time courses of the tortuosity did not show a statistically significant difference for the control and the three treatment groups, neither in non-diabetic ( p = 0.37 ) nor in diabetic ( p = 0.31 ) mice.
Figure 6a,b depicts the time course of the average wound size in non-diabetic and diabetic animals and reveals a steady decline in both non-diabetic and diabetic animals and in all treatment groups and the control. At the last study day (D18), complete wound closure was observed in 11 of 24 non-diabetic and 7 of 23 diabetic animals. No statistically significant difference in the time courses of both the control and the three treatment groups was found ( p = 0.15 , non-diabetic; p = 0.91 , diabetic).
Histological specimens were obtained on the last study day 18. Example HE staining of the pinnae of one non-diabetic and one diabetic animal are depicted in Figure 7a,b, respectively, and reveal the tissue morphology with the distinct layers, that is, stratum corneum, epidermis, dermis, striated muscle fibers between the dorsal dermis and cartilage layer, and the central cartilage itself. In addition, hair follicles and sebaceous glands are visible. The images show complete re-epithelization in both the non-diabetic and the diabetic animal. Images of the CD31 staining in Figure 7c,d reveal the sprouting of CD31-positive endothelial cells into the granulation tissue. The additional presence of thrombocytes and leucocytes is indicated by a pale brown staining.
In both example images of α-SMA staining in non-diabetic and diabetic animals, a positive staining indicates the presence of smooth muscle cells limited to the granulation tissue of the wound area (Figure 8).

4. Discussion

In this report, we presented the application of a custom-built dermal OCT system for assessment of cutaneous wound healing in a mouse pinna model. In both non-diabetic and diabetic mice, quantitative OCTA parameters were evaluated in a longitudinal manner and revealed changes related to vascular remodeling during healing of the wound.
In the current study, an excisional wound was set extending through stratum corneum, epidermis and dermis to the central cartilage of the pinna. In such wounds, healing occurs from the margin of the wounds and allows assessment of various mechanisms including angiogenesis, epithelization, granulation tissue formation and tissue contraction. Compared to punch wounds, the excisional wound provided a wound bed that facilitated topical application of different test treatments and thus modeling of pharmacologic interventions in wound healing. Animal models in preclinical research aim to mimic human wound healing problems, that is, dehiscence, ischemia, ulceration, infections, and scarring [70]. Here, one has to consider that cutaneous wound healing in humans and rodents involve different mechanisms. Human wound healing happens mainly via re-epithelization and formation of granulation tissue. While both processes are also present in rodents, their dominant mechanism of wound closure is contraction. Different strategies were introduced to overcome this limitation of cutaneous wound models in rodents [70]. For example, Galiano and co-workers applied a wound splint in a dorsal wound model in mice [71]. Here, silicone splints were fixed to the dorsal skin with adhesive and nylon sutures in order to avoid wound contraction during healing. In our study, in an effort to minimize wound contraction, a donut-shaped splint was sutured to the pinna, fixating the skin at six points with the central cartilage of the ear serving as second anchor point. The usage of additional glue was omitted in order to prevent any interaction with the test substance treatments applied at each study day. Due to the high flexibility of the skin of the pinna, wound contraction could however not be entirely prevented as indicated by the positive α-SMA staining found in IHC. OCTA monitoring of dorsal wound healing in mice might be possible but may be hampered by the increased thickness of the dorsal skin as well as the denser hair coat. Proper visualization of tissue morphology and vascularization via OCT is dependent on the central wavelength of the light source and on the absorption and scattering properties of the tissue. These factors are limiting the imaging depth to 1 mm–2 mm. Alternative models such as excisional wounds in rabbit ears [72,73,74] may avoid influences by contraction. Here the skin is firmly attached to the subcutaneous tissue, thereby naturally splinting the wound. However, in addition to the slightly thicker skin, differences in costs and animal housing requirements still favor the mouse model.
In the current study, the wound surface area was quantified based on digital photographs. In both non-diabetic and diabetic animals and in all study groups, wound size gradually decreased with time with no significant difference in the time courses between the groups. At the last study day, 18 days after injury, the average wound size of all animals was found to be reduced by 87.5% compared to the initial wound size; 38% (18 out of 47 animals) revealed complete wound closure. The wound size time course indicates that re-epithelization and closure of the 1 m m excisional wound takes approximately three weeks. The OCTA parameters assessed in our study provided an insight into the vascular changes after injury and during wound healing. After setting of the excisional wound, bleeding of the injured vessels was observed. Consecutively, activated platelets adhere to the injured vessel ends and by this provide a surface for hemostasis. This, finally, leads to generation of thrombin and formation of fibrin clots stabilizing the initial platelet plug and closing of the vessel [75]. Since the mouse pinna comprises a very dense and interconnected vascular network, the perfusion of the downstream tissues is mostly maintained via anastomosis, collateral vessels, and recruitment of pre-existing capillaries. This is mirrored by the increase in the tortuosity parameter that reflects the curvature of the vessels and is considered to be larger in smaller vessels and the vessel density parameter that does not drop between the measurements directly before and immediately after injury (time point 0).
Within a few hours, the inflammatory phase with release of proinflammatory factors into the blood stream is initiated. Histamine, as one of the inflammatory agents, plays a major role in the modulation of wound healing. By causing a dilation of vessels surrounding the wound and increasing their porosity, histamine facilitates the entry of inflammatory cells into the wound site, leads to an activation of macrophages and supports angiogenesis [76,77]. The vessel dilation and capillary recruitment might be reflected by the slightly increasing OCTA parameters at the first two time points after incision, where the formation of new vessels has not yet occurred.
In order to form new healthy tissue, angiogenesis has to take place in the wound area. It is initiated by hypoxia of the tissue, inducing the expression of growth factors like VEGF by activated fibroblasts, mast cells, and macrophages. In addition, stem cells originating from the endothelium of injured vessels are attracted to the wound site by fibronectin found in the fibrin clots. In wild type animals this proliferation phase was noticed as early as day 4, with a peak at day 8–10 [75]. In our study, a strong increase in all OCTA parameters, indicating the sprouting of new capillaries into the granulation tissue, was observed between day 1 and day 4 or 7 respectively. After day 7, vessel density and vessel length reveal a descending trend while the number of bifurcations that reflects the branchings of the capillary network at the wound site and the tortuosity that is a measure for the curvature of the vessels stay almost constant. A possible explanation for this observation might reside in the mechanisms during the overlapping wound healing phases of proliferation and inflammation. Towards the end of the inflammatory phase histamine release diminishes, vasodilation declines and the newly created vessels in the granulation tissue furnish sufficient blood supply to the wound site. This also induces a partial closure of capillaries recruited during earlier phases of wound healing, as reflected by the time courses of the OCTA parameters vessel density and vessel length that show a decrease versus the peak values at days 4 and 7, respectively, and also the weak trend towards a decreasing vessel tortuosity parameter. In non-diabetic mice, a trend towards a faster decrease of vessel density and vessel length values in the VEGF/PDGF and in the chitosan hydrogel group was found, which could be indicative of a more advanced proliferative phase.
Major changes in this network are expected during the remodeling phase of wound healing that might have only been initiated within the study period of 18 days. Here, a vascular remodeling will take place, where some capillaries formed via angiogenesis grow into larger vessels while others that are no longer needed are removed by apoptosis [78,79]. This phase of wound healing was reported to last several weeks to months, depending on the type and extent of the wound [50,80].
The longitudinal in vivo assessment of quantitative imaging data poses different challenges. In vivo OCTA imaging requires the vascular bed to be precisely positioned in the focal plane of the imaging optics in order to ensure comparability of the values at different time points but also between different subjects at the same time point. In the current study, a scan lens with a focal length of 18 mm was used, providing a depth of focus of 200 μ m . As long as the vessels are resolved, parameters like vessel length and number of bifurcations are less dependent on the focus. In contrast, the evaluation of the vessel density and vessel diameter parameter require precise positioning of the ear into the focal plane, adversely affecting their quantification if placed above or below this plane. In our measurements, the tissue surrounding the wound and the central cartilage of the ear served as reference points for axial positing of the ear, while the splint allowed centering of the wound in the imaging area. Individual differences in the anatomy of the mouse ear with the curvature of the pinna and small skin folds but also the splint itself with the sutures could have led to variations in the positioning of the ear for measurement. This has to be considered both when analyzing changes between different time points and particularly when comparing the time courses of different treatment groups. Here, these variations could have caused a larger scatter of the determined values.
The present study has some limitations that are worth mentioning. Based on the assessed OCT data, no significant difference, both between treatment groups and versus control group, was detected. This could be explained as follows. When employing certain imaging modalities for assessment of new potential biomarkers, the effect size of an intervention upon this parameter is not known a priori. Since the present study was designed as a pilot study, only a relatively small sample of 6 animals per group was included. To the best of our knowledge, no quantitative, longitudinal OCTA data regarding the treatment effect of topical pharmaceutical applications for enhancement of cutaneous wound healing was available in the literature at the time the study protocol was submitted and the study was carried out. Therefore, the sample size calculation in our study was based on previous reports evaluating the wound sizes in excisional wound models in diabetic mice. Here, on day 10, a 40% reduction in wound size was detected [56]. Recently, the group of Stephen Boppart reported on the effects of an angiogenesis promoting topical treatment on the wound healing in diabetic mice employing OCTA and fluorescence lifetime imaging microscopy [81]. Seven days after injury, the authors found differences in the range of 2% to 20% (OCT parameters: vessel density, branching point density, and vessel diameter) between treatment and control group ( n = 5 per group). The same work group performed a study using multimodal imaging including OCTA in diabetic mice placed in four different groups (high concentration treatment, low concentration treatment, placebo and control; n = 6 per group) [82]. Here, authors reported OCTA branching point density in the high-concentration treatment and placebo group to be significantly higher than in control mice. Furthermore, at day 3, OCTA mean intensity in the low concentration treatment group was higher than in the control. For both parameters, no differences between the three treatments were detected. The reported time courses of the previous studies as well as our data suggest that, in order to detect significant differences for different topical treatments, larger sample sizes than the one employed in the current study are needed. This can help to reduce the effect of potential outliers due to the aforementioned experimental challenges and increase the precision of the determined OCTA parameters. Future experiments based on these data can form the basis for the definition of OCTA biomarkers applicable for an objective assessment of wound healing progression and for the planning of new studies investigating pharmacological interventions in cutaneous tissue repair.
Another aspect that could be considered a limitation of the current study is analysis of vascular network based on two-dimensional en-face projections of the OCTA data instead of the original three-dimensional data sets. The vascular tree of the mouse ear pinna is composed of a descending order of arterioles and venules [83,84,85], where the lower orders run deep in the dermis layer on both sides of the cartilage, while the higher order vessels and capillary loops occupy the superficial dermis and deep epidermis. In the current study that aimed to investigate the applicability of OCTA for tracking dermal wound healing during treatment with proangiogenic substances, a full thickness wound, extending down to the cartilage layer and removing all skin layers including the enclosed vessels, was set. Since this standardized wound was applied in all animals of all treatment groups, no bias on the study results due to the two-dimensional analysis is to be expected. However, the analysis of the three-dimensional data set can provide a more detailed insight into the angioarchitecture of the microcirculation both in preclinical research and also for the clinical assessment of wounds or lesions of the skin [38].
Regarding the clinical applicability of OCTA for dermatological applications, one must consider the previously mentioned penetration depth of a few millimeters into tissue. This allows assessment of the superficial capillary loops and the underlying capillary and vessel beds. The combination with PA imaging in a multimodal imaging system, however, can provide a full representation of the skin vasculature [86]. Here, the PA channel yields the visualization of vessels with diameters in the range of 100 μ m and larger down to a depth of 5 m m –10 m m while OCTA facilitates imaging of the superficial perfusion [87,88]. Recently, such a multimodal system has been employed for imaging and quantitative assessment of the dermal vasculature in different dermatological conditions [89].
In conclusion, we demonstrated the applicability of dermal OCTA for in vivo tracking of the dynamic changes in the vascular network after application of an excisional wound model in the mouse pinna. The high resolution of the imaging system provided an insight into adaptational changes of the microvasculature during the overlapping wound healing phases in both non-diabetic and diabetic animals. The obtained data reflected well the processes after injury during hemostatic, inflammatory, proliferative, and remodeling phases. Our results indicate that OCTA could serve as a valuable preclinical research tool for evaluating the impaired adaptational mechanisms in vascular remodeling leading to the formation of chronic wounds and for monitoring the outcome of new pharmacologic treatment strategies facilitating or enhancing wound repair after injury.

Supplementary Materials

The following are available online at https://www.mdpi.com/2076-3417/11/5/2447/s1.

Author Contributions

Conceptualization, C.H., L.S. and R.M.W.; methodology, K.S. and R.M.W.; software, M.P. and H.S.; validation, M.P., K.S. and R.M.W.; formal analysis, M.P., K.S., H.S. and R.M.W.; investigation, M.P., K.S., B.J.S., S.P. and H.S.; resources, K.S. and C.H.; data curation, M.P. and R.M.W.; writing—original draft preparation, M.P., K.S. and R.M.W.; writing—review and editing, C.H., M.M., G.G. and L.S.; visualization, M.P. and R.M.W.; supervision, L.S. and R.M.W.; funding acquisition, L.S. and R.M.W. All authors have read and agreed to the published version of the manuscript.

Funding

This research was funded by Christian Doppler Research Association, the Austrian Federal Ministry of Digital and Economic Affairs, and the National Foundation of Research, Technology and Development with grant number CD10260502.

Institutional Review Board Statement

All animal procedures in this study were approved by the local Animal Welfare Committee of the Medical University of Vienna and the Federal Ministry of Science, Research, and Economy (GZ 66.009/0248-WF/V/3b/2018, GZ 66.009/0396-WF/V/3b/2019). All experiments were performed in full accordance with all relevant regulations and the ARRIVE guidelines [90].

Informed Consent Statement

Not applicable.

Data Availability Statement

The data presented in this study are available in Supplementary Material.

Acknowledgments

We thank Nicolas Binder for his support with the histological evaluation.

Conflicts of Interest

C.H. is employed by Croma Pharma GmbH. All other authors declare no conflict of interest. The funders had no role in the design of the study; in the collection, analyses, or interpretation of data; in the writing of the manuscript, or in the decision to publish the results.

References

  1. Nussbaum, S.R.; Carter, M.J.; Fife, C.E.; DaVanzo, J.; Haught, R.; Nusgart, M.; Cartwright, D. An Economic Evaluation of the Impact, Cost, and Medicare Policy Implications of Chronic Nonhealing Wounds. Value Health 2018, 21, 27–32. [Google Scholar] [CrossRef] [Green Version]
  2. Morley, R.L.; Sharma, A.; Horsch, A.D.; Hinchliffe, R.J. Peripheral Artery Disease. BMJ 2018, j5842. [Google Scholar] [CrossRef] [Green Version]
  3. Bolton, L. Peripheral Arterial Disease: Scoping Review of Patient-Centred Outcomes. Int. Wound J. 2019, 16, 1521–1532. [Google Scholar] [CrossRef]
  4. Eberhardt, R.T.; Raffetto, J.D. Chronic Venous Insufficiency. Circulation 2014, 130, 333–346. [Google Scholar] [CrossRef]
  5. Baltzis, D.; Eleftheriadou, I.; Veves, A. Pathogenesis and Treatment of Impaired Wound Healing in Diabetes Mellitus: New Insights. Adv. Ther. 2014, 31, 817–836. [Google Scholar] [CrossRef]
  6. Zhao, R.; Liang, H.; Clarke, E.; Jackson, C.; Xue, M. Inflammation in Chronic Wounds. Int. J. Mol. Sci. 2016, 17, 2085. [Google Scholar] [CrossRef]
  7. Phillips, C.J.; Humphreys, I.; Fletcher, J.; Harding, K.; Chamberlain, G.; Macey, S. Estimating the costs associated with the management of patients with chronic wounds using linked routine data. Int. Wound J. 2015, 13, 1193–1197. [Google Scholar] [CrossRef] [PubMed]
  8. Guest, J.F.; Ayoub, N.; McIlwraith, T.; Uchegbu, I.; Gerrish, A.; Weidlich, D.; Vowden, K.; Vowden, P. Health economic burden that wounds impose on the National Health Service in the UK. BMJ Open 2015, 5, e009283. [Google Scholar] [CrossRef] [PubMed] [Green Version]
  9. Heyer, K.; Herberger, K.; Protz, K.; Glaeske, G.; Augustin, M. Epidemiology of chronic wounds in Germany: Analysis of statutory health insurance data. Wound Repair Regen. 2016, 24, 434–442. [Google Scholar] [CrossRef] [PubMed]
  10. Frykberg, R.G.; Banks, J. Challenges in the Treatment of Chronic Wounds. Adv. Wound Care 2015, 4, 560–582. [Google Scholar] [CrossRef] [Green Version]
  11. Machado, M.J.; Watson, M.G.; Devlin, A.H.; Chaplain, M.A.; Mcdougall, S.R.; Mitchell, C.A. Dynamics of Angiogenesis During Wound Healing: A Coupled In Vivo and In Silico Study. Microcirculation 2011, 18, 183–197. [Google Scholar] [CrossRef]
  12. Kolte, D.; McClung, J.A.; Aronow, W.S. Vasculogenesis and Angiogenesis. In Translational Research in Coronary Artery Disease; Academic Press: Boston, MA, USA, 2016; Chapter 6; pp. 49–55. [Google Scholar] [CrossRef]
  13. Jung, Y.; Dziennis, S.; Zhi, Z.; Reif, R.; Zheng, Y.; Wang, R.K. Tracking Dynamic Microvascular Changes during Healing after Complete Biopsy Punch on the Mouse Pinna Using Optical Microangiography. PLoS ONE 2013, 8, e57976. [Google Scholar] [CrossRef]
  14. Singer, A.J.; Clark, R.A. Cutaneous Wound Healing. N. Engl. J. Med. 1999, 341, 738–746. [Google Scholar] [CrossRef] [PubMed]
  15. Baum, C.L.; Arpey, C.J. Normal Cutaneous Wound Healing: Clinical Correlation with Cellular and Molecular Events. Dermatol. Surg. 2006, 31, 674–686. [Google Scholar] [CrossRef]
  16. Masson-Meyers, D.S.; Andrade, T.A.M.; Caetano, G.F.; Guimaraes, F.R.; Leite, M.N.; Leite, S.N.; Frade, M.A.C. Experimental models and methods for cutaneous wound healing assessment. Int. J. Exp. Path. 2020, 101, 21–37. [Google Scholar] [CrossRef]
  17. Abramovitch, R.; Frenkiel, D.; Neeman, M. Analysis of subcutaneous angiogenesis by gradient echo magnetic resonance imaging. Magn. Reson. Med. 1998, 39, 813–824. [Google Scholar] [CrossRef]
  18. Helbich, T.H.; Roberts, T.P.; Rollins, M.D.; Shames, D.M.; Turetschek, K.; Hopf, H.W.; Mühler, M.; Hunt, T.K.; Brasch, R.C. Noninvasive Assessment of Wound-Healing Angiogenesis with Contrast-Enhanced MRI. Acad. Radiol. 2002, 9, S145–S147. [Google Scholar] [CrossRef]
  19. Nebuloni, L.; Kuhn, G.A.; Vogel, J.; Müller, R. A Novel In Vivo Vascular Imaging Approach for Hierarchical Quantification of Vasculature Using Contrast Enhanced Micro-Computed Tomography. PLoS ONE 2014, 9, e86562. [Google Scholar] [CrossRef] [PubMed]
  20. Urao, N.; Okonkwo, U.A.; Fang, M.M.; Zhuang, Z.W.; Koh, T.J.; DiPietro, L.A. MicroCT angiography detects vascular formation and regression in skin wound healing. Microvasc. Res. 2016, 106, 57–66. [Google Scholar] [CrossRef] [Green Version]
  21. Caresio, C.; Caballo, M.; Deandrea, M.; Garberoglio, R.; Mormile, A.; Rossetto, R.; Limone, P.; Molinari, F. Quantitative analysis of thyroid tumors vascularity: A comparison between 3-D contrast-enhanced ultrasound and 3-D Power Doppler on benign and malignant thyroid nodules. Med. Phys. 2018, 45, 3173–3184. [Google Scholar] [CrossRef] [PubMed] [Green Version]
  22. Panfilova, A.; Shelton, S.E.; Caresio, C.; van Sloun, R.J.; Molinari, F.; Wijkstra, H.; Dayton, P.A.; Mischi, M. On the Relationship between Dynamic Contrast-Enhanced Ultrasound Parameters and the Underlying Vascular Architecture Extracted from Acoustic Angiography. Ultrasound Med. Biol. 2019, 45, 539–548. [Google Scholar] [CrossRef] [PubMed]
  23. Newsome, I.G.; Dayton, P.A. Visualization of Microvascular Angiogenesis Using Dual-Frequency Contrast-Enhanced Acoustic Angiography: A Review. Ultrasound Med. Biol. 2020, 46, 2625–2635. [Google Scholar] [CrossRef]
  24. Hu, S.; Maslov, K.; Wang, L.V. In vivo functional chronic imaging of a small animal model using optical-resolution photoacoustic microscopy. Med. Phys. 2009, 36, 2320–2323. [Google Scholar] [CrossRef] [PubMed] [Green Version]
  25. Liu, M.; Drexler, W. Optical coherence tomography angiography and photoacoustic imaging in dermatology. Photochem. Photobiol. Sci. 2019, 18, 945–962. [Google Scholar] [CrossRef]
  26. Sun, M.; Li, C.; Chen, N.; Zhao, H.; Ma, L.; Liu, C.; Shen, Y.; Lin, R.; Gong, X. Full three-dimensional segmentation and quantification of tumor vessels for photoacoustic images. Photoacoustics 2020, 20, 100212. [Google Scholar] [CrossRef] [PubMed]
  27. Meiburger, K.M.; Nam, S.Y.; Chung, E.; Suggs, L.J.; Emelianov, S.Y.; Molinari, F. Skeletonization algorithm-based blood vessel quantification usingin vivo3D photoacoustic imaging. Phys. Med. Biol. 2016, 61, 7994–8009. [Google Scholar] [CrossRef] [PubMed]
  28. Zhang, W.; Ma, H.; Cheng, Z.; Wang, Z.; Zhang, L.; Yang, S. Miniaturized photoacoustic probe for in vivo imaging of subcutaneous microvessels within human skin. Quant. Imaging Med. Surg. 2019, 9, 807. [Google Scholar] [CrossRef] [PubMed]
  29. Zhang, H.F.; Maslov, K.; Stoica, G.; Wang, L.V. Functional photoacoustic microscopy for high-resolution and noninvasive in vivo imaging. Nat. Biotechnol. 2006, 24, 848–851. [Google Scholar] [CrossRef]
  30. Wang, R.K.; Jacques, S.L.; Ma, Z.; Hurst, S.; Hanson, S.R.; Gruber, A. Three dimensional optical angiography. Opt. Express 2007, 15, 4083. [Google Scholar] [CrossRef]
  31. Rabiolo, A.; Carnevali, A.; Bandello, F.; Querques, G. Optical coherence tomography angiography: Evolution or revolution? Expert Rev. Ophthalmol. 2016, 11, 243–245. [Google Scholar] [CrossRef] [Green Version]
  32. Spaide, R.F.; Fujimoto, J.G.; Waheed, N.K.; Sadda, S.R.; Staurenghi, G. Optical Coherence Tomography Angiography. Prog. Retin. Eye Res. 2018, 64, 1–55. [Google Scholar] [CrossRef] [PubMed]
  33. Bandello, F.; Corbelli, E.; Carnevali, A.; Pierro, L.; Querques, G. Optical Coherence Tomography Angiography of Diabetic Retinopathy. In Developments in Ophthalmology; S. Karger AG: Basel, Switzerland, 2016; pp. 107–112. [Google Scholar] [CrossRef]
  34. Tey, K.Y.; Teo, K.; Tan, A.C.S.; Devarajan, K.; Tan, B.; Tan, J.; Schmetterer, L.; Ang, M. Optical coherence tomography angiography in diabetic retinopathy: A review of current applications. Eye Vis. 2019, 6. [Google Scholar] [CrossRef] [PubMed]
  35. Cicinelli, M.V.; Rabiolo, A.; Sacconi, R.; Carnevali, A.; Querques, L.; Bandello, F.; Querques, G. Optical Coherence Tomography Angiography in Dry Age-Related Macular Degeneration. Surv. Ophthalmol. 2017, 63, 236–244. [Google Scholar] [CrossRef] [PubMed]
  36. Schneider, E.W.; Fowler, S.C. Optical Coherence Tomography Angiography in the Management of Age-Related Macular Degeneration. Curr. Opin. Ophthalmol. 2018, 29, 217–225. [Google Scholar] [CrossRef] [PubMed]
  37. Themstrup, L.; Carvalho, N.D.; Nielsen, S.M.; Olsen, J.; Ciardo, S.; Schuh, S.; Nørnberg, B.M.H.; Welzel, J.; Ulrich, M.; Pellacani, G.; et al. In vivo differentiation of common basal cell carcinoma subtypes by microvascular and structural imaging using dynamic optical coherence tomography. Exp. Dermatol. 2018, 27, 156–165. [Google Scholar] [CrossRef] [PubMed]
  38. Meiburger, K.M.; Chen, Z.; Sinz, C.; Hoover, E.; Minneman, M.; Ensher, J.; Kittler, H.; Leitgeb, R.A.; Drexler, W.; Liu, M. Automatic skin lesion area determination of basal cell carcinoma using optical coherence tomography angiography and a skeletonization approach: Preliminary results. J. Biophotonics 2019, 12. [Google Scholar] [CrossRef] [PubMed]
  39. Gubarkova, E.V.; Feldchtein, F.I.; Zagaynova, E.V.; Gamayunov, S.V.; Sirotkina, M.A.; Sedova, E.S.; Kuznetsov, S.S.; Moiseev, A.A.; Matveev, L.A.; Zaitsev, V.Y.; et al. Optical coherence angiography for pre-treatment assessment and treatment monitoring following photodynamic therapy: A basal cell carcinoma patient study. Sci. Rep. 2019, 9. [Google Scholar] [CrossRef]
  40. Lindblad, W.J. Considerations for selecting the correct animal model for dermal wound-healing studies. J. Biomater. Sci. Polym. Ed. 2008, 19, 1087–1096. [Google Scholar] [CrossRef]
  41. Wong, V.W.; Sorkin, M.; Glotzbach, J.P.; Longaker, M.T.; Gurtner, G.C. Surgical Approaches to Create Murine Models of Human Wound Healing. J. Biomed. Biotechnol. 2011, 2011, 1–8. [Google Scholar] [CrossRef]
  42. Parnell, L.K.; Volk, S.W. The Evolution of Animal Models in Wound Healing Research: 1993–2017. Adv. Wound Care 2019, 8, 692–702. [Google Scholar] [CrossRef]
  43. Ansell, D.M.; Campbell, L.; Thomason, H.A.; Brass, A.; Hardman, M.J. A statistical analysis of murine incisional and excisional acute wound models. Wound Repair Regen. 2014, 22, 281–287. [Google Scholar] [CrossRef] [PubMed] [Green Version]
  44. Gerber, P.A.; Buhren, B.A.; Schrumpf, H.; Homey, B.; Zlotnik, A.; Hevezi, P. The top skin-associated genes: A comparative analysis of human and mouse skin transcriptomes. Biol. Chem. 2014, 395, 577–591. [Google Scholar] [CrossRef]
  45. Monaco, G.; van Dam, S.; Ribeiro, J.L.C.N.; Larbi, A.; de Magalhães, J.P. A comparison of human and mouse gene co-expression networks reveals conservation and divergence at the tissue, pathway and disease levels. BMC Evol. Biol. 2015, 15, 259. [Google Scholar] [CrossRef] [PubMed] [Green Version]
  46. Mestas, J.; Hughes, C.C.W. Of Mice and Not Men: Differences between Mouse and Human Immunology. J. Immunol. 2004, 172, 2731–2738. [Google Scholar] [CrossRef] [PubMed] [Green Version]
  47. Zomer, H.D.; Trentin, A.G. Skin wound healing in humans and mice: Challenges in translational research. J. Dermatol. Sci. 2018, 90, 3–12. [Google Scholar] [CrossRef] [Green Version]
  48. Eming, S.A.; Martin, P.; Tomic-Canic, M. Wound repair and regeneration: Mechanisms, signaling, and translation. Sci. Transl. Med. 2014, 6, 265sr6. [Google Scholar] [CrossRef] [Green Version]
  49. Chen, L.; Mirza, R.; Kwon, Y.; DiPietro, L.A.; Koh, T.J. The murine excisional wound model: Contraction revisited. Wound Repair Regen. 2015, 23, 874–877. [Google Scholar] [CrossRef] [Green Version]
  50. Yousefi, S.; Qin, J.; Dziennis, S.; Wang, R.K. Assessment of microcirculation dynamics during cutaneous wound healing phasesin vivousing optical microangiography. J. Biomed. Opt 2014, 19, 076015. [Google Scholar] [CrossRef] [Green Version]
  51. Wang, H.; Shi, L.; Qin, J.; Yousefi, S.; Li, Y.; Wang, R.K. Multimodal optical imaging can reveal changes in microcirculation and tissue oxygenation during skin wound healing. Lasers Surg. Med. 2014, 46, 470–478. [Google Scholar] [CrossRef] [Green Version]
  52. Sharma, P.; Kumawat, J.; Kumar, S.; Sahu, K.; Verma, Y.; Gupta, P.K.; Rao, K.D. Feasibility of speckle variance OCT for imaging cutaneous microvasculature regeneration during healing of wounds in diabetic mice. Laser Phys. 2018, 28, 025601. [Google Scholar] [CrossRef]
  53. Gong, P.; Es’haghian, S.; Wood, F.M.; Sampson, D.D.; McLaughlin, R.A. Optical Coherence Tomography Angiography for Longitudinal Monitoring of Vascular Changes in Human Cutaneous Burns. Exp. Dermatol. 2016, 25, 722–724. [Google Scholar] [CrossRef] [Green Version]
  54. Deegan, A.J.; Wang, W.; Men, S.; Li, Y.; Song, S.; Xu, J.; Wang, R.K. Optical Coherence Tomography Angiography Monitors Human Cutaneous Wound Healing over Time. Quant. Imaging Med. Surg. 2018, 8, 135–150. [Google Scholar] [CrossRef] [PubMed] [Green Version]
  55. Holmes, J.; Schuh, S.; Bowling, F.L.; Mani, R.; Welzel, J. Dynamic Optical Coherence Tomography Is a New Technique for Imaging Skin Around Lower Extremity Wounds. Int. J. Low. Extrem. Wounds 2019, 18, 65–74. [Google Scholar] [CrossRef] [PubMed]
  56. Galiano, R.D.; Tepper, O.M.; Pelo, C.R.; Bhatt, K.A.; Callaghan, M.; Bastidas, N.; Bunting, S.; Steinmetz, H.G.; Gurtner, G.C. Topical Vascular Endothelial Growth Factor Accelerates Diabetic Wound Healing through Increased Angiogenesis and by Mobilizing and Recruiting Bone Marrow-Derived Cells. Am. J. Pathol. 2004, 164, 1935–1947. [Google Scholar] [CrossRef] [Green Version]
  57. Saaristo, A.; Tammela, T.; Fārkkilā, A.; Kärkkäinen, M.; Suominen, E.; Yla-Herttuala, S.; Alitalo, K. Vascular Endothelial Growth Factor-C Accelerates Diabetic Wound Healing. Am. J. Pathol. 2006, 169, 1080–1087. [Google Scholar] [CrossRef] [Green Version]
  58. Greenhalgh, D.; Sprugel, K.; Murray, M.; Ross, R. PDGF and FGF stimulate wound healing in the genetically diabetic mouse. Am. J. Pathol. 1990, 136, 1235–1246. [Google Scholar] [PubMed]
  59. Boateng, J.S.; Matthews, K.H.; Stevens, H.N.; Eccleston, G.M. Wound Healing Dressings and Drug Delivery Systems: A Review. J. Pharm. Sci. 2008, 97, 2892–2923. [Google Scholar] [CrossRef]
  60. Ueno, H.; Mori, T.; Fujinaga, T. Topical formulations and wound healing applications of chitosan. Adv. Drug Deliv. Rev. 2001, 52, 105–115. [Google Scholar] [CrossRef]
  61. Dai, T.; Tanaka, M.; Huang, Y.Y.; Hamblin, M.R. Chitosan preparations for wounds and burns: Antimicrobial and wound-healing effects. Expert Rev. Anti Infect. Ther. 2011, 9, 857–879. [Google Scholar] [CrossRef]
  62. Michaels, J.; Churgin, S.S.; Blechman, K.M.; Greives, M.R.; Aarabi, S.; Galiano, R.D.; Gurtner, G.C. db/db mice exhibit severe wound-healing impairments compared with other murine diabetic strains in a silicone-splinted excisional wound model. Wound Repair Regen. 2007, 15, 665–670. [Google Scholar] [CrossRef]
  63. Rege, A.; Thakor, N.V.; Rhie, K.; Pathak, A.P. In vivo laser speckle imaging reveals microvascular remodeling and hemodynamic changes during wound healing angiogenesis. Angiogenesis 2011, 15, 87–98. [Google Scholar] [CrossRef]
  64. Pfister, M.; Schützenberger, K.; Pfeiffenberger, U.; Messner, A.; Chen, Z.; dos Santos, V.A.; Puchner, S.; Garhöfer, G.; Schmetterer, L.; Gröschl, M.; et al. Automated segmentation of dermal fillers in OCT images of mice using convolutional neural networks. Biomed. Opt. Express 2019, 10, 1315. [Google Scholar] [CrossRef]
  65. Jia, Y.; Tan, O.; Tokayer, J.; Potsaid, B.; Wang, Y.; Liu, J.J.; Kraus, M.F.; Subhash, H.; Fujimoto, J.G.; Hornegger, J.; et al. Split-spectrum amplitude-decorrelation angiography with optical coherence tomography. Opt. Express 2012, 20, 4710. [Google Scholar] [CrossRef] [Green Version]
  66. Sato, Y.; Nakajima, S.; Shiraga, N.; Atsumi, H.; Yoshida, S.; Koller, T.; Gerig, G.; Kikinis, R. Three-dimensional multi-scale line filter for segmentation and visualization of curvilinear structures in medical images. Med. Image Anal. 1998, 2, 143–168. [Google Scholar] [CrossRef]
  67. Pizer, S.M.; Amburn, E.P.; Austin, J.D.; Cromartie, R.; Geselowitz, A.; Greer, T.; ter Haar Romeny, B.; Zimmerman, J.B.; Zuiderveld, K. Adaptive histogram equalization and its variations. Comput. Vis. Graph. Image Process. 1987, 39, 355–368. [Google Scholar] [CrossRef]
  68. Otsu, N. A Threshold Selection Method from Gray-Level Histograms. IEEE Trans. Syst. Man Cybern. 1979, 9, 62–66. [Google Scholar] [CrossRef] [Green Version]
  69. Bullitt, E.; Gerig, G.; Pizer, S.; Lin, W.; Aylward, S. Measuring tortuosity of the intracerebral vasculature from MRA images. IEEE Trans. Med. Imaging 2003, 22, 1163–1171. [Google Scholar] [CrossRef] [PubMed] [Green Version]
  70. Davidson, J.M. Animal models for wound repair. Arch. Dermatol. Res. 1998, 290, S1–S11. [Google Scholar] [CrossRef] [PubMed]
  71. Galiano, R.D.; Joseph Michaels, V.; Dobryansky, M.; Levine, J.P.; Gurtner, G.C. Quantitative and reproducible murine model of excisional wound healing. Wound Repair Regen. 2004, 12, 485–492. [Google Scholar] [CrossRef] [PubMed]
  72. Chen, E.A. Acceleration of Wound Healing With Topically Applied Deoxyribonucleosides. Arch. Surg. 1999, 134, 520–525. [Google Scholar] [CrossRef] [Green Version]
  73. Qian, L.W.; Fourcaudot, A.B.; Leung, K.P. Silver Sulfadiazine Retards Wound Healing and Increases Hypertrophic Scarring in a Rabbit Ear Excisional Wound Model. J. Burn Care Res. 2017, 38, e418–e422. [Google Scholar] [CrossRef] [PubMed]
  74. Breen, A.; Redmond, G.M.; Dockery, P.; O’Brien, T.; Pandit, A. Assessment of Wound Healing in the Alloxan-Induced Diabetic Rabbit Ear Model. J. Investig. Surg. 2008, 21, 261–269. [Google Scholar] [CrossRef] [PubMed]
  75. Monroe, D.M.; Hoffman, M. The clotting system—A major player in wound healing. Haemophilia 2012, 18, 11–16. [Google Scholar] [CrossRef] [PubMed]
  76. Numata, Y.; Terui, T.; Okuyama, R.; Hirasawa, N.; Sugiura, Y.; Miyoshi, I.; Watanabe, T.; Kuramasu, A.; Tagami, H.; Ohtsu, H. The Accelerating Effect of Histamine on the Cutaneous Wound-Healing Process Through the Action of Basic Fibroblast Growth Factor. J. Investig. Dermatol. 2006, 126, 1403–1409. [Google Scholar] [CrossRef] [PubMed] [Green Version]
  77. Ashina, K.; Tsubosaka, Y.; Nakamura, T.; Omori, K.; Kobayashi, K.; Hori, M.; Ozaki, H.; Murata, T. Histamine Induces Vascular Hyperpermeability by Increasing Blood Flow and Endothelial Barrier Disruption In Vivo. PLoS ONE 2015, 10, e0132367. [Google Scholar] [CrossRef] [PubMed]
  78. de Oliveira Gonzalez, A.C.; Costa, T.F.; de Araújo Andrade, Z.; Medrado, A.R.A.P. Wound healing—A literature review. An. Bras. Dermatol. 2016, 91, 614–620. [Google Scholar] [CrossRef] [Green Version]
  79. Greenhalgh, D.G. The role of apoptosis in wound healing. Int. J. Biochem. Cell Biol. 1998, 30, 1019–1030. [Google Scholar] [CrossRef]
  80. Cañedo-Dorantes, L.; Cañedo-Ayala, M. Skin Acute Wound Healing: A Comprehensive Review. Int. J. Inflamm. 2019, 2019, 1–15. [Google Scholar] [CrossRef]
  81. Li, J.; Bower, A.J.; Arp, Z.; Olson, E.J.; Holland, C.; Chaney, E.J.; Marjanovic, M.; Pande, P.; Alex, A.; Boppart, S.A. Investigating the healing mechanisms of an angiogenesis-promoting topical treatment for diabetic wounds using multimodal microscopy. J. Biophotonics 2017, 11, e201700195. [Google Scholar] [CrossRef]
  82. Rico-Jimenez, J.; Lee, J.H.; Alex, A.; Musaad, S.; Chaney, E.; Barkalifa, R.; Olson, E.; Adams, D.; Marjanovic, M.; Arp, Z.; et al. Non-Invasive Monitoring of Pharmacodynamics during the Skin Wound Healing Process Using Multimodal Optical Microscopy. BMJ Open Diabetes Res. Care 2020, 8, e000974. [Google Scholar] [CrossRef] [Green Version]
  83. Eriksson, E.; Boykin, J.V.; Pittman, R.N. Method for in vivo microscopy of the cutaneous microcirculation of the hairless mouse ear. Microvasc. Res. 1980, 19, 374–379. [Google Scholar] [CrossRef]
  84. Barker, J.H.; Hammersen, F.; Bondar, I.; Uhl, E.; Galla, T.J.; Menger, M.D.; Messmer, K. The Hairless Mouse Ear for in Vivo Studies of Skin Microcirculation. Plast. Reconstr. Surg. 1989, 83, 948–959. [Google Scholar] [CrossRef]
  85. Barker, J.; Frank, J.; Bidiwala, S.; Stengel, C.; Carroll, S.; Carroll, C.; Aalst, V.V.; Anderson, G. An animal model to study microcirculatory changes associated with vascular delay. Br. J. Plast. Surg. 1999, 52, 133–142. [Google Scholar] [CrossRef] [PubMed]
  86. Leitgeb, R.A.; Baumann, B. Multimodal Optical Medical Imaging Concepts Based on Optical Coherence Tomography. Front. Phys. 2018, 6. [Google Scholar] [CrossRef]
  87. Zabihian, B.; Chen, Z.; Rank, E.; Sinz, C.; Bonesi, M.; Sattmann, H.; Ensher, J.R.; Minneman, M.P.; Hoover, E.E.; Weingast, J.; et al. Comprehensive vascular imaging using optical coherence tomography-based angiography and photoacoustic tomography. J. Biomed. Opt. 2016, 21, 1. [Google Scholar] [CrossRef] [PubMed]
  88. Liu, M.; Chen, Z.; Zabihian, B.; Sinz, C.; Zhang, E.; Beard, P.C.; Ginner, L.; Hoover, E.; Minneman, M.P.; Leitgeb, R.A.; et al. Combined multi-modal photoacoustic tomography, optical coherence tomography (OCT) and OCT angiography system with an articulated probe for in vivo human skin structure and vasculature imaging. Biomed. Opt. Express 2016, 7, 3390. [Google Scholar] [CrossRef] [PubMed]
  89. Chen, Z.; Rank, E.; Meiburger, K.M.; Sinz, C.; Hodul, A.; Zhang, E.; Hoover, E.; Minneman, M.; Ensher, J.; Beard, P.C.; et al. Non-invasive multimodal optical coherence and photoacoustic tomography for human skin imaging. Sci. Rep. 2017, 7. [Google Scholar] [CrossRef] [PubMed]
  90. Kilkenny, C.; Browne, W.J.; Cuthill, I.C.; Emerson, M.; Altman, D.G. Improving Bioscience Research Reporting: The ARRIVE Guidelines for Reporting Animal Research. PLoS Biol. 2010, 8, e1000412. [Google Scholar] [CrossRef]
Figure 1. Post-processing of the optical coherence tomography angiograms. (a) Original OCT angiogram. (b) Region of interest with excluded wound area and image area covered by the plastic ring. (c) Angiogram after application of the Sato filter of curvilinear structures. (d) Thresholded angiogram. (e) Angiogram after skeletonization. (f) Skeletonized angiogram after removal of short vessel segments as used for calculating the vessel tortuosity.
Applsci 11 02447 g001
Figure 2. Wound splinting in the mouse ear pinna wound model.
Applsci 11 02447 g002
Figure 3. Optical coherence tomography angiography of dermal wound healing. Images present the angiogram time series of (a) one non-diabetic and (b) one diabetic animal. While the depicted non-diabetic mouse belonged to the control group that received no treatment, the diabetic animal received fibrin sealant at each study day directly after OCT measurements. BL is the baseline measurement before and D00 the measurement directly after wounding. D01 to D18 denote the angiograms acquired on the following days until the last study day 18.
Applsci 11 02447 g003
Figure 4. Vascular network derived from OCT angiograms. Graphics depict the OCTA data timeline acquired from the non-diabetic mouse shown in Figure 3a after post-processing. The extracted binary images were used for calculating the four vascular parameters vessel density, normalized vessel length, number of bifurcations per unit length, and vessel tortuosity. The region covered by the donut-shaped ring and the wound site were excluded during evaluation of the vascular parameters and are shown darker.
Applsci 11 02447 g004
Figure 5. Vascular parameters derived from OCT angiograms in (a,c,e,g) non-diabetic and (b,d,f,h) diabetic mice. (a,b) Vessel density. (c,d) Vessel length. (e,f) Number of bifurcations per vessel length. (g,h) Vessel tortuosity. The error bars represent the standard deviation.
Applsci 11 02447 g005
Figure 6. Wound size relative to the initial day as determined from photographs in (a) non-diabetic and (b) diabetic mice. The error bars represent the standard deviation.
Applsci 11 02447 g006
Figure 7. Example of cross-sectional histology of full thickness mouse pinnae on D18. Slices depict (a,c) non-diabetic and (b,d) diabetic mice in the control group stained with (a,b) HE or (c,d) anti-CD31 antibody, respectively. The dashed line rectangles indicate the respective wound area. Epidermis E, dermis D, muscle M, cartilage C, and hair follicles H. (a) In the HE staining in the non-diabetic mouse, the top arrow highlights the granulation process below the closed epithelium, while the bottom arrow indicates the healing response with ingrowing fibroblasts and inflammatory cells. (b) The HE staining in the diabetic mouse shows complete re-epithelialization of the wound (top arrow). The bottom arrow shows a diffuse mixed inflammatory process. The anti-CD31 antibody staining in (c) the non-diabetic and (d) the diabetic animal depict comparable CD31+ endothelial cells indicating angiogenesis.
Applsci 11 02447 g007
Figure 8. α-Smooth muscle actin staining of the cutaneous wound model in the mouse pinna. Positive staining in (a) non-diabetic and (b) diabetic mouse indicates smooth muscles cells demonstrating that wound closure was promoted by contraction.
Applsci 11 02447 g008
Table 1. Study groups and number of animals included in the analysis.
Study GroupNon-Diabetic AnimalsDiabetic Animals
Control (no treatment)66
Chitosan hydrogel65
Fibrin sealant66
VEGF/PDGF + fibrin sealant66
Table 2. OCTA vessel parameters at baseline before induction of the dermal wound on the mouse pinna (mean ± standard deviation).
OCTA ParameterNon-DiabeticDiabeticp-Value
( n = 24 )( n = 23 )
Vessel density [% of skin area] 22.75 ± 2.63 23.02 ± 1.81 0.69
Vessel length [ m m per m m 2 skin area] 4.93 ± 0.64 5.01 ± 0.47 0.63
Bifurcations per vessel length [ 1 / μ m ] 3.90 ± 0.29 4.02 ± 0.33 0.18
Vessel tortuosity [1] 1.140 ± 0.024 1.138 ± 0.025 0.84
Publisher’s Note: MDPI stays neutral with regard to jurisdictional claims in published maps and institutional affiliations.

