Article

Biogeochemical Modelling of Uranium Immobilization and Aquifer Remediation Strategies Near NCCP Sludge Storage Facilities

by
Alexey V. Safonov
1,
Anatoly E. Boguslavsky
2,*,
Olga L. Gaskova
2,
Kirill A. Boldyrev
3,
Olga S. Shvartseva
2,
Albina A. Khvashchevskaya
4 and
Nadezhda M. Popova
1
1
Frumkin Institute of Physical Chemistry, Russian Academy of Science, 119071 Moscow, Russia
2
Sobolev Institute of Geology and Mineralogy, Siberian Branch of the Russian Academy of Sciences, 630090 Novosibirsk, Russia
3
Nuclear Safety Institute (IBRAE), 115191 Moscow, Russia
4
Laboratory of Hydrogeochemistry, Department of Geology, Tomsk Polytechnic University, 634050 Tomsk, Russia
*
Author to whom correspondence should be addressed.
Submission received: 25 February 2021 / Revised: 18 March 2021 / Accepted: 20 March 2021 / Published: 23 March 2021
(This article belongs to the Special Issue Sustainable Strategies for Remediation of Contaminated Water and Soil)

Abstract

:
Nitrate is a substance which influences the prevailing redox conditions in groundwater, and in turn the behaviour of U. The study of groundwater in an area with low-level radioactive sludge storage facilities has shown their contamination with sulphate and nitrate anions, uranium, and some associated metals. The uranyl ion content in the most contaminated NO3–Cl–SO4–Na borehole is 2000 times higher (1.58 mg/L) than that in the background water. At the same time, assessment of the main physiological groups of microorganisms showed a maximum number of denitrifying and sulphate-reducing bacteria (e.g., Sulfurimonas) in the water from the same borehole. Biogenic factors of radionuclide immobilization on sandy rocks of upper aquifers have been experimentally investigated. Different reduction rates of NO3, SO42−, Fe(III) and U(VI) with stimulated microbial activity were dependent on the pollution degree. Moreover, 16S rRNA gene analysis of the microbial community after whey addition revealed a significant decrease in microbial diversity and the activation of nonspecific nitrate-reducing bacteria (genera Rhodococcus and Rhodobacter). The second influential factor can be identified as the formation of microbial biofilms on the sandy loam samples, which has a positive effect on U sorption (an increase in Kd value is up to 35%). As PHREEQC physicochemical modelling numerically confirmed, the third most influential factor that drives U mobility is the biogenic-mediated formation of a sulphide redox buffer. This study brings important information, which helps to assess the long-term stability of U in the environment of radioactive sludge storage facilities.

1. Introduction

Uranium ore mining and processing facility activities can lead to the uncontrolled migration of heavy metals, radioactive elements, and other toxic compounds, followed by groundwater pollution and entry into water sources and surface water bodies. Groundwater contamination by natural actinides—uranium and thorium—is a particular problem due to their long half-life and high toxicity [1].
A significant contribution to groundwater pollution is made by facilities with large volumes of solid wastes, tailings, and sludge repositories, which form potential environmentally hazardous sites on the surface. Due to infiltration from atmospheric precipitation, heavy metals, acid anions (sulphates and nitrates), and radioactive elements enter the groundwater of shallow aquifers through the walls and bottom of storage facilities for a long time [2,3]. In the described cases, high uranium migration and groundwater contamination are controlled by the main components of the filtrate, which provide a high redox potential (nitrate and sulphate), uranyl ion complexation, and colloidal and pseudocolloidal transfer with particles of clays and metal oxides (iron, manganese, and chromium). Additionally, underground microbiota play a significant role in uranium immobilization via the processes of enzymatic reduction [4,5], sorption on biofilms [6,7,8], and biomineralization [9,10,11,12,13]. It should be noted that the main components of liquid wastes entering underground ecosystems are additional electron donors or acceptors that affect the development of microbiological processes (denitrification, sulphate reduction, iron reduction, etc.) and can indirectly affect uranium mobility significantly in underground aquifers [14,15,16].
While many treatment methods have been developed and effectively used for soil and surface water pollution, such methods are difficult to apply for deep aquifers, and they tend to have limited effectiveness in preventing pollution spread under “slurry wall” conditions [17]. Slurry wall configurations restrict the movement of contaminated water without pollution neutralization. The use of microbial methods for the purification of aquifers can lead to significant complex effects—the complete removal of nitrogen compounds, the immobilization of sulphur in compounds with heavy metals, and the creation of optimal reducing conditions for uranium immobilization. This approach is currently being used successfully to clean contaminated sites [18,19,20,21,22].
We studied groundwater taken from depths of 5–10 m near the sludge pond of the Novosibirsk Chemical Concentrates Plant (NCCP), one of the world’s leading producers of nuclear fuel for atomic power plants and research reactors in Russia and foreign countries, as well as of lithium and its salts. Since the beginning of plant operation in 1950–1951, over 100,000 tons of low-activity solid wastes have accumulated in sludge ponds at the facility. Over the 65-year facility history, the areas of the sludge repositories have exhibited permanent groundwater pollution by sulphate and nitrate anions, uranium, and a number of heavy metals. The uranium concentration in the liquid phase of the slurries varies depending on season and ranges from 2–4 mg/L. Long-term observations indicate that contaminated water has filtered into the first aquifer. This contaminated water mixes with natural water, which leads to a multiple dilution effect. The contents of pollutants in water outside the NCCP industrial site do not exceed the existing standards’ MACs (maximum allowable concentration).
The main purpose of this work is to study biogeochemical processes in technogenic and natural underground NCCP systems contaminated by nitrate, sulphate, and uranium to develop an integrated approach for remediation using microbiological and microbiologically mediated mechanisms for pollutant immobilization.

2. Site Characterization

Groundwater was sampled near the sludge storage facility for low-level radioactive waste represented mainly by uranium and its daughter isotopes. Host rocks at the site are represented by middle Quaternary fluviolacustrine sediments and can be divided into three layers. A layer of loam with a penetrated thickness of 3–9 m is located at the bottom. It is distinguished by low water permeability (Kf = < 0.001 m/day). The overlying layer is composed of intercalations of yellowish-brown loam with sandy loam and fine-grained sand. The sandy loam and sand of this layer are the soils with the highest water permeability (Kf = 1.5 m/day), and the main groundwater flow (corresponding to the first aquifer) occurs in this area. The layer at the top consists of loess-like yellowish-brown loam with a layer thickness of 8–15 m that reaches the maximum in watershed areas (Kf = 0.01–0.1 m/day). Quartz, feldspar, calcite, magnetite, and ilmenite predominate in the mineral composition. Quartz, plagioclase, potassium feldspar, mica, chlorite, calcite with limited amphibole, and smectite are present in the fine fraction (>0.001 mm). The total content of clay minerals is below 3%.
Three samples of groundwater and soil (sandy loam collected in boreholes) taken from a depth of 7–9 m at different distances from the pollution site (sludge pond) were used for detailed analysis. Sample 1 is the natural background of the area, located at a distance of more than 300 m upstream of the collector. Sample 3 is water from a well located at a distance of ~10 m from the collector, where the dilution of technogenic water by groundwater is minimal. Sample 2 was taken at a distance of ~150 m from the collector (Table 1). In this sample, the dilution rate of chloride and nitrate ions was approximately 5.5 times that of Sample 3.
The unpolluted (background) groundwater is fresh (total dissolved solids—TDS is below 0.47 g/L) with a hydrocarbonate–calcium composition. The contaminated samples (Samples 2 and 3) show an evident increase in TDS compared to the background value (3.83 g/L for Sample 2 and 14.9 g/L for Sample 3) due to their main components—nitrate, sulphate, chloride ions, calcium, and sodium. The water chemistry in Sample 2 is SO4–NO3–Na–Mg, but in Sample 3, it is NO3–Cl–SO4–Na–Ca, indicating that the chemical type changes even at a distance of 150 m from the well. The content of uranyl ions in the sample from the well near the contamination zone (1.58 mg/L) is 2000 times higher than the background value. It is worth mentioning that in the sample from the contaminated well, metal concentrations in excess of the MAC (maximum allowable concentration) are observed—in particular, zinc, manganese, iron, and copper. The oxygen content in the samples varies over a wide range characteristic of both aerobic–microaerophilic and anaerobic conditions.

3. Materials and Methods

3.1. Sample Collection

Water samples were collected from the observation wells during summer using downhole pumps in 1.5-L sterile plastic containers. For rRNA 16S analysis, samples were conserved with ethanol at a ratio of 1:1. To isolate clean samples and enrichment cultures and for laboratory model experiments, groundwater was collected in liquid full containers, which were then sealed without a gas phase. The samples were stored at a temperature of 5–7 °C before they were delivered.
Filtration was carried out under field conditions in an anaerobic box in a nitrogen atmosphere immediately after sampling. For filtration, 5-mL syringes with nozzles containing membranes (Closed Joint-Stock Company “Vladipor”) with pore sizes of 4.5, 2.4, 1.2, 0.45, and 0.05 µm were used. After each filtration step, the filtrate composition was analysed by inductively coupled plasma-mass spectrometry (ICP-MS).

3.2. DNA Sample Preparation and 16S rRNA Gene Analysis

Samples for total microbial DNA analysis were obtained after filtration of 1.5 litres through Millipore nitrate–cellulose filters (type GS 0.22 µm) using a VFD-35 vacuum filtration device [23] including a funnel filter cell, a collector, a vacuum pump, and an ejector. Precipitates on the filters were conserved with 96% ethanol and stored at −20 °C before DNA isolation. DNA isolation from enrichment cultures was conducted using a kit (ZymoBIOMICS™ DNA Miniprep Kit, Zymo Research, USA) according to the manufacturer’s manual.
DNA isolation from the filter was conducted by a kit (Meta-G-Nome™ DNA Isolation Kit, Epicentre, USA) according to the manufacturer’s manual. In preparing libraries for amplification, variable parts of a gene of the V3–V4 region of 16S rRNA were selected: for the amplification of the V3–V4 region, the degenerate primers For341 (5’-CCTACGGGNBGCASCAG-3”) and Rev806 (5”-GGACTACHVGGGTWTCTAAT-3”) were used. For the amplification of the V4 region, the degenerate primers For515 (5”- GTGBCAGCMGCCGCGGTAA-3”) and Rev806 (5”—GGACTACHVGGGTWTCTAAT-3”) were used. Amplification was performed by real-time PCR on a CFX96 Touch (Bio-Rad, USA) device using qPCRmix-HS SYBR (Eurogen, Russia).
Denaturation, primer annealing, and chain elongation for the V3–V4 region were carried out at temperatures of 96, 54, and 72 °C, respectively, and the steps for the V4 region were carried out at temperatures of 96, 58, and 72 °C, respectively. Purification of the desired product from each batch was conducted with Agencourt AMPure XP magnetic particles (Beckman Coulter, USA). Furthermore, high-throughput sequencing was performed via the MiSeq system (Illumina, USA) using a kit (MiSeq Kit v2, 500 cycles, Illumina, USA).
The estimation of biofilm formation on rocks was carried out by culturing 1 g of rock in 10 mL of formation fluid with a mixture of 1 g/L of glucose and sodium acetate for each solution. The analysis of the respiratory metabolism of the attached microbial biofilm was performed by MTT assay on the 20th and 40th days [24], followed by imaging using a laser confocal microscope.
Confocal microscopy was performed by adding fluorescent dyes to rock samples with biofilms; wheat germ agglutinin (WGA) aggregated with the fluorescent dye AlexaFluor 488 (W11261 ThermoFisher), which binds to monosaccharides of bacterial walls and extracellular polysaccharides (EPS), was used. SYTO 11, which binds to nucleic acids, served as a dye for cell staining. Samples were analysed using a Leica SP5 confocal microscope (Leica, Germany). Images were obtained using an argon laser with a wavelength of 488 nm for the detection of WGA fluorescence and a wavelength of 594 nm for the detection of SYTO 11, and Nomarski contrast mode was used for the detection of uncoloured particles (sand). The resulting images were analysed using the Imaris 7.0.0 software package (Bitplane, Switzerland) to calculate the area of polysaccharides and nucleic acids on rock samples.
Uranium sorption experiments were conducted on rock samples before and after biofilm formation from distillate solutions and groundwater samples; the initial uranium concentration in each case was 5 mg/L. The water/rock ratio in the experiment was 1:20. The distribution coefficients were calculated after reaching sorption equilibrium in the system (3 days for a sample with biofilm and 48 h for a biofilm-free sample). The following equation was used for the calculation:
K d   =   U ] i U ] e q [ U ] e q × V m
where (U)I is the initial concentration of uranium, (U)eq is the equilibrium concentration of uranium in the aqueous phase, V is the volume of the aqueous phase in millilitres, and m is the mass of the sample in grams. The units of measurement are Kd mL/g.

3.3. Analytical Methods

The determination of Eh and pH values was carried out in situ using an “ANION-4100” pH metre/ionomer (Russia) with an electrode combination. Anion and cation concentrations were measured by a capillary electrophoresis system (Capel-105M, LUMEX Instruments, Russia). The concentrations of uranium and other elements were measured using an Agilent 7800 ICP-MS analyser.

3.4. Laboratory Experiment

Biological processes were modelled in vitro in 100-mL vials containing 50 mL of formation fluid. At the initial stage of the experiment, the gas phase was air. Aliquots of solutions containing various electron donors and carbon sources were added to the samples: a 5% solution of sugar, a 5% solution of sodium acetate, and milk whey (60,000 mg/mL of chemical oxygen demand-COD) (Agroprommilksbyt Ltd., Utyatinka, Novgorod region) in the stoichiometric proportion necessary for the complete removal of nitrate with 2.5 mg of COD per 1 mg of nitrogen [25]. To determine the uranium speciation in the precipitate, 10 mg/L of uranium in the form of uranyl–nitrate salt was added to the samples. The samples were cultured at room temperature, and aliquots were taken at regular intervals for pH and Eh analysis and determination of the main macrocomponent concentrations. After complete nitrate and sulphate consumption and black precipitate formation, the solution was decanted, and the precipitate was dried for analysis.
Uranium reduction experiments in formation water from the background well were conducted under anaerobic conditions with the addition of uranyl–sodium acetate at uranium concentrations of 10, 50, 100, and 200 mg/L in penicillin vessels with argon as a gas phase. The experiment was carried out twice, with and without the addition of nitrate.

3.5. Thermodynamic Modelling

Geochemical calculations were made using the computer code PHREEQC 2 (USGS). PHREEQC is a computer program written in the C++ programming language that is designed to perform a wide variety of aqueous geochemical calculations. The thermodynamic database llnl and PSINA (PSI/Nagra Chemical Thermodynamic Database 12/07) were used for the calculations of uranium migration forms. We calculated the following species of U(IV-VI): U4+, (U(OH)4, U(CO3)44−, UOH3+, U(CO3)56−, U(SO4)2, USO42+, UCl3+, UNO33+, U(NO3)22+, UO2+, UO2(CO3)35−), UO22+, (UO2(CO3)22−, UO2(CO3)34−, UO2CO3, UO2(OH)2, UO2OH+, UO2(OH)3, UO2SO4, (UO2)3(CO3)66−, UO2(SO4)22−, (UO2)3(OH)5+, (UO2)2(OH)22+, UO2Cl+, UO2NO3+, (UO2)3(OH)7, (UO2)4(OH)7+, (UO2)3(OH)42+, UO2Cl2, (UO2)3(OH)5CO2+, (UO2)2OH3+, (UO2)3O(OH)2(HCO3)+, UO2(OH)42−, UO2SO3, and (UO2)11(CO3)6(OH)122−.
Saturation index (SI = logIAP—logKs) values were also calculated. At SI > 0, solid phase formation is predicted, and at SI < 0, dissolution occurs; SI = ± 0.3 indicates equilibrium, accounting for the calculation error. The system database allowed the presence of the following phases: uraninite (logKs −4.84), UO2(am) (logKs 0.11) and other nonstoichiometric oxides and phosphates. All solubility constants were calculated for similar stoichiometry reactions. For the thermodynamic modelling of Samples 1, 2, and 3, a uranium concentration of 10 mg/L was used in the computations.

4. Results and Discussion

4.1. Uranium Speciation in Groundwater

In the study samples from wells near the sludge repository, uranium at concentrations of up to 1.56 mg/L was found (
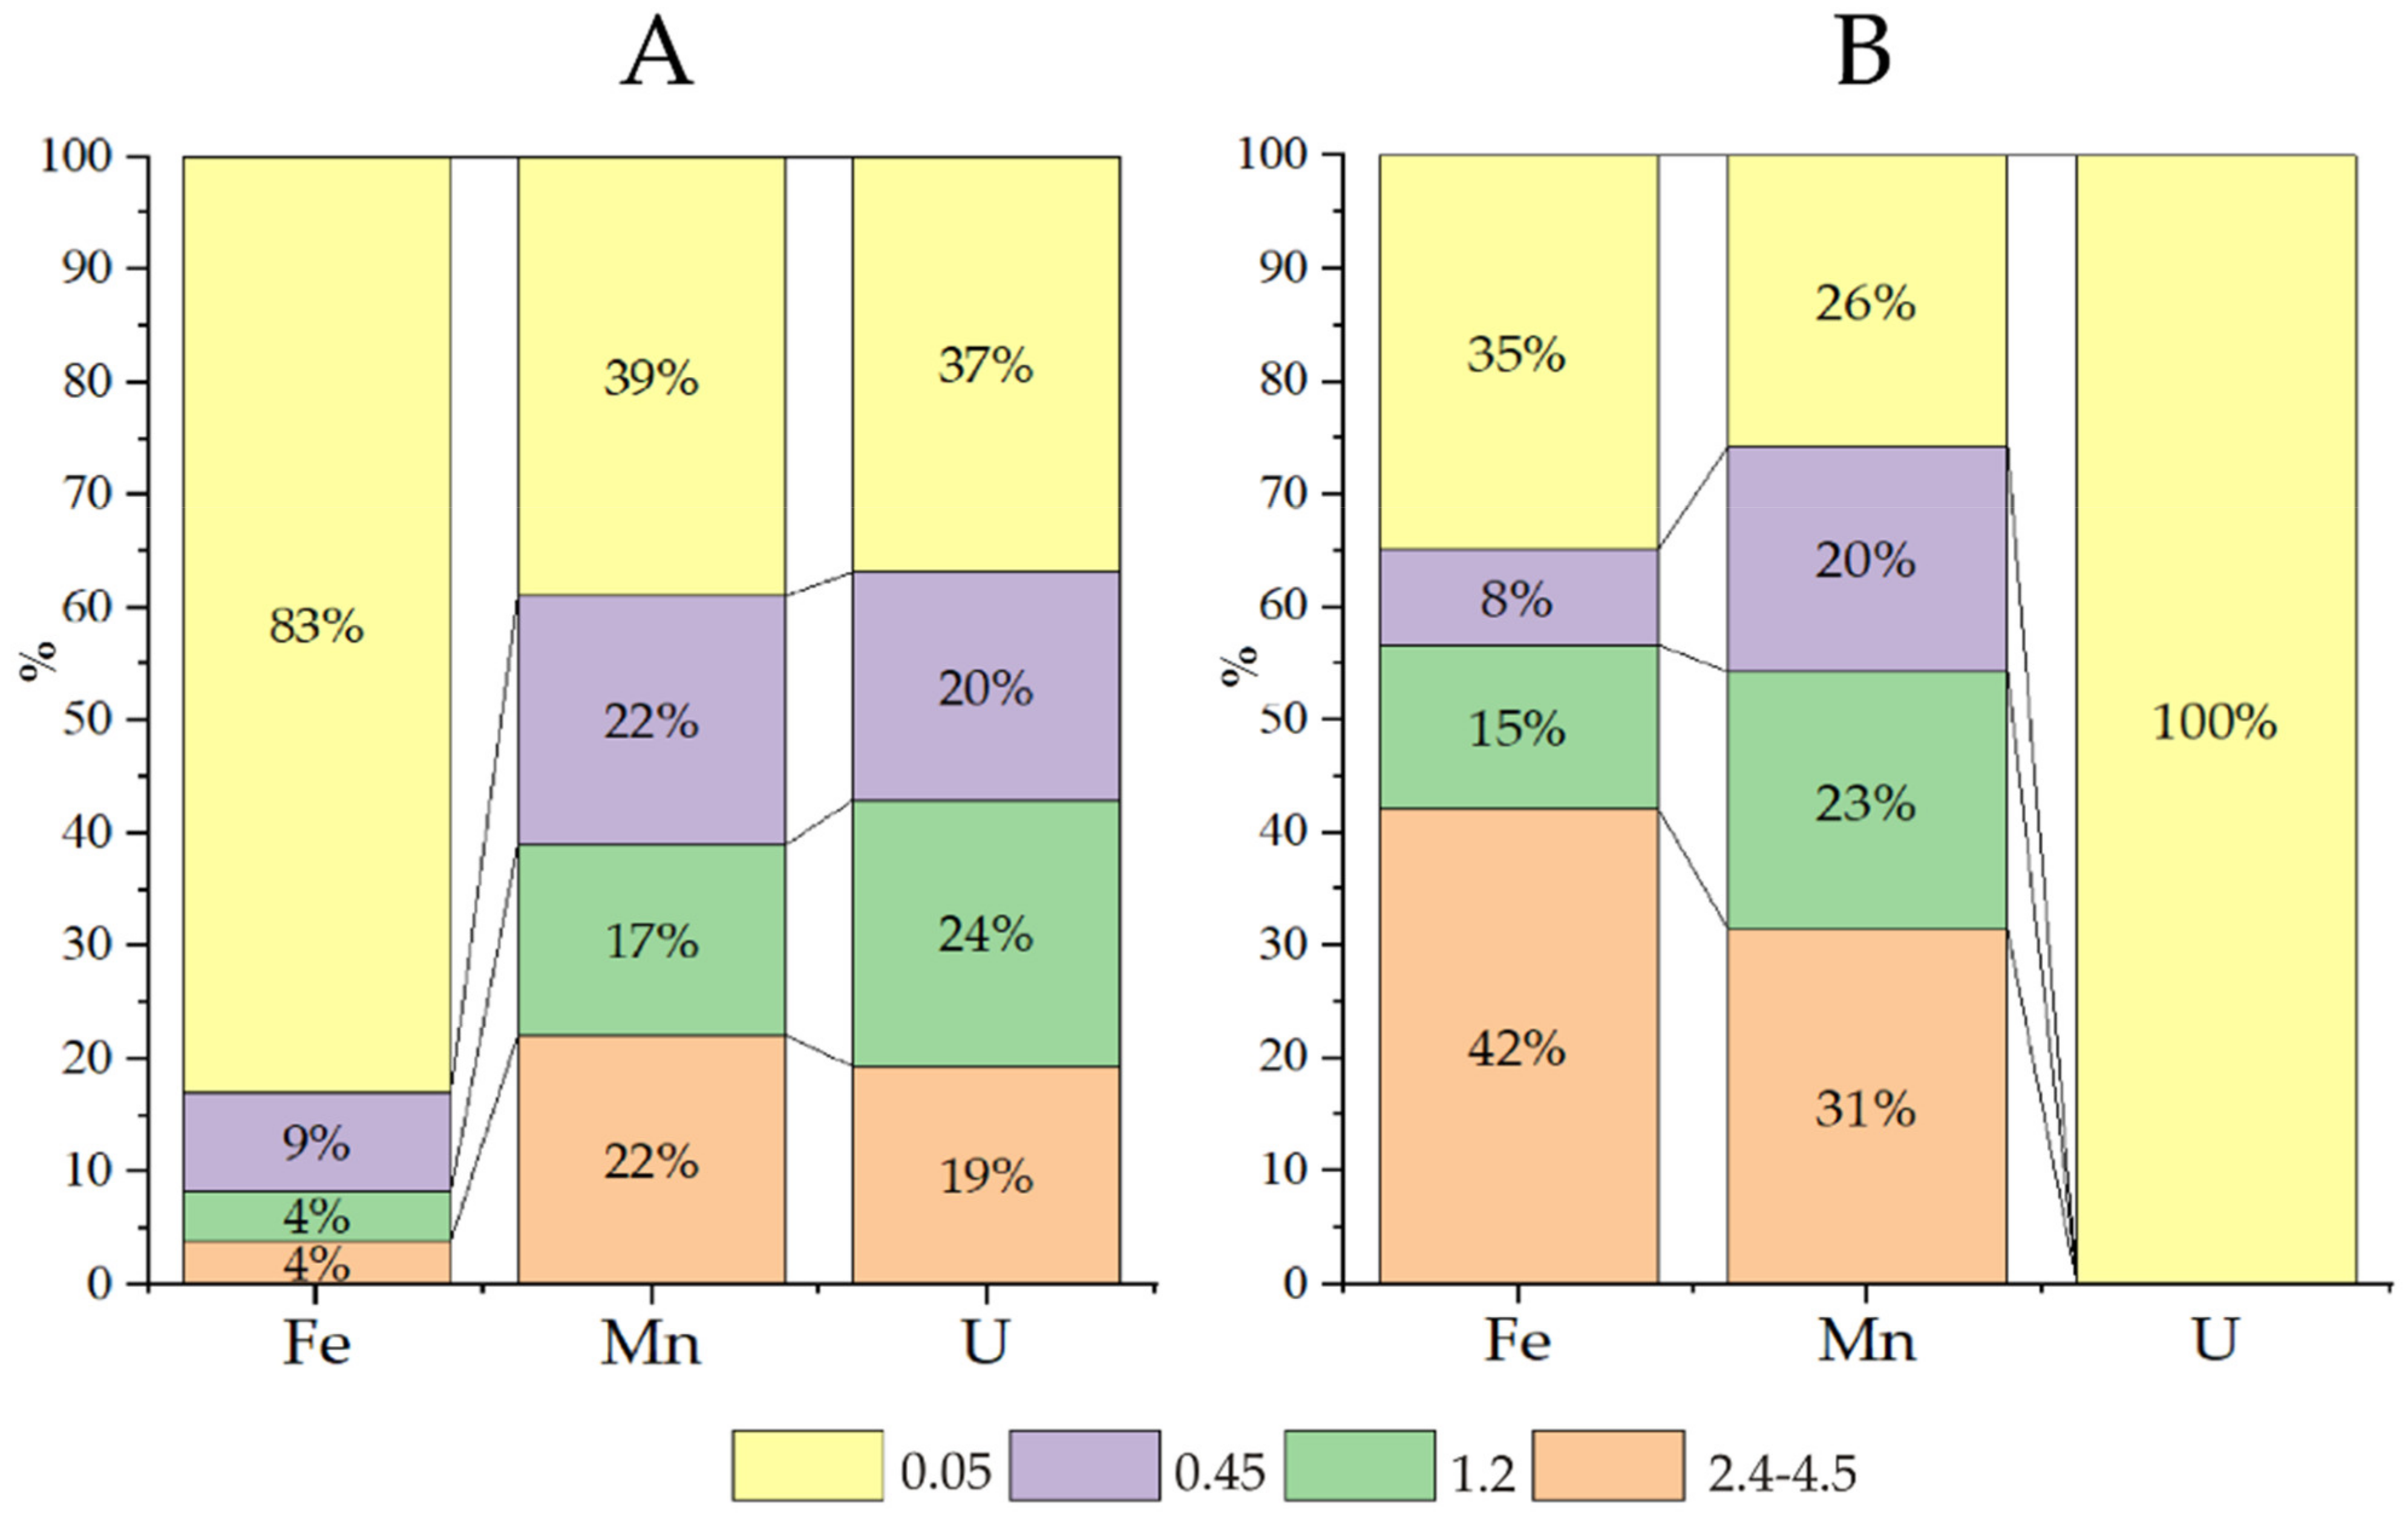
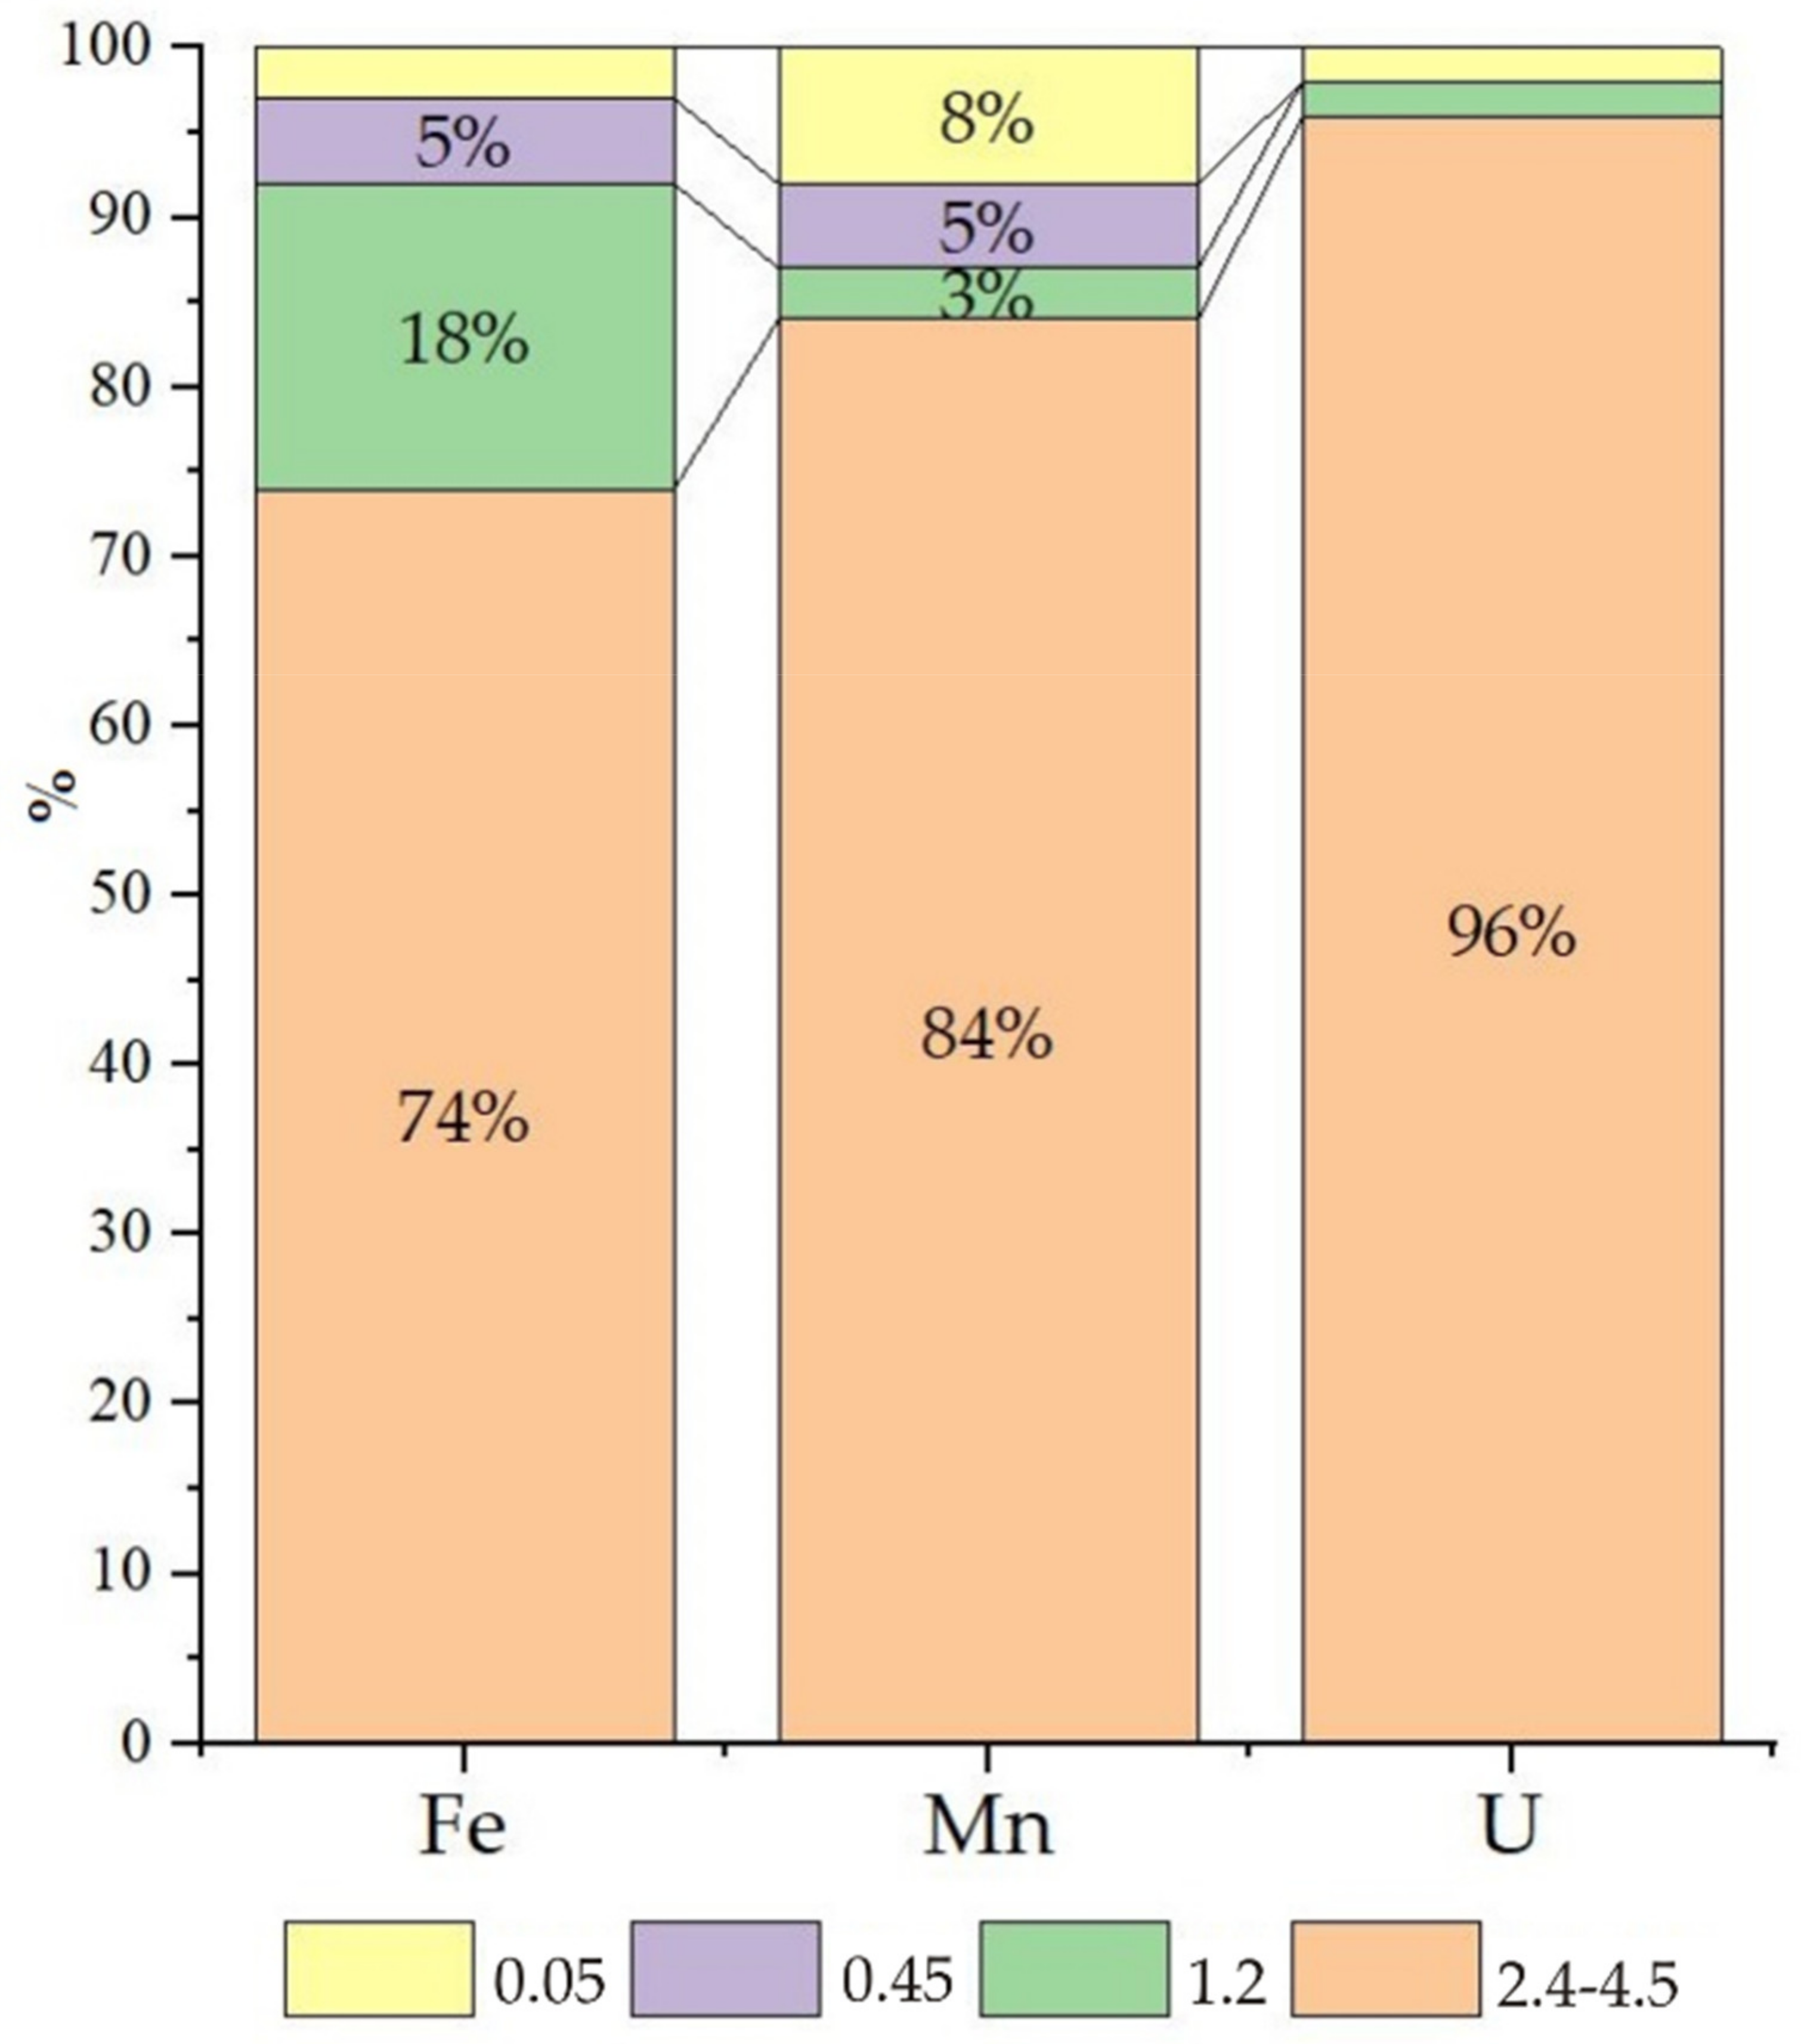
Table 1). Cascade filtration of the water samples from Wells 2 and 3 in an anaerobic box under field conditions allowed us to establish the size distribution of the main particles associated with uranium migration. Chemical elements in groundwater can migrate as suspended particles (0.1 μm), colloids (1–100 nm), and molecular solutions (≤1 nm). It is generally accepted that suspended particles are nearly nonexistent in groundwater, colloids play a subordinate role, and truly dissolved forms dominate. Exceptions are elements such as Si, Al, Mn, Fe, U, and Th. We therefore studied their behaviour (Figure 1).
More than 6 g/L of nitrate ions was found in the water of Sample 3, contributing to slightly oxidative conditions (Eh 90 mV), and uranium was found mainly in the form of uranyl ion carbonate complexes, in which form uranium easily migrates (Figure 2 fraction < 0.05 μm, yellow colour). Iron and manganese are transported mainly as colloids, and the large fraction (2.4–4.5 μm) accounted for 30–40% of these elements. For iron, this fractionation is explained by the formation of insoluble Fe(III) (hydro)oxide; the explanation for manganese is not as apparent.
According to the calculations (Table 2), manganese should be present in the form of Mn2+ and MnSO4(aq) without solid phases. Moreover, the aerobic oxidation of bivalent compounds to insoluble forms with the highest valence, followed by subsequent separation, is used to precipitate manganese from contaminated water. Currently, we can only assume that the concentrated Mn colloids are organomineral compounds.
The water of Sample 2 presents a nitrate content of approximately 1 g/L (Eh −28 mV). Iron is mainly in the dissolved forms of Fe(II)—Fe2+, FeHCO3+ and FeSO4(aq)—while manganese is in the solution (40%) and in all fractions of colloids. Note that in this water, the concentration of manganese (2.3 mg/L) is much higher than the MAC. According to the calculations, in zone 2 at a distance of tens of metres from the sludge pond, the uranium in solution is mainly in the form of U(OH)4(aq) and in the form of true and pseudocolloidal UO2(am).
Nitrates, with which the solutions of Samples 2 and 3 are saturated, form oxidative conditions in neutral groundwater in the territory of the NCCP and prevent the removal of uranium. Moreover, a positive shift is evident even when the NO3 content decreases from 6169 mg/L to 1124 mg/L: (a) the oxidation state of uranium changes from U(VI) to U(IV), and (b) the content of ferrous iron (Fe(II)), a potential electron donor, increases from 0.01 to 10.7 mg/L. According to calculations and a review [26], for the intense reduction of nitrates at pH 7, Eh ≤ 0 mV is necessary. In our case, such values are characteristic only for Sample 1 (background water). Even in this case, at an Eh of -190 mV, sulphate is predominant over sulphide species in the solution (Table 2), with values of 3.8 × 10⁻⁵ H2Stotal and 2.74 × 10⁻⁴ SO42− total. Modelling experiments of the metabolism of biota were therefore designed to attain the reduction of nitrates and sulphates during NCCP groundwater treatment. The formation of sulphide will lead to the removal of heavy metals, and sometimes this mechanism is the only opportunity for the remediation of certain pollutants, such as zinc and other heavy metals.

4.2. Microbiological Parameters of Groundwater

The assessment of the main physiological groups of microorganisms showed a diverse microbial community in the groundwater samples, including aerobic and anaerobic bacteria. In the contaminated samples (Samples 2 and 3), the number of denitrification and sulphate-reducing bacteria was higher than that in the background well. The most polluted sample (Sample 3) contained the maximum number of denitrifying and sulphate-reducing bacteria, except for iron reducers, whose activities depend on anaerobic conditions (negative Eh), which dominated in the background water (Sample 1). In shallow groundwater locations, such as in the NCCP area (up to 10 m), due to the lack of organic matter and the oxidizing environment, natural denitrification is poorly developed [27].
Based on the 16SrRNA gene analysis (Table 3) of the microbial community in the water samples, the greatest number of representatives of the Sulfurimonas genus was found in the contaminated groundwater (Sample 3). Sulfurimonas reduces nitrates and oxidizes sulphur in lithotrophic growth [28,29]. Bacteria of the genus Gallionella are iron oxidants that form biogenic mineral phases of ferrihydrite [30]. Bacteria of the genus Pseudomonas were also detected in Sample 3; these bacteria are known for their ability in anaerobic conditions to reduce nitrate and transition metals, including uranyl [31]. Bacteria of the family Xanthomonadaceae are known for a wide variety of aerobic metabolic processes, including the nitrogen cycle (denitrification, iron oxidation, etc.), and form biofilms [32]. Parcubacteria are referred to as ultramicrobacteria. The organisms have small (generally < 1 Mb) genomes and highly reduced metallic capabilities. They have been implicated in hydrogen and sulphur cycles in anoxic sediments [33]. Some papers have reported that they are frequent satellites of bacteria of the genus Planctomycetes, which are responsible for the anammox process [34].
The background groundwater (Sample 1) is dominated by typical bacteria associated with the iron cycle (Gallionella and Geobacter) and sulphur cycle (the genera Sulfurimonas, Desulfobacteraceae, Desulfosporosinus, and Desulfovibrio), as well as organothrophic bacteria of the family Comamonadaceae and class Bacteroidales, whose representatives have a wide range of metabolic characteristics; they reduce nitrate, nitrite, iron and other elements in anaerobic conditions. All of these bacteria can form biofilms [35].

4.3. Laboratory Modelling of Biological Groundwater Treatment

In the first stage, electron donors were selected to stimulate the microbial community of the formation water in Samples 1 and 2 (Table 4). Ordinary substrates and one complex substrate (whey) [36] were used. It has been established that the optimal electron donor for the denitrifying microbial community is whey, a rich substrate containing a variety of organic and mineral substances, including phosphate [37]. Further, whey was used in the in situ experiments.
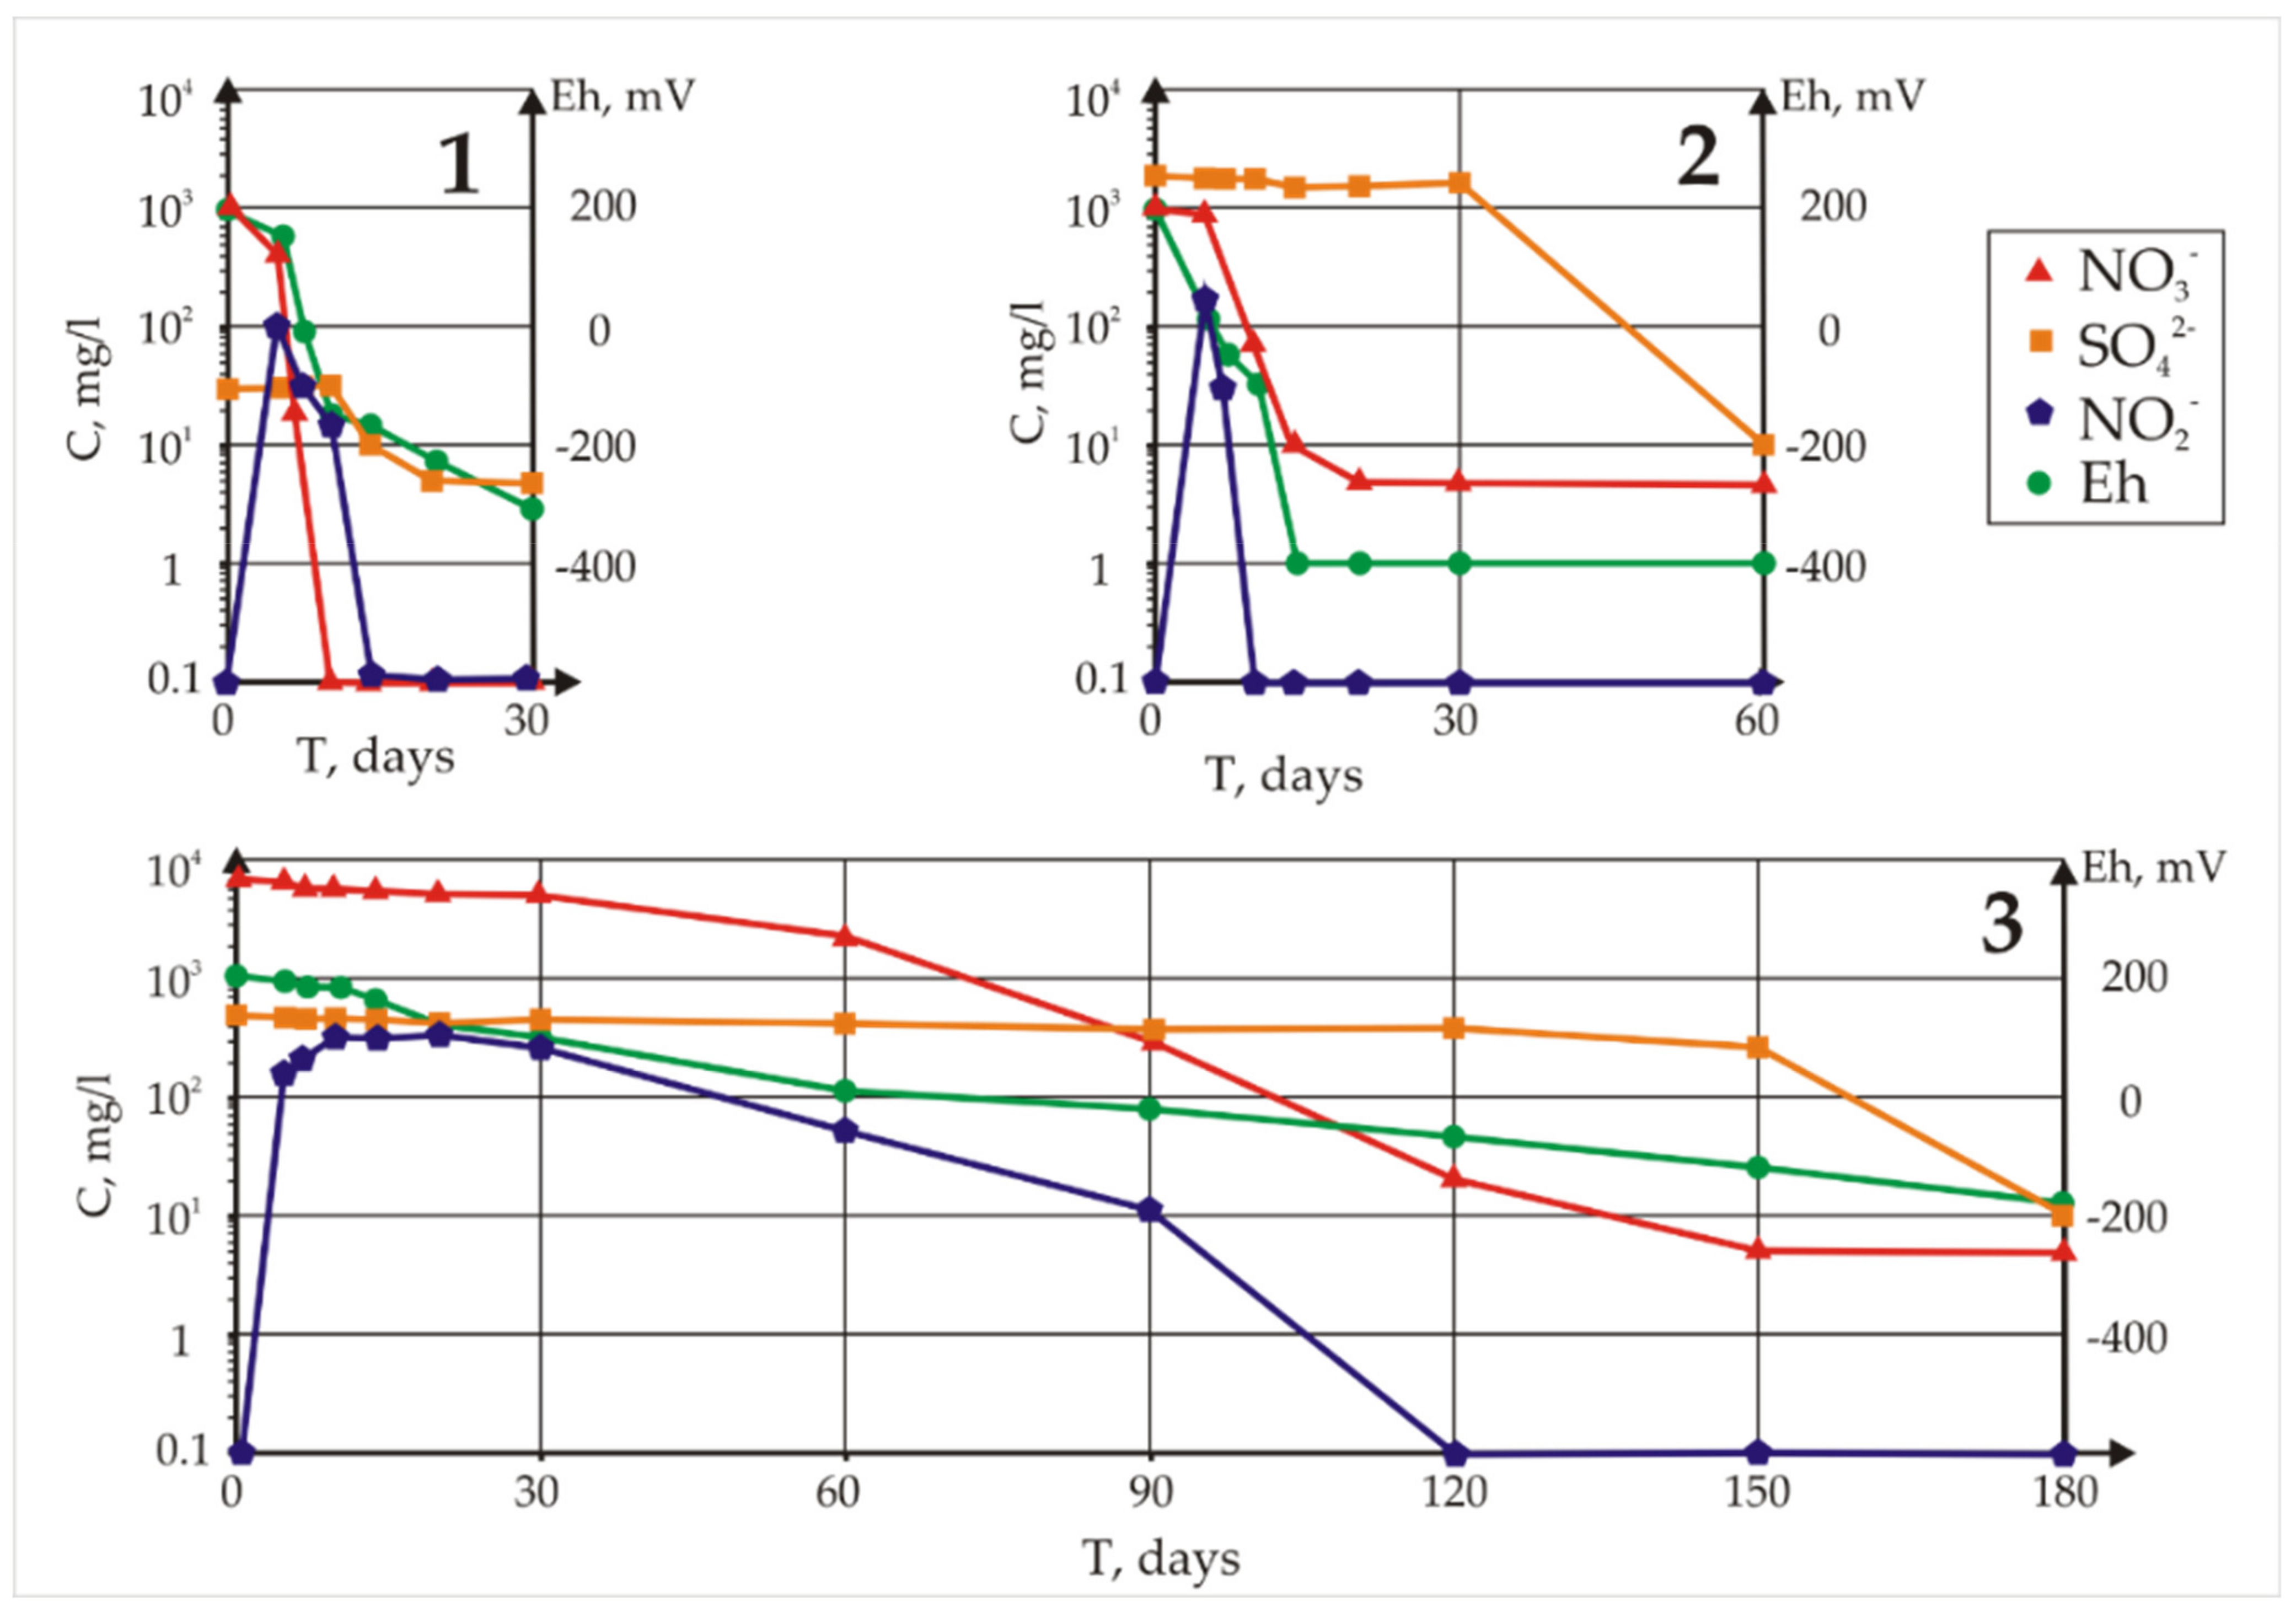
The measured concentrations of sulphates, nitrates, and nitrites and the Eh values in the samples with whey are given in Figure 3. First, a decrease in the concentration of nitrate ions took place, and only after their complete removal did the reduction of sulphate anions begin. In Sample 1 from the background well, where 1 g/L of nitrate was specifically added, the process of nitrate reduction lasted approximately 7 days, and the visible removal of sulphates began after 20 days. In Sample 2, nitrate removal and sulphate removal continued for 20 days and 60 days, respectively. In the sample from Well 3 with maximum pollution, nitrate removal continued for 150 days, while a significant accumulation of nitrite was observed. Removal of sulphates lasted 180 days. Thus, in natural water with the original microbial community, purification is very rapid. It should be taken into account that the initial mineralization and redox potential of the background water (Sample 1) were significantly lower, with only 30 mg/L sulphate.
To explain the fundamental differences between the nitrate and sulphate removal rates in the laboratory experiments, 16S rRNA gene analysis of the microbial community was conducted at the end of the whey addition experiment (Table 5).
Whey addition to Sample 3 from a highly polluted site led to a significant decrease in microbial diversity and the dominance of the genera Rhodococcus and Rhodobacter. The former is known for its ability to perform aerobic denitrification; it grows on media with a complex source of organic matter, such as media containing sugar beet molasses and sucrose as carbon sources [38]. Rhodobacter can reduce nitrate and nitrite ions under anaerobic conditions. Some members of the genus Bacillus reduce nitrates and sulphates and digest rich organic substrates.
In the development of the microbial community of Sample 1, after whey addition, representatives from the taxa Acidovorax, Hydrogenophaga, and Thauera dominated; these microorganisms are known for their ability to reduce nitrates, iron, and other compounds. The presence of sulphur cycle bacteria—representatives of the genera Sulfuritalea, Desulfobacterium, Desulfomicrobium, and Desulfuromonas—was also observed.
The removal of nitrates and sulphates in Sample 1 thus occurred after the addition of whey due to the activity of a metabolically diverse microbial community represented by denitrifying and sulphate-reducing bacteria. For highly contaminated Sample 3, nitrate removal was too slow because of the activation of nonspecific nitrate reducers. Such retardation can be explained by toxic nitrite shock, which lasts for a long time and occurs at the initial stage of the denitrification process. For nonspecific denitrification bacteria of the genera Rhodococcus and Rhodobacter, nitrate removal was insufficient; however, a decrease in the rate of NO3 reduction led to lower NO2 concentrations to avoid nitrite shock. We stress again that not only the amount of nitrates but also the microbial community diversity causes retardation in the nitrate reduction process.
It should be added that in conditions of high pollution, the development of microbial biofilms on rocks can play a key role in contributing to pollutant concentration gradients and the protection of cells from toxic stress [39]. Microbial biofilm development can likely play an important role in formation conditions with high contamination. Therefore, we studied this process in detail.

4.4. Assessment of Biofilm Formation and the Role of Biofilms in Uranium Immobilization

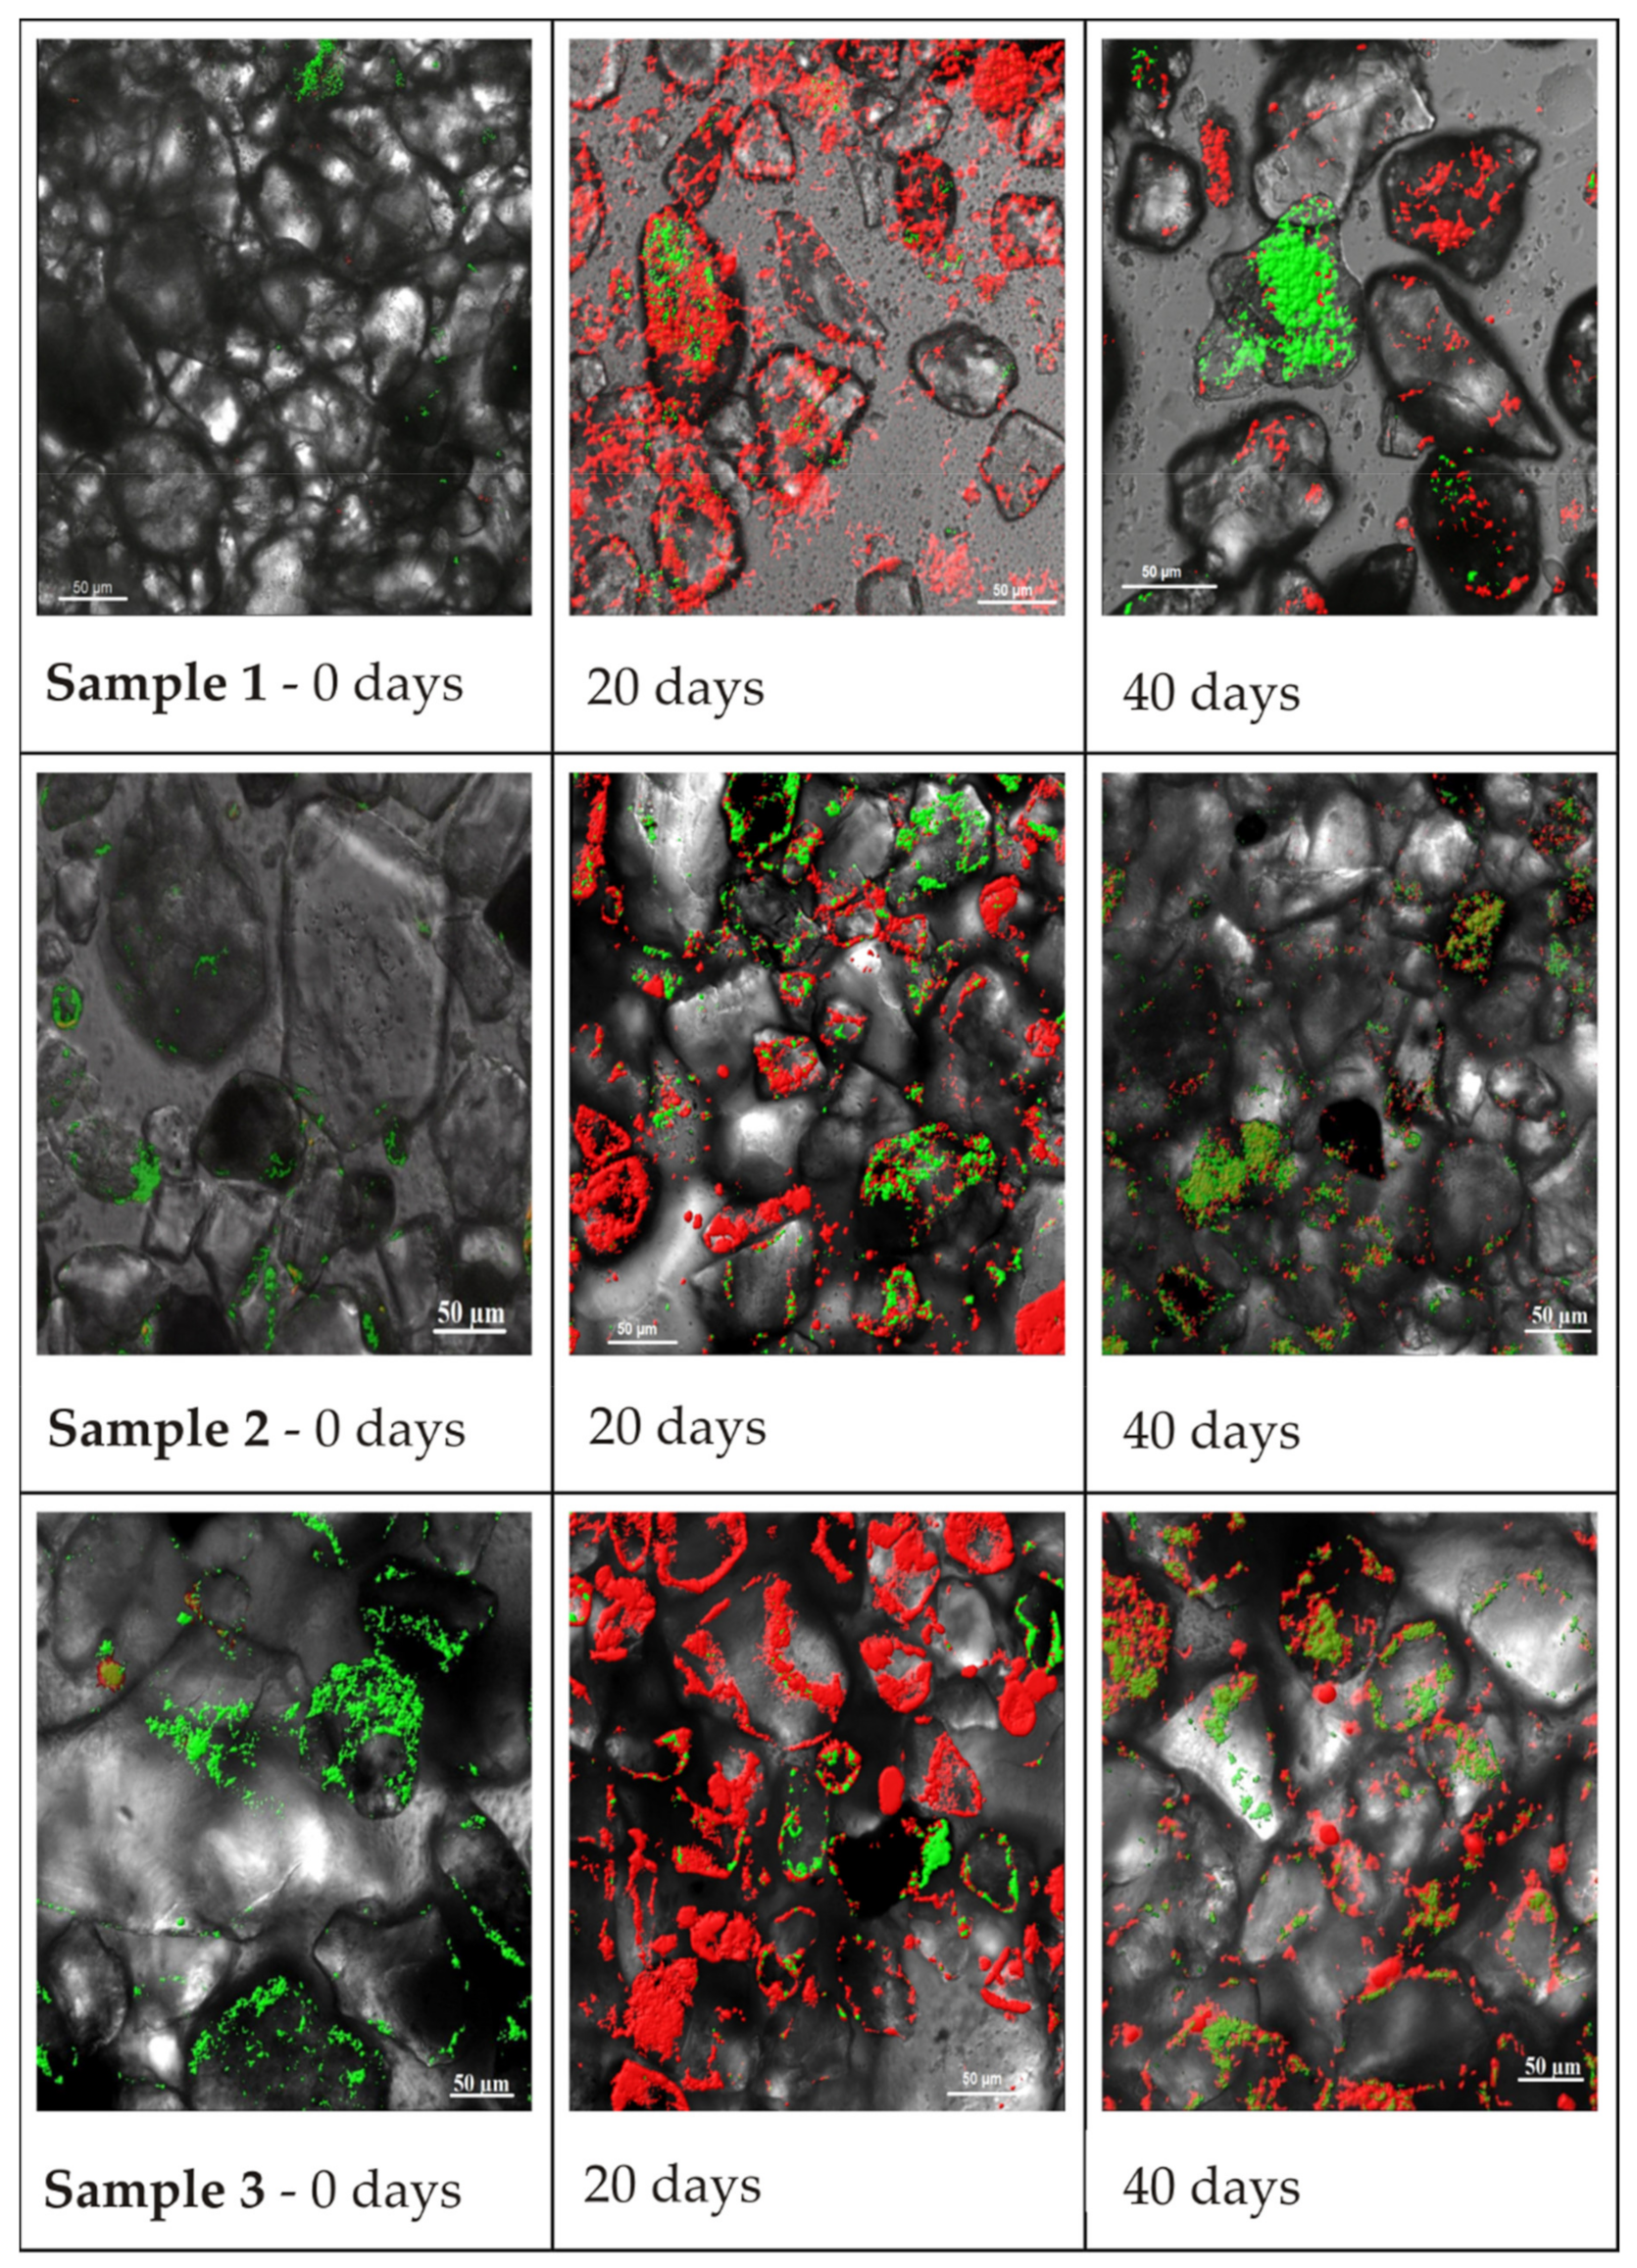
In laboratory experiments using several methods, the formation of microbial biofilms by microorganisms on loam (sandy loam) from boreholes 1, 2, and 3 after single glucose-acetate activation was investigated. Microphotographs obtained using confocal microscopy (Figure 4) show maximum biofilm development on the 20th day of the experiment. On the 40th day, the biofilm matrices of microbial communities on the three rock samples deteriorated, and only in some areas of the rock did attached microorganisms remain.
Based on visual analysis, the maximum accumulation of cellular nucleic acids (green colour) before glucose activation was observed in the loam of Sample 3. The maximum accumulation of polysaccharides on the 20th day was observed for the rock of Sample 1, but on the 40th day, the maximum polysaccharide amount was observed for the loam of Sample 3, indicating uneven biofilm development on rocks during interactions with solutions of different compositions. On the rock sample suffering from maximum technogenic impact, biofilm development was slower on the 20th day, but the deterioration rate on the 40th day was also not rapid.
The confocal microscopy visualization data were confirmed by the MTT assay data (Table 6). The respiratory metabolism of microbial biofilms reached the maximum on the 20th day, with the largest respiratory activity observed for the microbial community of Sample 1, which was in contact with groundwater and the minimum observed for the rock of Sample 3, which was mostly affected by nitrate sulphate water.
The maximum area occupied by biofilms before microbial stimulation was largest on the sample with maximum contamination, and after stimulation, the area was largest on the uncontaminated sample. It should be noted that on the 40th day, the biofilm area on Sample 3 was two times larger (15.5%) than the areas measured on the other samples. The formation of a more developed biofilm and the lower rate of biofilm deterioration on the most contaminated rock may indicate the important role of biofilms in microbial processes with a high nitrate background.
It should be added that, based on the analysis of 16S rRNA genes in the biofilms, on both samples the dominance of representatives of the families Comamonadaceae (genus Acidovorax) and Pseudomonadaceae (genus Pseudomonas) was observed.
The formation of biofilms on rocks led to a change in the sorption capacity of the samples towards uranium. Samples after 20 days of the experiment were used as sorbents (Figure 4, Table 6). The Kd values calculated from the experimental results are presented in Table 7. A notable increase in the Kd value occurred for the rock of Sample 3, with increases of 24% and 30.5% (for distillate and groundwater solutions, respectively), and for Sample 1, with values of 33% and 37%, caused by the coating of particles with biofilms. We associated the higher sorption characteristics for Sample 1 with the higher degree of biofilm coating of the particles, explained by an increase in the number of sorption sites on the polysaccharide matrix on the rock surface, including carboxyl and hydroxyl groups [40].

4.5. Change in Uranium Forms after Microbial Process Stimulation in the Groundwater Samples

Cascade filtration of the water of Sample 3 after stimulation of the microbiota by whey addition resulted in a clarified solution due to a decrease in suspended and colloidal particles. Most of the iron (92%), manganese (87%), and uranium (98%) in the sample changed to coarse particles (larger than 2.4 µm) that did not form stable suspensions. The proportion of dissolved uranium was approximately 1%. Thus, the formation of microbial metabolites provided uranium removal from the solution by forming bulky aggregates of more than 2.4 μm, reducing the risk of uranium migration in colloidal and pseudocolloidal forms (Figure 5).

4.6. Estimation of Biogeochemical Mineral Neoprecipitation

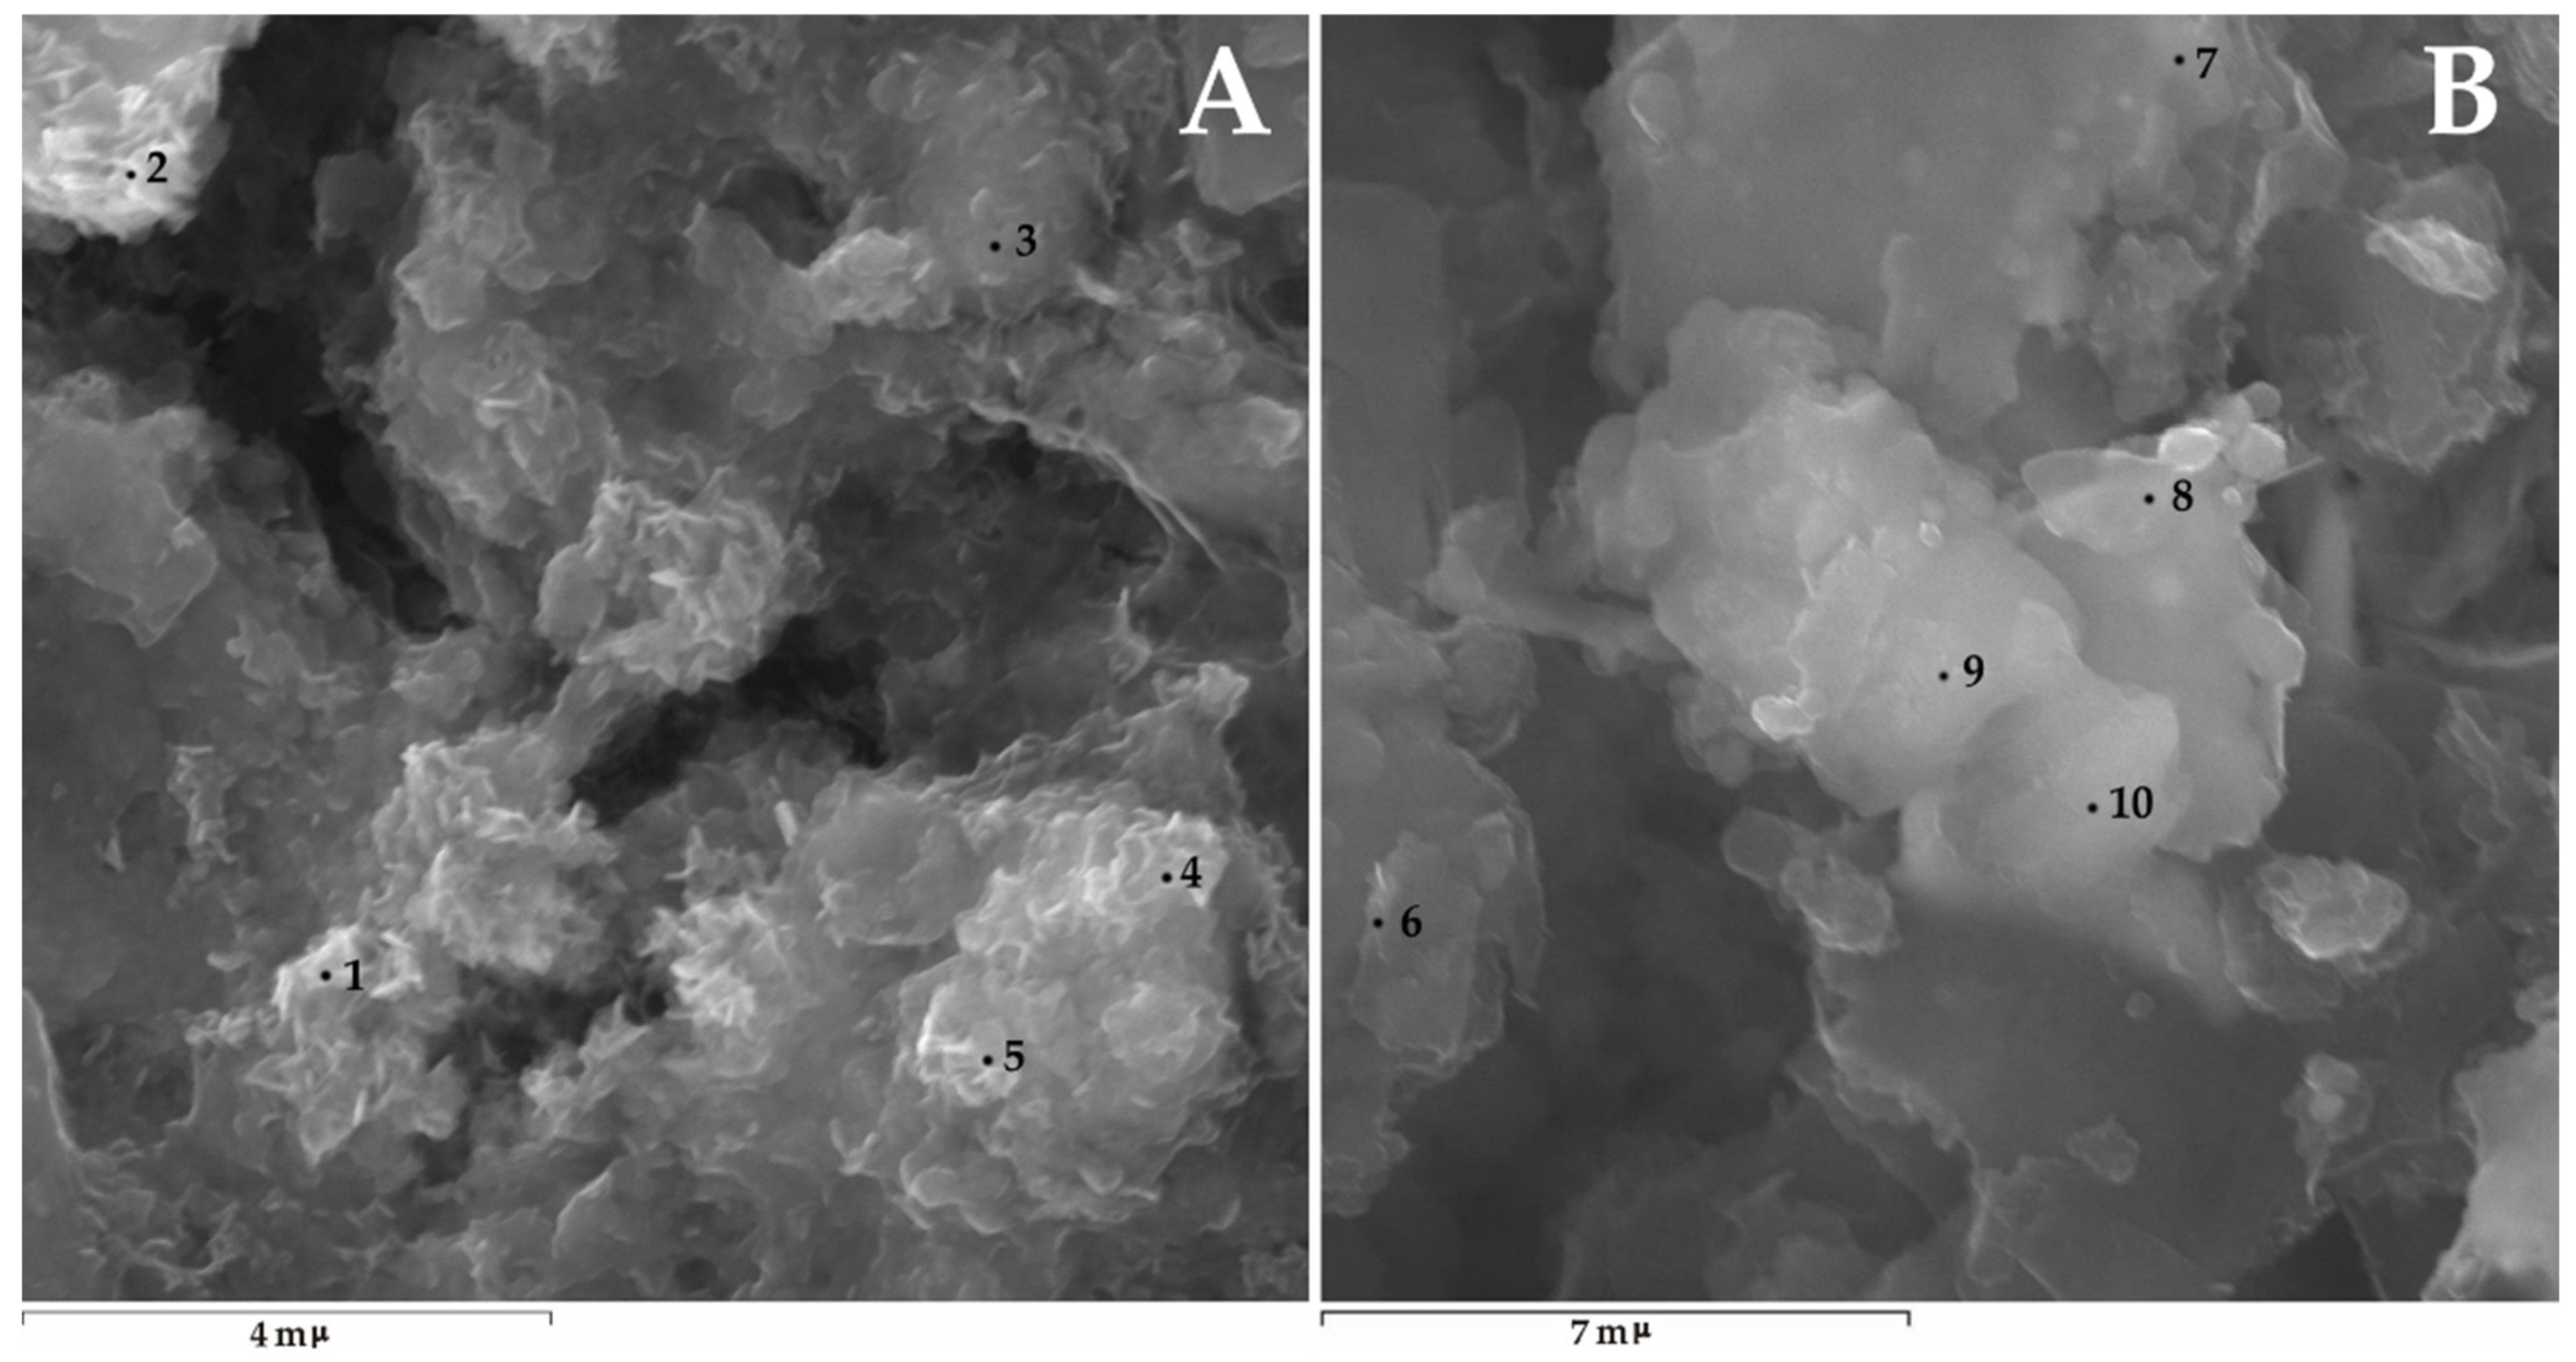
Two precipitate generation phenomena were recorded in the experiments after whey addition. The first (bright coloured) precipitate appeared a few hours after cultivation. The second (dark coloured) precipitate originated after the reduction of sulphate ions for 1–6 months. Scanning electron microscopy (SEM) solid-phase analysis revealed two dominant phases differing in both morphology and particle composition. The first phase (Figure 6A) is represented by heterogeneous particles with abundant sharp faces; the appearance of this phase in the first hours after mixing the solutions suggests that the disequilibrium of the solution arising from mixing is the source of its formation. The phase contains high concentrations of phosphorus and calcium without uranium. The second phase is a sintered aggregate containing a large number of spherical and elongated particles of 1–5 μm (Figure 6B). This phase contains considerably more S, Fe, Na, and K, with high concentrations of uranium of up to 5.36 wt. % (Table 8). According to the chemical composition, we may assume that sulphides were added to the first (apatite-like) phase over time, as evidenced by the sharp drop in the concentration of sulphate in the solution (Figure 3).
Based on the data obtained, it can be concluded that nitrate reduction can be successfully activated by the addition of organics to groundwater aquifers in situ. A decrease in nitrate concentration reduces the migration activity of uranium since the associated decrease in Eh leads to uranium reduction and immobilization. The risk-free prediction of uranium behaviour and risk assessment of uranium remobilization remain important tasks. There are a group of factors that determine the behaviour of uranium in biochemical processes and have different influences on its (im)mobilization. These factors include the following:
-
Microbial catabolic reduction of uranium, leading to the formation of an amorphous uranium phase (“biogenic uraninite”), which has a much higher solubility than other forms of uranium (uraninite logKs −4.84; UO2(am) logKs 0.11) and is very important for the design of more effective posttreatment reduction strategies.
-
Uranium sorption on rocks that can be covered by biofilms of different compositions and intensities. The effective sorption sites of rocks and the formation of new bioorganic bonding sites in the polysaccharide matrix of biofilms may overlap. In our case, the Kd value of uranium increased by 30.5% in the most polluted well (6169 mg/L NO3).
-
Changes in Eh and pH values, affecting the distribution of uranium forms, the solubility of mineral phases, including clay phases, and the bacterial community itself. Abiogenic and biogenic reduction processes contribute to Eh reduction and pH growth, which are sometimes above the optimal values for denitrification bacteria (2–4):
2.5. [-CH2O] + 2NO3 +2H+ = 2.5CO2 + N2(gas) + 3.5H2O
0.25. [-CH2O] + Fe(OOH) +2H+ = 0.25CO2 + 1.75H2O + Fe2+
[-CH2O] + 0.5SO42−. + 0.5H+ = 0.5HS + CO2 + H2O
-
The formation of carbonate species in solution and carbonate mineral phases during the oxidation of organics (2–4) can enhance the mobility of uranium due to stable carbonate complexes or modify the sorption properties of host rocks.
-
The formation of microbial metabolites that, on the one hand, inhibit nuclide migration when accumulating in biofilms and, on the other hand, enhance migration in the form of biocolloids (pseudocolloids), which mobilize uranium.
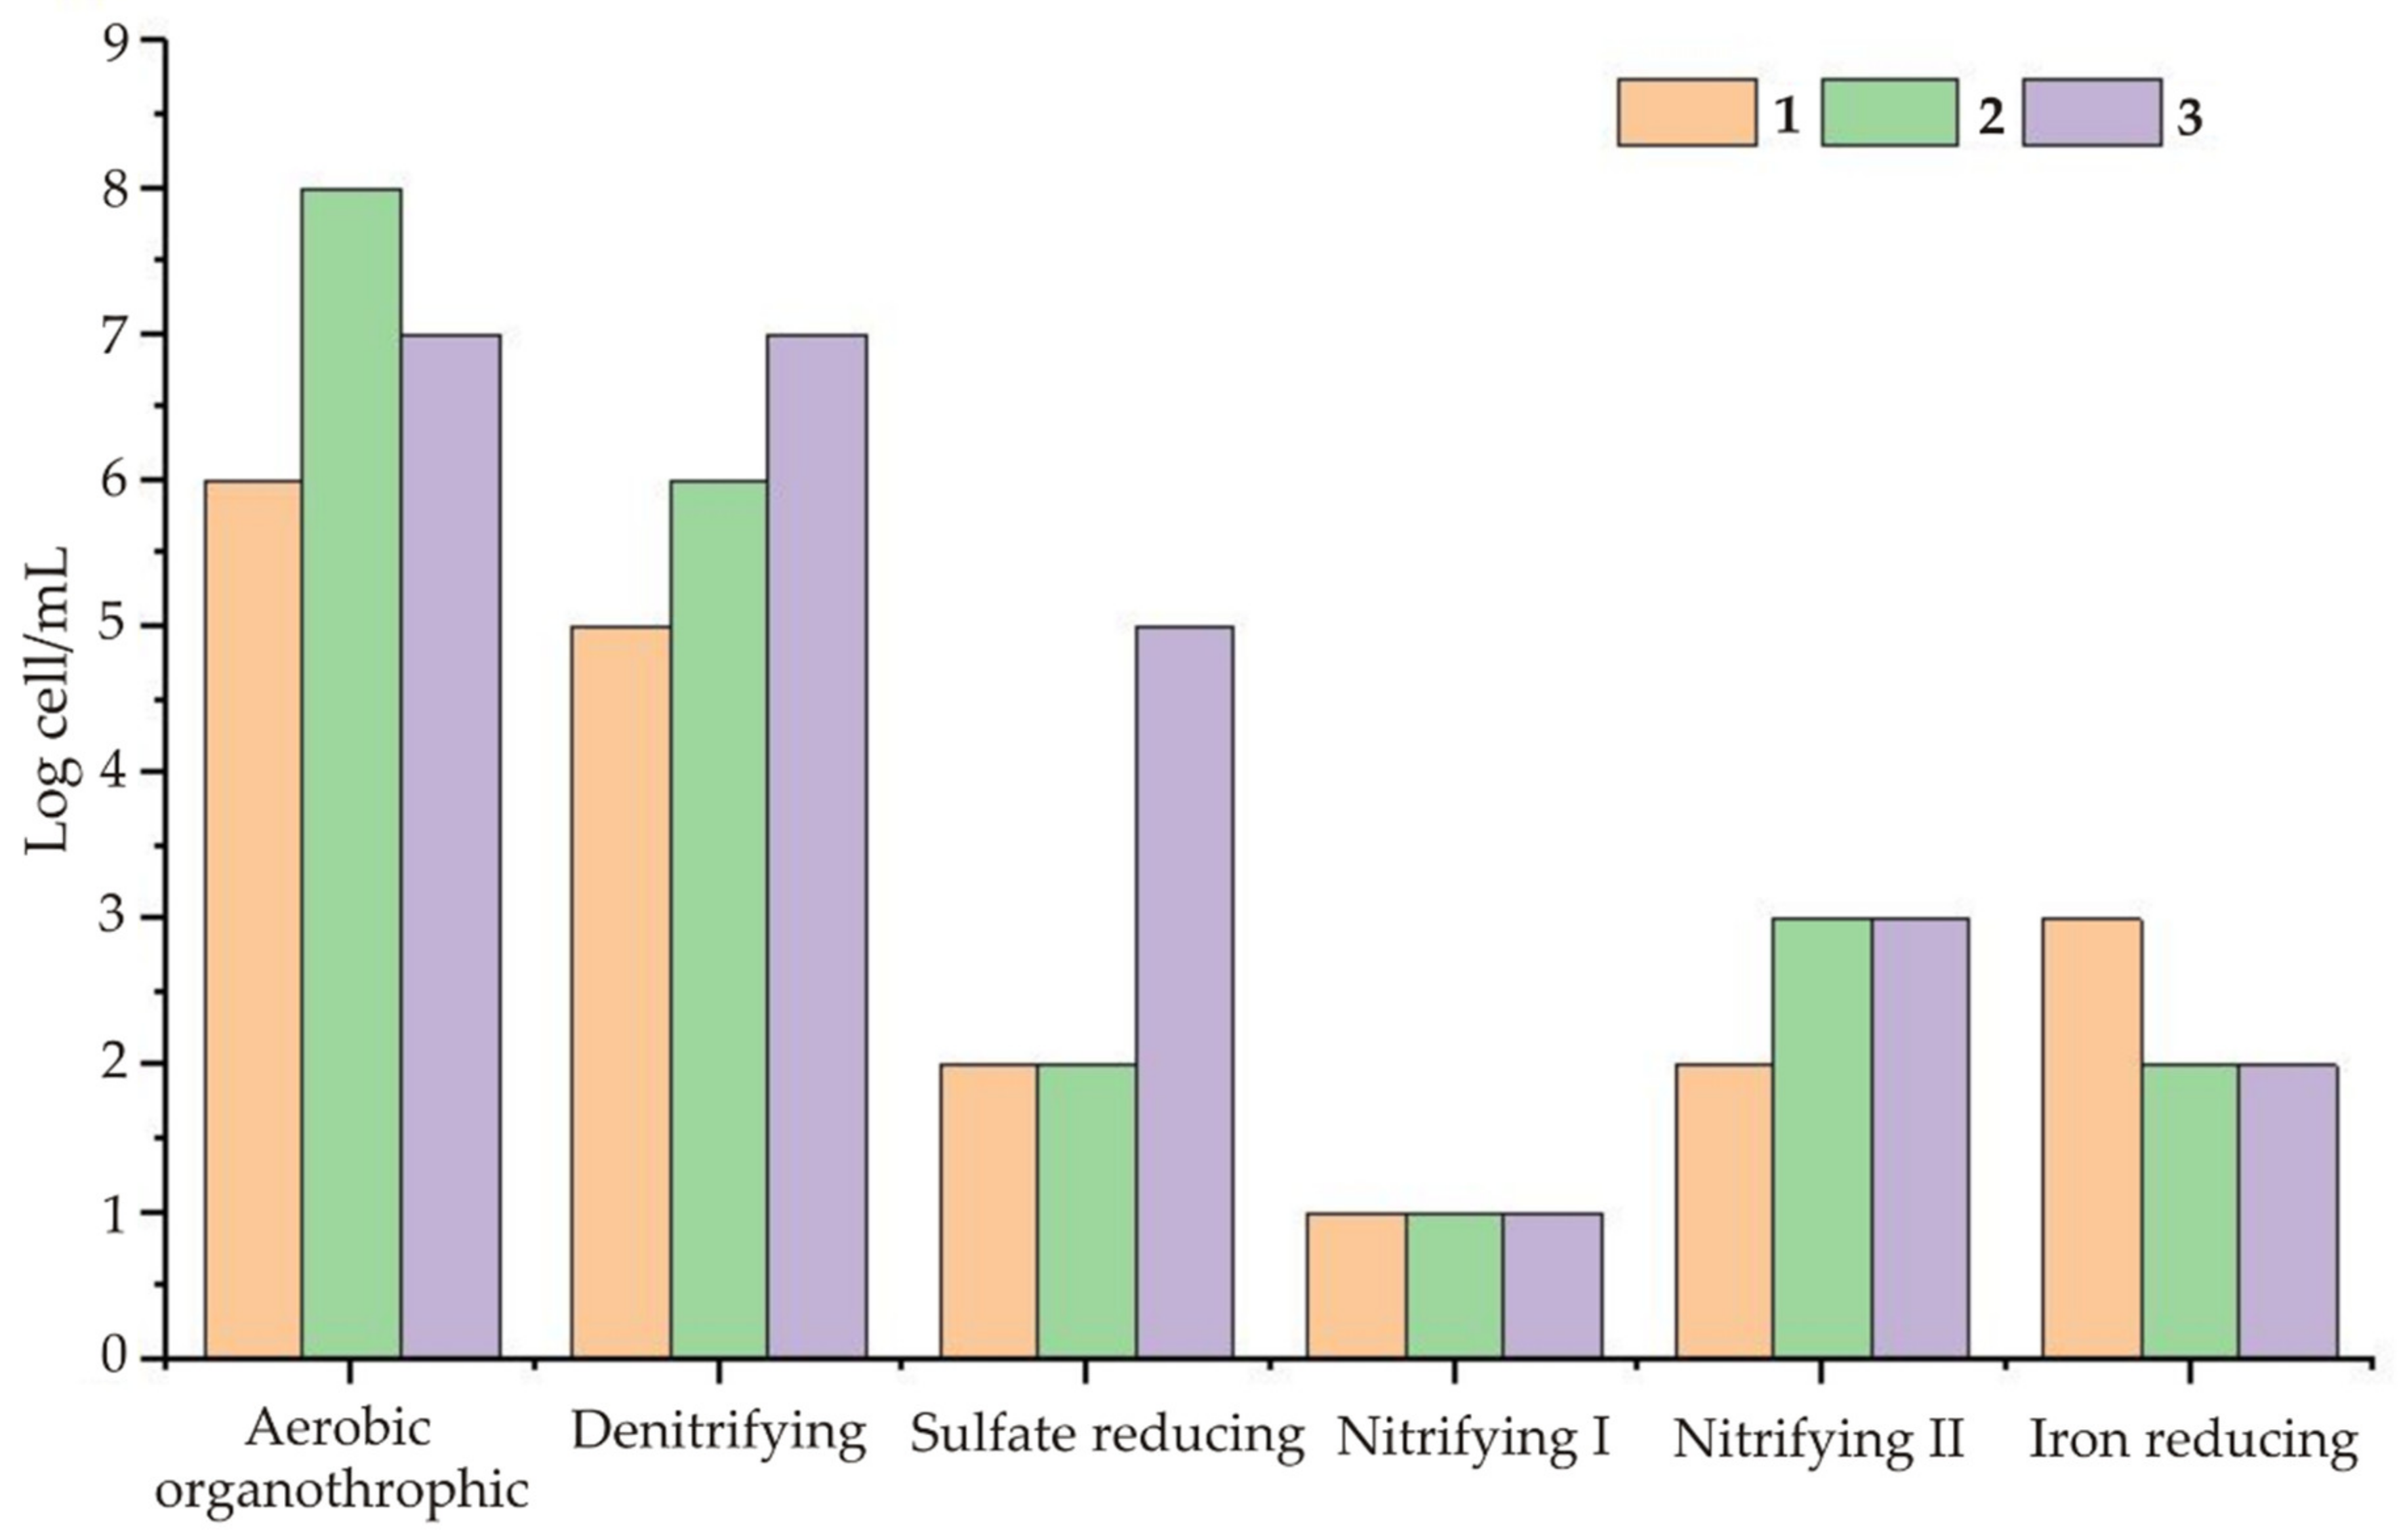
In addition to the above factors, the hydrogeochemical conditions at each facility play a crucial role. The maximum number of denitrifying and sulphate-reducing bacteria (Table 2) was found in Sample 3, which was taken from the most contaminated well. Moreover, uranium, like many other metals, can be used in enzymatic reactions as an oxidizer. The question is, at what concentration does nitrate lead to a decrease in the biological efficiency of uranium reduction? This question should be solved experimentally. In particular, in the laboratory experiments, after the addition of 50, 500, and 3000 mg/L of NO3 and 50, 100, and 200 mg/L of uranium to clean groundwater (Sample 1, Table 1), we observed that at nitrate concentrations of up to 500 mg/L, the microbial reduction efficiency of nitrate ions increased within 7 days. At high concentrations of NO3 and 200 mg/L of U(VI), pronounced retardation was recorded, up to 1.2%.
Microbial biofilm formation was studied under simulated underground aquifer conditions, and the maximum formation was observed on the 20th day. At the beginning of the experiment, the maximum intensity of respiratory metabolism of the attached microorganisms and the maximum coating area were observed on the rock from the contaminated well. The additional evidence that on the 40th day, the biofilm deterioration rate was lower on the rock from the highly contaminated sample than on rocks from other samples also indicates the importance and stability of the attached forms of microorganisms in conditions of high pollution. Since polysaccharides are the main component of biofilms, sometimes occupying up to 95% of the total area of the biofilm, their contribution to the immobilization of uranyl should be treated as the most vital. The surface of the polysaccharide matrix contains a wide variety of functional groups, primarily hydroxyl, carboxyl, carbonyl, and sometimes amino groups. In one of our publications, we performed a detailed analysis of the interaction of uranyl ions with the functional groups of o-polysaccharides isolated from the bacterium Pseudomonas veronii, a common biofilm inhabitant. Carbonyl groups have been found to play a major role at neutral pH values [41]. Kazy et al. [42] provided evidence of uranium bonding with the extracellular polysaccharides (EPS) produced by Pseudomonas aeruginosa strain BU2 involving carboxylic groups at pH 5.0, whereas at lower pH values, amino and hydroxyl groups played a major role. It is worth noting that biofilms are a condition for the immobilization of other compounds, primarily iron, calcium, and chromium, that contribute to the formation of new mineral phases in biofilms (calcites, ferrihydrites, etc.) [43] that are known for their high sorption capacity for many actinides [44]. Taking into account the possibility of stimulating microbial processes, microbial growth on rocks can therefore be an important factor in the immobilization of uranium in the form of organic and organomineral deposits in local areas.
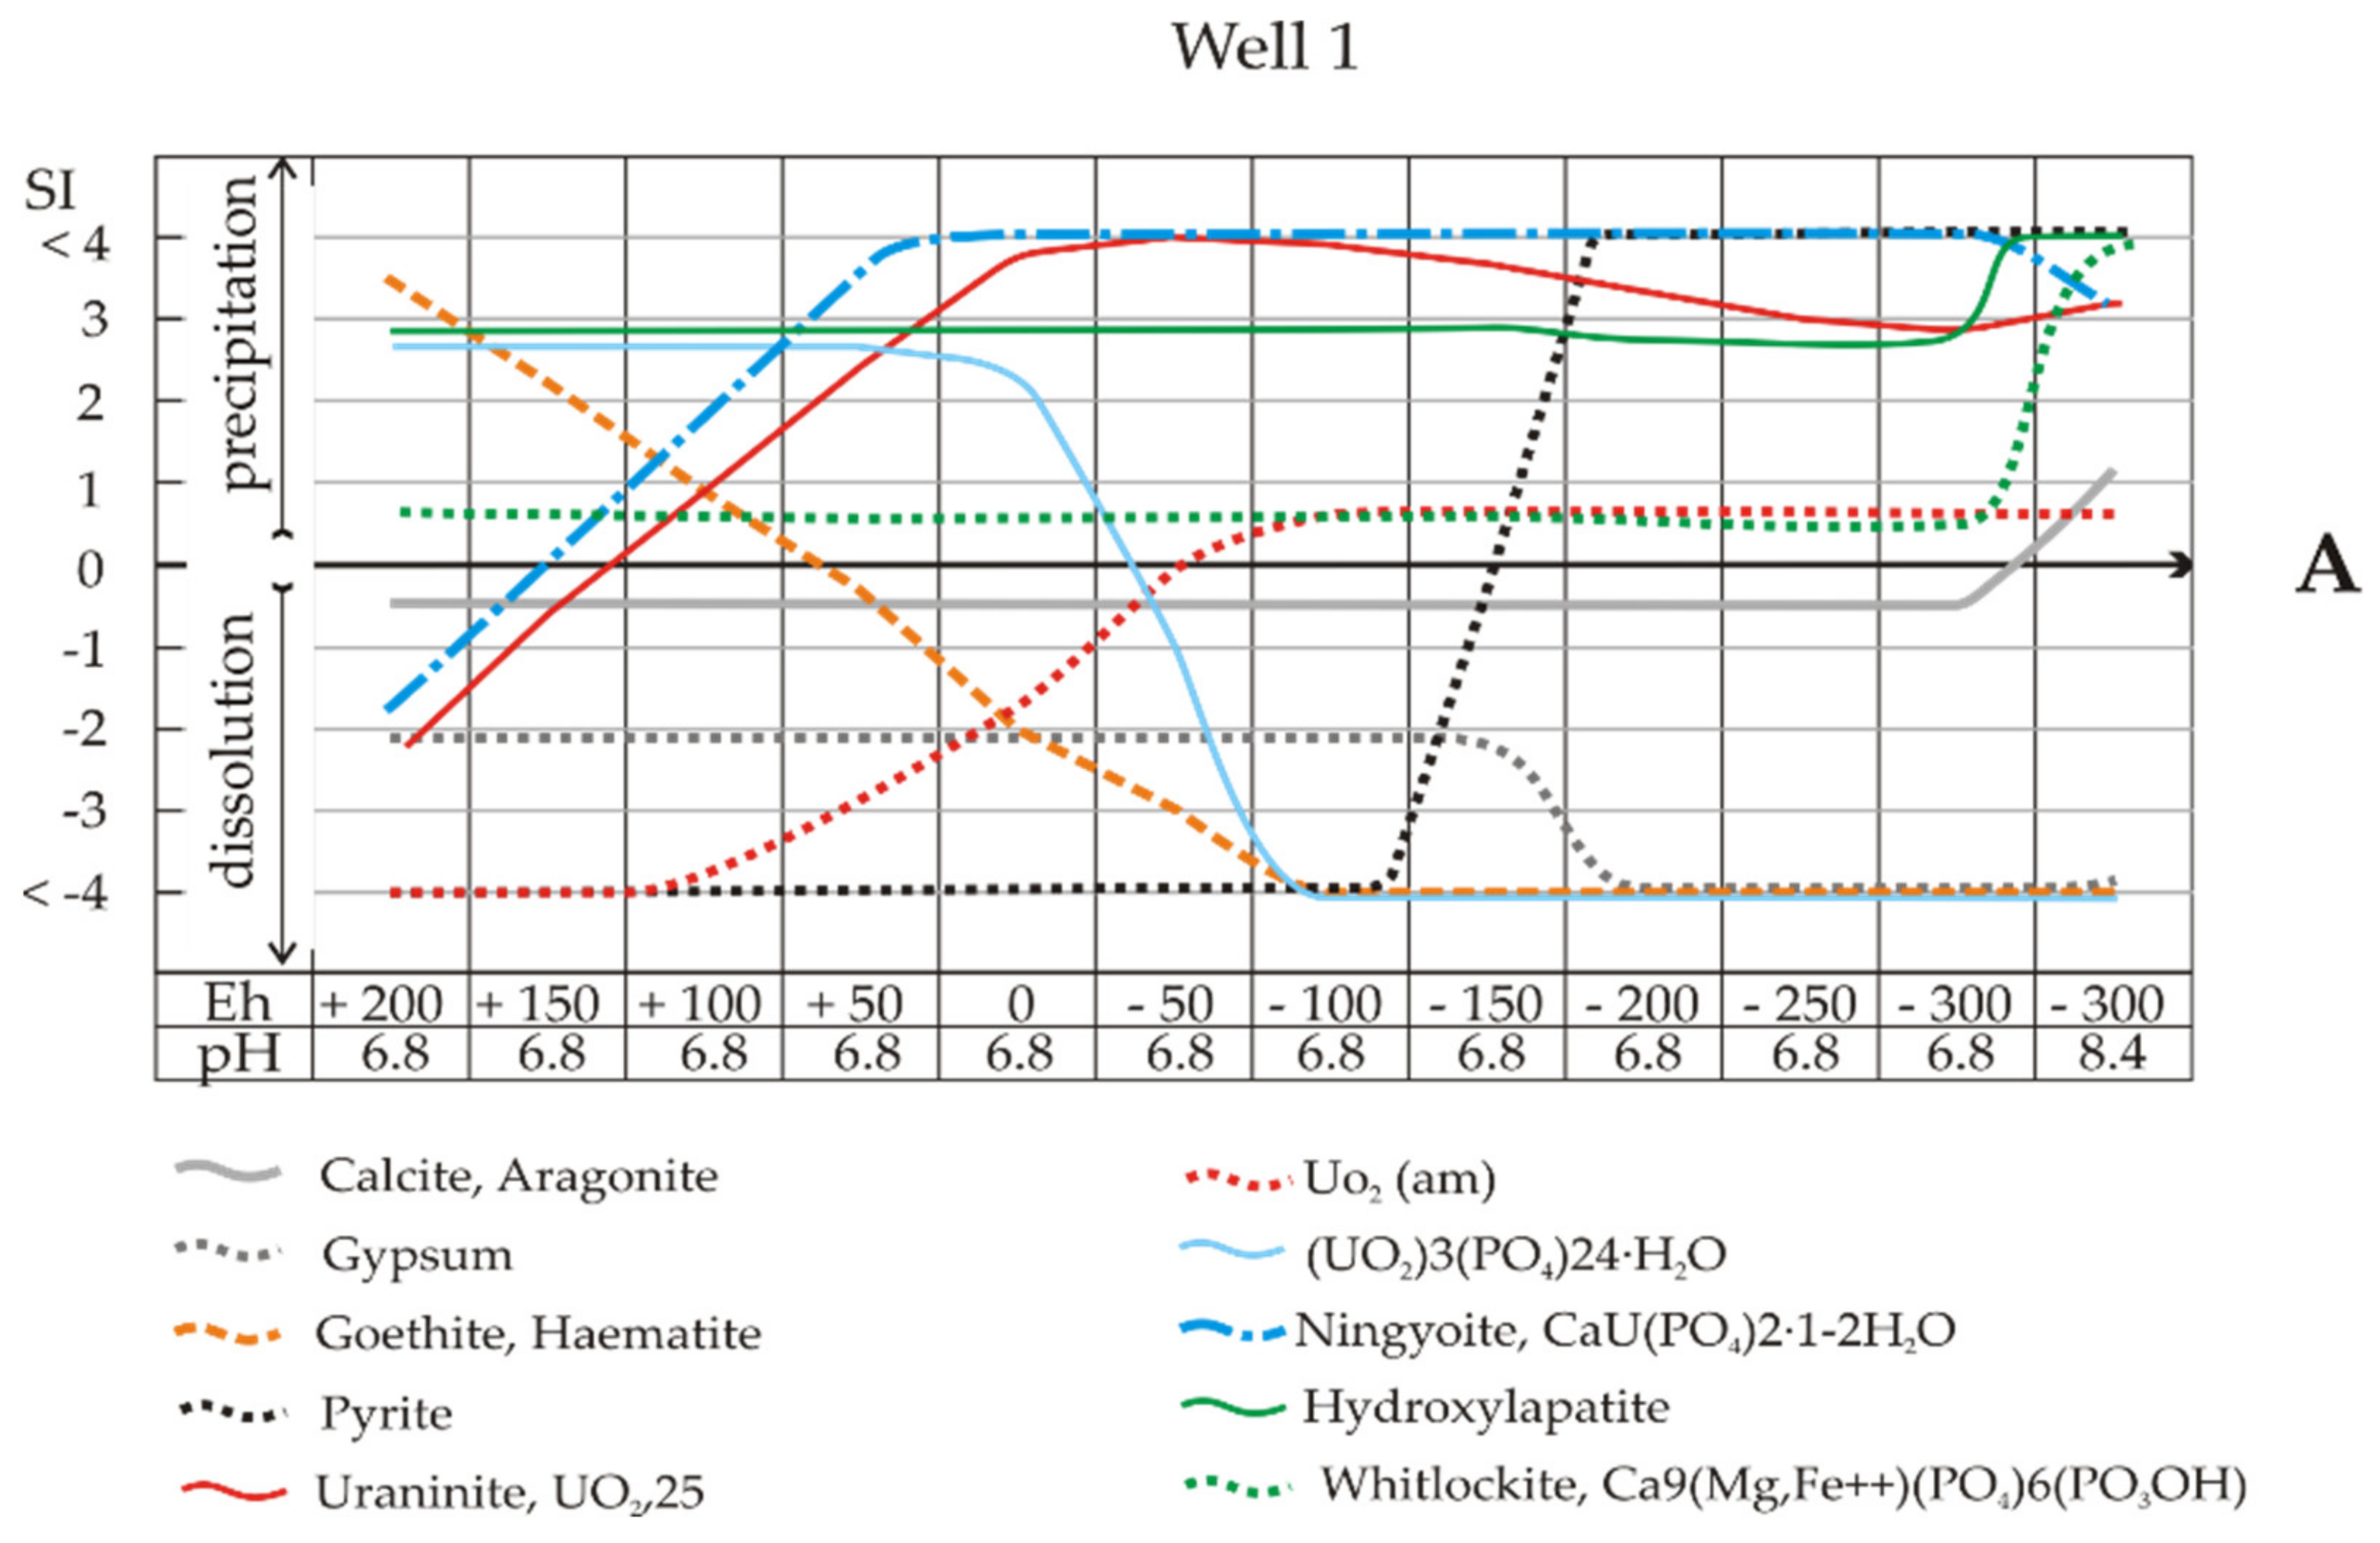
Calculating the SIs of solutions with respect to certain minerals in a wide range of redox conditions is important for the development of remediation practices since SI reveals how microbial activity changes Eh (Figure 3). Recall that in the model calculations, 10 mg/L of uranium was added, corresponding to the simulated, not natural, solutions. Phosphates appeared due to the addition of whey to stimulate biota development. Thermodynamic modelling of the element speciation in sampled in situ solutions allowed us to track the change in valence of a number of elements at different Eh values (Table 2). It should be added that the main calculation was performed at a fixed pH (e.g., 6.8). Microbial denitrification is known to be followed by an increase in pH [45,46]. In our experiments, no visible change in pH was observed; however, such a process cannot be completely excluded with a high content of nitrate. In the calculations, conditions with more alkaline solution values were therefore simulated to show the direction of the possible evolution of the system when the pH changed.
At pH 6.8 and Eh −100 mV (Well 1 and Sample 1), the mobility of uranium can be limited by the deposition of UO2(am) (Figure 7A), but these are the boundary pH-Eh conditions. Even a small amount of oxygen access (shifting to the left along the X-axis) will lead to the failure of pyrite deposition due to the lack of sulphide (black dots) and the preservation of uranium in solution. Note that at the same critical point, the solutions are completely undersaturated towards iron hydroxides (brown dotted line) and uranium phosphate (UO2)3(PO4)2·2-4H2O (blue line). Natural background water is undersaturated with respect to calcite and biomineral aragonite at up to Eh −300 mV (pH 6.8), and the water will thus be vulnerable to acid drainage. Leaching of the system will result in the supersaturation of the solution with hydrocarbonate ions and calcite precipitation.
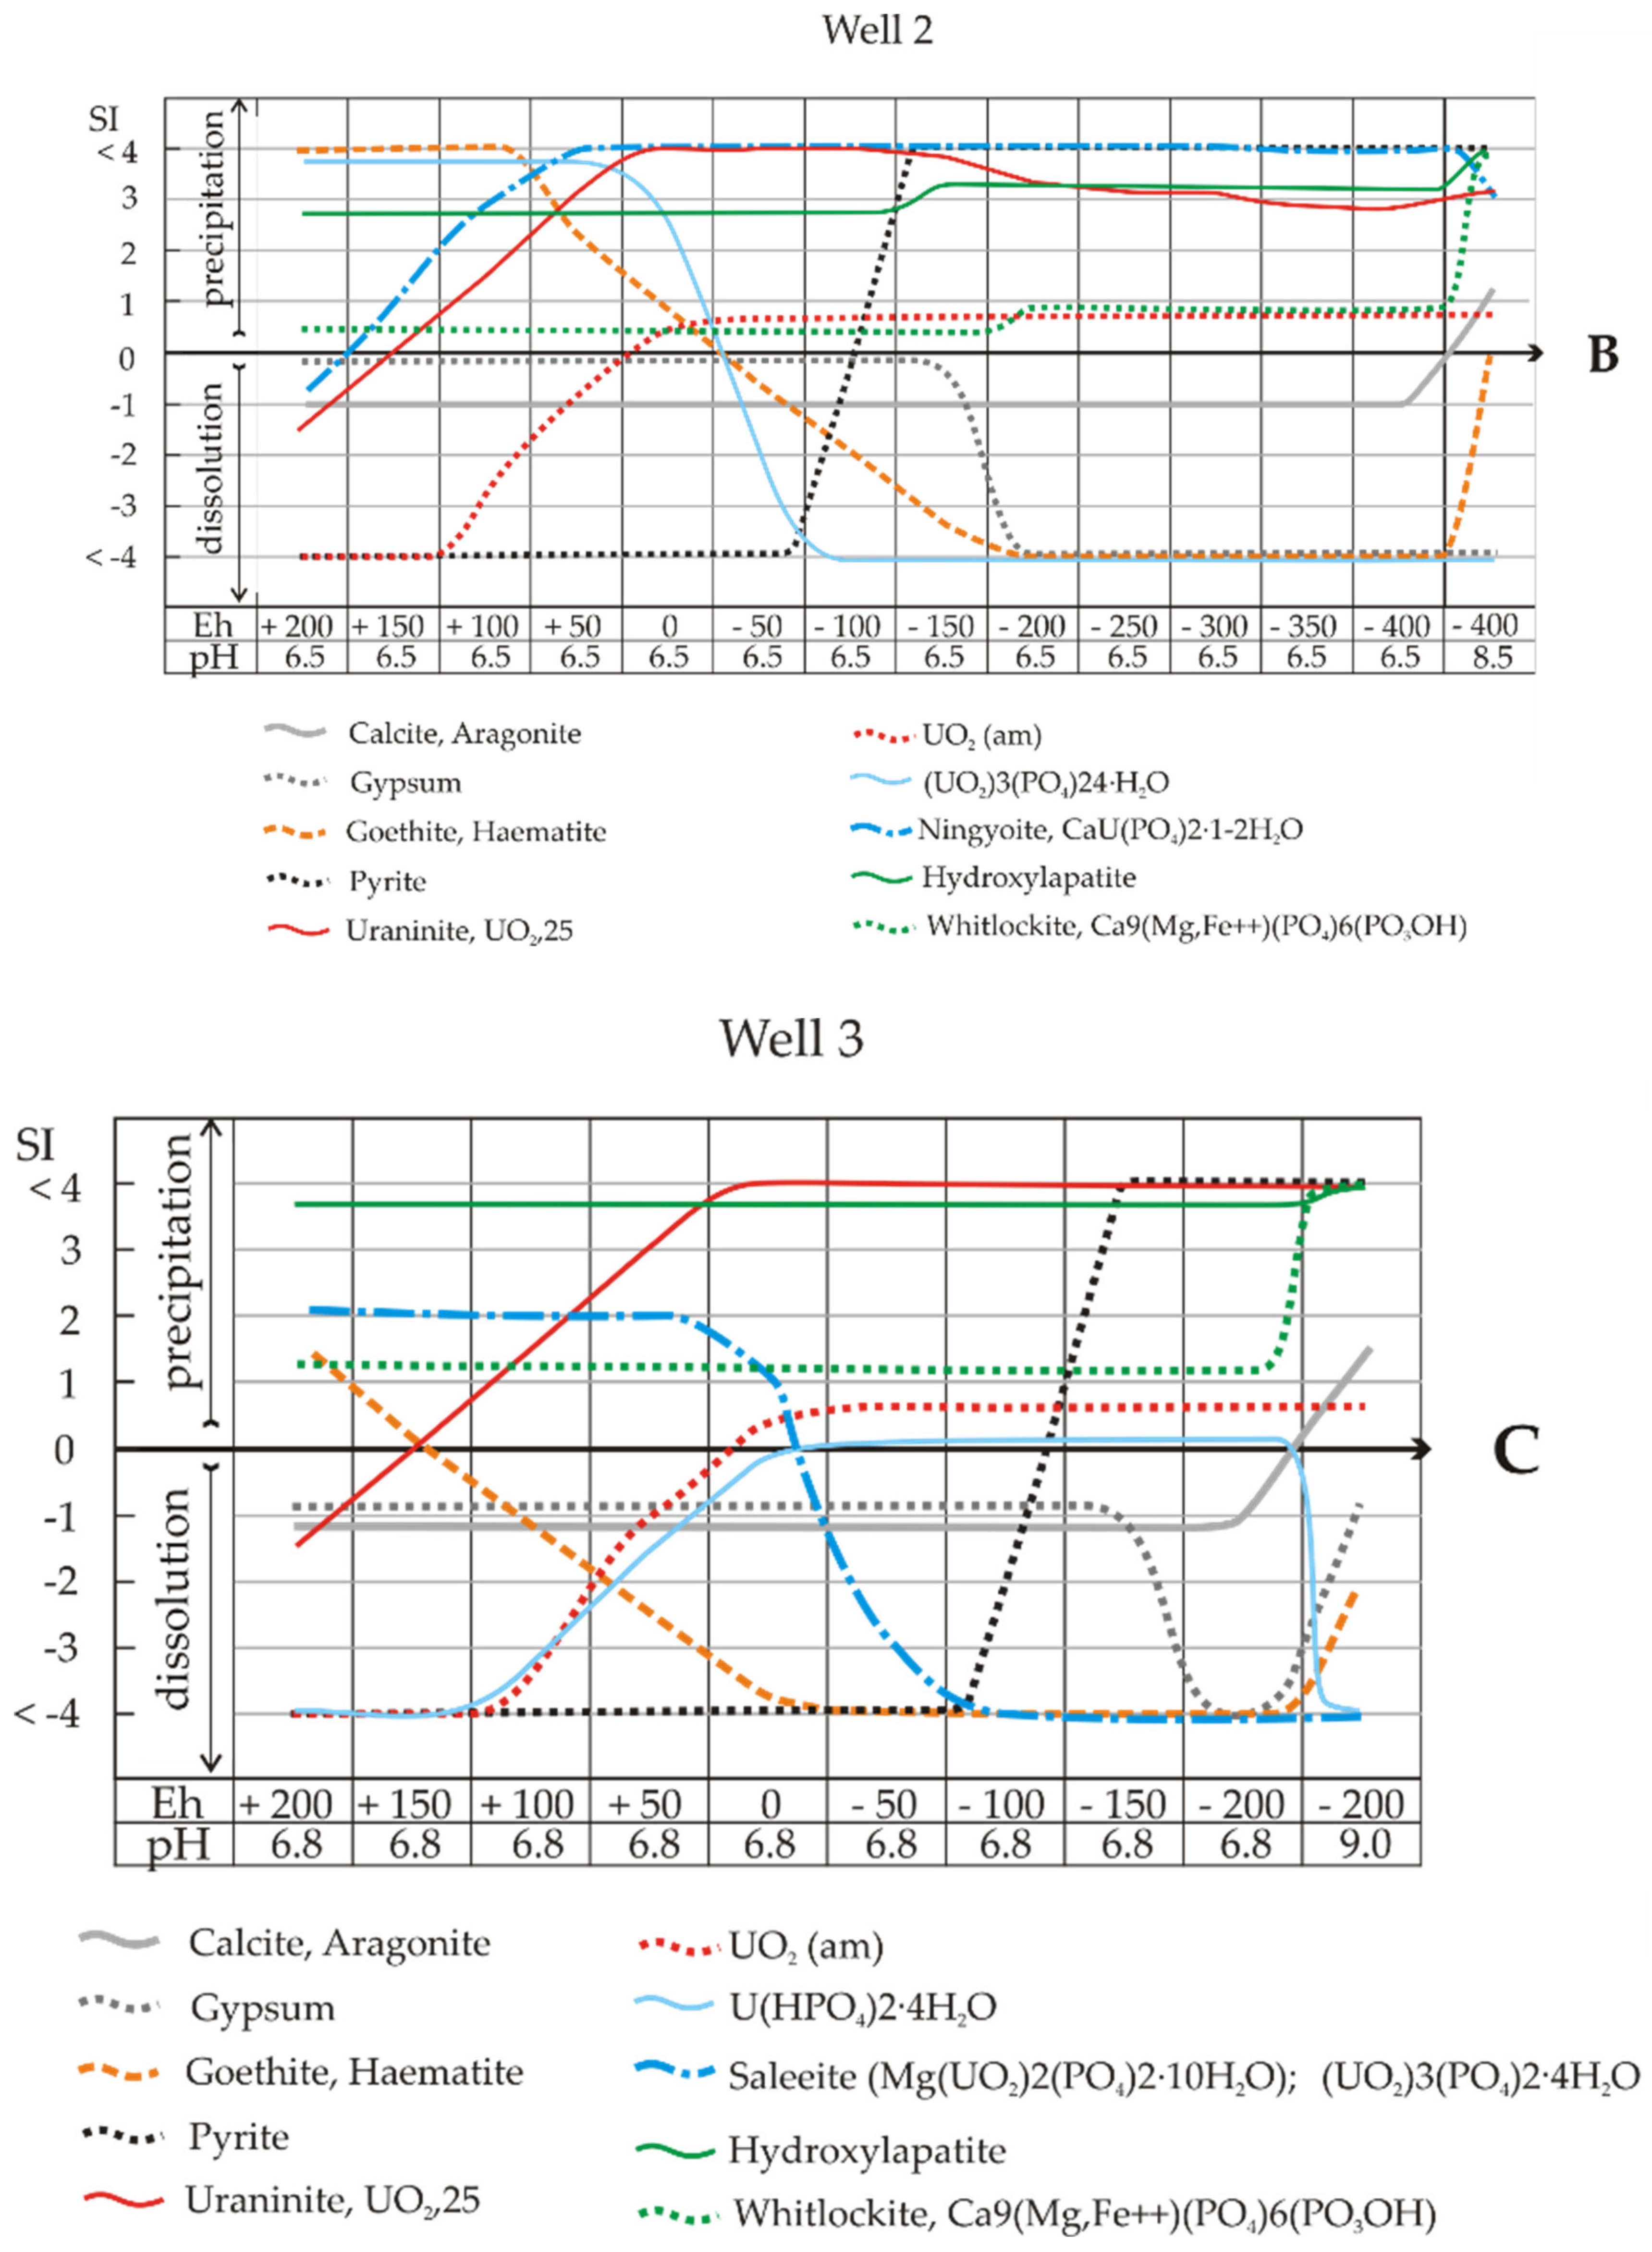
In Sample 2 (Well 2), the processes of nitrate and sulphate removal were quite slow in the experiment (complete reduction on the 20th and 60th days, respectively). Nevertheless, we observed an Eh value of −400 mV on the 15th day of the experiment. Thus, according to the model calculations, under biota stimulation in Sample 2, the removal of uranium from solution’n may occur primarily due to the precipitation of (UO2)3(PO4)2·2-4H2O phosphates and subsequently of U(IV) oxides. The SI lines of these chemical species intersect at 0/−50 mV. This means that on the left side of the graph (Eh > −50 mV), phosphates should be precipitated from the solution, and a white precipitate should be formed, while at Eh < −50 mV, a black precipitate should be formed because of pyrite deposition (as in the experiment). However, the uranium content in the white precipitate is below the detection limit;, i.e., these are common calcium phosphates (see Table 7). As in the previous case, leaching of the system will cause the solution to be supersaturated with hydrocarbonate ions and calcite precipitation. Under these conditions, goethite and hydrogoethite reach equilibrium, and their dissolution ceases.
A recent article on uranium phosphates demonstrated that uranyl–phosphate minerals can maintain extremely low levels of aqueous uranium in groundwater due to their low solubility [47]. Once formed, such minerals are relatively insensitive to the system redox potential and are also more resistant to dissolution than other uranium minerals under oxic conditions outside of their stability fields [48]. However, the pH range and phosphate-to-bicarbonate ratio need to be precisely adjusted to the correct values to achieve phosphate formation, and the exact conditions depend on the uranium and phosphorous starting concentrations. Future experimental work should be performed to understand the connections between solution chemistry and uranium mineral composition under our conditions (Samples 1–3).
The solutions were undersaturated with respect to calcite (SI = −1), although they were in equilibrium with gypsum to Eh -200 mV, i.e., at the beginning of the intensive bacterial reduction of sulphate. As shown above (reactions 2–4), during bacterial reduction, proton uptake reactions occur, and the pH increases. On the right side of Figure 7A,B, at an alkaline pH of 8.5, the supersaturation of the solution towards biogenic carbonates is seen. The influence of uranyl speciation and iron oxides on uranium biogeochemical redox reactions was discussed previously [49]. The presence of calcium in carbonate-bearing solutions promotes the formation of ternary complexes, Ca2UO2(CO3)3 and CaUO2(CO3)32−, which have a profound impact on U biogeochemistry by decreasing both microbial and abiotic reduction rates. This is clear evidence; moreover, note that at pH 8.5 and Eh -400 mV, there is a peak in the formation of goethite or haematite corresponding to a sharp extension of their stability fields in the Eh-pH plots (Table 8). According to the cited authors, “goethite and haematite act as sorbents of Ca and, as a result, decrease the proportion of less-reduced Ca2UO2(CO3)3 species, thus increasing the rate of microbial reduction of uranium compared to that in systems with no ferrihydrite”.
The calculation of SIs showed oversaturation of the solution of Sample 2 with respect to ningyoite–phosphate U(IV) at all Eh values (Figure 7B). Ningyoite is a rare mineral; however, U(IV)–phosphate minerals may play an important role in U retention in mining-contaminated wetlands and as possible products of microbial U(VI) reduction [50].
In Sample 3, from the well with maximum pollution, the composition of mineral associations during the Eh decrease changed considerably compared to the results in Figure 7A,B. First, in the experiment, even on the 180th day, an Eh of only -200 mV was achieved. Second, ningyoite CaU(PO4)2·1-2H2O dissolved, which corresponded to a high and permanent supersaturation of the pure solutions. Instead of ningyoite, U(VI) phosphates appeared—saleeite Mg(UO2)2(PO4)2·10H2O or (UO2)3(PO4)2·4H2O. These solutions are generally in close equilibrium with UO2(am) until strong alkaline conditions, which cause a rapid increase in the stability of ion–uranyl carbonate complexes. Although Sample 3 had 30 times more calcium than Sample 2, the solutions were also undersaturated with respect to gypsum and calcite (SI = -1) until the end of the experiment (in the calculations, pH 6.8 and Eh -200 mV). We can assume that calcium in solid precipitates is predominantly in the form of whitlockite and hydroxylapatite phosphates. The point in Figure 7C is very interesting (pH 6.8, Eh -100 mV). Computations showed that here, the solutions became saturated with pyrite and remaining sulphate. At pH > 6.8 and Eh -200 mV, the solutions were highly supersaturated towards pyrite, and gypsum dissolved (only sulphide was present in the solution). In the experiment, this reaction took place on the 180th day.
It is well known that biological processes depend on the redox of electron donor and acceptor pairs [51,52]. Obviously, with a shift in Eh from oxidizing conditions to anoxic conditions, the reduction of nitrate occurs first (as in our experiment), followed by Mn and then the Fe(OH)3/Fe2+ pair (reduction of Fe(III)). Sulphur reduction should occur after iron reduction, and uranium reduction is highly dependent on the presence of uranium carbonate complexes. In low-CO2 media (black arrow), the UO22+/U4+ equilibrium lies in the zone of iron reduction, and there is a dramatic shift in the UO2(CO3)34−/U4+ equilibrium in the direction of decreasing Eh to a region close to that of methanogenesis.
Thus, it becomes clear why the reduced sulphide forms of Fe(II) generated by sulphate-reducing bacteria are extremely important for systems containing uranium. When oxidizing conditions change to reducing conditions during oxygen consumption and nitrate-sulphate reduction [11], iron and manganese are first reduced to pyrite FeS2, mackinawite, FeS0.9, and alabandine MnS and then to uranyl ions [53]. A reduction buffer was therefore formed to prevent possible reoxidation of uranium in the system.
The calculation considering a possible increase in pH, as a consequence of the denitrification process, revealed the main difference in the appearance of carbonates among the precipitates, primarily calcite. No significant changes were found in the uranium phases. It should be pointed out that in the natural conditions of contact between solutions and rocks, minerals will serve as a buffer for increased alkalinity.
In our laboratory experiments, the required database was obtained for the aquifer bioremediation process near NCCP. However, after the effective experimental tests of in situ uranium bioremediation processes at different objects, we assume that laboratory modelling of the biotreatment at the first stage of the work is a key to the successful completion of bioremediation. It should be added that the results obtained in our computations are consistent with those in a number of field experiments [54,55,56,57,58,59].
The formation of various biogenic mineral phases—phosphate uranium precipitates, calcite, pyrite FeS2, and mackinawite—has been reported in many publications. The formation of biogenic ferrous deposits in the bioremediation of uranium pollution not only provides the immobilization conditions of uranium by the sorption mechanisms on new phases but also promotes their further mineralization and stronger fixation [60,61], including the inhibition of subsequent oxidation [62]. According to numerous papers, microbial biofilms contribute to the mineralization of ferrous minerals, in particular haematite and pyrite [63,64,65].

5. Conclusions

The behaviour of uranyl ions in the shallow aquifers of the NCCP territory, if sufficient organic matter is present, can be determined from the contributions of aerobic and anaerobic microbial and geochemical processes. Microbial-mediated Eh reduction (due to aerobic microbial metabolism) is an important factor in the reduction of uranium and other heavy metals. It was shown by experiments that depending on the concentrations of nitrate and sulphate ions in solution, the kinetics of their reduction differ considerably, and uranium reduction is therefore delayed with its transformation to a solid phase.
The forms of uranium migration, as evidenced by cascade filtration, depended on the chemical composition of the solutions, the Eh–pH environment, and the presence of microbial communities. In particular, the formation of microbial metabolites influenced the removal of uranium from the solution by forming bulky aggregates of more than 2.4 μm, reducing the risk of uranium migration in colloidal and pseudocolloidal forms.
We presented new data on changes in the amount and quality of biota during the transition from background conditions to the drainage flow of contaminated groundwater. In the water from the most polluted well, a maximum number of denitrifying and sulphate-reducing bacteria (e.g., Sulfurimonas) was detected. 16S rRNA gene analysis of the microbial community after whey addition demonstrated a catastrophic decrease in microbial diversity and the dominance of representatives of the genera Rhodococcus and Rhodobacter. Physicochemical modelling of the stepwise processes affecting the distribution of transition elements between the solution and the solid phase showed that the precipitation of two types of compounds—phosphates (PO43− was supplemented with whey addition) and U(IV) oxides—promoted the removal of uranium. Oxides of U(IV) appeared when sulphate was reduced, and pyrite (black precipitate) formed. The experiments showed no formation of uranium-containing phosphates.
It was concluded that the reduction of nitrates, sulphates, iron, and uranium could be activated successfully by adding nutritive solutions to microbial communities under conditions consistent with those of formation water in the NCCP region, suggesting the potential for the sustainable purification of contaminated aquifers by further in situ bioremediation.

Author Contributions

Conceptualization—A.V.S., A.E.B.; methodology—A.V.S., A.E.B., O.L.G., K.A.B., O.S.S. K.A.B.; formal Analysis—O.S.S., A.A.K., N.M.P.; data curation—A.E.B.; visualization—A.E.B., A.V.S., N.M.P.; writing—original draft preparation—A.V.S., A.E.B., O.S.S.; writing—review and editing—O.L.G., O.S.S.; supervision—O.L.G., A.E.B., A.V.S. All authors have read and agreed to the published version of the manuscript.

Funding

The study was funded by the Russian Foundation for Basic Research, project 20-05-00602 A (fieldwork, cascade filtration, study of elemental speciation); the Russian Science Foundation, project 18-77-10029 (fieldwork, chemical analyses, sorption experiments); the State Assignment of the Sobolev Institute of Geology and Mineralogy, Siberian Branch of the Russian Academy of Sciences (thermodynamic modelling).

Institutional Review Board Statement

Not applicable.

Informed Consent Statement

Not applicable.

Data Availability Statement

Data is contained within the article or supplementary material.

Conflicts of Interest

The authors declare no conflicts interests.

References

  1. IAEA. Environmental contamination from uranium production facilities and their remediation. In Proceedings of the an International Workshop, Lisbon, Portugal, 11–13 February 2004; IAEA: Vienna, Austria, 2005. Available online: https://www-pub.iaea.org/MTCD/Publications/PDF/Pub1228_web.pdf (accessed on 20 November 2020).
  2. Boguslavsky, A.E.; Gaskova, O.L.; Naymushina, O.S.; Popova, N.M.; Safonov, A.V. Environmental monitoring of low-level radioactive waste disposal in electrochemical plant facilities in Zelenogorsk, Russia. Appl. Geochem. 2020, 119, 104598. [Google Scholar] [CrossRef]
  3. Gaskova, O.L.; Boguslavskiy, A.E. Groundwater geochemistry near the storage sites of low-level radioactive waste: Implications for uranium migration. Procedia Earth Planet. Sci. 2013, 7, 288–291. [Google Scholar] [CrossRef] [Green Version]
  4. Lovley, D.R.; Phillips, E.J.P.; Gorby, Y.A.; Landa, E.R. Microbial reduction of uranium. Nature 1991, 350, 413–416. [Google Scholar] [CrossRef]
  5. Newsome, L.; Morris, K.; Trivedi, D.; Atherton, N.; Lloyd, J.R. Microbial reduction of uranium(VI) in sediments of different lithologies collected from Sellafield. Appl. Geochem. 2014, 51, 55–64. [Google Scholar] [CrossRef]
  6. Safonov, A.V.; Babich, T.L.; Sokolova, D.S.; Grouzdev, D.S.; Tourova, T.P.; Poltaraus, A.B.; Zakharova, E.V.; Merkel, A.Y.; Novikov, A.P.; Nazina, T.N. Microbial community and in situ bioremediation of groundwater by nitrate removal in the zone of a radioactive waste surface repository. Front. Microbiol. 2018, 9, 1985. [Google Scholar] [CrossRef] [PubMed]
  7. Manobala, T.; Shukla, S.K.; Rao, T.S.; Kumar, M.D. Kinetic modelling of the uranium biosorption by Deinococcus radiodurans biofilm. Chemosphere 2020, 269, 128722. [Google Scholar] [CrossRef] [PubMed]
  8. Cao, B.; Ahmed, B.; Kennedy, D.W.; Wang, Z.; Shi, L.; Marshall, M.J.; Fredrickson, J.K.; Isern, N.G.; Majors, P.D.; Beyenal, H. Contribution of extracellular polymeric substances from Shewanella sp. HRCR-1 biofilms to U(VI) immobilization. Environ. Sci. Technol. 2011, 45, 5483–5490. [Google Scholar] [CrossRef] [PubMed]
  9. Majumder, E.L.-W.; Wall, J.D. Uranium bio-transformations: Chemical or biological processes. Open J. Inorg. Chem. 2017, 7, 28–60. [Google Scholar] [CrossRef] [Green Version]
  10. Zhao, C.; Li, X.; Ding, C.; Liao, J.; Du, L.; Yang, J.; Yang, Y.; Zhang, D.; Tang, J.; Liu, N.; et al. Characterization of uranium bioaccumulation on a fungal isolate Geotrichum sp. dwc-1 as investigated by FTIR, TEM and XPS. J. Radioanal. Nucl. Chem. 2016, 310, 165–175. [Google Scholar] [CrossRef]
  11. Bonnetti, C.; Xiaodong, L.; Yan, Z.; Cuney, M.; Michels, R.; Malartre, F.; Mercadier, J.; Cai, J. Coupled uranium mineralisation and bacterial sulphate reduction for the genesis of the Baxingtu sandstone-hosted U deposit, SW Songliao Basin, NE China. Ore Geol. Rev. 2017, 82, 108–129. [Google Scholar] [CrossRef]
  12. Zhengji, Y. Microbial removal of uranyl by sulfate reducing bacteria in the presence of Fe(III) (hydr) oxides. J. Environ. Radioact. 2010, 101, 700–705. [Google Scholar] [CrossRef]
  13. Newsome, L.; Morris, K.; Lloyd, J.R. Uranium biominerals precipitated by an environmental isolate of Serratia under anaerobic conditions. PLoS ONE 2015, 10, e0132392. [Google Scholar] [CrossRef]
  14. Berk, V.W.; Fu, O.Y. Redox roll-front mobilization of geogenic uranium by nitrate input into aquifers: Risks for groundwater resources. Environ. Sci. Technol. 2017, 51, 337–345. [Google Scholar] [CrossRef]
  15. Komlos, J.; Peacock, A.; Kukkadapu, R.K.; Jaffe, P.R. Long-term dynamics of uranium reduction/reoxidation under low sulfate conditions. Geochim. Cosmochim. Acta 2008, 72, 3603–3615. [Google Scholar] [CrossRef] [Green Version]
  16. Safonov, A.V.; Andryushchenko, N.D.; Ivanov, P.V.; Boldyrev, K.A.; Babich, T.L.; German, K.E.; Zakharova, E.V. Biogenic factors of radionuclide immobilization on sandy rocks of upper aquifers. Radiochemistry 2019, 61, 99–108. [Google Scholar] [CrossRef]
  17. IAEA-TECDOC-1403. The Long-Term Stabilization of Uranium Mill Tailings; Final Report of a Co-Ordinated Research Project 2000–2004; IAEA: Vienna, Austria, 2004. [Google Scholar]
  18. North, N.N.; Dollhopf, S.L.; Petrie, L.; Istok, J.D.; Balkwill, D.L.; Kostka, J.E. Change in bacterial community structure during in situ biostimulation of subsurface sediment cocontaminated with uranium and nitrate. Appl. Environ. Microbiol. 2004, 70, 4911–4920. [Google Scholar] [CrossRef] [PubMed] [Green Version]
  19. Wu, W.M.; Carley, J.; Luo, J.; Ginder-Vogel, M.A.; Cardenas, E. In situ bioreduction of uranium (VI) to submicromolar levels and reoxidation by dissolved oxygen. Environ. Sci. Technol. 2007, 41, 5716–5723. [Google Scholar] [CrossRef] [PubMed]
  20. Xu, M.; Wu, W.M.; Wu, L.; He, Z.; van Nostrand, J.D.; Deng, Y.; Luo, J.; Carley, J.; Ginder-Vogel, M.; Gentry, T.J.; et al. Responses of microbial community functional structures to pilot-scale uranium in situ bioremediation. ISME J. 2010, 4, 1060–1070. [Google Scholar] [CrossRef] [PubMed] [Green Version]
  21. Maleke, M.; Williams, P.; Castillo, J.; Botes, E.; Ojo, A.; DeFlaun, M.; van Heerden, E. Optimization of a bioremediation system of soluble uranium based on the biostimulation of an indigenous bacterial community. Environ. Sci. Pollut. Res. 2015, 22, 8442–8450. [Google Scholar] [CrossRef] [PubMed]
  22. Safonov, A.V.; Boguslavskiy, A.E.; Boldyrev, K.A.; Zayceva, L.V. Biogenic factors of formation of geochemical uranium anomalies near the sludge storage of the Novosibirsk chemical concentrate plant. Geochem. Int. 2019, 57, 709–715. [Google Scholar] [CrossRef]
  23. GOST 18963-73. Drinking Water. Methods of Sanitary-Bacteriological Analysis; ICS 13.060.20; Federal Agency on 567 Technical Regulating and Metrology (ROSSTANDART): Moscow, Russia, 1973.
  24. Plakunov, V.K.; Martyanov, S.V.; Teteneva, N.A.; Zhurina, M.A. universal method for quantitative characterization of growth and metabolic activity of microbial biofilms in static models. Microbiology 2016, 85, 509–513. [Google Scholar] [CrossRef]
  25. Daigger, G.T. Oxygen and carbon requirements for biological nitrogen removal processes accomplishing nitrification, nitritation, and anammox. Water Environ. Res. 2014, 86, 204–209. [Google Scholar] [CrossRef] [PubMed]
  26. Krainov, S.R.; Solomin, G.A.; Zakutin, V.P. Oxidation-reduction conditions of nitrogen compound transformations in groundwater (in the context of geochemical-ecological problems). Geokhimiya 1991, 6, 831–882. [Google Scholar]
  27. Vodyanitskii, Y.N.; Mineev, V.G. Degradation of nitrates with the participation of Fe(II) and Fe(O) in groundwater: A review. Eurasian J. Soil Sci. 2015, 48, 139–147. [Google Scholar] [CrossRef]
  28. Zhang, M.; Zhang, T.; Shao, M.F.; Fang, H.H.P. Autotrophic denitrification in nitrate-induced marine sediment remediation and Sulfurimonas denitrificans-like bacteria. Chemosphere 2009, 76, 677–682. [Google Scholar] [CrossRef]
  29. Zhang, S.; Pang, S.; Wang, P.; Wang, C.; Guo, C.; Addo, F.G.; Li, Y. Responses of bacterial community structure and denitrifying bacteria in biofilm to submerged macrophytes and nitrate. Sci. Rep. 2016, 6, 36178. [Google Scholar] [CrossRef] [Green Version]
  30. Krawczyk-Bärsch, E.; Scheinost, A.C.; Rossberg, A.; Muller, K.; Bok, F.; Hallbeck, L.; Lehrich, J.; Schmeide, K. Uranium and neptunium retention mechanisms in Gallionella ferruginea/ferrihydrite systems for remediation purposes. Environ. Sci. Pollut. Res. 2020. [Google Scholar] [CrossRef]
  31. Newsome, L.; Morris, K.; Lloyd, J.R. The biogeochemistry and bioremediation of uranium and other priority radionuclides. Chem. Geol. 2014, 363, 164–184. [Google Scholar] [CrossRef]
  32. Chang, H.K.; Zylstra, G.J. Xanthomonads. In Handbook of Hydrocarbon and Lipid Microbiology; Timmis, K.N., Ed.; Springer: Berlin/Heidelberg, Germany, 2010; pp. 1805–1811. [Google Scholar]
  33. Nelson, W.C.; Stegen, J.C. The reduced genomes of Parcubacteria (OD1) contain signatures of a symbiotic lifestyle. Front. Microbiol. 2015, 6, 713. [Google Scholar] [CrossRef] [Green Version]
  34. Kumar, S.; Herrmann, M.; Thamdrup, B.; Schwab, V.F.; Geesink, P.; Trumbore, S.E.; Totsche, K.-U.; Kusel, K. Nitrogen loss from pristine carbonate-rock aquifers of the Hainich Critical Zone exploratory (Germany) is primarily driven by chemolithoautotrophic Anammox processes. Front. Microbiol. 2017, 8, 1951. [Google Scholar] [CrossRef]
  35. Lee, J.-H.; Lee, B.-J.; Yun, U.; Koh, D.-C. In-situ microbial colonization and its potential contribution on biofilm formation in subsurface sediments. J. Appl. Biol. Chem. 2019, 62, 51–56. [Google Scholar] [CrossRef] [Green Version]
  36. Dragičević, T.L.; Hren, M.Z.; Grgas, D.; Buzdum, I. The potential of dairy wastewater for denitrification. Mljekarstvo 2010, 60, 191–197. [Google Scholar]
  37. Slavov, A.K. General characteristics and treatment possibilities of dairy wastewater—A review. Food Technol. Biotechnol. 2017, 55, 14–28. [Google Scholar] [CrossRef] [PubMed]
  38. Voss, I.; Steinbüchel, A. High cell density cultivation of Rhodococcus opacus for lipid production at a pilot-plant scale. Appl. Microbiol. Biotechnol. 2001, 55, 547–555. [Google Scholar] [CrossRef] [PubMed]
  39. Barathi, S.; Meng, Y.; Yu, Z.; Ni, S.-Q.; Meng, F. Roles of nitrite in mediating the composition and metacommunity of multispecies biofilms. J. Water Proc. Eng. 2021, 40, 101764. [Google Scholar] [CrossRef]
  40. Flemming, H.-C. Sorption sites in biofilms. Water Sci. Technol. 1995, 32, 27–33. [Google Scholar] [CrossRef]
  41. Safonov, A.V.; Perepelov, A.V.; Babich, T.L.; Popova, N.M.; Grouzdev, D.S.; Filatov, A.V.; Shashkov, A.S.; Demina, L.I.; Nazina, T.N. Structure and gene cluster of the o-polysaccharide from Pseudomonas veronii a-6-5 and its uranium bonding. Int. J. Biol. Macromol. 2020, 165, 2197–2204. [Google Scholar] [CrossRef]
  42. Kazy, S.K.; Sar, P.; D’Souza, S.F. Studies on uranium removal by the extracellular 504 polysaccharide of a Pseudomonas aeruginosa strain. Bioremediat. J. 2008, 12, 47–57. [Google Scholar] [CrossRef]
  43. Kondratyeva, L.M.; Golubeva, E.M.; Litvinenko, Z.N. Microbiological factors of the formation of iron-containing minerals. Contemp. Probl. Ecol. 2016, 9, 318–328. [Google Scholar] [CrossRef]
  44. Winstanley, E.H.; Morris, K.; Abrahamsen-Mills, L.G.; Blackham, R.; Shaw, S. U(VI) sorption during ferrihydrite formation: Underpinning radioactive effluent treatment. J. Hazard. Mater. 2019, 366, 98–104. [Google Scholar] [CrossRef]
  45. Wiesmann, U. Biological nitrogen removal from wastewater. In Biotechnics/Wastewater. Advances in Biochemical Engineering/Biotechnology; Springer: Berlin/Heidelberg, Germany, 1994; Volume 51, pp. 113–154. [Google Scholar]
  46. Green, S.; Prakash, O.; Gihring, T.; Akob, D.M.; Jasrotia, P.; Jardine, P.M.; Watson, D.B.; Brown, S.D.; Palumbo, A.V.; Kostka, J.E. Denitrifying bacteria isolated from terrestrial subsurface sediments exposed to mixed-waste contamination. Appl. Environ. Microbiol. 2010, 76, 3244–3254. [Google Scholar] [CrossRef] [PubMed] [Green Version]
  47. Munasinghe, P.S.; Madden, M.E.E.; Brooks, S.C.; Elwood Madden, A.S. Dynamic interplay between uranyl phosphate precipitation, sorption, and phase evolution. Appl. Geochem. 2015, 58, 147–160. [Google Scholar] [CrossRef]
  48. Wellman, D.M.; McNamara, B.K.; Bacon, D.H.; Cordova, E.A.; Ermi, R.M.; Top, L.M. Dissolution kinetics of meta-torbernite under circum-neutral to alkaline conditions. Environ. Chem. 2009, 6, 551–560. [Google Scholar] [CrossRef] [Green Version]
  49. Stewart, B.D.; Amos, R.T.; Nico, P.S.; Fendorf, S. Influence of uranyl speciation and iron oxides on uranium biogeochemical redox reactions. Geomicrobiol. J. 2011, 28, 444–456. [Google Scholar] [CrossRef] [Green Version]
  50. Stetten, L.; Lefebvre, P.; Le Pape, P.; Mangeret, A.; Blanchart, P.; Merrot, P.; Brest, J.; Julien, A.; Bargar, J.R.; Cazala, C.; et al. Experimental redox transformations of uranium phosphate minerals and mononuclear species in a contaminated wetland. J. Hazard. Mater. 2020, 384, 121362. [Google Scholar] [CrossRef] [Green Version]
  51. Reerburgh, W.S. A major sink and flux control for methane in marine sediments: Anaerobic consumption. In The Dynamic Environment of the Ocean Floor; Fanning, K.A., Manheim, R.T., Eds.; Lexington Books: Lexington, KY, USA, 1982; pp. 203–218. [Google Scholar]
  52. Strakhovenko, V.D.; Gaskova, O.L. Thermodynamic model of formation of carbonates and uranium mineral phases in lakes Namshi-Nur and Tsagan-Tyrm (Cisbaikalia). Russ. Geol. Geophys. 2018, 59, 374–385. [Google Scholar] [CrossRef]
  53. Dullies, F.; Lutze, W.; Gong, W.L.; Nuttall, H.E. Biological reduction of uranium—from the laboratory to the field. Sci. Total Environ. 2010, 408, 6260–6271. [Google Scholar] [CrossRef] [PubMed]
  54. Mehta, V.S.; Mailot, F.; Wang, Z.; Catalano, J.G.; Giammar, D.E. Transport of U(VI) through sediments amended with phosphate to induce in situ uranium immobilization. Water Res. 2015, 69, 307–317. [Google Scholar] [CrossRef] [Green Version]
  55. Qafoku, N.P.; Kukkadapu, R.K.; McKinley, J.P.; Arey, B.W.; Kelly, S.D.; Wang, C.; Resch, C.T.; Long, P.E. Uranium in framboidal pyrite from a naturally bioreduced alluvial sediment. Environ. Sci. Technol. 2009, 43, 8528–8534. [Google Scholar] [CrossRef] [PubMed] [Green Version]
  56. Bopp, I.V.; Charles, J.; Lundstrom, C.C.; Johnson, T.M.; Sandford, R.A.; Long, P.E.; Williams, K.H. Uranium 238U/235U isotope ratios as indicators of reduction: Results from an in situ biostimulation experiment at Rifle, Colorado, U.S.A. Environ. Sci. Technol. 2010, 44, 5927–5933. [Google Scholar] [CrossRef] [PubMed]
  57. Ohan, J.A.; Saneiyan, S.; Lee, J.; Bartlow, A.W.; Ntarlagiannis, D.; Burns, S.E.; Colwell, F.S. Microbial and geochemical dynamics of an aquifer stimulated for microbial induced calcite precipitation (MICP). Front. Microbiol. 2020, 11, 1327. [Google Scholar] [CrossRef]
  58. Xu, J.; Veeramani, H.; Qafoku, N.P.; Singh, G.; Riquelme, M.V.; Pruden, A.; Kukkadapu, R.K.; Gartman, B.N.; Hochella, M.F., Jr. Efficacy of acetate-amended biostimulation for uranium sequestration: Combined analysis of sediment/groundwater geochemistry and bacterial community structure. Appl. Geochem. 2017, 78, 172–185. [Google Scholar] [CrossRef] [Green Version]
  59. Moon, H.S.; McGuinness, L.; Kukkadapu, R.K.; Peacock, A.D.; Komlos, J.; Kerkhof, L.J.; Long, P.E.; Jaffe, P.R. Microbial reduction of uranium under iron- and sulfate-reducing conditions: Effect of amended goethite on microbial community composition and dynamics. Water Res. 2010, 44, 4015–4028. [Google Scholar] [CrossRef] [PubMed] [Green Version]
  60. Veeramani, H.; Scheinost, A.C.; Monsegue, N.; Qafoku, N.P.; Kukkadapu, R.K.; Newville, M.; Lanzirotti, A.; Pruden, A.; Murayama, M.; Hochella, M.F., Jr. Abiotic reductive immobilization of U(VI) by biogenic mackinawite. Environ. Sci. Technol. 2013, 47, 2361–2369. [Google Scholar] [CrossRef]
  61. Hyun, S.P.; Davis, J.A.; Sun, K.; Hayes, K.F. Uranium(VI) reduction by iron(II) monosulfide mackinawite. Environ. Sci. Technol. 2012, 46, 3369–3376. [Google Scholar] [CrossRef]
  62. Bi, Y.; Hayes, K.F. Nano-FeS inhibits UO2 reoxidation under varied oxic conditions. Environ. Sci. Technol. 2014, 48, 632–640. [Google Scholar] [CrossRef]
  63. Chan, C.S.; Fakra, S.C.; Edwards, D.C.; Emerson, D.; Banfield, J.F. Iron oxyhydroxide mineralization on microbial extracellular polysaccharides. Geochim. Cosmochim. Acta 2009, 73, 3807–3818. [Google Scholar] [CrossRef] [Green Version]
  64. Chan, C.S.; de Stasio, G.; Welch, S.A.; Girasole, M.; Frazer, B.H. Microbial polysaccharides template assembly of nanocrystal fibers. Science 2004, 303, 1656–1658. [Google Scholar] [CrossRef] [Green Version]
  65. Dynes, J.J.; Tyliszczak, T.; Araki, T.; Lawrence, J.R.; Swerhone, G.D.W.; Leppard, G.G.; Hitchcock, A.P. Speciation and quantitative mapping of metal species in microbial biofilms using scanning transmission X-ray microscopy. Environ. Sci. Technol. 2006, 40, 1556–1565. [Google Scholar] [CrossRef] [PubMed] [Green Version]
Figure 1. The content of elements in different fractions (% of initial concentration) after cascade filtration of groundwater samples: A—Sample 2, B—Sample 3. The pore diameters of the filters (μm) are displayed at the bottom.
Applsci 11 02875 g001
Figure 2. The number of cells of different functional groups in the formation fluid samples, cells/mL.
Applsci 11 02875 g002
Figure 3. Results of laboratory modelling of nitrogen and sulphur reduction in the presence of whey. The pH remained at ~ 6.8.
Applsci 11 02875 g003
Figure 4. Microphotographs of biofilms on soil samples from boreholes 1, 2, and 3 on days 0, 20, and 40. Cellular nucleic acids have a green colour, and biofilm matrix sugars have a red colour.
Applsci 11 02875 g004
Figure 5. Results of the filtration experiment after the biological process of Sample 3 (compared with Figure 1B).
Applsci 11 02875 g005
Figure 6. First (bright) phase (A) and second (dark) phase (B) of the precipitate (see Table 8 for the composition).
Applsci 11 02875 g006
Figure 7. Thermodynamic model calculations of the saturation indexes (SIs) of water from Sample 1 (A), Sample 2 (B), and Sample 3 (C) after biostimulation with whey. Points indicated with * and ** correspond to the values obtained without fixed pH in conditions of organic matter oxidation to CO2.
Applsci 11 02875 g007aApplsci 11 02875 g007b
Table 1. Chemical composition, total dissolved solids (TDS), and Eh–pH of the study samples.
Sample1 (Backg.)2 (Inter.)3 (Max)
pH7.016.806.97
Eh, mV−190−2890
TDS, g/L0.473.8314.91
Cl, mg/L115903200
HCO3, mg/L549161180
NO3, mg/L12.211246169
SO42301769470
Ca, mg/L123561436
Mg, mg/L3311465
Na, mg/L0.246851249
Mn, mg/L0.402.31.3
Fe, mg/L0.0110.7<0.01
Cu, mg/L0.203.20.6
Zn, mg/L0.140.310.2
U, mg/L0.0020.00081.6
Table 2. Main species and molality in water samples under different redox conditions (PHREEQC modelling).
Sample 1, Eh −190 mV, pH 7Sample 2, Eh −28 mV, pH 6.8Sample 3, Eh 90 mV, pH 6.97
Fe(II) 1.791 × 10⁻⁷ totalFe(II) 1.916 × 10⁻⁴ totalFe(II) 1.789 × 10⁻⁷ total
Fe2+ 5.063 × 10⁻⁸Fe2+ 1.174 × 10⁻⁴Fe2+ 1.228 × 10⁻⁷
FeHCO3+ 1.221 × 10⁻⁷FeHCO3+ 5.211 × 10⁻⁵FeHCO3+ 4.586 × 10⁻⁸
-FeSO4 2.004 × 10⁻⁵FeSO4 5.715 × 10⁻⁹
Fe(III) 9.0 × 10⁻¹⁶ totalFe(II) 3.672 × 10⁻¹⁰ totalFe(II) 2.042 × 10⁻¹⁰ total
Mn(II) 7.2 × 10⁻⁶ totalMn(II) 4.187 × 10⁻⁵ totalMn(II) 2.348 × 10⁻⁵ total
Mn2 6.500 × 10⁻⁶Mn2+ 3.364 × 10⁻⁵Mn2+ 1.995 × 10⁻⁵
MnCO3 4.273 × 10⁻⁷MnCO3 2.279 × 10⁻⁷MnCO3 1.624 × 10⁻⁷
MnSO4 1.230 × 10⁻⁷MnSO4 7.171 × 10⁻⁶MnSO4 1.445 × 10⁻⁶
-MnNO3+ 2.215 × 10⁻⁷MnNO3+ 5.278 × 10⁻⁷
U(IV) 4.2 × 10⁻⁵ totalU(IV) 4.032 × 10⁻⁵ totalU(IV) 1.981 × 10⁻⁹ total
U(OH)4 4.2 × 10⁻⁵U(OH)4 4.032 × 10⁻⁵U(OH)4 1.981 × 10⁻⁹
U(VI) 6.8 × 10⁻¹¹ totalU(VI) 1.684 × 10⁻⁶ totalU(VI) 4.201 × 10⁻⁵ total
UO2(CO3)22− 2.630 × 10⁻¹¹UO2(CO3)22− 8.494 × 10⁻⁷UO2(CO3)22− 1.569 × 10⁻⁵
UO2(CO3)34− 4.052 × 10⁻¹¹UO2(CO3)34 4.590 × 10⁻⁷UO2(CO3)34− 2.311 × 10⁻⁵
UO2(OH)2 4.781 × 10⁻¹³UO2(OH)2 1.299 × 10⁻⁷UO2(OH)2 4.695 × 10⁻⁷
-(UO2)2CO3(OH)3 7.597 × 10⁻⁸(UO2)2CO3(OH)3 1.177 × 10⁻⁶
S(-2) 3.805 × 10⁻⁵ total--
S(VI) 2.743 × 10⁻⁴ totalS(VI) 6.976 × 10⁻³ totalS(VI) 4.894 × 10⁻³ total
SO42− 2.358 × 10⁻⁴SO42− 5.117 × 10⁻³SO42− 3.075 × 10⁻³
CaSO4 3.601 × 10⁻⁵CaSO4 1.640 × 10⁻³CaSO4 1.345 × 10⁻³
NaSO4 2.314 × 10⁻⁶NaSO4 1.921 × 10⁻⁴NaSO4 4.715 × 10⁻⁴
-FeSO4 2.004 × 10⁻⁵
Table 3. Heat map of 16S rRNA gene analysis results for Samples 1 and 3 (part 1). (% of the total number of operational taxonomic units—OTUs).
TaxonSample 1Sample 3
Acidimicrobiales0.34.4
Acinetobacter2.30.1
Actinomycetales2.21.3
Alcaligenaceae0.42.6
Anaerolineae1.30.9
Bacteroidales5.33.4
Chloroflexi1.60.1
Clostridiales1.21.2
Comamonadaceae7.21.5
Desulfobacteraceae3.70
Desulfosporosinus1.20
Desulfovibrio5.20
Faecalibacterium1.11.0
Flavobacteriaceae2.43.7
Gallionella6.85.3
Geobacter3.40
Hydrogenophaga0.62.8
Lachnospiraceae2.62.2
Methanobacteriaceae1.10.2
Methylophilaceae1.31.8
Methylotenera0.60
Micrococcaceae1.60.1
Mycoplana1.30.5
Parcubacteria0.45.0
Other30.021.4
Paenibacillus0.11.4
Parvarchaea00.7
Prevotella1.41.4
Pseudomonas1.53.9
Ralstonia0.70.4
Rhizobiales1.30.9
Rhodobacteracea0.61.6
Rhodocyclaceae1.60.2
Rhodospirillaceae01.1
Ruminococcaceae2.21.9
Sulfurimonas1.120.5
Veillonellaceae0.80.1
Verrucomicrobia0.90.4
Xanthomonadaceae1.05.0
Table 4. Denitrification rate (mg NO3/L/day) using various organic substrates.
Electron DonorSample 1 *Sample 2Sample 3
Sodium acetate13098108
Sucrose127124107
Glucose13510195
Ethanol341412
Na lactate847463
Milk whey141155120
* Since no nitrate ions were detected in Well 1, in the laboratory experiment, nitrate at a concentration of 1000 mg/L was added, similar to Sample 2.
Table 5. Analysis of 16S rRNA genes of the microbial community in the samples with added whey (part 1). (% of the total number of OTUs).
TaxonSample 1Sample 3
Acidovorax10.320
Acinetobacter0.600
Actinobacteria0.740
Bacillus02.0
Burkholderiaceae4.690
Candidatus Accumulibacter0.550
Clostridiales1.120
Comamonas0.550
Dechloromonas1.910
Delftia1.150
Desulfobulbaceae (Desulfobacterium)1.560
Desulfomicrobium0.680
Desulfuromonas0.630
Gallionellaceae1.940
Hydrogenophaga9.060
Limnohabitans1.640
Methylophilaceae0.570
Nitrosomonadaceae0.870
Nitrospira1.470
Other9.030
Parcubacteria0.10
Planctomycetes0.660
Polaromonas1.010
Pseudomonas2.290
Pseudorhodobacter0.630
Rhodobacter010.30
Rhodobacter2.310
Rhodococcus0.0387.7
Rhodocyclaceae4.310
Sideroxydans1.360
Simplicispira3.190
Sulfuritalea4.180
Thauera27.210
Vulcanibacillus1.770
Sum100100
Table 6. Biofilm formation kinetics on rock samples (NA—nucleic acid area, %; Bf—common biofilm area on sand, %; MTT—sand-attached microbiota metabolic activity per g).
Sample0 Day20 Days40 Days
NABfMTTNABfMTTNABfMTT
11.03 ± 0.31.7 ± 0.40.1310.3 ± 2.641.8 ± 3.413.52.6 ± 1.27.8 ± 1.81.7
23.6 ± 0.53.8 ± 0.61.157.8 ± 1.534.8 ± 2.711.17.9 ± 1.28.4 ± 1.32.1
34.05 ± 0.54.7 ± 0.51.124.2 ± 0.528.9 ± 1.25.26.6 ± 1.215.5 ± 0.71.8
Table 7. Kd values (cm3/g) of uranium sorption on soils before and after biofilm development from glucose–acetate activation.
SamplePresence of BiofilmsDistilled WaterGroundwater
1Natural521489
After 20 days769771
2Natural469377
After 20 days714703
3Natural501450
After 20 days657647
Table 8. Elemental composition of the precipitate phases after whey addition.
No.PhaseElement, wt. %
SiAlFeMgCaNaKNiUPSClO
1A0.380.330.291.8725.80.980.15n.d.n.d.15.190.310.1954.51
2A0.420.380.372.0924.530.810.1n.d.n.d.14.950.190.1656
3A0.350.30.251.7522.651.050.12n.d.n.d.16.520.220.1956.6
4A0.540.440.441.620.990.990.110.1n.d.14.70.20.2159.68
5A0.360.310.221.9923.230.870.190.15n.d.13.90.290.2558.24
6B0.74n.d.0.472.1920.796.070.4n.d.2.211.151.81.5352.67
7B0.92n.d.0.782.19186.760.88n.d.5.3610.412.41.7750.51
8B0.96n.d.0.642.2919.436.560.640.345.2311.122.21.6548.95
9B0.83n.d.0.622.1919.396.4150.64n.d.3.7810.782.11.6551.59
10B0.88n.d.0.732.1319.057.060.620.414.1213.082.411.5747.94
Publisher’s Note: MDPI stays neutral with regard to jurisdictional claims in published maps and institutional affiliations.

