
Prediction of Peak Particle Velocity Caused by Blasting through the Combinations of Boosted-CHAID and SVM Models with Various Kernels


 , ,
, ,  and
and 
Abstract
:1. Introduction
2. Materials and Methods
2.1. Input Selection Technique
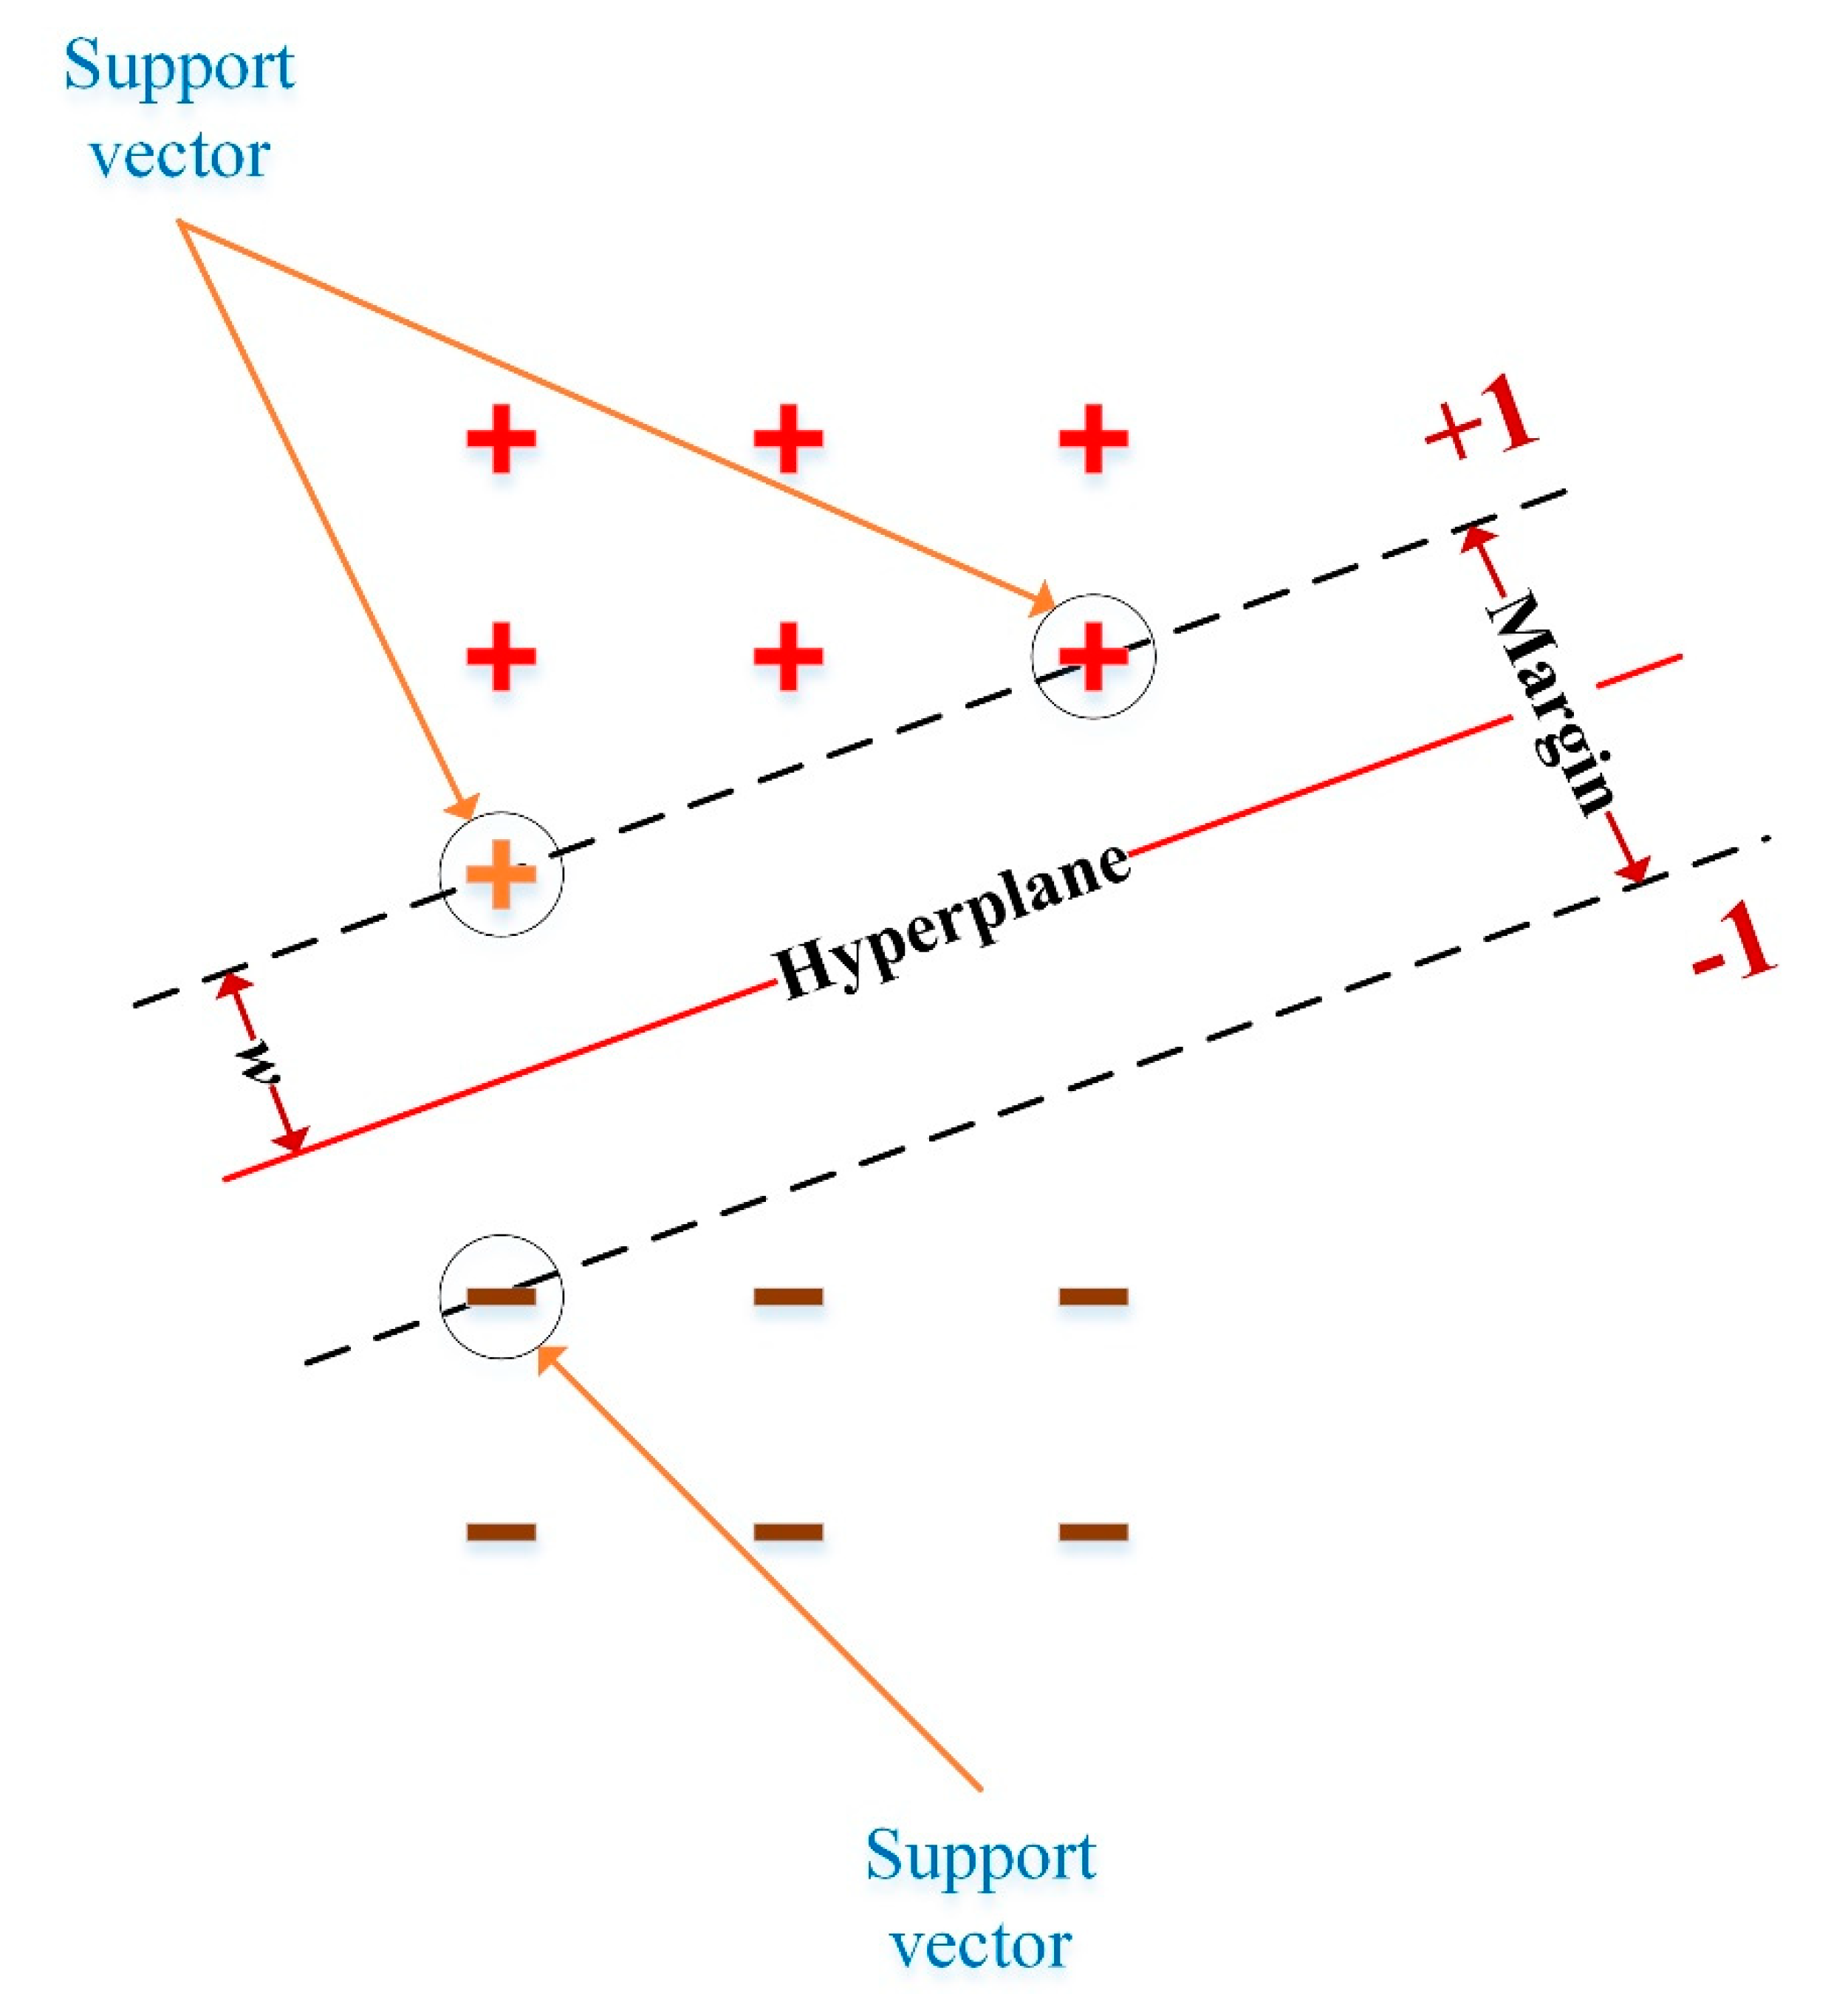
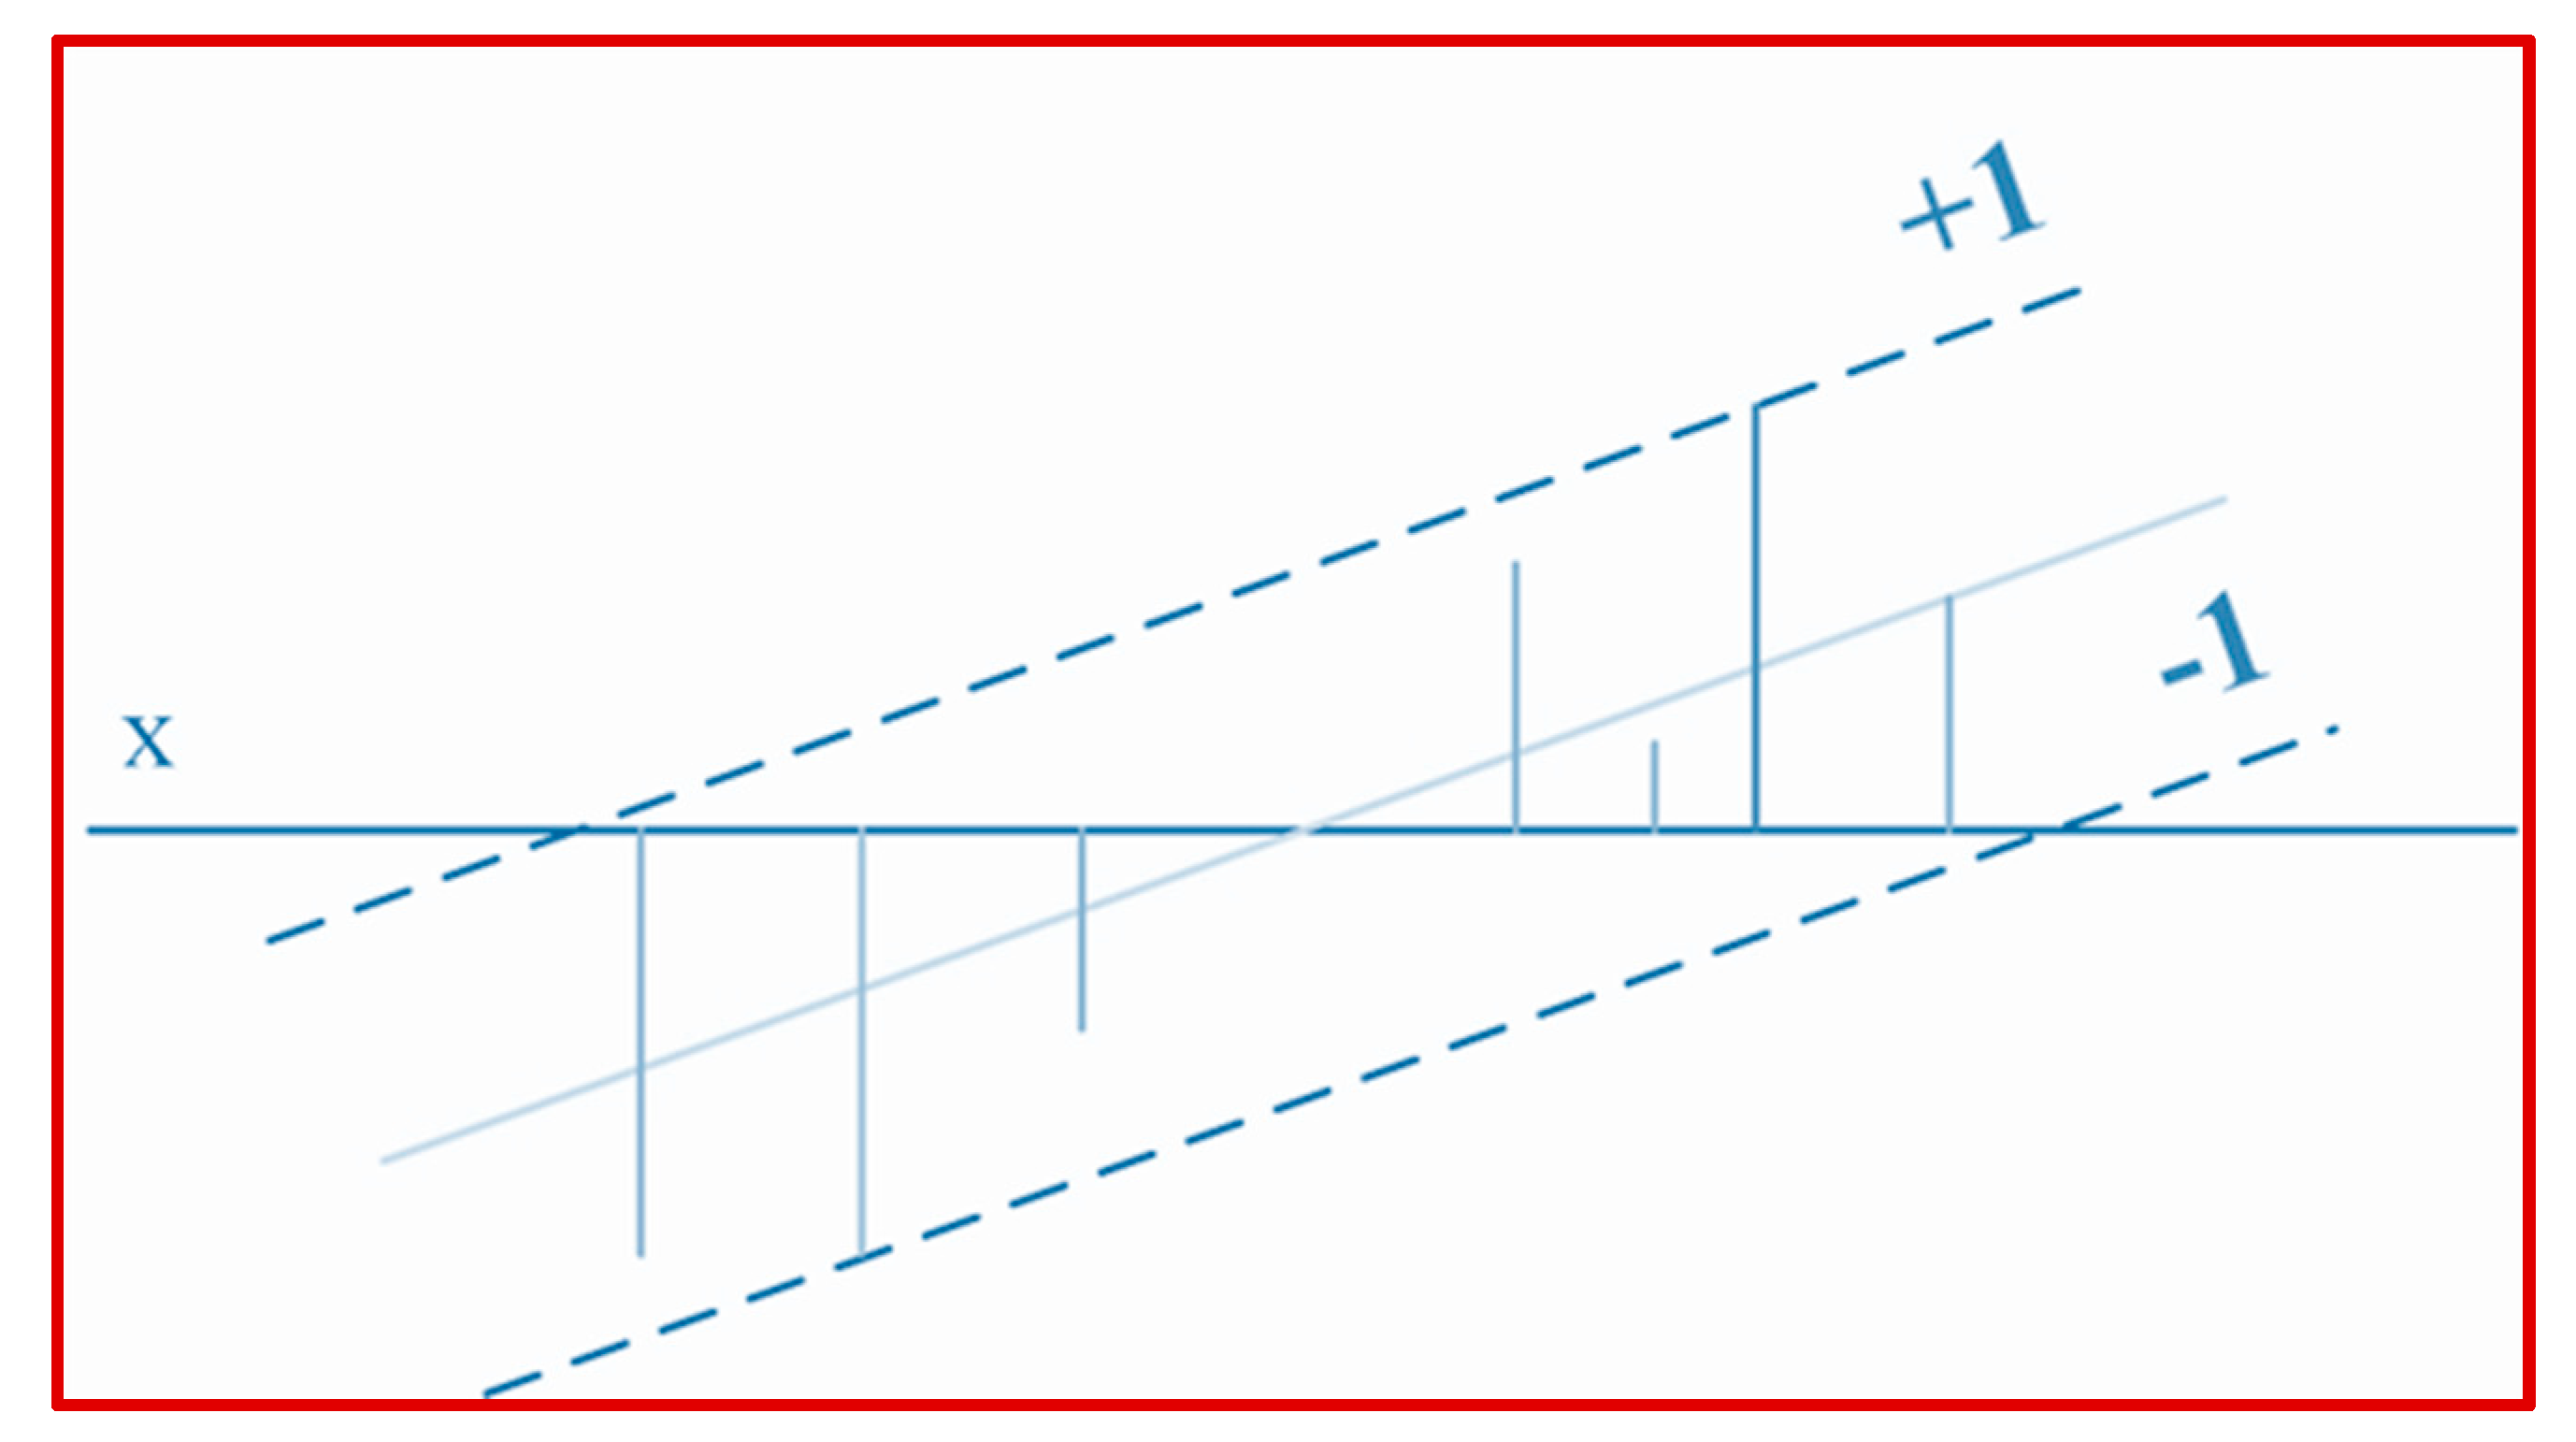
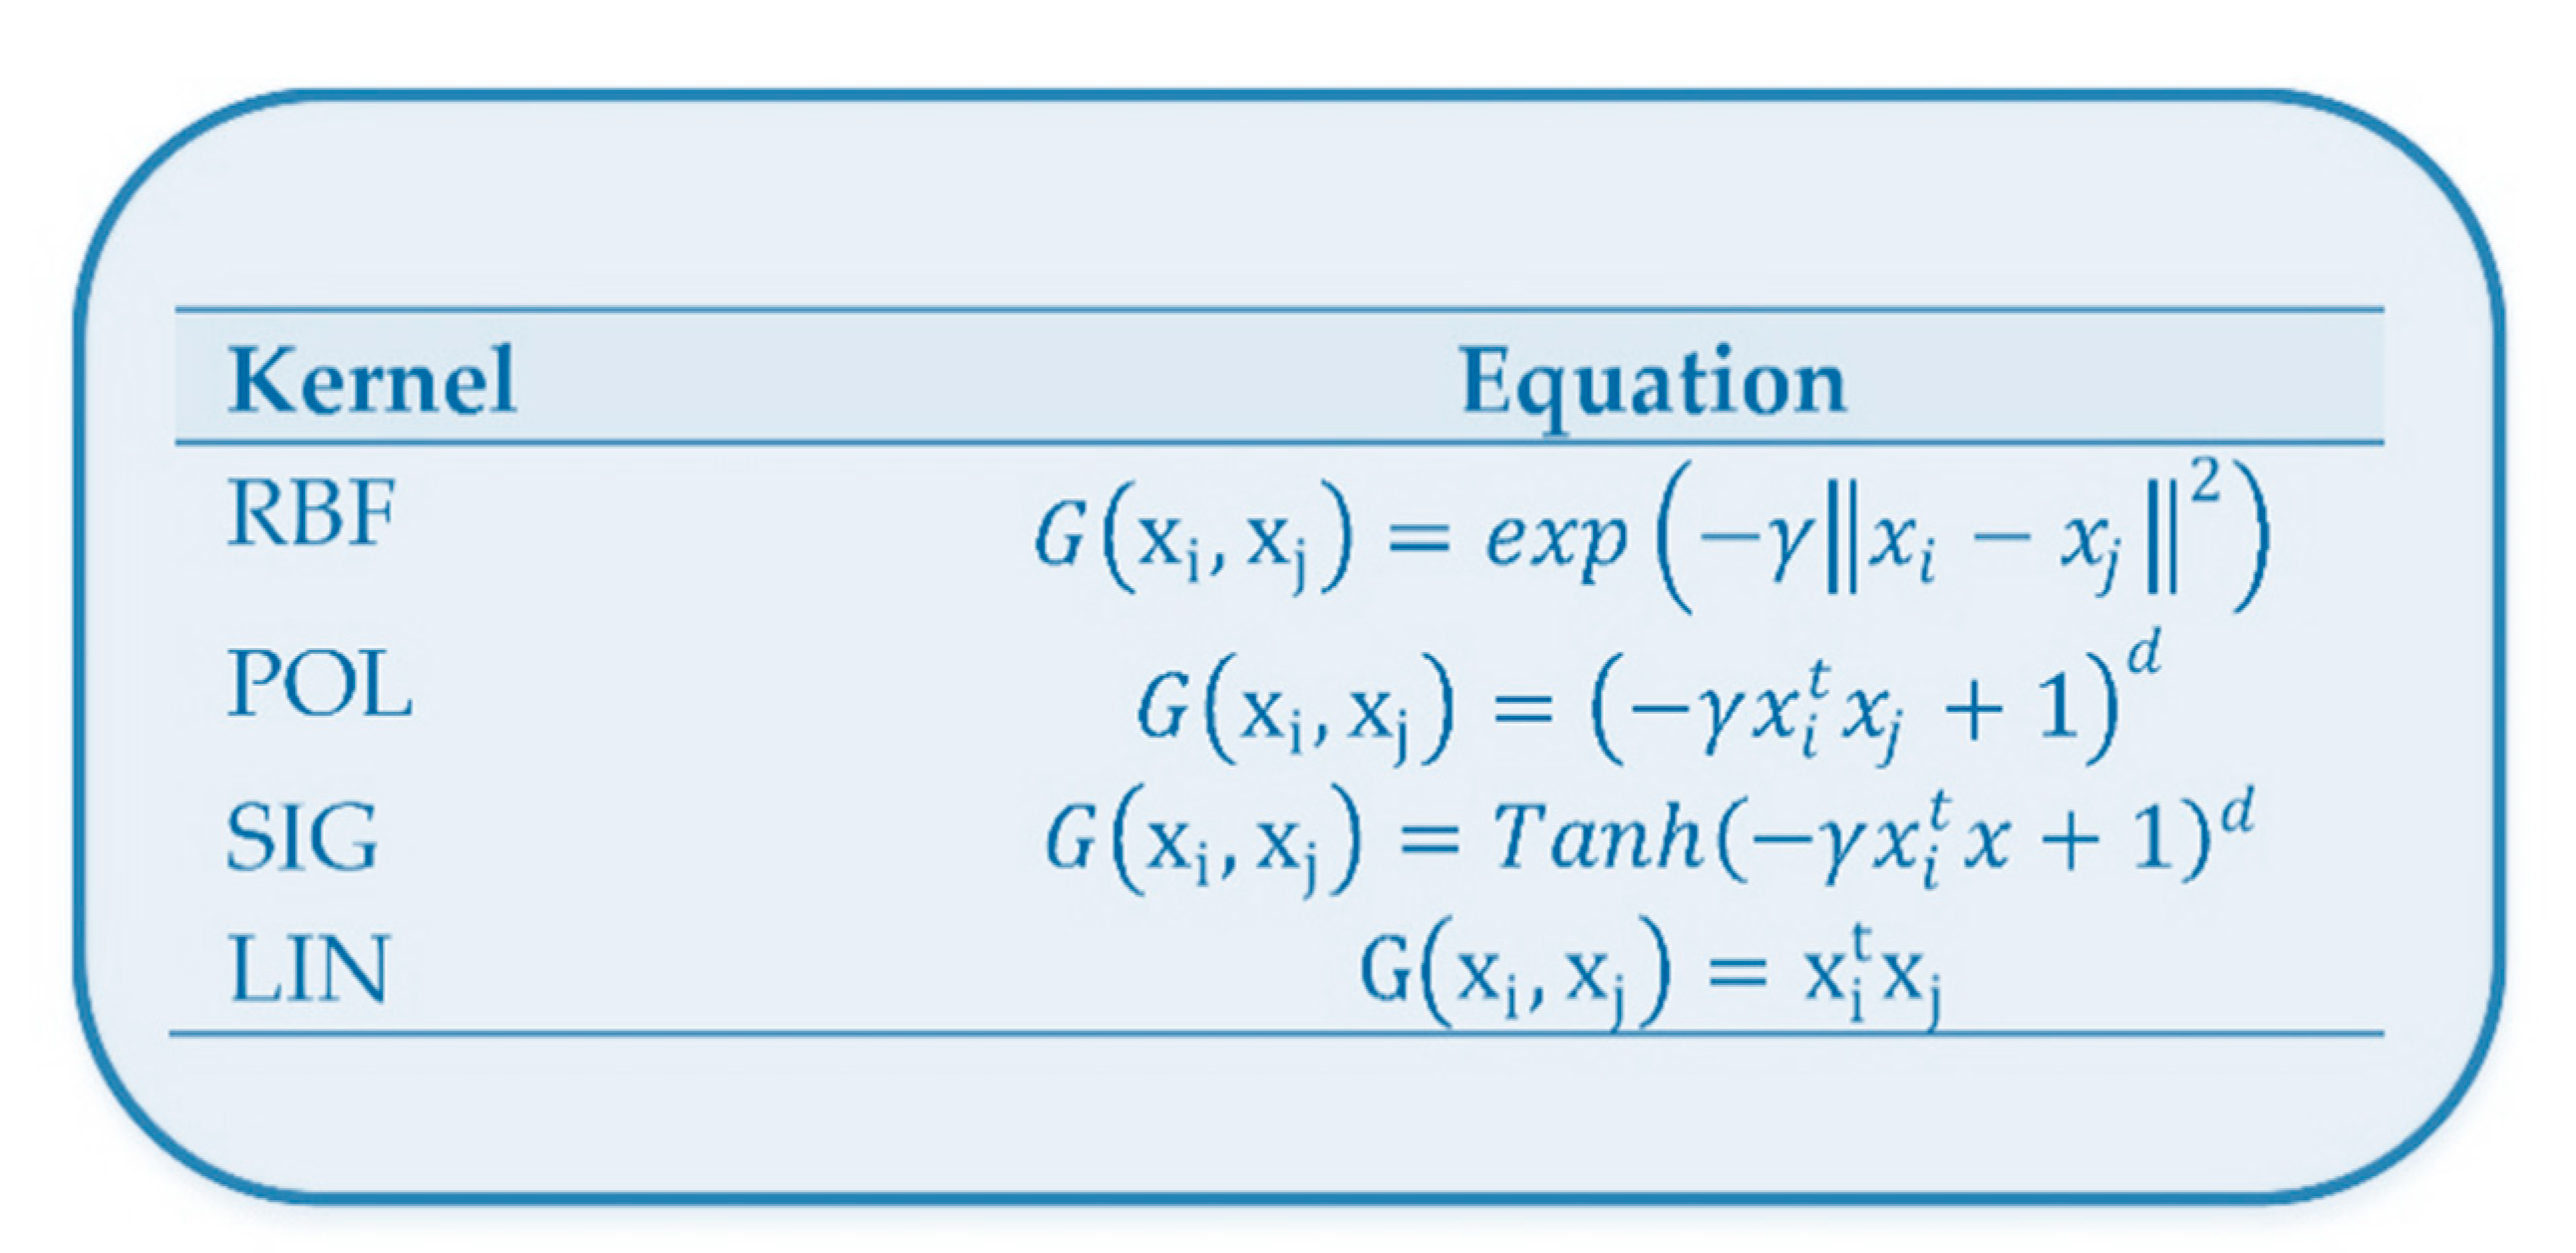
2.2. SVM Model and Its Variants
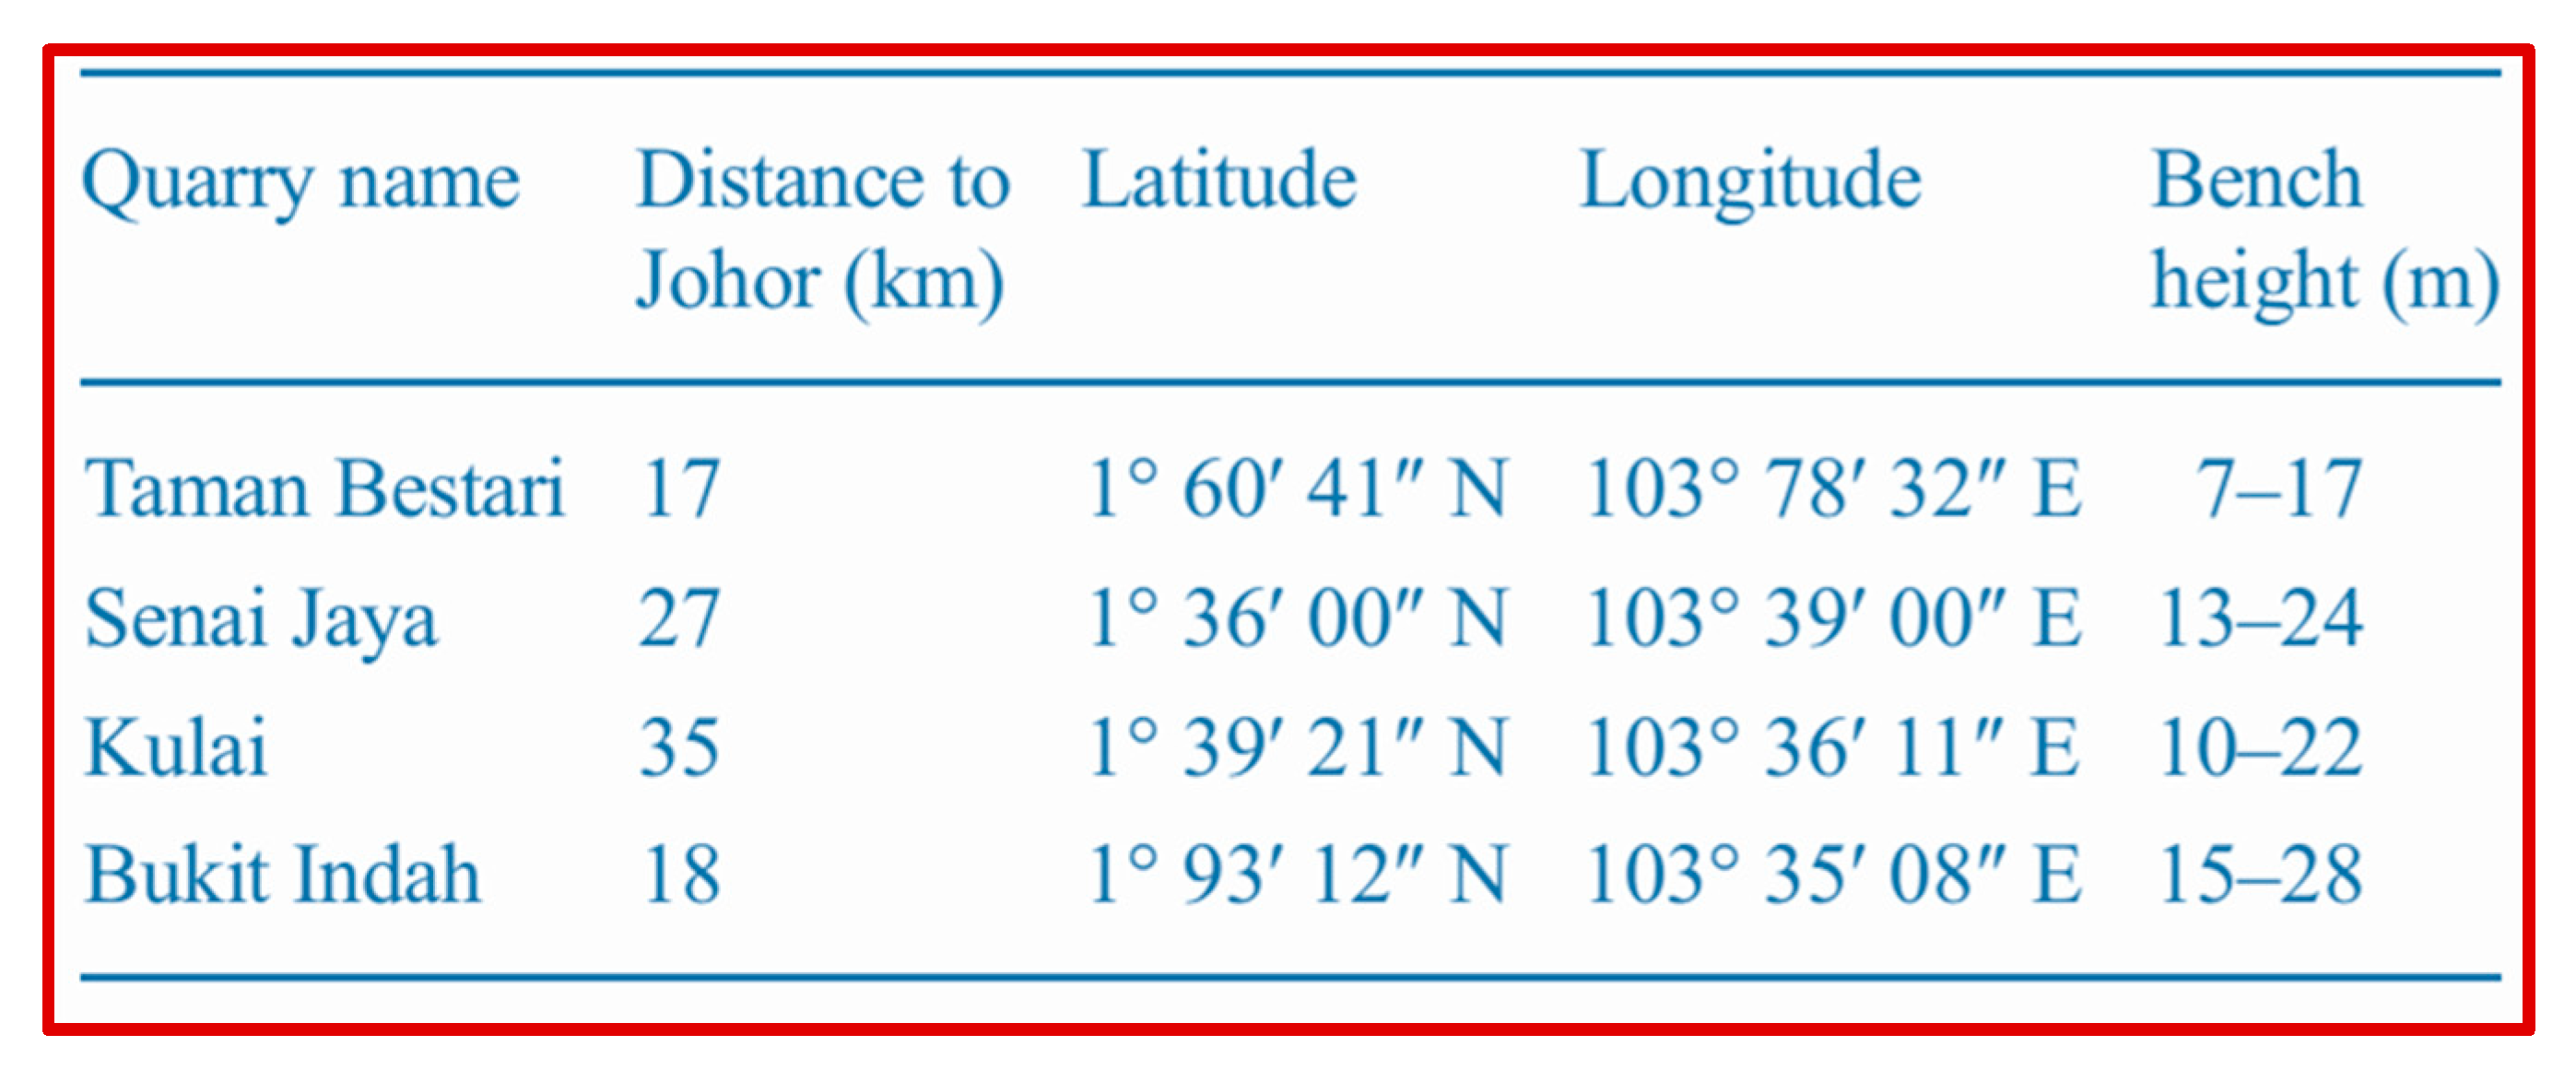
2.3. Experimental Database
3. Models’ Application
3.1. Input Selection
3.2. SVM Models with Different Kernels
4. Discussion
5. Conclusions
Author Contributions
Funding
Conflicts of Interest
Abbreviations
| CHAID | Chi-Squared Automatic Interaction Detection |
| ANN | Artificial neural network |
| PPV | Peak particle velocity |
| MAE | Mean absolute error |
| SVM | Support vector machine |
| GEP | Gene expression programming |
| ICA | Imperialism competitive algorithm |
| R | Correlation coefficient |
| SC | Soft computing |
| PSO | Particle swarm optimization |
| HKM | K-means clustering |
| CA | Cubist algorithm |
| SVR | Support vector regression |
| SIG | Sigmoid |
| GA | Genetic algorithm |
| POL | Polynomial |
| ANFIS | Adaptive Neuro-Fuzzy Inference System |
| LIN | Linear |
| RF | Random Forest |
| CART | Classification and regression tree |
| FIS | Fuzzy inference system |
| FA | Firefly algorithm |
| BN | Bayesian network |
| RBF | Radial basis function |
| ML | Machine learning |
| mean of measured values | |
| n | Total number of data |
| C | Regularization parameter |
| yim | Measured values |
| yip | Predicted values |
| tr | Training ranking |
| te | Testing ranking |
References
- Armaghani, D.J.; Hajihassani, M.; Mohamad, E.T.; Marto, A.; Noorani, S.A. Blasting-induced flyrock and ground vibration prediction through an expert artificial neural network based on particle swarm optimization. Arab. J. Geosci. 2014, 7, 5383–5396. [Google Scholar] [CrossRef]
- Hajihassani, M.; Jahed Armaghani, D.; Monjezi, M.; Mohamad, E.T.; Marto, A. Blast-induced air and ground vibration prediction: A particle swarm optimization-based artificial neural network approach. Environ. Earth Sci. 2015, 74, 2799–2817. [Google Scholar] [CrossRef]
- Murlidhar, B.R.; Kumar, D.; Jahed Armaghani, D.; Mohamad, E.T.; Roy, B.; Pham, B.T. A Novel Intelligent ELM-BBO Technique for Predicting Distance of Mine Blasting-Induced Flyrock. Nat. Resour. Res. 2020, 29, 4103–4120. [Google Scholar] [CrossRef]
- Han, H.; Armaghani, D.J.; Tarinejad, R.; Zhou, J.; Tahir, M.M. Random Forest and Bayesian Network Techniques for Probabilistic Prediction of Flyrock Induced by Blasting in Quarry Sites. Nat. Resour. Res. 2020, 29, 655–667. [Google Scholar] [CrossRef]
- Huang, J.; Koopialipoor, M.; Armaghani, D.J. A combination of fuzzy Delphi method and hybrid ANN-based systems to forecast ground vibration resulting from blasting. Sci. Rep. 2020, 10, 1–21. [Google Scholar] [CrossRef]
- Mahdiyar, A.; Jahed Armaghani, D.; Koopialipoor, M.; Hedayat, A.; Abdullah, A.; Yahya, K. Practical Risk Assessment of Ground Vibrations Resulting from Blasting, Using Gene Expression Programming and Monte Carlo Simulation Techniques. Appl. Sci. 2020, 10, 472. [Google Scholar] [CrossRef] [Green Version]
- Hasanipanah, M.; Amnieh, H.B. A fuzzy rule-based approach to address uncertainty in risk assessment and prediction of blast-induced Flyrock in a quarry. Nat. Resour. Res. 2020. [Google Scholar] [CrossRef]
- Bui, X.-N.; Choi, Y.; Atrushkevich, V.; Nguyen, H.; Tran, Q.-H.; Long, N.Q.; Hoang, H.-T. Prediction of blast-induced ground vibration intensity in open-pit mines using unmanned aerial vehicle and a novel intelligence system. Nat. Resour. Res. 2020, 29, 771–790. [Google Scholar] [CrossRef]
- Nguyen, H.; Bui, X.-N. Predicting blast-induced air overpressure: A robust artificial intelligence system based on artificial neural networks and random forest. Nat. Resour. Res. 2019, 28, 893–907. [Google Scholar] [CrossRef]
- Murlidhar, B.R.; Bejarbaneh, B.Y.; Armaghani, D.J.; Mohammed, A.S.; Mohamad, E.T. Application of Tree-Based Predictive Models to Forecast Air Overpressure Induced by Mine Blasting. Nat. Resour. Res. 2020, 30, 1865–1887. [Google Scholar] [CrossRef]
- Monjezi, M.; Hasanipanah, M.; Khandelwal, M. Evaluation and prediction of blast-induced ground vibration at Shur River Dam, Iran, by artificial neural network. Neural Comput. Appl. 2013, 22, 1637–1643. [Google Scholar] [CrossRef]
- Khandelwal, M.; Monjezi, M. Prediction of backbreak in open-pit blasting operations using the machine learning method. Rock Mech. Rock Eng. 2013, 46, 389–396. [Google Scholar] [CrossRef]
- Manoj, K.; Monjezi, M. Prediction of flyrock in open pit blasting operation using machine learning method. Int. J. Min. Sci. Technol. 2013, 23, 313–316. [Google Scholar] [CrossRef]
- Tonnizam Mohamad, E.; Jahed Armaghani, D.; Hasanipanah, M.; Murlidhar, B.R.; Alel, M.N.A. Estimation of air-overpressure produced by blasting operation through a neuro-genetic technique. Environ. Earth Sci. 2016, 75, 1–15. [Google Scholar] [CrossRef]
- Khandelwal, M.; Singh, T.N. Evaluation of blast-induced ground vibration predictors. Soil. Dyn. Earthq. Eng. 2007, 27, 116–125. [Google Scholar] [CrossRef]
- Zhou, J.; Asteris, P.G.; Armaghani, D.J.; Pham, B.T. Prediction of ground vibration induced by blasting operations through the use of the Bayesian Network and random forest models. Soil Dyn. Earthq. Eng. 2020, 139, 106390. [Google Scholar] [CrossRef]
- Hajihassani, M.; Jahed Armaghani, D.; Marto, A.; Tonnizam Mohamad, E. Ground vibration prediction in quarry blasting through an artificial neural network optimized by imperialist competitive algorithm. Bull. Eng. Geol. Environ. 2014, 74, 873–886. [Google Scholar] [CrossRef]
- Khandelwal, M.; Singh, T.N. Prediction of blast-induced ground vibration using artificial neural network. Int. J. Rock Mech. Min. Sci. 2009, 46, 1214–1222. [Google Scholar] [CrossRef]
- Monjezi, M.; Ghafurikalajahi, M.; Bahrami, A. Prediction of blast-induced ground vibration using artificial neural networks. Tunn. Undergr. Space Technol. 2011, 26, 46–50. [Google Scholar] [CrossRef]
- Standard, I. Criteria for safety and design of structures subjected to under ground blast. ISI. IS-6922, 1973. [Google Scholar]
- United States Bureau of Mines; Siskind, D. Structure Response and Damage Produced by Ground Vibration from Surface Mine Blasting; Department of the Interior, Bureau of Mines: New York, NY, USA, 1980.
- Zhou, J.; Li, C.; Koopialipoor, M.; Jahed Armaghani, D.; Thai Pham, B. Development of a new methodology for estimating the amount of PPV in surface mines based on prediction and probabilistic models (GEP-MC). Int. J. Min. Reclam. Environ. 2020, 35, 48–68. [Google Scholar] [CrossRef]
- Wiss, J.F.; Linehan, P.W. Control of Vibration and Blast Noise from Surface Coal Mining. Open File Report (Final) 1 July 1975-28 February 1978; Wiss, Janney, Elstner and Associates, Inc.: Northbrook, IL, USA, 1978; Volume 2. [Google Scholar]
- Khandelwal, M.; Singh, T.N. Prediction of blast induced ground vibrations and frequency in opencast mine: A neural network approach. J. Sound Vib. 2006, 289, 711–725. [Google Scholar] [CrossRef]
- Duvall, W.I.; Fogelson, D.E. Review of Criteria for Estimating Damage to Residences from Blasting Vibrations; US Department of the Interior, Bureau of Mines: Washington, DC, USA, 1962.
- Ghosh, A.; Daemen, J.J.K. A simple new blast vibration predictor (based on wave propagation laws). In Proceedings of the 24th US Symposium on Rock Mechanics (USRMS), College Station, TX, USA, 20 June 1983; American Rock Mechanics Association: Alexandria, VA, USA, 1983. [Google Scholar]
- Roy, P.P. Putting ground vibration predictors into practice. Colliery Guard. 1993, 241, 63–67. [Google Scholar]
- Rahimi, I.; Gandomi, A.H.; Chen, F. Analysis and Prediction of COVID-19 using SIR, SEIR, and Machine Learning Models: Australia, Italy, and UK Cases. Information 2021, 12, 109. [Google Scholar] [CrossRef]
- Asteris, P.G.; Douvika, M.G.; Karamani, C.A.; Skentou, A.D.; Chlichlia, K.; Cavaleri, L.; Daras, T.; Armaghani, D.J.; Zaoutis, T.E. A novel heuristic algorithm for the modeling and risk assessment of the covid-19 pandemic phenomenon. Comput. Model. Eng. Sci. 2020, 124, 1–14. [Google Scholar] [CrossRef]
- Aghaabbasi, M.; Shekari, Z.A.; Shah, M.Z.; Olakunle, O.; Armaghani, D.J.; Moeinaddini, M. Predicting the use frequency of ride-sourcing by off-campus university students through random forest and Bayesian network techniques. Transp. Res. Part A Policy Pract. 2020, 136, 262–281. [Google Scholar] [CrossRef]
- Dehghanbanadaki, A.; Khari, M.; Amiri, S.T.; Armaghani, D.J. Estimation of ultimate bearing capacity of driven piles in c-φ soil using MLP-GWO and ANFIS-GWO models: A comparative study. Soft Comput. 2020, 25, 4103–4119. [Google Scholar] [CrossRef]
- Zhou, J.; Koopialipoor, M.; Murlidhar, B.R.; Fatemi, S.A.; Tahir, M.M.; Armaghani, D.J.; Li, C. Use of Intelligent Methods to Design Effective Pattern Parameters of Mine Blasting to Minimize Flyrock Distance. Nat. Resour. Res. 2019, 1–15. [Google Scholar] [CrossRef]
- Zhou, J.; Shi, X.; Li, X. Utilizing gradient boosted machine for the prediction of damage to residential structures owing to blasting vibrations of open pit mining. J. Vib. Control 2016, 22, 3986–3997. [Google Scholar] [CrossRef]
- Zhou, J.; Li, E.; Yang, S.; Wang, M.; Shi, X.; Yao, S.; Mitri, H.S. Slope stability prediction for circular mode failure using gradient boosting machine approach based on an updated database of case histories. Saf. Sci. 2019, 118, 505–518. [Google Scholar] [CrossRef]
- Armaghani, D.J.; Asteris, P.G. A comparative study of ANN and ANFIS models for the prediction of cement-based mortar materials compressive strength. Neural Comput. Appl. 2020, 1–32. [Google Scholar] [CrossRef]
- Apostolopoulou, M.; Asteris, P.G.; Armaghani, D.J.; Douvika, M.G.; Lourenço, P.B.; Cavaleri, L.; Bakolas, A.; Moropoulou, A. Mapping and holistic design of natural hydraulic lime mortars. Cem. Concr. Res. 2020, 136, 106167. [Google Scholar] [CrossRef]
- Zeng, J.; Asteris, P.G.; Mamou, A.P.; Mohammed, A.S.; Golias, E.A.; Armaghani, D.J.; Faizi, K.; Hasanipanah, M. The Effectiveness of Ensemble-Neural Network Techniques to Predict Peak Uplift Resistance of Buried Pipes in Reinforced Sand. Appl. Sci. 2021, 11, 908. [Google Scholar] [CrossRef]
- Jahed Armaghani, D.; Asteris, P.G.; Askarian, B.; Hasanipanah, M.; Tarinejad, R.; Huynh, V. Van Examining Hybrid and Single SVM Models with Different Kernels to Predict Rock Brittleness. Sustainability 2020, 12, 2229. [Google Scholar] [CrossRef] [Green Version]
- Duan, J.; Asteris, P.G.; Nguyen, H.; Bui, X.-N.; Moayedi, H. A novel artificial intelligence technique to predict compressive strength of recycled aggregate concrete using ICA-XGBoost model. Eng. Comput. 2020, 1–18. [Google Scholar] [CrossRef]
- Lu, S.; Koopialipoor, M.; Asteris, P.G.; Bahri, M.; Armaghani, D.J. A Novel Feature Selection Approach Based on Tree Models for Evaluating the Punching Shear Capacity of Steel Fiber-Reinforced Concrete Flat Slabs. Materials 2020, 13, 3902. [Google Scholar] [CrossRef] [PubMed]
- Asteris, P.G.; Apostolopoulou, M.; Armaghani, D.J.; Cavaleri, L.; Chountalas, A.T.; Guney, D.; Hajihassani, M.; Hasanipanah, M.; Khandelwal, M.; Karamani, C.; et al. On the metaheuristic models for the prediction of cement-metakaolin mortars compressive strength. Metaheuristic Comput. Appl. 2020, 1, 63–99. [Google Scholar]
- Armaghani, D.J.; Asteris, P.G.; Fatemi, S.A.; Hasanipanah, M.; Tarinejad, R.; Rashid, A.S.A.; Huynh, V. Van On the Use of Neuro-Swarm System to Forecast the Pile Settlement. Appl. Sci. 2020, 10, 1904. [Google Scholar] [CrossRef] [Green Version]
- Zhao, J.; Nguyen, H.; Nguyen-Thoi, T.; Asteris, P.G.; Zhou, J. Improved Levenberg–Marquardt backpropagation neural network by particle swarm and whale optimization algorithms to predict the deflection of RC beams. Eng. Comput. 2021, 1–23. [Google Scholar] [CrossRef]
- Apostolopoulou, M.; Armaghani, D.J.; Bakolas, A.; Douvika, M.G.; Moropoulou, A.; Asteris, P.G. Compressive strength of natural hydraulic lime mortars using soft computing techniques. Procedia Struct. Integr. 2019, 17, 914–923. [Google Scholar] [CrossRef]
- Sarir, P.; Chen, J.; Asteris, P.G.; Armaghani, D.J.; Tahir, M.M. Developing GEP tree-based, neuro-swarm, and whale optimization models for evaluation of bearing capacity of concrete-filled steel tube columns. Eng. Comput. 2019, 1–19. [Google Scholar] [CrossRef]
- Huang, J.; Kumar, G.S.; Sun, Y. Evaluation of workability and mechanical properties of asphalt binder and mixture modified with waste toner. Constr. Build. Mater. 2021, 276, 122230. [Google Scholar] [CrossRef]
- Kardani, N.; Bardhan, A.; Kim, D.; Samui, P.; Zhou, A. Modelling the energy performance of residential buildings using advanced computational frameworks based on RVM, GMDH, ANFIS-BBO and ANFIS-IPSO. J. Build. Eng. 2021, 35, 102105. [Google Scholar] [CrossRef]
- Khari, M.; Armaghani, D.J.; Dehghanbanadaki, A. Prediction of Lateral Deflection of Small-Scale Piles Using Hybrid PSO–ANN Model. Arab. J. Sci. Eng. 2019, 1–11. [Google Scholar] [CrossRef]
- Momeni, E.; Yarivand, A.; Bagher Dowlatshahi, M.; Jahed Armaghani, D. An Efficient Optimal Neural Network Based on Gravitational Search Algorithm in Predicting the Deformation of Geogrid-Reinforced Soil Structures. Transp. Geotech. 2020, 26, 100446. [Google Scholar] [CrossRef]
- Zhang, H.; Nguyen, H.; Bui, X.-N.; Pradhan, B.; Asteris, P.G.; Costache, R.; Aryal, J. A generalized artificial intelligence model for estimating the friction angle of clays in evaluating slope stability using a deep neural network and Harris Hawks optimization algorithm. Eng. Comput. 2021, 1–14. [Google Scholar] [CrossRef]
- Apostolopoulour, M.; Douvika, M.G.; Kanellopoulos, I.N.; Moropoulou, A.; Asteris, P.G. Prediction of Compressive Strength of Mortars using Artificial Neural Networks. In Proceedings of the 1st International Conference TMM_CH, Transdisciplinary Multispectral Modelling and Cooperation for the Preservation of Cultural Heritage, Athens, Greece, 10–13 October 2018; pp. 10–13. [Google Scholar]
- Psyllaki, P.; Stamatiou, K.; Iliadis, I.; Mourlas, A.; Asteris, P.; Vaxevanidis, N. Surface treatment of tool steels against galling failure. In Proceedings of the MATEC Web of Conferences, Warsaw, Poland, 5–7 October 2018; EDP Sciences: Les Ulis, France; Volume 188, p. 4024. [Google Scholar]
- Kechagias, J.; Tsiolikas, A.; Asteris, P.; Vaxevanidis, N. Optimizing ANN performance using DOE: Application on turning of a titanium alloy. In Proceedings of the MATEC Web of Conferences, Taichung, Taiwan, 28 October–1 November 2017; EDP Sciences: Les Ulis, France; Volume 178, p. 1017. [Google Scholar]
- Huang, L.; Asteris, P.G.; Koopialipoor, M.; Armaghani, D.J.; Tahir, M.M. Invasive Weed Optimization Technique-Based ANN to the Prediction of Rock Tensile Strength. Appl. Sci. 2019, 9, 5372. [Google Scholar] [CrossRef] [Green Version]
- Huang, J.; Asteris, P.G.; Pasha, S.M.K.; Mohammed, A.S.; Hasanipanah, M. A new auto-tuning model for predicting the rock fragmentation: A cat swarm optimization algorithm. Eng. Comput. 2020, 1–12. [Google Scholar] [CrossRef]
- Ly, H.B.; Pham, B.T.; Le, L.M.; Le, T.T.; Le, V.M.; Asteris, P.G. Estimation of axial load-carrying capacity of concrete-filled steel tubes using surrogate models. Neural Comput. Appl. 2020, 33, 3437–3458. [Google Scholar] [CrossRef]
- Asteris, P.G.; Cavaleri, L.; Ly, H.-B.; Pham, B.T. Surrogate models for the compressive strength mapping of cement mortar materials. Soft Comput. 2021, 25, 6347–6372. [Google Scholar] [CrossRef]
- Huang, J.; Wang, Q.-A. Influence of crumb rubber particle sizes on rutting, low temperature cracking, fracture, and bond strength properties of asphalt binder. Mater. Struct. 2021, 54, 1–15. [Google Scholar] [CrossRef]
- Huang, J.; Duan, T.; Zhang, Y.; Liu, J.; Zhang, J.; Lei, Y. Predicting the permeability of pervious concrete based on the beetle antennae search algorithm and random forest model. Adv. Civ. Eng. 2020, 2020. [Google Scholar] [CrossRef]
- Huang, J.; Sun, Y.; Zhang, J. Reduction of computational error by optimizing SVR kernel coefficients to simulate concrete compressive strength through the use of a human learning optimization algorithm. Eng. Comput. 2021, 1–18. [Google Scholar] [CrossRef]
- Huang, J.; Zhang, J.; Ren, J.; Chen, H. Anti-rutting performance of the damping asphalt mixtures (DAMs) made with a high content of asphalt rubber (AR). Constr. Build. Mater. 2021, 271, 121878. [Google Scholar] [CrossRef]
- Yang, H.; Liu, J.; Liu, B. Investigation on the cracking character of jointed rock mass beneath TBM disc cutter. Rock Mech. Rock Eng. 2018, 51, 1263–1277. [Google Scholar] [CrossRef]
- Yang, H.Q.; Li, Z.; Jie, T.Q.; Zhang, Z.Q. Effects of joints on the cutting behavior of disc cutter running on the jointed rock mass. Tunn. Undergr. Space Technol. 2018, 81, 112–120. [Google Scholar] [CrossRef]
- Yang, H.; Wang, Z.; Song, K. A new hybrid grey wolf optimizer-feature weighted-multiple kernel-support vector regression technique to predict TBM performance. Eng. Comput. 2020, 1–17. [Google Scholar] [CrossRef]
- Liu, B.; Yang, H.; Karekal, S. Effect of Water Content on Argillization of Mudstone During the Tunnelling process. Rock Mech. Rock Eng. 2019, 53, 799–813. [Google Scholar] [CrossRef]
- Zhou, J.; Li, X.; Mitri, H.S. Comparative performance of six supervised learning methods for the development of models of hard rock pillar stability prediction. Nat. Hazards 2015, 79, 291–316. [Google Scholar] [CrossRef]
- Zhou, J.; Li, X.; Mitri, H.S. Evaluation method of rockburst: State-of-the-art literature review. Tunn. Undergr. Space Technol. 2018, 81, 632–659. [Google Scholar] [CrossRef]
- Gavriilaki, E.; Asteris, P.G.; Touloumenidou, T.; Koravou, E.-E.; Koutra, M.; Papayanni, P.G.; Karali, V.; Papalexandri, A.; Varelas, C.; Chatzopoulou, F.; et al. Genetic justification of severe COVID-19 using a rigorous algorithm. Clin. Immunol. 2021, 9, 108726. [Google Scholar] [CrossRef]
- Singh, T.N.; Singh, V. An intelligent approach to prediction and control ground vibration in mines. Geotech. Geol. Eng. 2005, 23, 249–262. [Google Scholar] [CrossRef]
- Fişne, A.; Kuzu, C.; Hüdaverdi, T. Prediction of environmental impacts of quarry blasting operation using fuzzy logic. Environ. Monit. Assess. 2011, 174, 461–470. [Google Scholar] [CrossRef]
- Saadat, M.; Khandelwal, M.; Monjezi, M. An ANN-based approach to predict blast-induced ground vibration of Gol-E-Gohar iron ore mine, Iran. J. Rock Mech. Geotech. Eng. 2014, 6, 67–76. [Google Scholar] [CrossRef] [Green Version]
- Shirani Faradonbeh, R.; Jahed Armaghani, D.; Abd Majid, M.Z.; MD Tahir, M.; Ramesh Murlidhar, B.; Monjezi, M.; Wong, H.M. Prediction of ground vibration due to quarry blasting based on gene expression programming: A new model for peak particle velocity prediction. Int. J. Environ. Sci. Technol. 2016, 13, 1453–1464. [Google Scholar] [CrossRef] [Green Version]
- Nguyen, H.; Bui, X.-N.; Tran, Q.-H.; Mai, N.-L. A new soft computing model for estimating and controlling blast-produced ground vibration based on hierarchical K-means clustering and cubist algorithms. Appl. Soft Comput. 2019, 77, 376–386. [Google Scholar] [CrossRef]
- Nguyen, H.; Choi, Y.; Bui, X.-N.; Nguyen-Thoi, T. Predicting Blast-Induced Ground Vibration in Open-Pit Mines Using Vibration Sensors and Support Vector Regression-Based Optimization Algorithms. Sensors 2020, 20, 132. [Google Scholar] [CrossRef] [Green Version]
- Zhang, H.; Zhou, J.; Armaghani, D.J.; Tahir, M.M.; Pham, B.T.; Huynh, V.V. A Combination of Feature Selection and Random Forest Techniques to Solve a Problem Related to Blast-Induced Ground Vibration. Appl. Sci. 2020, 10, 869. [Google Scholar] [CrossRef] [Green Version]
- Iphar, M.; Yavuz, M.; Ak, H. Prediction of ground vibrations resulting from the blasting operations in an open-pit mine by adaptive neuro-fuzzy inference system. Environ. Geol. 2008, 56, 97–107. [Google Scholar] [CrossRef]
- Mohamed, M.T. Performance of fuzzy logic and artificial neural network in prediction of ground and air vibrations. Int. J. Rock Mech. Min. Sci. 2011, 48, 845. [Google Scholar] [CrossRef]
- Khandelwal, M.; Kumar, D.L.; Yellishetty, M. Application of soft computing to predict blast-induced ground vibration. Eng. Comput. 2011, 27, 117–125. [Google Scholar] [CrossRef]
- Mohamadnejad, M.; Gholami, R.; Ataei, M. Comparison of intelligence science techniques and empirical methods for prediction of blasting vibrations. Tunn. Undergr. Space Technol. 2012, 28, 238–244. [Google Scholar] [CrossRef]
- Mohamad, E.T.; Noorani, S.A.; Armaghani, D.J.; Saad, R. Simulation of blasting induced ground vibration by using artificial neural network. Electron. J. Geotech. Eng. 2012, 17, 2571–2584. [Google Scholar]
- Ghasemi, E.; Ataei, M.; Hashemolhosseini, H. Development of a fuzzy model for predicting ground vibration caused by rock blasting in surface mining. J. Vib. Control 2013, 19, 755–770. [Google Scholar] [CrossRef]
- Dindarloo, S.R. Peak particle velocity prediction using support vector machines: A surface blasting case study. J. South. Afr. Inst. Min. Metall. 2015, 115, 637–643. [Google Scholar] [CrossRef]
- Hasanipanah, M.; Monjezi, M.; Shahnazar, A.; Armaghani, D.J.; Farazmand, A. Feasibility of indirect determination of blast induced ground vibration based on support vector machine. Measurement 2015, 75, 289–297. [Google Scholar] [CrossRef]
- Armaghani, D.J.; Momeni, E.; Abad, S.V.A.N.K.; Khandelwal, M. Feasibility of ANFIS model for prediction of ground vibrations resulting from quarry blasting. Environ. Earth Sci. 2015, 74, 2845–2860. [Google Scholar] [CrossRef] [Green Version]
- Ghoraba, S.; Monjezi, M.; Talebi, N.; Armaghani, D.J.; Moghaddam, M.R. Estimation of ground vibration produced by blasting operations through intelligent and empirical models. Environ. Earth Sci. 2016, 75, 1–9. [Google Scholar] [CrossRef]
- Hasanipanah, M.; Faradonbeh, R.S.; Amnieh, H.B.; Armaghani, D.J.; Monjezi, M. Forecasting blast-induced ground vibration developing a CART model. Eng. Comput. 2017, 33, 307–316. [Google Scholar] [CrossRef]
- Shahnazar, A.; Nikafshan Rad, H.; Hasanipanah, M.; Tahir, M.M.; Jahed Armaghani, D.; Ghoroqi, M. A new developed approach for the prediction of ground vibration using a hybrid PSO-optimized ANFIS-based model. Environ. Earth Sci. 2017, 76, 1–17. [Google Scholar] [CrossRef]
- Armaghani, D.J.; Hasanipanah, M.; Amnieh, H.B.; Mohamad, E.T. Feasibility of ICA in approximating ground vibration resulting from mine blasting. Neural Comput. Appl. 2018, 29, 457–465. [Google Scholar] [CrossRef]
- Kass, G.V. An exploratory technique for investigating large quantities of categorical data. J. R. Stat. Soc. Ser. C (Appl. Stat.) 1980, 29, 119–127. [Google Scholar] [CrossRef]
- Freund, Y.; Schapire, R.E. Experiments with a new boosting algorithm. In Proceedings of the Thirteenth International Conference on Machine Learning, Bary, Italy, 3–6 July 1996; Volume 96, pp. 148–156. [Google Scholar]
- Tien Bui, D.; Pradhan, B.; Lofman, O.; Revhaug, I. Landslide susceptibility assessment in vietnam using support vector machines, decision tree, and Naive Bayes Models. Math. Probl. Eng. 2012, 2012. [Google Scholar] [CrossRef] [Green Version]
- Jebur, M.N.; Pradhan, B.; Tehrany, M.S. Optimization of landslide conditioning factors using very high-resolution airborne laser scanning (LiDAR) data at catchment scale. Remote Sens. Environ. 2014, 152, 150–165. [Google Scholar] [CrossRef]
- Marjanović, M.; Kovačević, M.; Bajat, B.; Voženílek, V. Landslide susceptibility assessment using SVM machine learning algorithm. Eng. Geol. 2011, 123, 225–234. [Google Scholar] [CrossRef]
- Song, S.; Zhan, Z.; Long, Z.; Zhang, J.; Yao, L. Comparative study of SVM methods combined with voxel selection for object category classification on fMRI data. PLoS ONE 2011, 6, e17191. [Google Scholar] [CrossRef]
- Tehrany, M.S.; Pradhan, B.; Jebur, M.N. Flood susceptibility mapping using a novel ensemble weights-of-evidence and support vector machine models in GIS. J. Hydrol. 2014, 512, 332–343. [Google Scholar] [CrossRef]
- Bhandari, S. Engineering Rock Blasting Operations; CRC Press/Balkema: Rotterdam, The Netherlands, 1997; p. 388. [Google Scholar]
- Chen, W.; Hasanipanah, M.; Rad, H.N.; Armaghani, D.J.; Tahir, M.M. A new design of evolutionary hybrid optimization of SVR model in predicting the blast-induced ground vibration. Eng. Comput. 2019, 1–17. [Google Scholar] [CrossRef]
- Jahed Armaghani, D.; Hajihassani, M.; Monjezi, M.; Mohamad, E.T.; Marto, A.; Moghaddam, M.R. Application of two intelligent systems in predicting environmental impacts of quarry blasting. Arab. J. Geosci. 2015, 8, 9647–9665. [Google Scholar] [CrossRef]


| Study | Model | Model Input Number | Site Location |
|---|---|---|---|
| Singh and Singh [69] | ANN | 9 | India |
| Iphar et al. [76] | ANFIS | 2 | Turkey |
| Khandelwal and Singh [18] | ANN | 10 | India |
| Monjezi et al. [19] | ANN | 4 | Iran |
| Mohamed [77] | ANN, FIS | 2 | Egypt |
| Khandelwal et al. [78] | ANN | 2 | India |
| Fişne et al. [70] | FIS | 2 | Turkey |
| Mohamadnejad et al. [79] | SVM, ANN | 2 | Iran |
| Mohammad et al. [80] | ANN | 9 | Malaysia |
| Monjezi et al. [11] | ANN | 3 | Iran |
| Ghasemi et al. [81] | FIS | 6 | Iran |
| Armaghani et al. [1] | PSO-ANN | 10 | Malaysia |
| Hajihassani et al. [17] | ICA-ANN | 7 | Malaysia |
| Dindarloo [82] | SVM | 12 | Iran |
| Hajihassani et al. [2] | PSO-ANN | 8 | Malaysia |
| Hasanipanah et al. [83] | SVM | 2 | Iran |
| Armaghani et al. [84] | ANFIS | 2 | Malaysia |
| Ghoraba et al. [85] | ANN, ANFIS | 2 | Iran |
| Shirani Faradonbeh et al. [72] | GEP | 6 | Malaysia |
| Hasanipanah et al. [86] | CART | 2 | Iran |
| Shahnazar et al. [87] | PSO-ANFIS | 2 | Malaysia |
| Armaghani et al. [88] | ICA | 2 | Malaysia |
| Nguyen et al. [73] | HKM-CA | 4 | Vietnam |
| Nguyen et al. [74] | SVR-GA | 4 | Vietnam |
| Zhang et al. [75] | RF, CART, CHAID | 6 | Malaysia |
| Zhou et al. [16] | RF, BN | 5 | Malaysia |
| Huang et al. [5] | FA-ANN | 4 | Malaysia |
| Variable (Category) | Unit | Minimum | Maximum | Mean | Standard Deviation |
|---|---|---|---|---|---|
| Burden to spacing (input) | - | 0.41 | 0.91 | 0.75 | 0.103 |
| Distance from the blast-face (input) | m | 65 | 710 | 329 | 142.961 |
| Maximum charge per delay (input) | kg | 69.79 | 309.09 | 202.44 | 64.534 |
| Powder factor (input) | kg/m3 | 0.24 | 0.98 | 0.69 | 0.197 |
| Spacing (input) | m | 2.2 | 5.1 | 3.65 | 0.721 |
| Stemming length (input) | m | 1.4 | 4 | 2.87 | 0.619 |
| PPV (target) | mm/s | 1.21 | 37.44 | 14.4 | 8.673 |
| Model | TRAIN | TEST | Train Ranking | Test Ranking | A-R | ||||||
|---|---|---|---|---|---|---|---|---|---|---|---|
| R | MAE | R | MAE | ||||||||
| V | R | V | R | V | R | V | R | ||||
| BC-SVMRBF | 0.955 | 4 | 0.372 | 4 | 0.965 | 4 | 0.472 | 3 | 8 | 7 | 15 |
| BC-SVMPOL | 0.946 | 3 | 0.388 | 2 | 0.935 | 2 | 0.488 | 2 | 5 | 4 | 9 |
| BC-SVMSIG | −0.208 | 1 | 10.793 | 1 | −0.342 | 1 | 14.455 | 1 | 2 | 2 | 4 |
| BC-SVMLIN | 0.944 | 2 | 0.387 | 3 | 0.959 | 3 | 0.471 | 4 | 5 | 7 | 12 |
Publisher’s Note: MDPI stays neutral with regard to jurisdictional claims in published maps and institutional affiliations. |
© 2021 by the authors. Licensee MDPI, Basel, Switzerland. This article is an open access article distributed under the terms and conditions of the Creative Commons Attribution (CC BY) license (https://creativecommons.org/licenses/by/4.0/).
Share and Cite
Zeng, J.; Roussis, P.C.; Mohammed, A.S.; Maraveas, C.; Fatemi, S.A.; Armaghani, D.J.; Asteris, P.G. Prediction of Peak Particle Velocity Caused by Blasting through the Combinations of Boosted-CHAID and SVM Models with Various Kernels. Appl. Sci. 2021, 11, 3705. https://0-doi-org.brum.beds.ac.uk/10.3390/app11083705
Zeng J, Roussis PC, Mohammed AS, Maraveas C, Fatemi SA, Armaghani DJ, Asteris PG. Prediction of Peak Particle Velocity Caused by Blasting through the Combinations of Boosted-CHAID and SVM Models with Various Kernels. Applied Sciences. 2021; 11(8):3705. https://0-doi-org.brum.beds.ac.uk/10.3390/app11083705
Chicago/Turabian StyleZeng, Jie, Panayiotis C. Roussis, Ahmed Salih Mohammed, Chrysanthos Maraveas, Seyed Alireza Fatemi, Danial Jahed Armaghani, and Panagiotis G. Asteris. 2021. "Prediction of Peak Particle Velocity Caused by Blasting through the Combinations of Boosted-CHAID and SVM Models with Various Kernels" Applied Sciences 11, no. 8: 3705. https://0-doi-org.brum.beds.ac.uk/10.3390/app11083705