
Stochastic Predictions of Ore Production in an Underground Limestone Mine Using Different Probability Density Functions: A Comparative Study Using Big Data from ICT System


Abstract
:1. Introduction
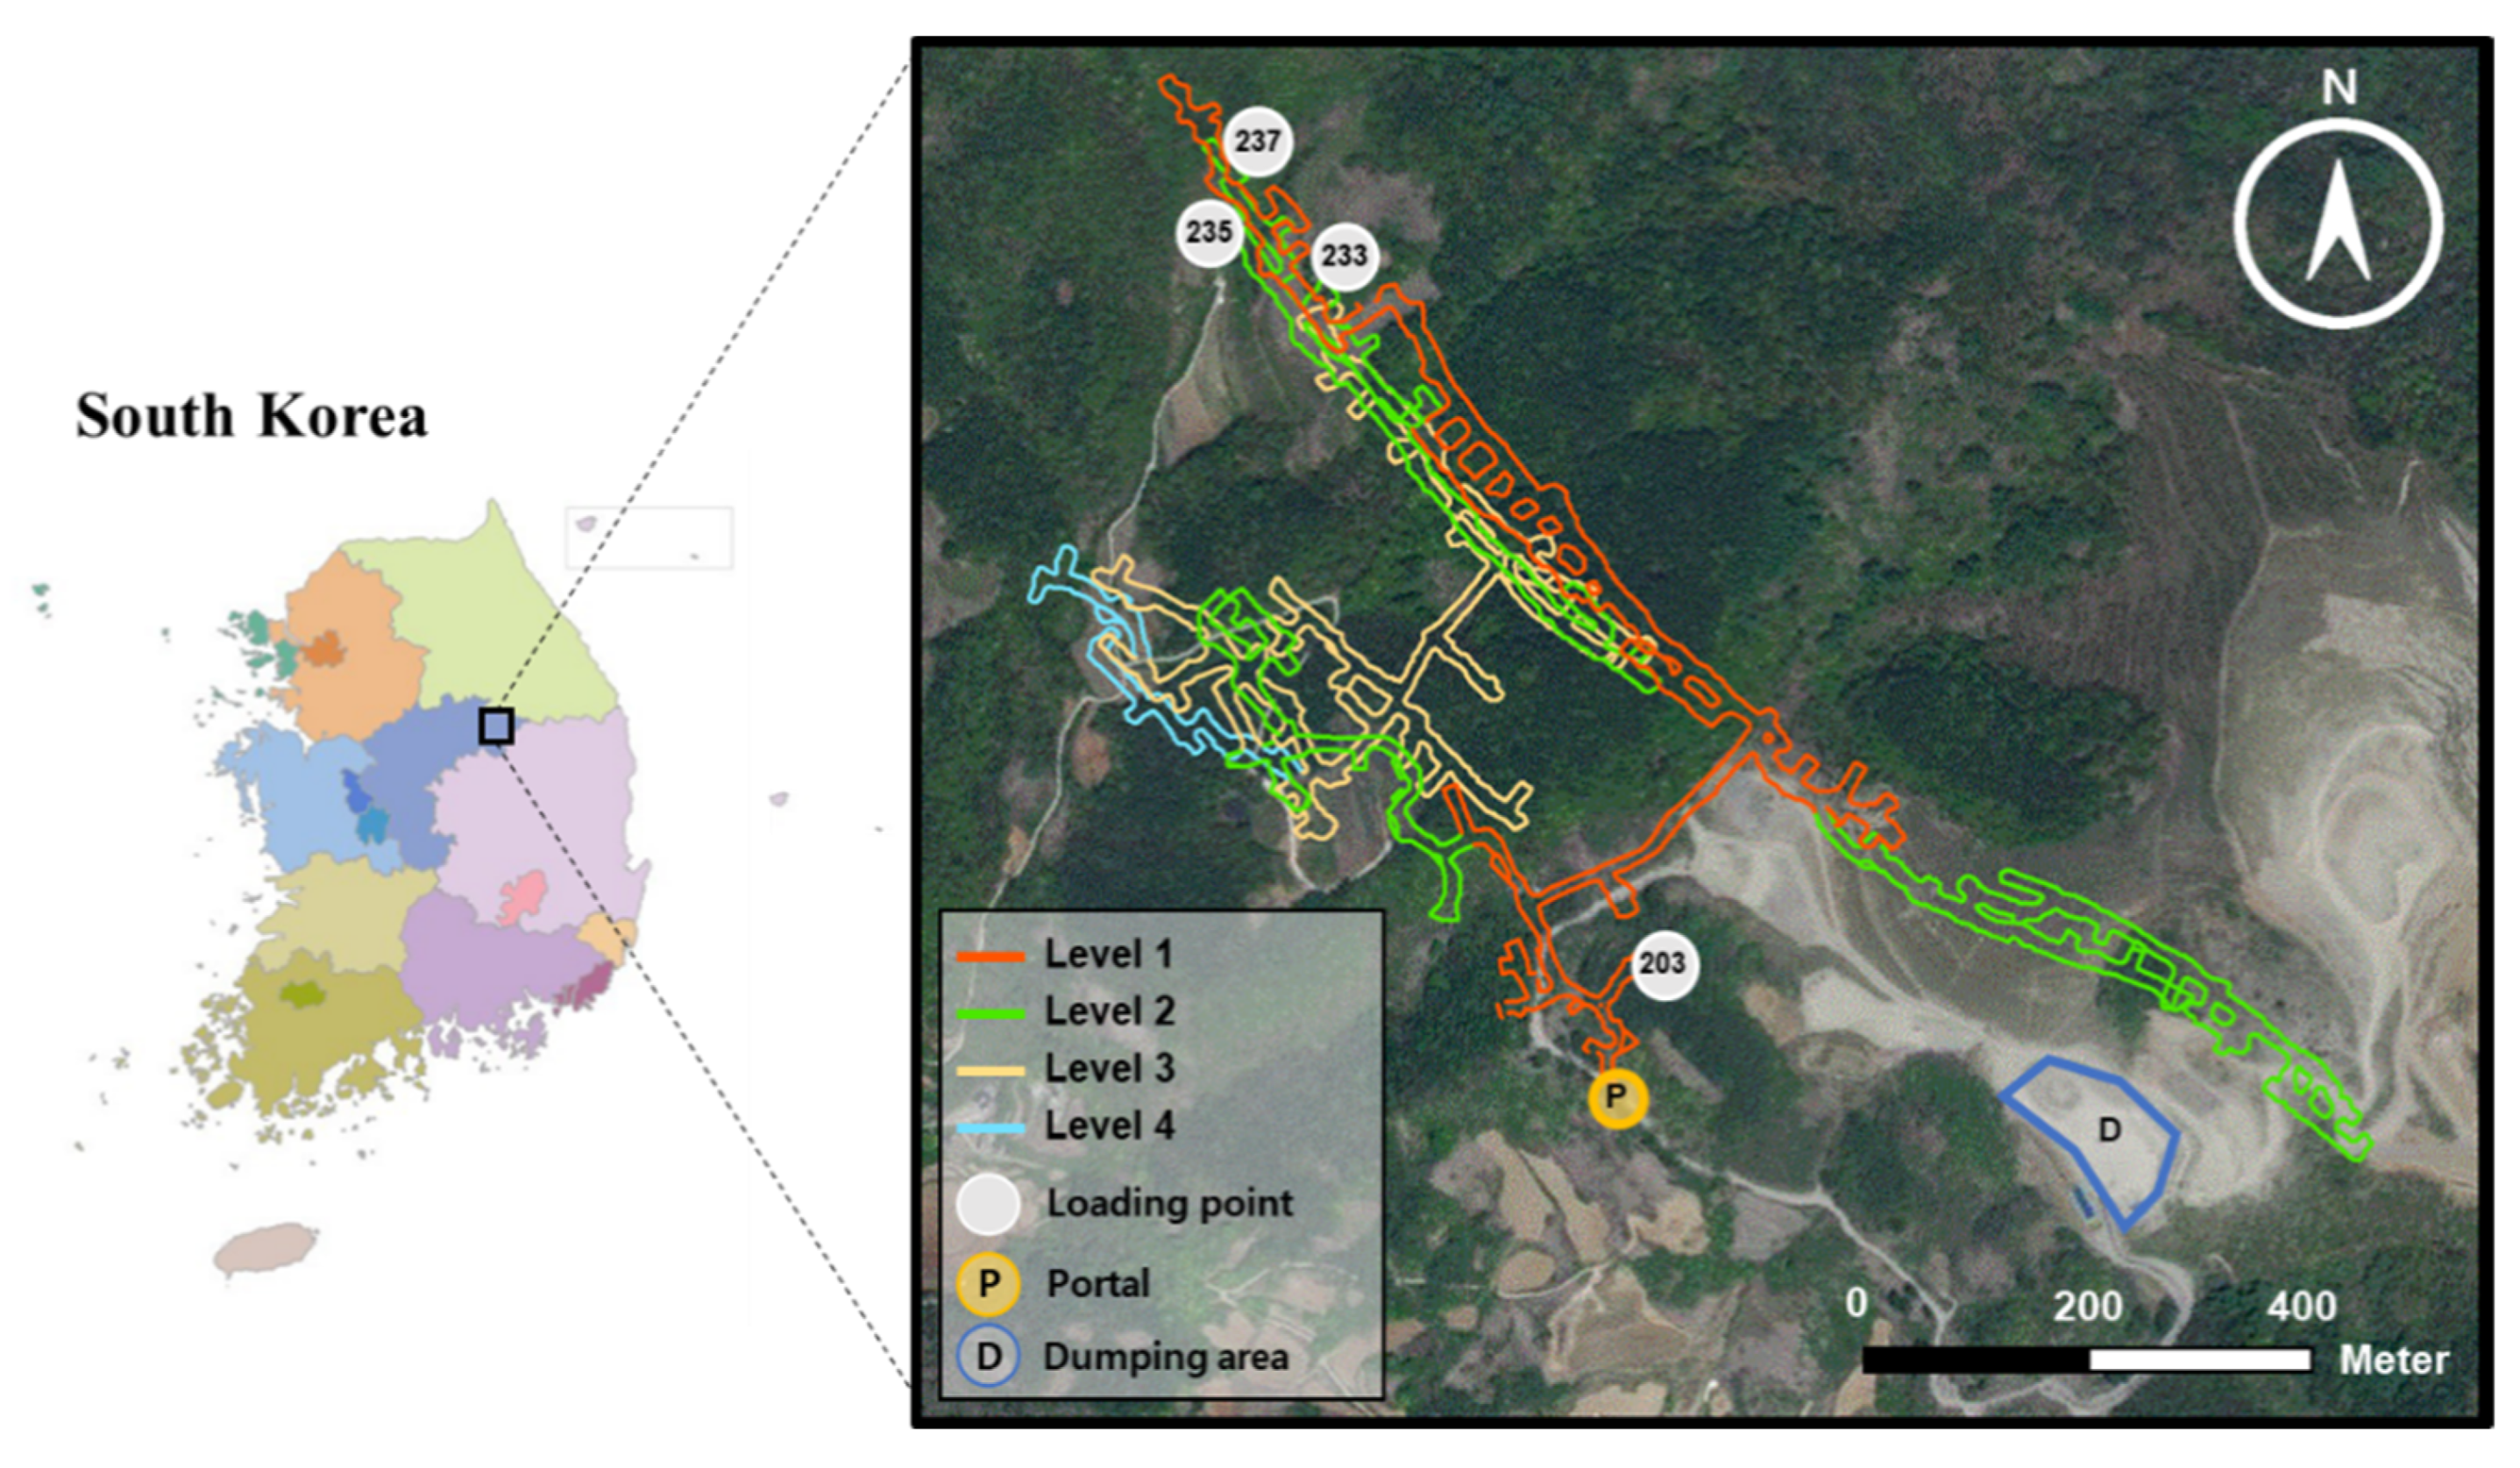
2. Study Area
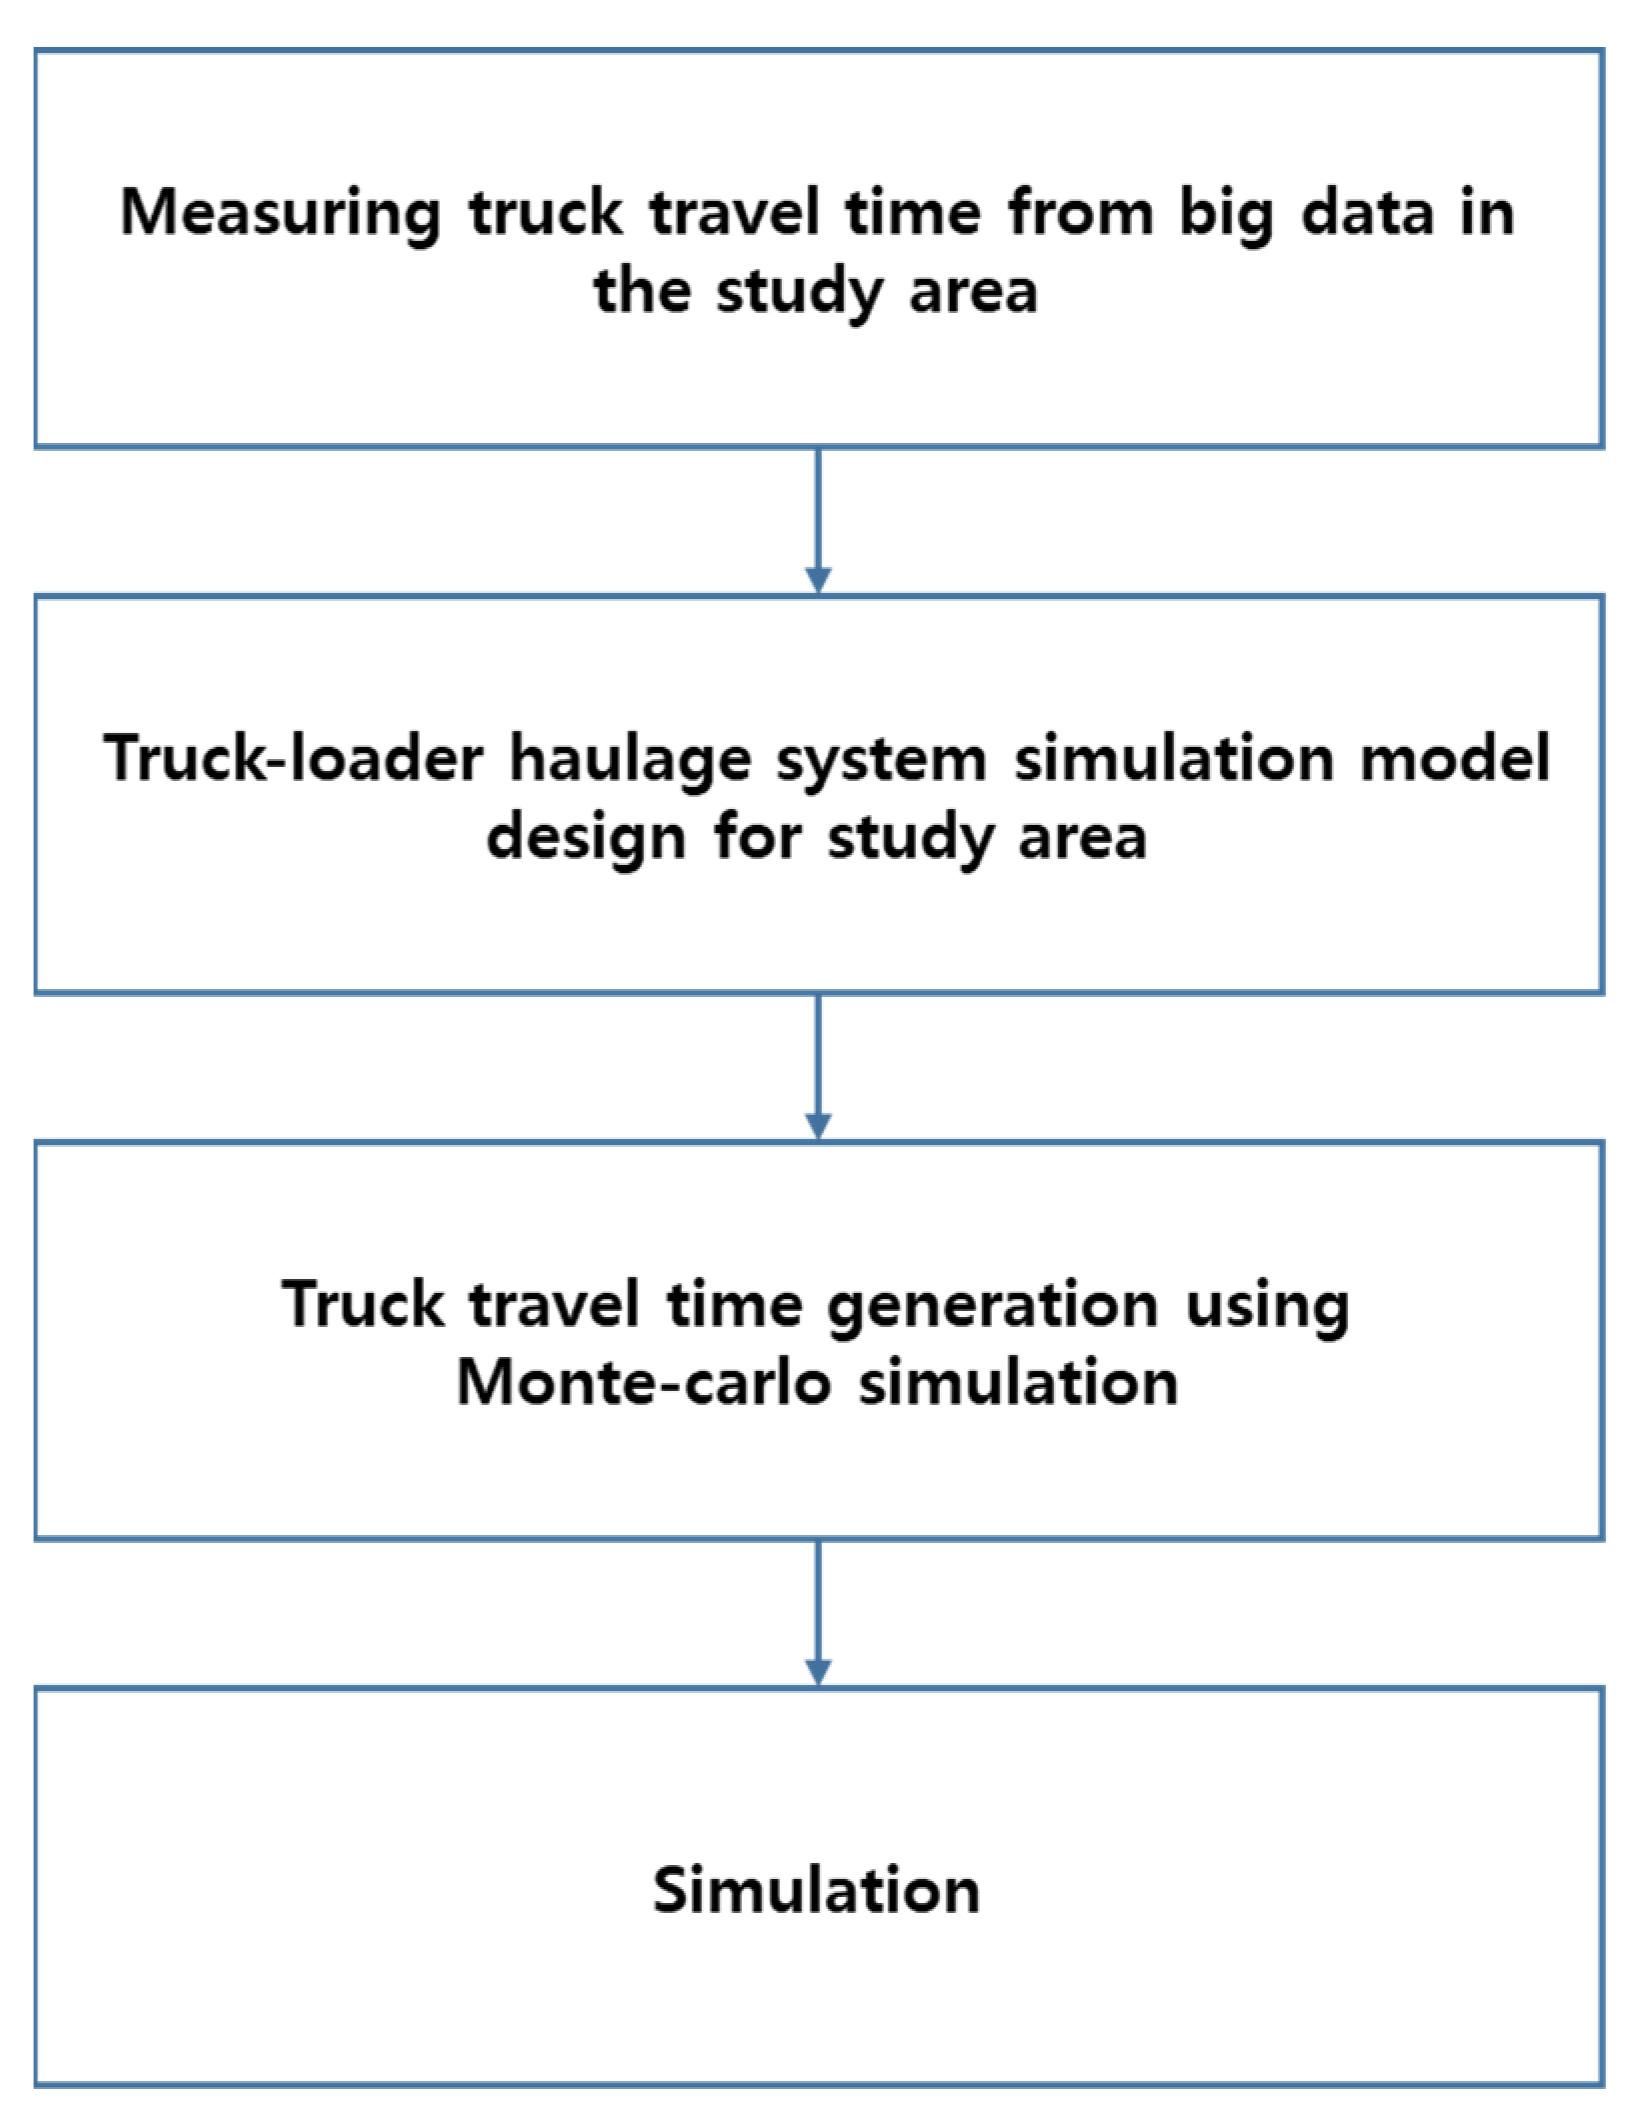
3. Methods
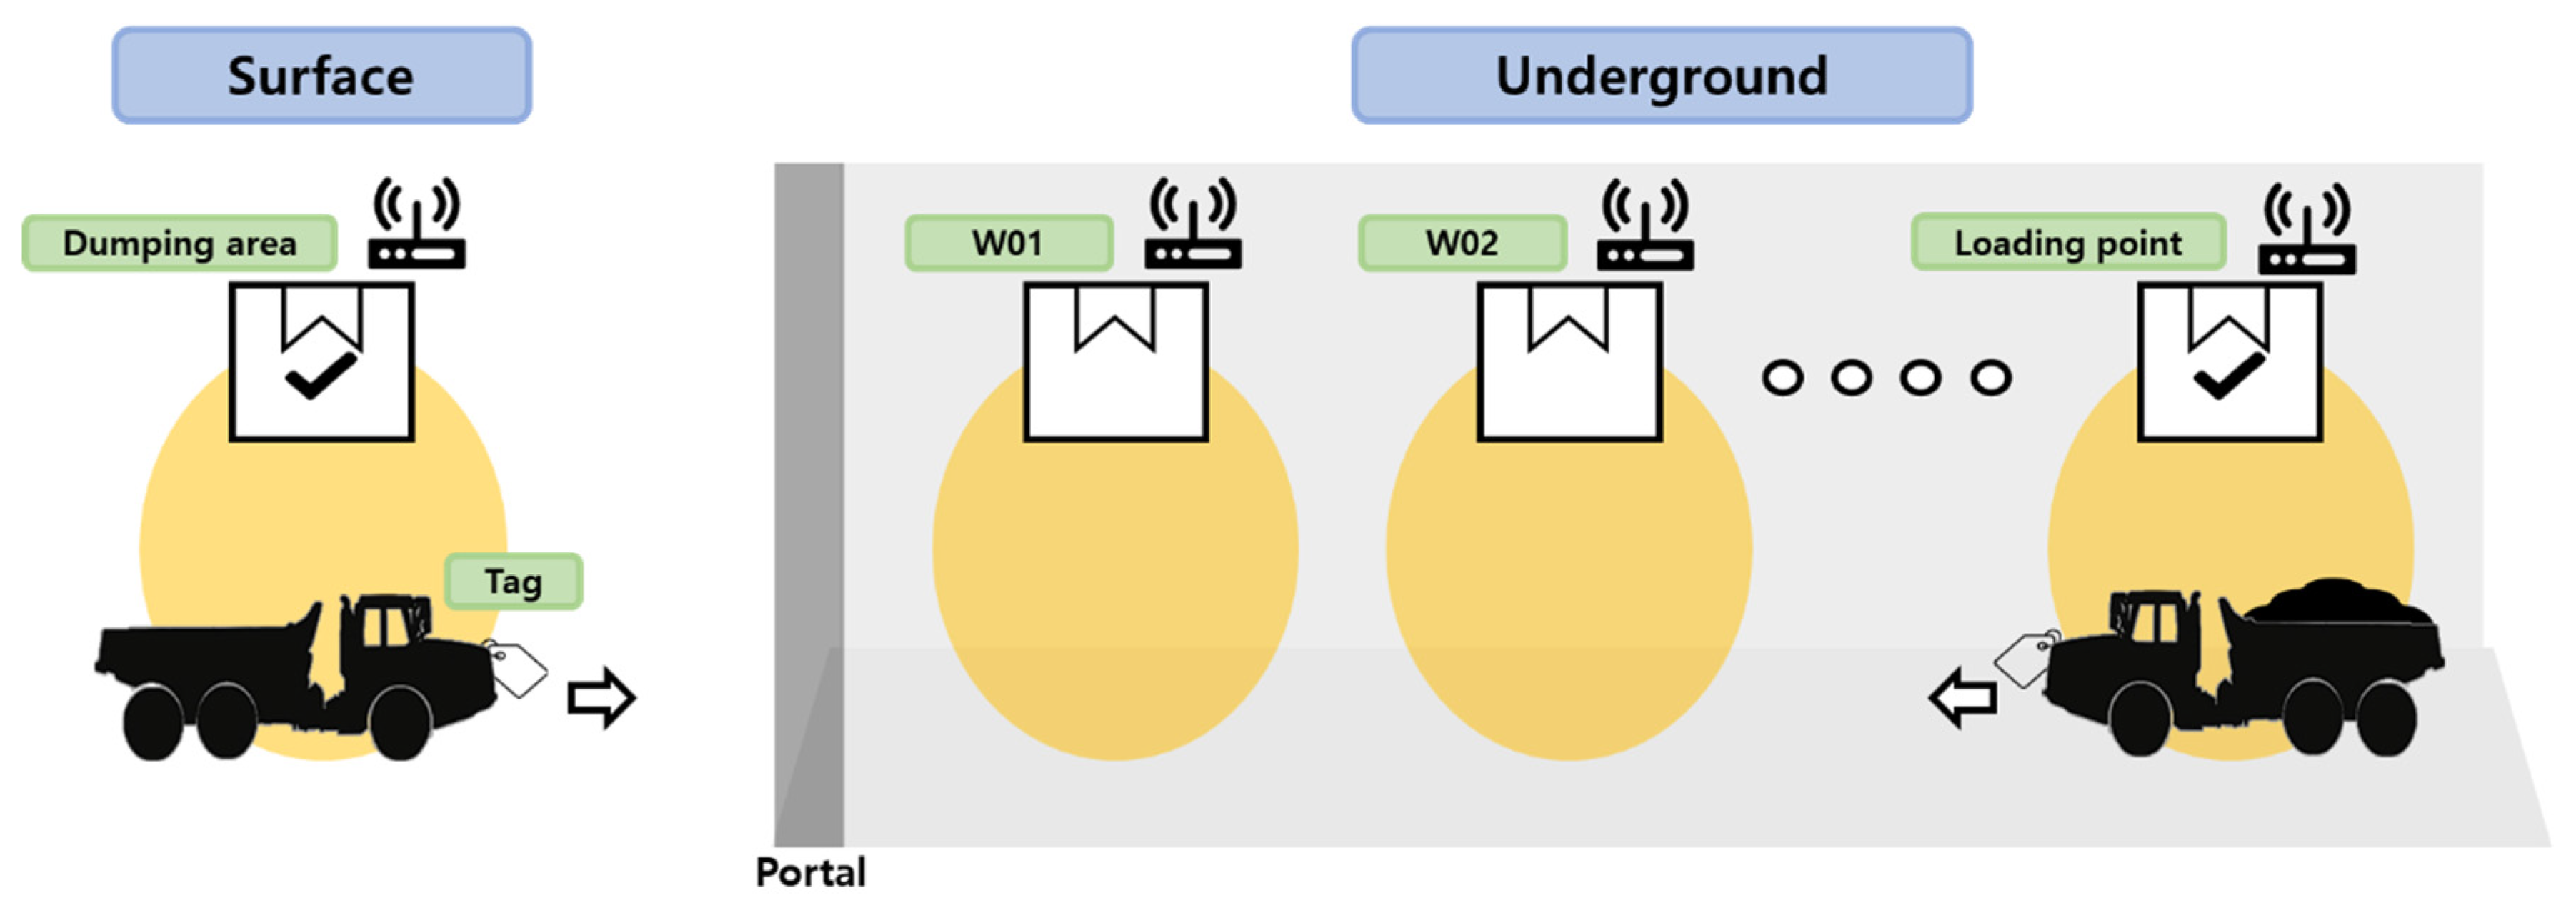
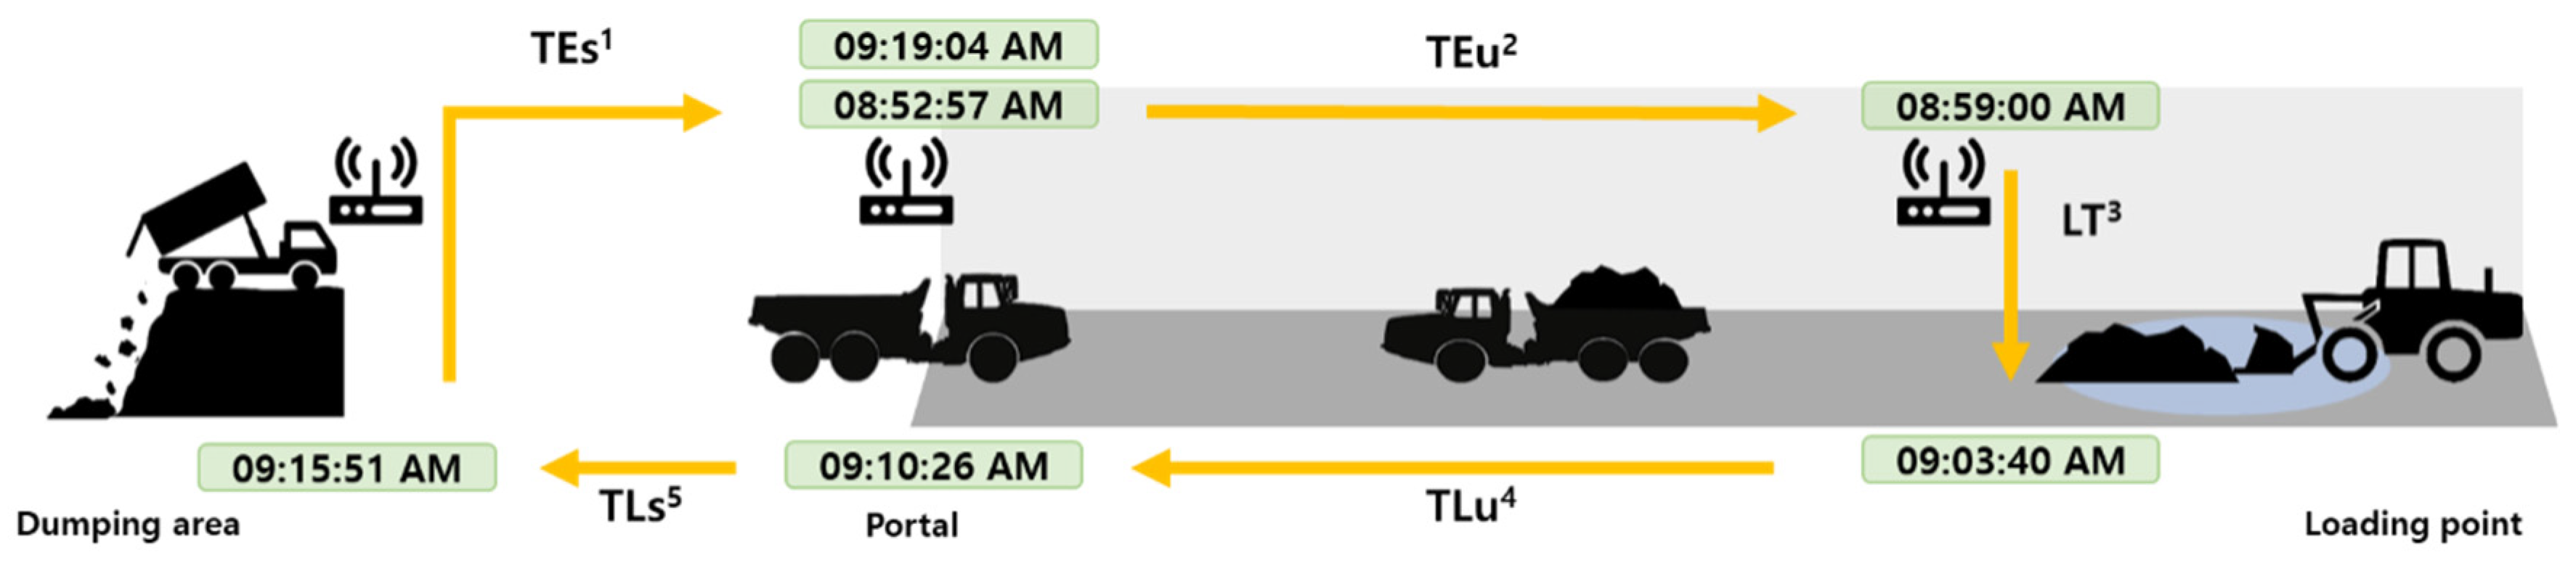
3.1. Measuring Truck Travel Times from Big Data
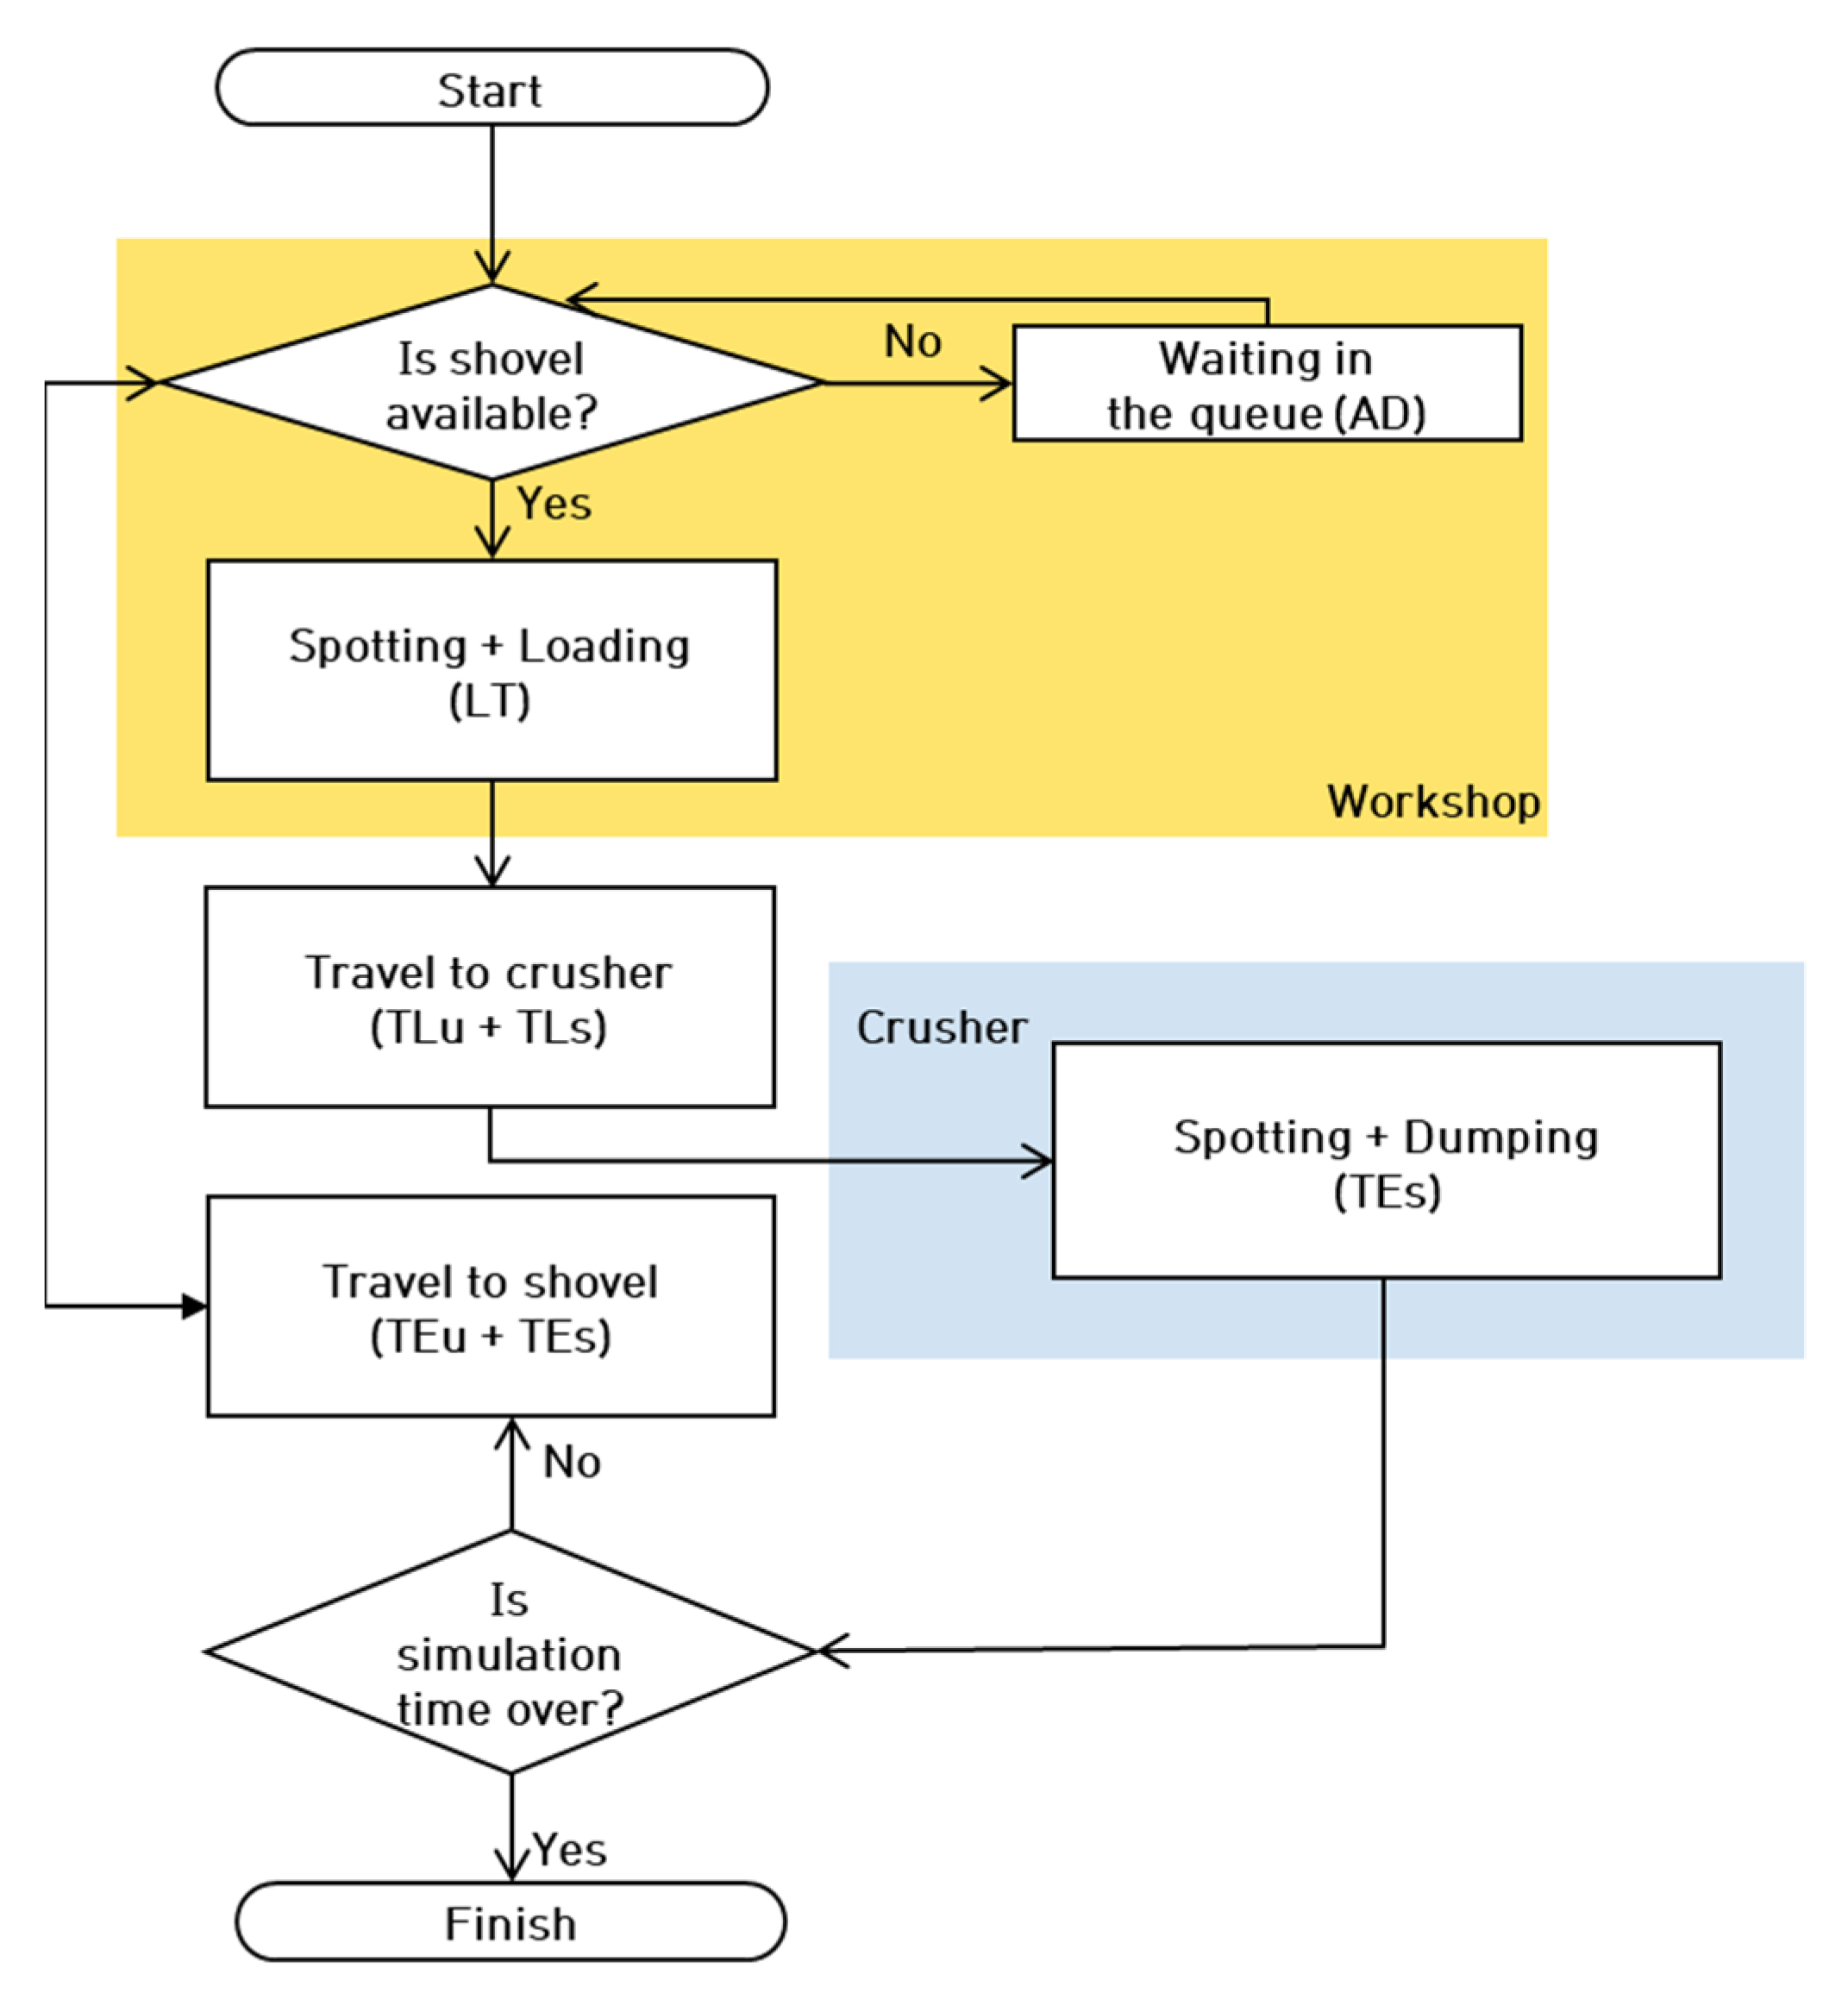
3.2. Design of a Truck Haulage System Model for Stochastic Discrete Event Simulation
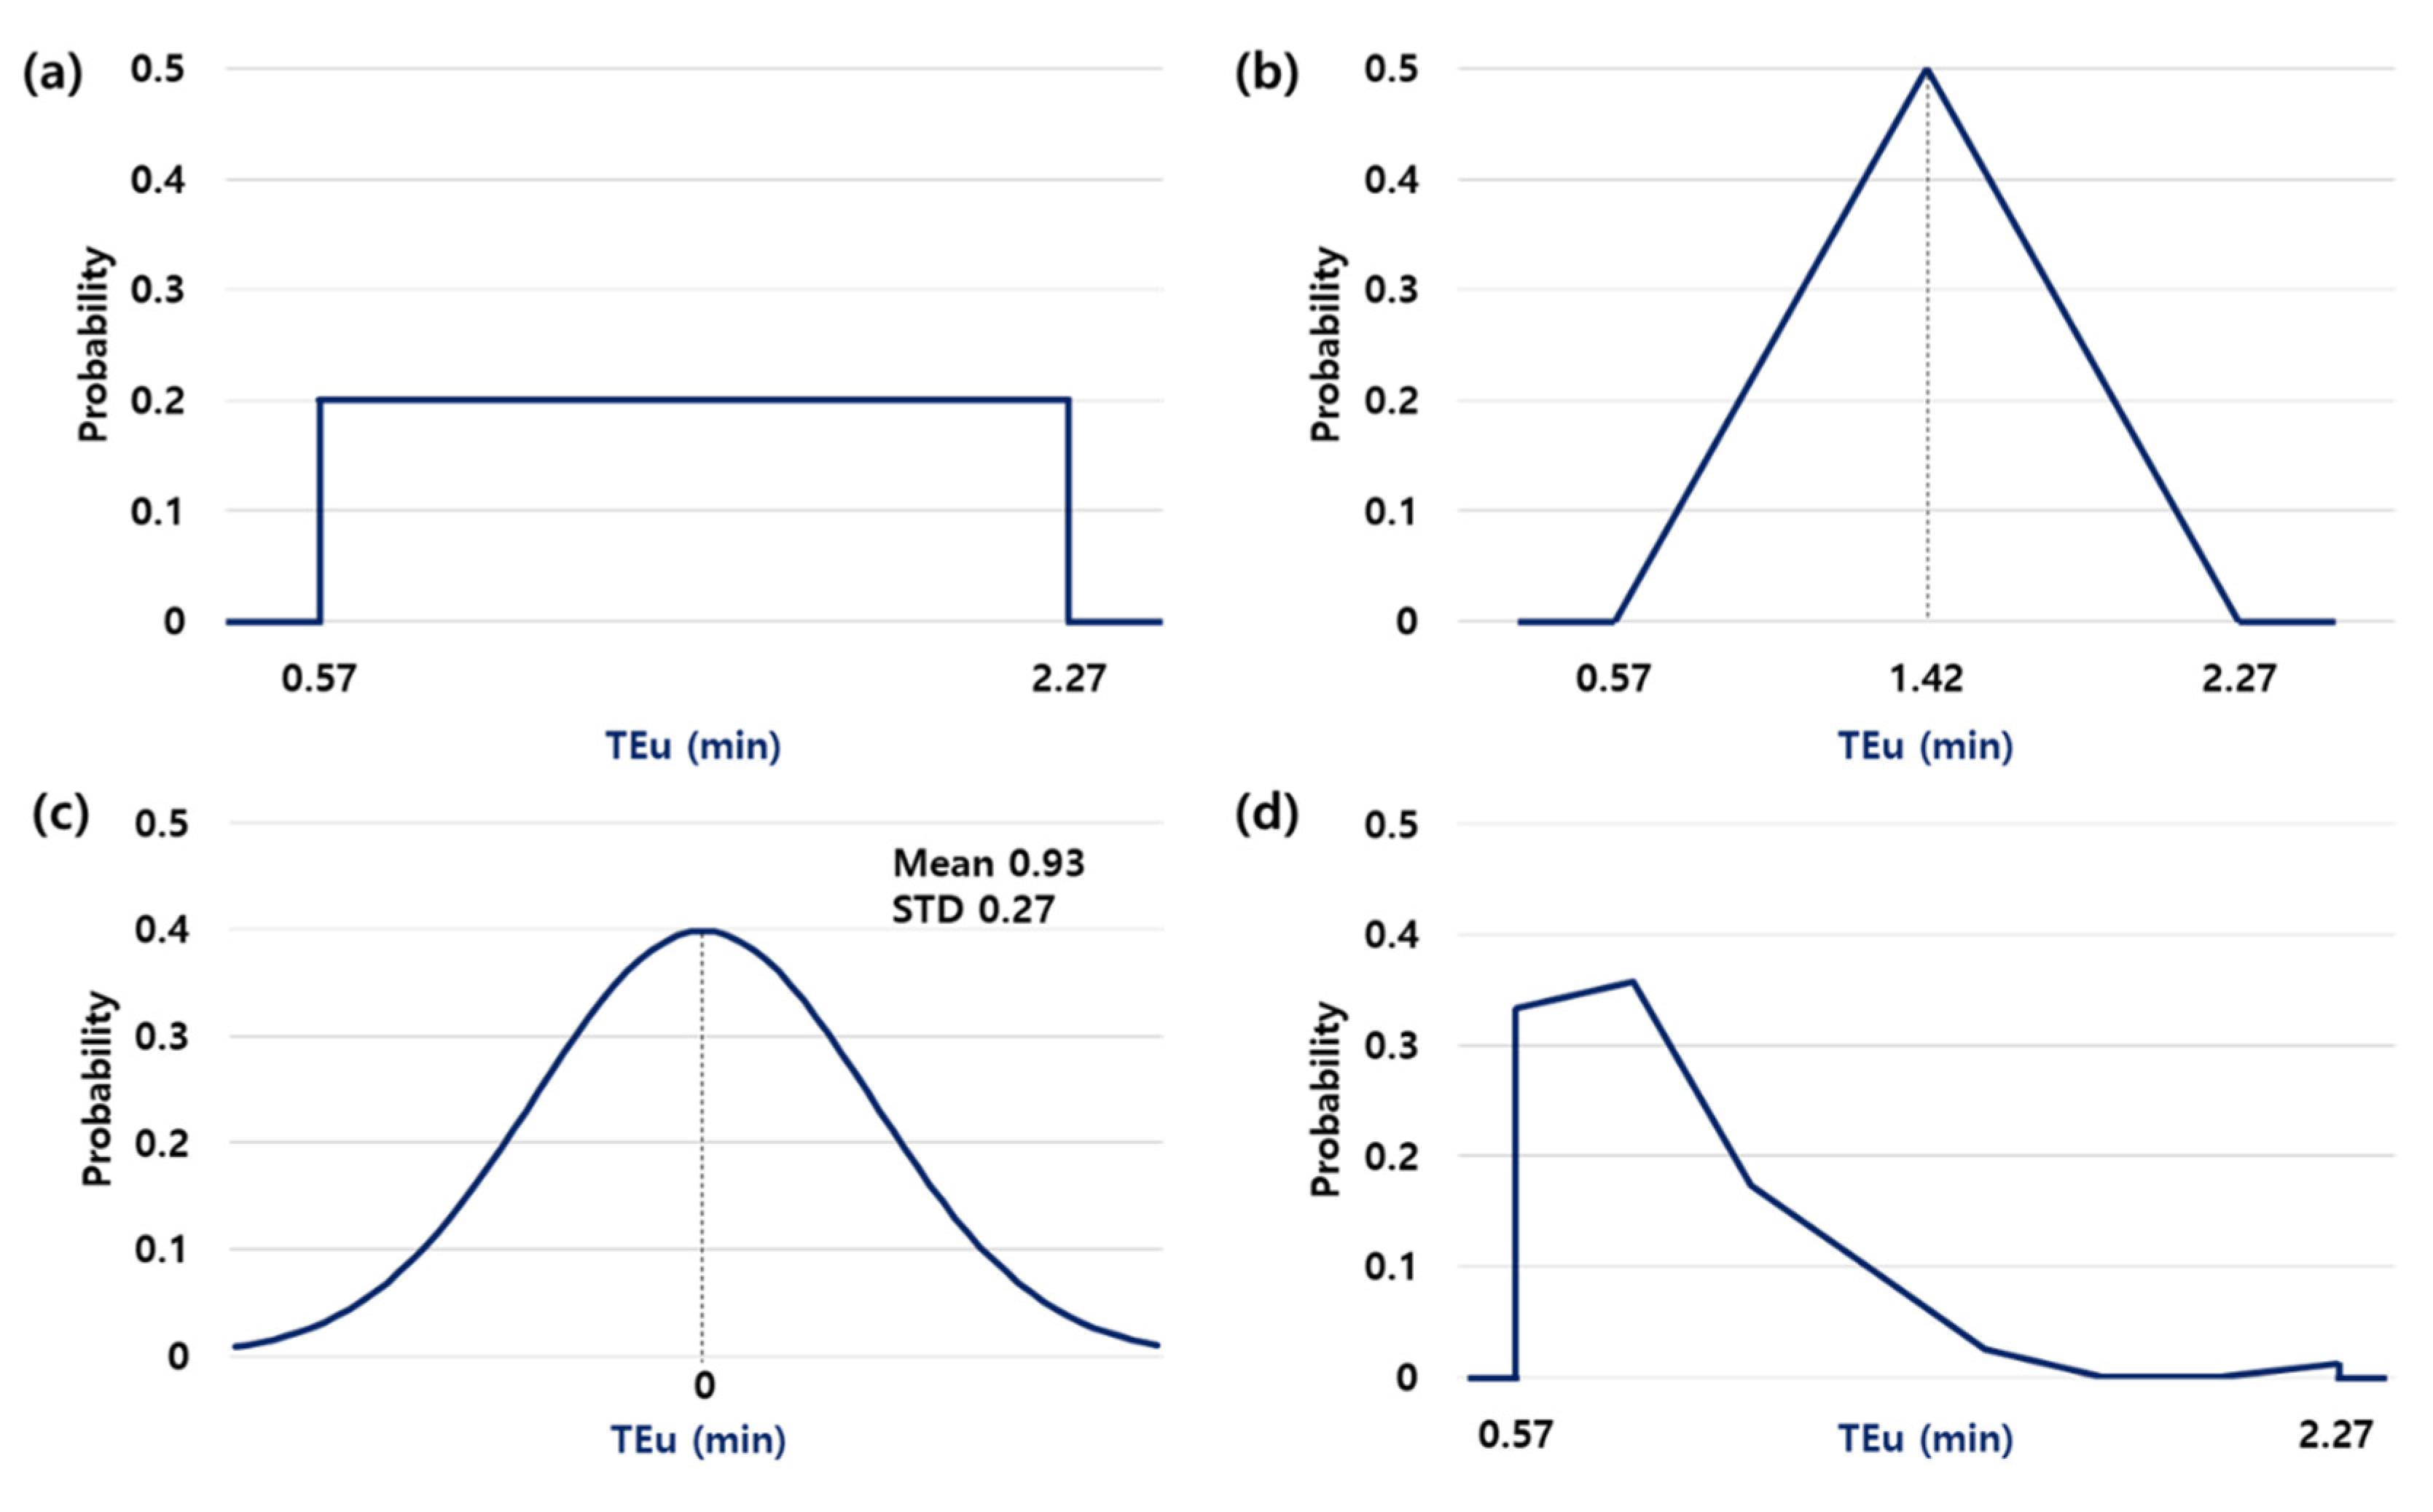
3.3. Generation of Truck Travel Times
3.4. Setting Simulation Parameters
4. Results
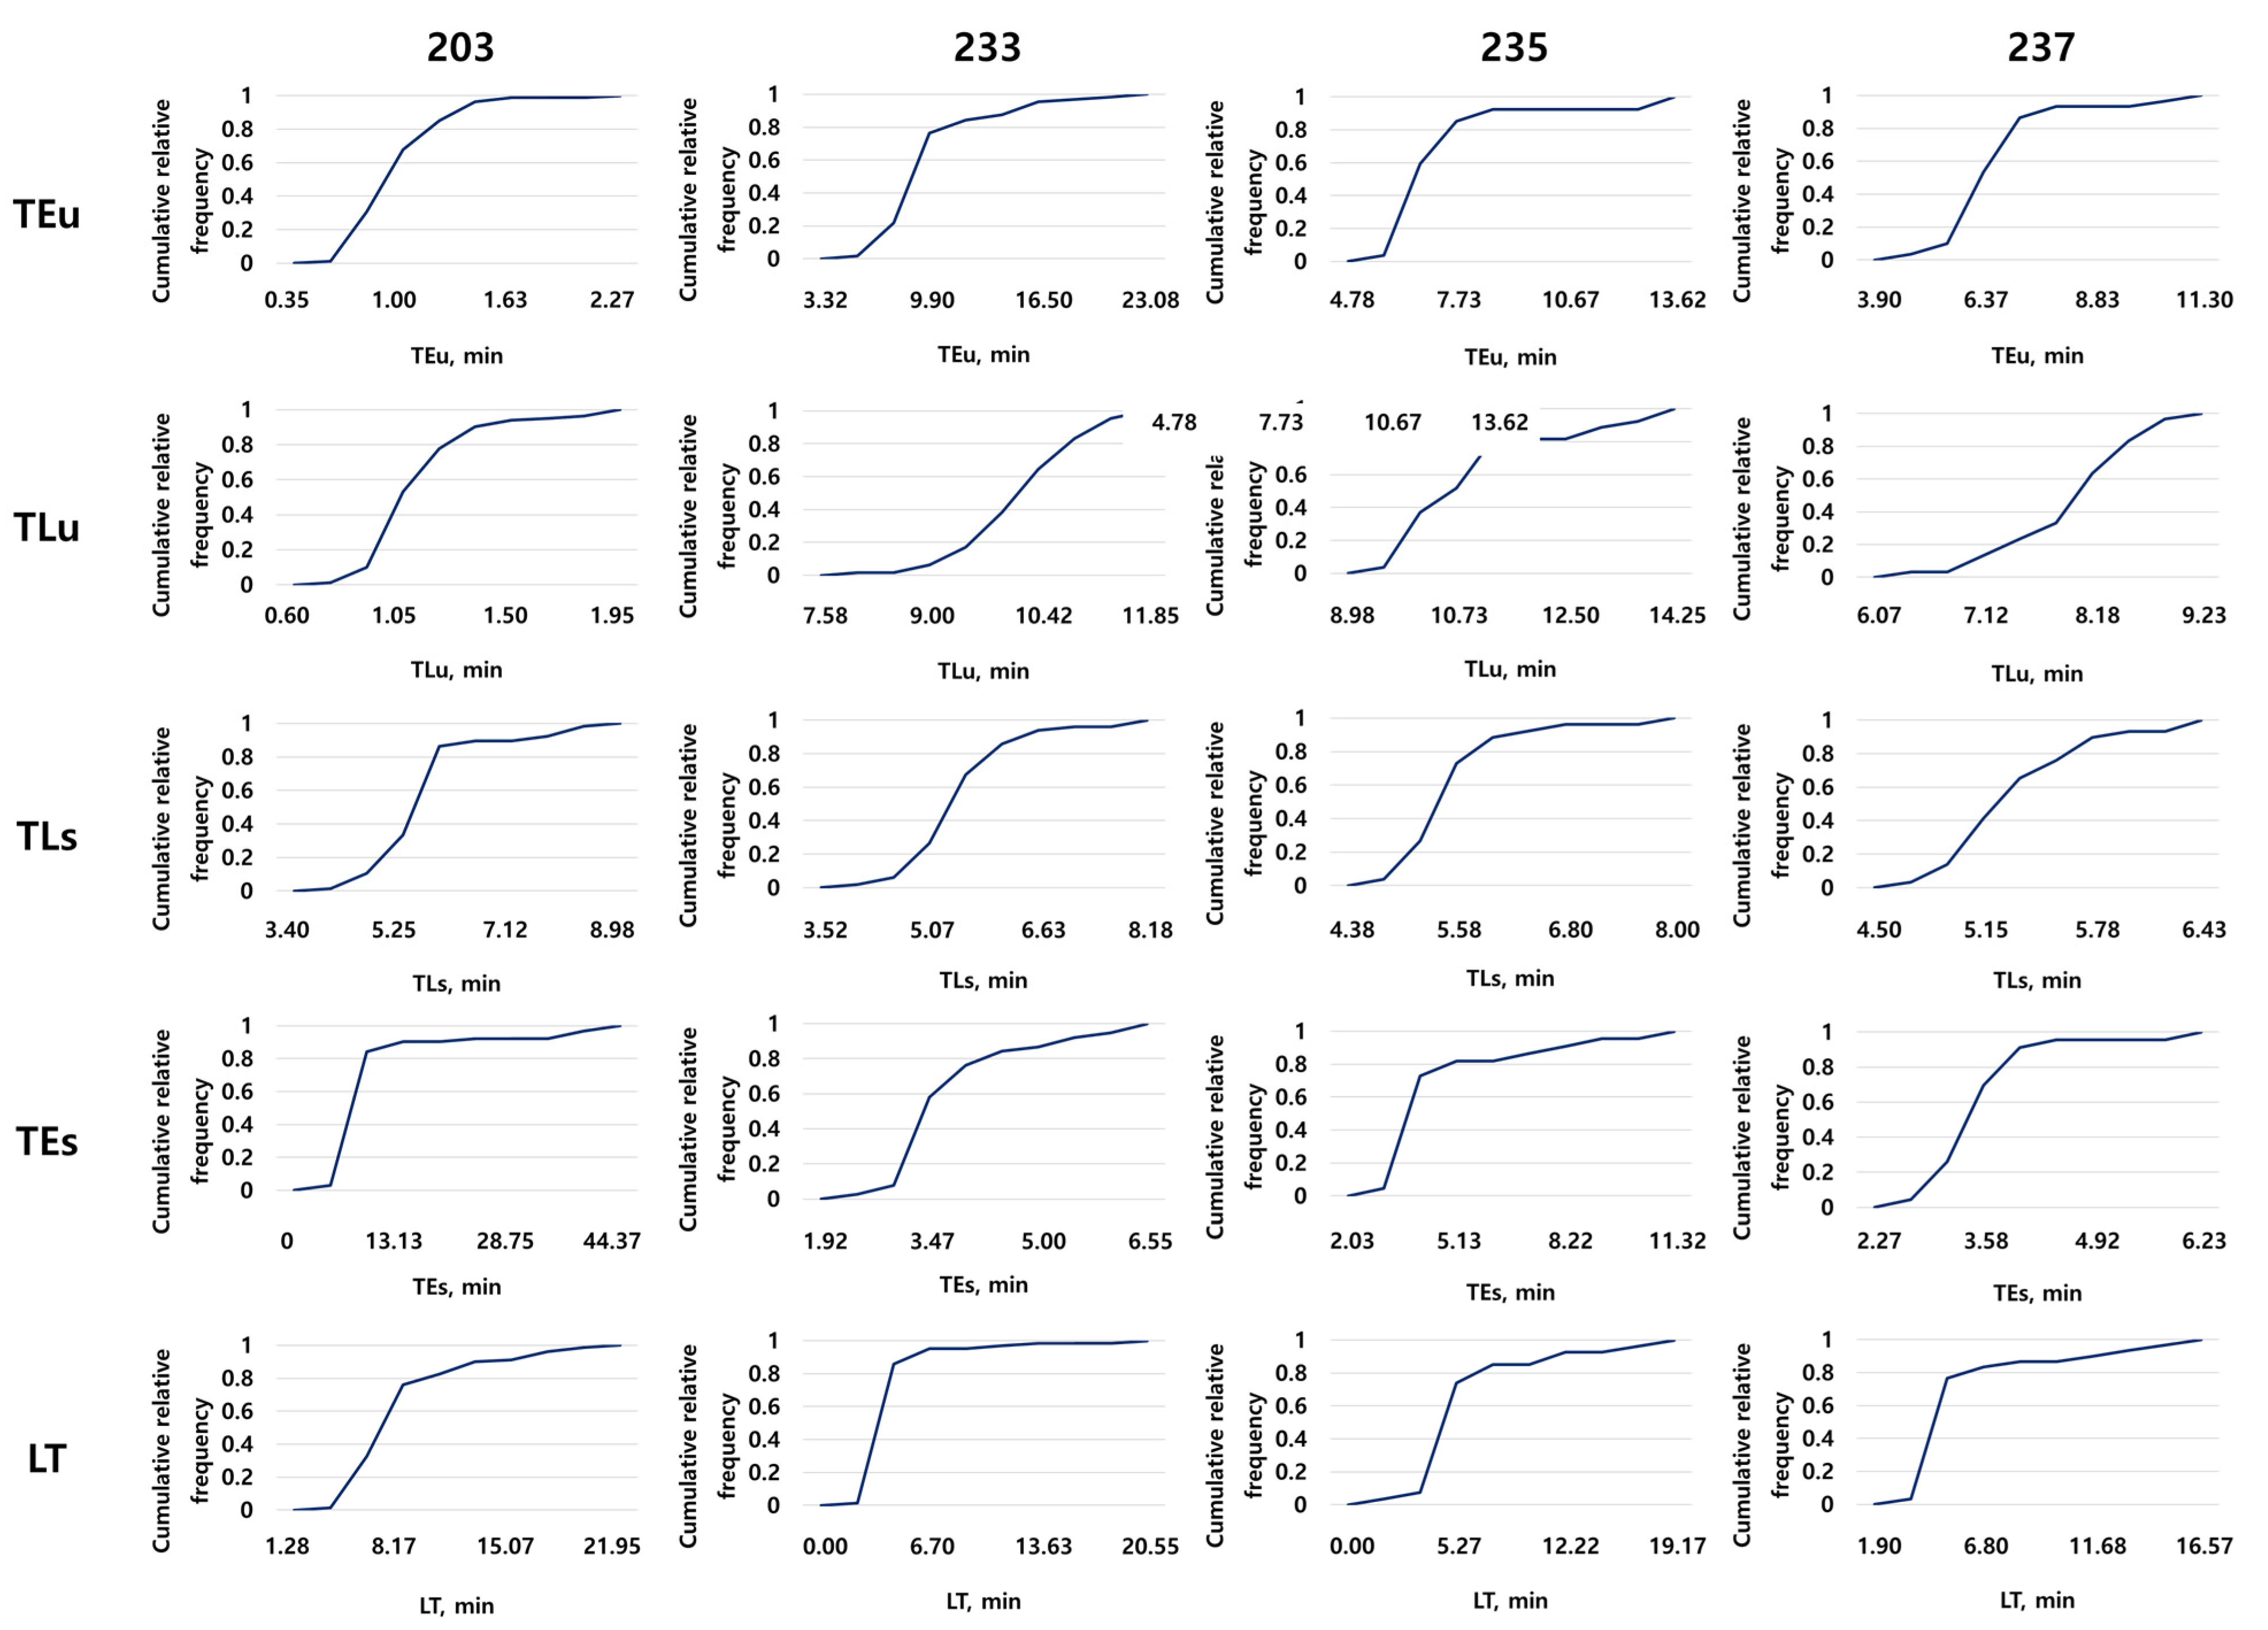
4.1. Statistical Characteristics of Truck Travel Times Measured from Big Data
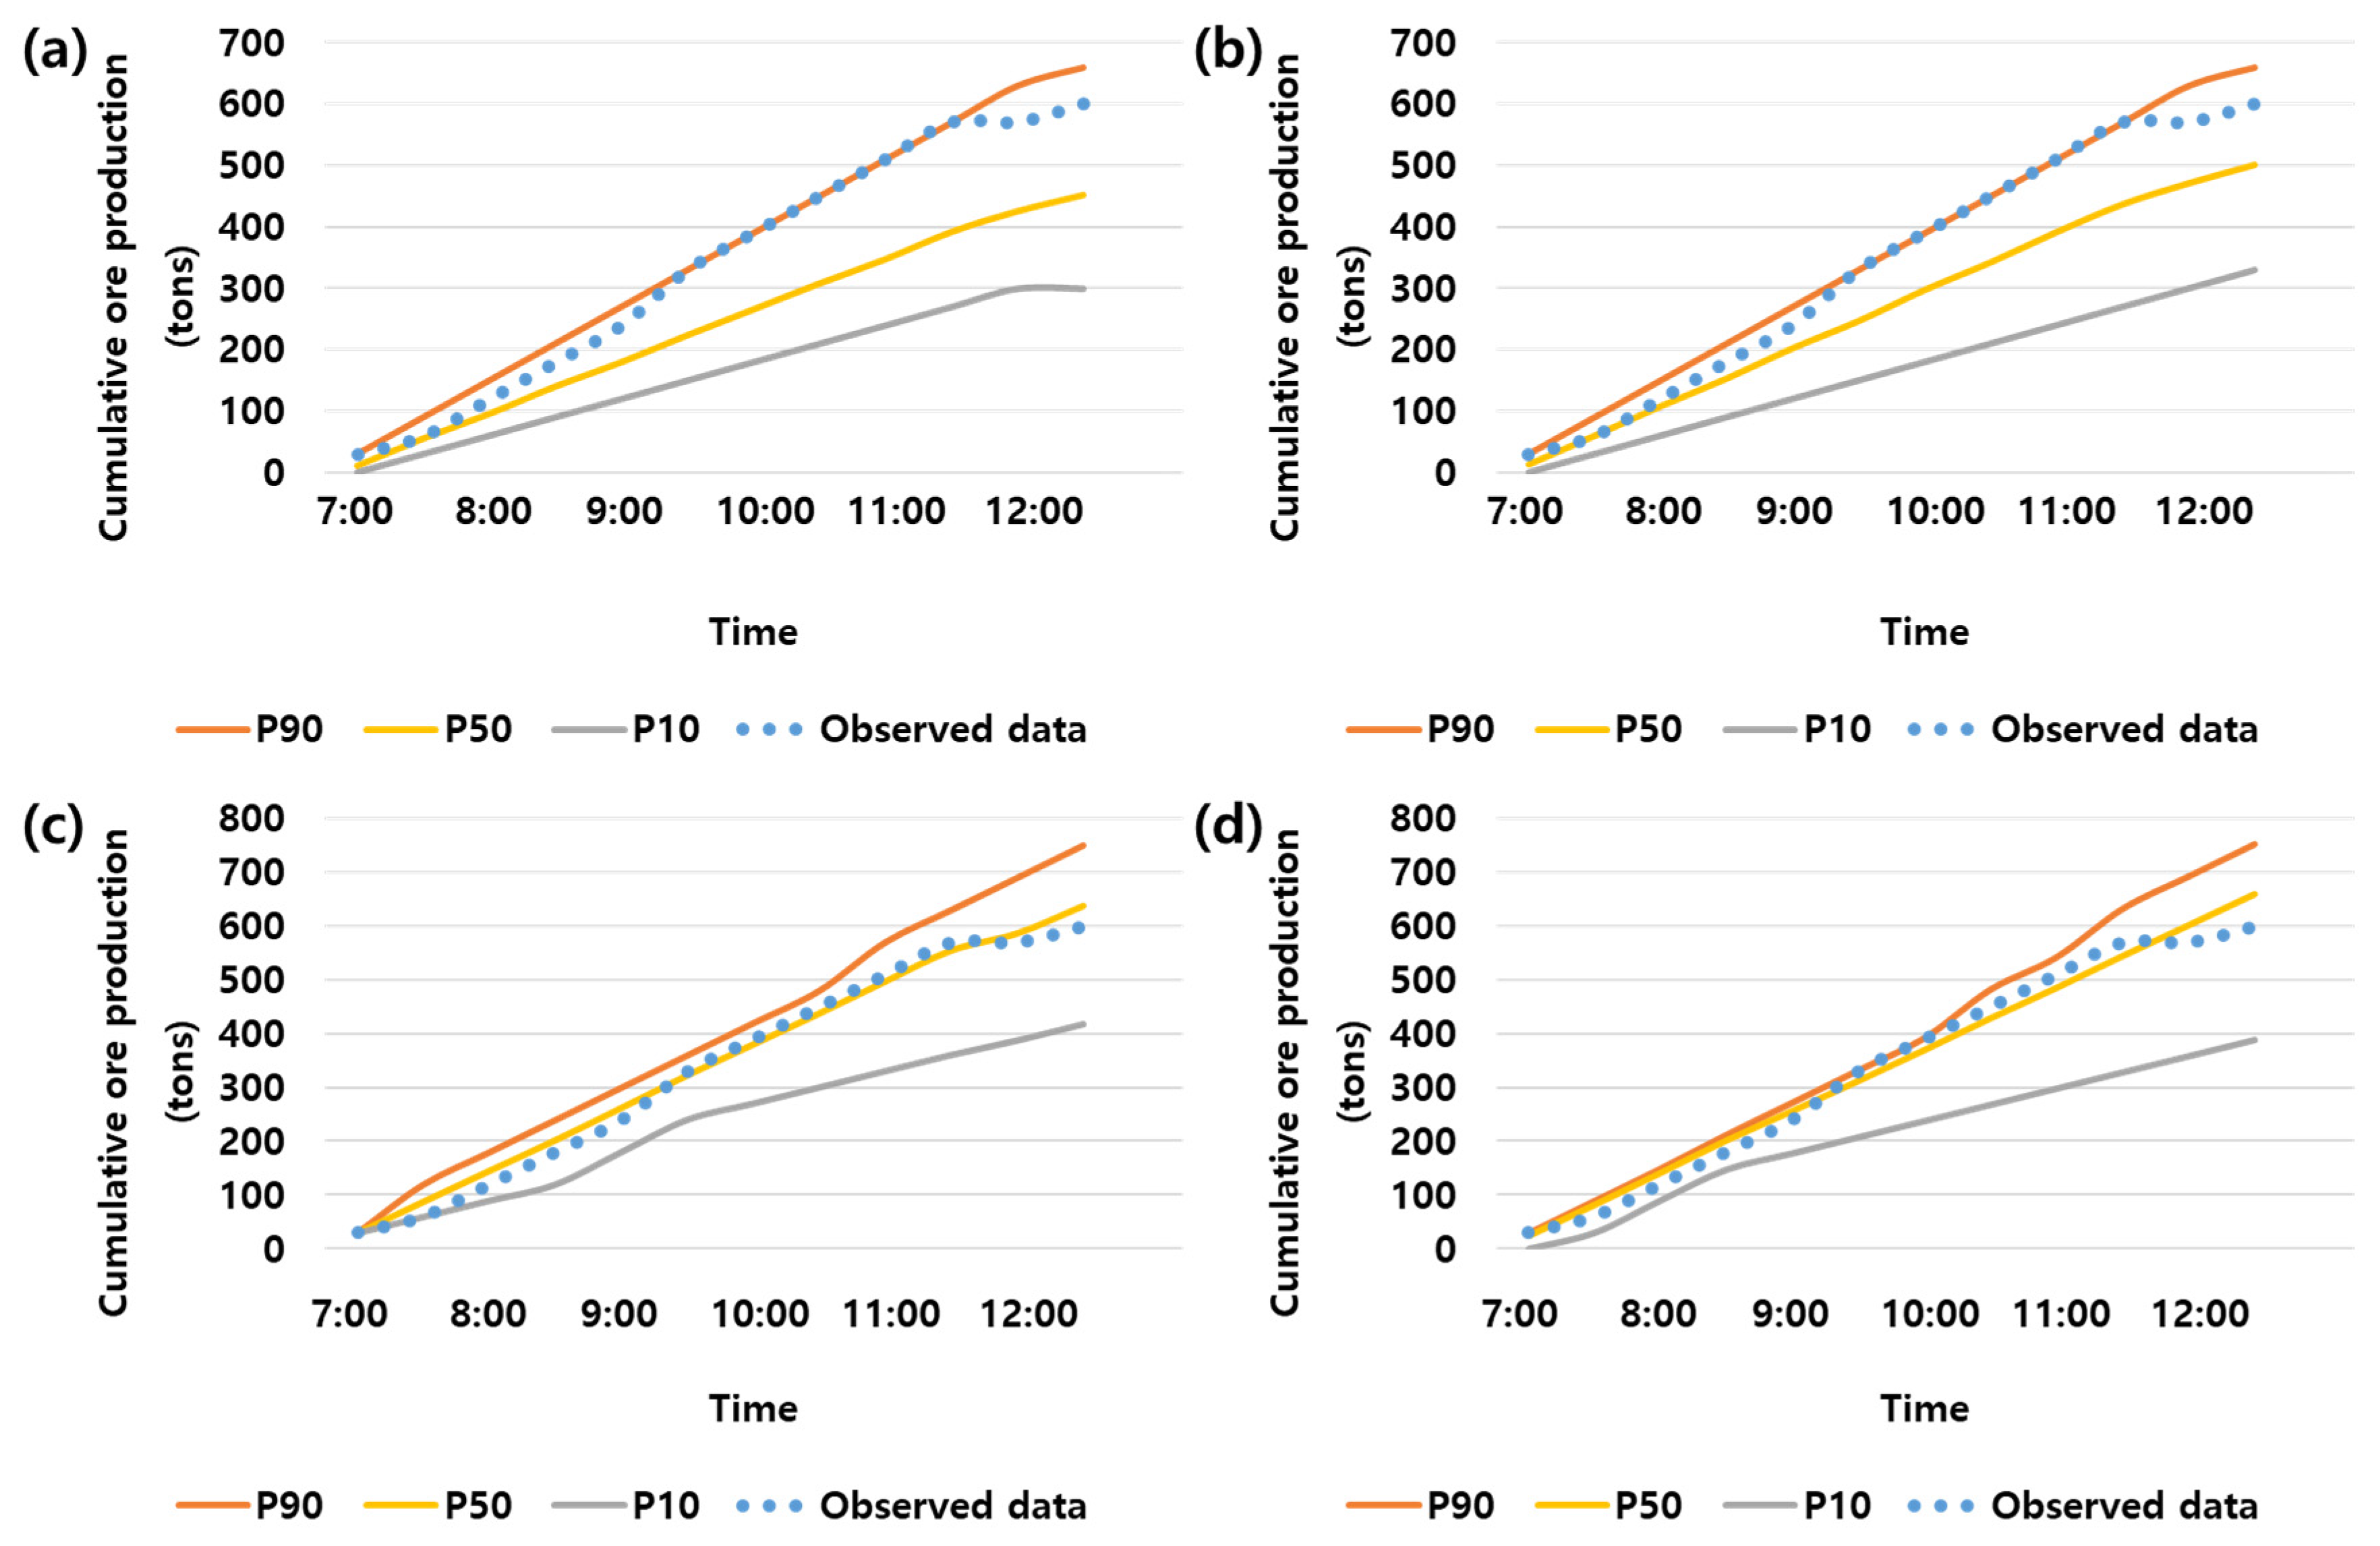
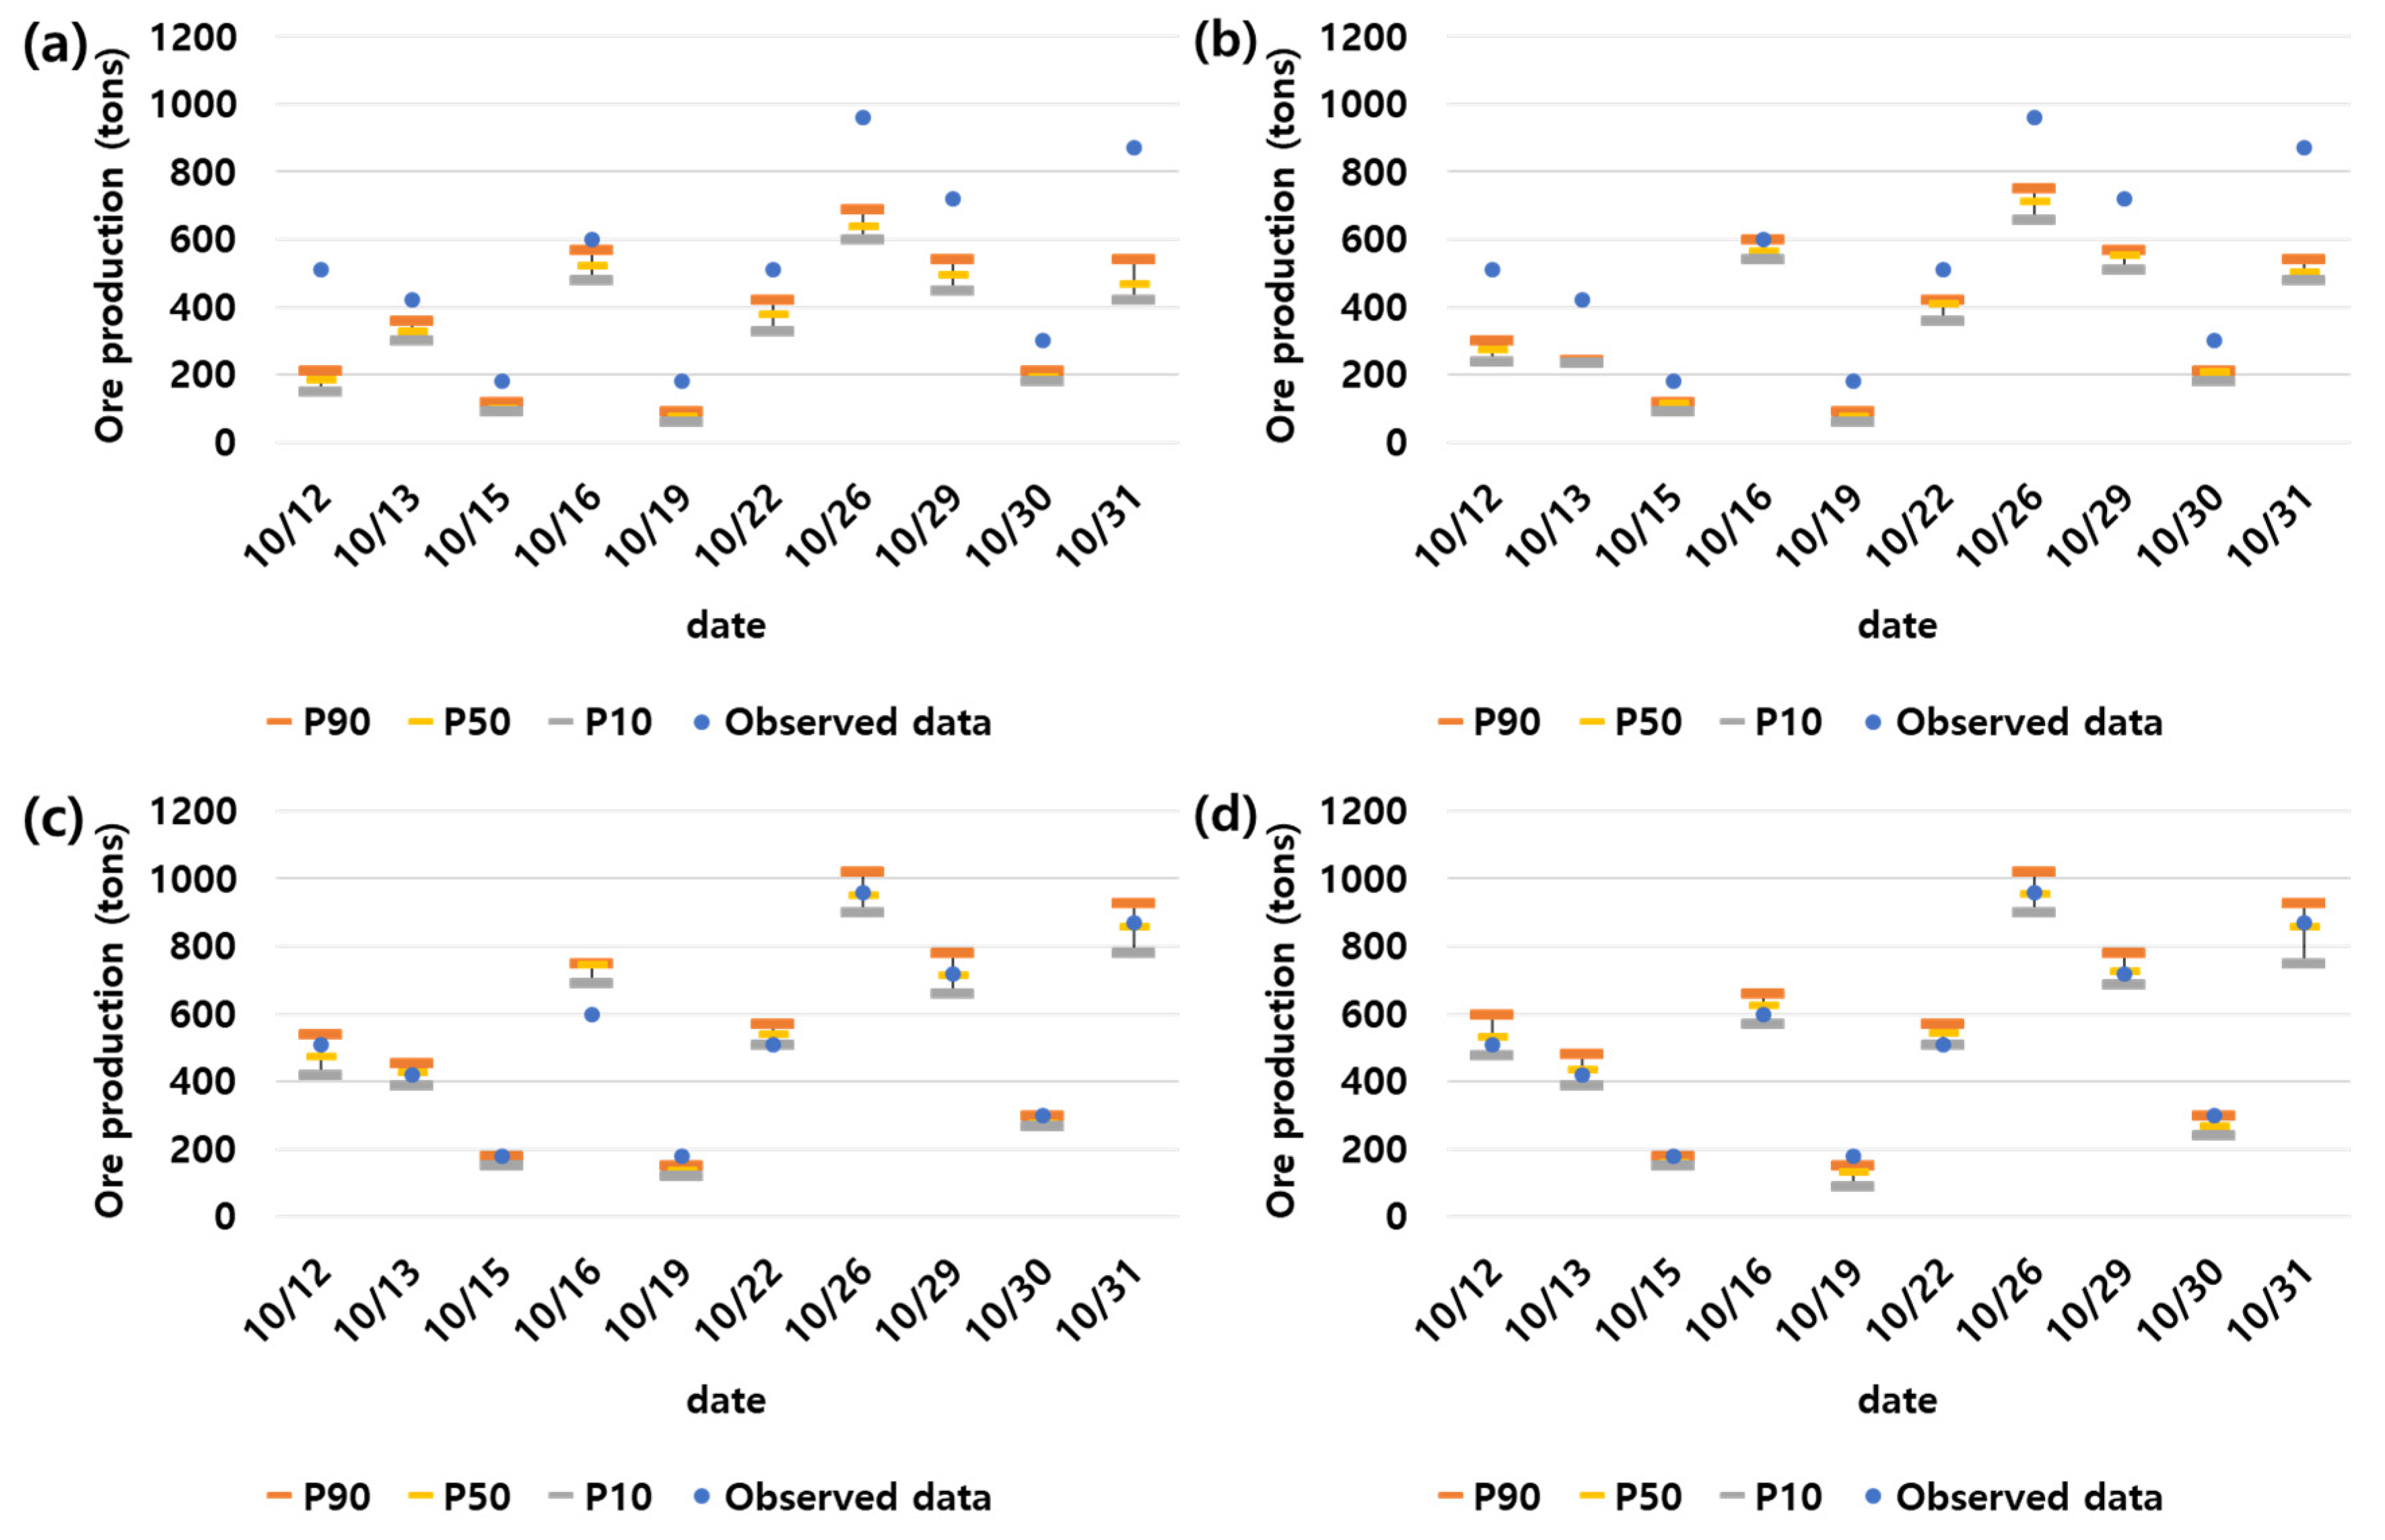
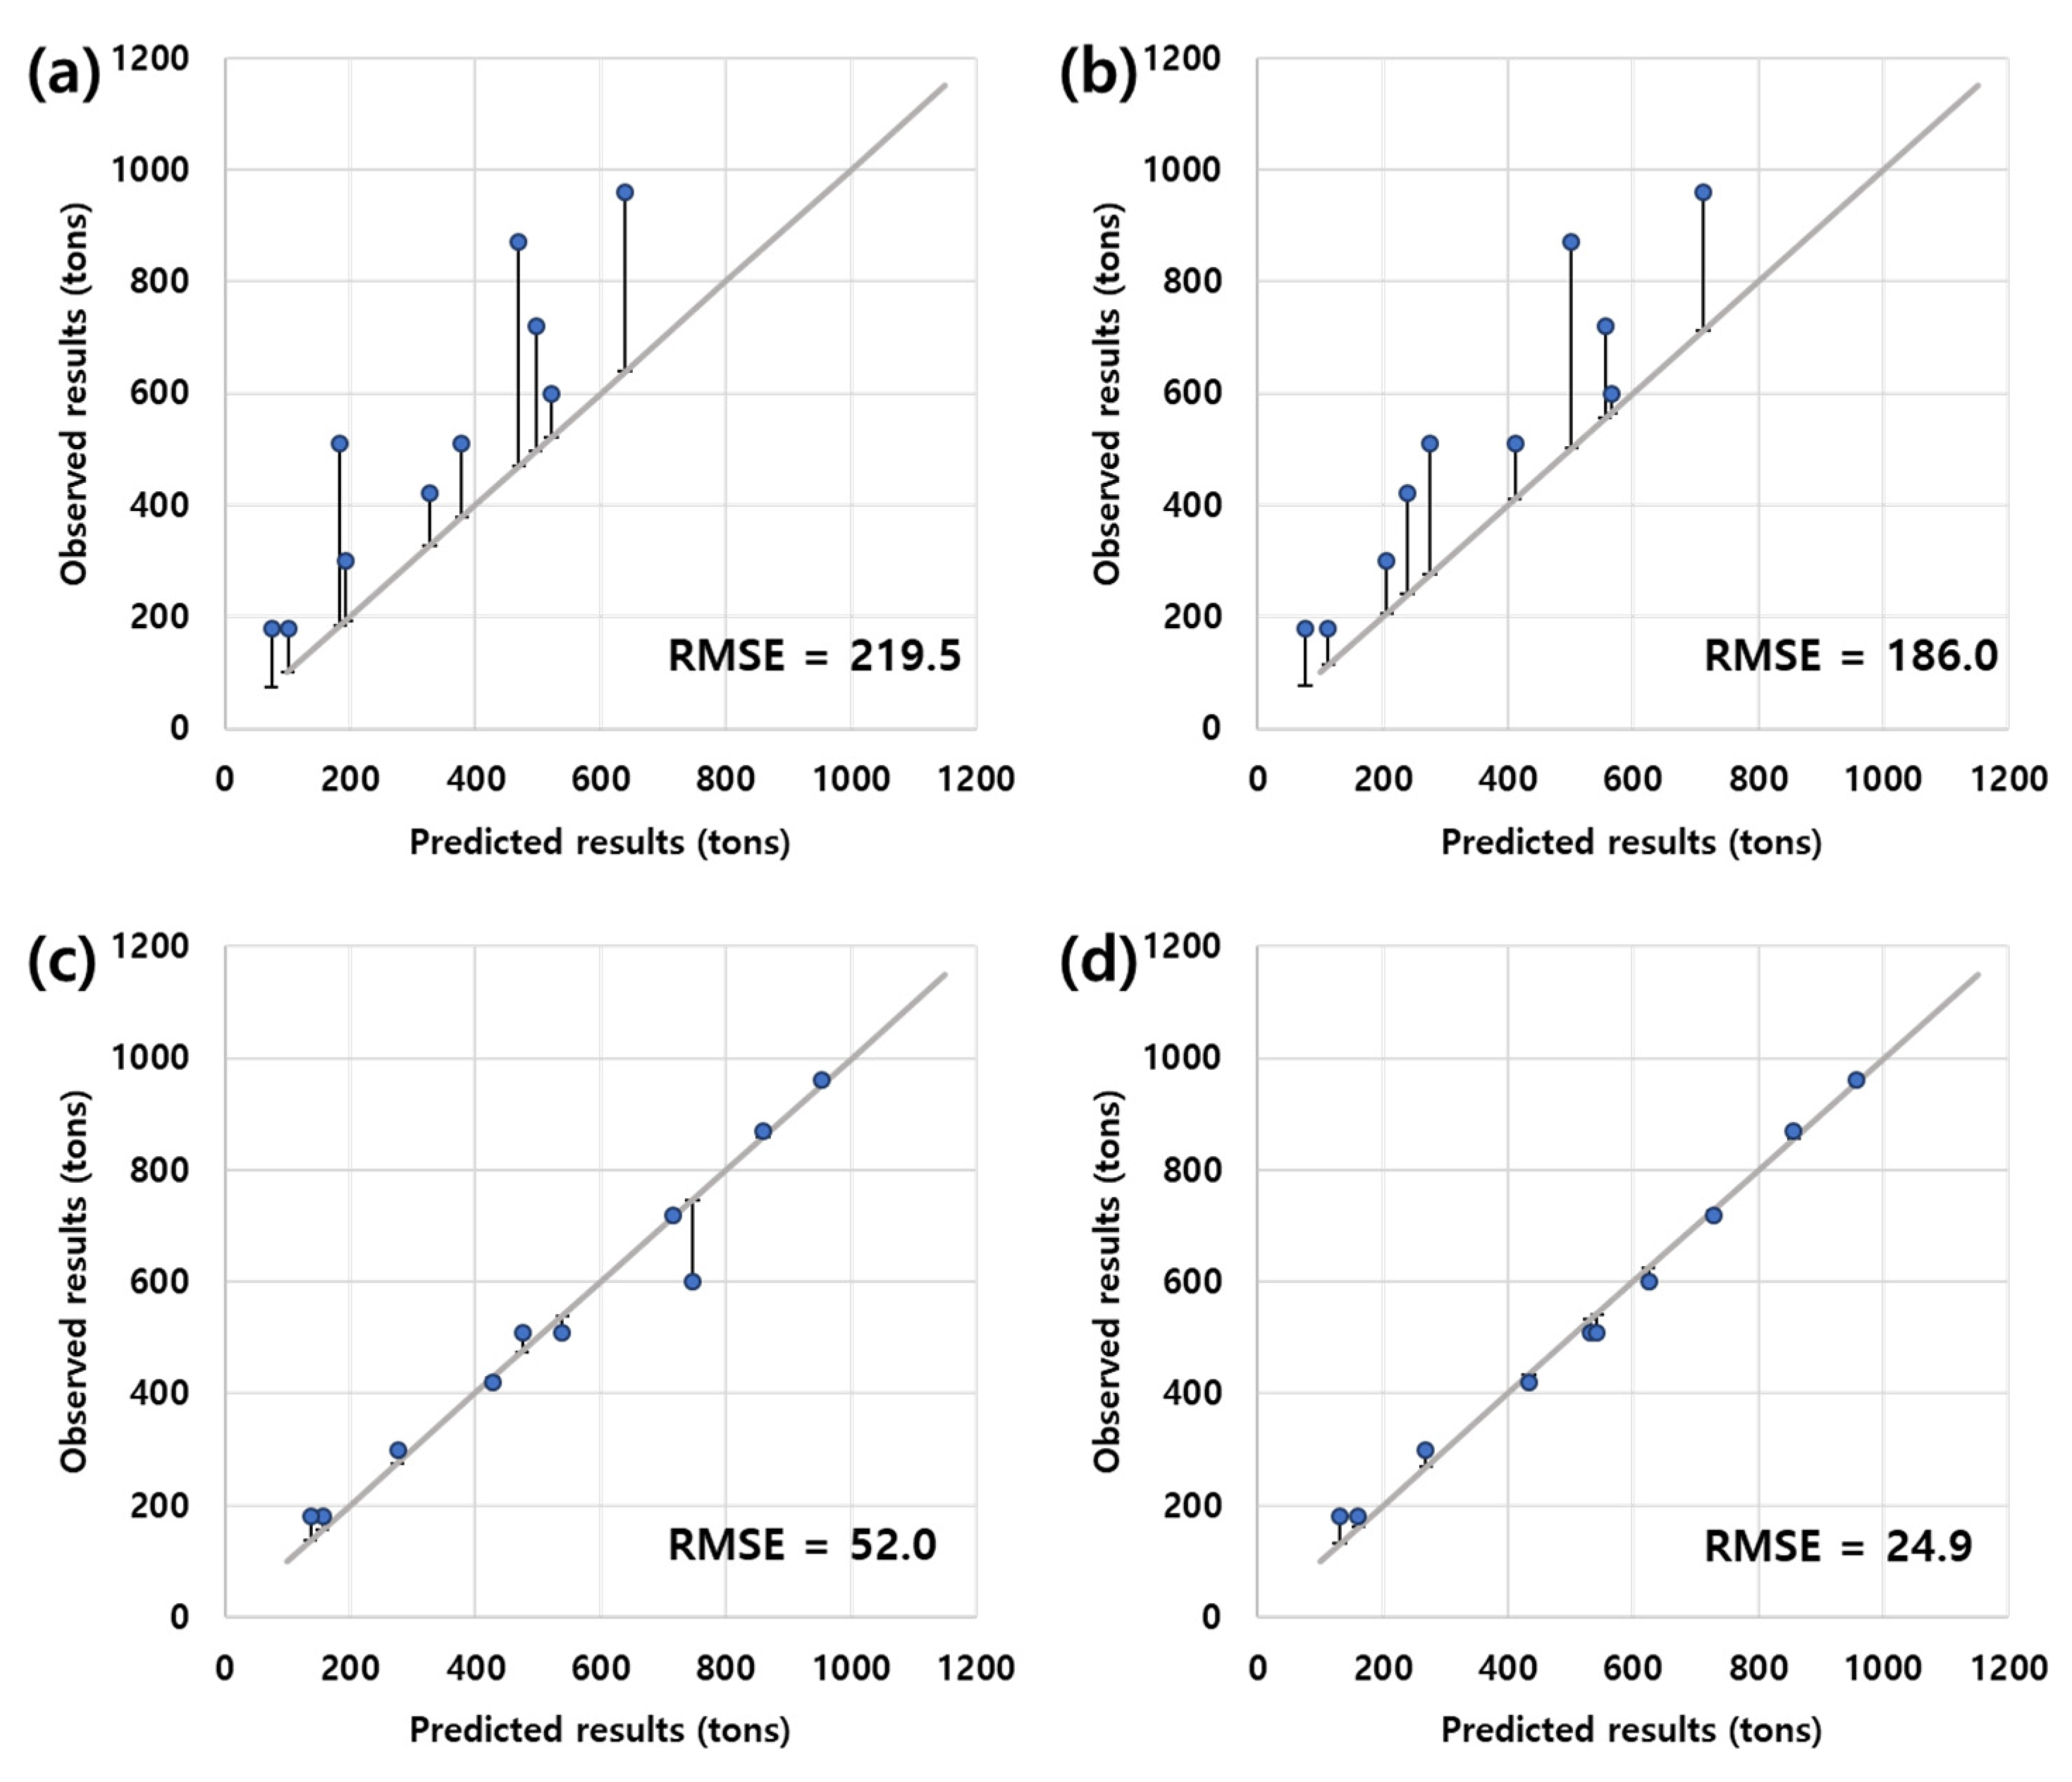
4.2. Predictions of Ore Productions by Stochastic Discrete Event Simulation
5. Discussion
6. Conclusions
Author Contributions
Funding
Institutional Review Board Statement
Informed Consent Statement
Data Availability Statement
Acknowledgments
Conflicts of Interest
References
- Torkamani, E.; Askari-Nasab, H. Verifying Short-Term Production Schedules using Truck-Shovel Simulation. In Mining Optimization Laboratory (MOL); University of Alberta: Edmonton, AB, Canada, 2012; pp. 190–205. [Google Scholar]
- Alarie, S.; Gamache, M. Overview of Solution Strategies Used in Truck Dispatching Systems for Open Pit Mines. Int. J. Surf. Mining, Reclam. Environ. 2002, 16, 59–76. [Google Scholar] [CrossRef]
- Burt, C.N.; Caccetta, L. Equipment Selection for Surface Mining: A Review. Interfaces 2014, 44, 143–162. [Google Scholar] [CrossRef] [Green Version]
- Afrapoli, A.M.; Askari-Nasab, H. Mining fleet management systems: A review of models and algorithms. Int. J. Min. Reclam. Environ. 2019, 33, 42–60. [Google Scholar] [CrossRef]
- Bonates, E.J.L. The Development of Assignment Procedures for Semi-Automated Truck/Shovel Systems. Ph.D. Thesis, McGill University, Montreal, QC, Canada, 1992. [Google Scholar]
- Gurgur, C.Z.; Dagdelen, K.; Artittong, S. Optimization of a real-time multi-period truck dispatching system in mining operations. Int. J. Appl. Decis. Sci. 2011, 4, 57–79. [Google Scholar] [CrossRef]
- Mena, R.; Zio, E.; Kristjanpoller, F.; Arata, A. Availability-based simulation and optimization modeling framework for open-pit mine truck allocation under dynamic constraints. Int. J. Min. Sci. Technol. 2013, 23, 113–119. [Google Scholar] [CrossRef]
- Patterson, S.R.; Kozan, E.; Hyland, P. An Integrated Model of an Open-pit Coal Mine: Improving Energy Efficiency Decisions. Int. J. Prod. Res. 2016, 54, 4213–4227. [Google Scholar] [CrossRef]
- Naoum, S.; Haidar, A. A Hybrid Knowledge Base System and Genetic Algorithms for Equipment Selection. Eng. Constr. Archit. Manag. 2000, 7, 3–14. [Google Scholar] [CrossRef]
- Koenigsberg, E. Cyclic queues. J. Oper. Res. Soc. 1958, 9, 22–35. [Google Scholar] [CrossRef]
- Carmichael, D.G. Engineering Queues in Construction and Mining; John Wiley & Sons: Hoboken, NJ, USA, 1987; ISBN 978-0132781442. [Google Scholar]
- Kappas, G.; Yegulalp, T.M. An application of closed queueing networks theory in truck-shovel systems. Int. J. Surf. Min. Reclam. Environ. 1991, 5, 45–51. [Google Scholar] [CrossRef]
- Xi, Y.; Yegulalp, T.M. Optimum Dispatching Algorithms for Anshan open Pit Mine. In Proceedings of the 24th International Symposium on Application of Computers and Operations Research in the Mineral Industry (APCOM 1993), Montreal, QC, Canada, 31 October–3 November 1993; Canadian Institute of Mining, Metallurgy and Petroleum: Westmount, QC, Canada, 1993; pp. 426–433. [Google Scholar]
- Raman, D.; Nagalingam, S.V.; Gurd, B.W.; Lin, G.C.I. Quantity of Material Handling Equipment-A Queuing Theory Based Approach. Robot. Comput. Integr. Manuf. 2009, 25, 348–357. [Google Scholar] [CrossRef]
- May, M.A. Applications of Queuing Theory for Open-Pit Truck/Shovel Haulage Systems. Master’s thesis, Virginia Polytechnic Institute and State University, Blacksburg, VA, USA, 19 December 2012. [Google Scholar]
- Bitarafan, M.K.; Ataei, M. Mining Method Selection by Multiple Criteria Decision Making Tools. J. S. Afr. Inst. Min. Metall. 2004, 104, 493–498. [Google Scholar]
- Baek, J.; Choi, Y. Deep Neural Network for Ore Production and Crusher Utilization Prediction of Truck Haulage System in Underground Mine. Appl. Sci. 2019, 9, 4180. [Google Scholar] [CrossRef] [Green Version]
- Baek, J.; Choi, Y. Deep Neural Network for Predicting Ore Production by Truck-Haulage Systems in Open-Pit Mines. Appl. Sci. 2020, 10, 1657. [Google Scholar] [CrossRef] [Green Version]
- Ozdemir, B.; Kumral, M. Simulation-based Optimization of Truck-Shovel Material Handling Systems in Multi-Pit Surface Mines. Simul. Model. Pract. Theory 2019, 95, 36–48. [Google Scholar] [CrossRef]
- Dekking, F.M.; Kraaikamp, C.; Lopuhaä, H.P.; Meester, L.E. A Modern Introduction to Probability and Statistics: Understanding Why and How; Springer: London, UK, 2005; pp. 1–488. [Google Scholar]
- Lizotte, Y.; Bonates, E. Truck and Shovel Dispatching Rules Assessment Using Simulation. Min. Sci. Technol. 1987, 5, 45–58. [Google Scholar] [CrossRef]
- Ta, C.H.; Kresta, J.V.; Forbes, J.F. A Stochastic Optimization Approach to Mine Truck Allocation. Int. J. Surf. Min. Reclam. Environ. 2006, 19, 162–175. [Google Scholar] [CrossRef]
- Bastos, G.S. Decision Making applied to Shift Change in Stochastic Open-pit Mining Truck Dispatching. In Proceedings of the 16th IFAC Symposium on Control, Optimization and Automation in Mining, Mineral and Metal Processing, San Diego, CA, USA, 25–28 August 2013; Florian, K., Ed.; Elsevier: Amsterdam, The Netherlands; pp. 34–39. [Google Scholar]
- Dindarloo, S.R.; Osanloo, M.; Frimpong, S. A Stochastic Simulation Framework for Truck and Shovel Selection and Sizing in Open Pit Mines. J. S. Afr. Inst. Min. Metall. 2015, 115, 209–219. [Google Scholar] [CrossRef]
- Torkamani, E.; Askari-Nasab, H. A Linkage of Truck-and-shovel Operations to Short-term Mine Plans Using Discrete-event Simulation. Int. J. Min. Miner. Eng. 2015, 6, 97–118. [Google Scholar] [CrossRef]
- Matamoros, M.E.V.; Dimitrakopoulos, R. Stochastic Short-term Mine Production Schedule Accounting for Fleet Allocation, Operational Considerations and Blending Restrictions. Eur. J. Oper. Res. 2016, 255, 911–921. [Google Scholar] [CrossRef] [Green Version]
- Park, S.; Choi, Y.; Park, H.S. Optimization of Truck-loader Haulage Systems in an Underground Mine Using Simulation Methods. Geosyst. Eng. 2016, 19, 222–231. [Google Scholar] [CrossRef]
- Chaowasakoo, P.; Seppälä, H.; Koivo, H.; Zhou, Q. Digitalization of Mine Operations: Scenarios to Benefit in Real-time Truck Dispatching. Int. J. Min. Sci. Technol. 2017, 27, 229–236. [Google Scholar] [CrossRef]
- Ristovski, K.; Gupta, C.; Harada, K.; Tang, H.K. Dispatch with Confidence: Integration of Machine Learning, Optimization and Simulation for Open Pit Mines. In Proceedings of the 23rd ACM SIGKDD International Conference on Knowledge Discovery and Data Mining, Halifax, NS, Canada, 13–17 August 2017; Association for Computing Machinery: New York, NY, USA; pp. 1981–1989. [Google Scholar]
- Afrapoli, A.M.; Tabesh, M.; Askari-Nasab, H. A Multiple Objective Transportation Problem Approach to Dynamic Truck Dispatching in Surface Mines. Eur. J. Oper. Res. 2019, 276, 331–342. [Google Scholar] [CrossRef]
- Baek, J.; Choi, Y. Simulation of Truck Haulage Operations in an Underground Mine Using Big Data from an ICT-Based Mine Safety Management System. Appl. Sci. 2019, 9, 2639. [Google Scholar] [CrossRef] [Green Version]
- Lisboa, A.C.; De Souza, F.H.B.; Ribeiro, C.M.; Maia, C.A.; Saldanha, R.R.; Castro, F.L.B.; Vieira, D.A.G. On Modelling and Simulating Open Pit Mine through Stochastic Timed Petri Nets. IEEE Access 2019, 7, 112821–112835. [Google Scholar] [CrossRef]
- Moniri-Morad, A.; Pourgol-Mohammad, M.; Aghababaei, H.; Sattarvand, J. A Methodology for Truck Allocation Problems Considering Dynamic Circumstances in Open Pit Mines, Case study of the Sungun Copper Mine. Min. Geol. Pet. Bull. 2019, 34, 57–65. [Google Scholar] [CrossRef]
- Jung, D.; Baek, J.; Choi, Y. Simulation and Real-time Visualization of Truck-Loader Haulage Systems in an Open Pit Mine using AnyLogic. J. Korean Soc. Miner. Energy Resour. Eng. 2020, 57, 45–57. [Google Scholar] [CrossRef]
- Pearson, K. On the Criterion that a Given System of Deviations from the Probable in the Case of a Correlated System of Variables. Philos. Mag. 1900, 5, 157–175. [Google Scholar] [CrossRef] [Green Version]
- Akaike, H. Information Theory and an Extension of the Maximum Likelihood Principle. In Proceedings of the 2nd International Symposium on Information Theory, Tsahkadsor, Armenia, 2–8 September 1971; Petrov, B.N., Csáki, F., Eds.; Akadémiai Kiadó: Budapest, Hungary, 1973; pp. 267–281. [Google Scholar]
- Kolmogorov, A. Sulla determinazione empirica di una lgge di distribuzione. Inst. Ital. Attuari Giorn. 1933, 4, 83–91. [Google Scholar]
- Yarkan, S.; Sabih, G.; Murphy, R.R. Underground Mine Communications: A Survey. IEEE Commun. Surv. Tutorials 2009, 11, 125–142. [Google Scholar] [CrossRef]
- Sunderman, C.; Waynert, J. An Overview of Underground Coal Miner Electronic Tracking System Technologies. In Proceedings of the 2012 IEEE Industry Applications Society Annual Meeting, Las Vegas, NV, USA, 7–11 October 2012; IEEE: New York, NY, USA, 2012; pp. 1–5. [Google Scholar]
- Forooshani, A.E.; Bashir, S.; Michelson, D.G.; Noghanian, S. A Survey of Wireless Communications and Propagation Modeling in Underground Mines. IEEE Commun. Surv. Tutor. 2013, 15, 1524–1545. [Google Scholar] [CrossRef]
- Dohare, Y.S.; Maity, T.; Das, P.S.; Paul, P.S. Wireless Communication and Environment Monitoring in Underground Coal Mines–Review. IETE Tech. Rev. 2015, 32, 140–150. [Google Scholar] [CrossRef]
- Thrybom, L.; Neander, J.; Hansen, E.; Landernäs, K. Future Challenges of Positioning in Underground Mines Future Challenges of Positioning in Underground Mines. IFAC PapersOnLine 2015, 48, 222–226. [Google Scholar] [CrossRef]
- Reddy, N.S.; Saketh, M.S.; Dhar, S. Review of Sensor Technology for Mine Safety Monitoring Systems: A Holistic Approach. In Proceedings of the 2016 IEEE First International Conference on Control, Measurement and Instrumentation (CMI), Kolkata, India, 8–10 January 2016; IEEE: New York, NY, USA, 2016; pp. 429–434. [Google Scholar]
- Muduli, L.; Mishra, D.P.; Jana, P.K. Application of Wireless Sensor Network for Environmental Monitoring in Underground Coal Mines: A systematic review. J. Netw. Comput. Appl. 2018, 106, 48–67. [Google Scholar] [CrossRef]
- Wu, Y.; Chen, M.; Wang, K.; Fu, G. A Dynamic Information Platform for Underground Coal Mine Safety based on Internet of Things. Saf. Sci. 2019, 113, 9–18. [Google Scholar] [CrossRef]
- Suboleski, S.C. Mine Systems Engineering Lecture Notes; The Pennsylvania State University: State College, PA, USA, 1975. [Google Scholar]
- Thomas, A. Cruse. Reliability-Based Mechanical Design; Marcel Dekker, Inc.: New York, NY, USA, 1997; p. 123. [Google Scholar]


| Reference | Theoretical Model Representing Probability Distribution | |||||||
|---|---|---|---|---|---|---|---|---|
| Gaussian | Triangular | Weibull | Gamma | Lognormal | Exponential | Erlang | Uniform | |
| [1] | Χ | Χ | ||||||
| [19] | Χ | Χ | Χ | |||||
| [21] | Χ | Χ | ||||||
| [22] | Χ | |||||||
| [23] | Χ | |||||||
| [24] | Χ | Χ | Χ | |||||
| [25] | Χ | Χ | Χ | Χ | ||||
| [26] | Χ | |||||||
| [27] | Χ | |||||||
| [28] | Χ | |||||||
| [29] | Χ | |||||||
| [30] | Χ | Χ | Χ | Χ | ||||
| [31] | Χ | |||||||
| [32] | Χ | Χ | Χ | Χ | ||||
| [33] | ||||||||
| [34] | Χ | |||||||
| Type | Data | Unit | ||
|---|---|---|---|---|
| Input | Time parameters | Travel time of the empty truck | TEu | Minutes |
| TEs | Minutes | |||
| Travel time of the loaded truck | TLu | Minutes | ||
| TEu | Minutes | |||
| Working time | LT | Minutes | ||
| Simulation parameters | Daily working time | Minutes | ||
| Number of trucks | Numbers | |||
| Capacity of a truck | Tons | |||
| Number of simulations | Numbers | |||
| Output | Total amount of the loaded ore | Tons | ||
| Simulation Parameters | Value |
|---|---|
| Daily working time (min) | 350 |
| Number of trucks | 2 |
| Capacity of a truck (ton) | 30 |
| Number of simulations | 50 |
| Loading Point | Statistics | Truck Travel Time | ||||
|---|---|---|---|---|---|---|
| TEu | TLu | TLs | TEs | LT | ||
| 203 | Mean (min) | 0.93 | 1.10 | 5.55 | 7.58 | 7.58 |
| Min (min) | 0.57 | 0.75 | 4.02 | 2.72 | 3.58 | |
| Max (min) | 2.27 | 1.95 | 8.98 | 44.37 | 21.95 | |
| STD (min) | 0.27 | 0.23 | 0.92 | 9.82 | 3.73 | |
| Kurtosis | 7.14 | 4.33 | 3.70 | 7.09 | 3.19 | |
| 233 | Mean (min) | 9.47 | 10.17 | 5.48 | 3.75 | 4.25 |
| Min (min) | 5.52 | 8.05 | 4.03 | 2.43 | 2.08 | |
| Max (min) | 23.08 | 11.85 | 8.18 | 6.55 | 20.55 | |
| STD (min) | 3.32 | 0.73 | 0.77 | 0.92 | 2.57 | |
| Kurtosis | 4.46 | 0.23 | 4.01 | 2.18 | 26.67 | |
| 235 | Mean (min) | 7.20 | 10.97 | 5.52 | 4.63 | 5.75 |
| Min (min) | 5.77 | 9.57 | 4.78 | 3.07 | 0.63 | |
| Max (min) | 13.62 | 14.25 | 8.00 | 11.32 | 19.17 | |
| STD (min) | 1.85 | 1.32 | 0.63 | 2.07 | 3.95 | |
| Kurtosis | 28.00 | 28.00 | 27.00 | 23.00 | 28.00 | |
| 237 | Mean (min) | 6.52 | 7.98 | 5.30 | 3.50 | 5.52 |
| Min (min) | 4.72 | 6.42 | 4.72 | 2.70 | 3.53 | |
| Max (min) | 11.30 | 9.23 | 6.43 | 6.23 | 16.57 | |
| STD (min) | 1.27 | 0.62 | 0.42 | 0.68 | 3.38 | |
| Kurtosis | 7.90 | 0.23 | 0.90 | 10.47 | 4.18 | |
| Simulation Parameters | Date | |||||||||||
|---|---|---|---|---|---|---|---|---|---|---|---|---|
| 12 October | 13 October | 15 October | 16 October | 19 October | 22 October | 24 October | 26 October | 29 October | 30 October | 31 October | ||
| Loading point 203 | Daily working times (min) | 400 | 100 | 355 | 55 | 385 | ||||||
| Number of trucks | 1 | 1 | 2 | 1 | 2 | |||||||
| Loading point 233 | Daily working times (min) | 330 | 80 | 40 | 445 | 290 | 280 | |||||
| Number of trucks | 2 | 2 | 2 | 1 | 2 | 1 | ||||||
| Loading point 235 | Daily working times (min) | 245 | 370 | |||||||||
| Number of trucks | 2 | 2 | ||||||||||
| Loading point 237 | Daily working times (min) | 270 | 40 | 115 | ||||||||
| Number of trucks | 2 | 1 | 3 | |||||||||
Publisher’s Note: MDPI stays neutral with regard to jurisdictional claims in published maps and institutional affiliations. |
© 2021 by the authors. Licensee MDPI, Basel, Switzerland. This article is an open access article distributed under the terms and conditions of the Creative Commons Attribution (CC BY) license (https://creativecommons.org/licenses/by/4.0/).
Share and Cite
Jung, D.; Baek, J.; Choi, Y. Stochastic Predictions of Ore Production in an Underground Limestone Mine Using Different Probability Density Functions: A Comparative Study Using Big Data from ICT System. Appl. Sci. 2021, 11, 4301. https://0-doi-org.brum.beds.ac.uk/10.3390/app11094301
Jung D, Baek J, Choi Y. Stochastic Predictions of Ore Production in an Underground Limestone Mine Using Different Probability Density Functions: A Comparative Study Using Big Data from ICT System. Applied Sciences. 2021; 11(9):4301. https://0-doi-org.brum.beds.ac.uk/10.3390/app11094301
Chicago/Turabian StyleJung, Dahee, Jieun Baek, and Yosoon Choi. 2021. "Stochastic Predictions of Ore Production in an Underground Limestone Mine Using Different Probability Density Functions: A Comparative Study Using Big Data from ICT System" Applied Sciences 11, no. 9: 4301. https://0-doi-org.brum.beds.ac.uk/10.3390/app11094301