
Improving the Discriminability of Haptic Icons: The Haptic Tuning Fork


1
Departamento de Ingeniería Centro Universitario en Tecnología y Arte Digital, Universidad Camilo Jose Cela, 28290 Madrid, Spain
2
The SPA Studios, 28023 Madrid, Spain
3
Departamento de Ciencias de la Computación, Arquitectura de Computadores, Lenguajes y Sistemas Informáticos y Estadística e Investigación Operativa, Escuela Técnica Superior de Ingeniería Informática, Campus de Móstoles, Universidad Rey Juan Carlos, 28933 Madrid, Spain
4
Center for Computation and Simulation, UPM, 28223 Madrid, Spain
*
Author to whom correspondence should be addressed.
Appl. Sci. 2021, 11(18), 8772; https://0-doi-org.brum.beds.ac.uk/10.3390/app11188772
Submission received: 2 August 2021
/
Revised: 14 September 2021
/
Accepted: 16 September 2021
/
Published: 21 September 2021
(This article belongs to the Special Issue Haptics: Technology and Applications—2021)
Abstract
:Technological advances enable the capture and management of complex data sets that need to be correctly understood. Visualisation techniques can help in complex data analysis and exploration, but sometimes the visual channel is not enough, or it is not always available. Some authors propose using the haptic channel to reinforce or substitute the visual sense, but the limited human haptic short-term memory still poses a challenge. We present the haptic tuning fork, a reference signal displayed before the haptic information for increasing the discriminability of haptic icons. With this reference, the user does not depend only on short-term memory. We have decided to evaluate the usefulness of the haptic tuning fork in impedance kinesthetic devices as these are the most common. Furthermore, since the renderable signal ranges are device-dependent, we introduce a methodology to select a discriminable set of signals called the haptic scale. Both the haptic tuning fork and the haptic scale proved their usefulness in the performed experiments regarding haptic stimuli varying in frequency.
1. Introduction
The scientific community must confront large volumes of increasingly complex data, making difficult their analysis. This need has promoted an increasing development of scientific visualisation techniques based on the use of the visual channel [1,2,3,4]. However, a large number of visual stimuli can saturate the sense of sight [5]. For this reason, rendering multisensory information can be of great help when exploring the data. In this article, we suggest a new technique to facilitate the use of other sensory channels, in particular the haptic sense, to help in the analysis of complex data. Our technique can be used either alone or to reinforce or supplement the visual information.
Using haptic data visualisation (HDV) to show complex data through haptic stimulus allows the users to perceive different data characteristics through the sense of touch [6,7]. Devices can be used to present haptic information, and the user can get qualitative or quantitative knowledge about the presented data in several areas of application. For example, in Raya et al. [8], authors use haptic information for the analysis of dense and complex filiform structures in the neurobiology context or, in Panëels et al. [9], they use it for education.
The haptic modality is not only useful for users who are blind or partially sighted, but it can also be used to increase the number of presented variables or to duplicate some variables to reinforce their presentation [10]. Some authors propose using haptic signals, called haptic icons, to represent non-haptic related abstract concepts [11].
However, using the tactile channel in a non-natural way may present different problems. A major approach to understanding human sensory organs is through psychophysical experiments. Psychophysical parameters also define the time and intensity that perceptual memory will remember [12,13,14]. Average users’ ability to discriminate the different haptic icons highly depends on users’ limited short-term memory [15]. This is one of the major reasons that explain why haptics is not frequently used for rendering quantitative or qualitative abstract data.
We propose a new method named haptic tuning fork to increase the discriminability of haptic icons. The idea is to add a reference signal to the haptic icon to help users discriminate the different haptic icons, similarly as the musical tuning fork works. The use of a reference signal could reduce or even eliminate the need for short-term memory.
The range of renderable signals highly depends on the haptic device. To maximise the users’ ability to discriminate different signals, they must be carefully selected. Haptic device limitations, such as the device degrees of freedom, working space or latency, must be considered. Additionally, perception principles, such as the Weber–Fechner law [16], also play a relevant role.
In this paper, we propose a methodology to select and order a proper set of haptic stimuli. Following the analogy with music, we call a haptic scale to a set of ordered haptic icons. Haptic icons are commonly created varying the signal frequency, amplitude, or shape. Previous studies have determined that frequency is the parameter that is best distinguished, followed by shape. Therefore, we validate the haptic scales creating frequency-based haptic icons sets. Furthermore, we have used the shape to increase the number of discriminable signals.
As mentioned above, this methodology is device-dependent, and it has to be applied to define haptic icons for any new haptic hardware used in the system. We applied our methodology to an impedance kinesthetic device (Novint Falcon [17]), and we validated it, together with the haptic tuning fork, in our experiments that study, using a haptic device, to what extent subjects can discriminate between different rendered haptic icons. The concept of the haptic tuning fork is a general concept that could be applied either to tactile, kinesthetic, impedance or admittance devices, and it can be used in combination with any proxy-based haptic rendering algorithm [18]. However, we formally validate it for impedance kinesthetic devices, combined with the proxy-based algorithm. Further work needs to be done to extend it to other types of haptic devices.
Hence, the main contributions are:
- The introduction of reference-based haptic stimulus that immediately precedes the data stimulus, named the haptic tuning fork.
- A generalised method for calibrating and developing discriminable frequency-based haptic stimuli forming an ordered haptic scale.
- Empirical evidence of the success of the calibration and method and results concerning the utility of using the haptic tuning fork to enhance the identification of frequency-based stimuli.
The rest of the paper is organised as follows: Section 2 reviews the current state of the art. In Section 3, the concepts of haptic scale and haptic tuning fork are explained in detail. The following section, Section 4, describes a methodology to create appropriate haptic scales for a particular haptic device. In our case of study, this methodology is applied to create frequency-based haptic scales for a Novint Falcon device [18]. Section 5 includes the validation of the haptic tuning fork concept together with the haptic scales designed for the Novint Falcon. Finally, in Section 6, we present the conclusions and future work.
2. Previous Work
Scientific and industrial fields involve massive data sets. Disciplines such as Big Data focus on automatic processing and extraction of these data sets. However, when the aim is not clearly defined or necessitates knowledge that cannot be entirely formalised, automatic extraction techniques are limited, and it is necessary to involve humans in the process of data exploration and analysis [19]. Visual perception has limitations such as the context effect [20] or crowding, and the inability to recognise objects in clutter [21]. Additionally, when there is a large amount of data, visualising every data point can lead to over-plotting and may visually overwhelm visual users’ perceptual and cognitive capacities [5].
There has been mounting interest in non-visual forms of presenting information [10]. Information can be conveyed using the sense of touch which can help visually impaired people or be useful when other modalities are not available [22,23]. Alternative representations are not only useful to blind or partially sighted users, but they are also useful in situations where the visual domain is impractical or overloaded [1,24,25,26]. Several research fields, such as virtual reality, have leveraged the development of interfaces that provide feedback through different sensory channels. These advances have been applied to the exploration of large data sets using, for example, the haptic and auditory sensory channels.
Menelas et al. [19] present an overview of the haptic rendering methods used for analysing massive data sets. There are several haptic rendering techniques designed to represent different abstract concepts [10] such as maps [27], graphs [15], diagrams [28,29], tables [30], networks [31] or icons [32]. In these investigations, the authors use different types of haptic navigation algorithms to understand the shape or structure of the data. In addition, in some of them, they use haptic signals (such as friction or tactile texture) to represent different properties of these structures.
Haptic icons are brief tactile, or force stimuli associated with a predefined meaning [11] and they can be used for representing abstract data. Haptic icons can be tactile or kinesthetic stimuli, depending on the haptic device. Brewster and Brown [33] describe the haptic icons as a potential tool to improve the interaction in different areas, particularly when there is an overload of the visual system, or it is limited or unavailable.
Haptic devices can be used to present information, and consequently, the user gains quantitative, qualitative, or holistic knowledge about the different data [10]. In the case of quantitative data, Yu et al. [15] indicate that the solution using tactile stimuli for each data is rather ineffective and confusing because they need to rely on the users’ short-term memory. According to several authors [34,35] the success of the representation of variables using haptic stimuli is influenced by the high dependence of humans on the short-term memory, which is limited for most subjects. This capability prevents representing a large number of quantitative data using the haptic channel. Therefore, utilising the haptic display is reduced to data requiring low accuracy. The capacity limits of human cognition are not well defined. George A. Miller (Miller, 1956) reports that the capacity of working memory is seven chunks of information, plus or minus two, and the short-term memory limit is about seven chunks, but this number also depends on the category of the chunks used (digits, words, or haptic stimuli, for example).
To address this limitation, several authors combine the haptic feedback with auditory stimuli, especially for the representation of quantitative information [27,36,37,38]. Yu et al. in [15] adopted a multimodal approach, using haptics for navigation and dedicating the auditory modality for providing quantitative values through synthesised speech and an overview through sonification.
In this work, we focus on solutions that exclusively use the haptic sense to discriminate and identify haptic stimuli, with the aim of palliating the two above-mentioned limitations, not only the haptic accuracy perception for quantitative data but also the problem of short-term memory for haptic stimuli.
Some authors have systematically used rhythm in combination with frequency and amplitude to create large sets of stimuli [39,40,41], or have used analogies either to music melodies by transforming pieces of music from the auditory domain to the vibrotactile domain [42] or to metaphors to increase the number of distinguishable stimuli.
However, melodies cannot be quantitatively sorted simply. Hence, this work is based on the research in Maclean et al. [32] for the design of haptic icons which shows that, for synthetic haptic icons, frequency plays a dominant perceptual role. The authors claim that, outside of frequency, the parameters of wave shape and force magnitude perceptually appear to be the most important. Consequently, we will focus our work on haptic icons exclusively based on those three parameters: frequency, amplitude, and shape.
MacLean et al. conclude that the meaning of users’ perceptual dimensions across an entire set of icons is strongly affected by the range of frequencies employed and suggest using a narrow range (they suggest a range of 5–20 Hz for their particular haptic device). In our work, we propose a methodology not only to obtain an appropriate frequency range given any particular device, but also to obtain a set of discriminant haptic stimuli to be used to represent quantitative data.
3. Defining a Haptic Icon Set
This section describes how to define a suitable set of haptic icons to maximise the user’s ability to discriminate among them. First, we describe the haptic icons and their parameterisation. Next, we explain how to order the haptic icons to create haptic scales and then, we introduce the concept of the haptic tuning fork.
3.1. Haptic Icons
Currently available general-purpose devices provide a natural interface to navigate through virtual 3D environments, usually offering up to 6-DoF position sensing. Proxy-based methods are among the preferred techniques for haptic rendering [18]. The exerted forces are proportional to the distance between a virtual proxy (the virtual representation of the haptic device) and the haptic interface point (an unconstrained haptic position in the scene): , where K is the stiffness constant.
As previously mentioned, haptic icons provide a powerful tool to display abstract information during the navigation whether to reinforce, complement, or substitute the visual channel. Haptic signals can be active or passive [43,44].
A haptic icon is passive if the observer does not have to move to perceive the signal (time-varying signals). In the other case, the signal can be considered active (space-varying signals). Active signals are more natural since users obtain haptic information through intentional exploration of the world. In contrast, the perception of the amplitude or the frequency of the signal might be affected by the speed of the user’s movement. On the one hand, we want users to perceive the icon even when they are not moving the HIP, but on the other hand, we want users to be able to recognise the signal naturally. Therefore, we have chosen a hybrid approach (semi-passive). Our haptic icon is time-varying, but the signal is not directly transformed into force. Instead, our haptic icons change the virtual object’s shape. In the simplest scenario, the signal is implemented as a proxy displacement. In this way, even if our signal is semi-passive, the haptic icons can be mapped to specific positions of the 3D space.
Analogously to the work in Maclean et al. [32], our haptic icon is a periodic signal that changes over time t, and the abstract information is encoded in its frequency f, its amplitude A, and its shape S. The wave shapes implemented in our system correspond to different discriminable forms according to Maclean et al. These forms are the sine, sawtooth and square waves. To define the other two parameters, experimental evidence is needed. Although Maclean et al. carry out different experiments to calculate discriminable ranges of frequencies and amplitudes, their icons are calculated as a force (instead of being calculated as a position displacement) and they use a customised hardware design which is non-commercial and, consequently, hardly available for its use in other external applications. Therefore, the values of amplitude and frequency cannot be extrapolated to our system.
Here, we propose the use of haptic icons, added as a one-dimensional time-varying signal that describes a modification in the shape of the virtual object to which the information is mapped. In the simplest case, the proxy is constrained to a 3D surface and the force feedback exerted during a 3D exploration can be computed as: , where is a unitary vector in the surface normal direction.
In our experiments, to isolate the haptic stimuli and avoid bias, we have simplified our haptic rendering algorithm so that the proxy is constrained to a horizontal plane (xz-plane). Therefore, there will only be haptic feedback in the y-coordinate (vertical axis), and this force can be computed as , where is the y-coordinate of and is equal to .
3.2. Haptic Scales
Musicians order the auditory frequencies in musical scales composed of elements called musical notes. According to the Weber–Fechner law [16], our senses work in a logarithmic manner; likewise, the musical notes follow a logarithmic scale so that users can discriminate between them. A haptic scale would consist of haptic notes, each note corresponding to a particular haptic icon. Hence, different haptic scales can be defined by varying different parameters of the haptic icons. Since we have complex synthesised semi-passively presented haptic icons, several haptic scales can be defined, depending on which parameters remain fixed and which change. We could order the haptic icons at least in three different types of scales: frequency-based haptic scales, where each note has an increased frequency with regards to the previous note (keeping constant the amplitude and the shape); shape-based haptic scales, where each different shape would correspond to a different note; and amplitude-based scales, where, keeping the same shape and frequency, each note would have a greater amplitude than its precedent note. Alternatively, we could also create hybrid haptic scales by simultaneously varying several parameters of the haptic icons, allowing us to represent multidimensional elements or a wider set of elements.
Each haptic scale will be composed of a set of ordered notes or haptic icons. For each haptic icon, we need to specify its shape, amplitude, and frequency. Previous work Maclean et al. [32] showed that the best discriminable feature is the frequency so, as a use case, in this paper, we explain and apply the procedure to obtain frequency-based haptic scales. If the haptic scales were based on a different parameter, the procedure will be analogous and similar experiments would need to be carried out.
In frequency-based haptic scales, the shape and the amplitude remain constant for the different haptic icons, whereas the different notes will have different frequencies. Previous works [32,45] showed that the more discriminable forms are: sine, sawtooth and square. Experiment 1 (described in Section 4.1) aims to obtain a suitable amplitude for each wave and the average amplitude of those three waves. Then, we need to obtain the range of discriminable frequencies (the minimum and the maximum value). Section 4.2 explains how we experimentally obtained those values. Finally, Section 4.3, explains how we calculate the values of frequency for each haptic icon within the previously calculated range, obeying the Weber–Fechner law [16] to achieve that the differences in the frequency between contiguous notes can be noticeable by users.
3.3. Haptic Tuning Fork
An improvement in the discrimination of different haptic icons will improve the usability of the sense of touch for data visualisation when representing qualitative and quantitative abstract variables. However, users are rarely trained in the use of haptic devices, and the exploratory characteristics of this sensory channel make discriminating different stimuli a difficult task. As previously mentioned, the goal of this work is to improve the users’ capability of discriminating between different haptic icons, palliating the short-term memory problem.
In many cases, the discrimination tasks of the auditory stimulus also depend on the short-term memory. The musical tuning fork is a widely used method to help to distinguish different musical notes. A tuning fork provides a reference signal for vocal or instrument tuning. Playing a known audio frequency (a musical note), the tuning fork allows musicians to determine other audio frequencies. Musicians, using the reference of the musical tuning fork, are capable of accurately identifying the rest of the notes in the musical scale. Similarly, the haptic tuning fork will correspond to a haptic signal which is used as a reference before receiving a haptic icon. Therefore, we hypothesise that having a haptic reference tuning fork can help users better discriminate and identify the haptic stimuli.
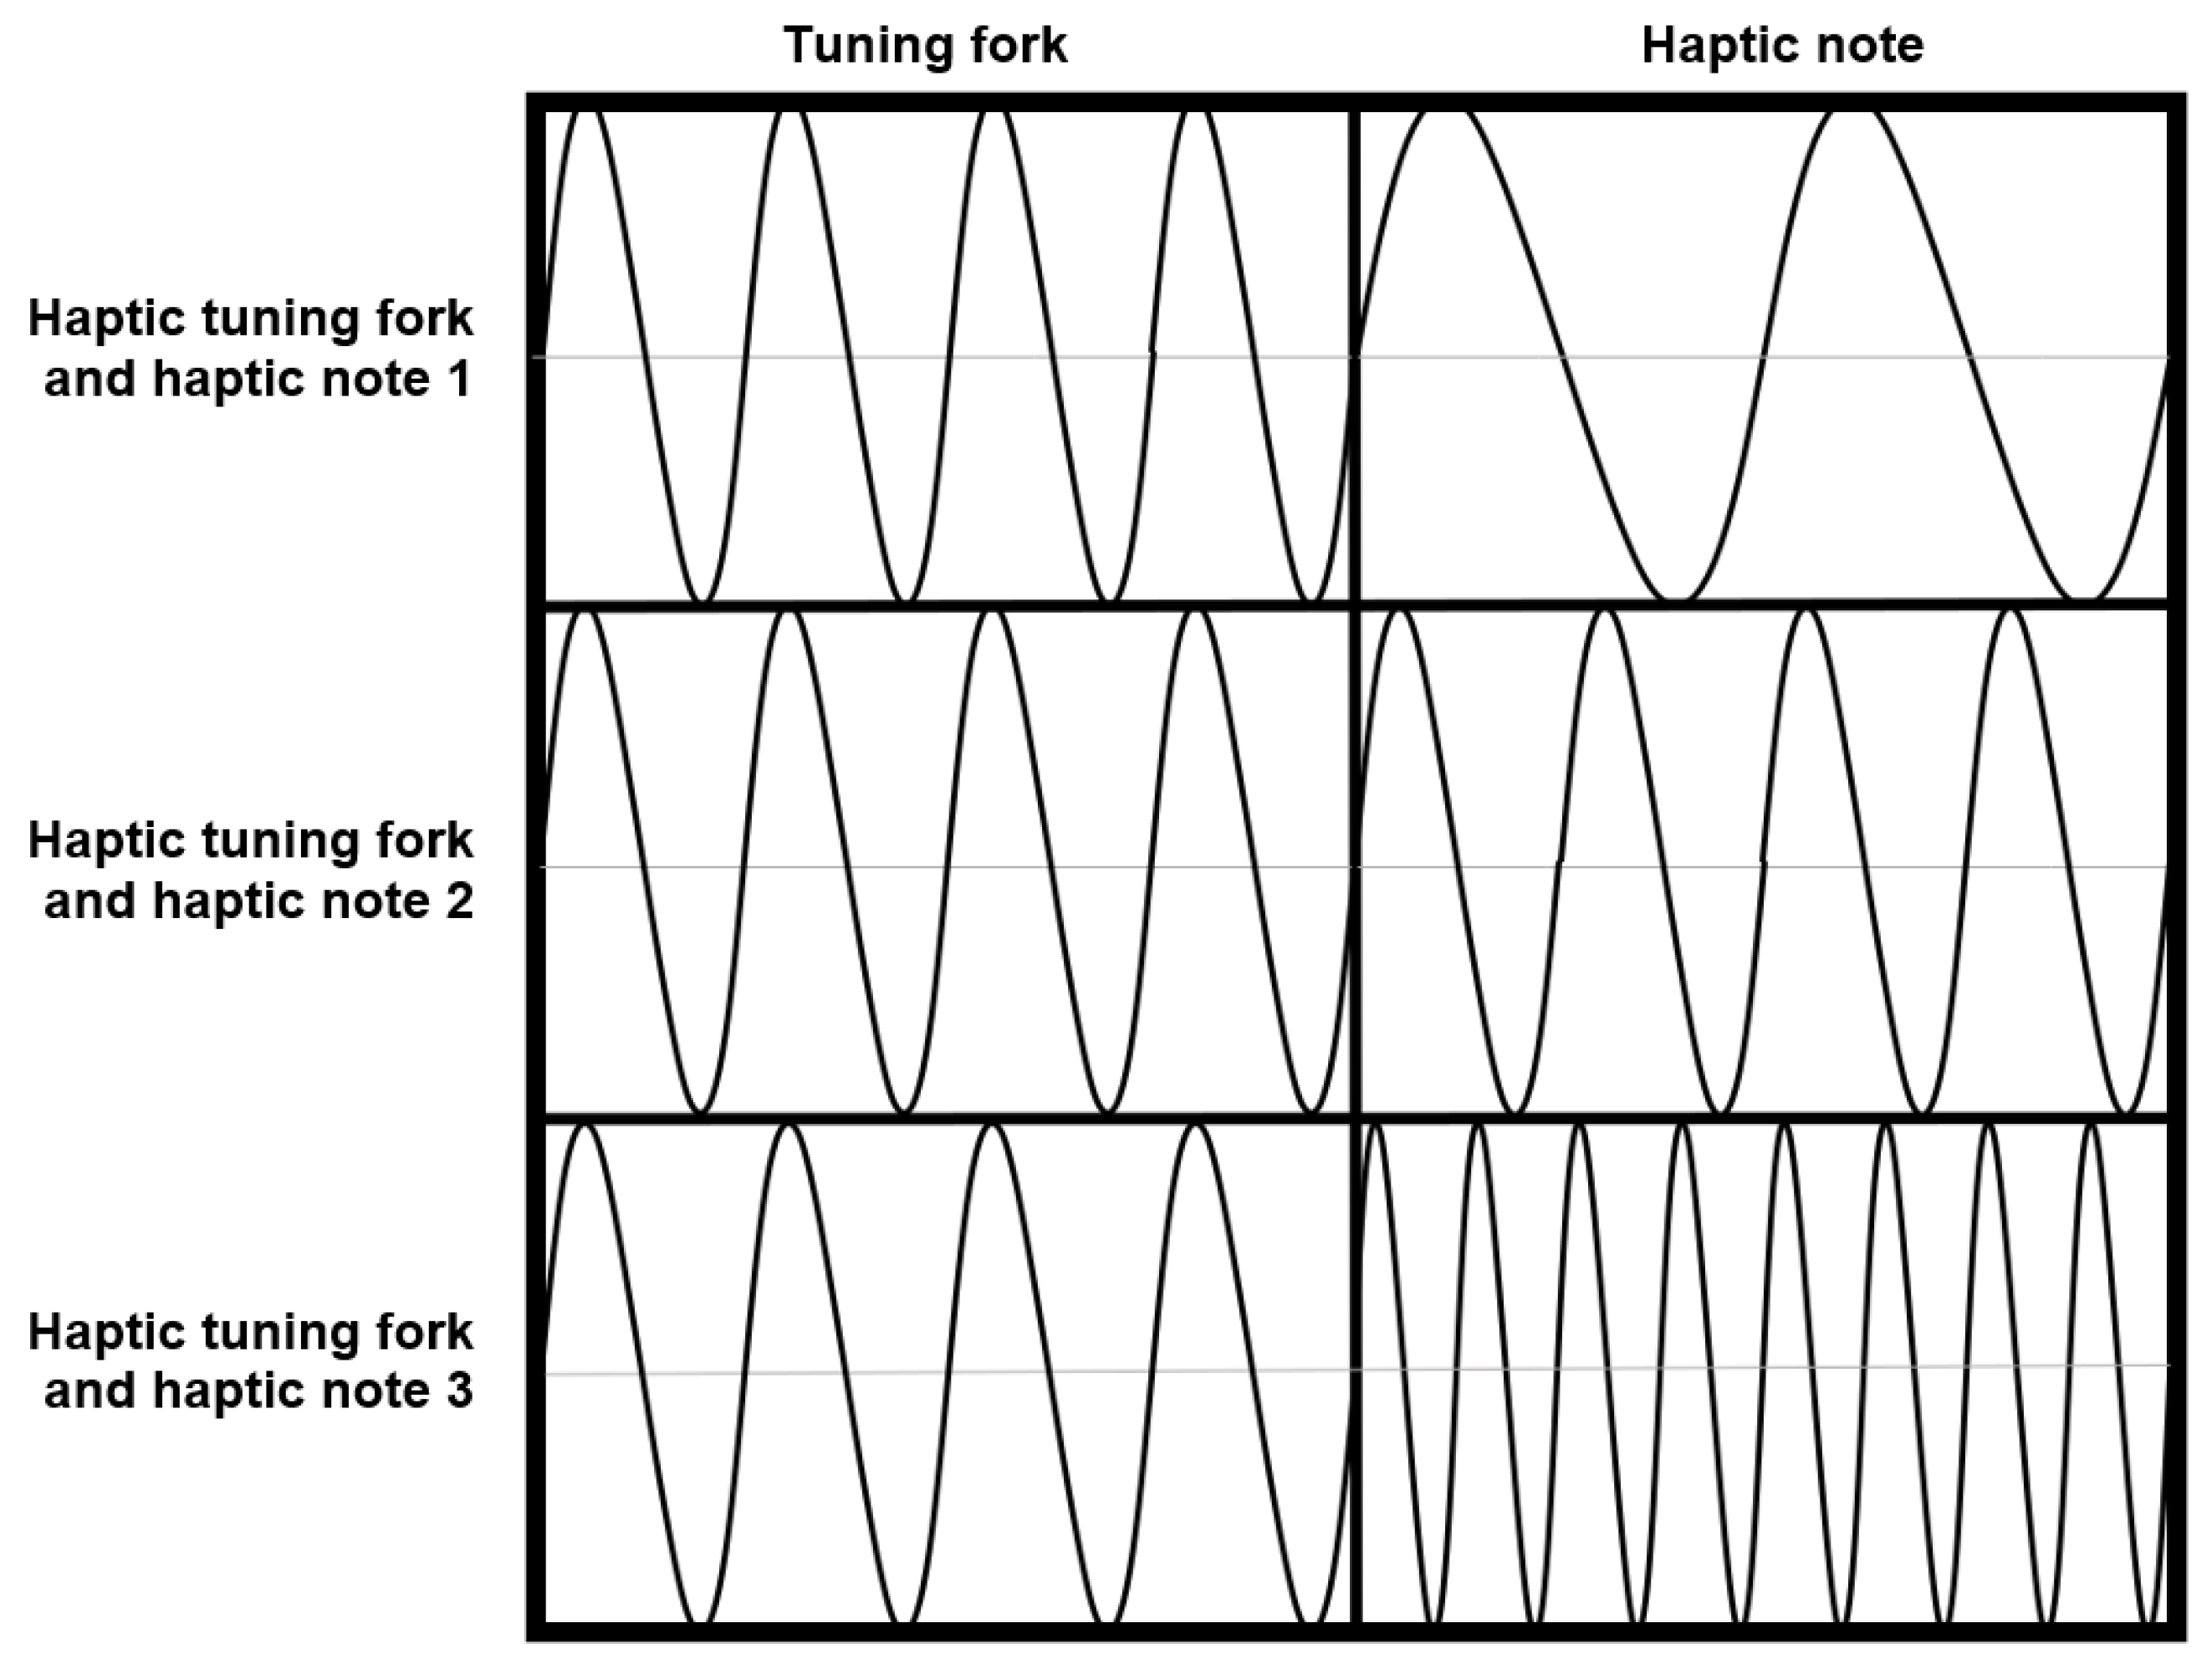
Consequently, our haptic icons consist of two haptic signals: a reference signal (the haptic tuning fork) and a signal that conveys the information. We propose to use as a haptic tuning fork the median value of the haptic scale used. Additionally, we constrained the maximum length of our haptic icons to 2 s. The duration of the signal that conveys the information is 1 s and it is repeated at least twice within that second. This constraint bounds the minimum frequency of our haptic scale to 2 Hz. The haptic tuning fork maximum length is 1 s but it can be less since we want to force a smooth transition between both signals. With this purpose, our haptic icon is restrained to be continuous . The haptic icon is so that its length approaches the upper limit, 1 s, and does not include any incomplete period (see Figure 1).
Although we introduce the concepts of the haptic tuning fork and haptic scale in its wider sense, in this paper, we will focus on the procedure to obtain frequency-based haptic scales since, according to MacLean et al. [32], the expressive capability is maximised in the frequency subspace. Moreover, this concept could be applied to both the tactile and the kinaesthetic channels. However, in this article, the haptic icons will be defined for the kinaesthetic channel, and we will check whether a previous haptic reference can facilitate the discrimination between various haptic icons. Section 5 contains the evaluation study, but first, the next section will describe in more detail how to obtain the haptic scales.
4. Methodology to Define the Haptic Scales
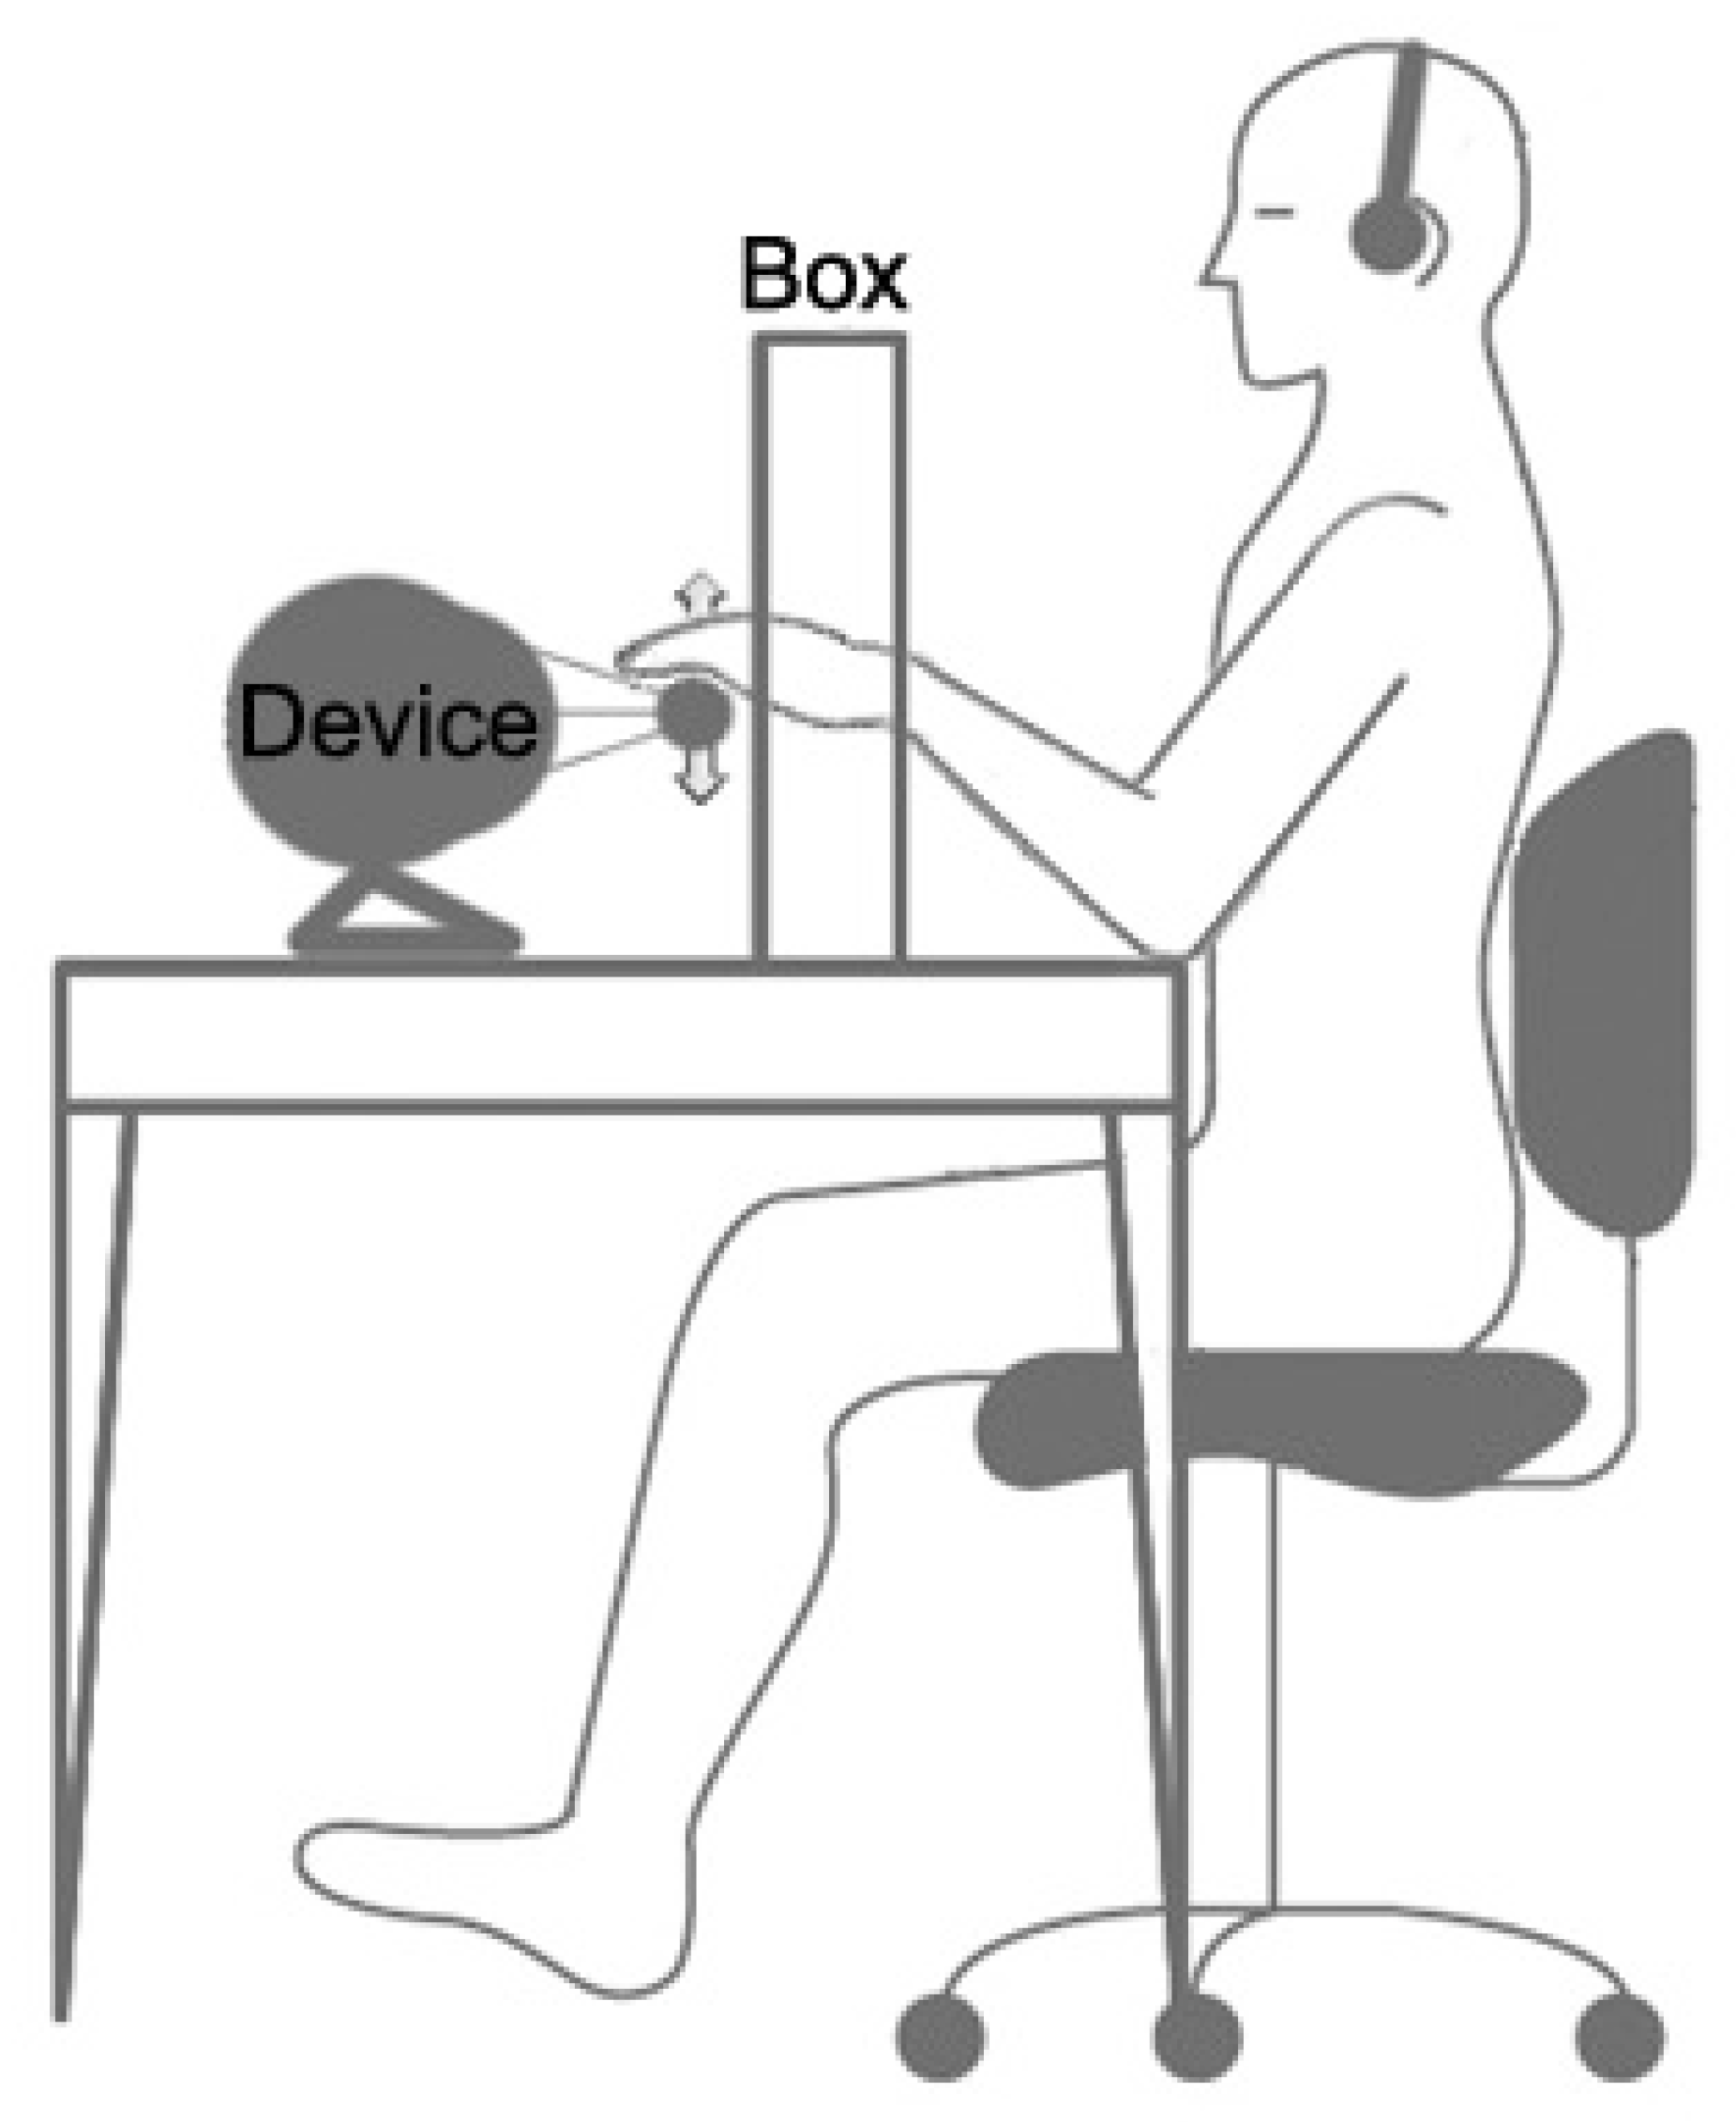
As it was previously mentioned, all the experiments carried out in this paper have used a Novint Falcon [17] device. The experimental setup is based on the use of the device located on a table and the user sitting in front of it for perceiving the haptic icon. The subject is relaxed, and the arm and forearm form a 90-degree angle (see Figure 2). To prevent the user from discriminating the haptic icons through the vision of the movement of the device, the user inserts his hand through a structure in front of the device that impairs the vision. Furthermore, the different frequencies of the device cause different noises that could help discriminating frequencies through the sense of hearing. To avoid this, the user has to wear a headset where white noise will be heard at high volume so that the user is isolated from its environment and the soundtracks caused by the noise of the haptic device motors and tensioners.
An explanatory document and the same instructions were given to each participant, to explain the experiment and define the new concepts of haptic scale, haptic note, and haptic tuning fork.
4.1. Experiment 1: Obtaining a Proper Amplitude for the Recognition of Each Wave
Due to the different geometric characteristics of each wave and, therefore, their perceptual difference, we hypothesised that each shape has an amplitude with which the user can discriminate it better. In Maclean et al. [32], a discriminable set of minimum amplitudes by shape and frequency is obtained. Due to the physical characteristics of the haptic device, their haptic texture is implemented in terms of force. Moreover, the authors search for the minimum discriminable amplitude for each frequency range, instead of searching for the best amplitude, which will be our aim, since we want to fix an amplitude for constructing a frequency-based haptic scale. To calculate this amplitude, we will first specify the values of the frequency and the shape. The shapes used are the ones presented in Maclean et al. In the case of the frequency, for this first experiment, we used the one obtained in Maclean et al. as the initial frequency. This initial frequency will later be modified and adapted for our system in the experiment described in Section 4.2. A group of 5 volunteer subjects, naïve to the experimental design, assessed these frequency ranges within our system to verify that their frequency ranges work well enough in our system and can be used to calculate the amplitude. The subjects related if they were able to find differences between the stimuli and if they were able to identify the different shapes. The subjects indicated that the frequencies in this range offer convenient device management and acceptable discrimination of the shapes. Once the frequency and the shapes are established, we proceeded to obtain the most appropriate amplitude for each shape.
4.1.1. Experimental Design
We designed an adaptive method based on the user responses. An initial sequence of waves was initially presented to the subject, consisting of three shapes to be recognised, starting with the lowest amplitude perceived in previous tests (4 mm), and a frequency equal to the average value within the range obtained in Maclean et al. [32]. This value is equal to 10.21 Hz. The procedure in this experiment is based on the theory that the user must not only recognise the different shapes but also indicate how sure he or she feels when haptically differentiating between the three shapes (sine, sawtooth and square). Users indicate the level of confidence with which they recognise these shapes using a 5-point Likert scale, where 5 represents “very high confidence in the response” and 1 represents “very low confidence in the response”. The different shapes are randomly displayed. While the user answers correctly, with a maintained level of confidence, the amplitude will be taking a greater value. The increase in amplitude obeys Weber’s Law [16], starting with a base stimulus in which the amplitude is 4 mm (lower amplitudes were not perceived in preliminary tests). Then, based on Maclean et al., the just-noticeable difference (JND) increment is equal to 1/5 of the base stimulus. The experiment stops when the user fails to identify the shape or if the confidence level in the response decreases (even when the answer is correct). The optimum amplitude is then set to the previous amplitude value that provided the correct identification of the shape with the highest degree of confidence.
4.1.2. Population
This experiment was performed with 11 right-handed subjects: 7 men and 4 women between 22 and 37 years old.
4.1.3. Results
The mean amplitude obtained for the case of the sine wave was 8.05 mm with a level of confidence of 3.77. For the square shape, the amplitude was 6.64 mm with an average of 2.14 in the level of confidence. For the sawtooth, the amplitude was 5.77 mm with a level of confidence equal to 1.86. It is important to note that the number of correct answers and the confidence level is higher in the case of the sine wave.
4.2. Experiment 2: Defining the Limits of the Range of the Frequency Haptic Scale
After determining the optimum amplitude for each form with the previous experiment, we need to calculate a range of discriminable frequencies, adapted to our system, to determine the values of the frequency scale we want to build. For this experiment, the chosen amplitude is 6.82 mm, the average of the three optimal amplitudes obtained in experiment 1.
Regarding the frequency, the minimum frequency corresponds to 2 Hz, as justified in Section 3.3. The maximum frequency will be that for which the subject fails to identify between the three forms (sine, sawtooth, square).
4.2.1. Experimental Design
We have designed an adaptive method based on the responses of the users. Initially, the user feels a set of three haptic icons with a fixed amplitude and frequency. This set of three icons can include a single wave shape repeated thrice, two different wave shapes (one of them repeated twice) or three different wave shapes. The order in which the waves were presented was randomised. Users answer how many different wave shapes have they perceived in that set. Similarly to the previous experiment, while users answer correctly, the value of the frequency increases. Following the JND, the value of the frequency increases by 1/5 of the base frequency. Once the subject fails the first time, our system begins to evaluate the percentage of failures from that moment on. When the failure rate reaches 50% (we chose the 50%-discriminated disparity [46]), the experiment stops, and we take the maximum frequency value with which the subject was still able to discriminate the shapes.
4.2.2. Population
This experiment was performed with 11 right-handed subjects: 7 men and 4 women between 22 and 37 years old. All participants were different for the different experiments.
4.2.3. Results
The maximum frequency obtained for the waveforms is 36.97 Hz, so the range of discriminable frequencies obtained corresponds to [2 Hz, 36.97 Hz]. This range, therefore, determines the lower and upper values of frequency for the haptic notes of our frequency-based haptic scale.
4.3. Creating Haptic Frequency Scales
With the lower and upper-frequency values obtained in experiment 2 (Section 4.2), it is possible to determine each of the notes that compose each haptic scale. Based on the JND, we have designed three haptic frequency scales obeying Weber’s Law. The equation used to generate the frequency scale is:
where is the minimum frequency obtained in Experiment 2, m is a counter indicating the position of a note within the scale, and is calculated as:
where is the maximum frequency defined in Experiment 2, and is the number of values that are in the sorted list. Using (1), we ensure that our haptic scale follows a logarithmic scale. Besides, we must ensure that the increment between two consecutive notes is higher than of the current value to follow Weber’s Law. This condition will be satisfied if the inc value computed in (2) is above .
To evaluate haptic scales with different numbers of notes, we have created scales of three (2, 8.6, 36.97 Hz), five (2, 4.14, 8.6, 17.83, 36.97 Hz) and seven (2, 3.25, 5.28, 8.6, 13.98, 22.73, 36.9 Hz) haptic notes. In all three cases, we have defined haptic scales of the frequency with an uneven number of notes, so that, afterwards, we can situate the haptic tuning fork in the middle note.
Setting the Value and Duration of the Haptic Tuning Fork
Following the musical analogy and knowing that the tuning fork in music corresponds to a note in the centre of the musical scale of the human voice, we hypothesised that a central value of our haptic tuning fork may serve as a reference to improve the discrimination of the different haptic icons. For this reason, our haptic tuning fork has a value equal to 8.6 Hz, which is the central value in all the defined scales. In addition, the haptic tuning fork lasts two seconds to complete a full cycle in the waveform, so that the tuning fork finishes at the neutral point of the wave. Thus, when the haptic tuning fork ends at zero, the corresponding haptic note can begin at that point, avoiding discontinuities between the haptic tuning fork and the haptic note that could confuse users.
5. Validation
Once the frequency-based haptic scales have been created and the haptic tuning fork has been defined, we performed a set of experiments to validate its usefulness.
5.1. Experiment A: Evaluating the Improvement in the Hit Rate Using the Haptic Tuning Fork
We developed an experiment to evaluate whether the use of a haptic tuning fork favours the discrimination of the different haptic notes. When using haptics to help to explore complex data scenarios, each haptic note will be associated with a particular value of the variables being explored. Having more discriminable haptic notes would allow, for example, the discrimination of a greater number of values for a particular variable. Therefore, this experiment aims at evaluating whether the application of the haptic tuning fork helps in better identifying different notes.
For this experiment, we selected the sinusoidal shape, since it is the shape with which users obtained the highest hit rate in experiment 1 (82% vs. 72% with the other two shapes). However, future experiments could validate the haptic tuning fork for different shape scales to validate if the results would be like other shapes. Importantly, the dependent measures for the experiment are “hit rate”, representing the percentage of correct identifications in a set that constitutes three times the number of stimuli presented (, , ).
5.1.1. Experimental Design
This experiment was repeated twice (once with and once without the haptic tuning fork), for each of the three frequency haptic scales (with 3, 5 and 7 haptic notes). The order in performing the task, either using or not using the haptic tuning fork, was balanced between subjects to avoid any bias. Each experiment was divided into the following phases:
Instructions: Initially, the subject reads the instructions about the experiment that includes a figure in which the user can visually observe the order and number of each haptic note within the scale. In this way, the user understands that the haptic icon with the lowest frequency corresponds to the haptic note number 1.
Familiarisation: Next, the user feels all the values of a particular frequency-based haptic scale (that is, the 3, 5 or 7 values, depending on the scale). Each haptic note of the scale will be named with a number that will be simultaneously listened to during this phase. The order of appearance of the haptic icons starts with the haptic note 1 (which has the lowest frequency), followed by the haptic note 2 and so on, until showing the note with the highest frequency and then, again all the notes are reversely displayed starting with the note with the highest frequency in descending order. This phase aims to familiarise the subject with the haptic notes and their identification numbers, establishing a common language with which the user can name a particular haptic note. This phase has been designed to help the user ordering the different haptic stimuli in a natural way, using the analogy with the musical scale.
Training: Once the selected scale has been haptically felt, the user will perform a training session that we will name the haptic dictation, similar to a musical dictation. The user will feel different haptic notes randomly chosen within the selected haptic scale, and he or she will have to identify them, saying their name (their associated number or position within the scale). The number of random stimuli will double the number of different values in the selected scale. Formative feedback, an audible signal, facilitates the training by indicating whether the user is right or wrong, and, in case of failure, the system tells the user which the correct note number was. This formative feedback facilitates the learning of that particular note and gives the user a reference of how far or close was his or her guess from the correct note. Though the training may be short, its main aim is to habituate users to the procedure, rather than training them thoroughly to recognise each individual stimuli.
Experiment: After completing the training, the subject performs the experiment. The experiment is similar to the training but, in this case, there will not be any audio providing formative feedback. The number of random stimuli will triple the number of different values in the selected scale and the user will not know if his or her guess to identify the note is correct or not. This experiment was repeated twice for each of the three frequency-based haptic scales (once using the haptic tuning fork and once without using it). Thus, we can independently determine if the use of a frequency haptic tuning fork improves the recognition of the notes for each scale.
There is a four-second lapse between one haptic note and the following one. These four seconds are composed of a second without haptic effect (zero force), 2 s with a haptic effect generated randomly (white noise) and, a final second without haptic effect. The reason for the inclusion of this haptic noise is to recreate similar conditions to the conditions when analyzing a variable using haptic feedback in a real application. When exploring complex data, not all stimuli will appear consecutively or without any other haptic information in between. During the test, we stored the number of correct haptic notes indicated by the user and, in case of failure, the distance error between the note indicated by the user and the correct note. At the end of the experiment, we asked users if they would like to count with the haptic tuning fork in future tasks when haptically exploring scenarios. In addition, we asked users if the haptic tuning fork improved their level of confidence when performing the task.
5.1.2. Population
The experiment was performed again with 11 right-handed subjects, 6 men and 5 women between 22 and 35 years old. Obviously, these subjects are different from those in the above experiments, to avoid any previous training.
5.1.3. Results
We checked the normality of the data using Kolmogorov–Smirnov and we applied the Student’s t-test for paired samples. Results for the haptic scale with three notes were not statistically significant, whether using or not the haptic tuning fork. Actually, the hit rate was in both cases close to 100%.
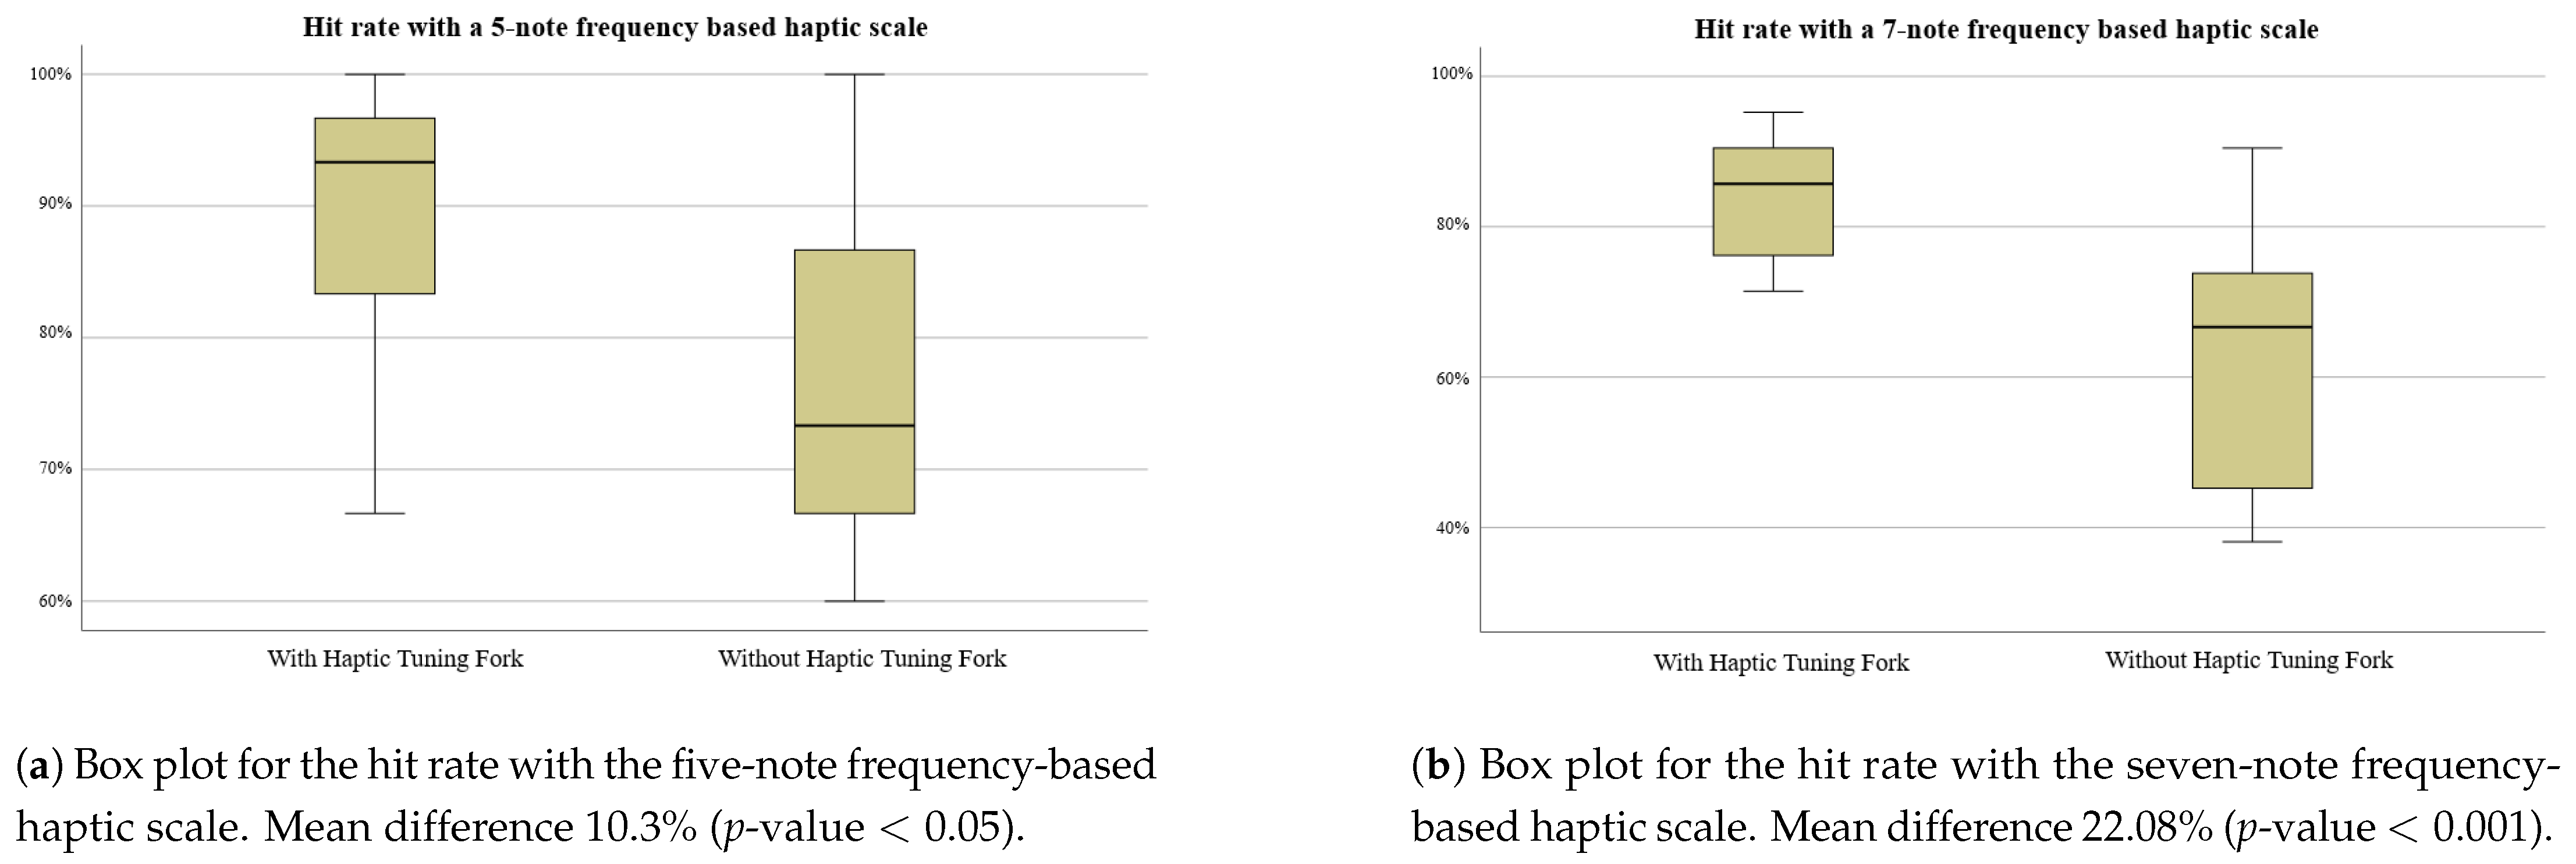
In the case of the scale of 5 haptic notes, the hit rate mean difference with and without haptic tuning fork, 10.3%, showed statistical significance at the 95 level (p-value ), favouring the use of the haptic tuning fork, see Figure 3a. For the scale of 7 stimuli, the hit rate mean difference is 22.08%, which was also statistically significant (p-value ), see Figure 3b. Details about the transmitted information can be found in the Supplementary Materials.
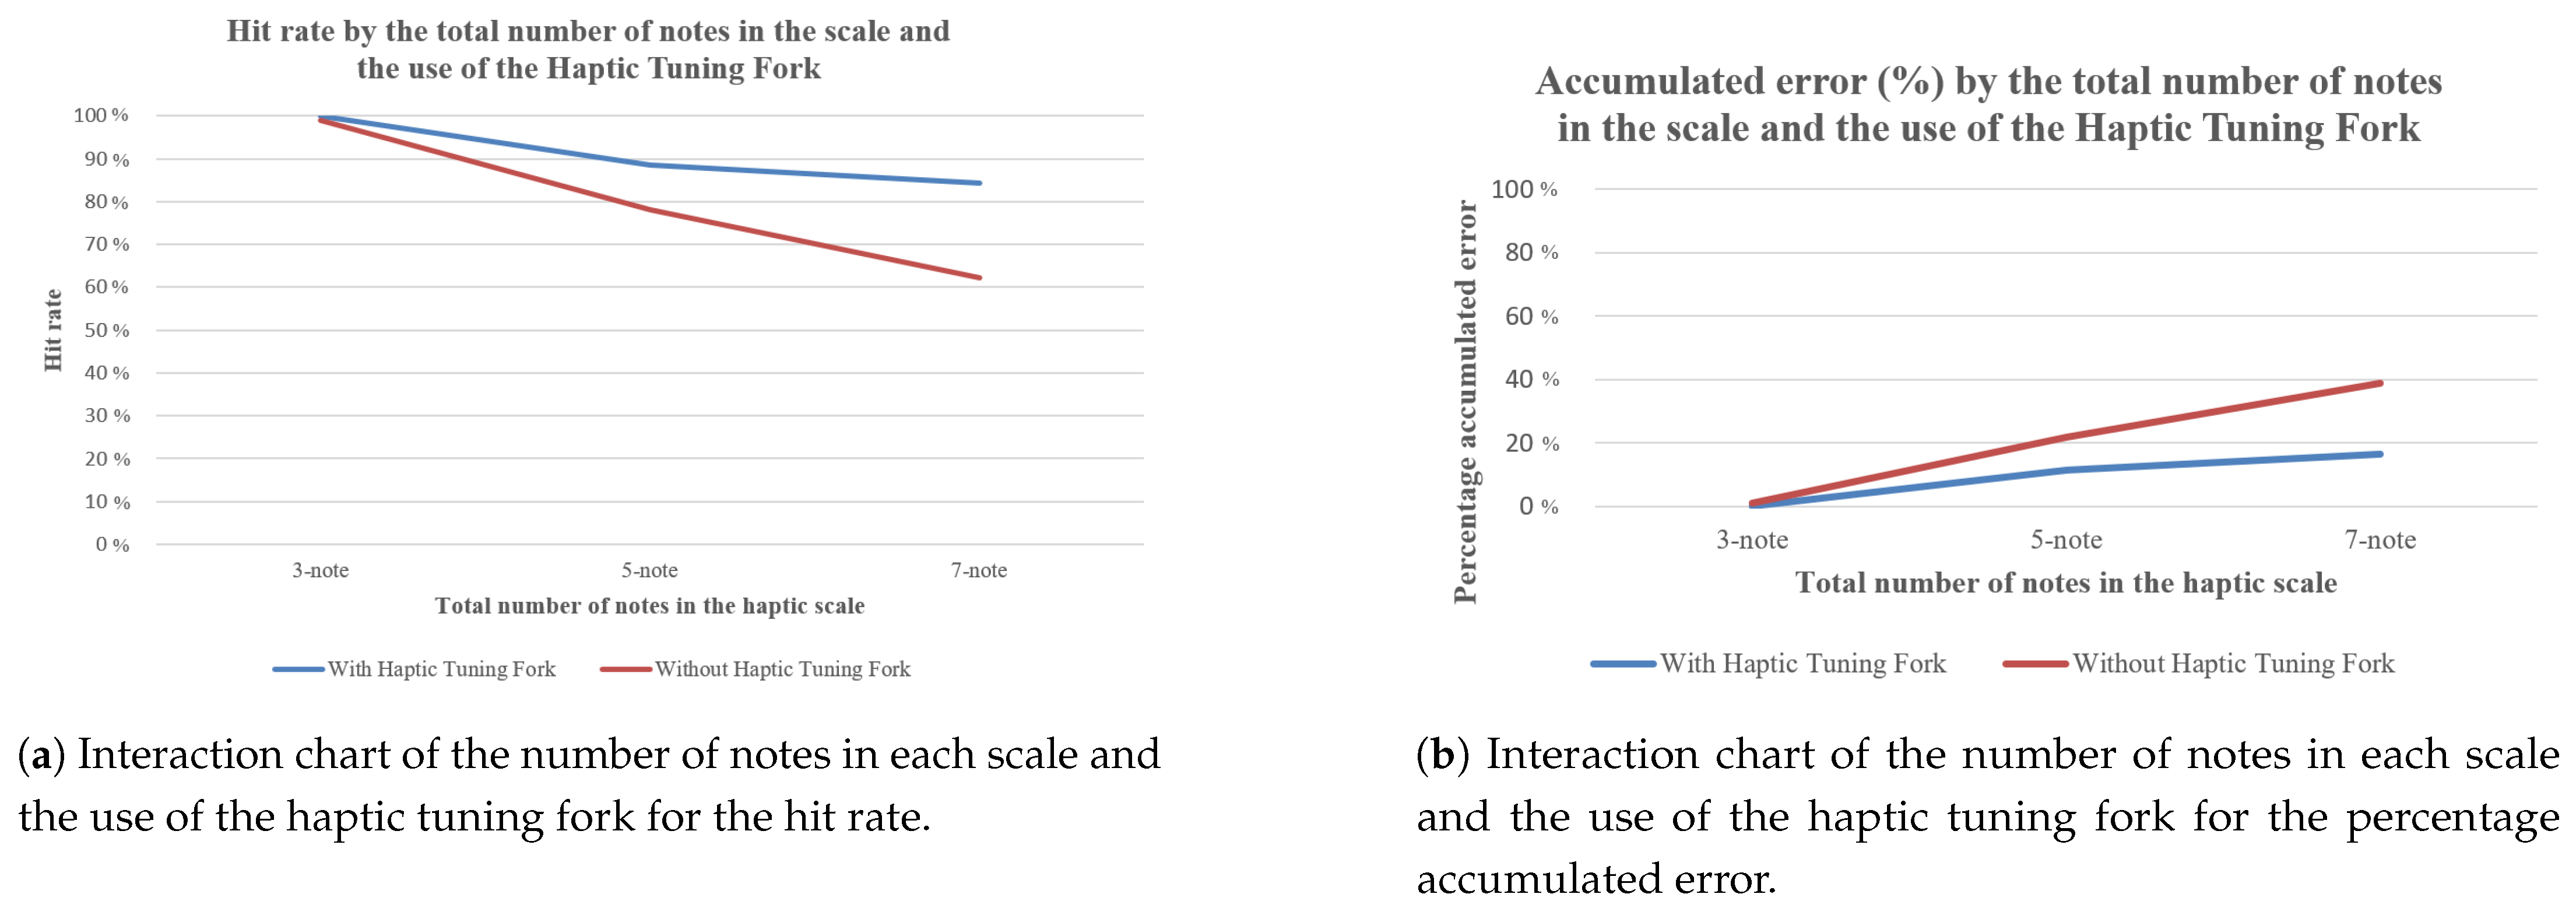
Figure 4 shows the interaction effect of the number of notes in the frequency-based scale and the use of the haptic tuning fork on the hit rate and on the percentage accumulated error.
A two-way ANalysis Of VAriance (ANOVA) followed by a post hoc analysis using the Tukey test showed these interaction effects were significant (p-value ). The use of the haptic tuning fork is particularly important when the haptic scale has a higher number of notes, increasing participants’ hit rate, and decreasing the accumulated error, see Figure 4.
The accumulated error was calculated by adding the difference between the reported notes and the number identifying the real notes. The mean difference in the accumulated error, −1.55, is also statistically significant for the 5-note scale (p-value ) and for the 7-not scale −4.73 (p-value ). When users made a mistake in telling the haptic note being displayed, mistakes were closer to the right answer when using the haptic tuning fork.
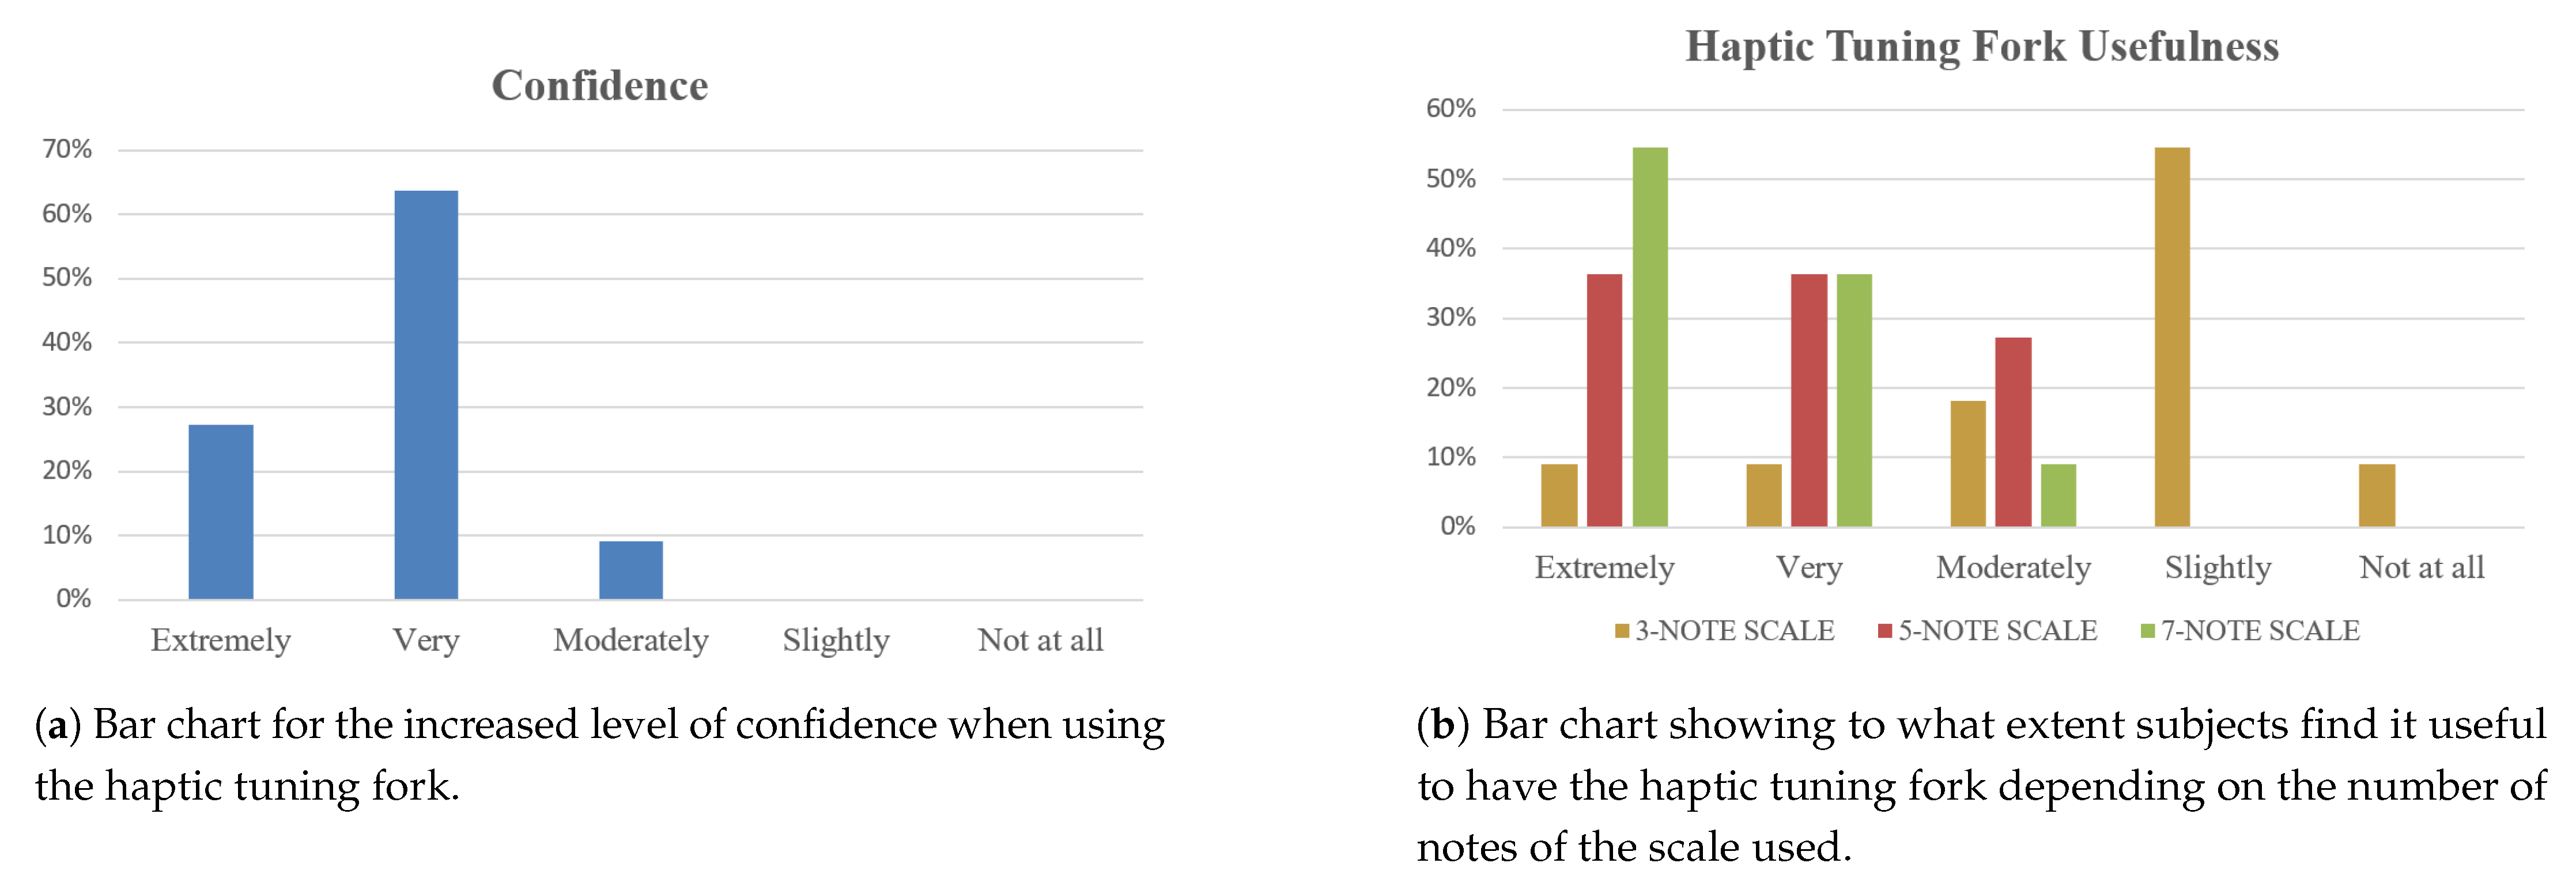
All subjects affirmed that, if they had to perform data analysis using the haptic channel, they would prefer to count with a haptic tuning fork to serve them as a haptic reference. Users were asked if they felt that the haptic tuning fork increased their level of confidence with a 5-point Likert scale, where 5 represents “Extremely”, 4 represents “Very”, 3 represents “Moderately”, 2 represents “Slightly” and 1 represents “Not at all”. 27.3% indicated that the haptic tuning fork extremely increased their confidence level, by answering 5; 63.6% answered 4; and 9.1% answered 3, indicating that the use of the haptic tuning fork moderately increased their level of confidence (median “Very”, mode “Very”), see Figure 5a. Regarding the usefulness of the haptic tuning fork, depending on the number of notes of the scale used, for the 3-note scale, most of the subjects reported that the haptic tuning fork was “Slightly” useful (median and mode “Slightly”); for the 5-note scale, most of the subjects reported that it was “Very” or “Extremely” useful (median “Very”, mode “Extremely”); whereas for the 7-note scale, most of the subjects reported that the haptic tuning fork was “Extremely” useful (median and mode “Extremely”). These results are shown in Figure 5b.
5.2. Experiment B: Evaluation of the Improvement in the Hit Rate When Users Discriminate Frequencies and Shapes Using the Haptic Tuning Fork
The previous experiment demonstrated that the use of the haptic tuning fork helps to identify the notes for the frequency sinusoidal scales of 5 and 7 notes, respectively. This experiment wants to evaluate if using a haptic tuning fork for the shape helps to recognise both the perceived shape and frequency of the target stimuli.
5.2.1. Experimental Design
This experiment includes three frequency-based haptic scales, one for each shape: the sine wave, and the other two discriminable shapes found in Maclean et al. [32], the sawtooth and the square waves. To limit the time of the experiment not to cause excessive fatigue to the user, we have chosen haptic frequency-based scales of five notes. Similarly to the previous experiment, this experiment was performed twice per subject: once using the haptic tuning fork, and once without it. Again, the order was balanced to avoid any bias.
In this experiment, the presented tuning fork value has the same frequency (the frequency of the middle note of the scale, note number 3) for all the shape scales, and the shape of the tuning fork will be the shape of its corresponding scale. The frequency and shape combinations are randomly displayed to the user for each stimulus. This experiment has also been divided into three phases, as explained in the previous experiment: an initial familiarisation of the scales, a training phase, and the final test.
5.2.2. Population
The experiment was performed with 11 right-handed subjects, 8 males, and 3 females between 22 and 37 years old. Again, these subjects are different from those in the above experiments, to avoid any previous training.
5.2.3. Results
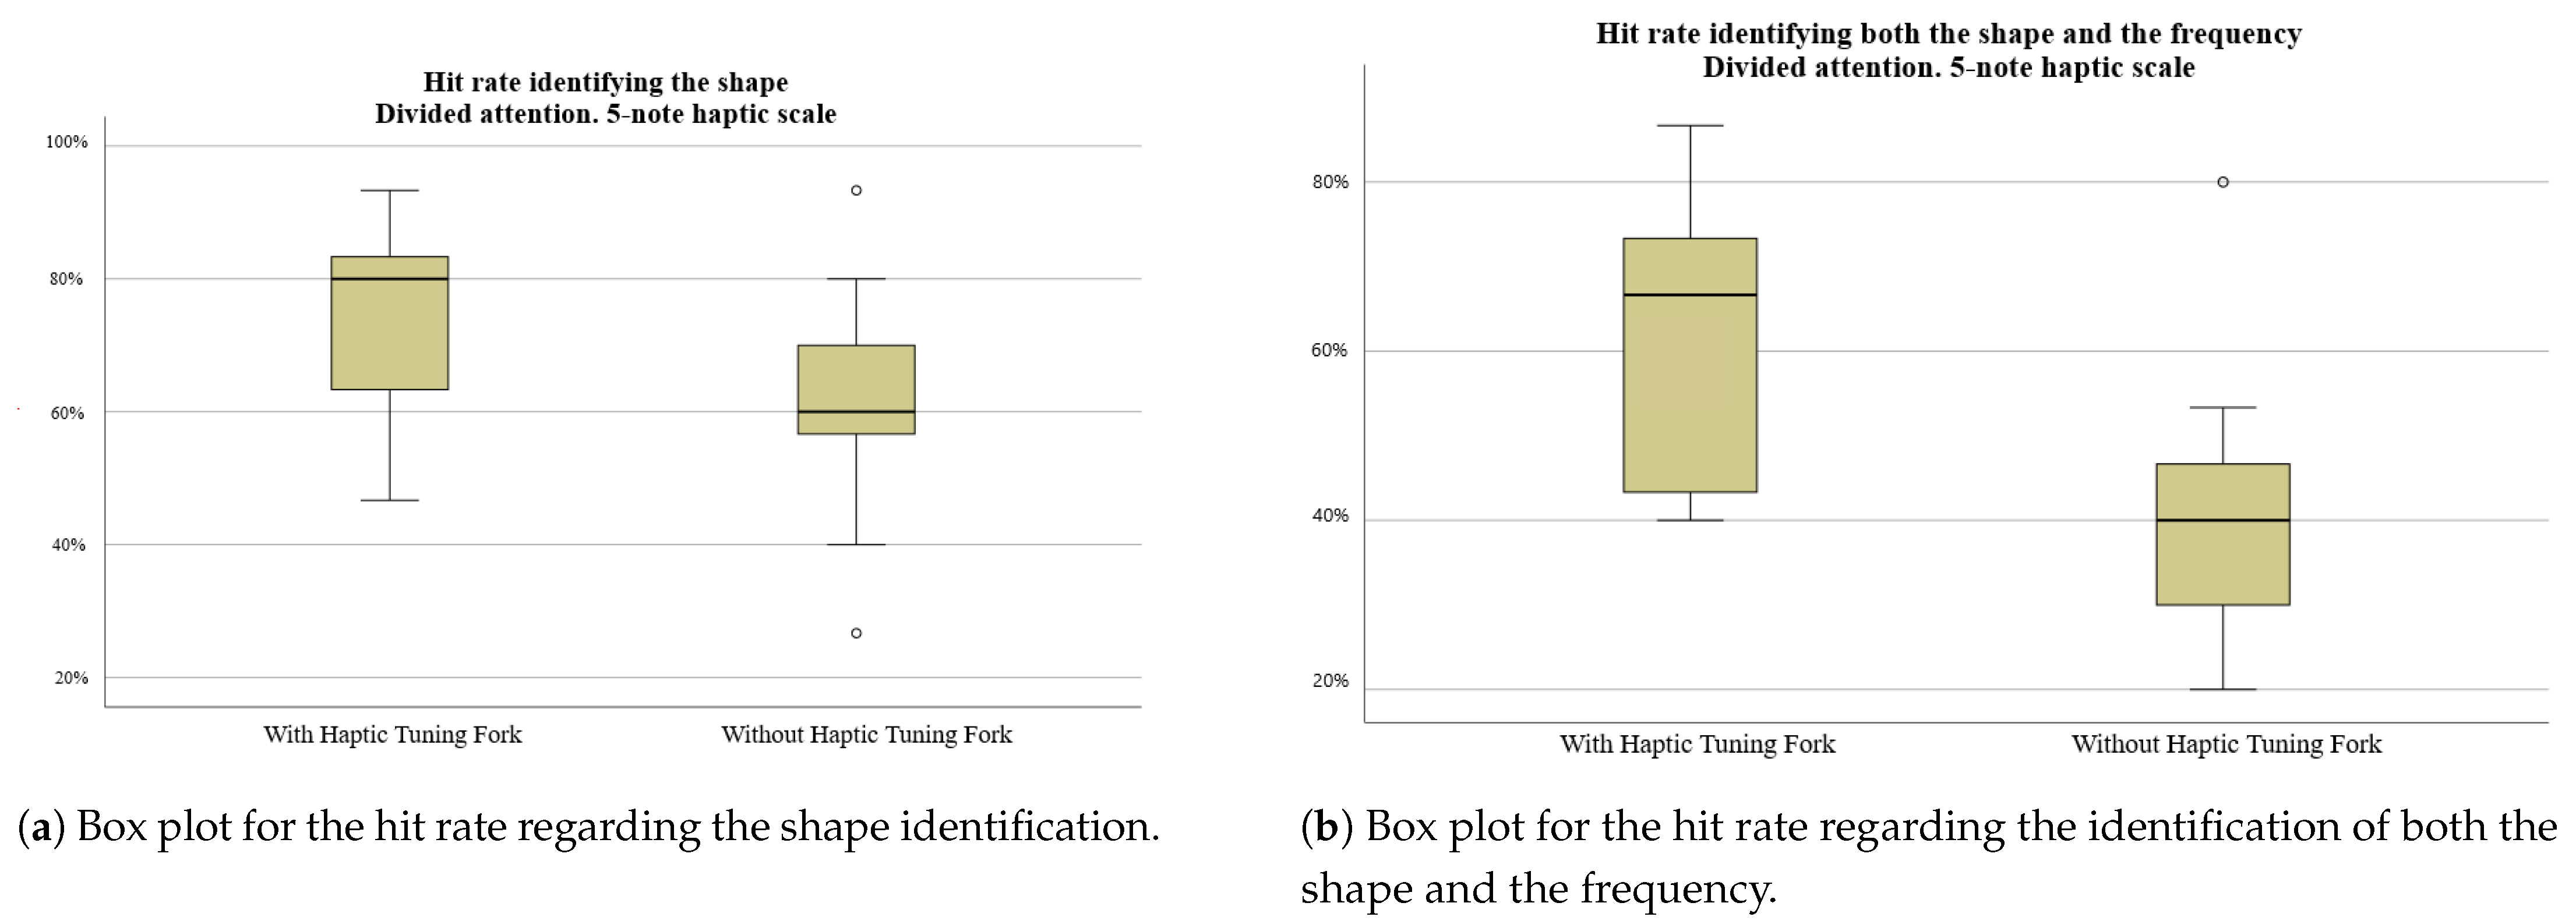
After analyzing the results using the Student’s t-test, we observe that the mean difference in the total hit rate identifying both the shape and the frequencies when using the tuning fork vs. not using the tuning fork is 20% and it is statistically significant (p-value ), again, the haptic tuning fork proves useful. The mean difference in the frequency hit rate, it is of 14.55% and it is statistically significant (p-value ). Regarding the hit rate when determining the shape of the haptic icon, the difference was not statistically significant (p-value ), see Figure 6a. Further studies need to be done regarding shape identification. In Figure 6b, the higher hit rate regarding the identification of both the frequency and the shape can be observed. All subjects indicated that they preferred to perform the exploration task using the tuning fork.
5.3. Experiment C: Evaluation of the Improvement in the Hit Rate When Users Discriminate between Haptic Frequencies in an Environment with Divided Attention Using a Haptic Tuning Fork
In the environments of experiments, A and B, users are focusing on feeling the stimuli and the haptic scales, which allows paying almost total attention to the stimuli. While this environment was useful to design and validate the scales and the haptic tuning fork, this experimental framework does not reflect a real situation in which the haptic icons are used for exploring a more complex scenario. In a real environment, the user will be performing other tasks when the haptic icon will be perceived. For this reason, we designed experiment C in which the user has to perceive the haptic icons while he or she has part of the attention focused on performing a different task. Again, we evaluate if including the haptic tuning fork still improves the hit rate.
5.3.1. Experimental Design
In this experiment, users will have to perform a task of selective attention [47]. They have to watch a video where two teams (one with white shirts and the other wearing black shirts) are passing a ball. The user has to count the number of passes of the ball between members of the team with the white shirt. At the end of the experiment, users will have to indicate this number. Additionally, the headphone white noise used in all experiments (to prevent that the user can identify the haptic notes by the noise produced by the motors of the haptic device) has been replaced by music that could also distract the user. While the user performs that task, ten stimuli of haptic icons from a sinusoidal 7-note frequency-based scale will be randomly presented and the user will have to recognise the number of the presented haptic note. The time between stimuli will also be random, to simulate what could happen in a real application. For this experiment, the sinusoidal seven-note haptic frequency scale has been selected, to increase complexity.
5.3.2. Population
The experiment was performed with 11 right-handed subjects, 8 males, and 3 females between 22 and 39 years old.
5.3.3. Results
In the task with divided attention, the mean difference in the percentage when using the haptic tuning fork versus the case without the tuning fork was analysed with the Student’s t-test. A mean difference of 25% was found and it is statistically significant (p-value ). Hence, the haptic tuning fork greatly improves the identification of frequencies in environments involving divided attention and with stimuli presented at random intervals.
6. Discussion and Conclusions
In this work, we introduce the concept of the haptic tuning fork and we provide a methodology to create haptic scales for different types of haptic devices, and apply these concepts to create frequency-based haptic scales for the Novint Falcon haptic device, validating the utility and the improvement reached.
We believe that the haptic tuning fork can be applied to amplitude-based, shape-based or hybrid scales. Vibro-tactile devices have been used to convey abstract information in the past. These approaches suffer from the same limitations as kinesthetic devices and might benefit from the haptic tuning fork. Future work will have to test these hypotheses.
Previous work addressed the short-term memory limitations of the haptic channel by including an additional channel, the auditory sense. Our work presents a method for increasing the discriminability of haptic icons that exclusively involves the sense of touch. By using the haptic tuning fork, we reduce the absolute dependence on short-term memory, because the user now has a reference against which to compare the haptic signal. Employing only the sense of touch could allow using other channels to transmit additional information or reinforce the information sent. Future work will evaluate multi-modal approaches.
We describe a methodology to create haptic scales and to specify the range and the values of the parameters of the haptic icons (haptic notes). We use semi-passive time-varying haptic icons that allow conveying the signal, independently from the user’s exploration speed, by modifying the shape of the object to which the haptic icon is attached. We detailed how to use the haptic icons in the simplest case, by mapping them to a surface and having the proxy always constrained to lay on that surface. However, the technique is also applicable to any other proxy-based approach, although, in more complex cases, the signal should be considered in the algorithm to calculate the virtual proxy position.
The paper exemplifies the application of the methodology by calculating three frequency-based haptic scales: a three-note, a five-note, and a seven-note haptic scale, for a particular haptic device. We demonstrated that the use of a frequency-based haptic tuning fork combined with our methodology to define haptic scales improved the users’ ability to discriminate different haptic stimuli. The results of our experiments are compiled in a summary table available in the Supplementary Materials.
Our experiment results proved that the use of the haptic tuning fork facilitates the identification of the frequency. The frequency identification hit rate improved in our experiments around 20% for complex scales when using the haptic tuning fork. Furthermore, our experiments prove that when increasing the number of haptic icons, the effect of the haptic tuning fork becomes more relevant.
We tested the haptic tuning fork in complex scenarios in which the user had to perform tasks (involving selective and divided attention) while being aware of randomly presented haptic stimuli (from a seven-note sinusoidal frequency-based haptic scale), where each individual haptic icon was perceived just once. Results in our experiment proved that the use of the haptic tuning fork led to an improvement higher than 20% in the hit rate in this kind of environment.
Specifically, in one of our experiments, users were able to identify 15 different haptic icons. The scope of this work is limited to demonstrating the usefulness of the haptic tuning fork in improving the discrimination of different haptic icons. It remains for future work to investigate what would be the maximum number of distinguishable haptic icons depending on the different haptic devices.
Previous works reached distinguishable sets of 84 stimuli, however, this number was reached by using rhythm [39]. Similarly, in Swerdfeger’s Dissertation [48] participants identified on average about 16 rhythm icons under no workload, after about three 20 min sessions for four weeks and one week without any exposure to haptic icons. Regarding haptic stimuli not including rhythm, in Maclean et al. [32], users were able to distinguish between 36 non-rhythmical different stimuli but, as highlighted in Ternes et al. [39], “distinguishability is not the same as the ability to independently recognise and identify individual items”. However, in Maclean et al., users had to sort stimuli that they could “feel” as many times as desired to classify them into different groups, in our work, after the familiarisation and training phases (that lasted less than 5 min) users were asynchronously presented with random haptic icons that they could “feel” just once and had to recognise and identify them.
Despite the limited number of subjects of our experiments, results showed significant differences when using the haptic tuning fork. A disadvantage, however, is that the inclusion of the haptic tuning fork lengthens the duration of the haptic signal.
In subsequent work, we intend to apply this technique to attach haptic icons to filiform structures in two different domains in which we are already working: the development of a tool for visually-impaired people to explore, analyse, and comprehend electrical circuits [49] and the visualisation of neuroscientific abstract data on the topology of neurons of the neurons. Regarding the latter example, performing a deep topological analysis of neural columns is a complex task due to the large number of neurons and their intricate structure of connections. The column structure can be seen as a filiform set of linked elements and its visual exploration often presents cluttering issues. Previous works have propose different techniques to navigate through connected filiform data sets [8,50], giving additional clues to understand the topology. We plan to test the use of haptic textures to incorporate additional information and alleviate the visual cluttering problem.
Supplementary Materials
The following are available at https://0-www-mdpi-com.brum.beds.ac.uk/article/10.3390/app11188772/s1: Table S1: Summary of experiments, Table S2: Entropy of the faithfully transmitted information (), Table S3: Sent information entropy (), Table S4: User response entropy (), and Table S5: Stimulus-response entropy ().
Author Contributions
Conceptualization, L.R., M.G.-L. and S.B.; Formal analysis, S.B., L.R., M.G.-L. and S.A.B.; Funding acquisition, M.G.-L. and S.B.; Methodology, L.R., M.G.-L. and S.B.; Software, L.R., S.A.B. and M.G.-L.; Supervision, M.G.-L. and S.B.; Validation, S.B., L.R., S.A.B. and M.G.-L.; Writing—Original draft, L.R., M.G.-L. and S.B.; Writing—Review & editing, L.R., M.G.-L. and S.B. All authors have read and agreed to the published version of the manuscript.
Funding
The research leading to these results has received funding from the following entities: Spanish Ministry of Economy and Competitiveness under grant TIN2017-83132-C2-1-R (VIANA), as well as from the European Union’s Horizon 2020 Framework Programme for Research and Innovation under the Specific Grant Agreements No. 785907 (Human Brain Project SGA2) and 945539 (Human Brain Project SGA3).
Institutional Review Board Statement
Not applicable. This research is exempt from Ethics Committee approval, since the tests were performed on healthy subjects and did not involve the application of invasive procedures, the use of drugs, the use of biological samples or the use of sensitive personal data. The performance of the tests in no way compromised the mental or physical health of the participants. Recruitment of subjects was voluntary, unpaid, and did not include students. The subjects were previously informed about the study, were given instructions about the computer application program and the questions they had to answer about it, signed the informed consent, and could leave the study at any time without giving any reasons. The only anonymous personal data collected were age, sex and dominant hand.
Informed Consent Statement
Informed consent was obtained from all subjects involved in the study.
Data Availability Statement
The data presented in this study are available in Supplementary Materials.
Conflicts of Interest
The authors declare no conflict of interest.
Abbreviations
The following abbreviations are used in this manuscript:
| HDV | Haptic Data Visualisation |
| JND | Just-Noticeable Difference |
References
- Lee, H.Y.; Ong, H.L.; Quek, L.H. Exploiting Visualization in Knowledge Discovery. In Proceedings of the First International Conference on Knowledge Discovery and Data Mining, Montreal, QC, Canada, 20–21 August 1995; pp. 198–203. [Google Scholar]
- Fodor, I. A Survey of Dimension Reduction Techniques; Technical Report; Lawrence Livermore National Laboratory: Livermore, CA, USA, 2002. [Google Scholar]
- Mohammed, A.M. High-Dimensional Data in Scientific Visualization: Representation, Fusion and Difference. Ph.D. Thesis, Virginia Polytechnic Institute and State University, Blacksburg, VA, USA, 2017. [Google Scholar]
- Rocha, A.; Silva, J.D.; Alim, U.; Sousa, M.C. Multivariate Visualization of Oceanography Data Using Decals. In Workshop on Visualisation in Environmental Sciences (EnvirVis); Rink, K., Middel, A., Zeckzer, D., Bujack, R., Eds.; The Eurographics Association: Geneve, Switzerland, 2017. [Google Scholar] [CrossRef]
- Liu, Z.; Jiang, B.; Heer, J. imMens: Real-time Visual Querying of Big Data. In Proceedings of the 15th Eurographics Conference on Visualization, Leipzig, Germany, 17–21 June 2013; The Eurographs Association; John Wiley & Sons, Ltd.: Chichester, UK, 2013; pp. 421–430. [Google Scholar]
- Fritz, J.P.; Barner, K.E. Design of a haptic data visualization system for people with visual impairments. IEEE Trans. Rehabil. Eng. 1999, 7, 372–384. [Google Scholar] [CrossRef] [PubMed]
- Taylor, R.M., II. Haptics for Scientific Visualization. In ACM SIGGRAPH 2005 Courses; ACM: New York, NY, USA, 2005. [Google Scholar]
- Raya, L.; Otaduy, M.; Garcia, M. Haptic navigation along filiform neural structures. In Proceedings of the World Haptics Conference (WHC), Istanbul, Turkey, 21–24 June 2011; pp. 71–76. [Google Scholar]
- Paneels, S.; Ritsos, P.; Rodgers, P.; Roberts, J. Prototyping 3D haptic data visualizations. Comput. Graph. 2013, 37, 179–192. [Google Scholar] [CrossRef]
- Panëels, S.A.; Roberts, J.C. Review of Designs for Haptic Data Visualization. IEEE Trans. Haptics 2010, 3, 119–137. [Google Scholar] [CrossRef] [PubMed] [Green Version]
- Brown, L.; Brewster, S.; Purchase, H. Investigation into the effectiveness of Tactons. In Proceedings of the First Joint Eurohaptics Conference and Symposium on Haptic Interfaces for Virtual Environment and Teleoperator Systems, Pisa, Italy, 18–20 March 2005; pp. 167–176. [Google Scholar]
- Ravikanth, D.; Hariharan, P. Psychophysics Experiment to Check the Temperature Impacts Over Human Fingertips for the Application of Textural Applications in Haptics Technology. Arab. J. Sci. Eng. 2021, 46, 7265–7272. [Google Scholar] [CrossRef]
- Prins, N. Psychophysics: A Practical Introduction; Academic Press: Cambridge, MA, USA, 2016. [Google Scholar]
- Jones, L.A.; Tan, H.Z. Application of psychophysical techniques to haptic research. IEEE Trans. Haptics 2013, 6, 268–284. [Google Scholar] [CrossRef] [PubMed] [Green Version]
- Yu, W.; Ramloll, R.; Brewster, S.; Ridel, B. Exploring Computer-Generated Line Graphs Through Virtual Touch. In Proceedings of the 6th International Symposium on Signal Processing and its Applications (ISSPA), Kuala Lumpur, Malaysia, 13–16 August 2001; pp. 72–75. [Google Scholar]
- Weber, E.H.; Ross, H.E.; Murray, D.J. E.H. Weber on the Tactile Senses; Psychology Press: Hove, UK, 1996. [Google Scholar]
- House, H. Falcon 3D Touch Haptic Controller. 2012. Available online: https://hapticshouse.com/pages/novints-falcon-haptic-device (accessed on 1 August 2021).
- Ruspini, D.C.; Kolarov, K.; Khatib, O. The Haptic Display of Complex Graphical Environments. In SIGGRAPH ’97 Proceedings of the 24th Annual Conference on Computer Graphics and Interactive Techniques; ACM Press/Addison-Wesley Publishing Co.: New York, NY, USA, 1997; pp. 345–352. [Google Scholar]
- Menelas, B.; Ammi, M.; Bourdot, P.; Richir, S. Survey on haptic rendering of data sets: Exploration of scalar and vector fields. J. Virtual Real. Broadcast. 2009, 6, 1–11. [Google Scholar] [CrossRef]
- Todorović, D. Context effects in visual perception and their explanations. Rev. Psychol. 2010, 17, 17–32. [Google Scholar]
- Whitney, D.; Levi, D.M. Visual crowding: A fundamental limit on conscious perception and object recognition. Trends Cogn. Sci. 2011, 15, 160–168. [Google Scholar] [CrossRef] [PubMed] [Green Version]
- Sanfilippo, F.; Pacchierotti, C. A Low-Cost Multi-modal Auditory-Visual-Tactile Framework for Remote Touch. In Proceedings of the 2020 3rd International Conference on Information and Computer Technologies (ICICT), San Jose, CA, USA, 9–12 March 2020; pp. 213–218. [Google Scholar] [CrossRef]
- Panëels, S.A.; Roberts, J.C.; Rodgers, P.J. Haptic Interaction Techniques for Exploring Chart Data. In Proceedings of the Haptic and Audio Interaction Design: 4th International Conference, HAID 2009, Dresden, Germany, 10–11 September 2009; Volume 5763, p. 31. [Google Scholar]
- Hajas, D.; Pittera, D.; Nasce, A.; Georgiou, O.; Obrist, M. Mid-Air Haptic Rendering of 2D Geometric Shapes with a Dynamic Tactile Pointer. IEEE Trans. Haptics 2020, 13, 806–817. [Google Scholar] [CrossRef] [PubMed] [Green Version]
- Loftin, R.B. Multisensory perception: Beyond the visual in visualization. Comput. Sci. Eng. 2003, 5, 56–58. [Google Scholar] [CrossRef]
- Roberts, J.C. Display Models—Ways to classify visual representations. Int. J. Comput. Integr. Des. Constr. 2000, 2, 241–250. [Google Scholar]
- Parente, P.; Bishop, G. BATS: The Blind Audio Tactile Mapping System. In Proceedings of the ACM South Eastern Conference, New York, NY, USA, 4–6 April 2003. [Google Scholar]
- Wall, S.; Brewster, S. Tac-tiles: Multimodal pie charts for visually impaired users. In Proceedings of the 4th Nordic Conference on Human-Computer Interaction: Changing Roles, Oslo, Norway, 14–18 October 2006. [Google Scholar]
- Roberts, J.C.; Franklin, K.M.; Cullinane, J. Virtual haptic exploratory visualization of line graphs and charts. In Stereoscopic Displays and Virtual Reality Systems IX; International Society for Optics and Photonics: Bellingham, WA, USA, 2002; Volume 4660, pp. 401–410. [Google Scholar]
- Siirtola, H.; Mäkinen, E. Constructing and Reconstructing the Reorderable Matrix. Inf. Vis. 2005, 4, 32–48. [Google Scholar] [CrossRef]
- Yi, D.; Hayward, V. Augmenting computer graphics with haptics for the visualization of vessel networks. In Proceedings of the 10th Pacific Conference on Computer Graphics and Applications, Beijing, China, 9–11 October 2002; pp. 375–384. [Google Scholar]
- Maclean, K.; Enriquez, M. Perceptual design of haptic icons. In Proceedings of the Eurohaptics, Dublin, Ireland, 6–9 July 2003; pp. 351–363. [Google Scholar]
- Brewster, S.; Brown, L.M. Tactons: Structured Tactile Messages for Non-visual Information Display. In Proceedings of the Fifth Conference on Australasian User Interface, Dunedin, New Zealand, 18–22 January 2004; pp. 15–23. [Google Scholar]
- Yu, W.; Ramloll, R.; Brewster, S.A. Haptic Graphs for Blind Computer Users. In Proceedings of the First International Workshop on Haptic Human-Computer Interaction; Springer: London, UK, 2001; pp. 41–51. [Google Scholar]
- Chan, A.; MacLean, K.; McGrenere, J. Learning and identifying haptic icons under workload. In Proceedings of the First Joint Eurohaptics Conference and Symposium on Haptic Interfaces for Virtual Environment and Teleoperator Systems, Pisa, Italy, 18–20 March 2005; pp. 432–439. [Google Scholar]
- Schneider, J.; Strothotte, T. Constructive Exploration of Spatial Information by Blind Users. In Proceedings of the Fourth International ACM Conference on Assistive Technologies, Arlington, VA, USA, 18–22 October 2000; pp. 188–192. [Google Scholar]
- Yu, W.; Brewster, S. Multimodal virtual reality versus printed medium in visualization for blind people. In Proceedings of the Fifth International ACM Conference on Assistive Technologies, Edinburgh, UK, 8–10 July 2002; pp. 57–64. [Google Scholar]
- Yu, W.; Brewster, S. Comparing Two Haptic Interfaces for Multimodal Graph Rendering. In Proceedings of the 10th Symposium on Haptic Interfaces for Virtual Environment and Teleoperator Systems, IEEE Computer Society, Orlando, FL, USA, 24–25 March 2002; pp. 3–9. [Google Scholar]
- Ternes, D.; MacLean, K.E. Designing Large Sets of Haptic Icons with Rhythm. In Proceedings of the Haptics: Perception, Devices and Scenarios: 6th International Conference, EuroHaptics 2008, Madrid, Spain, 10–13 June 2008; Ferre, M., Ed.; Springer: Berlin/Heidelberg, Germany, 2008; pp. 199–208. [Google Scholar] [CrossRef]
- Seifi, H.; Zhang, K.; MacLean, K.E. VibViz: Organizing, visualizing and navigating vibration libraries. In Proceedings of the 2015 IEEE World Haptics Conference (WHC), Evanston, IL, USA, 22–26 July 2015; pp. 254–259. [Google Scholar] [CrossRef]
- Clark, B.; Schneider, O.S.; MacLean, K.E.; Tan, H.Z. Predictable and distinguishable morphing of vibrotactile rhythm. In Proceedings of the 2017 IEEE World Haptics Conference (WHC), Munich, Germany, 6–9 June 2017; pp. 84–89. [Google Scholar] [CrossRef]
- Van Erp, J.B.; Spapé, M.M. Distilling the underlying dimensions of tactile melodies. In Proceedings of the Eurohaptics, Dublin, Ireland, 6–9 July 2003; pp. 111–120. [Google Scholar]
- Appelle, S.; Heller, M.; Schiff, W. Haptic perception of form: Activity and stimulus attributes. In The Psychology of Touch; Psychology Press: Hove, UK, 1991; pp. 169–188. [Google Scholar]
- Gibson, J.J. Observations on active touch. Psychol. Rev. 1962, 69, 477. [Google Scholar] [CrossRef] [PubMed]
- De Valois, R.L.; De Valois, K.K. Spatial Vision; Oxford University Press: Oxford, UK, 1988. [Google Scholar]
- Booth, D.; Freeman, R. Discriminative measurement of feature integration. Acta Psychol. 1973, 84, 1–16. [Google Scholar] [CrossRef]
- Chabris, C.; Simons, D. The Invisible Gorilla; Crown Publishing Group: New York, NY, USA, 2010. [Google Scholar]
- Swerdfeger, B.A. A First and Second Longitudinal Study of Haptic Icon Learnability: The Impact of Rhythm and Melody. Ph.D. Dissertation, University of British Columbia, Vancouver, BC, Canada, 2009. [Google Scholar]
- Boga, S.A.; Garre, C.; Sanchez, A.; Raya, L. Visualización háptica en entornos educativos orientados a estudiantes con discapacidad visual. In Proceedings of the IV Conference on Teaching Innovation and IT Technologies, Valencia, Spain, 4–5 March 2013. [Google Scholar]
- Raya, L.; Bayona, S.; Pastor, L.; Garcia, M. A New User-Adapted Search Haptic Algorithm to Navigate along Filiform Structures. IEEE Trans. Haptics 2014, 7, 273–284. [Google Scholar] [CrossRef] [PubMed]
Figure 1.
Example of haptic icons. Our haptic icons consist of two signals: a fixed reference signal (the haptic tuning fork) and a signal that codifies the abstract information (haptic note). Since we are testing the idea of using a reference signal in kinesthetic devices, they are rendered as displacement applied to the proxy position in the surface-normal direction. This displacement is shown in the y-axis, while the x-axis represents 2 s. The first second is used to render a 4 Hz haptic tuning fork and then the haptic note. Please, note that the values of the haptic notes have been simplified to 2, 4, and 8 Hz to make the figure clearer. Those values do not correspond to actual values from our frequency-based haptic scales.

Figure 2.
Experimental setup. The subject wears headphones (to avoid hearing the motors of the haptic device) while the box in front of the subject prevents from seeing the haptic device.
Figure 2.
Experimental setup. The subject wears headphones (to avoid hearing the motors of the haptic device) while the box in front of the subject prevents from seeing the haptic device.

Figure 3.
Hit rate results for Experiment A.

Figure 4.
Interaction effect charts for Experiment A.

Figure 5.
Subjective results for Experiment A.

Figure 6.
Experiment B results.

Publisher’s Note: MDPI stays neutral with regard to jurisdictional claims in published maps and institutional affiliations. |
© 2021 by the authors. Licensee MDPI, Basel, Switzerland. This article is an open access article distributed under the terms and conditions of the Creative Commons Attribution (CC BY) license (https://creativecommons.org/licenses/by/4.0/).
Share and Cite
MDPI and ACS Style
Raya, L.; Boga, S.A.; Garcia-Lorenzo, M.; Bayona, S. Improving the Discriminability of Haptic Icons: The Haptic Tuning Fork. Appl. Sci. 2021, 11, 8772. https://0-doi-org.brum.beds.ac.uk/10.3390/app11188772
AMA Style
Raya L, Boga SA, Garcia-Lorenzo M, Bayona S. Improving the Discriminability of Haptic Icons: The Haptic Tuning Fork. Applied Sciences. 2021; 11(18):8772. https://0-doi-org.brum.beds.ac.uk/10.3390/app11188772
Chicago/Turabian StyleRaya, Laura, Sara A. Boga, Marcos Garcia-Lorenzo, and Sofia Bayona. 2021. "Improving the Discriminability of Haptic Icons: The Haptic Tuning Fork" Applied Sciences 11, no. 18: 8772. https://0-doi-org.brum.beds.ac.uk/10.3390/app11188772
Note that from the first issue of 2016, this journal uses article numbers instead of page numbers. See further details here.