Article

Vibrations Analysis of the Fruit-Pedicel System of Coffea arabica var. Castillo Using Time–Frequency and Wavelets Techniques

by
Carlos I. Cardona
1,
Hector A. Tinoco
1,2,3,*,
Luis Perdomo-Hurtado
1,
Juliana López-Guzmán
1 and
Daniel A. Pereira
4
1
Experimental and Computational Mechanics Laboratory, Universidad Autónoma de Manizales, Antigua Estación del Ferrocarril, Manizales 170001, Colombia
2
Institute of Physics of Materials, Czech Academy of Sciences, Žižkova 22, 616 00 Brno, Czech Republic
3
Central European Institute of Technology, Brno University of Technology, Purkyňova 656/123, 612 00 Brno, Czech Republic
4
Department of Automatics (DAT), Federal University of Lavras (UFLA), P.O. Box 3037, Lavras 37200-000, MG, Brazil
*
Author to whom correspondence should be addressed.
Submission received: 1 August 2021 / Revised: 17 September 2021 / Accepted: 23 September 2021 / Published: 8 October 2021
(This article belongs to the Topic Applied Sciences in Functional Foods)

Abstract

:
Colombian coffee production is well-known, and selective manual harvesting plays a vital task in guaranteeing high ripe coffee fruit rates in this process, leading to its known worldwide aroma and flavor. To maintain this quality approach, selective harvesting methods based on mechanical vibrations are a promising alternative for developing technologies that could accomplish the challenging Colombian coffee production context. In this study, a vibrations analysis in coffee fruits at three ripening stages was carried out to evaluate the dynamic behavior at two frequency windows: 10 to 100 Hz and 100 to 1000 Hz. Two groups of fruits previously classified in the CIELab color space were chosen for the vibration test study samples. Time and frequency signals were characterized via FFT (fast Fourier transform), and bump wavelets were determined to obtain the frequency–time magnitude scalograms. The measurements were obtained in three degrees of freedom over the fruits: one for measuring the input force (computed in voltage way) and the other two measured by the velocity. The results revealed frequency ranges with specific resonant peaks between 24 and 45 Hz, and close to 700 Hz, where the ripe fruits presented higher magnitudes in the calculated parameters. FFT of the velocity and scaled mechanical impedance were used to estimate these frequency ranges. This work is an important step to identify a “vibrational fingerprint” of each Coffea arabica var. Castillo fruit-ripening stage. However, we consider that more experiments should be performed to reconstruct the modal shape in each resonance. In future studies, fatigue analysis could show which are the most effective frequency ranges to detach the ripe fruits from the perspective of a real selective coffee-harvesting scenario.

1. Introduction

Since the last decade, the Colombian coffee industry has experienced a decrease in the hand-pickers labor force that threatens its worldwide known quality and economic viability [1]. This critical issue is related to different sociocultural and economic factors [2], leading to a sizeable diminishing workforce. Hand picking has been the traditional harvesting technique due to the coffee crops being normally located in regions with irregular geography characterized by mountains that have difficult access for any machinery [3]. Moreover, the hand-picking is based on a selective process in which a high proportion of ripe against unripe coffee fruit ratio is guaranteed, giving the characteristic quality of the Colombian coffee as an exportation product [4].
The average labor productivity in the picking process of the Colombian coffee region is 82.6 kg of coffee cherries per workday, and this process accounts for over 75% of the labor requirement [5]. For these reasons, the mechanized harvesting process has gained attention as an imperative strategy to overcome the lack of labor force and to guarantee the Colombian coffee future. Mechanical harvesting has been successfully implemented and used in different crops such as olives [6], grapes [7], strawberries [8], and even coffee [9]. However, at this moment, the introduction of machinery to access the Colombian mountain slopes is seen as unfeasible. Despite some improvement and adaptation of mechanical or semi-mechanical techniques proposed to reach an optimal ripe—unripe coffee fruit ratio [10,11], these approaches have not been successful implemented.
The complexity of selective coffee harvesting tasks also depends on the three characteristics, such as the plant shape, height, length, and width differences [12]. Furthermore, each branch has uneven fruit ripeness [13], where each ripening stage has its own mechanical [14] and geometrical [15,16] properties.
The mechanical harvesting methods generally used in industry are limb shaking, air blasting, canopy shaking, and trunk shaking [17]. These technologies use low-frequency vibrations to harvest different kinds of crops as apples [18], olives [19], citrus [20], and cherry [21], among others. However, some proposals based on portable shakers were studied to accomplish a high ripe–total harvested fruits ratio, but these just reached values between 13 and 70% [11]. Higher detachments in ripe fruits than in unripe fruits were found when a shaker was implemented to excite a coffee branch to estimate the appropriate frequency, amplitude, and vibration time to detach fruits [22]. Shaking the entire coffee tree could conduce to plant death [23], high leaf, and branch detachment [24]. Nevertheless, semi-mechanical harvesting based on vibrations could be a promising approach if the coffee fruits were stimulated at their characteristic modal frequencies that vary at each ripening stage, as studied by [14].
The fruit–peduncle system becomes the main substructure to be analyzed for selective harvesting with the aim to understand the mechanics of the detachment based on vibrations [25,26]. The fruit–peduncle’s vibrational frequencies were experimentally [11,22,26] and semi-theoretically [14,27] screened, producing 20 possible natural frequencies and their associated vibration modes, respectively. Discrete frequency values have been applied for coffee Arabica compared with the dynamic, flexible body model [28]. Improving the frequency drag span could reveal hidden significant differences in vibrational frequencies between ripening stages [29].
Recent works have applied low and high-frequencies and video magnification analysis for colorimetric characterized coffee ripening stages [29]. However, the coffee time–frequency signals present noise and abrupt changes that hinder the frequency characterization [30]. Consequently, to accurately analyze frequency signals with sudden fluctuations, we require functions that are well localized in time and frequency as wavelets [31]. This approach was implemented for almond time–frequency signals where wavelet filtering improved the displacement estimate [32].
In this work, the oscillatory behavior in coffee time–frequency signals has been characterized using traditional frequency, time analysis, and continuous wavelet transform (CWT). The substructure fruit–peduncle dynamic behavior was characterized over low (10 to 100 Hz) and high frequencies (100 to 1000 Hz). Time and frequency signals have been characterized by applying traditional fast Fourier transform (FFT) to velocity response over two coffee fruit orthogonal directions [16]. Wavelets analysis was performed to determine frequency–time magnitude scalograms [33]. The present work aims to identify a “vibrational fingerprint” of each Coffea arabica var. Castillo fruit-ripening stage identified by colorimetric techniques [34].
These findings are a crucial step toward selective harvesting frequencies that could finally improve the effectiveness of semi-mechanized tools. There are no studies exposing coffee branch fruits to high frequencies where fatigue and fracture phenomena could occur. Specific vibrations that transmit maximum oscillations in the fruit–peduncle substructure could promote the ripe fruit detachment [15]. It is crucial to highlight that a slight change in frequency promotes ripe fruit detachment instead of unripe [29]. A robust vibrational analysis might characterize each ripening stage employing a complete frequency drag.
In the materials and methods section, the description of the theory of CIELab chromaticity is given to classify of the coffee-ripening stage. The wavelet theory is also shown for carrying out the vibration analysis, which is the primary goal of our study. Then, the experiment for the vibration analysis carried out in selected fruit samples is detailed in the experimental setup. Finally, the results are presented, and a discussion is done concerning the obtained vibrations scalograms. Several conclusions are highlighted, arguing the main differences in the dynamics of the tested ripening stages. Finally, prominent future research and applications are suggested.

2. Materials and Methods

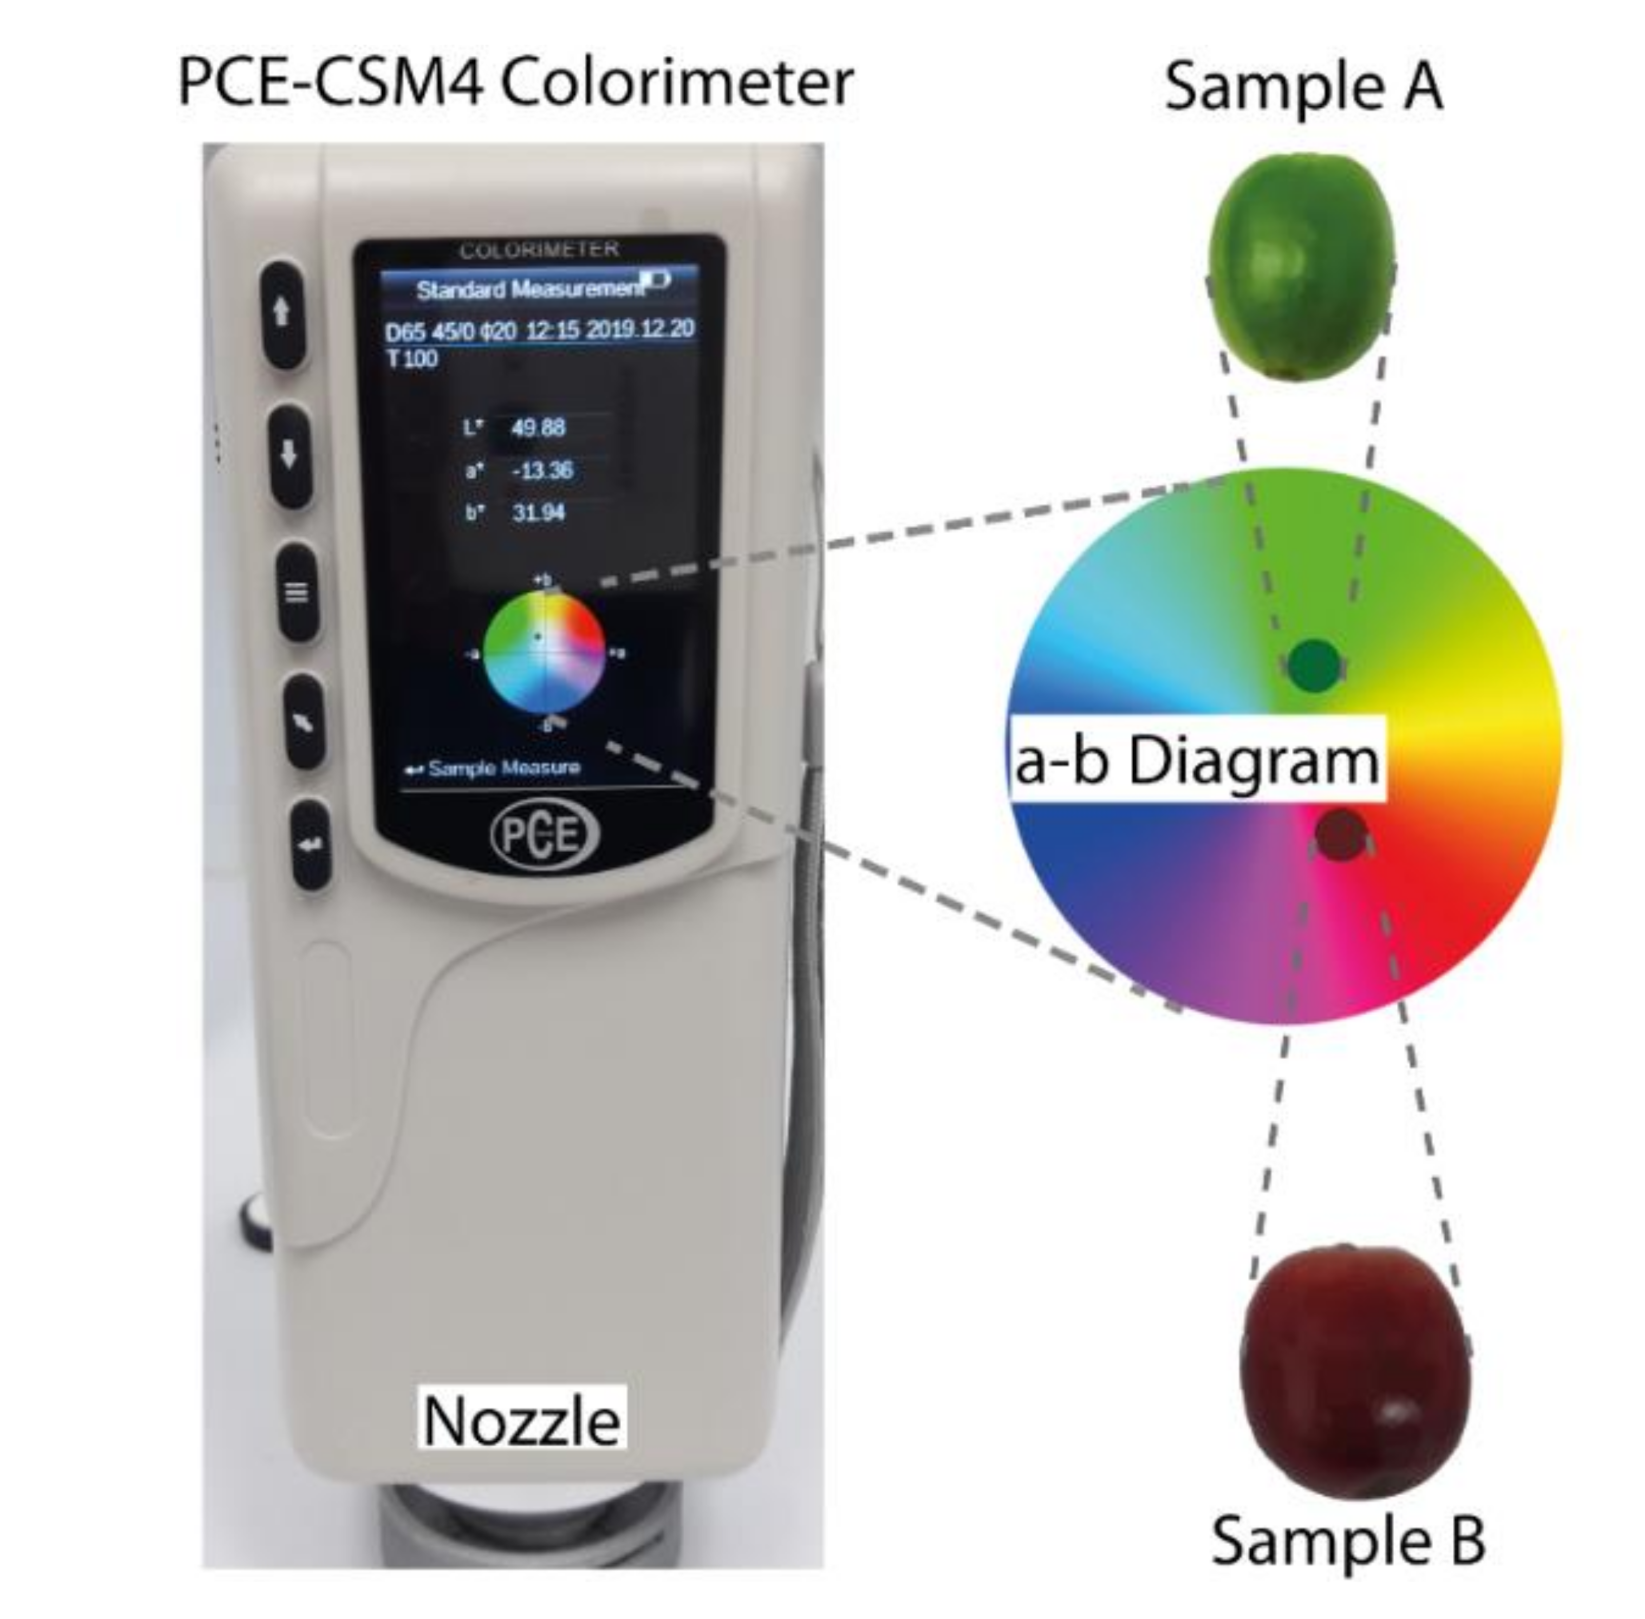
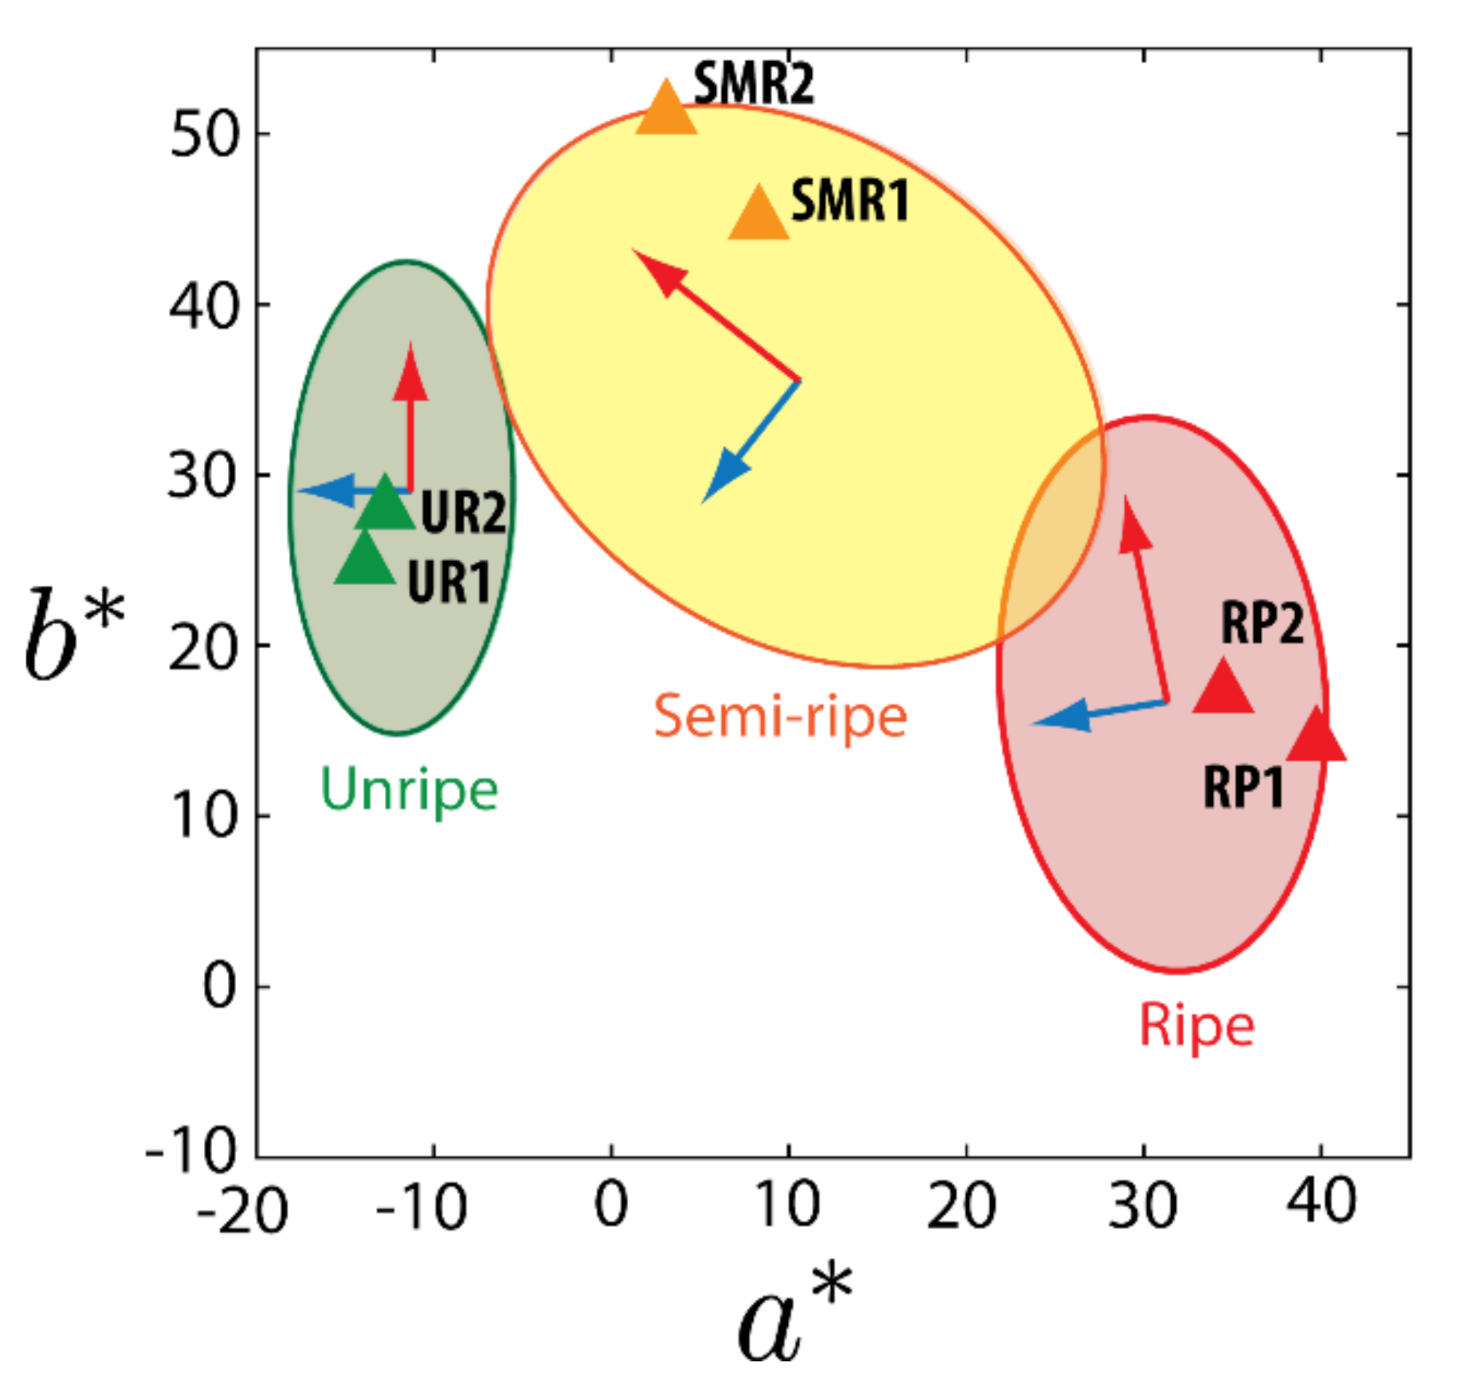
2.1. Ripening Stages Classification Based on Color CIELab Chromaticity

A color space allows the representation of color at a visible light range in a three-dimensional system [28]. The CIELab is a uniform color space whose representation is composed by the axes L * , a * , and b * [30]. a * is the gradient from green to red colors, and b * is the gradient from blue to yellow and color as depicted in Figure 1. Moreover, L * represents the lightness gradient. For each ripening stage, a domain was computed through Gaussian distribution. This domain embodies the probability that the a * and b * values can be inside the interval defined by cluster separation according to the following distribution:
N ( μ , σ ) = 1 σ 2 π e ( x μ ) 2 2 σ 2 , .
Here, μ is the mean of color data, σ is the standard deviation, a * and b * are values of data represented by x [31]. The distribution functions are calculated as N a and N b in each color direction. The covariance matrix correlates this as follows
C = σ a 2 σ a b σ b a σ b 2 .
σ a 2 and σ b 2 are variances; σ a b and σ b a are crossed covariances. This matrix allows setting up an eigenvalues problem as
C x = λ x ,
where λ max and λ min are the maximum amplitudes of data variation in each ripening stage represented by the eigenvalue. The data clusters are delimited by ellipses oriented at the principal direction depending on the eigenvectors λ = λ a i + λ b j , and i and j are unit vectors. Hence, the principal direction of each data is determined by:
β = tan 1 λ b λ a .
Scaling the principal axes by a factor of α = 2.4477 (chi-square), a confidence domain of 95% is reached. Each ripening stage is represented by the following expression, which describes a rotated ellipse β with maximum amplitudes λ max and λ min
a μ a cos ( β ) + b μ b sin ( β ) 2 λ max 2 + a μ a sin ( β ) + b μ b cos ( β ) 2 λ min 2 = 1 .
In this study, the ripeness stages of coffee fruits (Coffea arabica var. Castillo) were classified through measurements in the CIELab color space. Samples were detached from a 2-year-old coffee tree from a farm located in Belalcazar, Caldas (Colombia). The environmental conditions of the farm were 25.2 °C temperature, 75.9 kPa of atmospheric pressure, 81% of relative humidity, 3 km/h west–northwest direction of wind speed, 1352 m of altitude, with coordinates 5°0′40″, 75°47′44″. The color of each fruit was measured with a PCE CSM 4 colorimeter, as shown in Figure 1.
After carrying color measurements out in 84 fruits, three data clusters were established over a * and b * values; then, a classification by data covariance was applied. Three ripening stages represented by three ellipses domains resulted from the covariance calculations depicted in Figure 2. For the present study, two groups of fruits of three ripening stages (unripe, semi-ripe, and ripe) were chosen as study samples for a vibrations analysis. These samples were initially classified by color and located in their corresponding ellipse space, as detailed in Figure 2. Unripe fruits were labeled as UR, semi-ripe were labeled as SMR, and ripe were labeled as RP. The parameters of the ellipses that describe the three studied ripening stages dataset for the previous 84 fruits are listed in Table 1.
The coffee fruits’ geometrical and physical properties selected as study samples are listed in Table 2. The pedicel length was defined as 3.4 mm for all the ripening stages to have a fixed parameter. In the selected samples, minor deviations are presented in each ripening state for the orthogonal diameters and mass, which means that a pair of samples were selected with close physical and geometrical properties.

2.2. Wavelets

Wavelet transform is a valuable processing tool for localized signal analysis, avoiding loosely contained spectral information. This signal analysis approach can achieve long and short time intervals for low and high-frequency information, respectively. Moreover, wavelet analysis can reveal hidden data information that is not detectable from other signal processing approaches. This is a remarkable advantage, particularly in applications such as detecting crack initiation and propagation resulting from damage scenarios in structures [35].
A wavelet is a waveform that occurred in a specific time interval and can be described in the general form as
ψ ( t ) d t = 0 .
The continuous wavelet transform (CWT) is defined as
W ( x , y ) = 1 x f ( t ) ψ * t y x d t  
where ψ * is the complex conjugate of the kernel wavelet ψ , while x and y are scale and translation parameters, respectively. The function ψ is represented as
ψ j , k ( t ) = 2 j / 2 ψ ( 2 j t k ) .
When x is 0 < x ≪ 1, narrow windows are presented, which is suitable for high-frequency components in the signal in time domain f ( t ) . On the other hand, much wider windows result when x is x ≫ 1, which is appropriate for the low-frequency components in the signal. As explained by Heisenberg inequality, the resolution in frequency and time fulfills the relationship:
Δ t Δ f 1 4 π
where Δ f can be used to compute the constant C as
Δ f f = C .
So, a good resolution in time is achieved at high frequencies, while frequency resolution becomes good at low frequency [36]. This fact permits going further than short-time Fourier transform (STFT) that keeps fixed the time-frequency resolution. For the existence of an inverse wavelet transform, the admissibility condition is
ψ ( ω ) 2 ω d ω <
where ψ is the Fourier transform of ψ [37]. Equation (1) could be written as
W ( x , y ) = f ( t ) , ψ x , y * ( t ) .
Thus, CWT is a compilation of the inner products of a signal f ( t ) and the wavelets ψ x , y ( t ) that results from the translation and the scaling. In addition, the reciprocal of the frequency resulting from a can be computed as follows:
F ψ ( t / x ) = x ψ ( x ω ) .
where F ψ ( t / x ) is the Fourier transform [36,37] (Debuchies, 1992; Kim and Melhem, 2004). A suitable choice for the Kernel function is the Bump Wavelet [38,39], which has as the main feature the wider variance in time and narrower variance in frequency. The Fourier transform of the analytic bump wavelet, with parameters μ and σ , is
ψ ^ ( s ω ) = e ( 1 1 1 ( s ω μ ) 2 / σ 2 x [ ( μ σ ) / s , ( μ + σ ) / s ]
where x [ ( μ σ ) / s , ( μ + σ ) / s ] is the indicator function for the interval ( μ σ ) / s ω ( μ + σ ) / s , as detailed in [40].

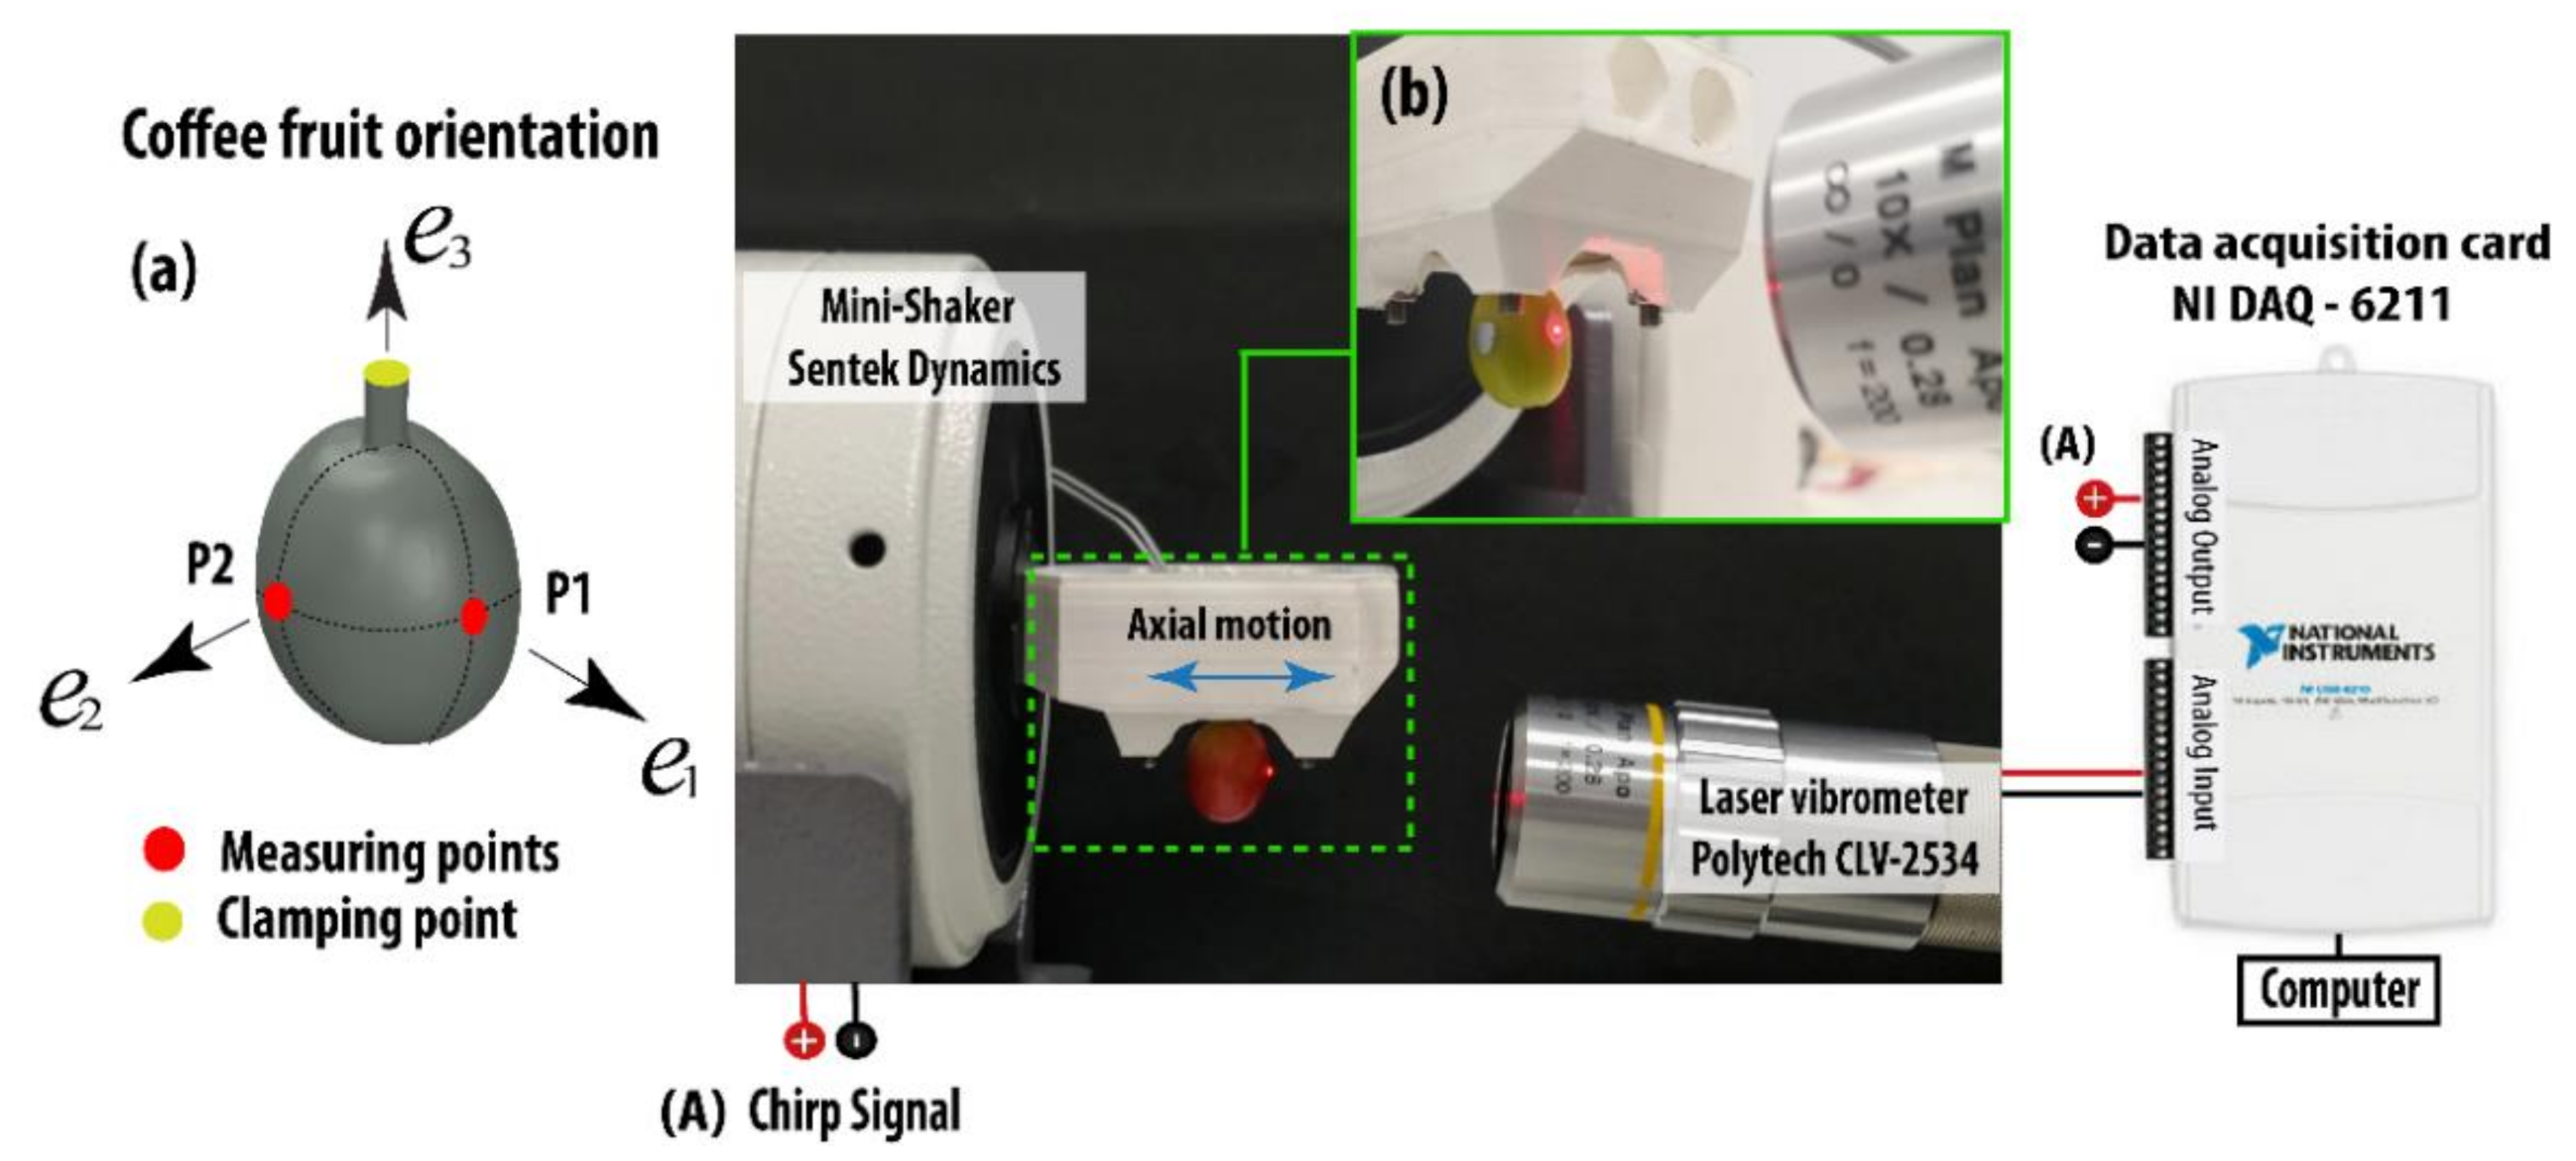
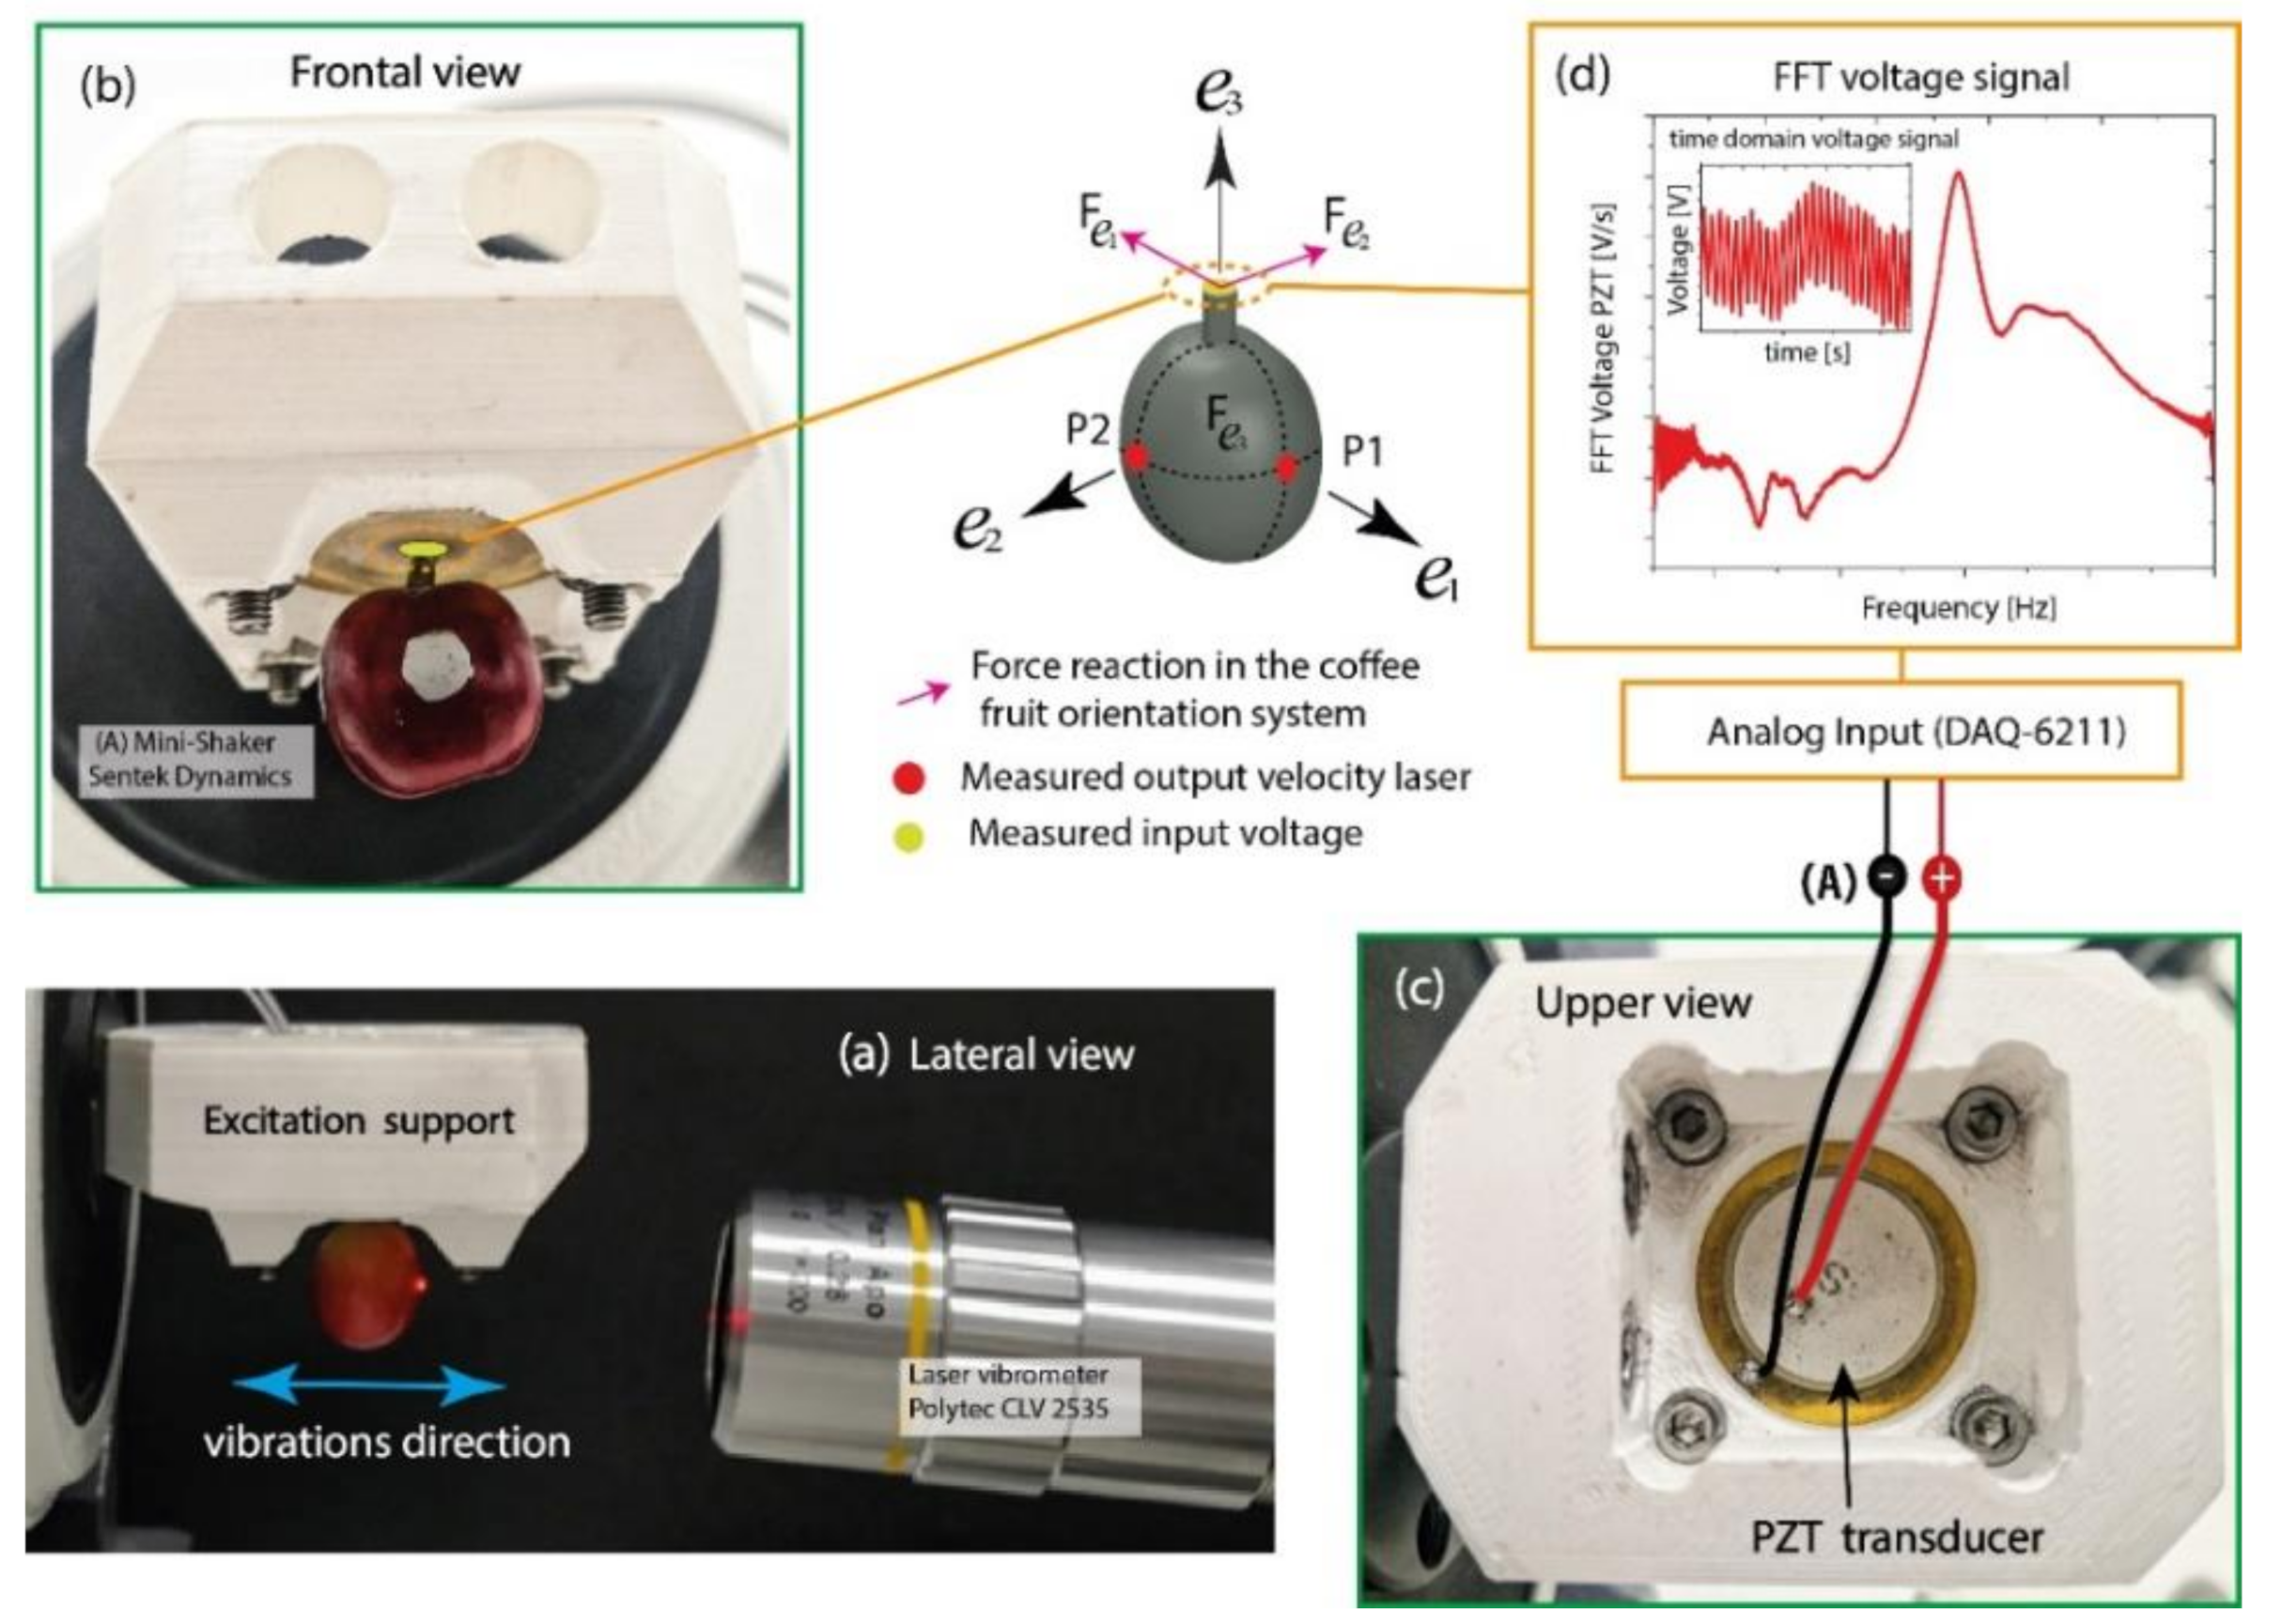
2.3. Experimental Setup for Determining Frequency Response Functions

In this section, an experimental setup was applied to evaluate the dynamic behavior of coffee fruits analyzing their response functions in time and frequency. Therefore, the primary sense of this experiment is to compute the dynamic response of the six coffee fruits classified previously and listed in Table 2. For that purpose, experiments were executed for pairs of fruits of the same ripening stage, which means that two groups of samples were evaluated. Each fruit was dynamically tested using an electrodynamic shaker (Mini shaker, Sentek Dynamics, Santa Clara, CA, USA) that applies the vibrations through a 3D-printed support fastened to it. Input motions were applied to the fruits in two different degrees of freedom according to the fruit orientation system e 1 - e 2 - e 3 . For our case, points P1 and P2 were assigned for the orientations e 1 and e 2 , as illustrated in Figure 3a. The support was prototyped in a PLA (polylactic acid) frame with a piezoelectric transducer (brass platform) at the core to hold from the pedicel the fruit joined using a layer of epoxy adhesive, as shown in Figure 3b. A laser vibrometer POLYTEC CLV-2534 (Polytec Inc., Auburn, MA, USA) was utilized to measure the fruit’s vibrational velocity at each point. A data acquisition card (NI DAQ-6211, Austin, TX, USA) was used for programming and measuring the excitation and response signal. In addition, a laser vibrometer was connected to the analog input, and the electrodynamic shaker was connected to the analog output of the card.
To assess the frequency response of the fruits, vibration tests were applied by two windows of chirp excitation signals for the two groups of fruits. The signal one was set up from 10 to 100 Hz, with 0.12 V of shaker amplitude, 100 s of excitation time, and 2 kHz of sampling rate. Signal two was defined from 100 to 1000 Hz, keeping the same amplitude and time in the shaker but applying 10 kHz of the sampling rate. Each sample was tested by applying the same signals.
The main idea of this experiment is to understand the dynamic behavior of the fruits identifying their resonance frequencies and the velocity amplitude at both frequency windows. The identification will allow us to choose monitoring peaks that could be tracked from the fast Fourier transform and a wavelet analysis.
On the other hand, for carrying out a modal analysis, the input vibrational force applied to the samples was read as voltage signals by a piezoelectric transducer placed inside the excitation support, as detailed in Figure 4. A lateral view, frontal view, and upper view of the experiment can be observed in Figure 4a–c, respectively. As detailed in Figure 4d, the time domain of the voltage signal of the tested fruit is acquired in the analog input of the DAQ with which the FFT of the input voltage is computed for all the samples in the e 1 and e 2 directions, respectively. This experimental approach was applied for computing the mechanical impedance of the fruits and determining the rate (input force—output velocity) of the tested fruits. Piezoelectric transducers have been used at different applications to sense vibrations signals over structures such as the case when residual forces are monitored in concrete structures, as was implemented by Kaur et al. [41].
To understand the relations between force/velocity modal analysis theory is reviewed [42]. In the experimental configuration the velocity is measured from the vibrometer and the force is determined with the piezoelectric sensor added to the fruit pedicel. Let us consider the motion equation in the frequency; this can be expressed as
( M ω 2 + C j ω + K ) { v o u t } e j ω t = { F i n } e j ω t .
where M , C , and K , constitute the matrix of mass, damping, and stiffness. F i n and v o u t are the input force and the output velocity, respectively. In Equation (14), the following relation can be constituted between the input and the output when the amplitudes { v o u t } 0
K M ω 2 + C ω j = { F i n } { v o u t } = H ( ω )
With that in consideration, H ( ω ) is the FRF that represents the behavior of the mechanical system in the frequency spectrum. Considering the experimental setup to measure the input force, we assume that F i n ( ω ) = V i n ( ω ) γ ( ω ) , where V i n ( ω ) is the voltage measured in the piezoelectric sensor and γ ( ω ) is a scaling factor; then, Equation (15) can be rewritten as
Z ( ω ) = V i n ( ω ) γ ( ω ) v o u t ( ω ) .
Finally, we determine the scaled mechanical impedance as follows:
Z ( ω ) γ ( ω ) = V i n ( ω ) v o u t ( ω ) .
Through scaled mechanical impedance, it is possible to observe the mechanical resonances of the fruit pedicel system.

3. Results and Discussion

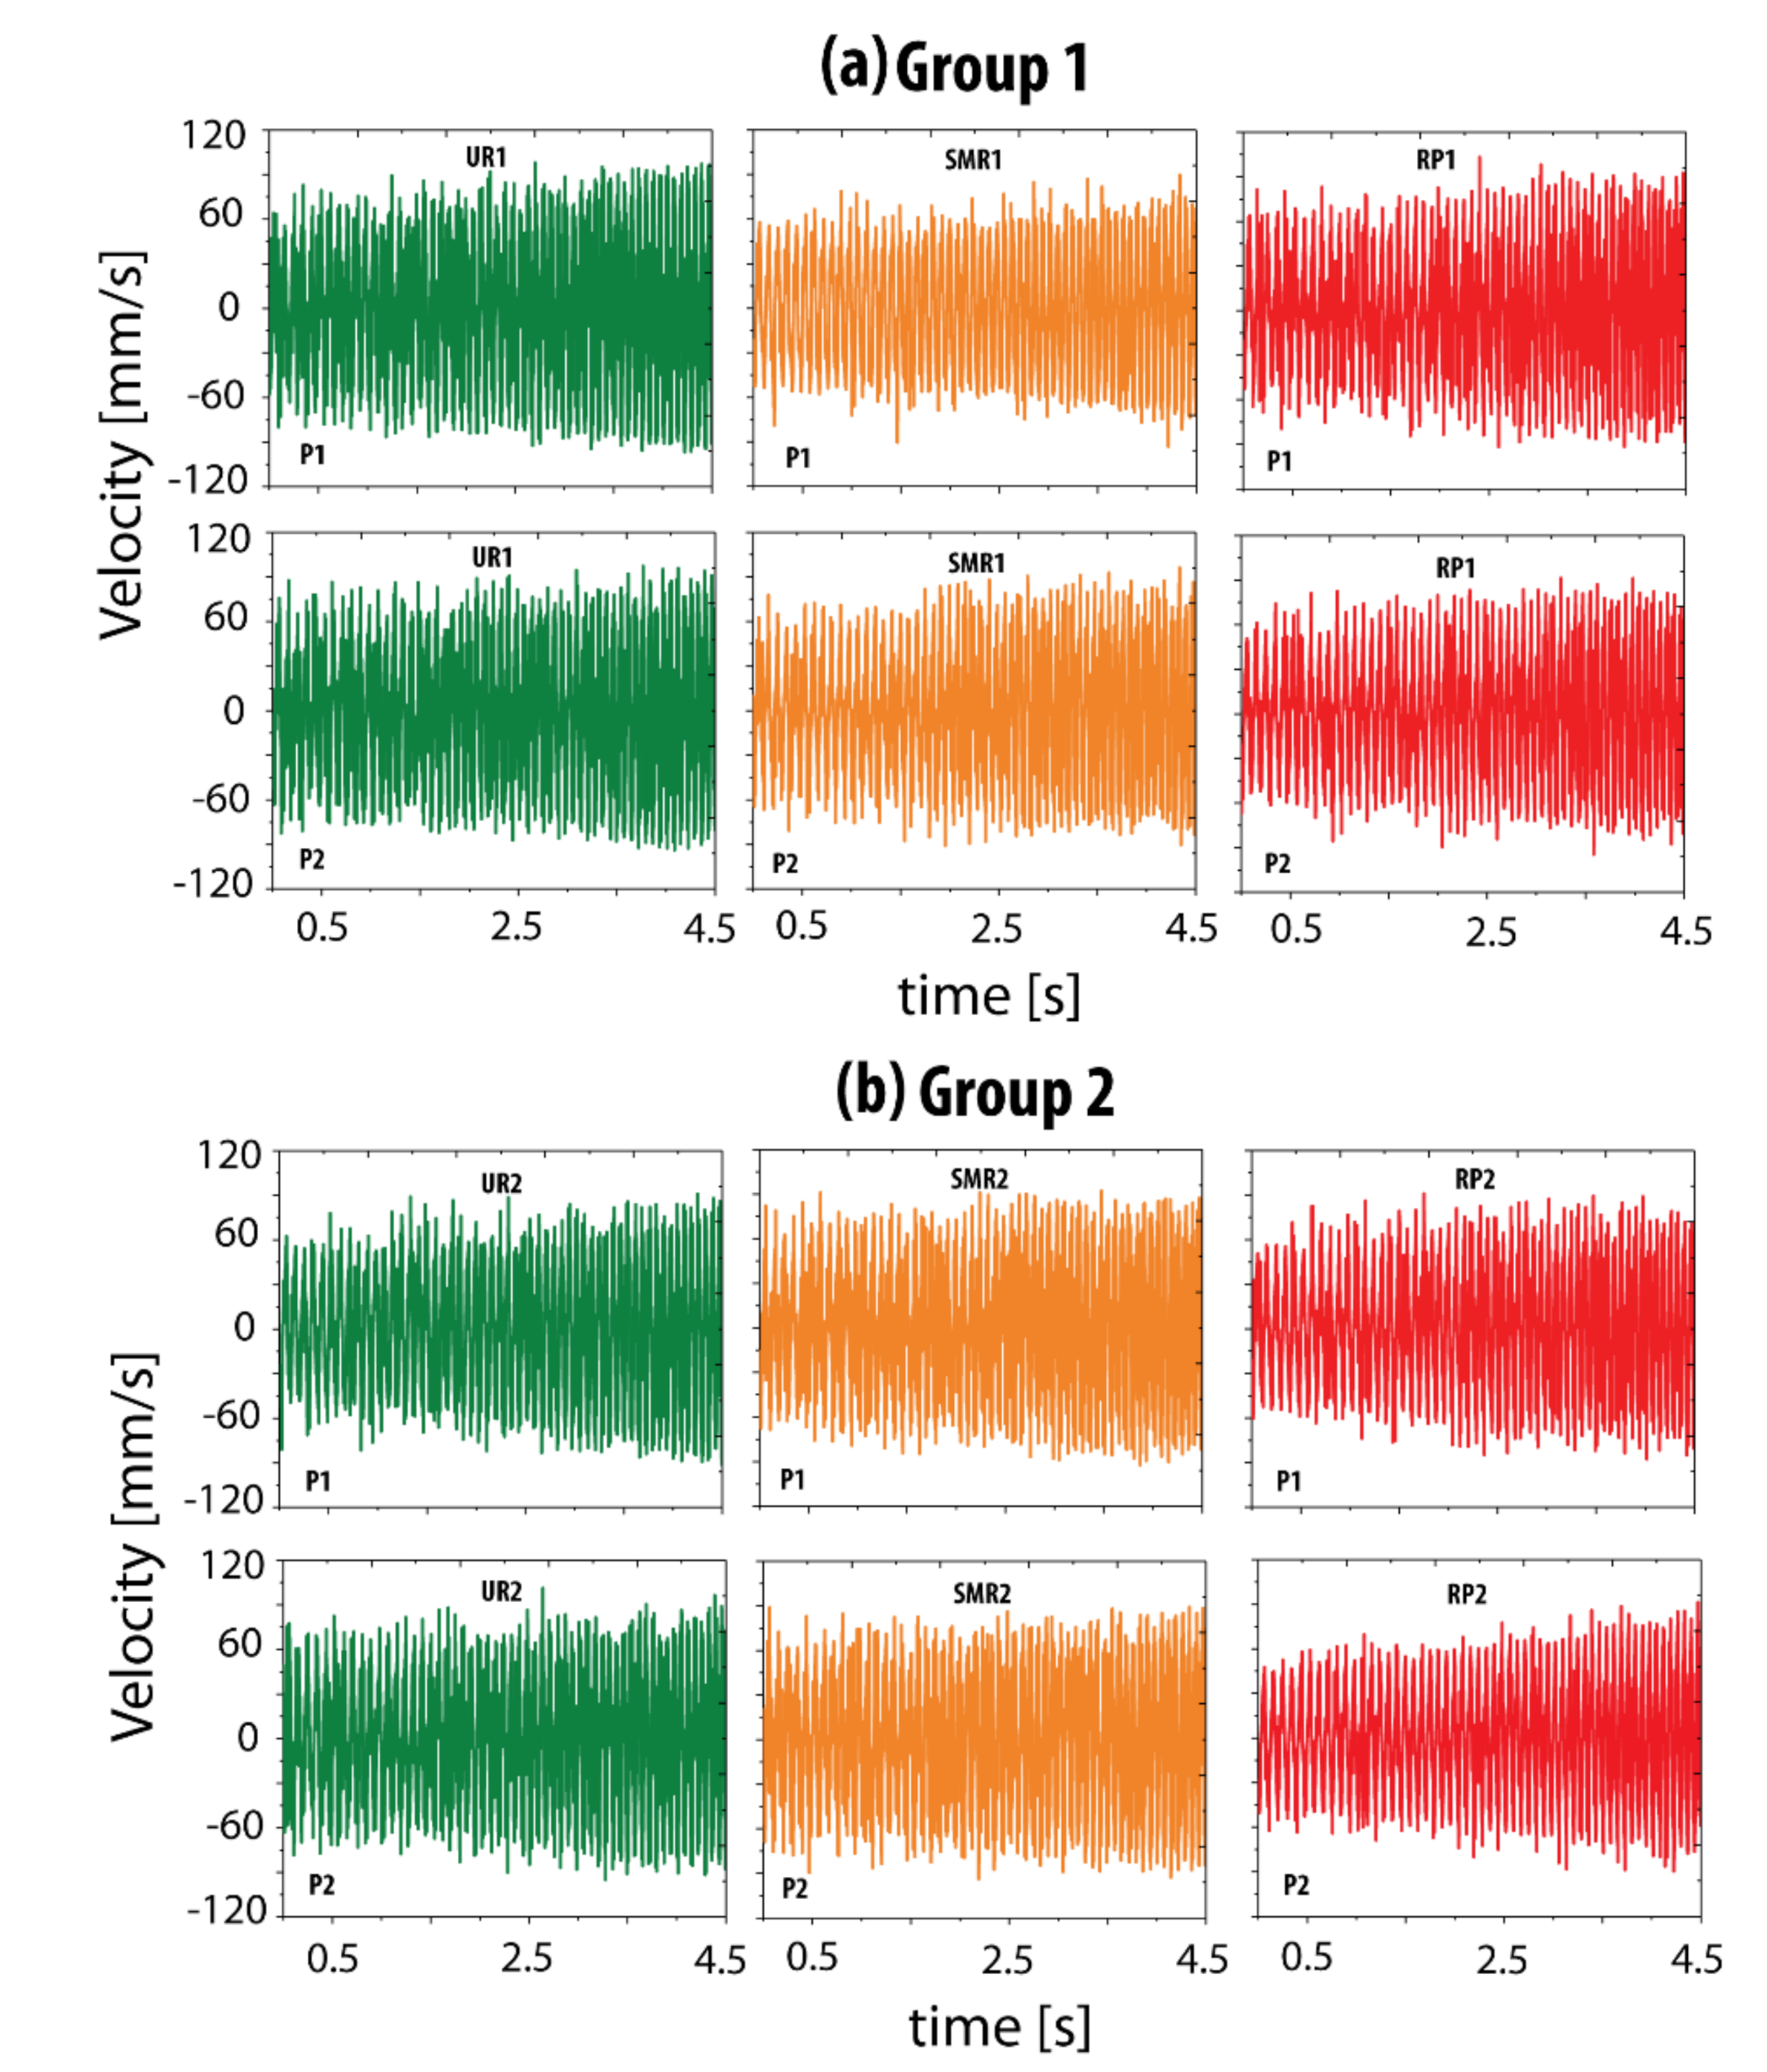
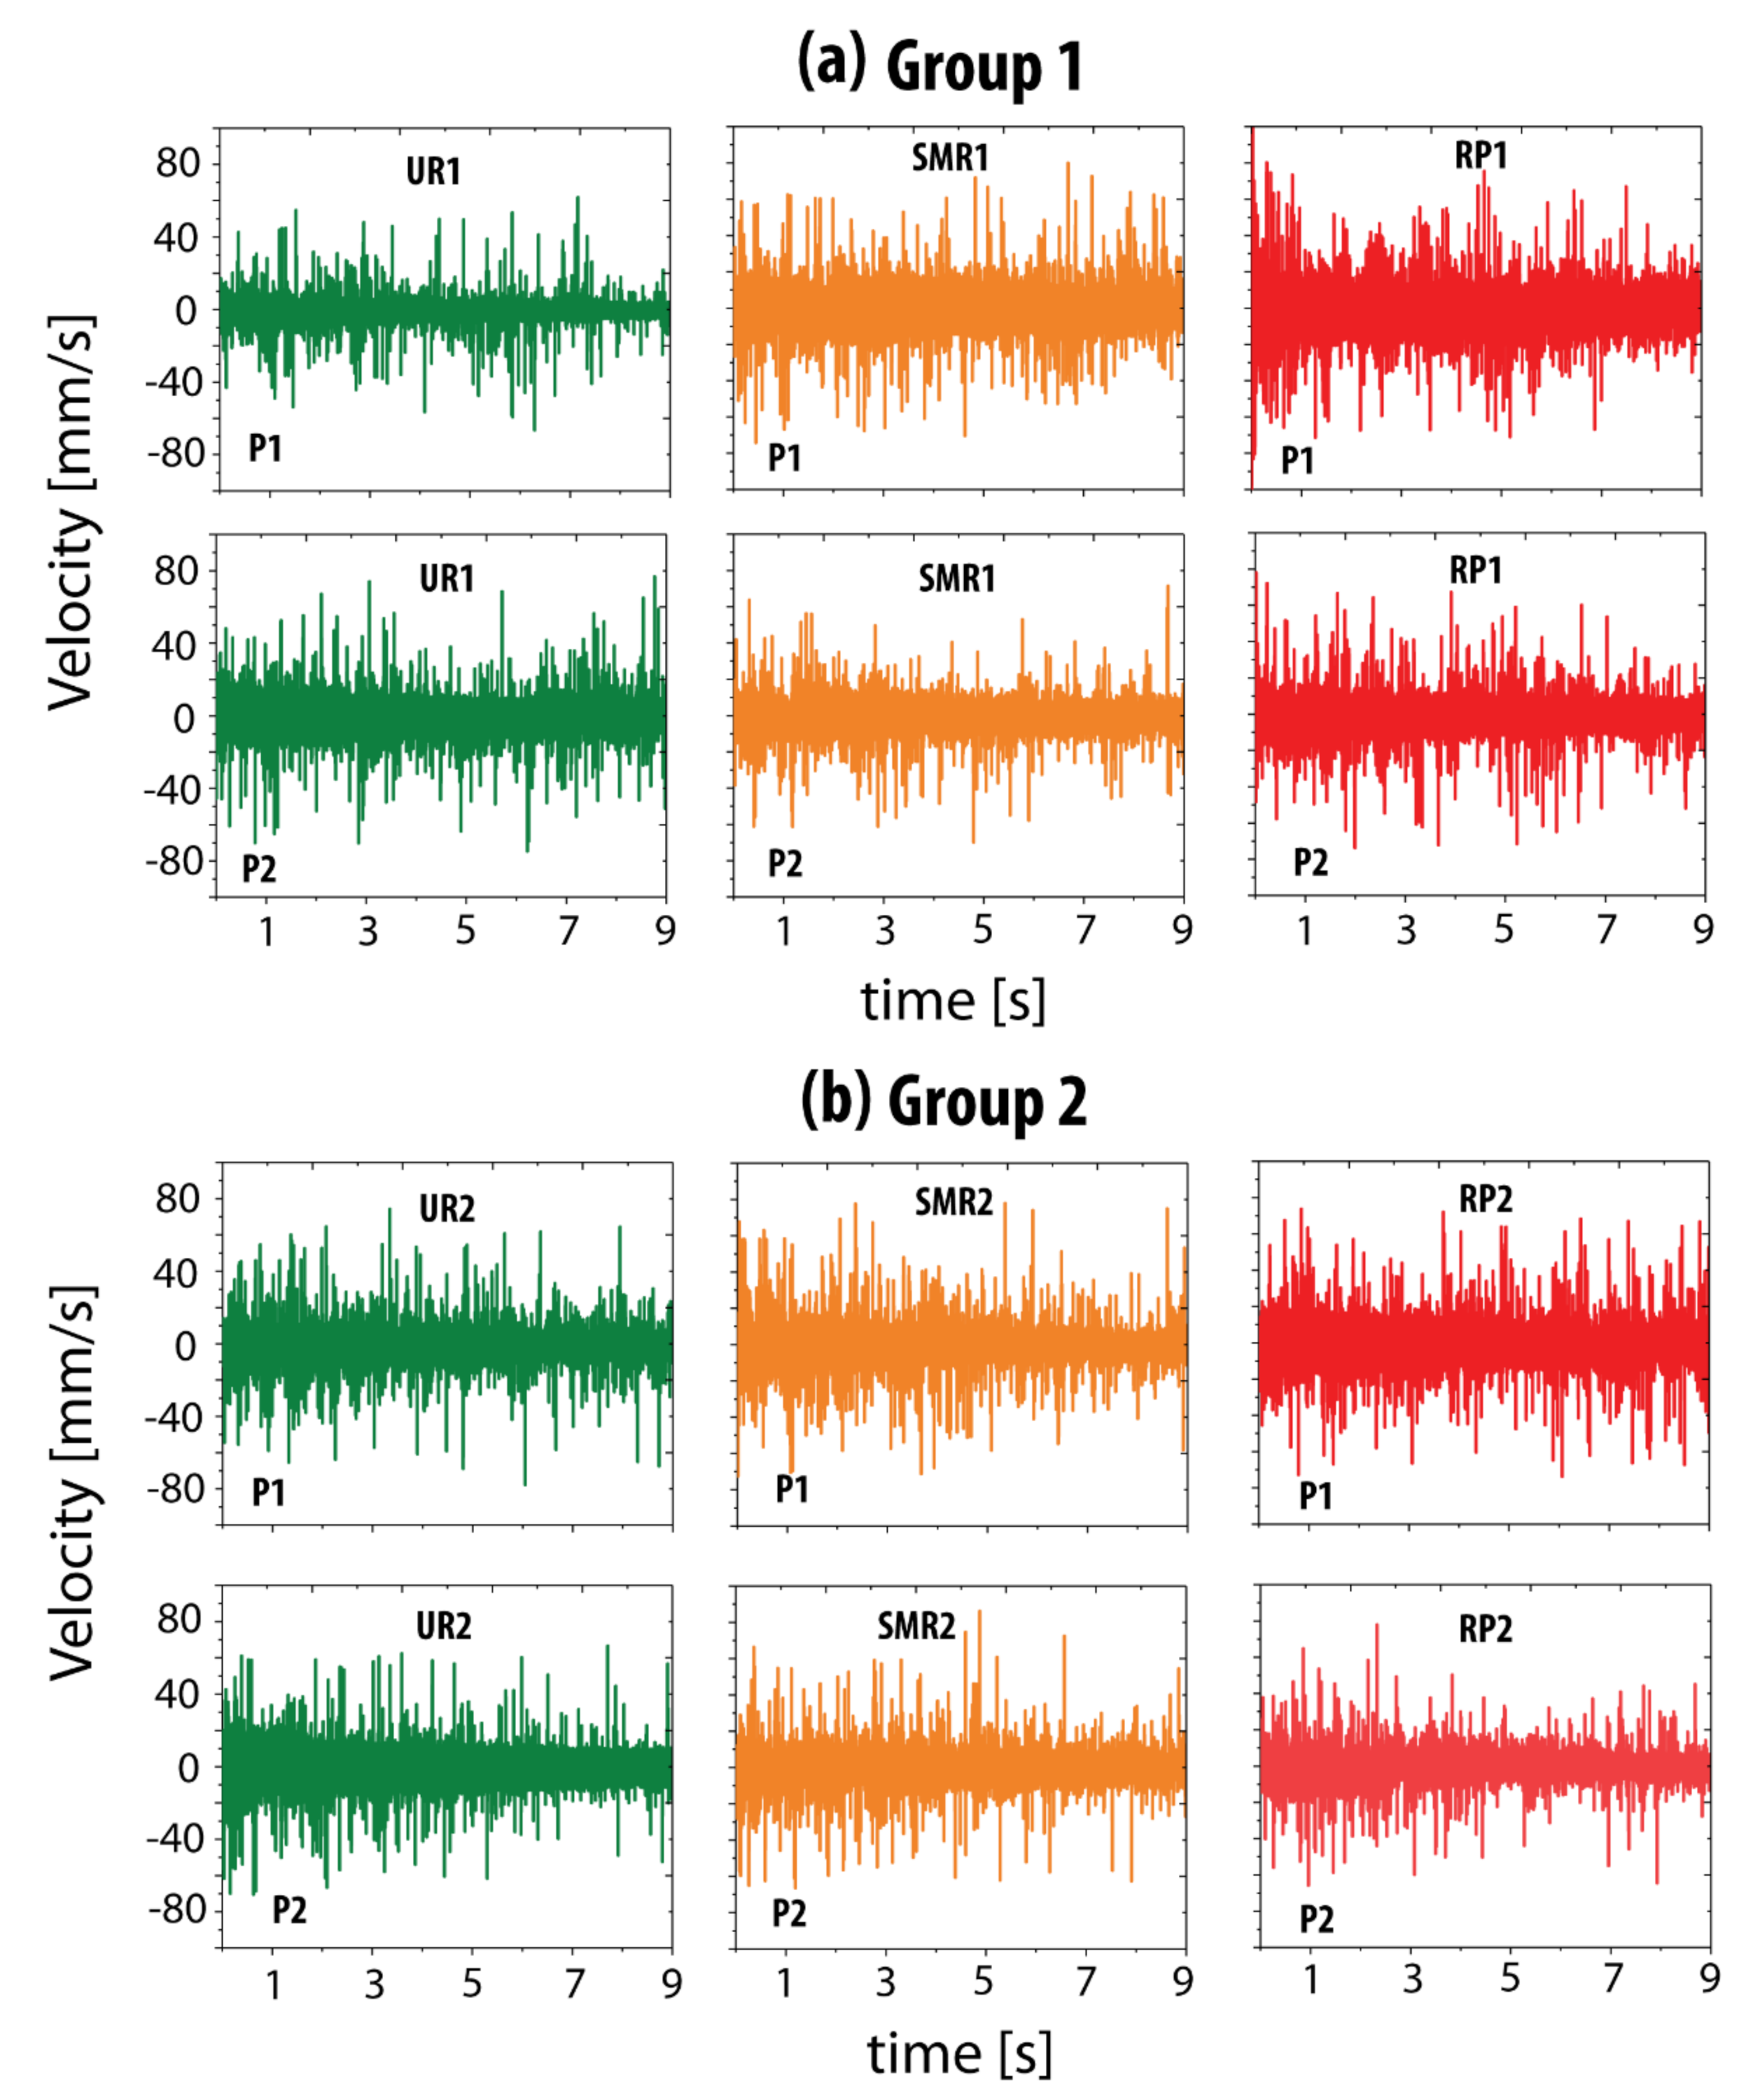
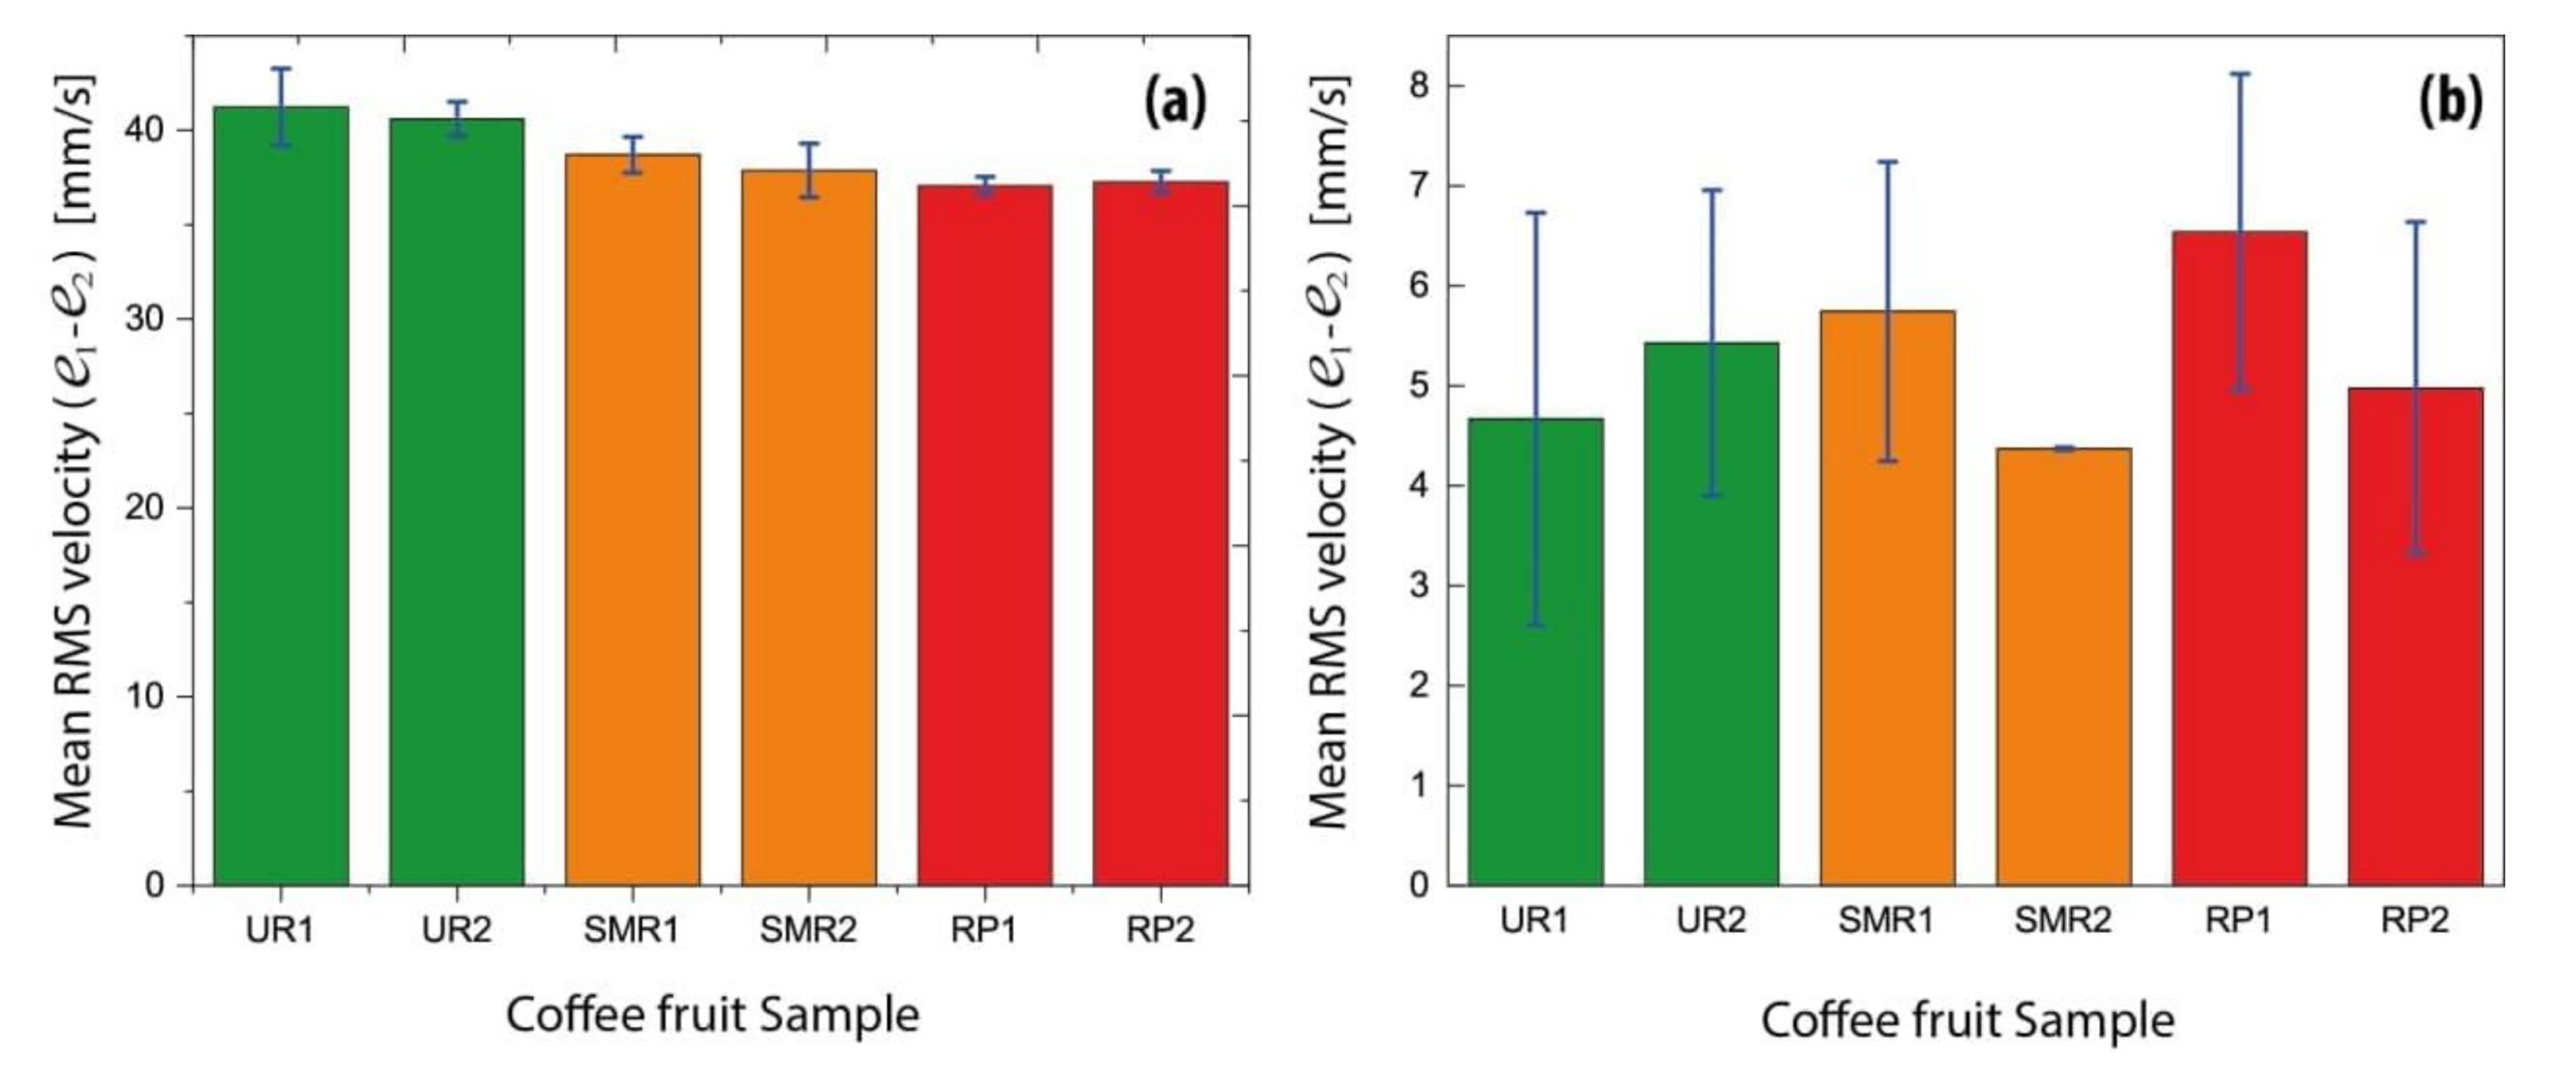
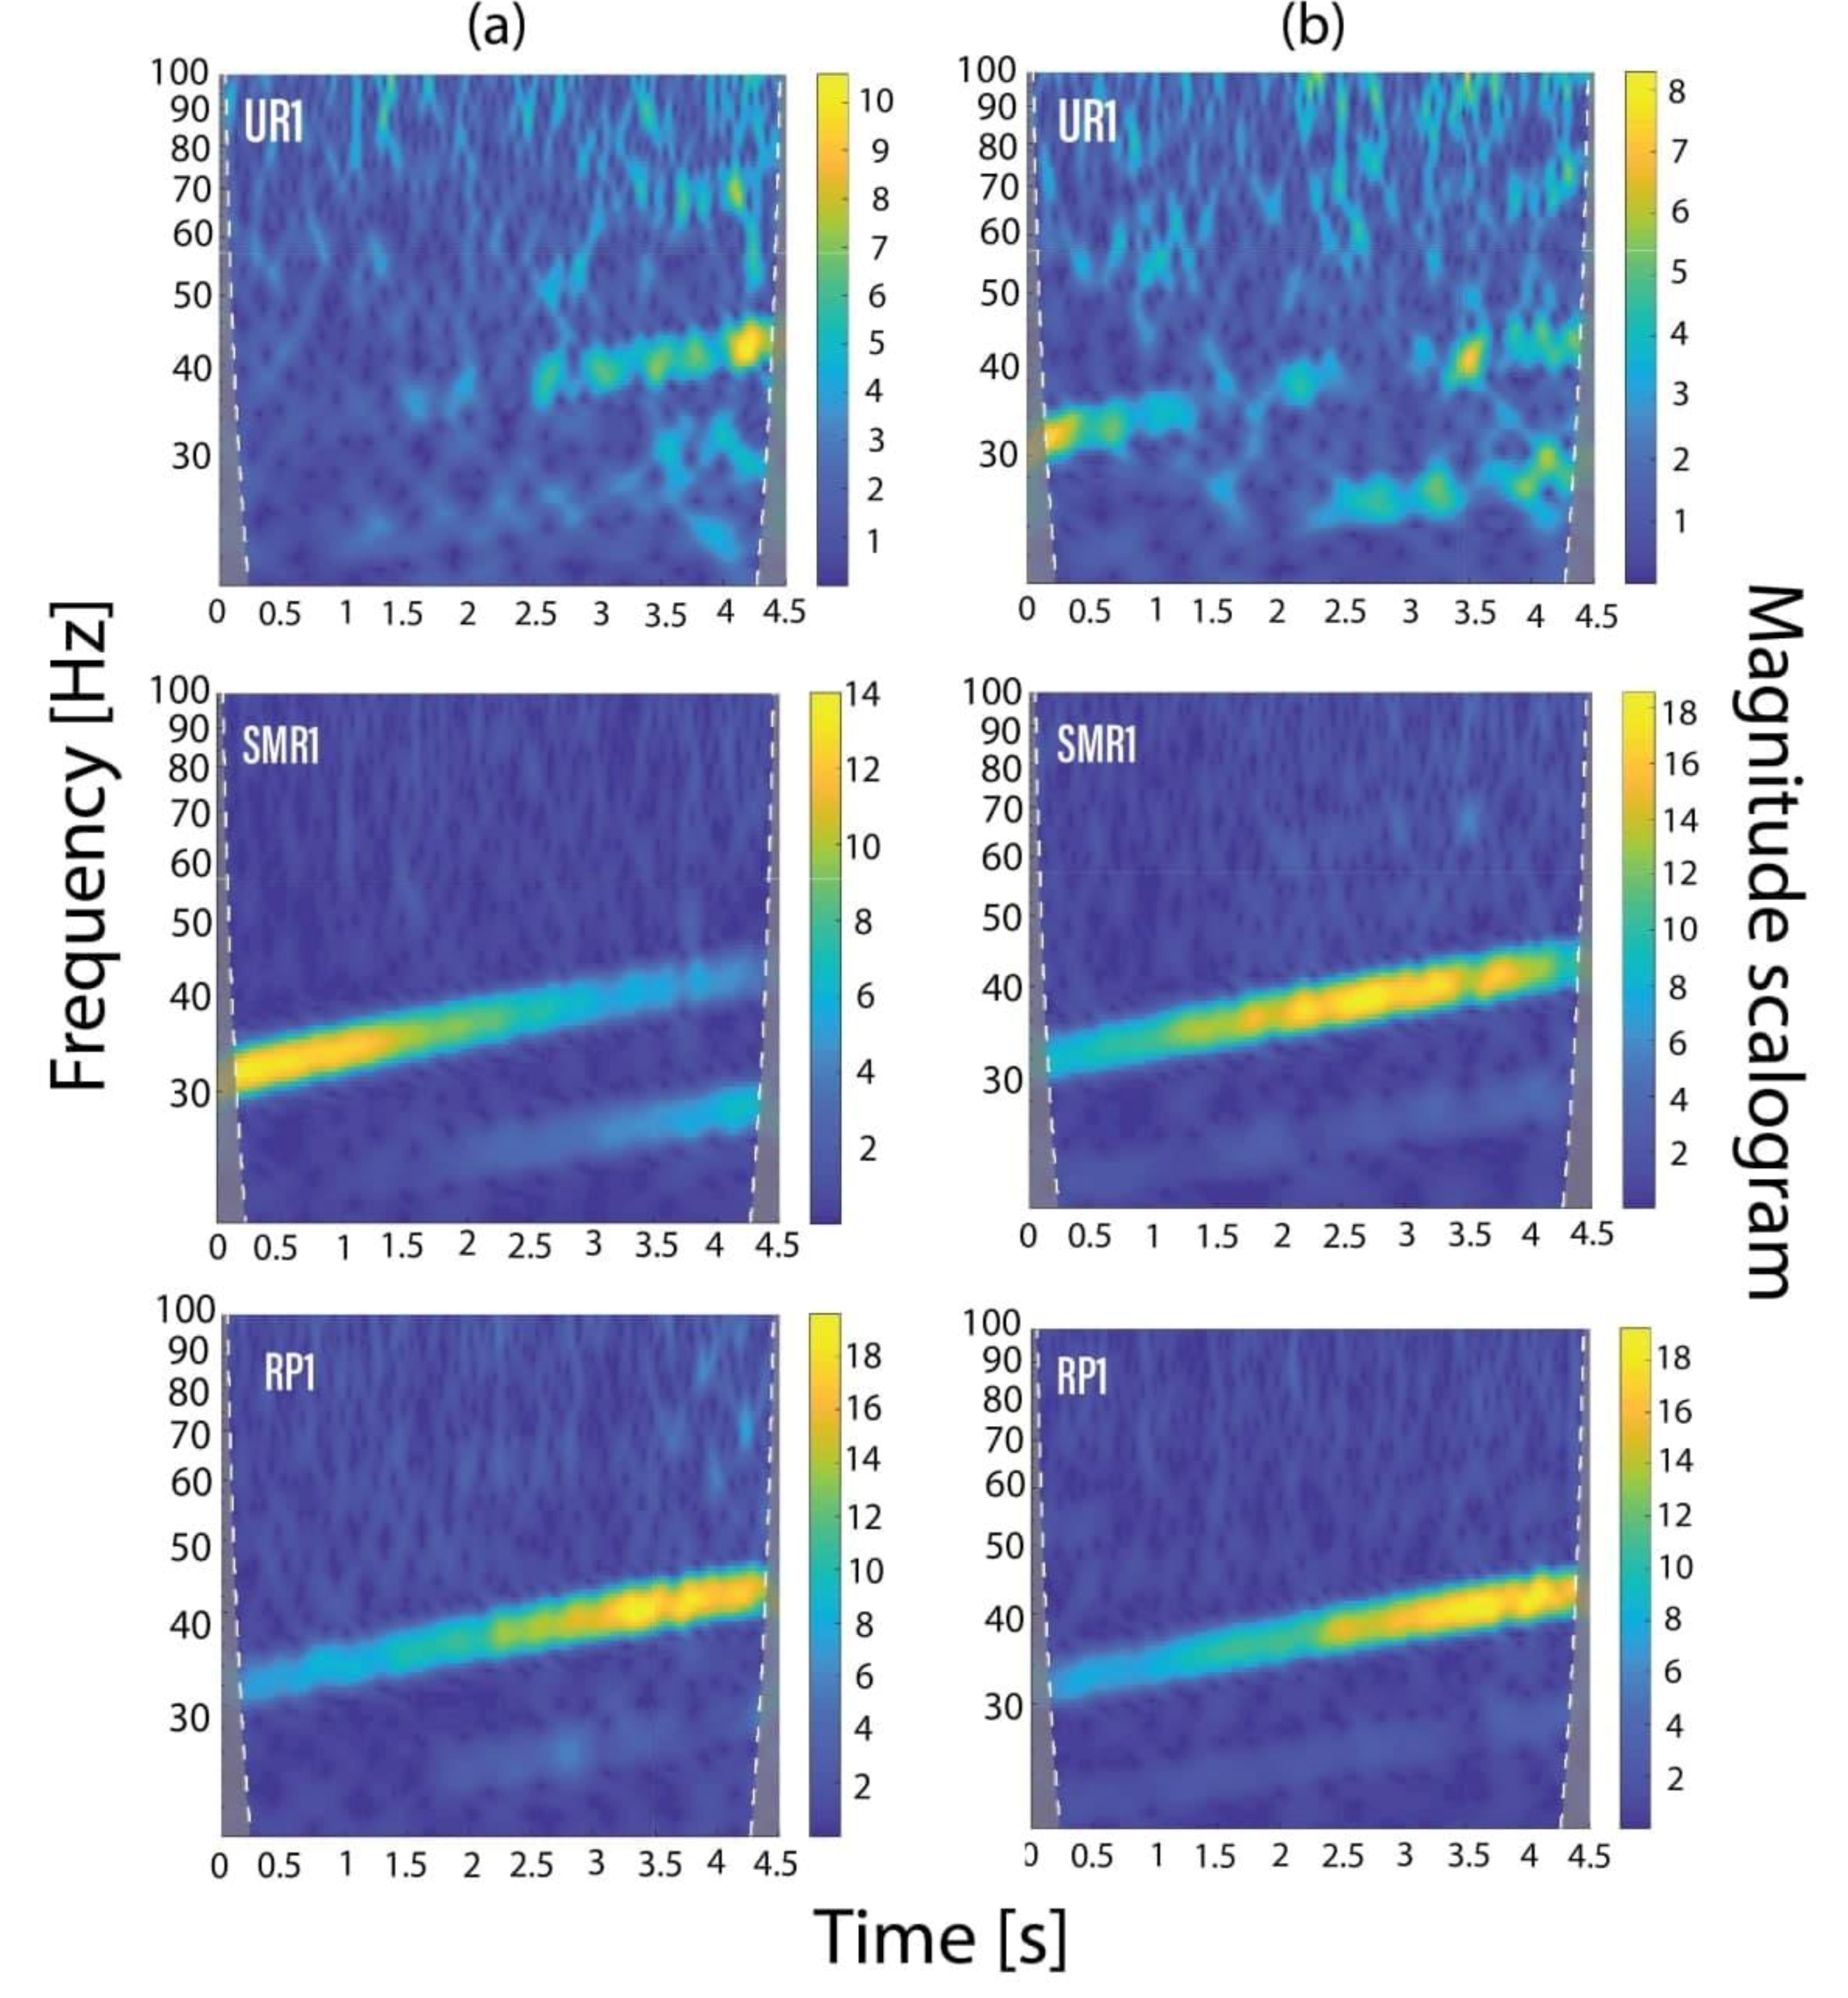
3.1. Time–Frequency Analysis of Velocity Measurements

The time-domain velocity signals measured by laser vibrometry between 10 and 100 Hz are illustrated in Figure 5 for both tested fruit groups. Each group refers to a set of fruit composed by one sample of each ripening stage. The collected samples were selected by a colorimetry approach that uses CIELab space as a reference.
Section 2.1 describes the whole sample classification process. It is important to mention that these were detached from the tree considering a protocol in which the appearance of each would not show defects, and it was as a single fruit, which means not a glomerulus.
The ripening stage lines up the graphs and the measured point (P1 and P2) defined for the directions e 1 and e 2 on the fruits. Different amplitudes of velocity were observed, comparing the three ripening stages at the measured points. This is due to the deformation pattern exhibited by the fruit structure (vibration shape) caused by the kinematics associated with the vibration modes at a specific frequency spectrum when the signals determined at the P1 direction are compared (Figure 5a). The UR1, SMR1, and RP1 graphs show that unripe fruits had a higher velocity amplitude than the semi-ripe and ripe ones. The colors of each figure represent the ripening stage: green for unripe, orange for semi-ripe, and red for ripe.
Figure 6 illustrates the velocity signals measured between 100 and 1000 Hz for both groups of fruits, as Figure 4 shows. In general, comparing the determined signals, it is seen that RP fruits present the highest velocity amplitudes in comparison with SMR and UR. Between fruits of the same ripening stage, the velocity amplitudes differ between P1 and P2. For instance, P1 of UR1 has a lower amplitude than P1 of UR2, and P2 of UR1 tends to be similar to P1 of UR2. P1 of SMR1 has a similar behavior of P1 of SMR 2 and also P2 of SMR1 with P2 of SMR2. As well as the case of semi-ripe fruits, P1 of RP1 and RP2 have higher amplitudes in comparison with P2 of RP1 and RP2.
The RMS was computed for the time domain signals of velocity measurements to understand the differences among vibration amplitudes. The mean was also computed for the RMS values determined from the signals that belong to e 1 and e 2 directions in all the tested fruits. The results for the mean of RMS are summarized in Figure 7, for the selected frequency windows, respectively. Between 10 and 100 Hz, it is observed that the highest value was obtained for the unripe fruits and they decrease sequentially until the ripe ones. In this window, similar values were evidenced between fruits of the same ripening stage, especially the ripe ones that presented the closest values. However, these differences are not representative statistically, as illustrated in Figure 7a. On the other hand, between 100 and 1000 Hz, a different trend was observed for the first fruits (UR1, SMR1, and RP1) where the quantities increased from unripe to ripe. However, for the second fruit of each ripening stage, the maximum value was presented in UR2 followed by RP2 and ending with the SMR2 fruit; see Figure 7b.
For the time-domain signals, it is not possible to visualize the characteristic mechanical resonances of the fruits due to noise presence. For that reason, the FFT was computed and plotted to determine the maximum amplitudes of velocity in the frequency domain (mechanical resonances) as detailed in Figure 8. The frequency response functions (FRF) are compared in Figure 8a,c for 10 Hz to 100 Hz and in Figure 8b,d for 100 Hz to 1000 Hz. These signals were smoothed applying a 30-point FFT filter. For the window between 10 and 100 Hz (Figure 8a,c), the two highest resonance peaks were evidenced between 10 and 60 Hz.
Furthermore, the same ripening stage signals exhibited a similar behavior mainly for the measurement taken in P2 where amplitudes and resonance levels are quite close. However, signals taken in P1 showed some differences between SMR1 and SMR2 where SMR1 appeared to resonate at a lower resonance than SMR2. The evidenced structure in the signals showed that the experiments were well controlled, since the same peaks were evidenced for both directions. In addition, it is noted that resonance peaks keep close between the signals of each ripening stage. The resonance frequencies relations advise that the ratio stiffness/mass is lower in the unripe stage than the ripe one. Moreover, it indicates that signals move from unripe to ripe forwardly.
Moreover, in the range from 100 to 1000 Hz, the highest resonance peaks were evidenced between 500 and 1000 Hz for the FFT of velocity (Figure 8b,d). In addition, both measurements are correlated, since they contemplate the fruits dynamics after 500 Hz. All ripening stages echoed their characteristic resonance peaks. For this case, the signals begin with a high amplitude at 100 Hz and then decrease until higher amplitude resonances appear after 550 Hz. Nevertheless, this range can observe that the velocity resonance peaks shift differently when the ripening stage changes. For instance, the peaks of the ripened fruits appear first, which are followed by the unripe and semi-ripe resonating at higher resonances. This permits us to observe that the stiffness changes at these frequencies mainly influence the mechanical resonances. The URs present the highest stiffness, which are followed by the SMRs and the RPs.
We can conclude that the similar behavior for the signals obtained for the same ripening stage fruits indicates that the resonances resemble the intrinsic properties of these. Star marks were labeled at resonance peaks of the signals. The values of frequency are listed in Table 3. It is important to mention that the peaks identification procedures were not performed using any methodology, since we consider that these are observable from a simple view while understanding that there are different methodologies that allow a procedure more replicable for the resonant peak extraction.

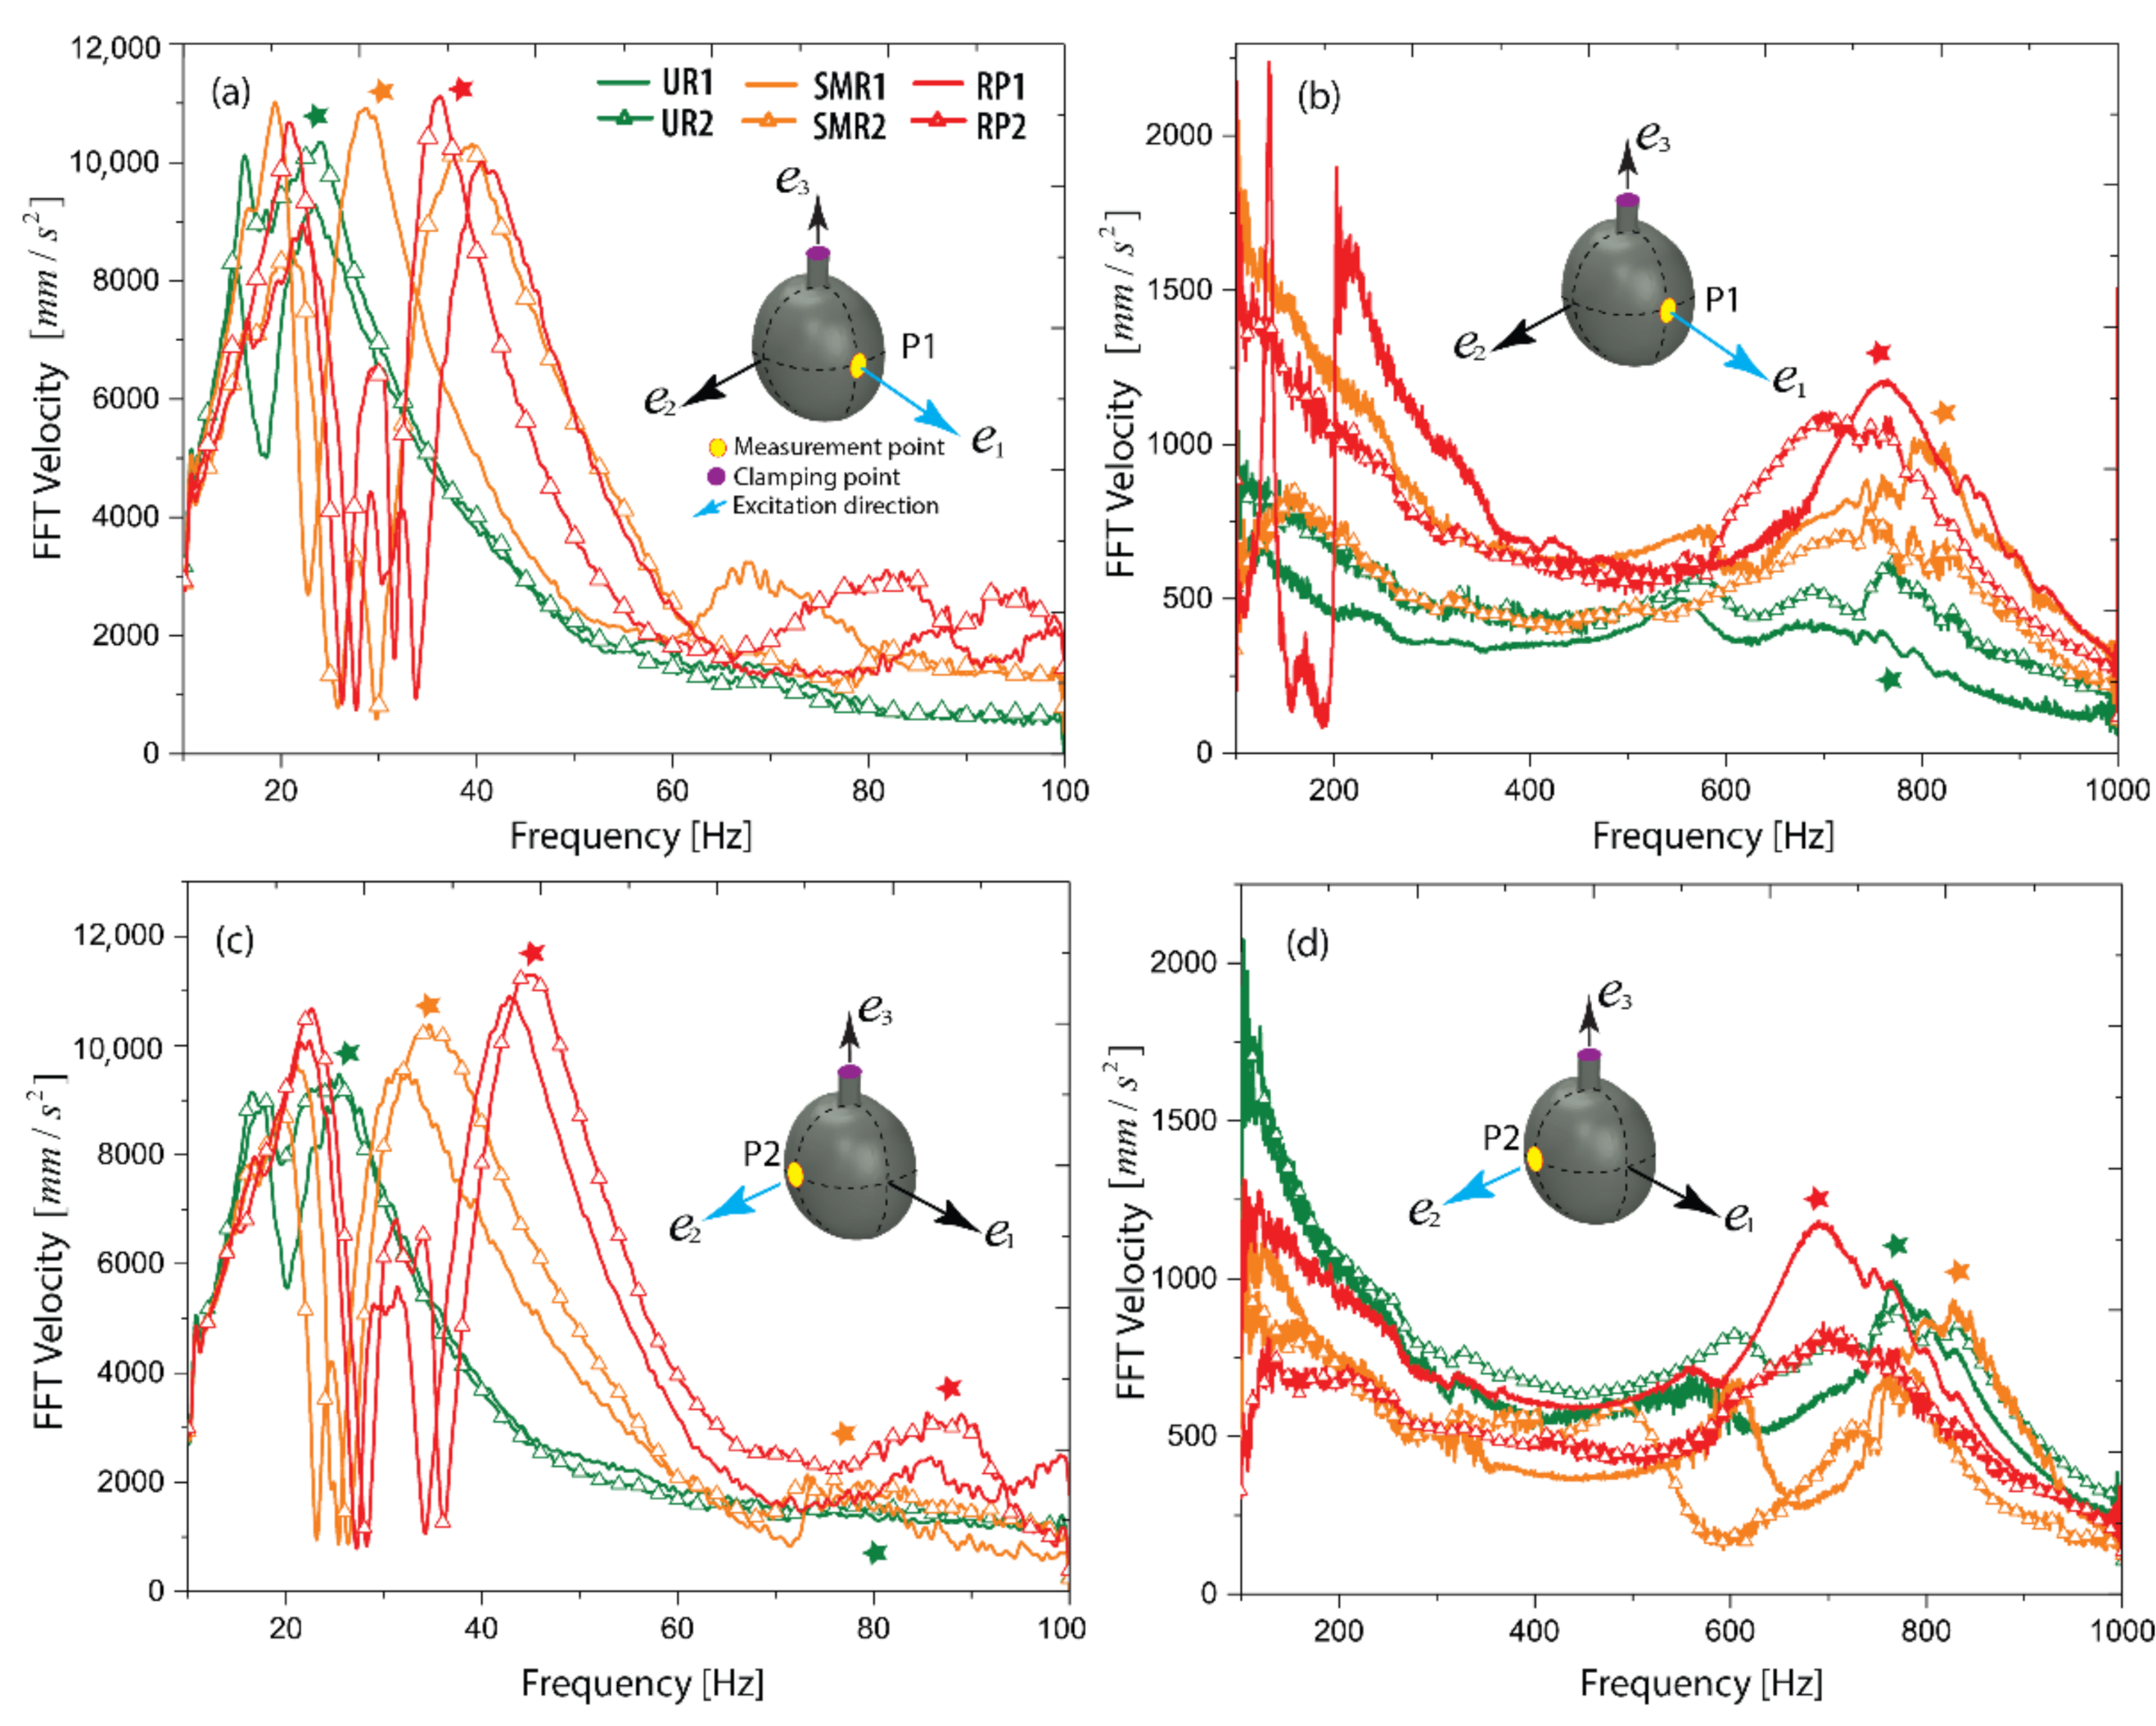
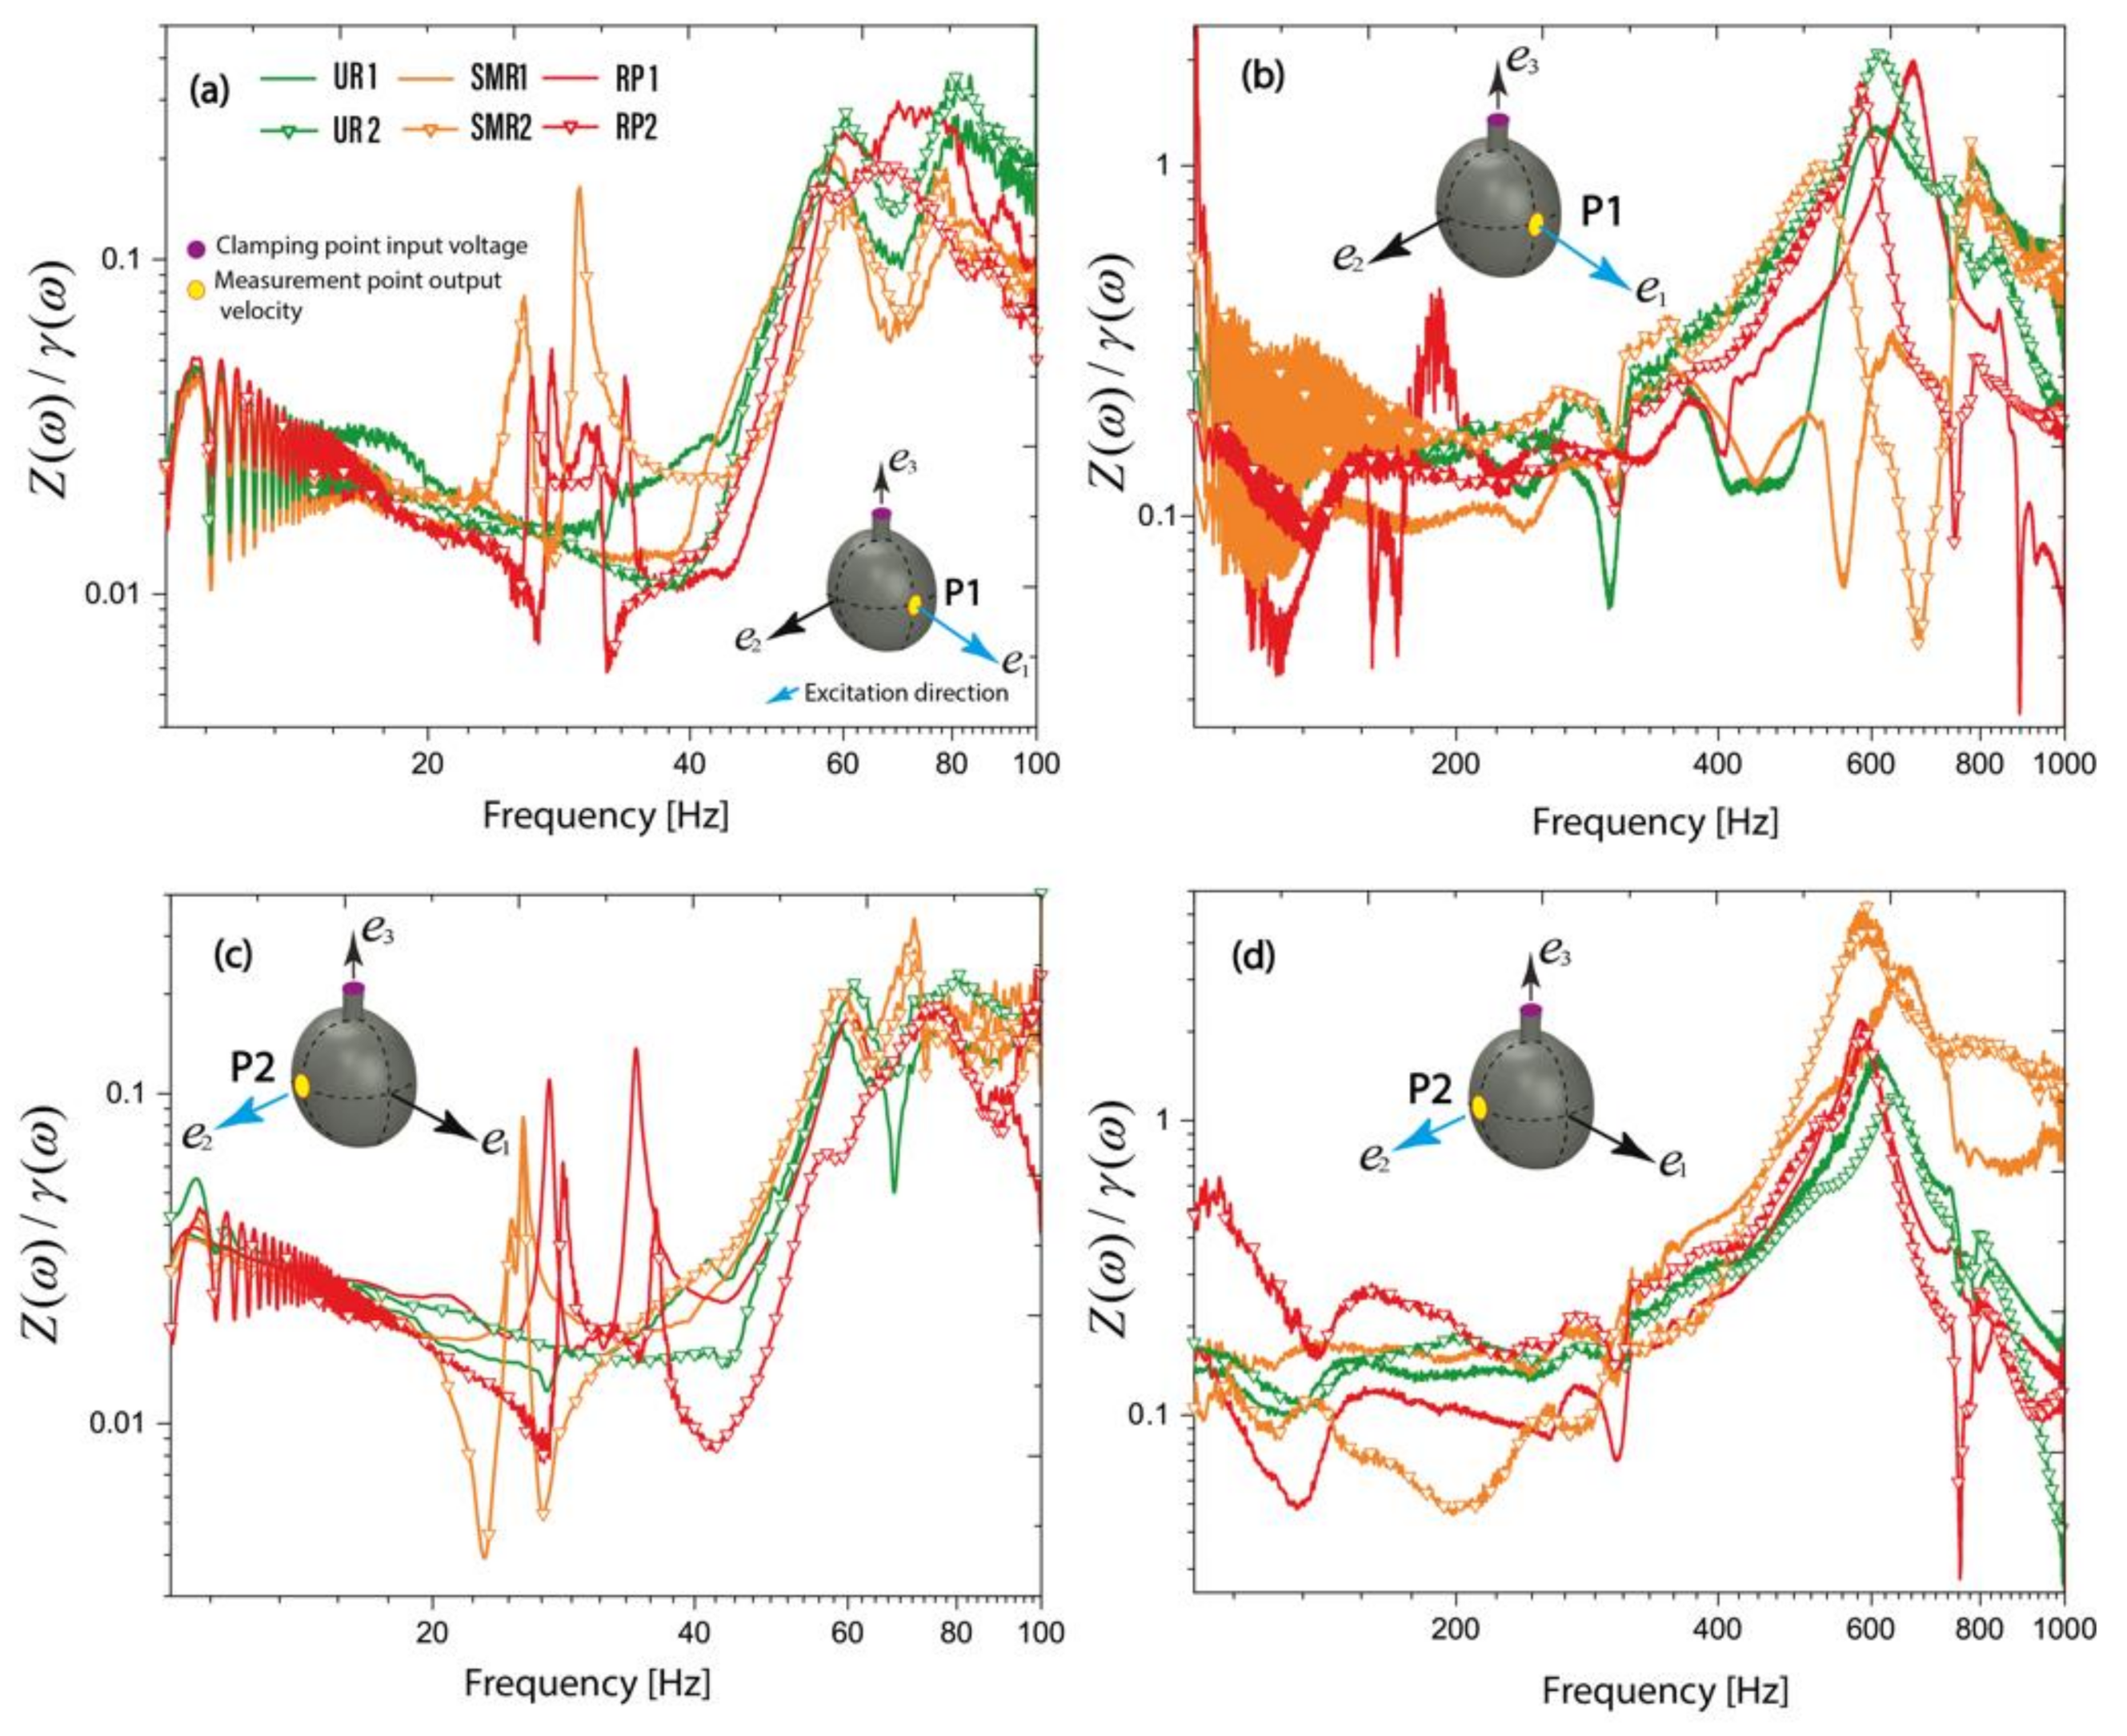
3.2. Mechanical Impedance Analysis

In Figure 9, the curves of the scaled mechanical impedance signals ( Z ( ω ) / γ ( ω ) ) obtained from the relation ( V i n ( ω ) / v o u t ( ω ) ) are consolidated, as detailed in Equations (14)–(18). These signals were also calculated for the same measured points P1 and P2, where Figure 9a,c belong to the window 10–100 Hz and Figure 9b,d belong to 100–1000 Hz. The signals between 10 and 100 Hz have a similar structure for all the tested fruits where two initial characteristic peaks are reflected between 24 and 40 Hz and two final peaks are presented between 55 and 1000 Hz with higher amplitude. We can observe that in the range of 24 to 40 Hz, only semi-ripe and ripe fruits present these resonances, which exhibit more resistance to motion during the excitation; in this range of frequency, the unripe fruits did not evidence resonance peaks.
As modal analysis theory exposes, it is important to denote that mechanical impedance is an FRF that represents a degree of freedom of a structure. This means that the scaled mechanical impedances were taken only for two degrees of freedom. According to the theory, these functions can be joined spatially, and for multiple degrees of freedom, it is possible to reconstruct the modal shape.
Moreover, between 100 and 1000 Hz (see Figure 9b,d), the scaled impedance signals showed higher amplitudes with a trend that does not evidence any relevant difference among the ripening stages, respectively. The most significant characteristic is an observed peak at 600 Hz.

3.3. Wavelets Analysis

In this section, the results for the wavelet analysis applied on the time-domain signals of group 1 are presented in Figure 10. The figures are represented in two columns; see Figure 10a for the P1 measurements and Figure 10b for the P2 measurements.
Each row denotes the ripening stage. In the frequency range from 10 to 100 Hz, we can observe that with the ripening of the fruit, the scalogram magnitudes in frequencies close to 40 Hz increased. These differences are more straightforward in the measurement point P1, as the maximum magnitude is around 10 for the UR stage, about 14 for the SMR stage, and approximately 18 for the RP stage. In addition, around 40 Hz, the maximum magnitude occurs in a slightly higher frequency for the RP fruit.
At measurement point P2, the maximum magnitudes in the scalogram go from 8 (UR) to 18 (RP), showing a significant difference between the unripe and ripe stages. In P2, the semi-ripe and ripe stages have the same maximum magnitudes. However, it is still clear that around 40 Hz, the frequency with a higher scalogram magnitude is slightly higher for the ripe fruit.
For RP1, it is noticeable that the magnitude of the scalogram has more intensity at the end of the time domain, keeping a similar trend for P1 and P2. For the UR1 case, the intensity is distributed in the scalogram and presented minor concentrations in some areas of the graph. Nevertheless, the SMR1 also exhibited an accumulation of intensity that for P1 was more intense at the beginning of time but for P2 was more intense at the end. In these graphs, the different concentration patterns evidenced in the scalograms were reflected due to the differences in the velocity amplitudes for the fruits that reflected the shifts in the vibration energy levels.

4. Conclusions

This work performed vibration analysis on coffee fruits (Coffee arabica var. Castillo). Vibrational signals were characterized by applying linear chirp excitation frequency and evaluating the response velocity measurements attained from a laser vibrometer. Two frequency intervals (10–100 Hz and 100–1000 Hz) were studied in three tested ripening stages. Initially, the ripening stages were classified according to a strategy based on measurements of CIELab color. Subsequently, the harmonic response of the fruits was analyzed by studying the application of time-frequency and CWT (bump wavelet) analysis. The signals analyzed were acquired in pursuance to detect the dynamic characteristics of the fruit–peduncle system. Using the traditional fast Fourier approach over the velocity measurements, it was possible to identify the mechanical resonances of each ripening stage. It was evidenced that between 10 and 100 Hz, resonances are more influenced by the lower stiffness (in the pedicel). For that reason, the unripe fruits start to resonate earlier and are more intense than the other rippeing stages. However, between 100 and 1000 Hz, the frequency of peaks was more influenced by the elasticity of the fruit since ripe fruits resonate first and more than the others. In evaluating scaled mechanical impedance, we observed a range of frequency between 24 and 40 Hz that confirms the data determined in the velocity spectra. In this range of frequency, a positive indicator for selective harvesting means that the resonances were excited for semi-ripe and ripe fruits but not for the unripe ones. Therefore, according to measurements, we conclude that the differences among ripening stages are more visible in the frequency spectrum established for 10–100 Hz.
Summarizing, we obtained in this interval the following values for both measuring points from velocity measurements: for P1, unripe 23.68 ± 0.48 Hz, semi-ripe 33.94 ± 7.50 Hz, and ripe 38.36 ± 3.01; and for P2, unripe 25.66 ± 0.30 Hz, semi-ripe 31.31 ± 7.50 Hz, and ripe 43.88 ± 1.50. The spectral characterization of the time-domain velocity measurements was achieved by decomposing the measured signals along the resulting amplitude scale by the function of the bump wavelet. The feature of impulsive signals was reflected in the computed scalograms taking advantage of the gradient information of the CWT as shown by the scale-space domain. The power of the solution scalograms permitted comprehending the shifts in the energy level of the vibrations for each ripening stage. The RP fruit exhibited a higher magnitude in the scalograms followed by the SMR and ended with the UR. This behavior was more clearly evidenced for the measured point P1. The average energy of the resolution window does not permit evidence of energy concentration at the geometrical center of the graph, which is logical due to the amplification of vibrational velocity varying from UR to RP. However, for the signals from 100 to 1000 Hz, it was not possible to obtain scalograms with a good resolution because the frequency concentration was lower than between 10 and 100 Hz. Then, the wider the resolution, the lower the frequency concentration that was presented. This study advances the condition monitoring of organic structures. It can be a helpful tool to understand the dynamic behavior of coffee fruits and fruits with other topologies that could be explored.
Excitation frequencies between 24 and 45 Hz and close to 700 Hz could be assessed to develop vibration-based equipment for selective coffee fruit harvesting. Fatigue analysis could be proposed to evaluate the most effective frequency to detach the ripe fruits from the perspective of a real application in a selective coffee-harvesting scenario. However, experiments with more samples should be performed to evaluate deviations in the dynamic behavior of the fruits. In addition, future studies could be proposed to study cycles needed to induce fractures for the detachment of the fruit.

Author Contributions

Conceptualization, H.A.T., C.I.C. and D.A.P.; methodology, H.A.T., C.I.C., D.A.P. and L.P.-H. software, H.A.T. and D.A.P.; validation, H.A.T., C.I.C. and D.A.P.; formal analysis, H.A.T. and C.I.C.; investigation, H.A.T., C.I.C., L.P.-H. and J.L.-G.; resources, H.A.T.; data curation, H.A.T., C.I.C. and D.A.P.; writing—original draft preparation, H.A.T., C.I.C., L.P.-H. and D.A.P.; writing—review and editing, H.A.T., C.I.C., L.P.-H., J.L.-G. and D.A.P.; visualization, H.A.T., C.I.C. and J.L.-G.; supervision, H.A.T.; project administration, H.A.T.; funding acquisition, H.A.T. All authors have read and agreed to the published version of the manuscript.

Funding

This research was funded by a grant from Ministerio de Ciencia Tecnología e Innovación (MINCIENCIAS, COLOMBIA) (Grand code 121980863997) legalized contract 80740-144-2019 and obtained in announcement 808 of the year 2018.

Institutional Review Board Statement

Not applicable.

Informed Consent Statement

Not applicable.

Data Availability Statement

The data collected in this research are available when be required.

Conflicts of Interest

The authors declare that there is not a conflict of interest in this article.

References

  1. Atteridge, A.; Elise, R. Indirect Effects of Adaptation: Pathways for Vulnerability Redistribution in the Colombian Coffee Sector; Stockholm Environment Institute: Stockholm, Sweden, 2013. [Google Scholar]
  2. Ortegón Chicuasuque, M.J. Perfil Sociodemográfico de los Recolectores de café en Colombia; Universidad del Rosario: Bogotá, Colombia, 2019. [Google Scholar]
  3. Moreira, R.M.G.; Teixeira, M.M.; Santos, F.L.; Fernandes, H.C.; Cecon, P.R. Preliminary design of a coffee harvester. Semin. Ciênc. Agrár. 2016, 37, 2933–2946. [Google Scholar] [CrossRef] [Green Version]
  4. Zapata, J.; Londoño, V.; Naranjo, M.; Osorio, J.; Lopez, C.; Quintero, M. Characterization of aroma compounds present in an industrial recovery concentrate of coffee flavour. CyTA-J. Food 2018, 16, 367–372. [Google Scholar] [CrossRef] [Green Version]
  5. Duque, H.; Dussán, C. Productividad de la mano de obra en la cosecha de café en cuatro municipios de la región cafetera central de Caldas. Cenicafé 2005, 55, 246–258. [Google Scholar]
  6. Ferguson, L.; Rosa, U.; Castro-Garcia, S.; Lee, S.; Guinard, J.; Burns, J. Krueger Mechanical Harvesting of California Table and Oil Olives. Adv. Hortic. Sci. 2010, 24, 53–63. [Google Scholar]
  7. Yarborough, D.E.; Hergeri, G.B. Mechanical harvesting of berry crops. Hortic. Rev. 2010, 16, 255–282. [Google Scholar]
  8. Olander, S. Swedish experience of mechanical harvesting of strawberries. In Proceedings of the II International Strawberry Symposium 348, Beltsville, MD, USA, 13–18 September 1992. [Google Scholar]
  9. Brando, C.H. Harvesting and green coffee processing. In Coffee: Growing, Processing, Sustainable Production. A Guidebook for Growers, Processors, Traders and Researchers; Wintgens, J.N., Ed.; Wiley-VCH: Weinheim, Germany, 2009; pp. 610–723. [Google Scholar]
  10. Tascón, C.E.O. Cosecha del café con vibradores portátiles del tallo. Rev. Fac. Nac. Agron. Medellín 2005, 58, 2697–2708. [Google Scholar]
  11. Oliveros Tascón, C.E.; Ramírez Gómez, C.A.; Acosta Acosta, R.; Álvarez Mejía, F. Equipo portátil para asistir la cosecha manual de café. Rev. Fac. Nac. Agron. Medellín 2005, 58, 3003–3013. [Google Scholar]
  12. Ferraz, S.; da Silva, F.M.; de Carvalho Alves, M.; de Lima Bueno, R.; da Costa, P.A.N. Geostatistical analysis of fruit yield and detachment force in coffee. Precis. Agric. 2012, 13, 76–89. [Google Scholar] [CrossRef]
  13. Jesusimo, D.J. Classification of immature and mature coffee beans using rgb 460 values and machine learning algorithms. Int. J. Emerg. Trends Eng. Res. 2020, 8, 3016–3022. [Google Scholar]
  14. Tinoco, H.A.; Ocampo, D.A.; Peña, F.M.; Sanz-Uribe, J.R. Finite element modal analysis of the fruit-peduncle of Coffea arabica L. var. Colombia estimating its geometrical and mechanical properties. Comput. Electron. Agric. 2014, 108, 17–27. [Google Scholar] [CrossRef]
  15. Tinoco, H.A.; Peña, F.M. Mechanical and geometrical characterization of fruits Coffea arabica L. var. Colombia to simulate the ripening process by finite element analysis. Eng. Agric. Environ. Food 2019, 12, 367–377. [Google Scholar]
  16. Tinoco, H.A. Modeling elastic and geometric properties of Coffea arabica L. var. Colombia fruits by an experimental-numerical approach. Int. J. Fruit Sci. 2017, 17, 159–174. [Google Scholar] [CrossRef]
  17. Li, P.; Lee, S.H.; Hsu, H.Y. Review on fruit harvesting method for potential use of automatic fruit harvesting systems. Procedia Eng. 2011, 23, 351–366. [Google Scholar] [CrossRef] [Green Version]
  18. Wang, M.; Ma, S.; Xing, H.; Wang, F.; Xing, H.; Bai, J. An Experimental Study on a Specialized Catching Device for Mechanical Harvesting of Apples. In Proceedings of the 2019 ASABE Annual International Meeting, Boston, MA, USA, 7–10 July 2019; p. 1. [Google Scholar]
  19. Sola-Guirado, R.R.; Castro-García, S.; Blanco-Roldán, G.L.; Jiménez-Jiménez, F.; Castillo-Ruiz, F.J.; Gil-Ribes, J.A. Traditional olive tree response to oil olive harvesting technologies. Biosyst. Eng. 2014, 118, 186–193. [Google Scholar] [CrossRef]
  20. Torregrosa, A.; Ortí, E.; Martín, B.; Gil, J.; Ortiz, C. Mechanical harvesting of oranges and mandarins in Spain. Biosyst. Eng. 2009, 104, 18–24. [Google Scholar] [CrossRef]
  21. Tanigaki, K.; Fujiura, T.; Akase, A.; Imagawa, J. Cherry-harvesting robot. Comput. Electron. Agric. 2008, 63, 65–72. [Google Scholar] [CrossRef]
  22. Coelho, A.L.D.F.; Santos, F.L.; Pinto, F.D.A.D.C.; Queiroz, D.M.D. Detachment efficiency of fruits from coffee plants subjected to mechanical vibrations. Pesqui. Agropecu. Tropical. 2015, 45, 406–412. [Google Scholar] [CrossRef] [Green Version]
  23. Velloso, N.S.; Magalhães, R.R.; Santos, F.L.; Santos, A.A.R. Modal properties of coffee plants via numerical simulation. Comput. Electron. Agric. 2020, 175, 105552. [Google Scholar]
  24. Júnior, L.D.G.F.; da Silva, F.M.; Ferreira, D.D.; de Souza, C.E.P.; Pinto, A.W.M.; de Melo Borges, F.E. Dynamic behavior of coffee tree branches during mechanical harvest. Comput. Electron. Agric. 2020, 173, 105415. [Google Scholar] [CrossRef]
  25. Oliveira, E.D.; Silva, F.M.D.; Salvador, N.; Figueiredo, C.A. Influência da vibração das hastes e da velocidade de deslocamento da colhedora no processo de colheita mecanizada do café. Eng. Agríc. 2007, 27, 714–721. [Google Scholar] [CrossRef] [Green Version]
  26. Santos, F.L.; Queiroz, D.M.D.; Pinto, F.D.A.D.C.; Resende, R.C.D. Efeito da frequência e amplitude de vibração sobre a derriça de frutos de café. Rev. Bras. Eng. Agríc. Ambient. 2010; 14, 426–431. [Google Scholar]
  27. Santos, F.L.; Queiroz, D.M.D.; Valente, D.S.M.; Coelho, A.L.D.F. Simulation of the dynamic behavior of the coffee fruit-stem system using finite element method. Acta Sci. Technol. 2015, 37, 11–17. [Google Scholar] [CrossRef]
  28. Villibor, G.P.; Santos, F.L.; de Queiroz, D.M.; Junior, J.K.K.; de Carvalho Pinto, F.D.A. Dynamic behavior of coffee fruit-stem system using modeling of flexible bodies. Comput. Electron. Agric. 2019, 166, 105009. [Google Scholar] [CrossRef]
  29. Cardona, C.I.; Tinoco, H.A.; Pereira, D.A.; Buitrago-Osorio, J.; Perdomo-Hurtado, L.; Hurtado-Hernandez, M.; Lopez-Guzman, J. Vibration Shapes Identification Applying Eulerian Video Magnification on Coffee Fruits to Study the Selective Harvesting. In Proceedings of the 2020 19th International Conference on Mechatronics-Mechatronika (ME), Prague, Czech Republic, 2–4 December 2020. [Google Scholar]
  30. Castro-Garcia, S.; Blanco-Roldán, G.L.; Ferguson, L.; González-Sánchez, E.J.; Gil-Ribes, J.A. Frequency response of late-season ‘Valencia’orange to selective harvesting by vibration for juice industry. Biosyst. Eng. 2017, 155, 77–83. [Google Scholar] [CrossRef]
  31. Nenadic, Z.; Burdick, J.W. Spike detection using the continuous wavelet transform. IEEE Trans. Biomed. Eng. 2004, 52, 74–87. [Google Scholar] [CrossRef] [PubMed] [Green Version]
  32. Abdel-Fattah, H.M.; Shackel, K.A.; Slaughter, D.C. Methodology for determining Almond Shaker Displacement and Frequency. Appl. Eng. Agric. 2003, 19, 141–144. [Google Scholar]
  33. Ghobber, S. Some results on wavelet scalograms. Int. J. Wavelets Multiresolut. Inf. Process. 2017, 15, 1750019. [Google Scholar] [CrossRef]
  34. Rincon-Jimenez, A.; Tinoco, H.A.; Buitrago-Osorio, J.; Ocampo, O.; Berrio, L.V.; Rodriguez-Sotelo, J.L.; Arizmendi, C. Ripeness stage characterization of coffee fruits (coffea arabica L. var. Castillo) applying chromaticity maps obtained from digital images. Mater. Today Proc. 2021, 44, 1271–1278. [Google Scholar] [CrossRef]
  35. Al-Badour, F.; Sunar, M.; Cheded, L. Vibration analysis of rotating machinery using time–frequency analysis and wavelet techniques. Mech. Syst. Signal Process. 2011, 25, 2083–2101. [Google Scholar] [CrossRef]
  36. Kim, H.; Melhem, H. Damage detection of structures by wavelet analysis. Eng. Struct. 2004, 26, 347–362. [Google Scholar] [CrossRef]
  37. Daubechies, I. Ten Lectures on Wavelets; Society for Industrial and Applied Mathematics: SIAM: Philadelphia, PA, USA, 1992. [Google Scholar]
  38. Li, L.; Cai, H.; Jiang, Q. Adaptive synchrosqueezing transform with a time-varying parameter for non-stationary signal separation. Appl. Comput. Harmon. Anal. 2020, 49, 1075–1106. [Google Scholar] [CrossRef] [Green Version]
  39. Meignen, S.; Oberlin, T.; McLaughlin, S. A New Algorithm for Multicomponent Signals Analysis Based on SynchroSqueezing: With an Application to Signal Sampling and Denoising. IEEE Trans. Signal Process. 2012, 60, 5787–5798. [Google Scholar] [CrossRef]
  40. Lee, H.K.; Choi, Y.S. Application of continuous wavelet transform and convolutional neural network in decoding motor imagery brain-computer interface. Entropy 2019, 21, 1199. [Google Scholar] [CrossRef] [Green Version]
  41. Kaur, N.; Goyal, S.; Anand, K.; Sahu, G.K. A cost-effective approach for assessment of pre-stressing force in bridges using piezoelectric transducers. Measurement 2021, 168, 108324. [Google Scholar] [CrossRef]
  42. Fu, Z.F.; He, J. Modal Analysis; Butterworth-Heinemann: Waltham, MA, USA, 2001. [Google Scholar]
Figure 1. Color measurement on coffee fruits with a colorimeter.
Applsci 11 09346 g001
Figure 2. Ripening stage classifications and location of the measured coffee fruits.
Applsci 11 09346 g002
Figure 3. Experimental setup for velocity measurements applying linear chirp excitation. (a) Coffee fruit orientation system ( e 1 - e 2 - e 3 ), and measuring points. (b) View of the measurment proccess with the laser.
Applsci 11 09346 g003
Figure 4. Experimental setup for modal analysis. (a) Lateral view of the experiment. (b) Frontal view of sample bonded to the PZT. (c) Upper view of the excitation support with piezotransducer and electrodes. (d) Representation of the FFT of input voltage.
Applsci 11 09346 g004
Figure 5. Time domain results of velocity between 10 and 100 Hz in e 1 and e 2 . P1 and P2 measurements for each sample. (a) Group 1 (UR1, SMR1, and RP1). (b) Group 2 (UR2, SMR2, and RP2).
Applsci 11 09346 g005
Figure 6. Time-domain results of velocity between 100 and 1000 Hz in e 1 and e 2 . P1 and P2 measurements for each sample. (a) Group 1 (UR1, SMR1, and RP1). (b) Group 2 (UR2, SMR2, and RP2).
Applsci 11 09346 g006
Figure 7. Mean RMS of velocity measurements in directions e 1 and e 2 . (a) 10 to 100 Hz. (b) 100 to 1000 Hz.
Applsci 11 09346 g007
Figure 8. Fast Fourier transform (FFT) of the velocity measurements. At the e 1 direction: (a) 10–100 Hz and (b) 100–1000 Hz. At the e 2 direction: (c) 10–100 Hz and (d) 10–1000 Hz.
Applsci 11 09346 g008
Figure 9. Scaled mechanical impedance. (a) 10–100 Hz for P1, (b) 100–1000 Hz for P1, (c) 10–100 Hz for P2, (d) 10–1000 Hz for P2.
Applsci 11 09346 g009
Figure 10. Scalograms wavelet analysis for group 1 between 10 and 100 Hz measured in UR1, SMR1, and RP1. (a) Analysis for P1. (b) Analysis for P2.
Applsci 11 09346 g010
Table 1. Ellipses parameters for ripening stages classification.
Ripening
Stage
Parameter
μ a μ b λ max λ min β
Unripe (UR)−11.8328.7013.836.281.55
Semi-ripe (SMR)10.3535.2019.0614.332.45
Ripe (RP)31.0017.2116.269.171.646
Table 2. Geometrical and physical properties of the coffee fruits selected as study samples.
Item a * b * Φ1 [mm]Φ2 [mm]Φ3 [mm]Mass [g]
UR1−13.9724.7513.6011.417.401.48
UR2−12.8327.9613.0011.8216.141.35
SMR18.2444.9213.0011.5016.241.70
SMR23.0351.1212.9011.1015.601.63
RP139.6614.3413.8012.4015.701.87
RP234.4117.1713.6412.3015.201.95
Table 3. Interest resonance peaks in the ranges of 10–100 Hz and 100–1000 Hz.
Ripening StageInterest Peaks from 10 to 100 [Hz]Interest Peaks from 100 to 1000 [Hz]
P1P2P1P2
UR123.3425.86774766.06
UR224.0225.43767.9769.03
SMR128.6331.32802.98826.74
SMR239.2531.3746.23787.25
RP140.542.82762.43690
RP236.2344.95713.28694.5
Publisher’s Note: MDPI stays neutral with regard to jurisdictional claims in published maps and institutional affiliations.

