Article

Analysis of Long-Term Change in the Thermal Resistance of Extruded Insulation Materials through Accelerated Tests

1
Building Energy Research Department, Korea Institute of Civil Engineering and Building Technology, 283 Goyangdaero, Ilsanseogu, Goyang 10223, Korea
2
Department of Architectural Engineering, University of Seoul, 163 Seoulsiripdaero, Seoul 02592, Korea
*
Author to whom correspondence should be addressed.
Submission received: 3 September 2021 / Revised: 25 September 2021 / Accepted: 29 September 2021 / Published: 8 October 2021
(This article belongs to the Section Energy Science and Technology)

Abstract

:

Featured Application

Experimental results in this study can be utilized to design building energy performance, simulate and anticipate the degradation of insulation material by ageing. Based on this, remodeling approach and practical reinforcement method can be designed energy efficiently for old buildings as well.

Abstract

Two experiments were executed to examine the slice accelerated test method, suggested in ISO 11561 “Ageing of thermal insulation materials—Determination of the long-term change in thermal resistance of closed-cell plastics (accelerated laboratory test methods)” and to observe the changes in the thermal performance of insulation material over time by the real-time ageing process. The accelerated test method was conducted for 120 consecutive days using 10 mm thick-sliced specimens, which were sampled from a 50 mm thick plate body. The real-time ageing process was performed for 5000 consecutive days under constant temperature and relative humidity conditions as of 20 ± 5 °C and 50 ± 5% without any slicing. Degradation of thermal performance was shown to be stabilized at around 38 to 41% down from the initial values, which were correspondent with the approximately 10 days after the initial time. The real-time ageing process revealed similar degradation levels at around 130 days after the starting point. Converting the results using the scaling method specified in ISO 11561, the change was found in the range of 37 to 41% for the thermal resistance after 25 years and of 30 to 38% for the 25-year-average thermal resistance, respectively. Within the 10% error range, both the accelerated method and real-time ageing resulted in a similar level of degradation. Consequently, it was our observation that the slice accelerated test was quite enough to predict the practical degradation of insulation materials with at least 90% of accuracy under the specified time duration, temperature and thickness satisfactions.

1. Introduction

Insulation is the most basic and commonly used passive method to decrease the energy consumption of buildings and to reduce cooling and heating loads. Insulation materials in the outer walls, roofs, and floors of buildings directly affect the cooling and heating loads. These materials should be replaced before the end of their service lifetime during remodeling and renovation to maintain the performance of buildings. Therefore, insulation materials are carefully selected at the design stage based on the purpose and characteristics of the building. Insulation materials used in buildings are classified as inorganic and organic insulation materials. Inorganic materials include glass wool, mineral wool, and gypsum board, which consist mainly of an open-cell structure and do not have an organic polymer matrix. Owing to this nature, generally, inorganic insulation materials are known to have better fire-resistant properties than organic insulation materials. Compared to inorganic insulation materials, organic insulation materials have a relatively lower thermal conductivity due to the cellular structure with highly formed closed cells. Expanded Styrene (EPS), polyurethane (PUR), polyisocyanurate (PIR), extruded styrene (XPS), and phenolic foam (PF) are representative insulation materials and are known to be highly insulative materials due to their unique closed-cell structure compared to open-cell structure inorganic materials. These can be divided into extruded insulation materials, bead insulation materials, urethane foam, and phenol foam according to the foaming process and raw materials [1,2]. Extruded insulation materials are made by foaming gas, with a lower thermal conductivity than air, to secure a high insulation performance during manufacturing. HCFC-141b, HCFC-142b are representative foaming gases, which have widely been used due to lower thermal conductivities ranging from 0.0097 to 0.0115 W / ( m · K ) than 0.025 W / ( m · K ) of air [3]. However, this foaming gas is gradually released over time and replaced with external air, which degrades the insulation performance of the materials by 30 to 40%. Basically, this degradation occurs at different speeds of time, which are a function of polymer type, cellular structure, temperature and foaming gas. Among these, foaming gas is generally known to directly influence the thermal conductivity by replacing it with air. At the early state, diffusion of air inside cellular structure happens faster than that of foaming gas, and induces a rapid decrease of thermal conductivity. As equilibrium in between diffusion of air and foaming gas inside the cellular structure is achieved, degradation of thermal conductivity slows down and stops when each concentration of air and foaming gas become similar [4,5]. Even if a foaming gas releases continuously inside the structure, degradation in thermal conductivity is observed very slowly. It was reported that the thermal resistance of foam insulation material was the function of time and thickness of material in the below equation [6,7].
Thermal   resistance = F { e ( time ( thickness ) 2 ) }
The heat transport through cellular foam plastics is the sum of heat capacities of radiation, gas mixture, and solid polymer. Heat capacities of solid polymer and radiation are relatively constant as foaming gas and time change. Therefore, long-term change in thermal performance can be regarded as governed by foaming gas concentration. The primary parameters of gas concentration in the cellular structure are effective diffusion coefficient, thickness, and time. To evaluate the contribution of each parameter, thickness and diffusion coefficient can be modulated by elevating the temperature, slicing thick material, and ageing for an intended time. However, it was reported that controlling temperature was not suggested because diffusivity of foaming gas could not be the same and controlled for foam plastic insulation material from each different manufacturer. In addition, closed cells in cellular structure, which mainly play an insulating role in foam material, can be readily damaged as temperature increases [8]. Meanwhile, thickness control can be relatively accurately conducted to modulate the degradation speed as follows in the below equation by avoiding microstructure corruption [9].
time 2 = time 1 ( thickness 2 thickness 1 ) 2
The change over time can be divided into primary and secondary stages. Considering duration time, it is quite difficult to analyze the secondary stage experimentally at least for over ten years. To address this practically, International Organization for Standardization (ISO) suggested an accelerated laboratory test method to speed up the foaming gas release intentionally by slicing thick specimens, which makes it possible to predict the thermal properties after 25 years. In addition to that, ISO 11561 [6], which specifies the accelerated laboratory test method by slicing, deals with both the thermal resistance in the 25-year average and the value after 25 years. It indicates that differences below 10% may occur for the measurement depending on the sample thickness. Therefore, there has been an intense discussion, but not much research has been performed empirically to figure out how this calculative difference could be induced. The foaming gas type was examined to investigate the possibility of influence on thermal resistance change [10]. The thermal resistance of one or two organic insulation materials was observed, but influencing parameters were not systemically explored in previous cases [11]. In this study, we analyzed changes in the thermal performance of cellular plastic insulation materials over the actual elapsed time and based on the slice accelerated method described in ISO 11561, respectively. Measured thermal conductivity values of each method were compared and estimated by the scaling method suggested in ISO 11561 to elucidate the practical approach conditions in tests and scientific meanings.

2. Materials and Methods

2.1. Specimen and Measurement Conditions

The products used as specimens were collected within seven days of their production date and stored in a constant temperature and humidity chamber at 20 ± 5 °C with 50 ± 5% relative humidity. For the accelerated test, 50 mm products were sliced into five 10 mm specimens and then stacked.
For the specimen slicing method, ISO 11561 specifies using a butcher knife, fine-toothed band saw, or a thin heat line cutter for slicing. For a preliminary test, as seen in Figure 1, we tested various slicing methods such as a cutter knife, butcher knife, mechanical saw blade, woodworking saw blade, and a heat line, and examined the geometry and degree of damage of the sliced surface using a magnifying glass to choose a suitable slicing method for cutting specimens in this study. The specimen slice cut using the cutter and butcher knives showed well-maintained independent, extruded polystyrene cells, and the shape of independent bubbles on the back surface was clearly observed. However, the use of saw blades damaged a considerable portion of the cells on the cut surface. The heat from the heat line, which is most commonly used for cutting foam plastics, destroyed the cells on the cut surface and damaged the shape of the cells beyond identification considering they were melted and tangled like a spider’s web. While most methods damaged the surface layer, it was observed in our test that a cutter knife was the appropriate tool to maintain the cells on the cut surface and exhibit the lowest degree of damage. Therefore, all specimens were prepared by using a cutter knife, which has a blade thickness of less than 0.5 mm.
For measuring the thermal conductivity, heat flow meters from Netzsch (Heat Flow Meters HFM 436 Lambda Series) were used based on the measurement methods of ASTM C 518 (Standard Test Method for Steady-State Thermal Transmission Properties by means of the heat flow meter apparatus) and ISO 8301 (Thermal Insulation—Determination of Steady-State Thermal Resistance and Related Properties). When heat is applied to the specimen, heat is transferred by the specimen in a steady state. Heat flux, thermal conductivity and test procedure including calibration and measurement method were followed by ASTM 518. In ISO 8301, three major components of heat transfer such as radiation, conduction in both solid matrix and foaming gas phase, and convection were covered in dealing with the heat flow meter to measure the steady-state heat transfer by the specimen. Parameters such as material composition, moisture, mean temperature, and prior thermal history regarding conditioning of material, which may infect the thermal transmission properties were referred [12,13]. The high and low temperatures for the experiment were 33 °C and 7 °C, respectively, with an average temperature as of 20 ± 1 °C [14]. HEM 436 Lambda deals with specimens from 5 mm up to 100 mm in thickness and 305 mm in length. Thermal conductivity in between 0.005~0.50 W/(m∙K) can be measured with an accuracy range of ±1~±3% and 0.5% of reproducibility.
Four different samples were prepared as summarized in Table 1. Insulation material was the same as XPS special grade in Korea. Specimen 1 and 2 represented the results of specimens on the 1st and 2nd floor from our previous study about real-time ageing tests for 50 mm thick XPS board [15]. To compare with previous results, additional samples were denoted as specimen 3 and 4, respectively, for the sliced acceleration test. All samples were stored under constant temperature and relative humidity as of 23 °C and 50%, respectively. Difference between specimen 1 and 2 was solar radiation exposure condition.
In Figure 2, a schematic diagram of the heat flow meter was drawn to simply describe the principle of heat flow measurement. As shown in Figure 2, the insulation specimen is installed on a heat flow meter between the top high-temperature plate and bottom low-temperature plate. The temperature difference is induced on the opposite side of the specimen by the top and bottom plates and generates heat flow from high temperature to low temperature. By controlling the temperature difference of plates, corresponding heat flow generation depending on a specimen can be measured as a function of specimen thickness and thermal conductivity [12,13].

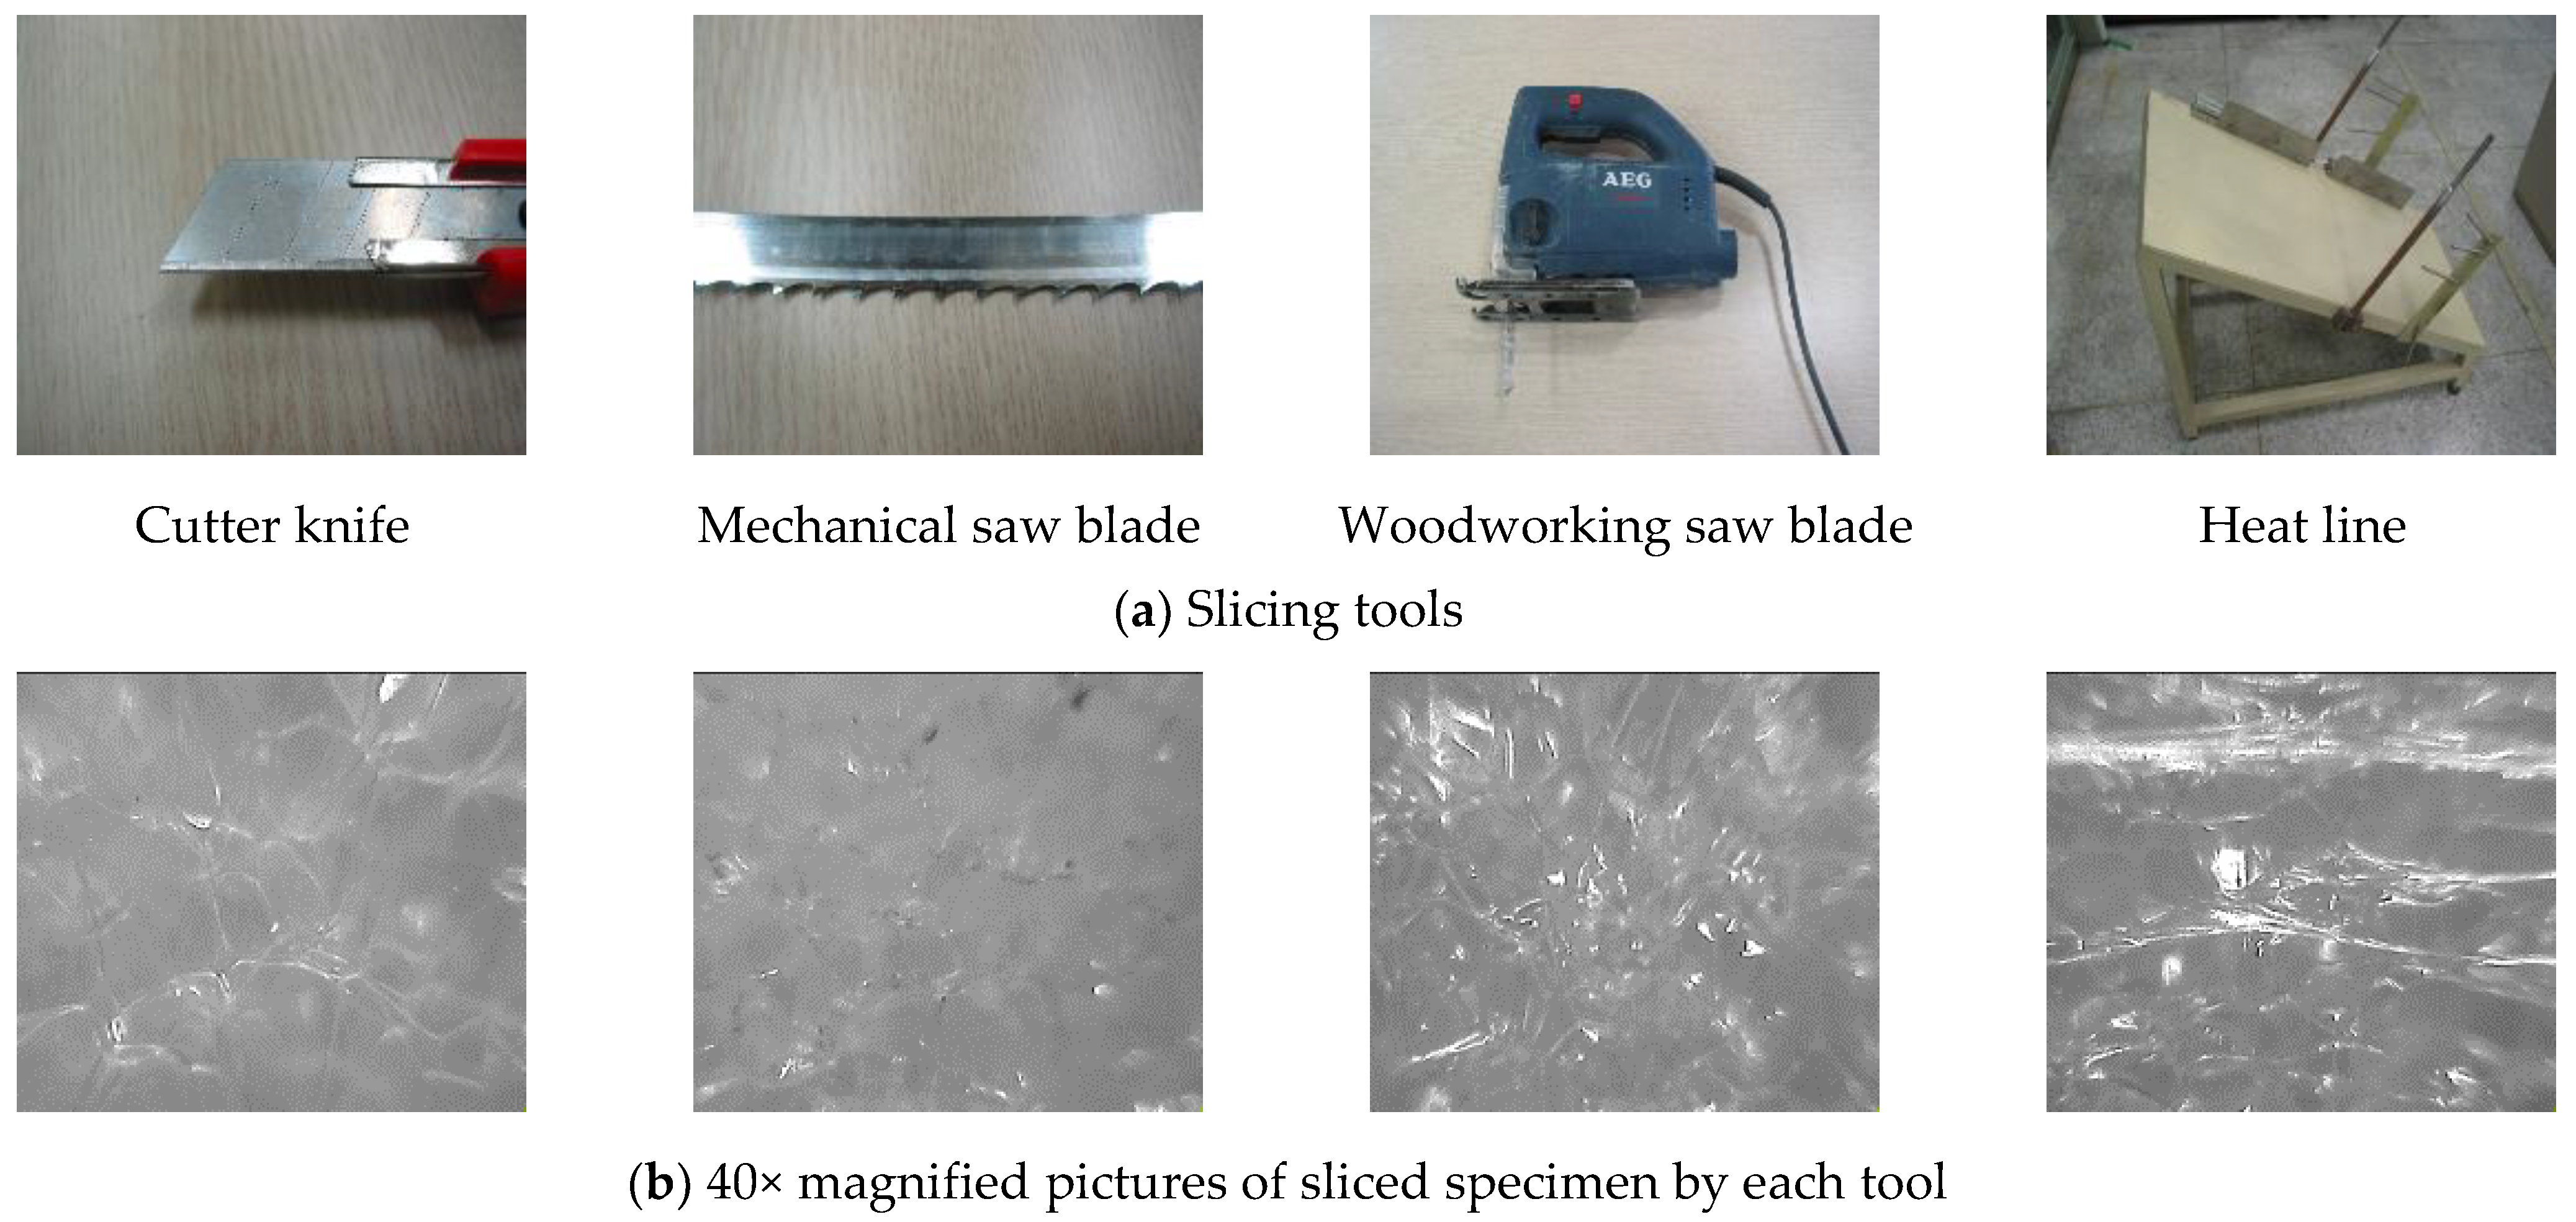
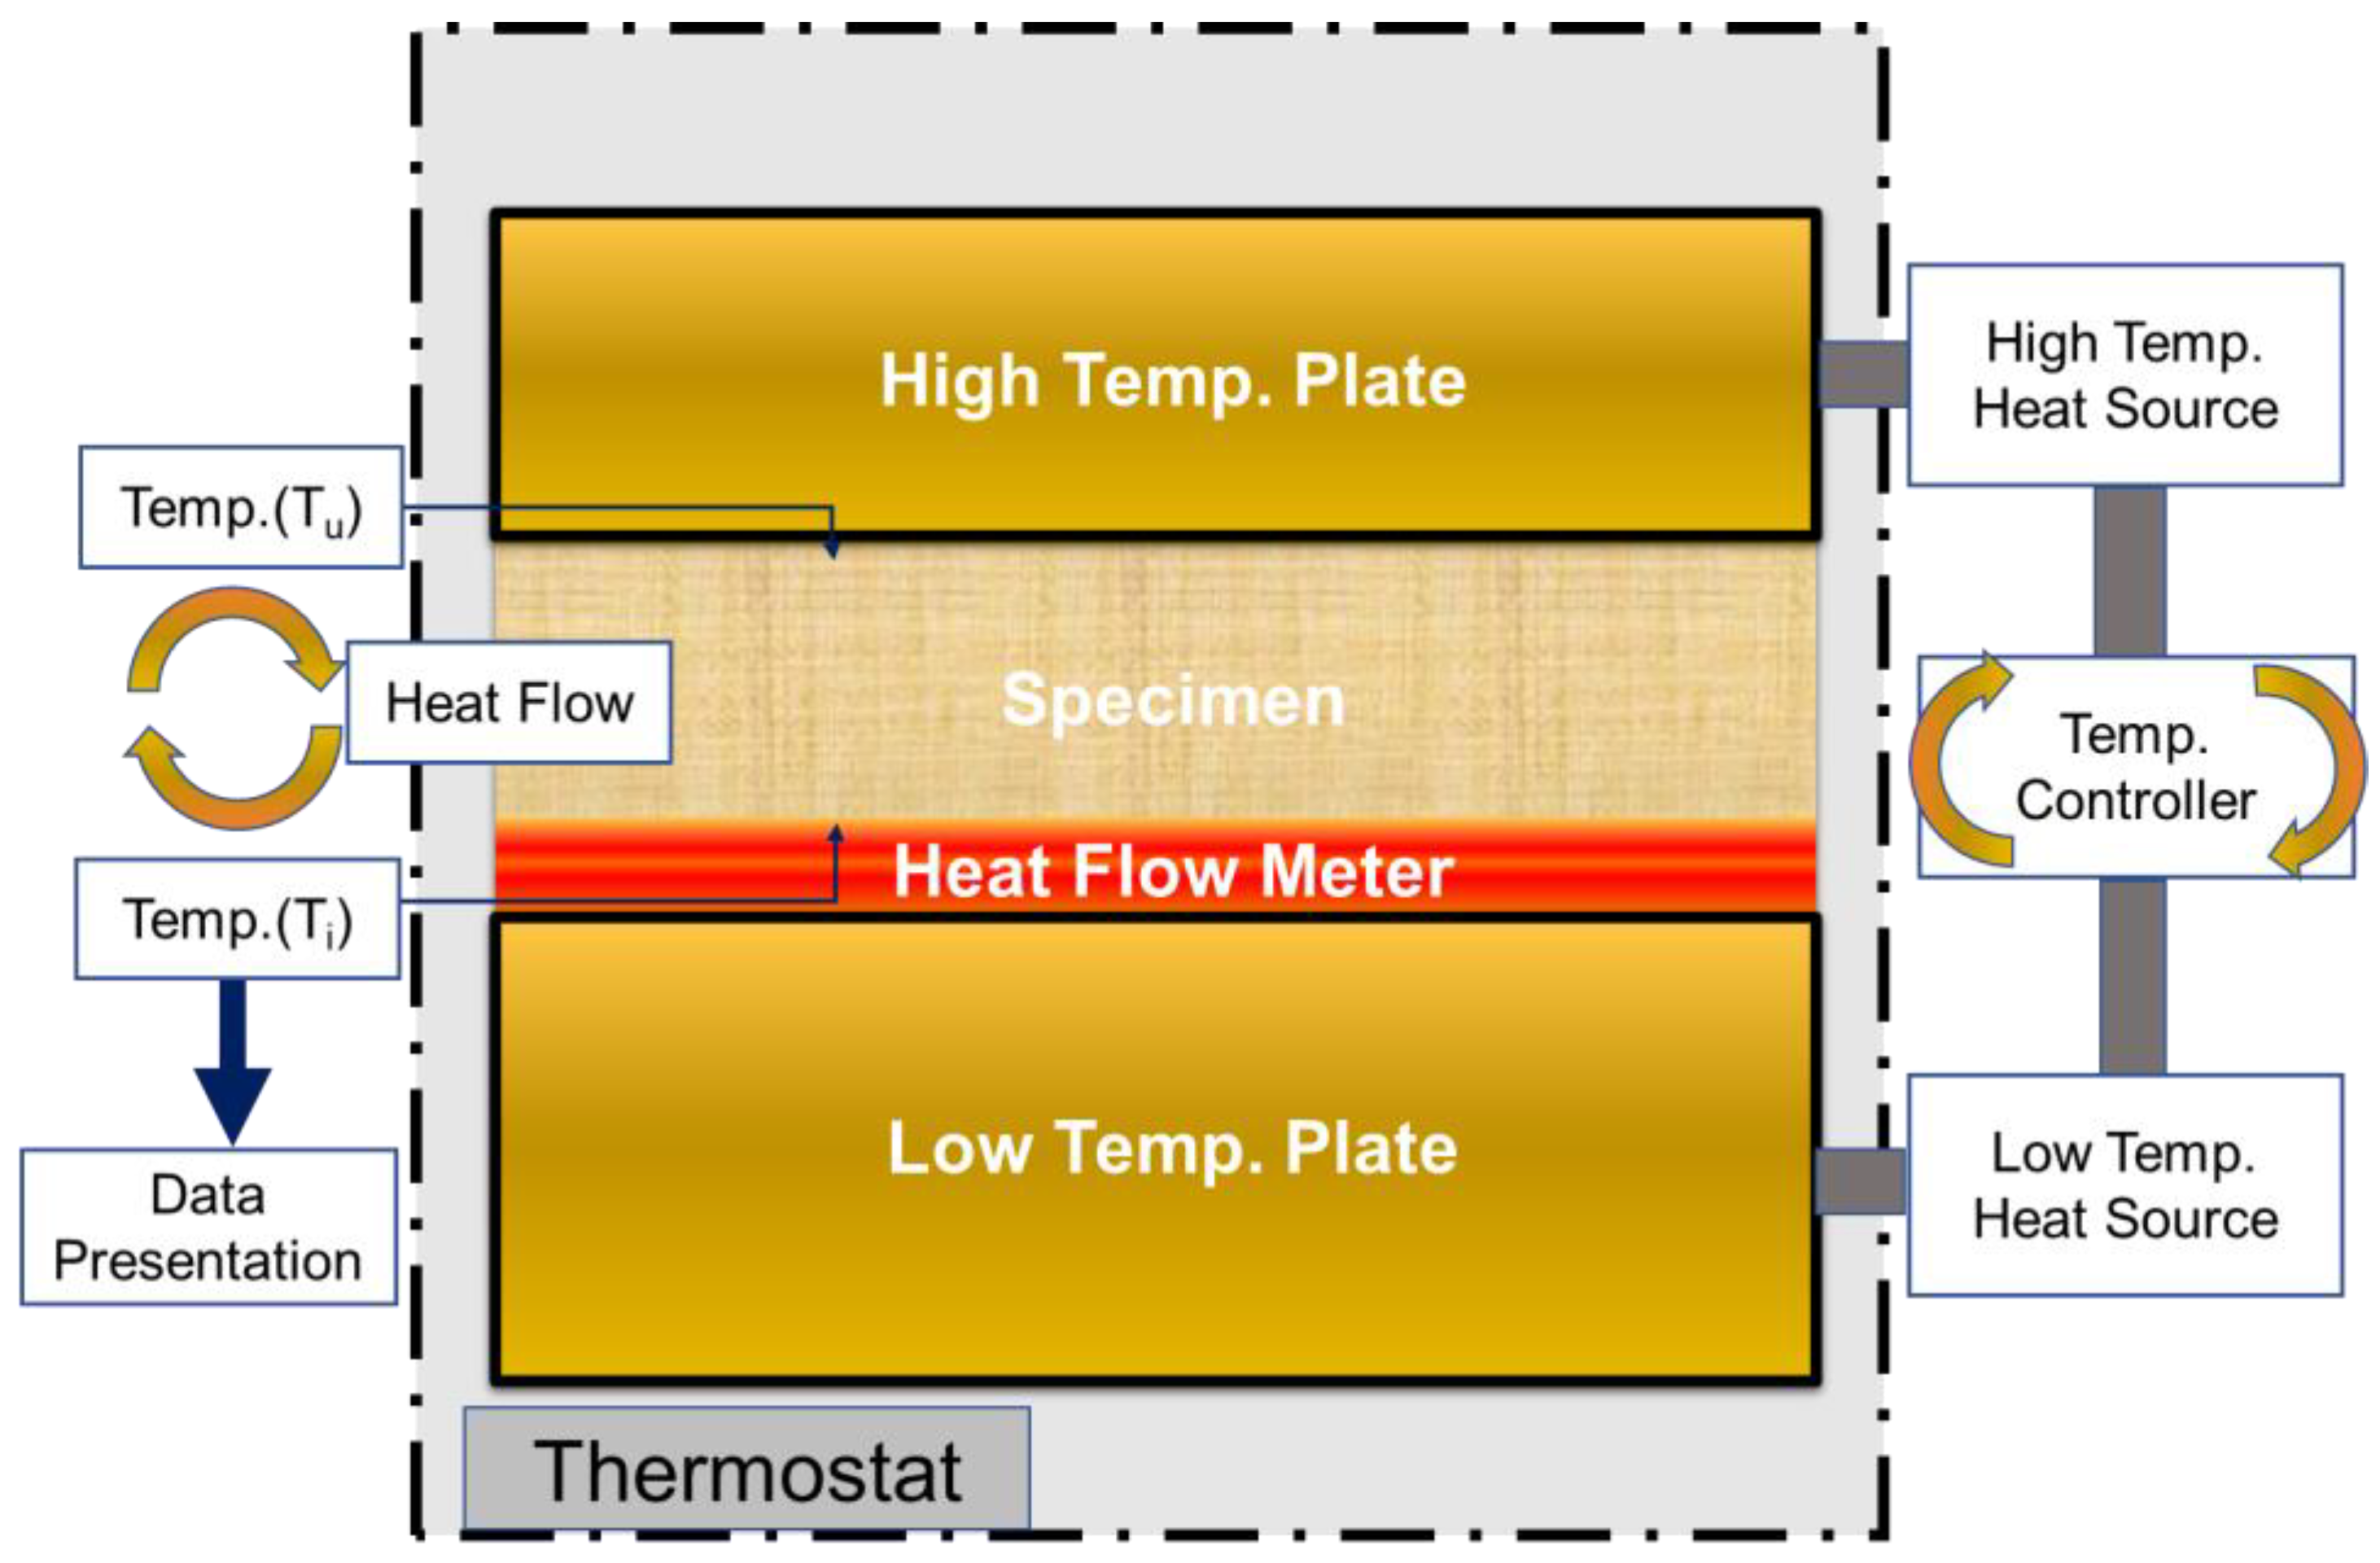
2.2. ISO 11561 Test Method

ISO 11561 “Ageing of thermal insulation materials—Determination of the long-term change in thermal resistance of closed-cell plastics (accelerated laboratory test methods)” demonstrates the method of determining the ageing of independent bubble plastic insulation materials based on the changes in thermal resistance over time owing to the diffusion of gas inside the materials, i.e., reduction in thermal resistance over time ISO 11561 also proposes the test method A and B regarding sample preparation, which regulates slicing thickness and execution time. Method A is “Test to determine time-dependent change in thermal properties of core materials” and Method B is “Simplified test to determine a design life-time thermal resistance of an unfaced product”. Method A is intended to observe the primary stage of degradation, which intentionally induces most part of the foaming gas release out of the thin specimen. Method B is to predict the thermal resistance of 25 years’ time passage at the secondary stage of ageing by scaling 91 ± 7 days observed data. So, the biggest difference in test procedure is the conditioning time to scale the actual time of 25 years to 91 ± 7 days. A simplified comparison between the two methods is summarized in Table 2. However, the standard described the limitations of test method B considering it cannot predict the product characteristics at high temperatures, that is, changes due to the internal components, and has specified the need for further research. Therefore, test method A was used in this study.
Test method A is used to periodically measure the thermal resistance or thermal conductivity of a thin slice of the specimen (core part of insulation material) pretreated using a standard test method under constant environmental conditions within a short time interval. Most studies on the ageing of foam plastics express the thermal resistance γ (reciprocal of thermal conductivity) as a function of the logarithm of time, which is given as:
γ = F ( logt )
The dimensionless thermal resistance is obtained when the thermal resistance γ (usually the initial few days) is utilized to the point where the initial time, used as a reference value, is zero. It is given as
γ t γ 0 = F ( logt )
The above equation can be used to understand the general characteristics of the ageing process without paying undue attention to absolute values. If R t is the thermal resistance after day t and R av ,   n is the average thermal resistance over a period of n days, then
R av ,   n = R t n
Assuming the relationship between R and t is the exponential function, Equations (3) and (4) would be the same as in Equation (6).
R i R n R 0 R n = 1     logi logn
where R 0 and R n are the thermal resistances on the first and last days of the ageing period, respectively. Therefore, the average thermal resistance R a v for n days is the same as the thermal resistance R t after t days, given as:
t = n 10
Similarly, we can compare the phenomenon of nitrogen and oxygen present in air penetrating into the independent bubble foam plastic insulation material and releasing foaming gas to a method that describes the heating or cooling process of a slab. In other words, when the temperature of the slab is uniform at T 1 and the surface temperature reduces to T 2 , the average temperature T m of the slab can be expressed as
T m = ( T 0     T 2 ) ( T 1     T 2 ) = 8 π 2 1 2 n + 1 exp [ F 0 ( 2 n + 1 ) 2 π 2 ]
where
F 0 = α · t d 2 = λ ρ · C p
When F0 (Fourier number) is large enough (i.e., when the duration is long, or the thickness is small), and n = 0 , the series in Equation (8) rapidly converges, and Equation (8) can be simplified As
( T m     T 2 ) ( T 1     T 2 ) = 8 π 2 · exp [ F 0 · π 2 ]
Here, in Table 3, all symbols and meaning of variables used in Equations (3)–(13) were summarized.
For each value, an exact exponential function is considered, provided the thickness and thermal diffusivity are known. This process is called diffusion progression, wherein the diffusion of gas can be interpreted as a mathematical model, similar to the diffusion of heat if the gas pressure changes according to changes in the temperature, and the effective gas diffusion coefficient changes according to the thermal diffusivity.
Therefore, the movement of gas can be interpreted from Equations (8) and (10), which show that the dimensionless logarithmic value of the relative pressure is always proportional to F 0 and has a linear relationship with F 0 if the value of F 0 is large, respectively. If F 0 is constant, the scaling technique of the movement process used to convert the diffusion rate of a thin specimen into that of a thick specimen is applied until Equation (8) demonstrates the gas movement process. Therefore, to compare the diffusion rate of the slab with all attribute sets ( d   and   D ) of the reference slab ( d 0 and D 0 ) as a specimen, the measured ageing time must be multiplied with the scaling factor, which similarly applies to comparing the diffusion rate of a slab with certain characteristics ( d   and   D ) with that of the reference plate ( d 0 and D 0 ).
t = t 0 · S
S = ( d 0 2 · D d 2 · D 0 )
Assuming D = D 0 for the material to be tested (i.e., when the material is homogeneous), the scaling factor can be expressed using the thickness ratio alone:
S = ( d 0 2 d 2 ) = ( 10 2 50 2 ) = 0.04
In summary, the relative thermal resistance ratio ( R t / R 0 : thermal resistance of the specimen after time t /initial thermal resistance) was calculated from the thermal resistance of the 10 mm thick specimen. Based on the calculated results, a graph was plotted as seen in Figure 3, where the x-axis represents the time taken to repeat the test until a constant linear relationship is achieved beyond the transition point.
Furthermore, the average thermal resistance of the specimen was determined, and the experimental result curve obtained was converted into the curve of the 10 mm thickness by using the scaling factor from Equation (13) to calculate the thermal resistance for the original thickness of the sample tested at the specified time. From these calculations, the specific thickness of foam insulation materials can be anticipated to have the deteriorated thermal resistance as a function of time, thickness and material type when considered inhomogeneities of cellular foam material and thickness measurement inaccuracy in a practical situation.

3. Results and Discussion

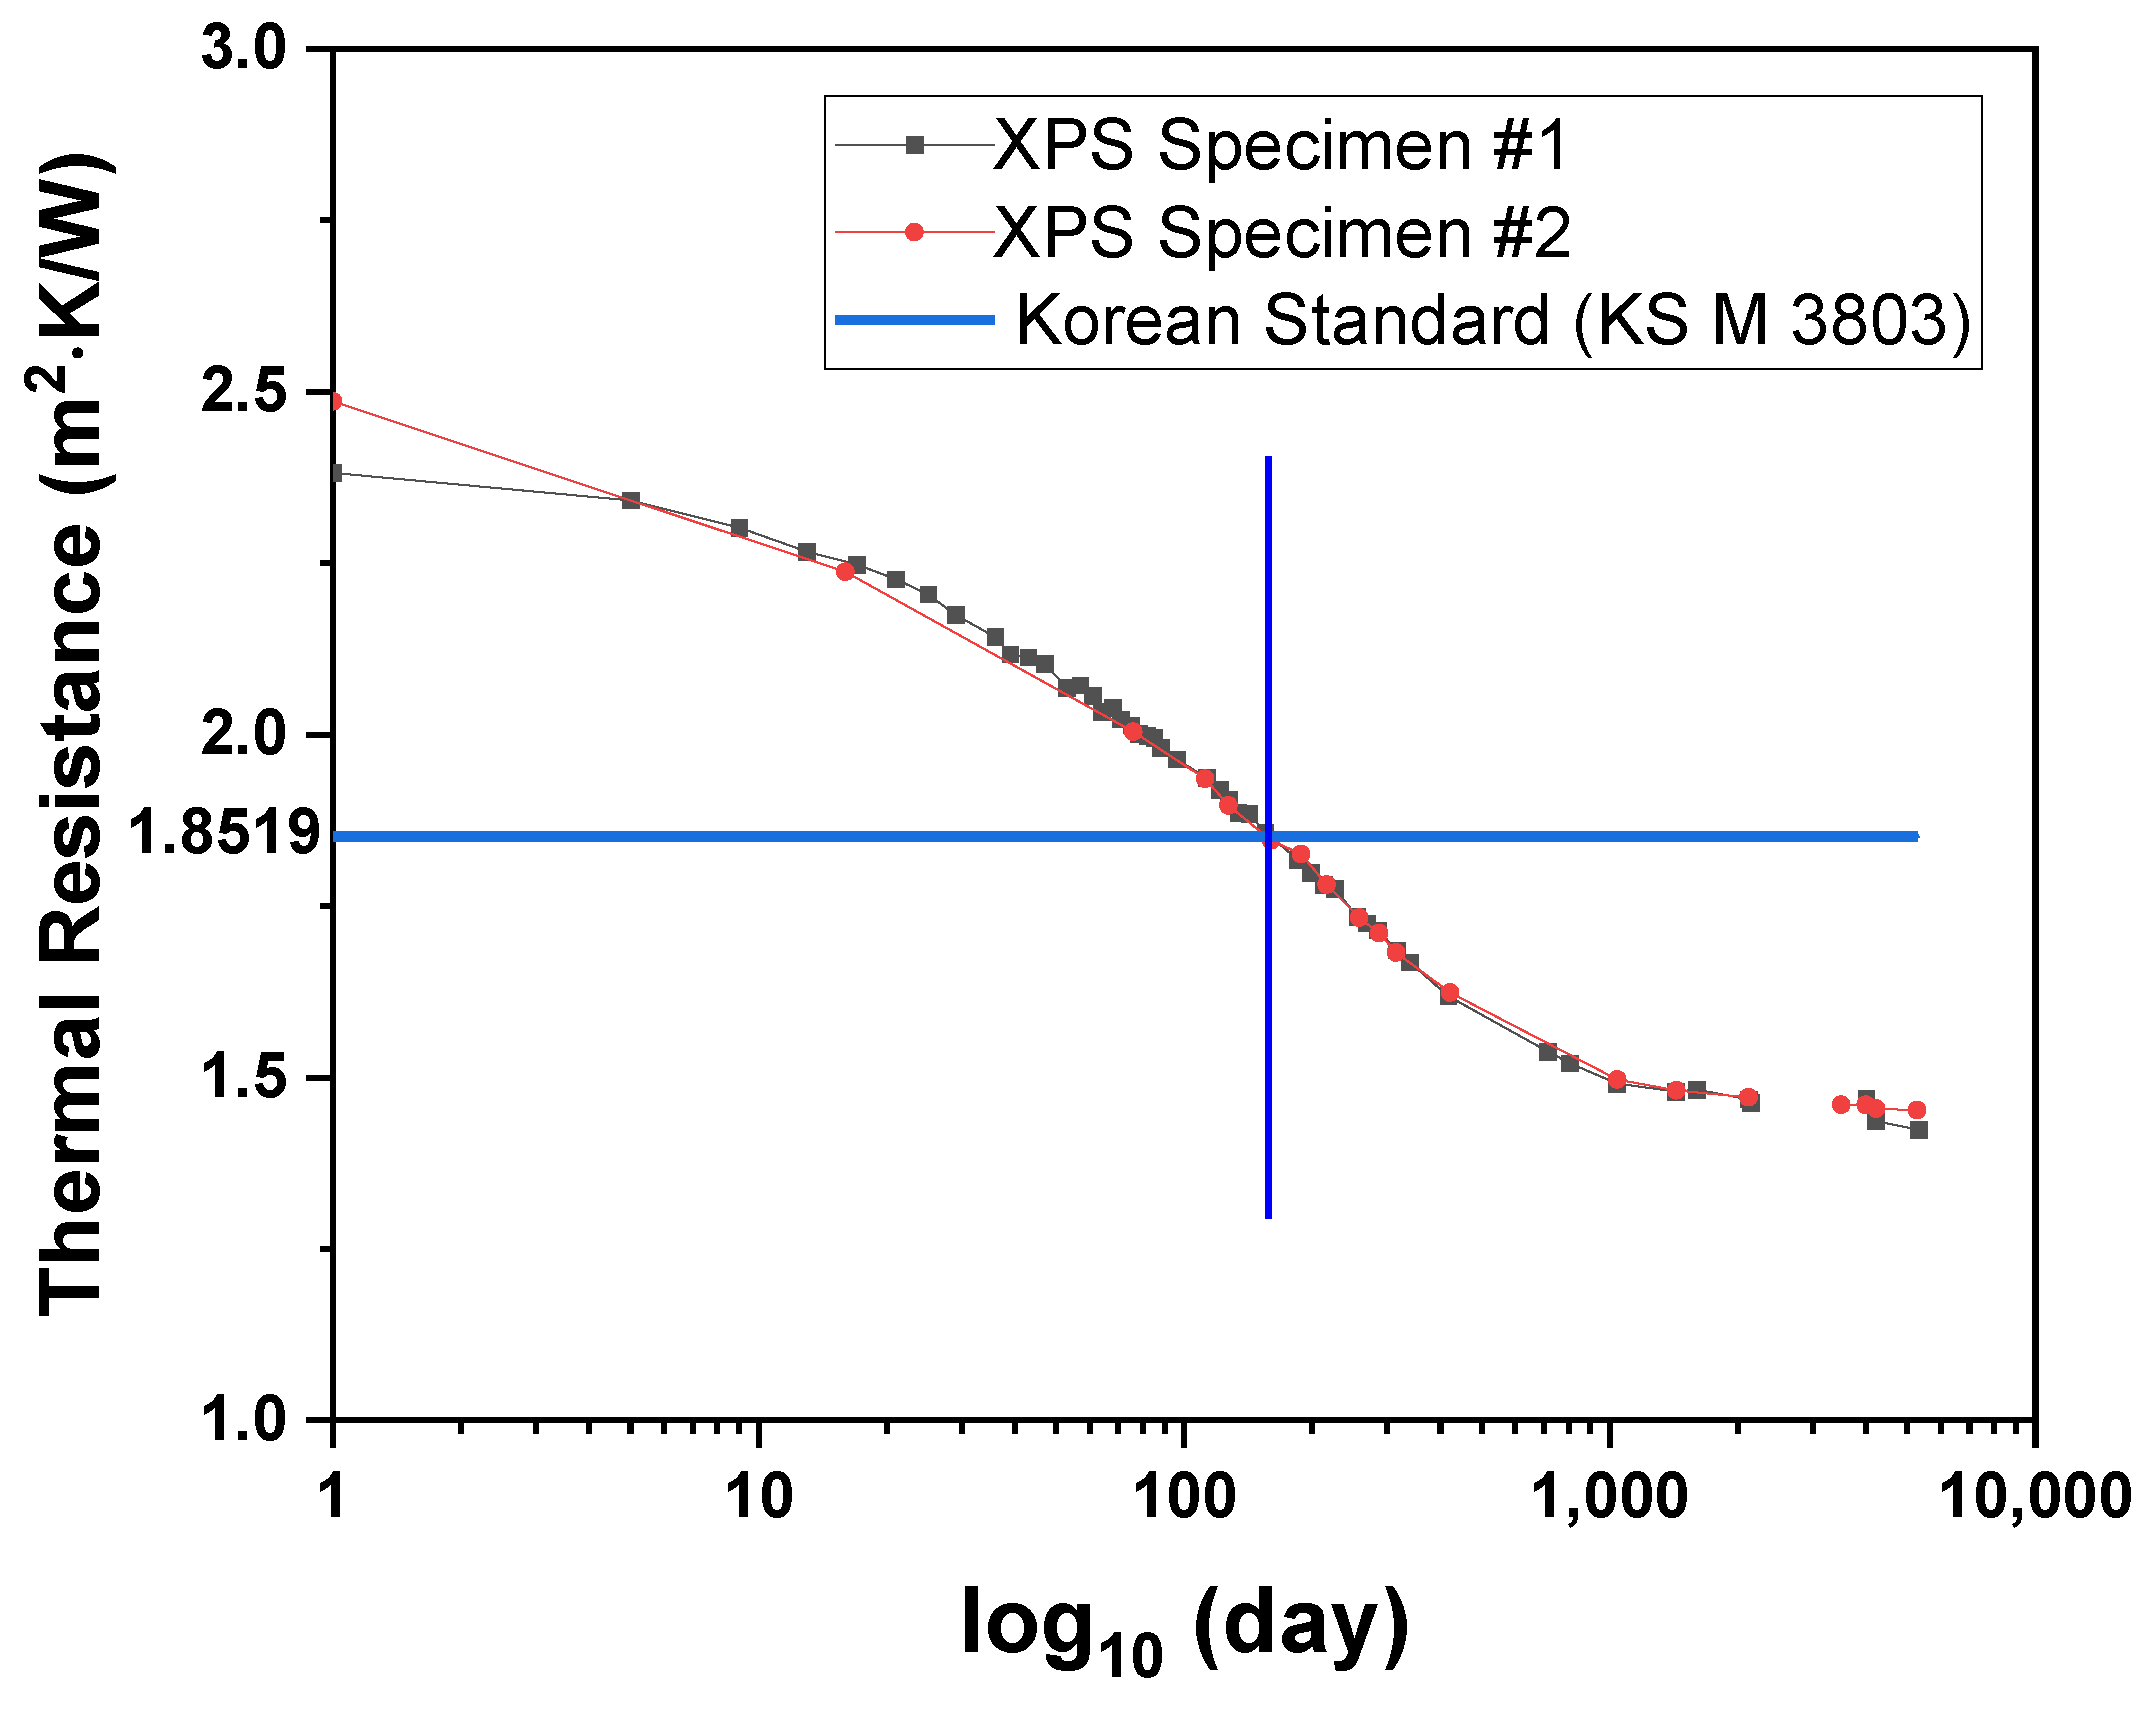
3.1. Ageing Based on the Actual Elapsed Time

In this section, measurement data of thermal resistance, while actual time passed for 50 mm thick XPS under 23 and 50% RH with and without solar radiation exposure conditions, are described. The thermal resistance profile graph of 50 mm thick extruded polystyrene (XPS) material under two experimental conditions was quoted as a function of time in log scale based on data in our previous study are as shown in Figure 4 [15]. The thermal performance of XPS exhibited a primary stage that showed rapid degradation in performance for approximately 1000 days and slow degradation in a second stage. The initial thermal resistance was measured in the range of 2.485~2.498 m 2 · K / W , and performance degradation of approximately 41% was observed compared to the initial value after approximately 5300 days, where the thermal resistance was measured in the range of 1.424~1.452 m 2 · K / W . As compared with the criteria value of 1.8519 m 2 · K / W in the Korean Standard (KS) M 3808 [16], which is positioned as a vertical dot line, thermal resistance values of two samples satisfied the value until 185 days as thermal resistance of 1.8173 m 2 · K / W for sample 3 and 188 days as of 1.82562 m 2 · K / W for sample 4, respectively. Consequently, it was concluded that thermal resistances of samples were over the Korean Standard at first installation, but deteriorated down 3 months later below the Korean Standard.

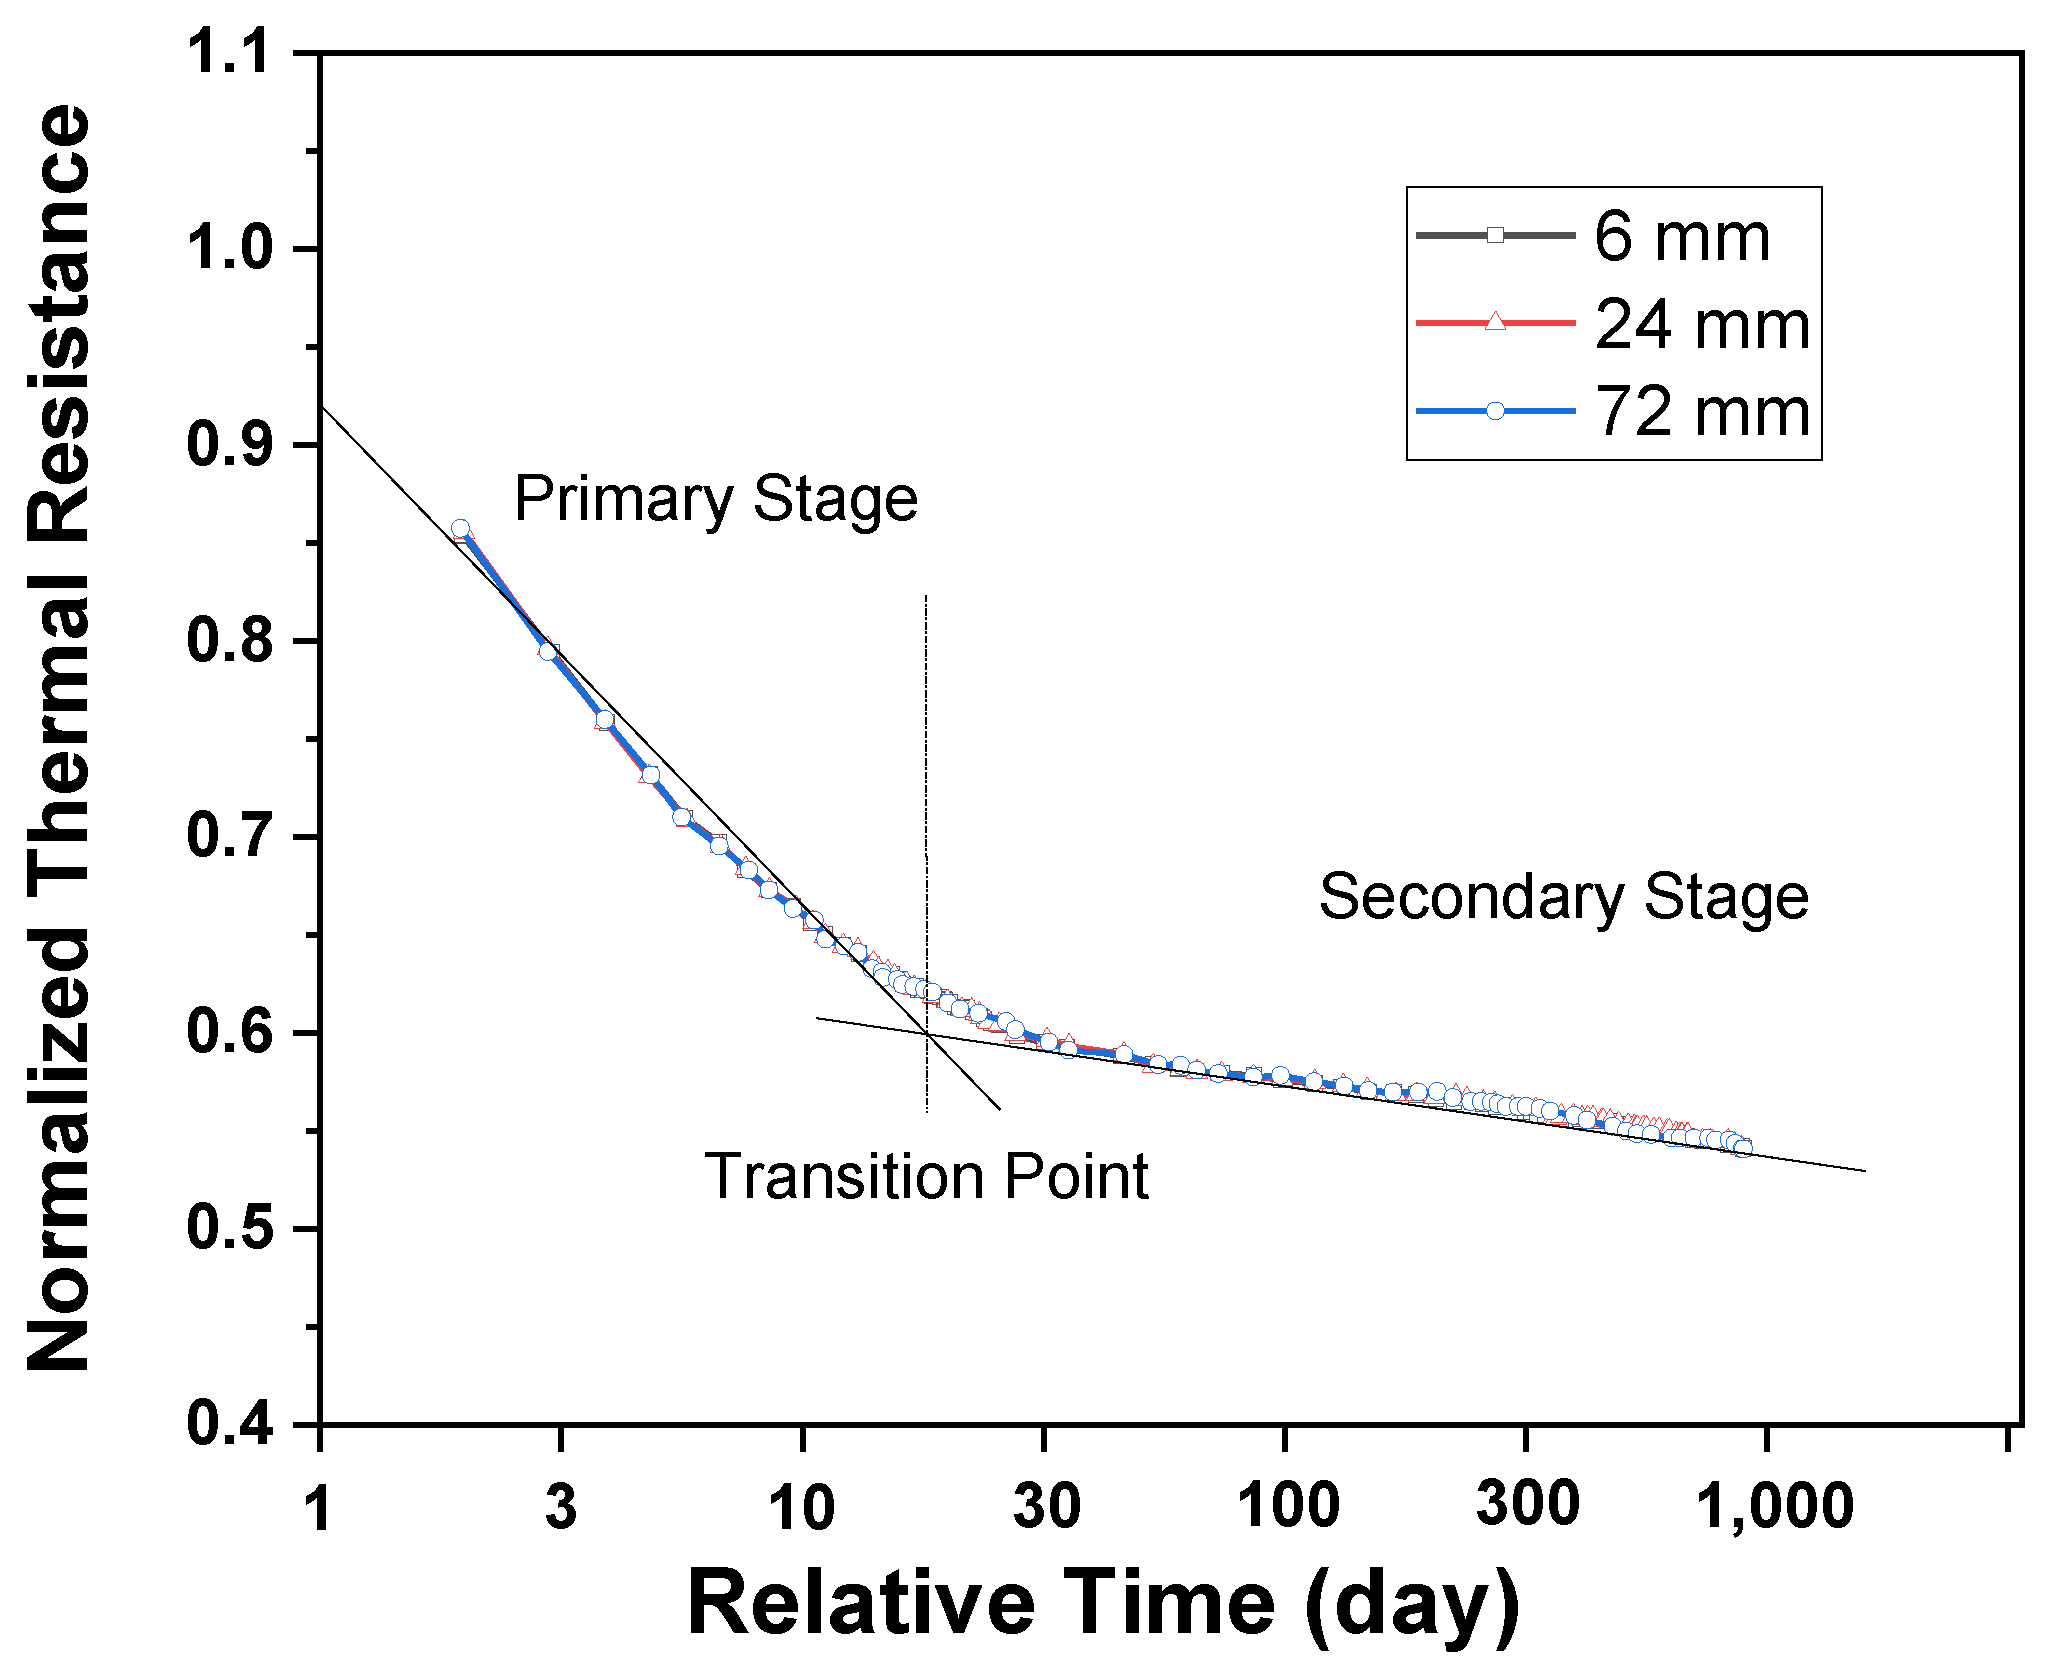
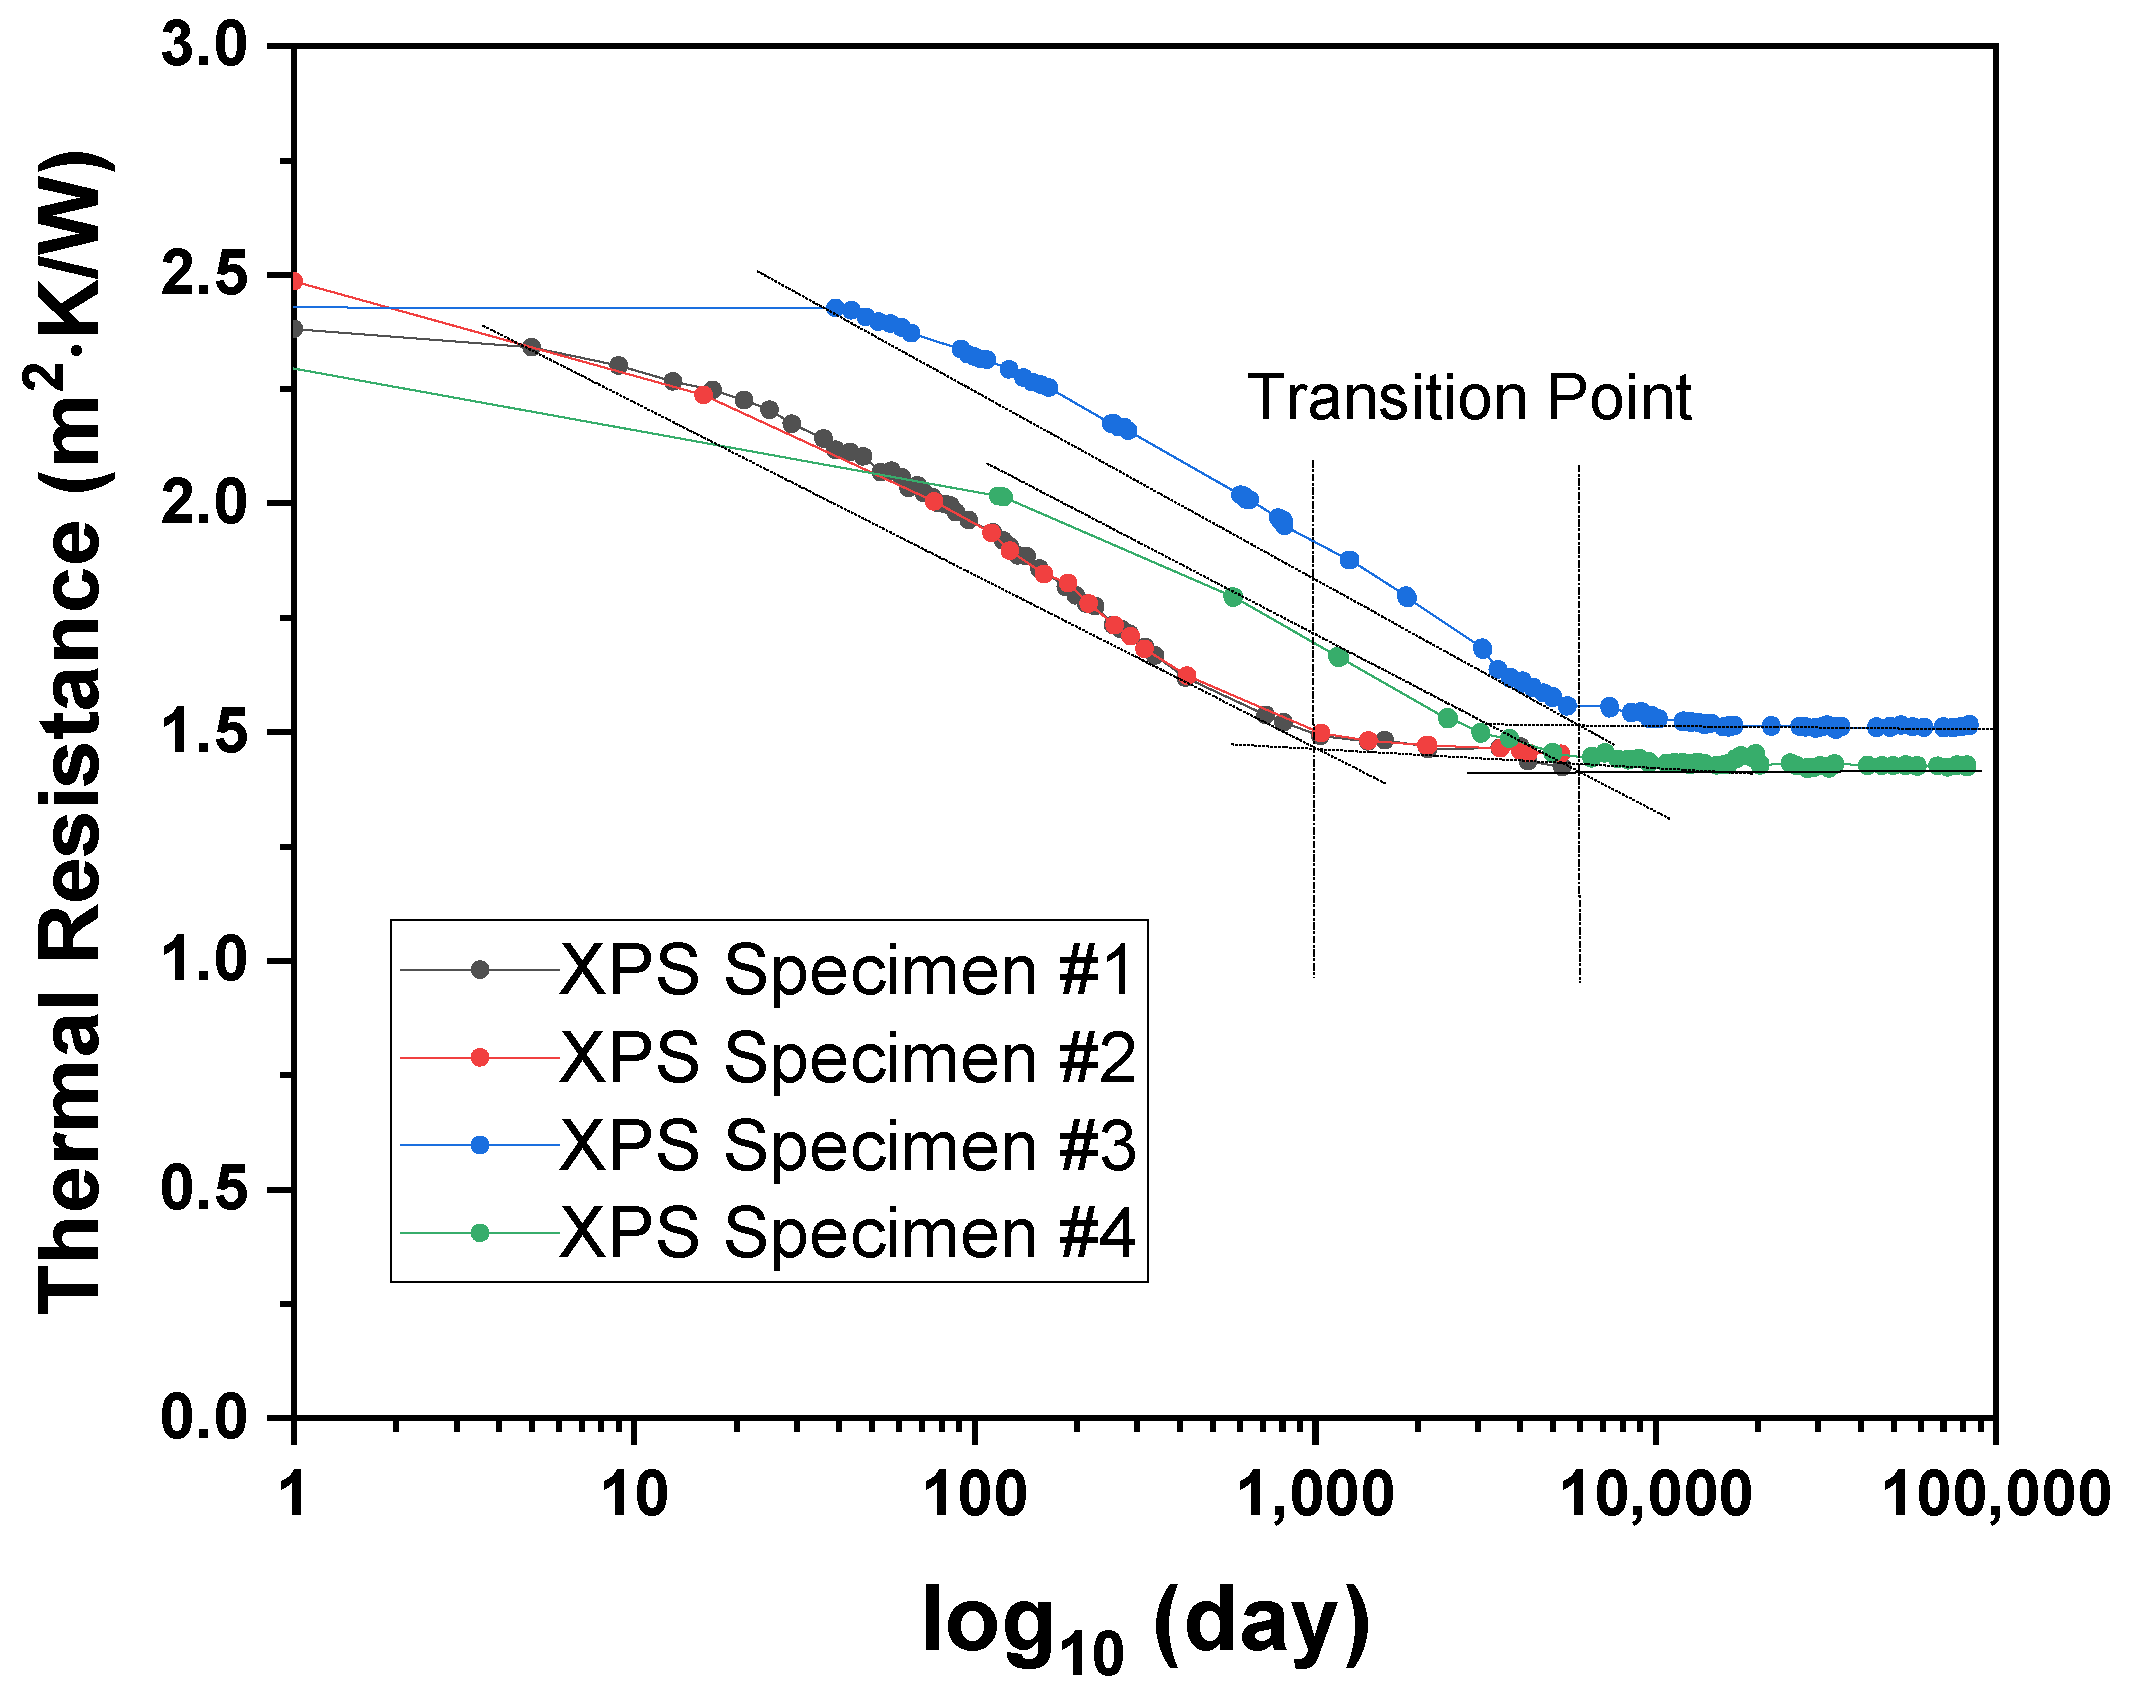
3.2. Accelerated Test Results

For the accelerated test, the thermal conductivity of the 10 mm sample was measured repeatedly for approximately 3200 hr, and the results were converted into thermal resistance values, as seen in Figure 5. The relative thermal resistance ratio ( R t / R 0 ) was calculated from the resultant thermal resistance values, and the time axis was subjected to a logarithmic transformation to derive the results shown in Figure 6. The scaling factors of the 10 mm and 50 mm thickness were compared, respectively, based on Equation (13) to express the results shown in Figure 7. As shown in Equation (13), the scaling factor for the 10 mm thick specimen corresponding to the original 50 mm thick XPS is 0.04. By applying 0.04 to the actual time of measurement for 50 mm thick material, the time for 10 mm thick specimen was obtained and graphed in log scale without any change of measured thermal resistance values. From scaling conversion, the corresponding thermal resistance of the time for a 10 mm thick specimen represents the thermal resistance of 50 mm thick material in actual ageing time. In addition, relative thermal resistances in dimensionless values were graphed as suggested in ISO 11561 [6] to compare the trend of thermal resistance degradation as a function of time. In Figure 5, Figure 6 and Figure 7, it can be observed that the initial thermal resistance of specimens varied within ranges from 0.4 to 2.5 m 2 · K / W . As explained in condition details, the intrinsic nature of specimens 3 and 4 can be regarded as the same owing to the cut from the same 50 mm slab. However, unexpectable inhomogeneities might induce the initial thermal resistance difference.
The thermal resistance of the 50 mm thick extruded insulation material after 25 years, which consists of 9125 days, was calculated using Equation (11) as follows:
t 10 mm   specimen ( t 10 ) = 9125 · ( 10 50 ) 2 = 365
This means that the time for a 10 mm sliced specimen is shortened down to 365 days, which corresponds to 9125 days for a full 50 mm thick slab.
As seen in Figure 7, the thermal resistances of sample 1 and 2 after 365 days, corresponding to 25 years, were calculated as approximately 0.309 m 2 · K / W and 0.288 m 2 · K / W , respectively. On converting these results into thermal resistances for a thickness of 50 mm, the thermal resistances of samples 1 and 2 were calculated as 1.542 m 2 · K / W and 1.442 m 2 · K / W , respectively.
Similarly, we calculated the 25-year-average thermal resistance using Equations (7), (11) and (13).
t 50 mm slab , average ( t 50 , av   ) = 9125 10 = 2886
t 10 mm specimen , average ( t 10 , av   ) = t 50 , av · S = 2886 · ( 10 50 ) 2 = 115
The thermal resistances of specimens 3 and 4 after 115 days were calculated to approximately 0.341 m 2 · K / W and 0.300 m 2 · K / W , respectively. On converting these results into thermal resistances for a thickness of 50 mm, the thermal resistances of samples 1 and 2 were calculated as 1.704 m 2 · K / W and 1.499 m 2 · K / W , respectively. Consequently, the 25-year-average thermal resistance of 50 mm thick insulation material becomes similar with thermal resistance values of 50 mm thick slab and 10 mm sliced specimen after 9125 days, 2886 days, and 115 days, respectively.
In Table 4, the thermal resistances of specimens 3 and 4 were summarized. Initial value, the value after 25 years, and the value in 25 years average were obtained from data in Figure 5 and calculation by Equations (15) and (16). The change rates of the thermal resistance by initial value were calculated by dividing degradation value from initial value by the value after 25 years. It varied from 37 to 41% for the thermal resistance after 25 years and from 30 to 38% for the 25-year-average thermal resistance, which meant that thermal insulation XPS lost almost 30 to 40% of intrinsic property both 25 years later and on average. Consequently, it is our suggestion that old buildings that were constructed with XPS insulation in the early 90s are necessary to be inspected to at least satisfy Korean Standards and the building energy efficiency grade in Korea.

3.3. Comparison of the Test Results

From calculations in Equations (15) and (16), it can be concluded that one day for the sliced 10 mm thick specimen corresponded to 25 days for the 50 mm thick original sample. Figure 8 shows the graphs derived from the scaling factor applied slice-accelerated test and the long-term ageing test. When the slice test results were converted into thermal resistance for the original sample thickness during the specific period, graphs moved in both X-axis and Y-axis directions, as seen in Figure 9. This indicates that the thermal performance of material changes over time.
The transition point was observed to occur after approximately 1000 and 5000 days for the long-term test and accelerated test results, respectively, thereby indicating a significant time difference between the two results. The difference between the two results was settled within 10% at around the time after 3600 days.

4. Conclusions

The hypothesis raised by ISO 11561 states that the thermal resistance of a sliced sample after 25 years and the 25-year average thermal resistance were degraded by time. It also specifies that the anticipated results may differ by approximately 10% compared to the original thickness sample. Based on this hypothesis, we compared the long-term ageing test data with the actual elapsed time. When the minimum period to consider the remodeling of an old building was assumed to be 3600 days (10 years), the prediction of ageing by the slice-accelerated test method appeared to have exhibited similar results as the performance degradation by the actual ageing. The experimental results are summarized as follows:
-
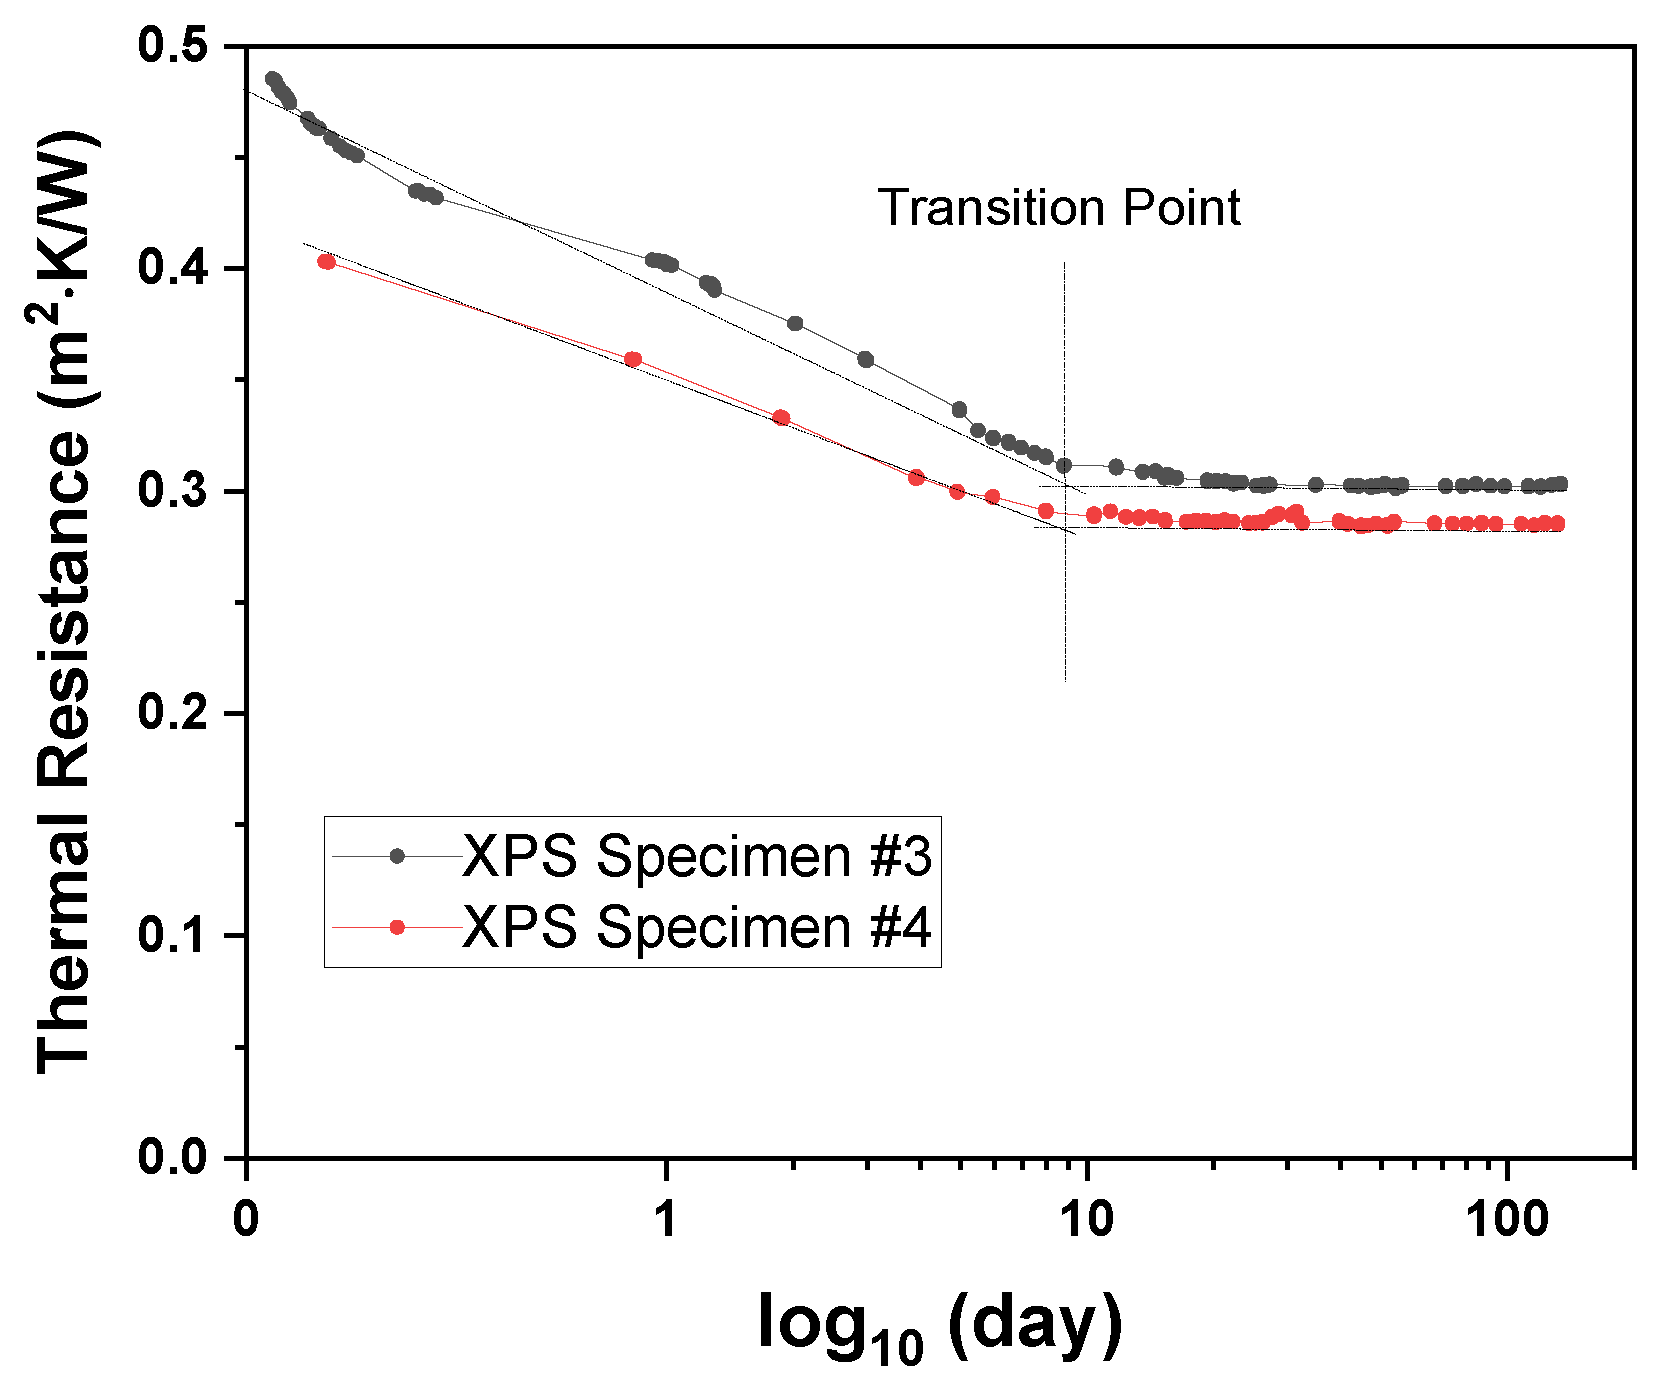
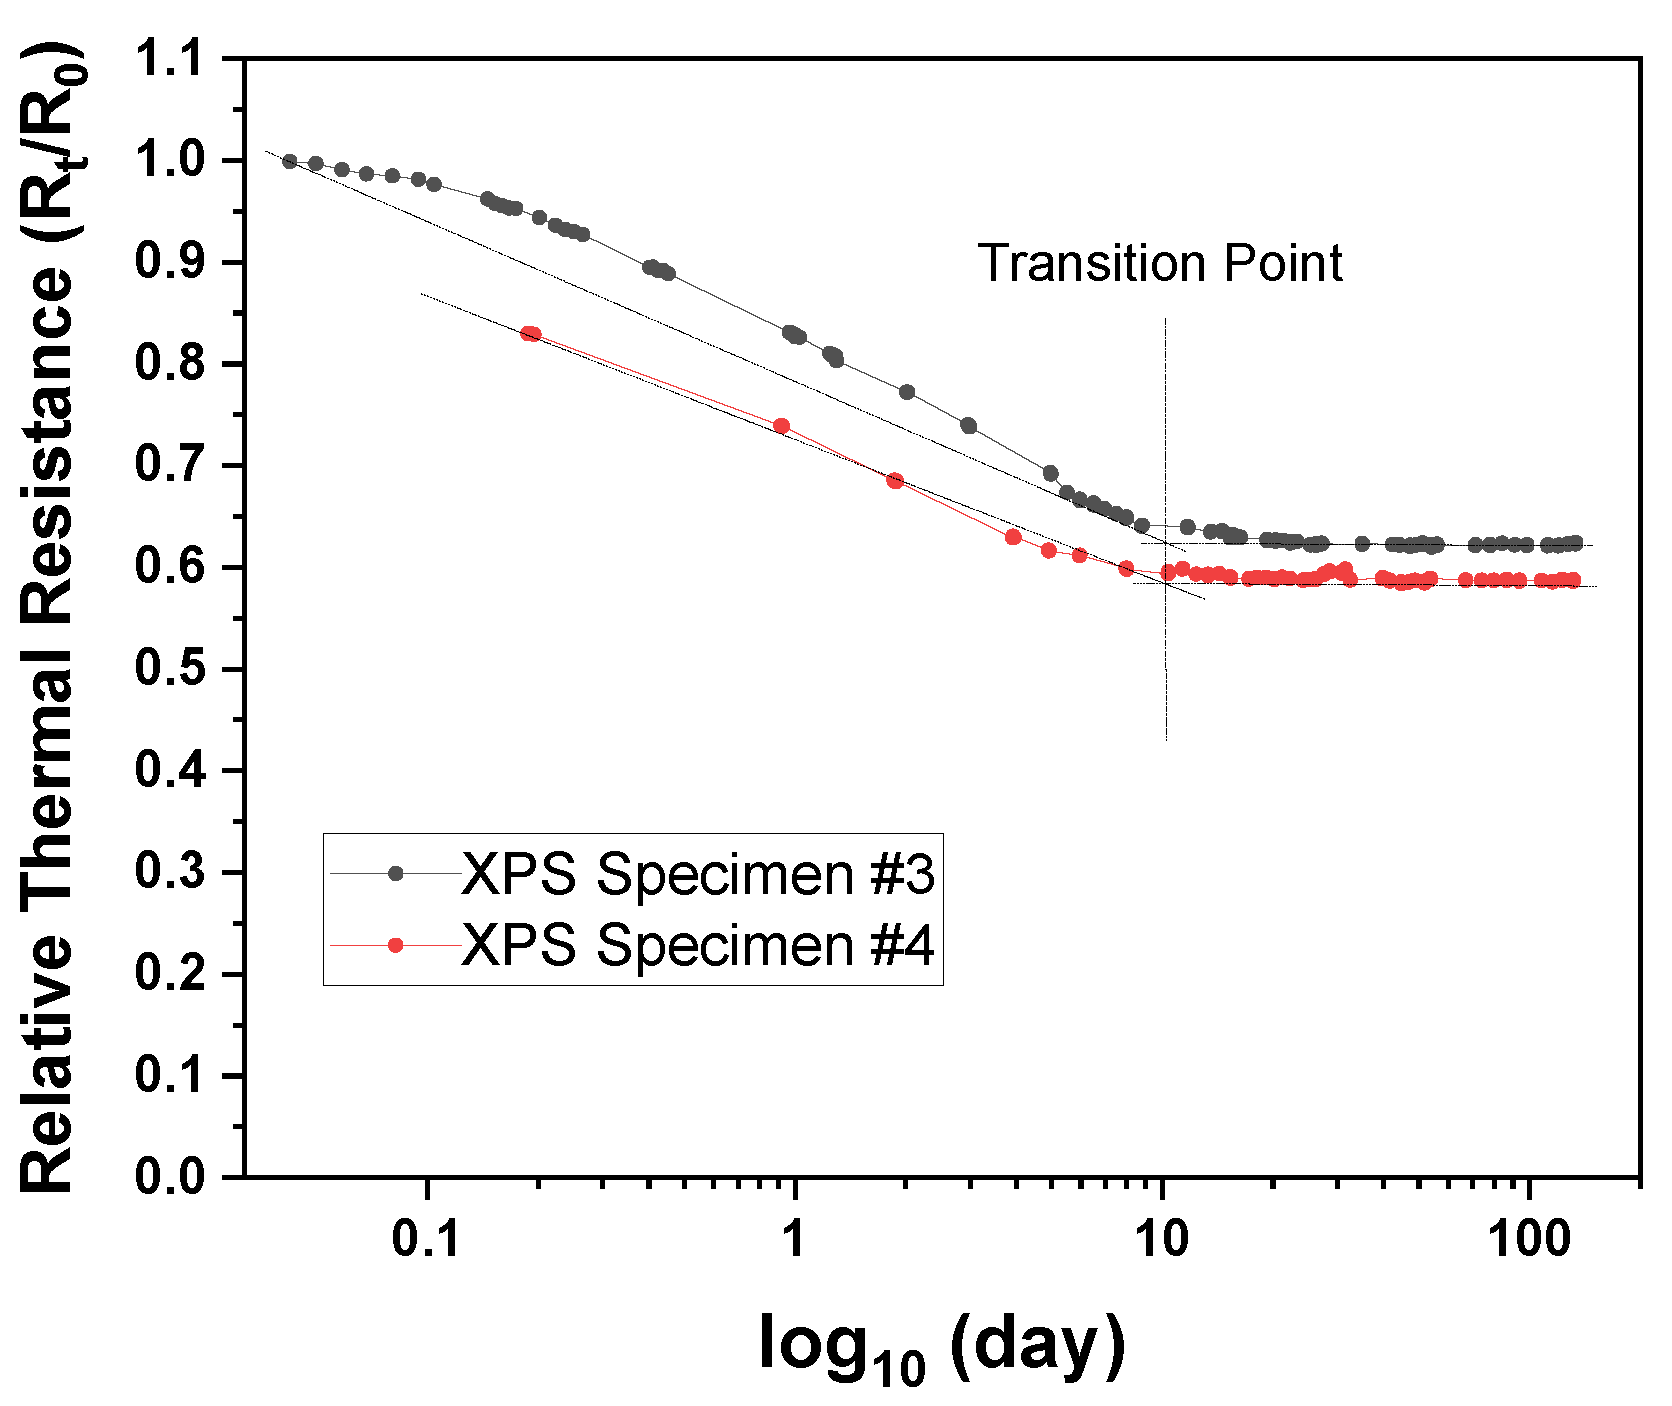
On conducting the accelerated laboratory test suggested in ISO 11561 using extruded insulation material (special grade), the material exhibited a stable state after approximately 120 days and underwent 38–41% degradation in thermal performance compared to the initial value. This result was similar to the rate of change of 39–42% after approximately 5000 days compared to the initial value of the 50 mm specimen analyzed in the previous study [16].
-
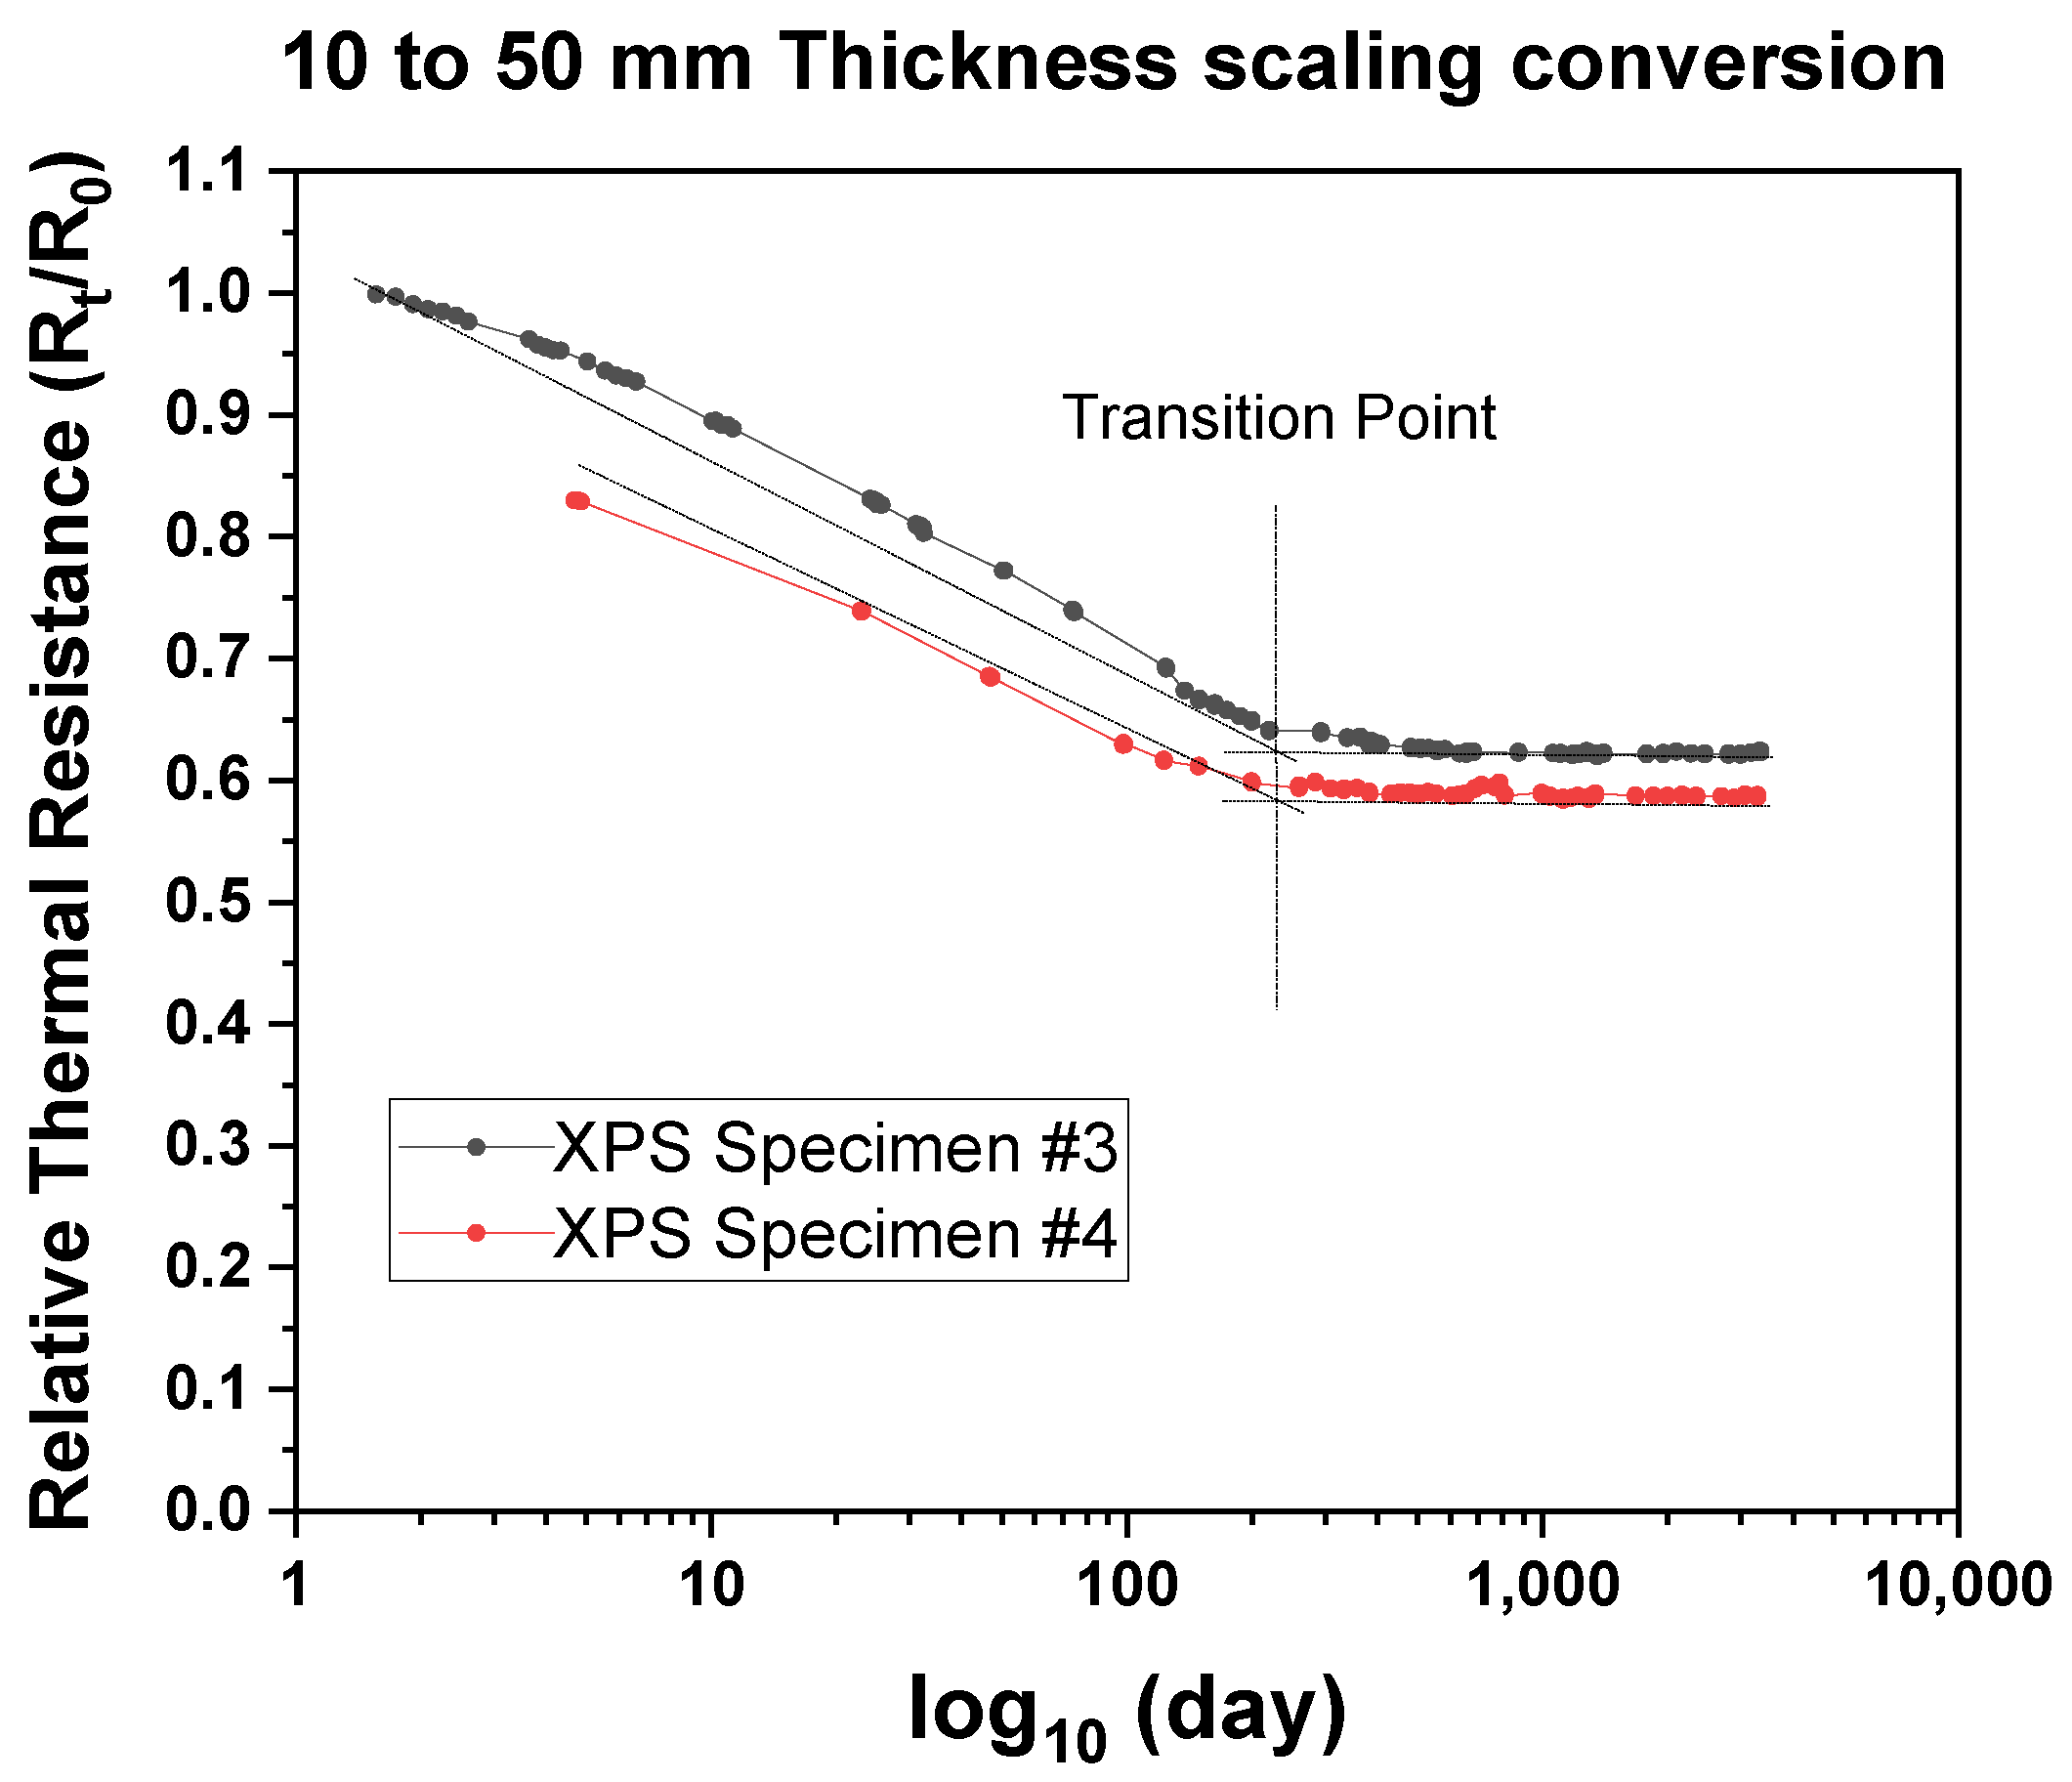
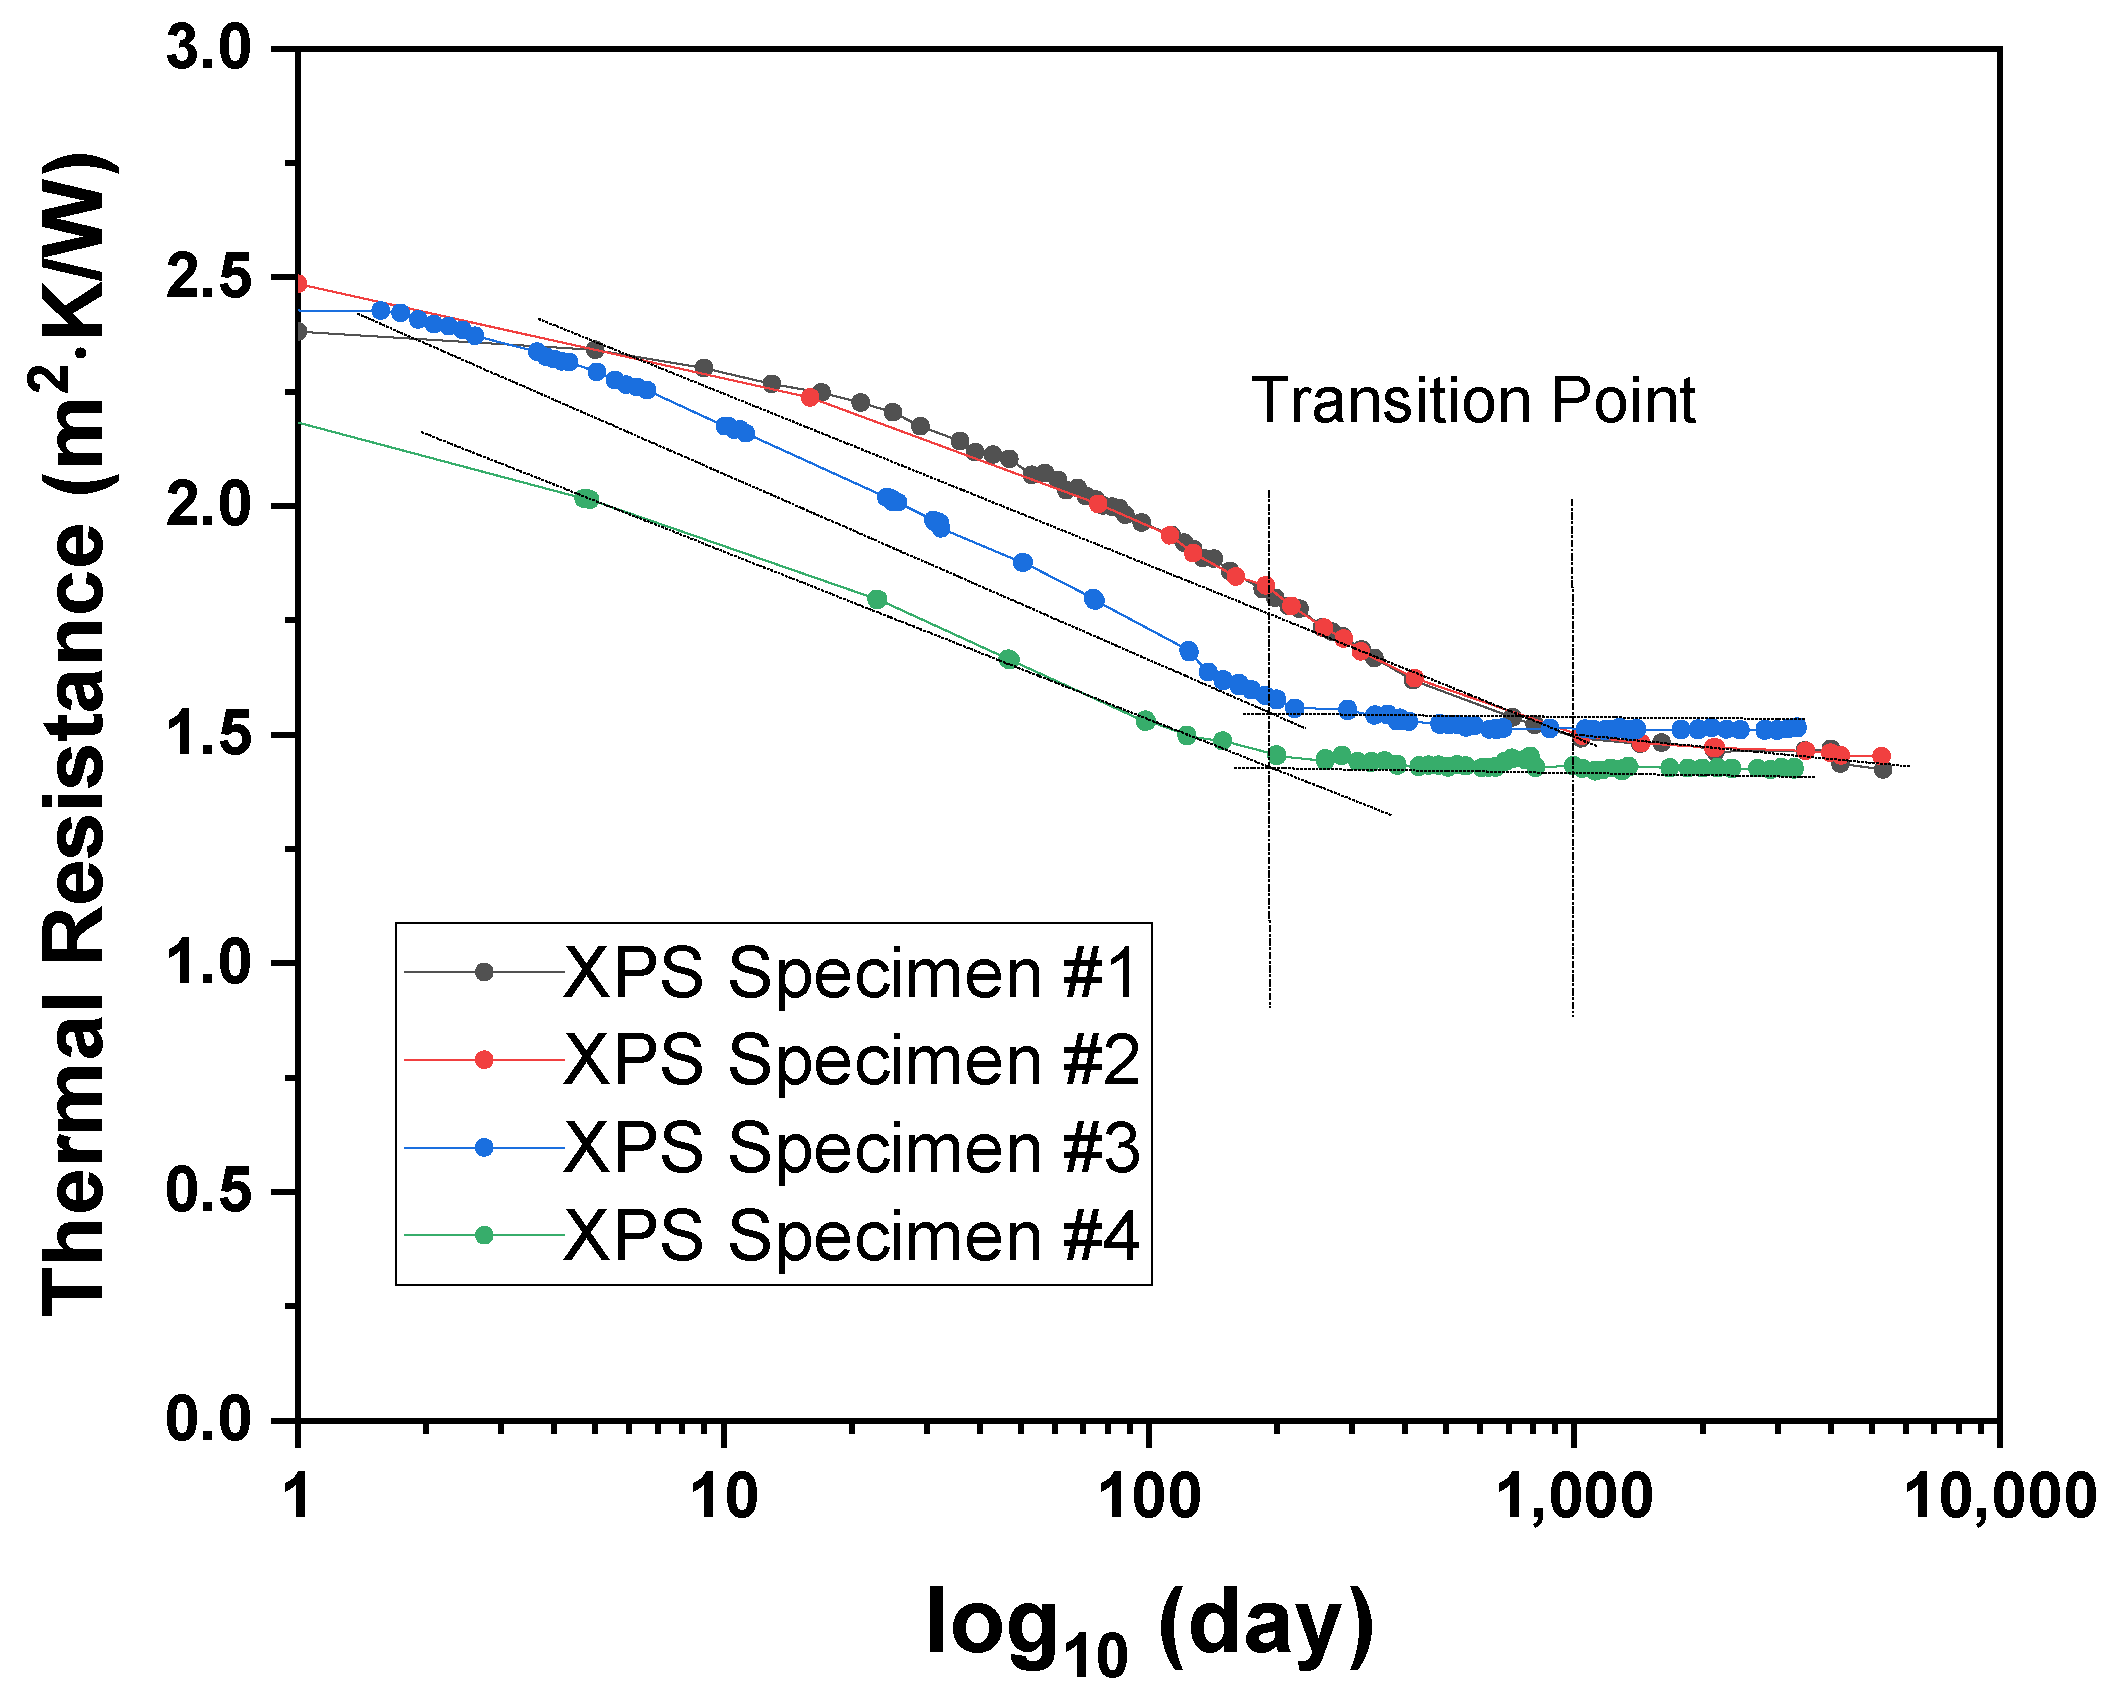
When the thermal performance of the 50 mm specimen after 25 years was predicted using the scaling technique, the thermal resistance and 25-year-average thermal resistance were calculated as 1.542 m 2 · K / W and 1.704 m 2 · K / W , respectively. Furthermore, the rate of change of the thermal resistance after 25 years and the 25-year average thermal resistance compared to the initial value ranged from 37 to 41% and from 30 to 38%, respectively.
-
While the ageing analysis of the two methods revealed a slight difference in the transition point, the difference was less than 10% after approximately 3600 days (10 years) owing to stabilization. Because the slice-accelerated test includes a method to predict the ageing of insulation materials after 25 years, the ageing results of the extruded insulation material using the two test methods were assumed to be similar.

Author Contributions

Conceptualization, H.-J.C. and J.-S.K.; methodology, H.-J.C.; software, H.A.; validation, G.-S.C. and J.-S.K.; formal analysis, H.-J.C.; investigation, H.-J.C.; resources, H.-J.C.; data curation, H.A.; writing—original draft preparation, H.-J.C.; writing—review and editing, J.-H.H., J.-S.K., H.A.; visualization, H.-J.C., H.A.; supervision, J.-H.H.; project administration, J.-S.K.; funding acquisition, G.-S.C. All authors have read and agreed to the published version of the manuscript.

Funding

This research was funded by Korea Agency for Infrastructure Technology Advancement (KAIA), grant number 21AUDP-B151639-03.

Conflicts of Interest

The authors declare no conflict of interest.

References

  1. Boustead, I. Polyurethane rigid foam. In Eco-Profiles of the European Plastics Industry; Plastics Europe: Brussels, Belgium, 2005; pp. 1–19. [Google Scholar]
  2. Winkler-Skalna, A.; Łoboda, B. Determination of the thermal insulation properties of cylindrical PUR foam products throughout the entire life cycle using accelerated aging procedures. J. Build. Eng. 2020, 31, 101348. [Google Scholar] [CrossRef]
  3. Mukhopadhyaya, P.; Kumar Kumaran, M. Long-Term Thermal Resistance of Closed-Cell Foam Insulation: Research Update from Canada. In Proceedings of the 3rd Global Insulation Conference and Exhibition, Barcelona, Spain, 16–17 October 2008. [Google Scholar]
  4. Pilon, L.; Fedorov, A.G.; Viskanta, R. Gas diffusion in closed-cell foams. J. Cell. Plast. 2000, 36, 451–474. [Google Scholar] [CrossRef] [Green Version]
  5. Albrecht, W. Cell-Gas Composition–An Important Factor in the Evaluation of Long-Term Thermal Conductivity in Closed-Cell Foamed Plastics. Cell. Polym. 2000, 19, 319–331. [Google Scholar]
  6. ISO 11561: 1999. Ageing of Thermal Insulation Materials–Determination of the Long-Term Change in Thermal Resistance of Closed-Cell Plastics (Accelerated Laboratory Test Methods); International Organization for Standardization: Geneva, Switzerland, 1999. [Google Scholar]
  7. Kumaran, M.K.; Bomberg, M.T. Thermal Performance of Sprayed Polyurethane Foam Insulation with Alternative Blowing Agents. J. Therm. Insul. 1990, 14, 43–58. [Google Scholar] [CrossRef]
  8. Schwartz, N.V.; Bomberg, M.T.; Kumaran, M.K. Measurements of the Rate of Gas Diffusion in Rigid Cellular Plastics. J. Therm. Insul. 1989, 13, 48–61. [Google Scholar] [CrossRef]
  9. Hollingsworth, M. Experimental Determination of the Thickness Effect in Glass Fiber Building Insulation in Thermal Insulation Performance; McElroy, D., Tye, R., Eds.; ASTM International: West Conshohocken, PA, USA, 1980; pp. 255–271. [Google Scholar]
  10. Christian, J.E.; Courville, G.E.; Graves, R.S.; Linkous, R.L.; McElroy, D.L.; Weaver, F.J.; Yarbrough, D.W. Thermal Measurement of In-Situ and Thin-Specimen Ageing of Experimental Polyisocyanurate Roof Insulation Foamed with Alternative Blowing Agents, Insulation Materials, Testing and Applications; ASTM STP, 1116; Graves, R.S., Wysocki, D.C., Eds.; American Society for Testing and Materials: Philadelphia, PA, USA, 1991; pp. 142–166. [Google Scholar]
  11. Kim, J.T.; Kim, S.M.; Kim, J.-T. Study on Long-term Performance of Phenolic Foam Insulation through Accelerated Aging Test. J. Korean Sol. Energy Soc. 2020, 40, 11–23. [Google Scholar] [CrossRef]
  12. ISO 8301:1991. Thermal Insulation. Determination of Steady-State Thermal Resistance and Related Properties. Heat Flow Meter Apparatus; International Organization for Standardization: Geneva, Switzerland, 1991. [Google Scholar]
  13. ASTM C518-17. Standard Test Method for Steady-State Thermal Transmission Properties by Means of the Heat Flow Meter Apparatus; ASTM International: West Conshohocken, PA, USA, 2017. [Google Scholar]
  14. KS L 9016:2010. Test Methods for Thermal Transmission Properties of Thermal Insulations; Korean Agency for Technology and Standards: Chungbuk, Korea, 2010. [Google Scholar]
  15. Choi, H.J.; Kang, J.S.; Huh, J.H. A study on variation of thermal characteristics of insulation materials for buildings according to actual long-term annual aging variation. Int. J. Thermophys. 2018, 39, 2. [Google Scholar] [CrossRef] [Green Version]
  16. KS M 3808: 2011. Cellular Polystyrene for Thermal Insulation; Korean Agency for Technology and Standards: Chungbuk, Korea, 2011. [Google Scholar]
Figure 1. (a) Slicing tools; (b) 40× magnified cutting cross-section of specimen corresponding above tools.
Applsci 11 09354 g001
Figure 2. Outline of the thermal conductivity test method using a heat flow meter.
Applsci 11 09354 g002
Figure 3. Relative thermal resistance of cellular plastic foams with three different thicknesses after scaling factor was applied. Redrawn by importing the points from image under the permission by ISO member in author‘s country [6].
Applsci 11 09354 g003
Figure 4. Thermal resistance of two XPS specimens. Redrawn based on previous results [15,16].
Applsci 11 09354 g004
Figure 5. Acceleration test result.
Applsci 11 09354 g005
Figure 6. Conversion of relative thermal resistance.
Applsci 11 09354 g006
Figure 7. Relative thermal resistance on applying the scaling factor calculated by Equation (13).
Applsci 11 09354 g007
Figure 8. Comparison of the long-term and scaled accelerated test results.
Applsci 11 09354 g008
Figure 9. Comparison of measurement results on converting them to results for a thickness of 50 mm.
Applsci 11 09354 g009
Table 1. Sample definitions and preparation conditions.
Sample DefinitionCondition
Specimen 150 mm thick XPS, conditioned under 23 °C and 50% RH without solar radiation exposure
Specimen 250 mm thick XPS, conditioned under 23 °C and 50% RH with solar radiation exposure
Specimen 310 mm thick specimen cut from left side of 50 mm XPS, conditioned under 23 °C and 50% RH
Specimen 410 mm thick specimen cut from right side of 50 mm XPS, conditioned under 23 °C and 50% RH
Table 2. Details of methods A and B in ISO 11561.
MethodAB
PurposeDetermine change in thermal resistance of specimen at any time in primary stage in graphScale thermal resistance of specimen at 91 ± 7 days to 25 ± 2 years in secondary stage in graph
Test condition10 mm thick, 23 ± 2 °C 50% RH10 mm thick, 23 ± 2 °C 50% RH
Conditioning Time3 days after production and conditioning in less than 2 days91 ± 7 days
Table 3. Definition of variables in equations.
SymbolMeaning
T m Average temperature of the slab
T 0 thickness of a reference slab
T 1 temperature of the slab
T 2 surface temperature
n ageing period
F0Fourier number
α thermal diffusivity (thermal diffusion coefficient)
t time
d thickness of specimen (slices)
λ thermal conductivity
ρ density
C p specific heat capacity at constant pressure
dthickness of specimen (slices)
d0thickness of a reference slab
Deffective gas diffusion coefficient
D0effective gas diffusion coefficient of a reference slab
Table 4. Slice test results.
SpecimenThermal Resistance [m2·K/W]
Initial ( R i )After 25 Years ( R t )Change % (1 − R i R t )25 Years in Average ( R a )Change % (1 − R i R a )
#30.4860.309 37%0.341 30%
#40.4860.288 41%0.300 38%
Publisher’s Note: MDPI stays neutral with regard to jurisdictional claims in published maps and institutional affiliations.

