
In Situ Bioremediation of a Chlorinated Hydrocarbon Plume: A Superfund Site Field Pilot Test


1
Wood Environment & Infrastructure Solutions, Albuquerque, NM 87113, USA
2
University of Arkansas, Fayetteville, AR 72701, USA
3
ECCI, Little Rock, AR 72223, USA
4
Biology Department, New Mexico Institute of Mining and Technology, Socorro, NM 87801, USA
5
Lynker Technologies, LLC, Leesburg, VA 20175, USA
*
Author to whom correspondence should be addressed.
Appl. Sci. 2021, 11(21), 10005; https://0-doi-org.brum.beds.ac.uk/10.3390/app112110005
Submission received: 10 September 2021
/
Revised: 21 October 2021
/
Accepted: 22 October 2021
/
Published: 26 October 2021
(This article belongs to the Special Issue Advancements in Biomonitoring and Remediation Treatments of Pollutants in Aquatic Environments)
Abstract
:The North Railroad Avenue Plume, discovered in 1989, contained chlorinated solvent groundwater plumes extending over 23.5 hectares (58 acres) and three hydrostratigraphic units. The source contaminant, tetrachloroethene, stemmed from release at a dry cleaner/laundromat business. The anaerobic biodegradation byproducts trichloroethene, isomers of dichloroethene (DCE), and vinyl chloride were detected in groundwater samples collected prior to remedial action. The impacted aquifers are the sole source drinking water aquifers for the communities near the site. Following the remedial investigation and feasibility study, the selected alternative for full-scale remedial action at the site was enhanced reductive dichlorination (ERD) focused on four treatment areas: the shallow source zone, the shallow hotspot area, the shallow downgradient area, and the deep zone. Pilot testing, which was conducted in the source zone and hotspot areas, is the subject of this paper. The primary objectives of the pilot test were to obtain the necessary information to select an ERD treatment formulation, dose, and frequency of dosing for use during full-scale remedial action, as well as to refine the site’s hydrogeologic conceptual site model and design parameters. Four (4) test cells, each of which contained well pairs of injection and downgradient extraction wells, were used to test ERD bio-amendment formulations: ethyl lactate, dairy whey, emulsified vegetable oil (EVO), and a combination of EVO and a hydrogen gas infusion. A conservative tracer, bromide, was added to the recirculation flow to record tracer breakthrough, peak, and dissipation at extraction wells. The results of these dipole tracer tests were used to reassess the hydraulic conductivity and hydrodynamic dispersity used in the remedial design. In addition to water quality analyses of contaminants and substrates, groundwater samples were also analyzed for biological analyses before, during, and after the addition of bioamendment. Analyses of phospholipid fatty acids and deoxyribonucleic acid (DNA) extracts from fresh groundwater samples informed decisions on the capacity for complete ERD without DCE stalling and tracked the shifts in the bacterial and archaeal taxonomy and phylogeny stemming from the addition of bioamendments. The pilot test concluded that EVO was the most suitable, considering (1) support of the native microbial consortia for ERD, (2) mechanics and hydraulics of the remediation system, and (3) sustainability/retention of the substrate in the subsurface. Along with EVO, the addition of a nutrient broth derived from brewery waste accelerated and sustained the desired conditions and microbial diversity and population levels. The pilot test results were also used to assess the utilization kinetics of the injected substrates based on total organic carbon (TOC) concentrations measured in the groundwater. After determining that substrate utilization followed Monod kinetics, a TOC threshold at 300 milligrams per liter, equivalent to approximately twice its half-saturation constant was established. Full scale treatment dosing and dose frequency were designed around this threshold, assuming the maximum substrate utilization would yield optimum ERD.
1. Introduction
The North Railroad Avenue Plume (NRAP) Site was discovered in 1989. The 23.5 hectares (58 acres) of groundwater were contaminated with tetrachloroethene (PCE), trichloroethene (TCE), dichloroethene (DCE) isomers (1,2-cis DCE and 1,2-trans DCE), and vinyl chloride (VC) from a release at a former dry cleaner and laundromat business. The three known groundwater units underlying the site are defined by differences in water pressures and geology. All three units contain chlorinated solvent impacts from the NRAP source zone. The contaminated groundwater aquifers are the sole source drinking water aquifers for the City of Española, Santa Clara Pueblo, and individual water supply wells near the site. Figure 1 shows the site area with groundwater plume. In 1999, the site was added to the National Priority List (NPL) and recognized as a superfund site. A study to determine a remediation plan was conducted from 1999 through 2001 [1,2]. Based on the findings, the original field test plan (FTP) was prepared in 2003 proposing bioremediation, specifically enhanced reductive dechlorination (ERD) with surfactant flushing for the source zone [3,4].
Approximately 100 wells (injection/extraction/monitoring) were installed during the summer and fall of 2005. Intensive soil/sediment and groundwater sampling, screening, and analyses were conducted during the well installation operations. Results improved the understanding of the contamination distribution and provided an enhanced picture of the lithology, especially concerning the shallow aquifer and aquitard. Based on the findings stemming from the well installation and soil/groundwater sampling and analysis campaigns, surfactant flushing was eliminated, and the 2003 FTP was revised. The primary changes to the 2003 FTP included new amendment selection, new test cell well pairs, and additional test cell to evaluate source area remediation. Construction of the remediation system was completed in 2006, and pilot test treatment was initiated in 2007 through 2008. This article presents the result of the Revised FTP.
Remedial action at the site was divided into four treatment areas: the source zone, a hotspot, and downgradient treatment areas located in the shallow groundwater aquifer and the deep zone area. Based on high-concentration dissolved-phase PCE detected in the source zone area, ganglia-phase dense non-aqueous phase liquid (DNAPL) contamination may have been present. Alternatively, the high-concentration dissolved-phase PCE may have been the result of increased solubility due to surfactants from the laundry wastewater discharge that mixed with the dry-cleaner chemicals at the release site, an inline lint trap. The hotspot area emanates downgradient from source zone in the shallow aquifer. Pilot testing was conducted in the source zone and hotspot areas. Although pilot test activities were not conducted at the downgradient or deep-zone areas, the results were used to inform remedial action approach for these areas.
Shifts in microbial consortia diversity, including changes in microbes that harbor the key enzyme-producing genes involved in the biodegradation of chlorinated hydrocarbons, were monitored during the pilot test by analyses of the microbiome, using molecular microbiological methods (MMMs). Changes in biomass measured by microscopic examination of concentrated consortia samples [5] was employed to assess the overall response of the microbiome to changing aquifer conditions. Phospholipid fatty acids, the main component of the cell membrane of all microbes were separated from fresh groundwater samples and analyzed to estimate biomass and reveal the signature and relative population of bacteria, such as Firmicutes, Proteobacteria, metal reducers, and sulfur-reducing bacteria (SRB), as well as the presence of eukaryotes in microbial communities [6]. Quantitative polymerase chain reaction (qPCR) was used to detect the presence and concentration of bacterial taxa such as Dehalococcoides (DHC) and Dehalobacter, and genes for important functions harbored by these taxa, the reductive dehalogenases (RDases) [7,8,9]. The MMMs implemented for the pilot test were performed by Microbial Insights, including their Census® qPCR analysis, which quantitates these microbes and genes in groundwater samples. When normalized with biomass calculation, qPCR has a detection limit of 100 cells per sample. The benefit of the MMMs implemented for the pilot test is that the analyses provide a snapshot that can be compared to the current knowledge base. This is the case with the services provided Microbial Insights, which, for example, were used to study bioremediation potential at a 1,4-dioxane- and TCE-contaminated site [10].
Metagenomic analysis using shotgun sequencing of DNA does not require prior amplification. Sequences are identified by comparison to microbial genomic databases and the increased throughput provides a more detailed picture of the consortia diversity. With adequate sampling, it is even possible to detect and assemble genomes of unculturable, and hence undiscovered, microbes. The benefit of applying high-throughput DNA sequencing techniques is exemplified by an extensive project focused on a groundwater site undergoing in situ injections [11]. As a result of this research, 47 new candidate phyla are proposed and extensive insights to changes in biogeochemical cycles are revealed by gene annotations.
The primary objective of the pilot testing was to obtain the necessary information to select a treatment formulation for use during the full-scale treatment operations. The tested treatment formulations were electron donors and nutrients. Bio-augmentation was not tested because the site conditions did not indicate it would be necessary (e.g., detectable VC in portions of the NRAP groundwater plume overlapped with petroleum contamination from a nearby leaking retail fuel business). Secondary objectives for the pilot test were to inform designers on the dosage and frequency of the selected bio-amendment and to obtain more representative information on the subsurface hydrogeology and as-built well and piping hydraulics for use in optimizing the full-scale operations. The field tests results consisted of biorecirculation tests to select amendments for full-scale treatment and the development of site-specific understanding of PCE contaminant breakdown pathways and rates.
2. Materials and Methods
2.1. Hydrogeologic Setting and Plume Characteristics of the Pilot Test
The source zone and hotspot areas, where the tests described in this paper were conducted, is underlain by interbedded gravel, sand, clay, and silt, typical of Rio Grande Basin alluvial deposits in northern New Mexico. The water table aquifer, referred to as the shallow zone, contains the source zone and hotspot areas [4]. The water table in these areas is encountered at approximately 1.5 m (5 feet) below ground surface (bgs) and extends to approximately 9.1 m (30 feet) bgs before encountering a clay aquitard. This upper section is comprised primarily of gravelly and sandy material with intermittent lenses of clay and silt. The arithmetic mean of the shallow-zone hydraulic conductivity is approximately 18.2 m per day (60 feet per day), ranging from approximately 1.5 m/day (5 ft/day) to 30.5 m/day (100 ft/day), based on in-well slug testing and numerical modeling conducted as part of the remedial investigation and design. Historical water level measurements from wells screened within this unit indicate that the groundwater flows south to southeast (slightly towards the Rio Grande) at a representative horizontal hydraulic gradient of 0.002 m per meter (m/m). Assuming an effective porosity of 0.15 (based on typical values for soils of the types found at this site) a representative lateral groundwater flow velocity is estimated at 0.2 m/day (0.8 ft/day). Considering the length of the treatment zone along the groundwater flow path at 67.1 m (220 feet) long, the time for groundwater to travel from the source zone to the periphery of the hotspot area is estimated at 275 days.
The maximum anticipated depth for treatment varies spatially across the hotspot area and is equal to the depth to the lower surface of the shallow groundwater plume. The vertical extent of the groundwater plume has been limited by extensive but discontinuous silt and clay layers, with contaminated groundwater penetrating deeper into the shallow zone as the plume migrated downgradient of the source zone, to the south and southeast. The maximum depth of the plume penetration beneath the source area, using a PCE concentration cutoff value of approximately 5 micrograms per liter (μg/L), is between 6.4 and 7.0 m (21 and 23 feet) bgs. At the south end of the hotspot area the maximum depth approaches 9.1 m (30 feet) bgs. The representative pore volume for the source zone and hotspot areas (or its volume), assuming the total porosity is 0.25, is estimated to be 4842.2 cubic meter (171,000 cubic feet) or 4.85 million liter (1.28 million gallons).
PCE concentrations within the source zone/hotspot portion of the groundwater plume (excluding the source area), along the plume centerline and prior to remedial action, range from approximately 10,000 μg/L to approximately 3000 μg/L, installed during phase II of remedial design. Evidence of natural reductive dehalogenation of PCE appears to occur within the hotspot area, as 830 μg/L TCE has been detected since March 2006. 1,2-cis DCE has also been detected in the hotspot area in groundwater and soil samples. The groundwater concentration ranges were developed from only a few sampling points. Thus, there is considerable uncertainty in the structure of the plume in this area of the Site
The source area within the larger hotspot area, encompassing approximately 83.6 square meters (900 square feet) of the 3344.5-square-meter (36,000-square-foot) treatment area, is characterized by high concentrations of PCE in the groundwater (dissolved phase) and on the sediment (adsorbed phase). Groundwater PCE concentrations in the source zone groundwater have been detected above 60,000 μg/L, with sediment PCE concentrations ranging up to 800,000 micrograms per kilogram (at SB-04 at a sampling depth of 3.7 m (12 feet) bgs).
2.2. Pilot Testing Design and Operation
Two key guidance documents [12,13], each of which were developed based on a review of research and real-world applications of ERD, were used in the development of the sampling and analysis plan and operational procedures of the pilot test. The infrastructure utilized in conducting the pilot test included the groundwater extraction and injection wells, bio-amendment mixing tanks and chemical metering pumps, flow-control manifolds, and monitoring and control systems including monitoring wells and a Supervisory Control and Data Acquisition (SCADA) system for continuous monitoring and control of the remediation system.
2.2.1. Injection and Extraction Operations
The extraction pumping and injection flow rate scheme as designed was used in operating the pilot test, whereby extracted groundwater was fed manifolds and reinjected into the injection wells. By this method, injection and extraction rates were balanced and a hydraulic recirculation cell was established for each of the four pilot tests. The pilot test also included a shut-in period, during which recirculation was stopped and the test cell was allowed to incubate under ambient conditions. Based on the ambient hydraulic gradient in the upper aquifer and the shut-in duration, the injectate plume was not anticipated to migrate during the shut-in period.
Hydrogeologic modeling conducted during the remedial design indicated that the average time of travel between adjacent injectors and extractor would be approximately 26 days at the 9.5 L per minute (lpm) (2.5 gallons per minute) recirculation flow rate [3]. As described earlier, the subsurface is heterogeneous, with interbedded layers and lenses of higher- and lower-permeability materials. These heterogeneities give rise to flow field anisotropy and preferential pathways between injector/extractor well sets. The conservative tracer (bromide) added along with the injectate indicated an earlier arrival travel time (presumably along preferential flow pathways) that was significantly less than 26 days (see Section 3.1 below). This result was taken into consideration in subsequent result interpretation for ERD for each of the pilot tests.
This pilot test design allowed us to determine if this flow rate was appropriate for full-scale implementation. In addition, pilot test results were employed to indicate whether modification of the design flow rate schedule was necessary to achieve one or more of the following objectives: (i) adequate hydraulic control against plume spreading; (ii) improved efficiency of the treatment zone sweep (i.e., distribution, mixing and contact); (iii) improved in-situ treatment efficiency; and/or (iv) improved equipment and system operation and maintenance efficiency.
2.2.2. Pilot Test Cells
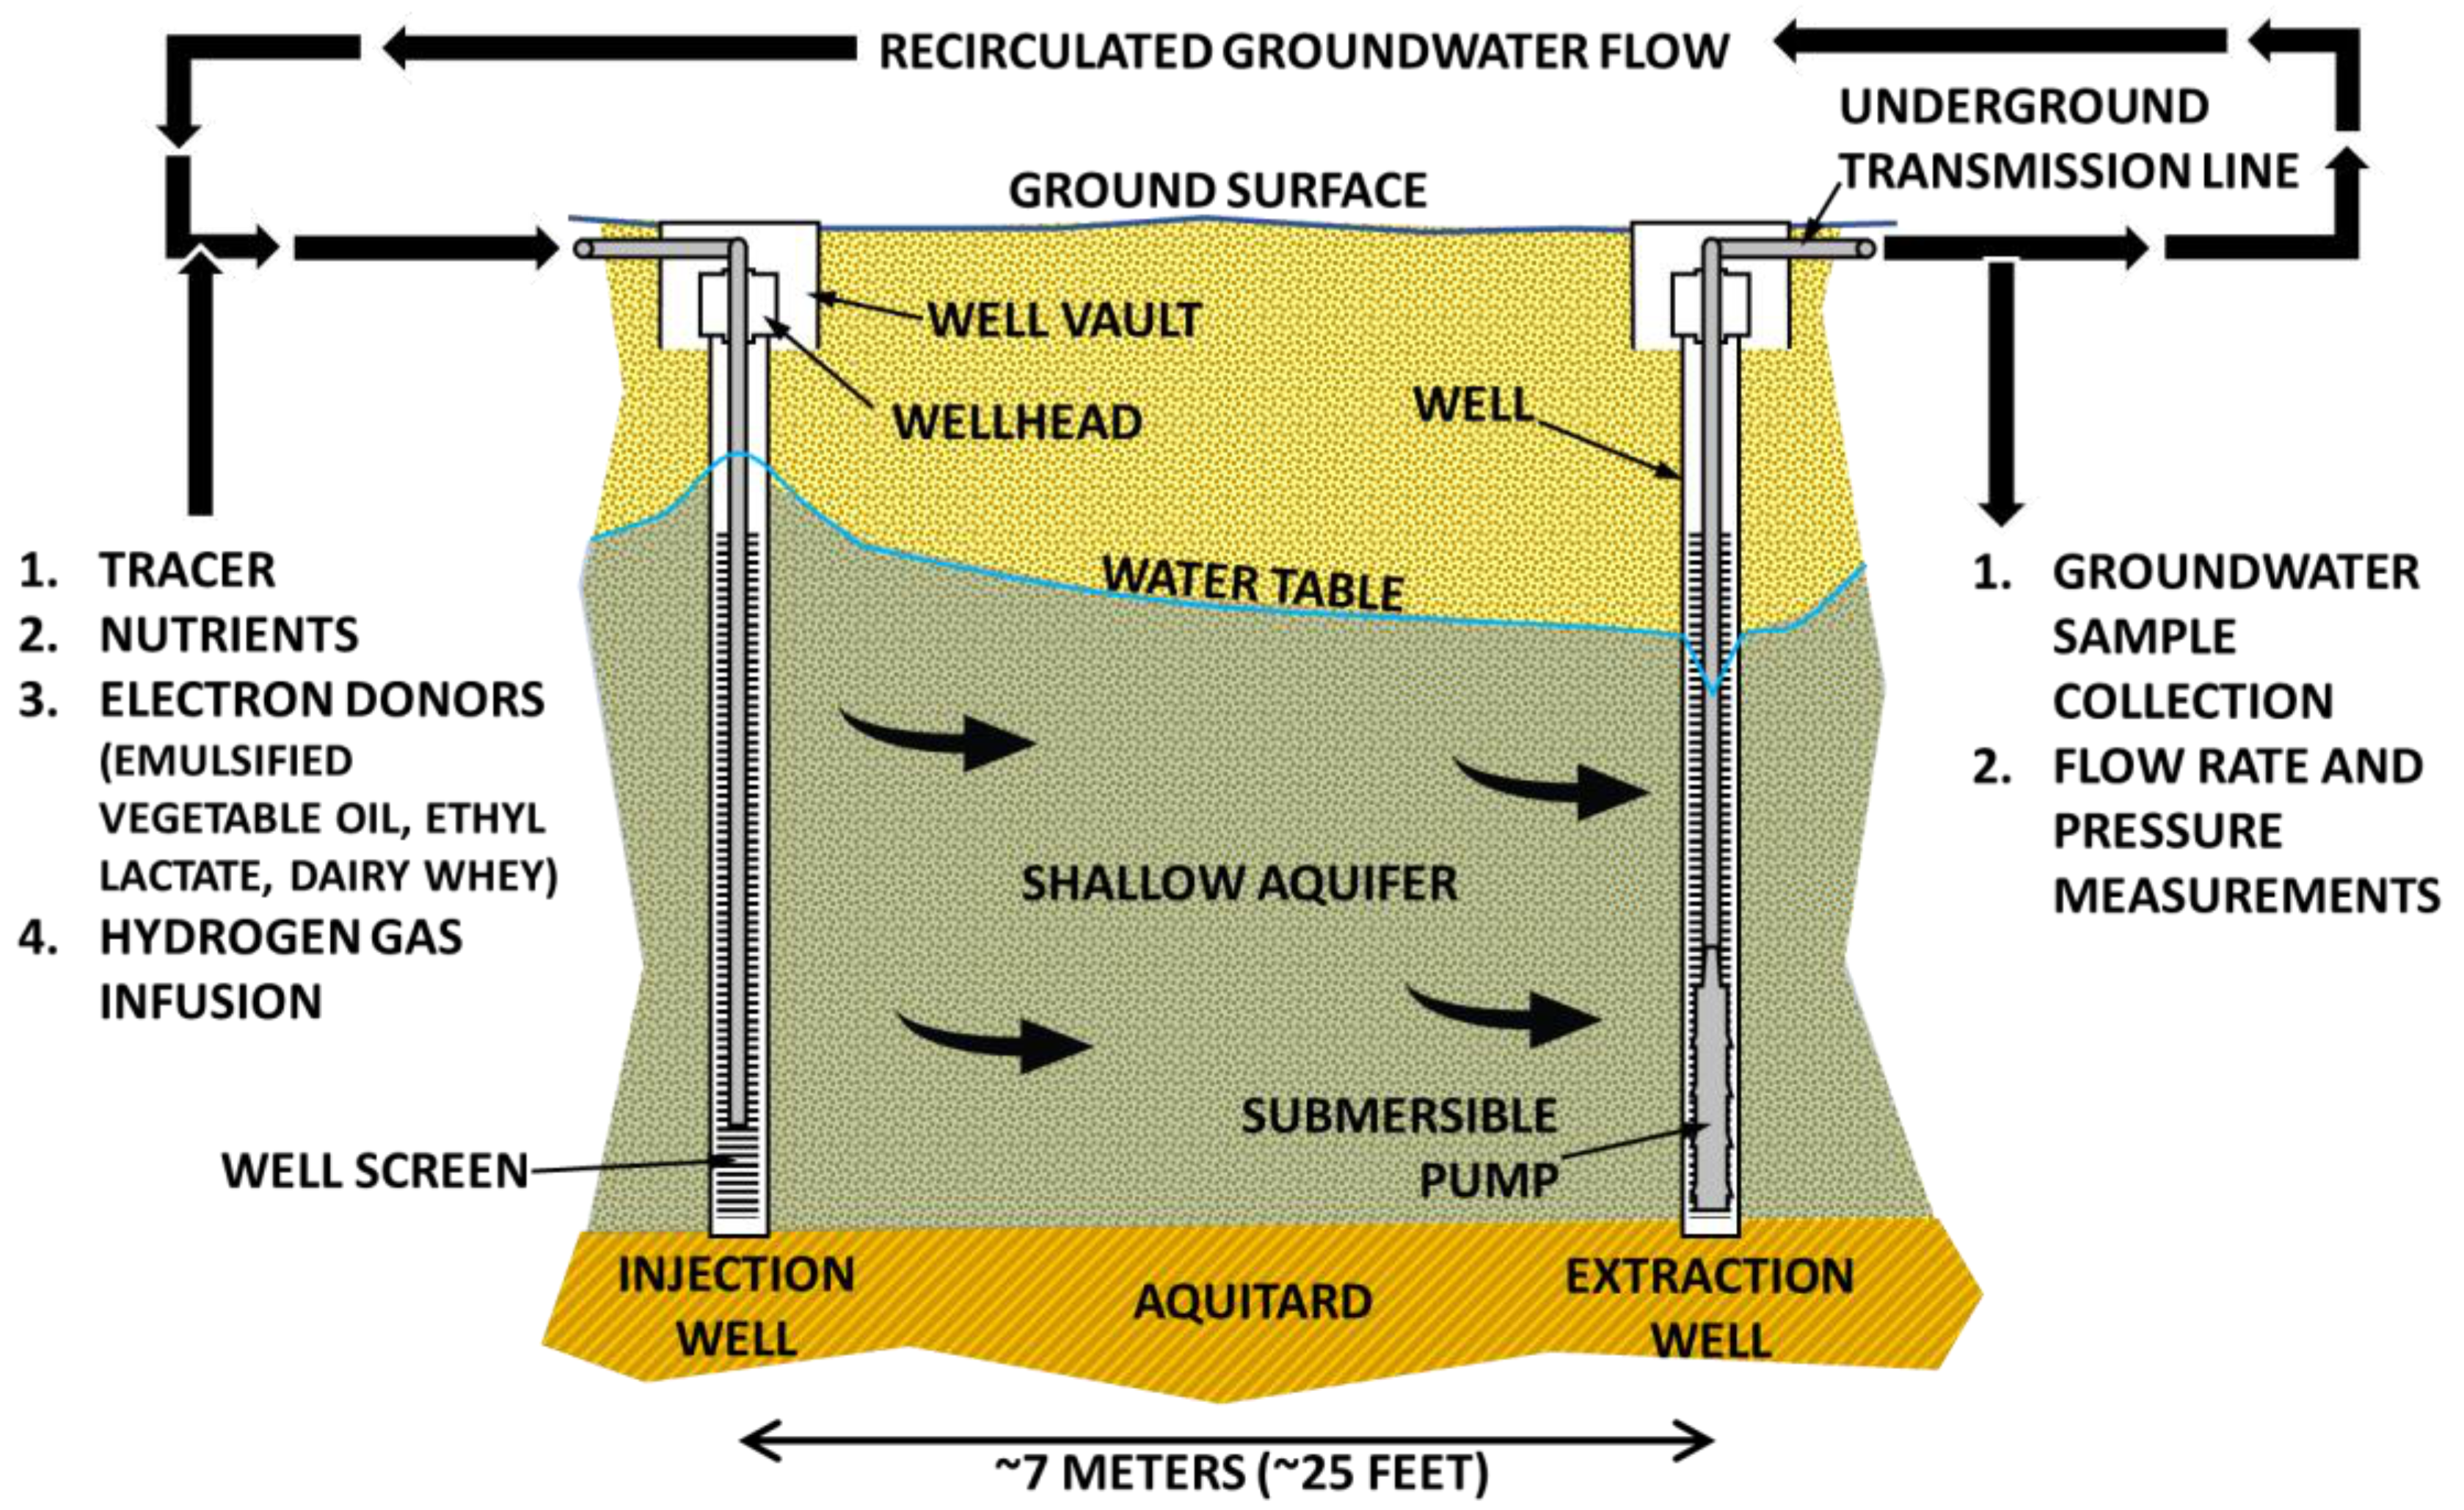
The pilot test was operated in four test cells consisting of extraction wells (designated HSE and EW) and injection wells (designated as HSI and IW) as follows: HSI-14/HSE-11 which was initially dosed with ethyl lactate (EL); HSI-8/HSE-6 which was initially dosed with dairy whey; HSI-19/HSE-14 which was initially dosed with emulsified vegetable oil (EVO); and, the source zone test cell, IW-2S, IW-2D/EW-3, which was dosed with EVO and groundwater infused with hydrogen gas. A second dose of EVO was added to each of the test cell at the approximate midpoint of the pilot test. The locations of these field test cell well pairs are shown in Figure 2. Figure 3 provides a generalized geologic cross section of a typical test cell.
2.3. Pilot Test Procedures
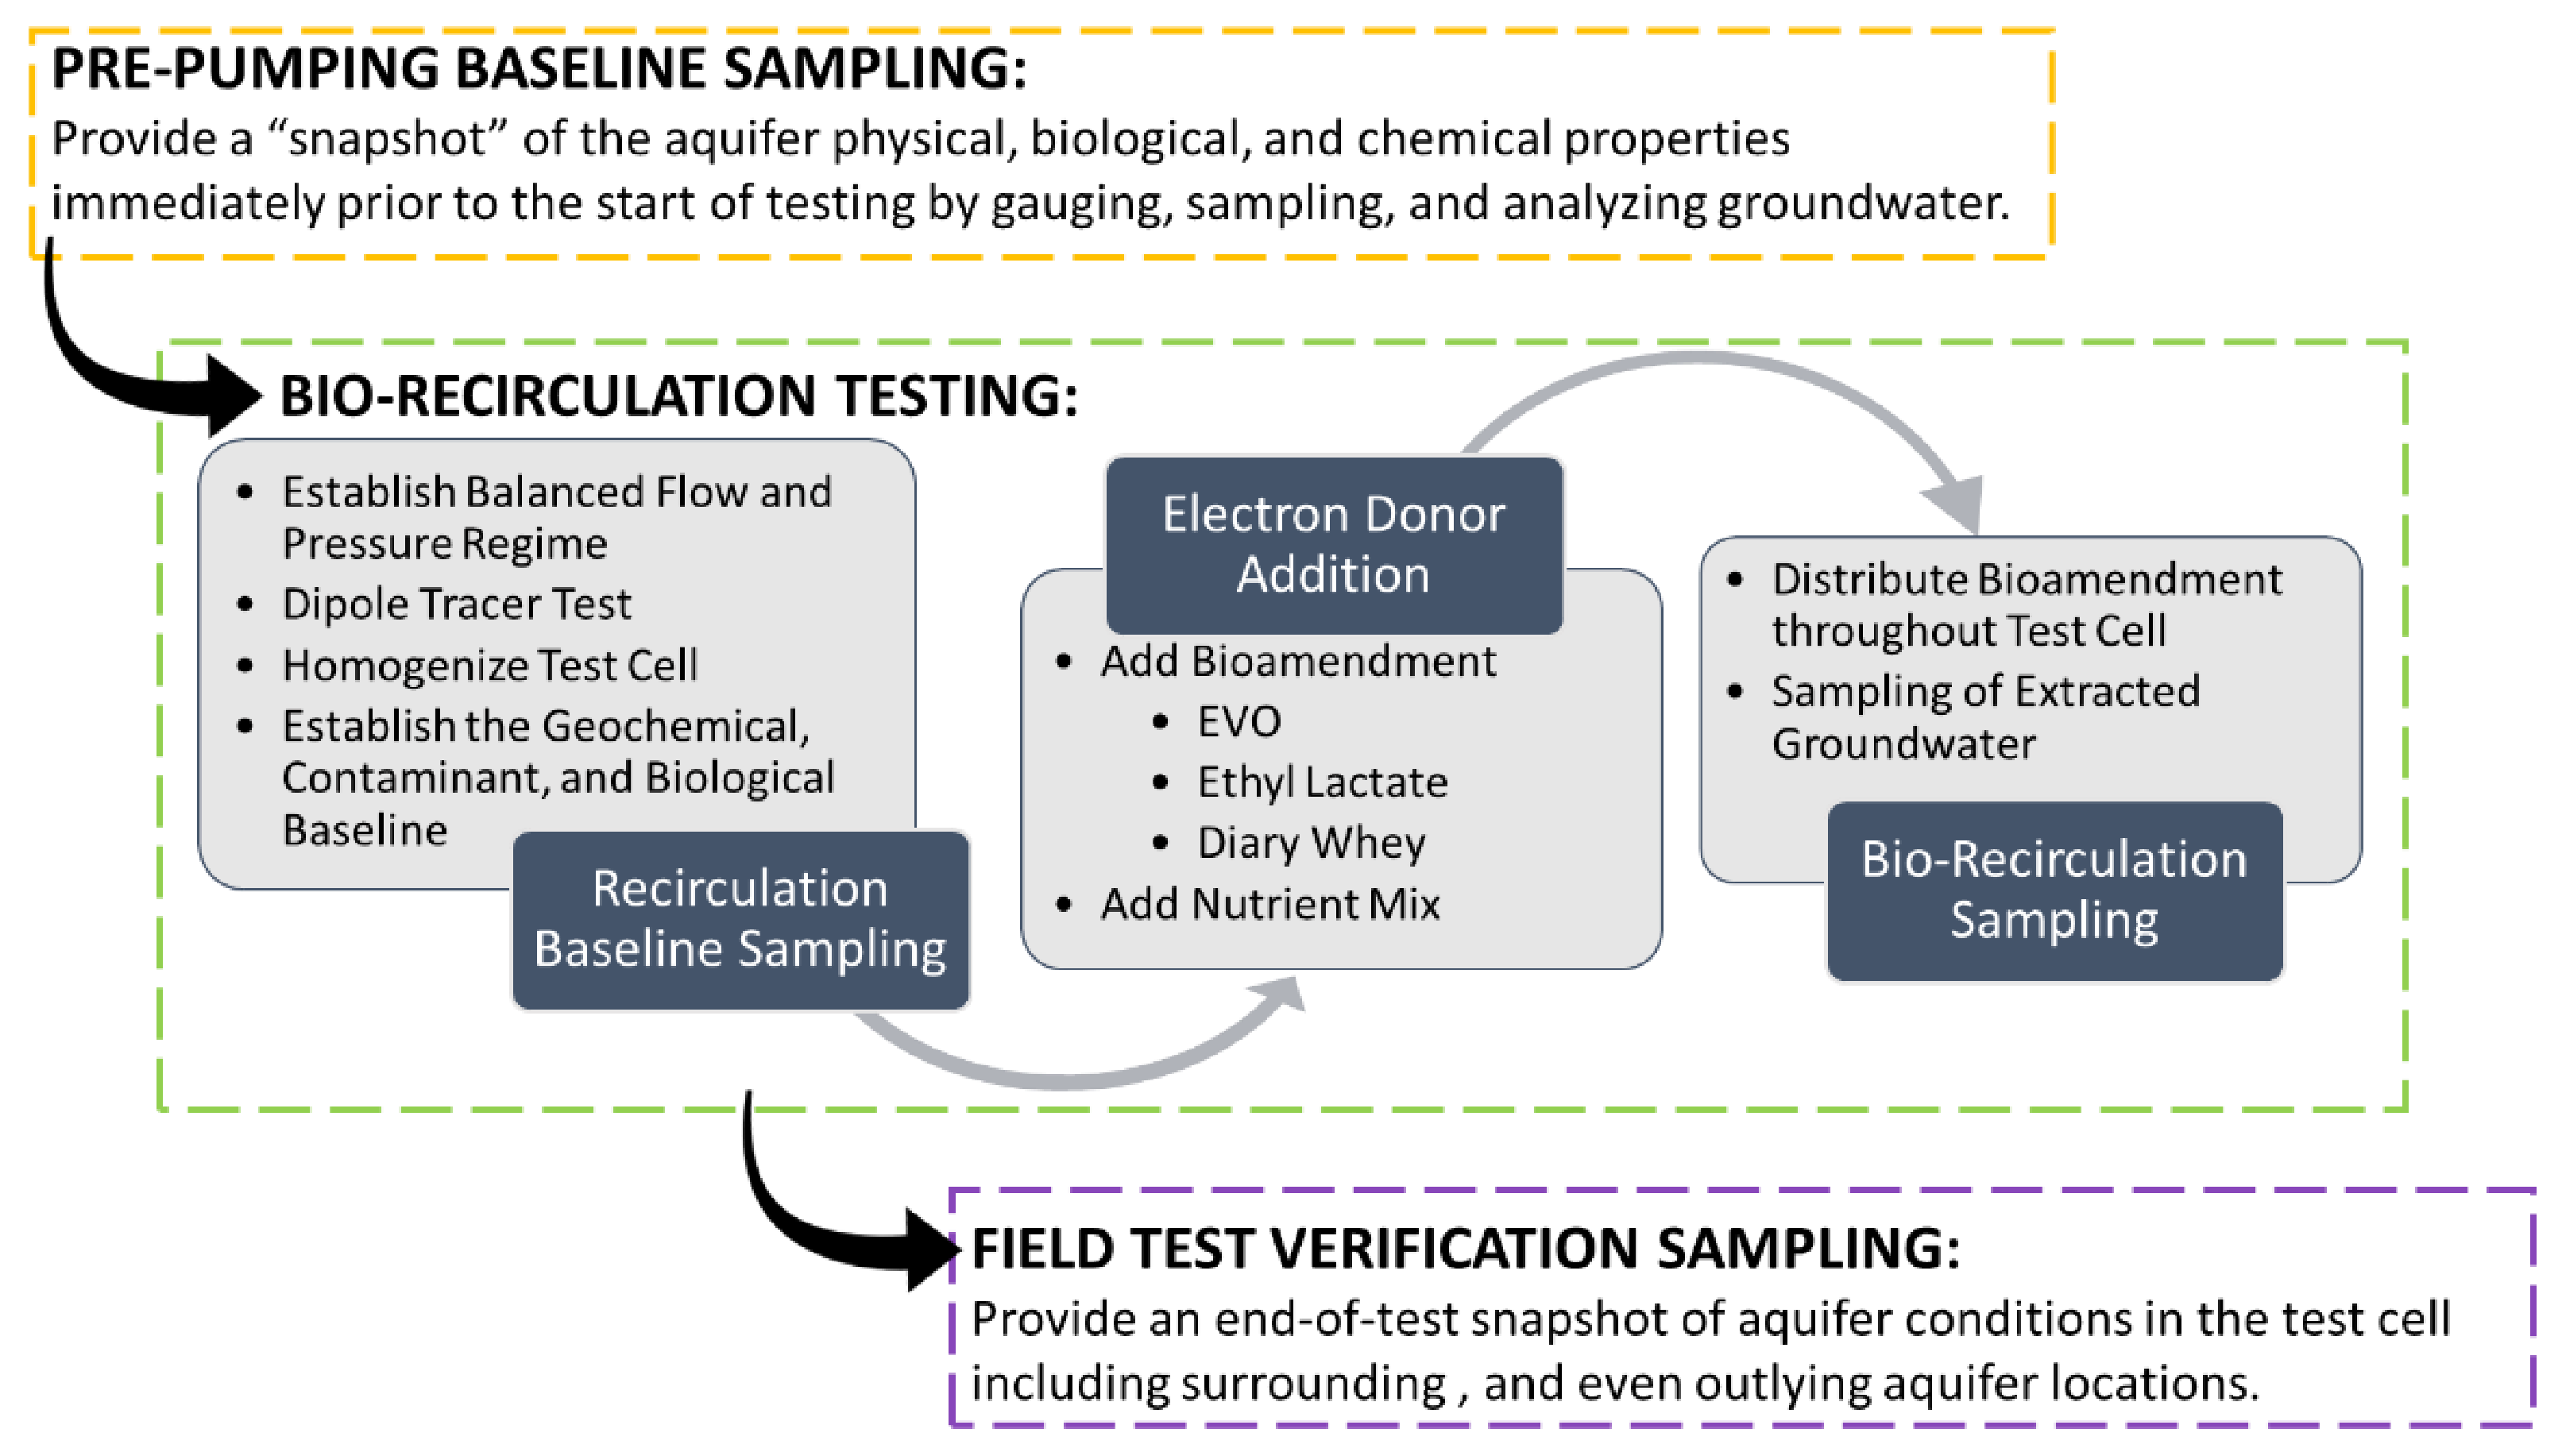
The revised, final FTP scope consisted of a sequence of activities involving recirculation of groundwater through the remediation system wells and periodic addition of bio-amendment formulation. In chronological order, these activities were: pre-pumping baseline sampling, biorecirculation testing, and verification sampling. Figure 4 below provides a flow chart of the FTP procedure and chronology.
Groundwater pressures during testing were measured using two methods. At the start of testing, water table elevations were measured using a water level meter to gauge the depth to groundwater from an established reference elevation at each wellhead. Wellhead reference elevations were measured by a Professional Land Surveyor licensed in the State of New Mexico, USA. Following the establishment of the water table elevations, submersible pressure transducers were installed in test cell and surrounding wells to provide continuous monitoring of water level changes. Extracted and injected water flow rates were measured using paddle-wheel flow indicating transmitters installed in manifolds housed within a remediation building centrally located in the hotspot area. Extracted and injected liquids from and to wells was transmitted via underground piping from the wells to the extraction and injection manifolds, respectively. The manifolds were used to isolate test cell flows, regulate flow and pressures, and inject/add tracers, bio-amendments, and nutrient mixtures.
Groundwater field screening for general water quality parameters were analyzed in the filed using handheld digital meters fitted with electrochemical and solid-state sensors. These digital meters were calibrated prior to deployment in the field and checked with reference solutions prior to use.
Groundwater and groundwater filtrate samples were collected and analyzed pursuant to the materials, methods, and procedures prescribed in the Revised FTP [4]. The groundwater sample collection methods prescribed in the Revised FTP include containerization and preservation approaches that meet US EPA methodology. Similarly, analyses of groundwater samples and groundwater filtrate were performed, reported, and validated at US EPA accredited laboratories and third-party data validation services. The methods for groundwater and groundwater filtrate sample analysis results presented in this paper follow:
- PCE, TCE, DCE isomers, and VC analysis: Gas chromatograph with mass spectroscopy detector (GC/MS) via US EPA Method 8260 [14].
- TOC: Carbonaceous Analyzer via US EPA Method 9060A [15].
- Groundwater microbial consortia sampling: Collected on a 0.40-micron sterilized filter.
- Phospholipid fatty acid analysis (PLFA): quantification of total viable biomass and general profile of the microbial community.
- The CENSUS qPCR: DNA-based method to accurately quantify specific microorganisms and functional genes responsible for biodegradation of contaminants.
PLFA and CENSUS qPCR analyses were developed and performed by Microbial Insights. Details of the materials and methods employed for these analyses are available on their webpage at https://microbe.com. (accessed on 25 October 2021)
2.3.1. Pre-Pumping Baseline Sampling
It is important that the plume in the source zone and hotspot area be characterized prior to the start of the pilot tests to be able to update the contaminant, geochemical, and biological baseline for the aquifer where the FTP was performed. Each well within the source and hotspot areas was gauged to determine the water table elevations under ambient flow, screened in the field for general water quality parameters (temperature, dissolved oxygen, pH, reduction-oxidation (redox) potential and specific conductance), and sampled to establish a geochemical, biological, and contaminant baseline immediately prior to the start of induced flow within the test cells.
2.3.2. Biorecirculation Testing
This phase of the FTP was performed to gather data for the assessment of the in situ performance of three candidate electron donors and the addition of hydrogen gas injection at the source zone. Biorecirculation testing consisted of four tasks: tracer testing, recirculation baseline sampling, and electron donor addition and biorecirculation sampling. These tasks were performed on all four test cells.
Tracer Testing
The tracer study incorporated into the recirculation testing was a critical step in understanding the travel time between injection and extraction wells and the expected flow and dispersion of the bio-amendments in situ. Bromide (in the form of sodium bromide salts) was used as the conservative (non-adsorbing) tracer. The tracer was added to the injection well at the manifold using chemical metering pumps. Monitoring of the tracers was accomplished using two methods: bromide probes installed in each of the test cell extraction wells (EW-3, HSE-11, and HSE-14) and sampling of the extraction well manifold. Extraction manifold samples were submitted for bromide laboratory analysis. Bromide probes were programmed to record bromide concentration at a frequency of once every half hour and bromide results were logged in the probe’s on-board datalogger. The datalogger was accessed and data downloaded weekly. Furthermore, samples were collected for laboratory bromide analyses during the recirculation testing. In addition, each batch of stock tracer solution was sampled and submitted for bromide analysis so that the injection concentration calculations could be checked for accuracy.
Baseline Recirculation Sampling and Analysis
Immediately prior to the additional bio-amendments to the test cell recirculation, the flow stream from the extraction well was sampled to assess the homogenization of the groundwater within the test cell. Similar to the pre-pumping baseline sampling, baseline recirculation samples were field screened (temperature, dissolved oxygen, pH, redox potential and specific conductance) and submitted for a full suite of laboratory analyses.
Electron Donor Addition
Upon completion of the baseline sampling tasks, the electron donor/nutrient test began. The electron donor volumes and recirculation requirements were established using the tracer test results. An injection of a nutrient mix was also included with each injection of electron donor. The nutrient mix was a yeast fermentation metabolite provided by JRW Bioremediation, LLC. It was added to accelerate the growth of the microbial populations. All the field test cells received supplemental injection of EVO. EVO was chosen as the electron donor for all four test cells primarily because vinyl chloride had begun to form in the EVO test cells but not in the EL or dairy whey test cells. Table 1 summarizes electron donor used at each test cell.
EVO Test Cell (HIS-19/HSE-14): The EVO used was a soybean oil-based product with a total organic carbon concentration of approximately 510 mg/L. Approximately 1381.7 L (365 gallons) of EVO and 283.9 L (75 gallons) of nutrient mix were fed as a stock solution into the injection well recirculation flow stream at an approximate feed rate of 15.1 L per hour (4 gallons per hour). Dosing of the EVO and nutrient mix required over five days. During and after the injection, recirculation was continued until the end of the 5-month testing period. Due to decreasing total organic carbon (TOC) concentrations measured in the extraction well discharge, supplemental electron donor addition was performed in the middle of the testing period. HSI-19 received approximately 946.4 L (250 gallons) of EVO solution over a 6h period and 227.1 L (60 gallons) of nutrient mix injected over a 2h period as a supplemental EVO dose.
Source Zone Test Cell (IW-2S, IW-2D/EW-3: EVO and Hydrogen Gas Infusion): The source zone test cell was slightly different than the hotspot test cell in that injection wells within the shallow aquifer and within the source zone were split into two wells: a collocated shallow and deep injection well. This change was implemented because the deeper sediments above the aquitard were lower in permeability compared with the upper portion of the shallow aquifer, and these deeper sediments were significantly more contaminated. Therefore, without separating the injection well into two separate and isolated screen sections, amendments and nutrients injected into a single well would have been disproportionately administered to areas of higher permeability which did not coincide with the highest levels of contamination.
In this source zone test cell, electron donor addition occurred in two separate periods. The recirculation of the first period was three months, and the second period was one month. For the first period, infusion of hydrogen gas was initiated with recirculation prior to amendment injection. After 20 days of hydrogen gas infusion, the EVO/nutrient mix was injected in a fashion as described earlier. Approximately 1249.2 L (330 gallons) of EVO solution and 227.1 L (60 gallons) of nutrient mix were injected as a solution through IW-2S and IW-2D (the shallow and deep injection wells). The second period started with a supplemental dose of nutrient mixture and was followed by injection of EVO. Each of IW-2S and IW-2D received approximately 832.8 L (220 gallons) of EVO injected over a 5.0 h period and 227.1 L (60 gallons) of nutrient mix injected over a 2.0 h period. Recirculation followed the direct injection of EVO and nutrient solution.
Dairy Whey Test Cell (HSI-8/HSE-6): A portion of the dairy whey amendment was metered into the recirculation flow; however, due to a malfunction of the chemical metering equipment the recirculation flow was temporarily stopped, and most of the dairy whey amendment was directly injected into injection well HSI-8. Approximately 997.9 kg (2200 pounds) of whey along with 283.9 L (75 gallons) of concentrate nutrient solution was blended with groundwater extracted from HSE-6, and injected into HSI-8. The solution (whey/nutrient/groundwater) were injected over an approximate 2.0 h period at an approximate rate of 9.5 L per minute (2.5 gallons per minute). Recirculation was reinitiated immediately following the direct injection of the amendments and nutrients. Recirculation was stopped 15 days after the direct injection. About three months after ceasing recirculation, the test cell received a supplemental dose of EVO and nutrient solution. This supplemental dose added to HSI-8 consisted of approximately 946.4 L (250 gallons) of EVO solution added over a 6.0 h period and 227.1 L (60 gallons) of nutrient solution over a 2.0 h period. Recirculation, which began immediately after the EVO injection, operated continuously for a month.
Ethyl Lactate Test Cell (HSI-14/HSE-11): Approximately 1457.4 L (385 gallons) of EL and 246.1 L (65 gallons) of nutrient mix were injected simultaneously as a solution at an approximate feed rate of 2.7 L per hour (4.7 gallons per hour) over 4 days into the recirculation flow between HSE-11 and HSI-14. During and after the injection, recirculation was continued for total of two weeks. About 4 months after ceasing recirculation, a supplemental injection of nutrient mixture and EVO was added to the test cell. The supplemental injection at this test cell consisted of approximately 946.4 L (250 gallons) of EVO solution over a 6.0 h period and 227.1 L (60 gallons) of nutrient mix injected over a 2.0 h period. Recirculation, which began immediately after the supplemental EVO injection, lasted for a month.
Biorecirculation Sampling
Biorecirculation sampling occurred from the beginning of the recirculation period and 1 month after stopping recirculation flow. Table 1 summarizes biorecirculation sampling analysis and test methods. The primary sampling during this phase was from the test cell extraction wells at the manifold; however, in the source zone dual completed monitoring wells located 0.9 m (3 feet) from the extraction well and screened in the lower and upper portions of the shallow aquifer were also sampled. These wells were designated SMW-3S and SMW-3D, where the ‘S’ and ‘D’ designated the shallow and deeper zones of the water-table aquifer.
2.3.3. Field Test Verification Sampling
Verification sampling took place about two weeks after the last biorecirculation sampling. Similar to the pre-pumping baseline sampling, the verification testing encompassed collecting and analyzing groundwater from a much larger sample set compared to the sampling performed during the active pilot testing. The results from the verification sampling provided an end-of-test snapshot of aquifer conditions in the test-cell treatment zones, including surrounding, and even outlying aquifer locations. Sufficient groundwater was collected at each well to adequately allow for field screening and laboratory full suite analyses.
2.3.4. Microbiological Sampling
In addition to the routine geochemical and contaminant sampling and analyses, samples were collected during the baseline recirculation testing, electron donor addition, and verification sampling phases of the pilot test for PFLA and Census qPCR analysis. Sampling of the microbiome was achieved by flowing the groundwater through a sterile filter (Bio-flo® samplers supplied by Microbial Insights) to collect the suspended microbes onto the filter. The total volume of groundwater passed through the filter was recorded and the filter was sealed and put on ice for delivery to the laboratory for analysis. The residues captured on the filter, including the microorganisms filtered from the groundwater, were backflushed in buffered sterile water solution for concentration via centrifuge. Extracts for MMM analyses were generated from these concentrated filtrate residues. Three samples were submitted to establish a baseline of the microbial consortia present in the hotspot and source zone areas of the shallow aquifer. A total of six groundwater samples were collected during the biorecirculation testing and 1 was collected during verification sampling period for the MMM analyses submitted to Microbial Insights. All samples were subjected to select MMMs to determine the presence of chlorinated hydrocarbon-degrading microorganisms and genes producing reductive dechlorination enzymes, the basic phylogeny of the microbiome, and their population density. Unlike traditional laboratory-based microcosm studies, these analyses were performed on fresh groundwater samples, without culturing or growth on selective medium.
3. Results
3.1. Tracer Test Results
As discussed above in Section 2.2.1, remedial design modeling suggested a 9.5 lpm (2.5 gpm) recirculation flow rate to achieve an approximate 26-day travel time between injector–extractor wells. The dense, high-resolution geologic characterization achieved during the installation of the wells and the tracer test results, however, indicated that the first arrival and median travel times were much shorter than 26 days, at recirculation flow rates between 15.1 and 20.4 lpm (4.0 and 5.4 gpm). The difference between design and operational flows and travel times was due to heterogeneities in the shallow zone geology, which consisted of a general fining of the materials from the water table to the aquitard. This resulted in higher permeable zones in the upper portions of the aquifer and channels or braids of coarse materials interbedded and intermittent throughout. At the EL, EVO, and source zone test cells, between approximately 1892.7 and 2271.3 L (500 and 600 gallons) of bromide tracer stock solution was injected into the recirculation flow stream at rates ranging between approximately 15.1 and 18.9 L per hour (4 and 5 gallons per hour, respectively). The flows were adjusted upward from the design flow rates until the pressure responses recorded at the extraction and injection wells were approximately equal to the pressure responses at these wells predicted in the numerical flow model used for the remedial design. Average bromide stock solution concentrations ranged between approximately 1250 mg/L and 3000 mg/L. Care was taken to keep the injected bromide concentration below 100 mg/L to reduce its antiseptic properties. Tracer testing was not conducted in the dairy whey test cell.
Breakthrough and peak detections of the bromide tracer at the extraction wells varied from test cell to test cell. At the EL and EVO test cells, breakthrough was detected at the extraction wells 18 h after injection started. The peak detection times and concentrations varied between these test cells. In the EL test cell the peak detection occurred after 6.9 days of injection, and in the EVO test cell the peak detection occurred 5.4 days post injection. The peak concentrations detected at the EL and EVO test cells were approximately 50 mg/L and 80 mg/L bromide, respectively. These peak concentrations were between approximately 50% and 70% of the injected bromide concentration and indicated variability in hydrodynamic dispersion, likely a measure in the degree of heterogeneity in different areas of the water-table aquifer.
In the source zone test cell, a total of 2400.0 L (634 gallons) of tracer stock solution, at an average bromide concentration of 1250 mg/L, was injected. The average feed rate of the tracer stock solution was 20.4 L per hour (5.4 gallons per hour). Breakthrough of the bromide tracer was detected 96 h later in EW-3, with the peak detection occurring after 48 days of injection and recirculation. Compared with the other test cells, these results confirm the low permeability zones present at the base of the shallow aquifer and the need for segregating the source zone injection wells.
The USEPA semi-analytical ground-water flow simulation program RESSQC, a computational module of Wellhead Protection Analysis (WHPA), was used to delineate the time-related capture zone around the extraction wells and tracer fronts around injection wells. The volume of the capture zone at time of maximum breakthrough was modeled for each test cell. Ultimately, the flow model calibrated to the results of the tracer tests was used to assess full-scale operational modes, where injected amendments could be mixed with greater contact and long travel paths could be developed to extend travel times and improve contact with bio-amendments within the hotspot treatment area.
3.2. Dissolved Chlorinated Hydrocarbon Analysis Results
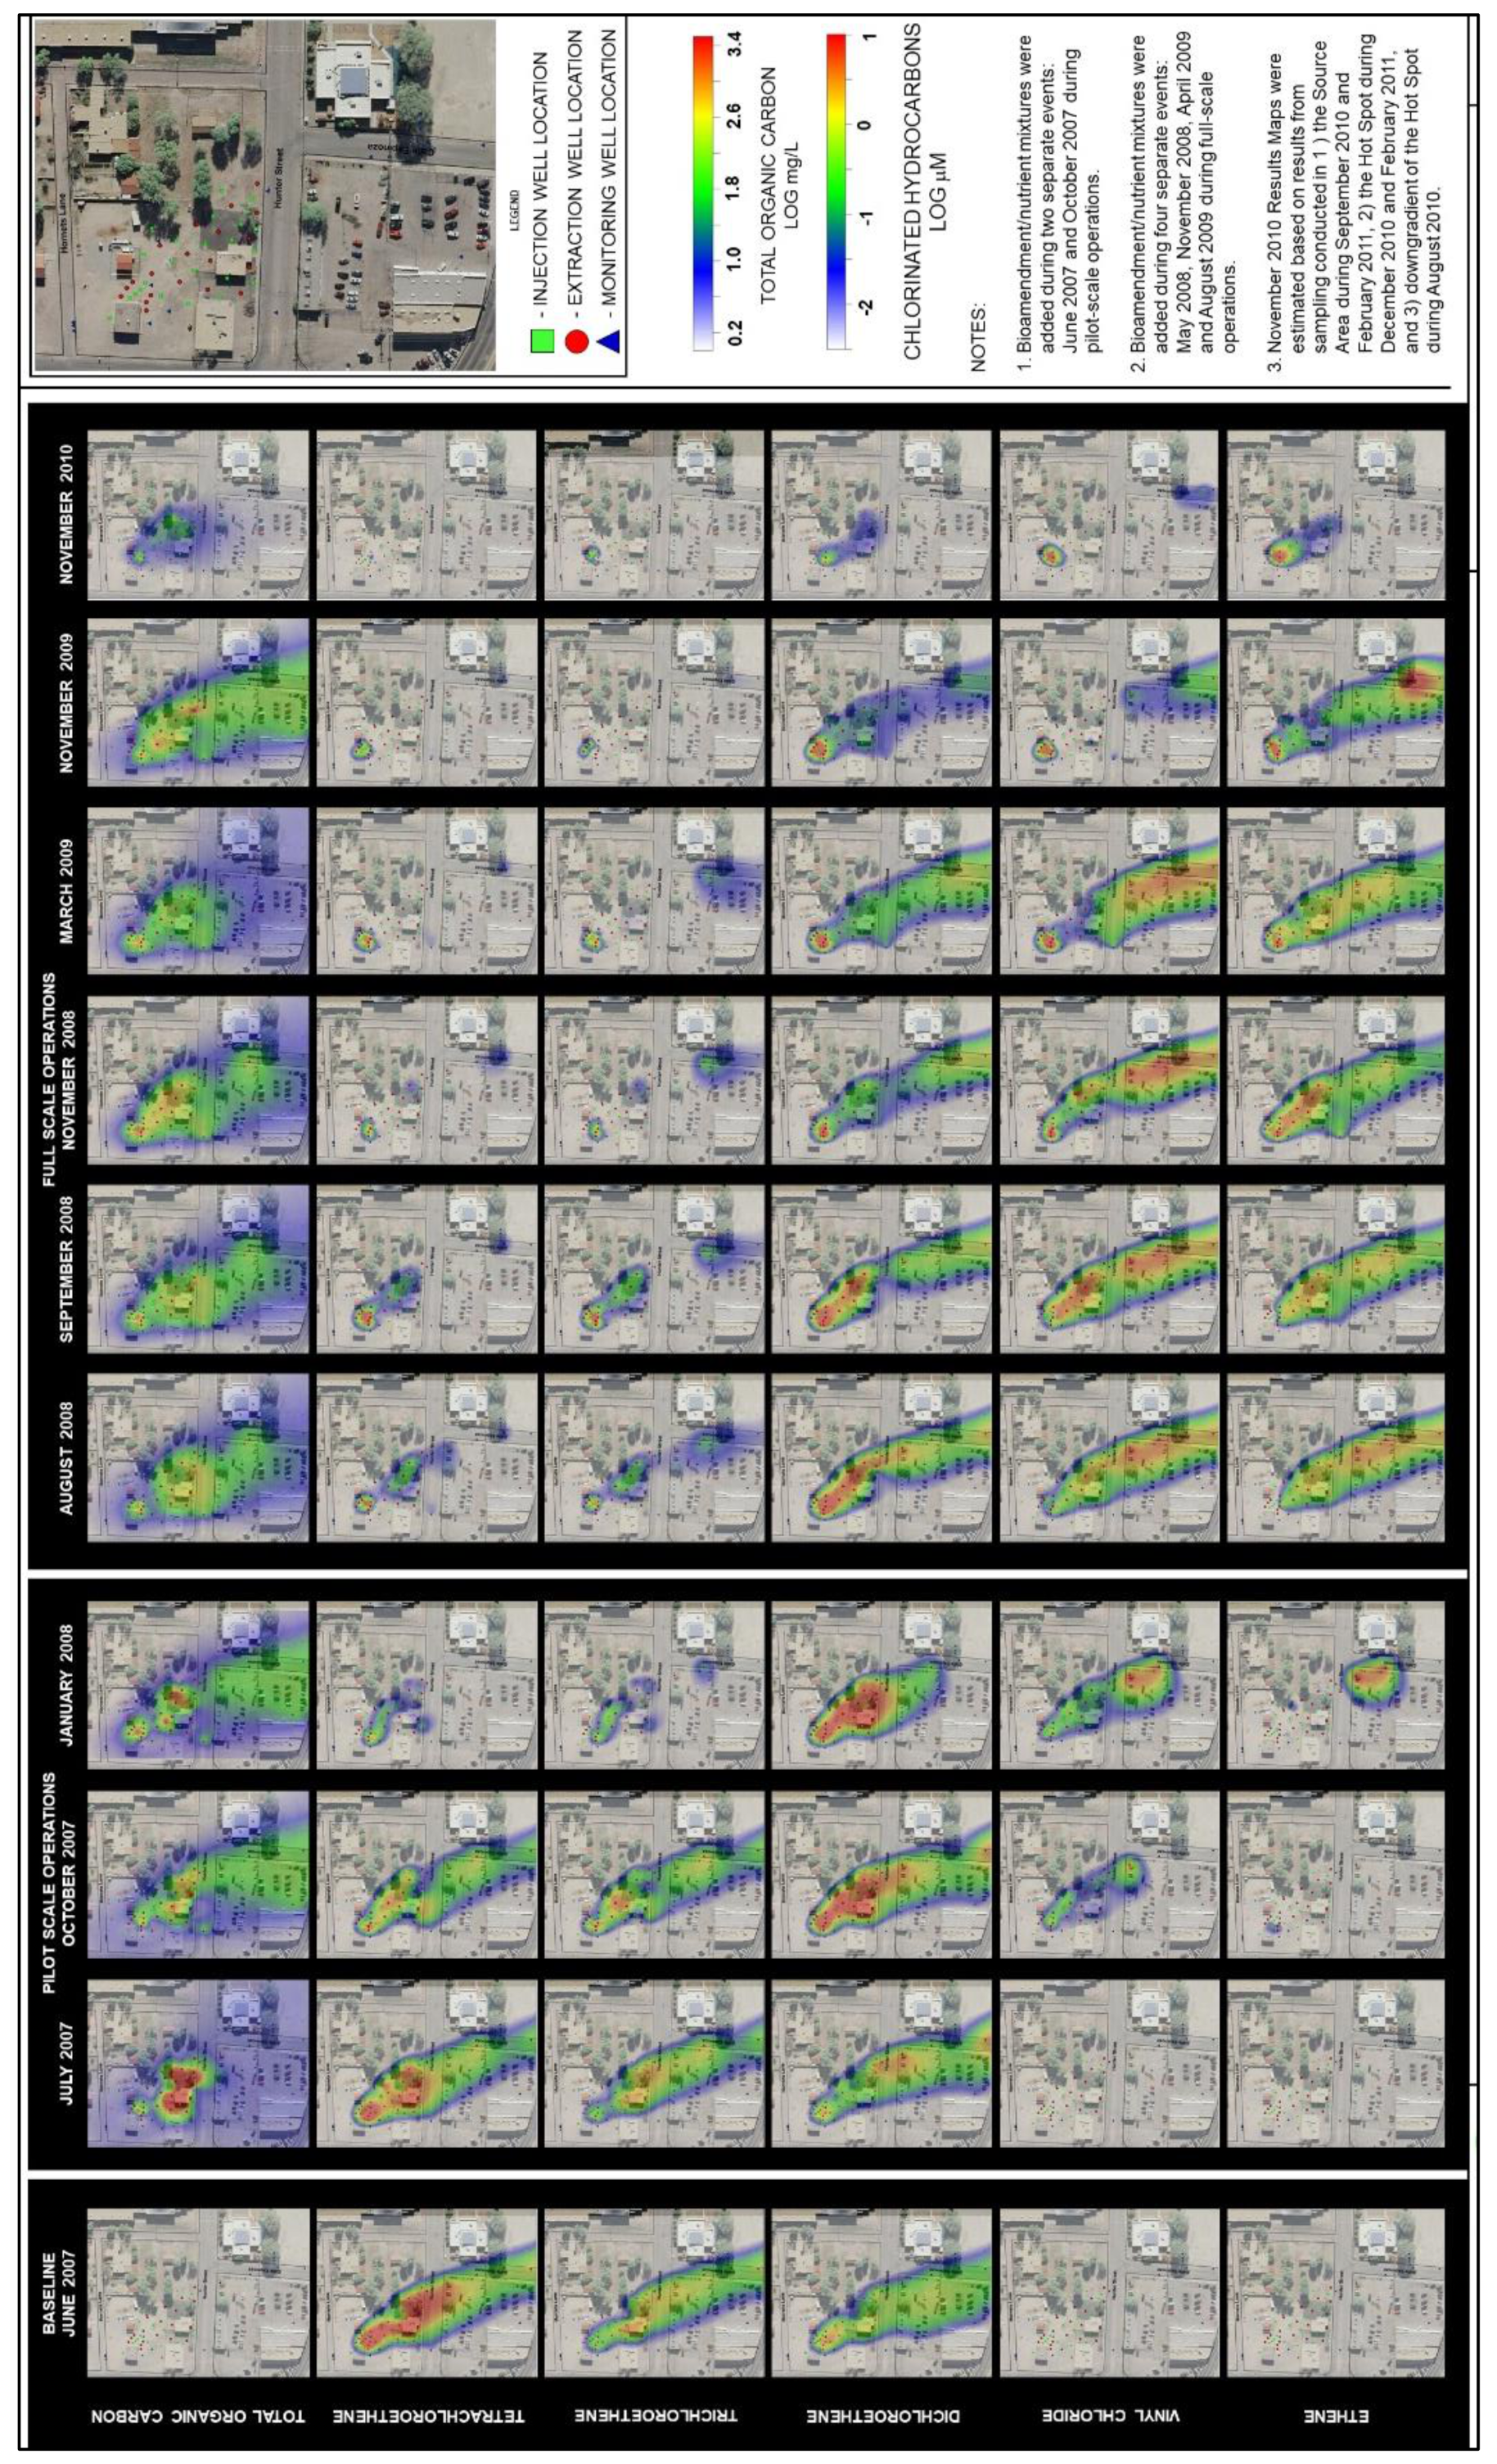
The Appendix A contains heat maps of bio-amendment distribution in the subsurface shown as TOC, as well as the distribution of PCE and its ERD byproducts (TCE, DCE, VC, and ethene) prior to and during pilot testing and the first portion of full-scale remediation operations. The sections below discuss the dissolved chlorinated volatile organic compounds (cVOC) results of each test cell.
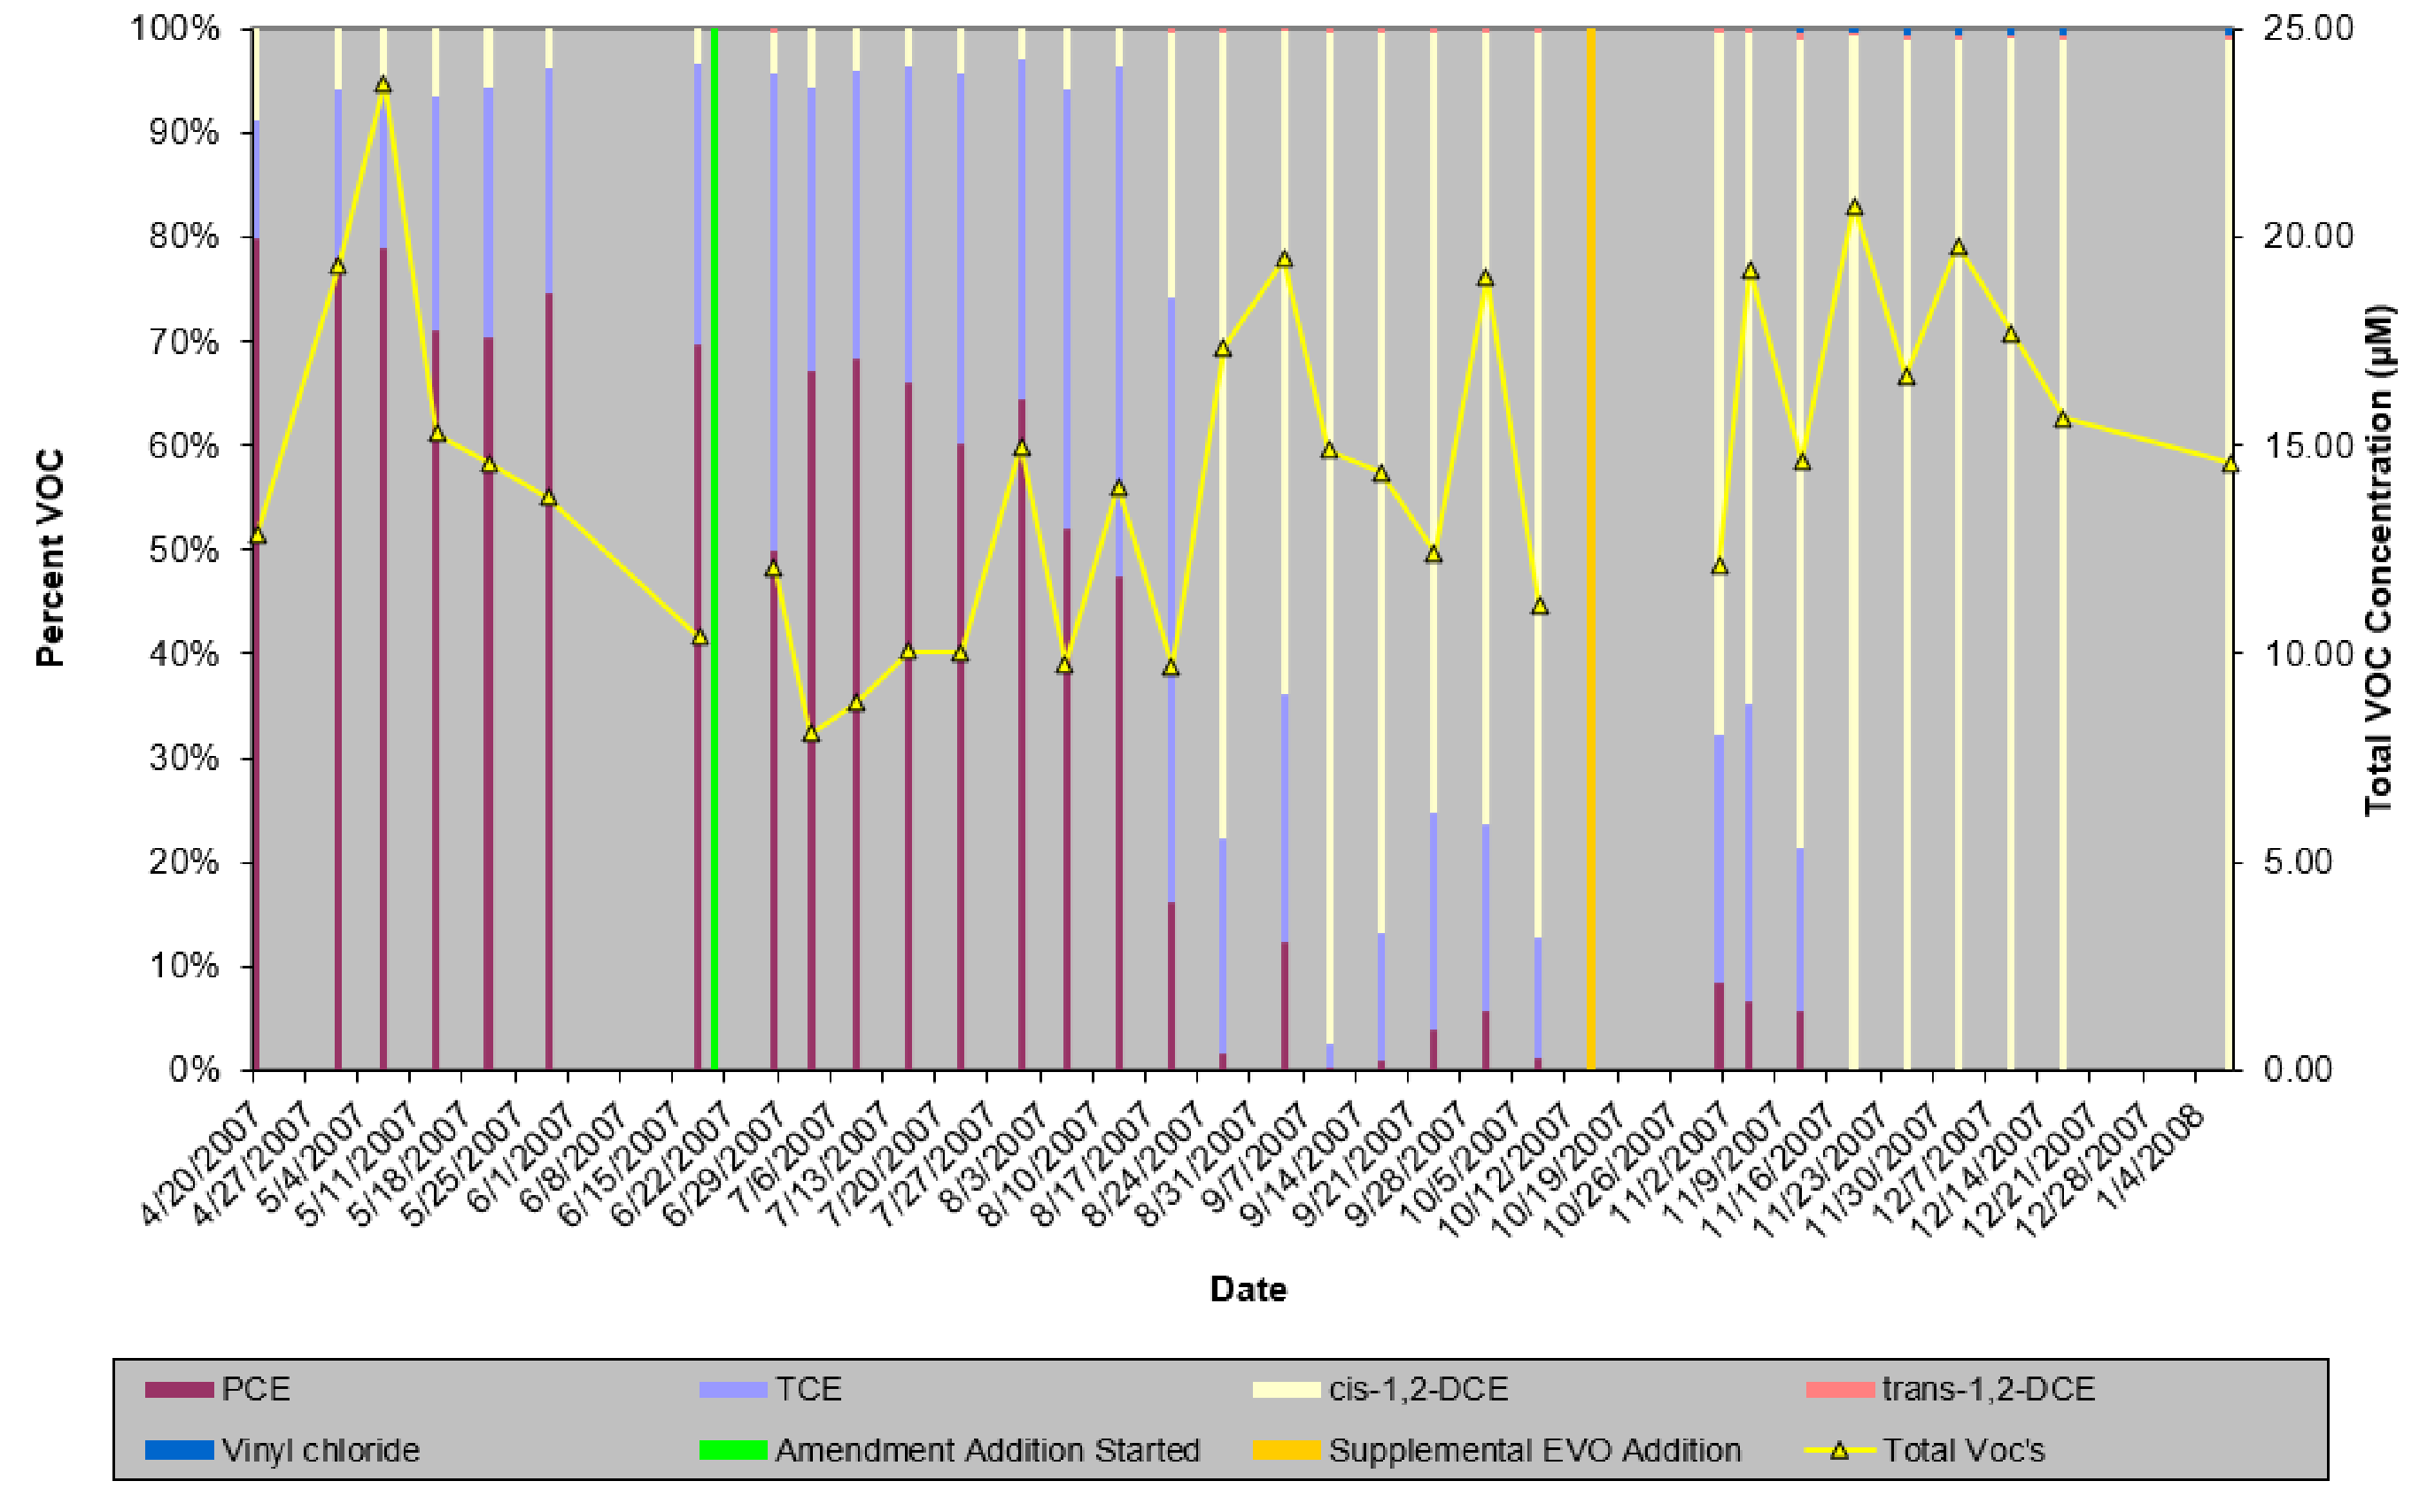
3.2.1. Ethyl Lactate Test Cell cVOC Results
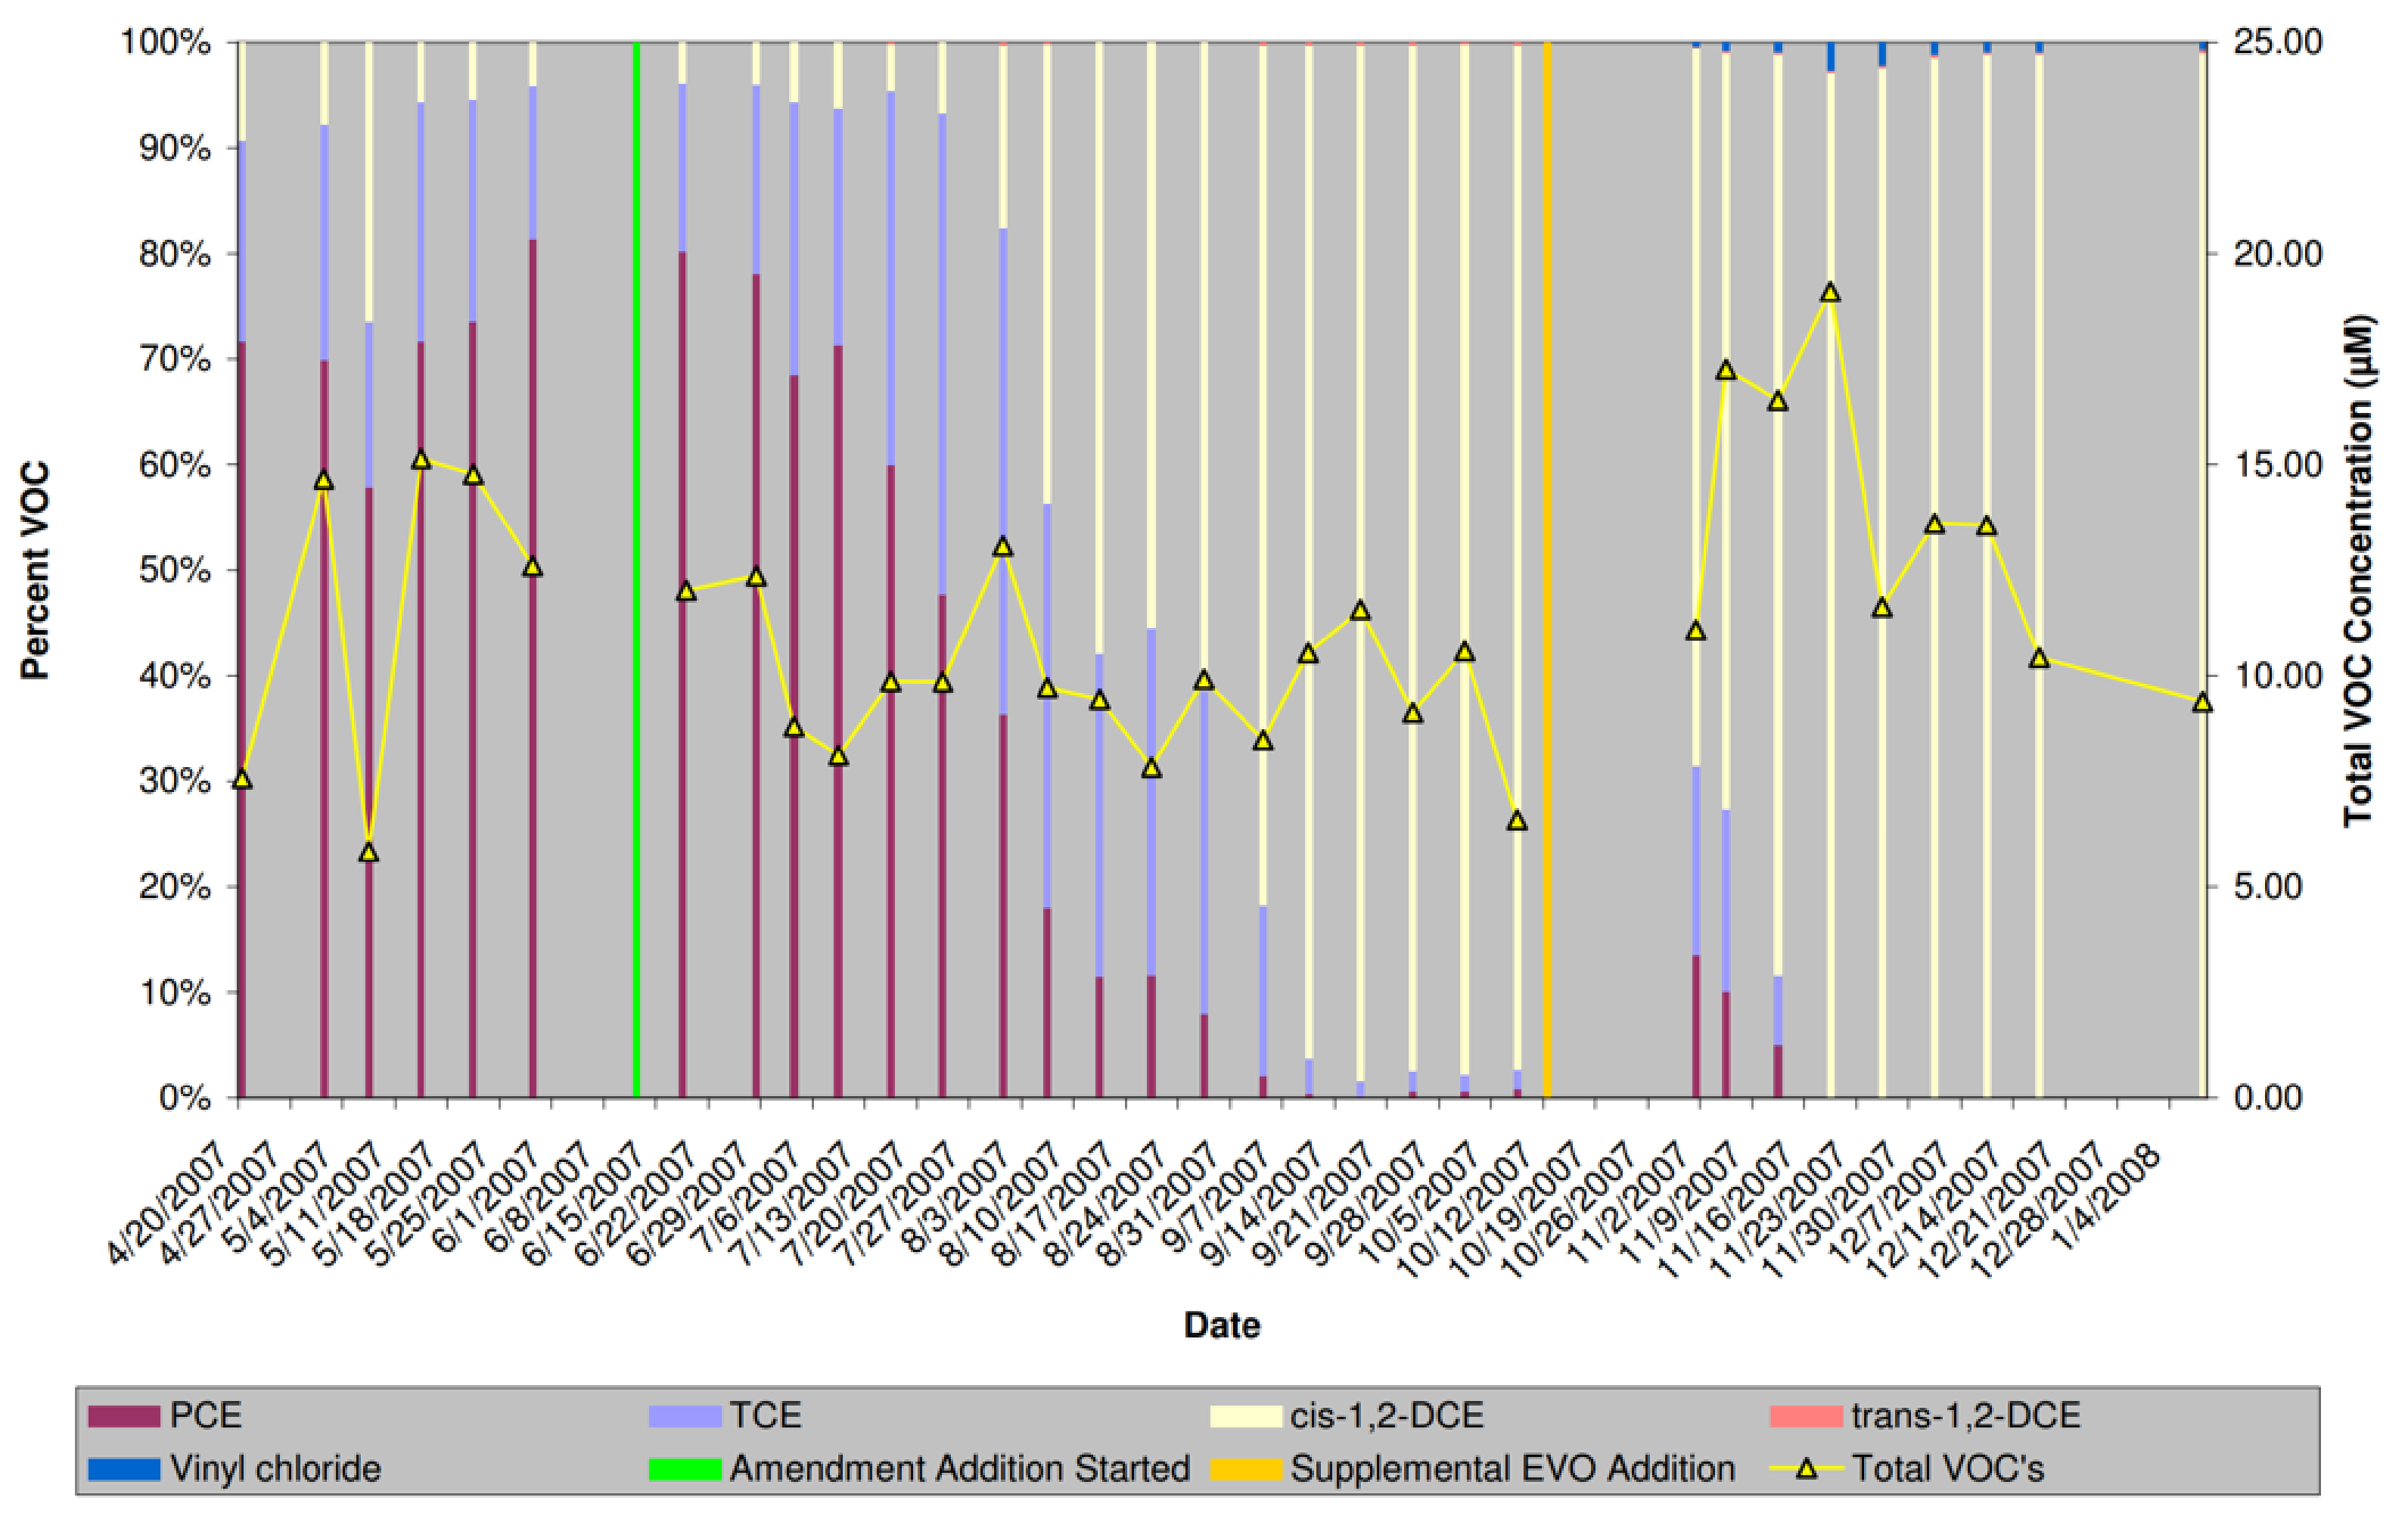
The proportions of PCE, TCE, DCE isomers, VC, and their sum (total cVOC) at HSE-11 are summarized in Figure 5. A comparison of VOC analysis results prior to and following the addition of EL showed that the dissolved-phase concentration of total cVOCs decreased from a baseline of 9.88 micromole (μM) to a low of 6.59 μM. Following the supplemental EVO addition, the concentration increased to 14.87 μM before decreasing to 9.39 μM on 8 January 2008. PCE concentrations steadily dropped from a baseline average of 1410 μg/L to non-detectable (<1.0 μg/L) on 19 November 2007, but increased to 2.7 μg/L on 8 January 2008. TCE increased from a baseline average of 307 μg/L to a high of 790 μg/L on 31 July 2007 before steadily decreasing, and was non-detectable (<1.0 μg/L) after 19 November 2007. Cis-DCE increased from a baseline average of 90 μg/L to a high of 1800 μg/L on 19 November 2007 and decreased to 900 μg/L as of 8 January 2008. Trans DCE increased from being non-detectable (<5.0 μg/L) to a concentration of 2.4 μg/L on 8 January 2008. Vinyl chloride was non-detectable (<1.0 μg/L) until the supplemental addition of EVO, after which a peak concentration of 32 μg/L was reached on 19 November 2007 and decreased to 4.1 μg/L by 8 January 2008. It should be noted that an anticipated result of ERD is increased dissolved-phase concentrations in the initial phases of remediation due to the increased solubility of PCE-daughter products (e.g., VC is approximately 18 times more soluble in water than PCE), the desorption of adsorbed-phase contaminants from the addition of amendments, and the increased flow induced by recirculation.
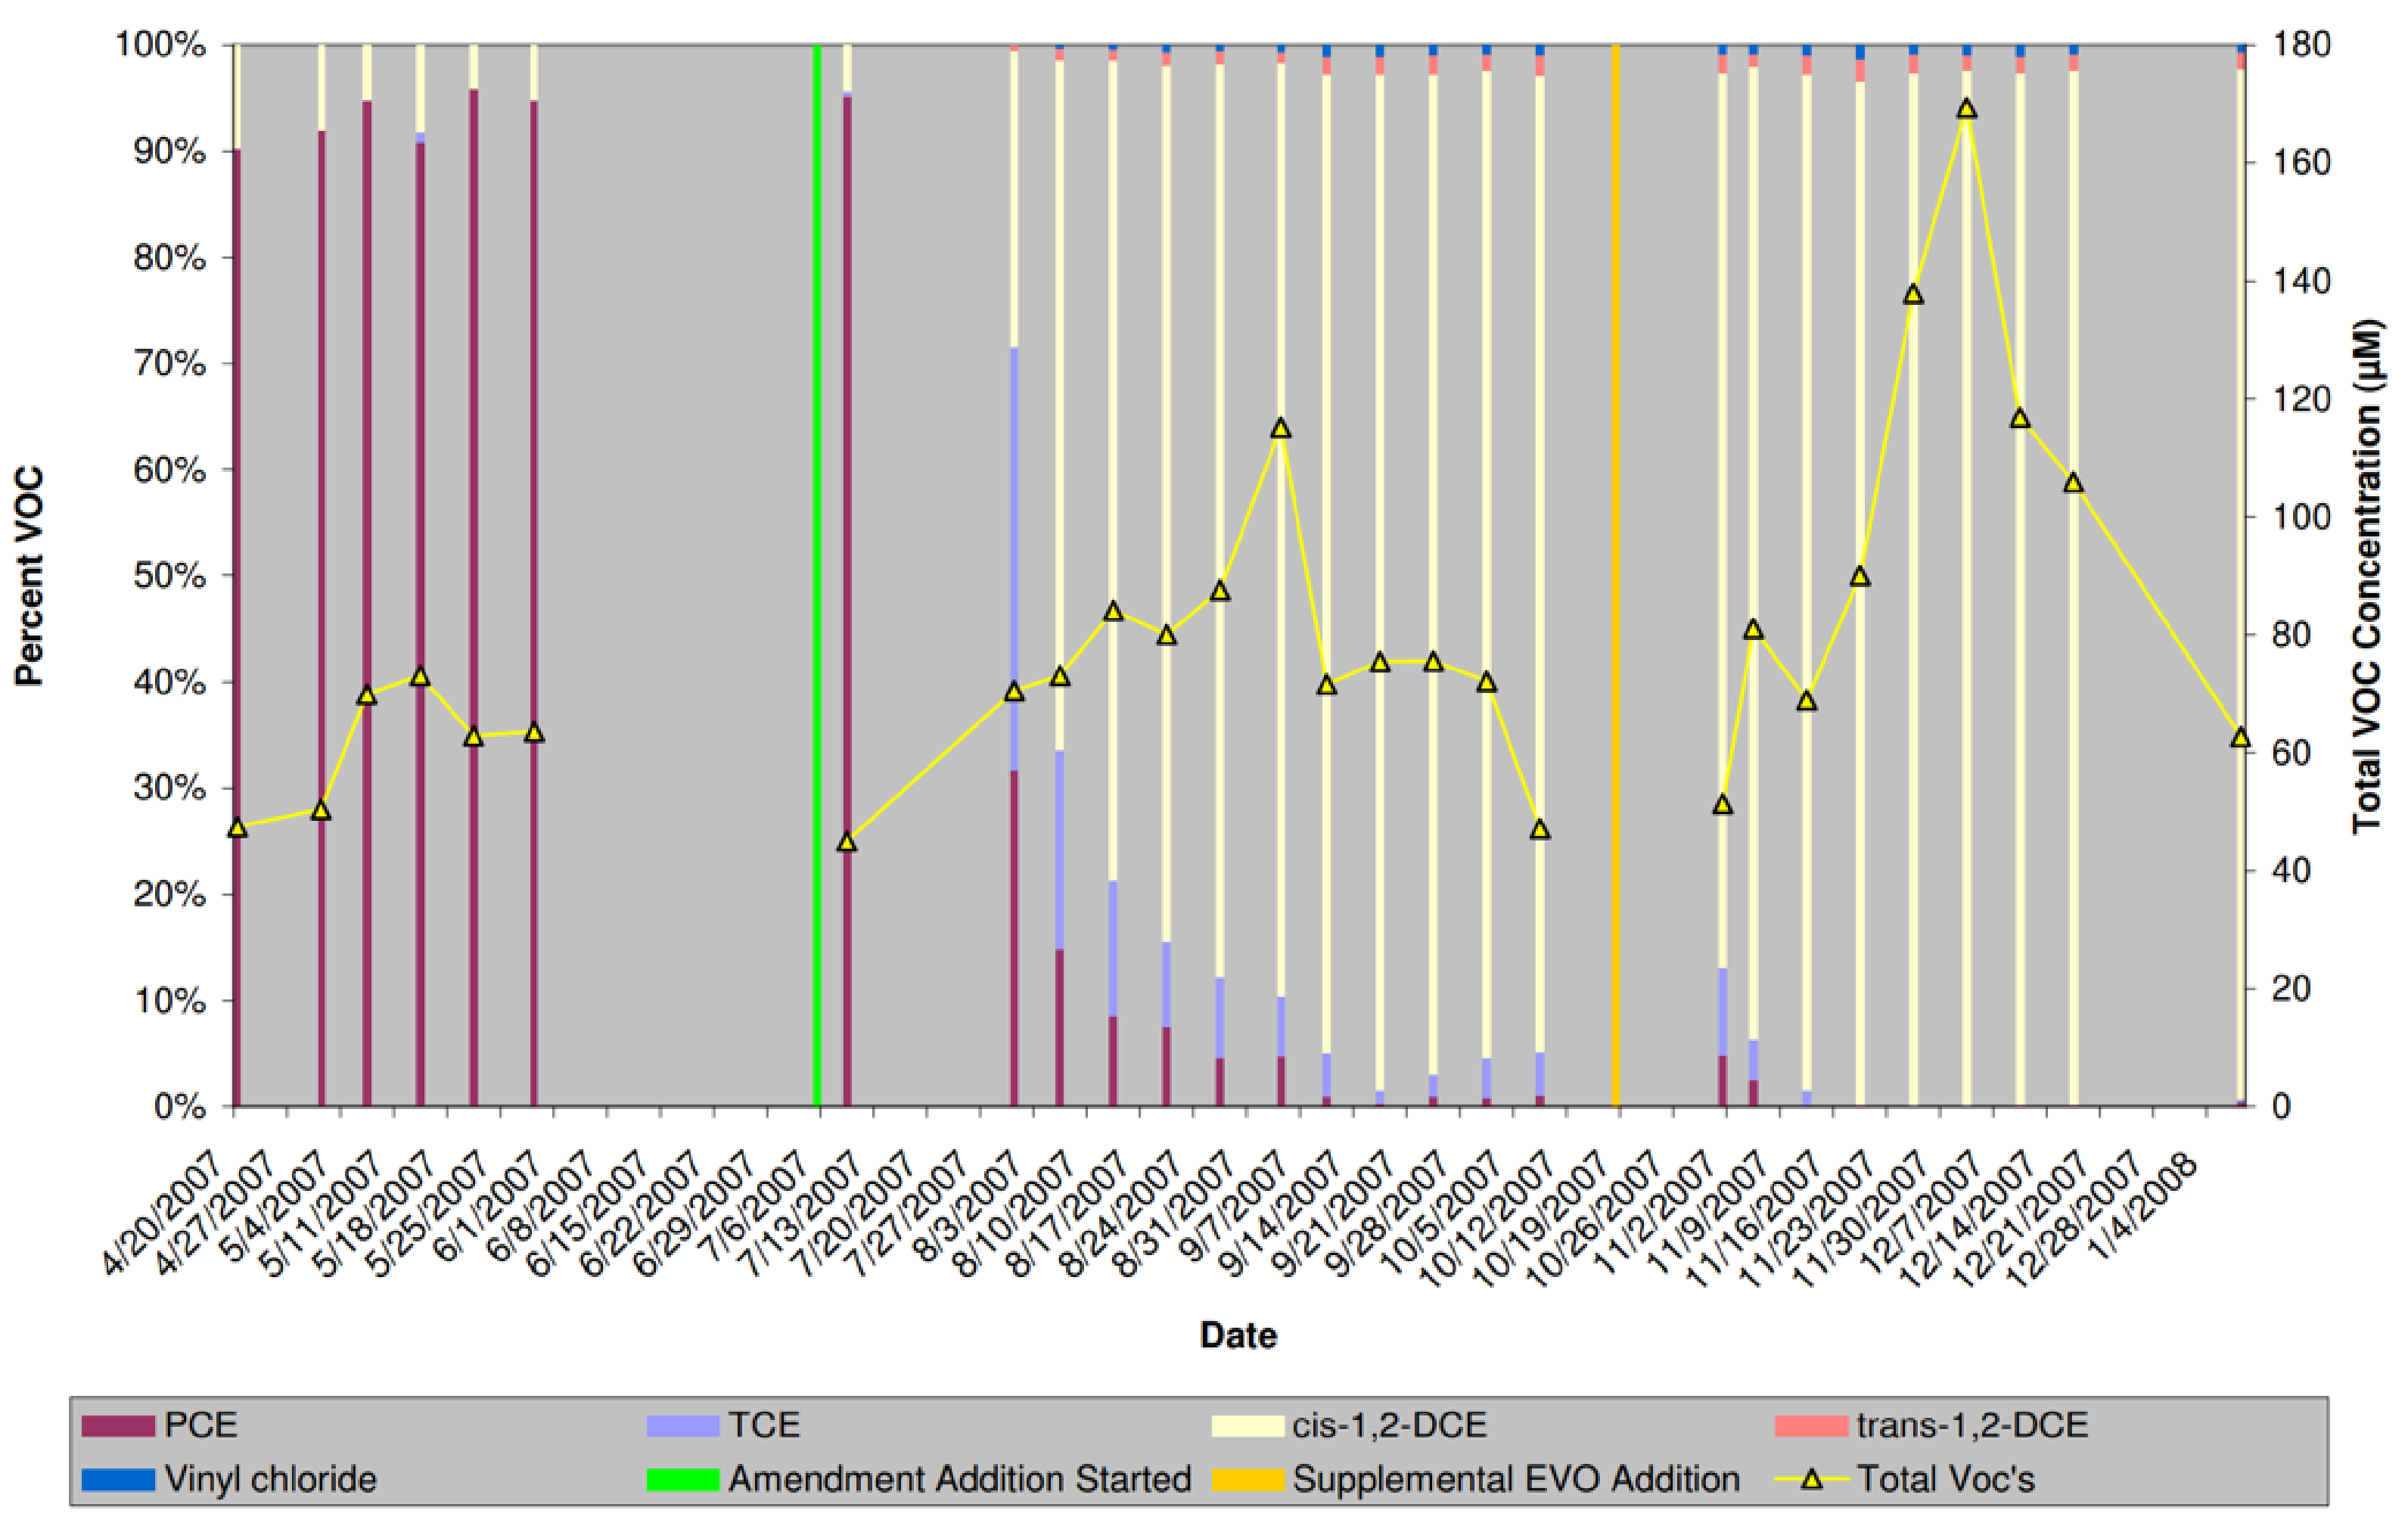
3.2.2. EVO Test Cell cVOC Results
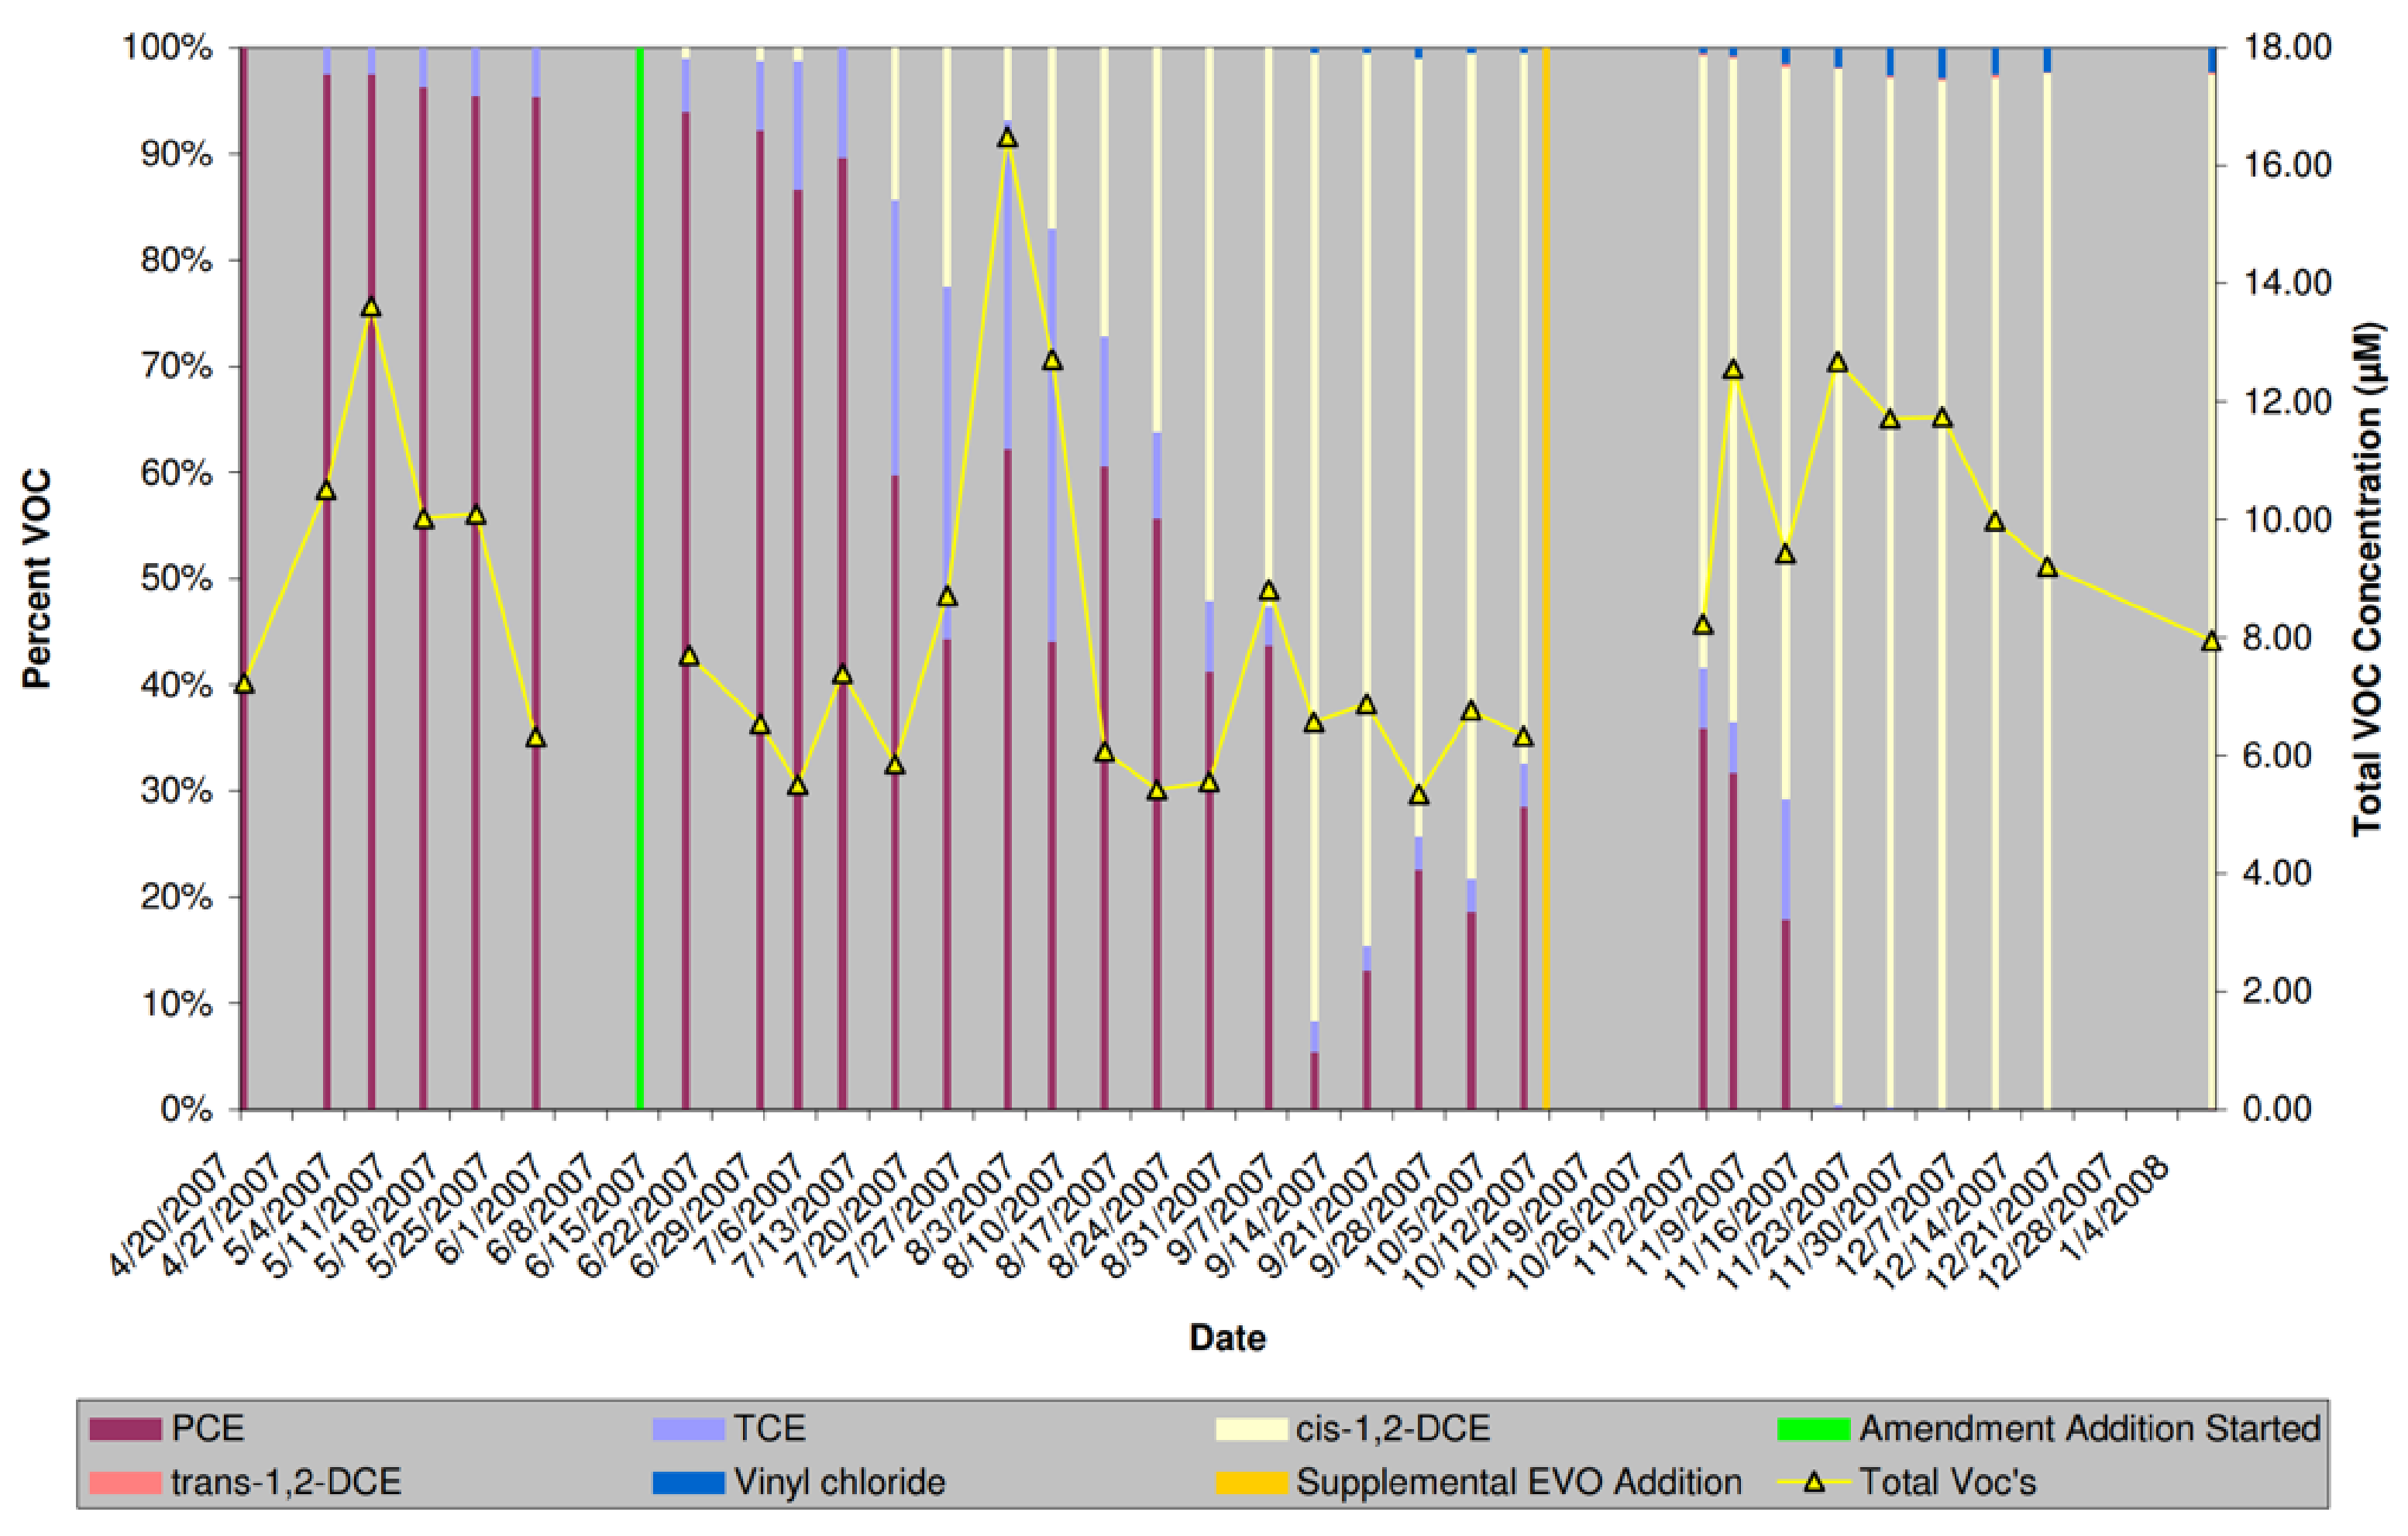
Fractions of and total cVOC concentrations at HSE-14 are summarized in Figure 6. A comparison of cVOC analyses prior to and following the addition of EVO shows that total cVOCs decreased from 7.57 μM to a low of 5.34 μM. Following the supplemental EVO addition, concentrations increased to 10.77 μM, and then decreased to 7.95 μM on 8 January 2008. PCE steadily dropped from a baseline average of 1550 μg/L to non-detectable (<1.0 μg/L) on 26 November 2007, and then increased to 1.2 μg/L by 8 January 2008. TCE increased from the baseline of 45 μg/L to a high of 670 μg/L by 31 July 2007 before steadily decreasing to non-detectable (<1.0 μg/L) by 10 December 2007. Cis-DCE increased from a baseline of <5.0 μg/L to a high of 1200 μg/L on 19 November 2007 and decreased to 750 μg/L by 8 January 2008. Trans-DCE increased from non-detectable (<5.0 μg/L) to a concentration of 2.2 μg/L on 8 January 2008. Vinyl chloride was non-detectable (<2.0 μg/L) until 10 September 2007, after which a peak concentration of 19 μg/L was detected on 26 November 2007, but decreased to 11 μg/L on 8 January 2008.
3.2.3. Dairy Whey Test Cell cVOC Results
Proportions of and total cVOC concentrations at HSE-6 are summarized in Figure 7. A comparison of cVOC analyses prior to and following the addition of whey showed that the average concentration of total cVOCs decreased from 12.89 μM to a low of 8.09 μM. Following the supplemental EVO addition, the cVOCs increased to 16.85 μM with a low of 12.12 μM, and then increased to 14.60 μM on 8 January 2008. PCE concentrations steadily dropped from a baseline average of 1957 μg/L to non-detectable (<1.0 μg/L) by 19 November 2007. TCE increased from a baseline average of 393 μg/L to a high of 900 μg/L on 13 August 2007, and then steadily decreased to non-detectable (<1.0 μg/L) by 19 November 2007. Cis-DCE increased from 87 μg/L to a high of 2000 μg/L on 19 November 2007 and decreased to 1400 μg/L by 8 January 2008. Trans-DCE increased from being non-detectable (<1.0 μg/L) to 4.1 μg/L by 8 January 2008. Vinyl chloride was non-detectable (<1.0 μg/L) until the supplemental addition of EVO, after which a peak concentration of 7.1 μg/L was reached on 10 December 2007, decreasing to 6.6 μg/L on 8 January 2008.
3.2.4. Source Area Test Cell
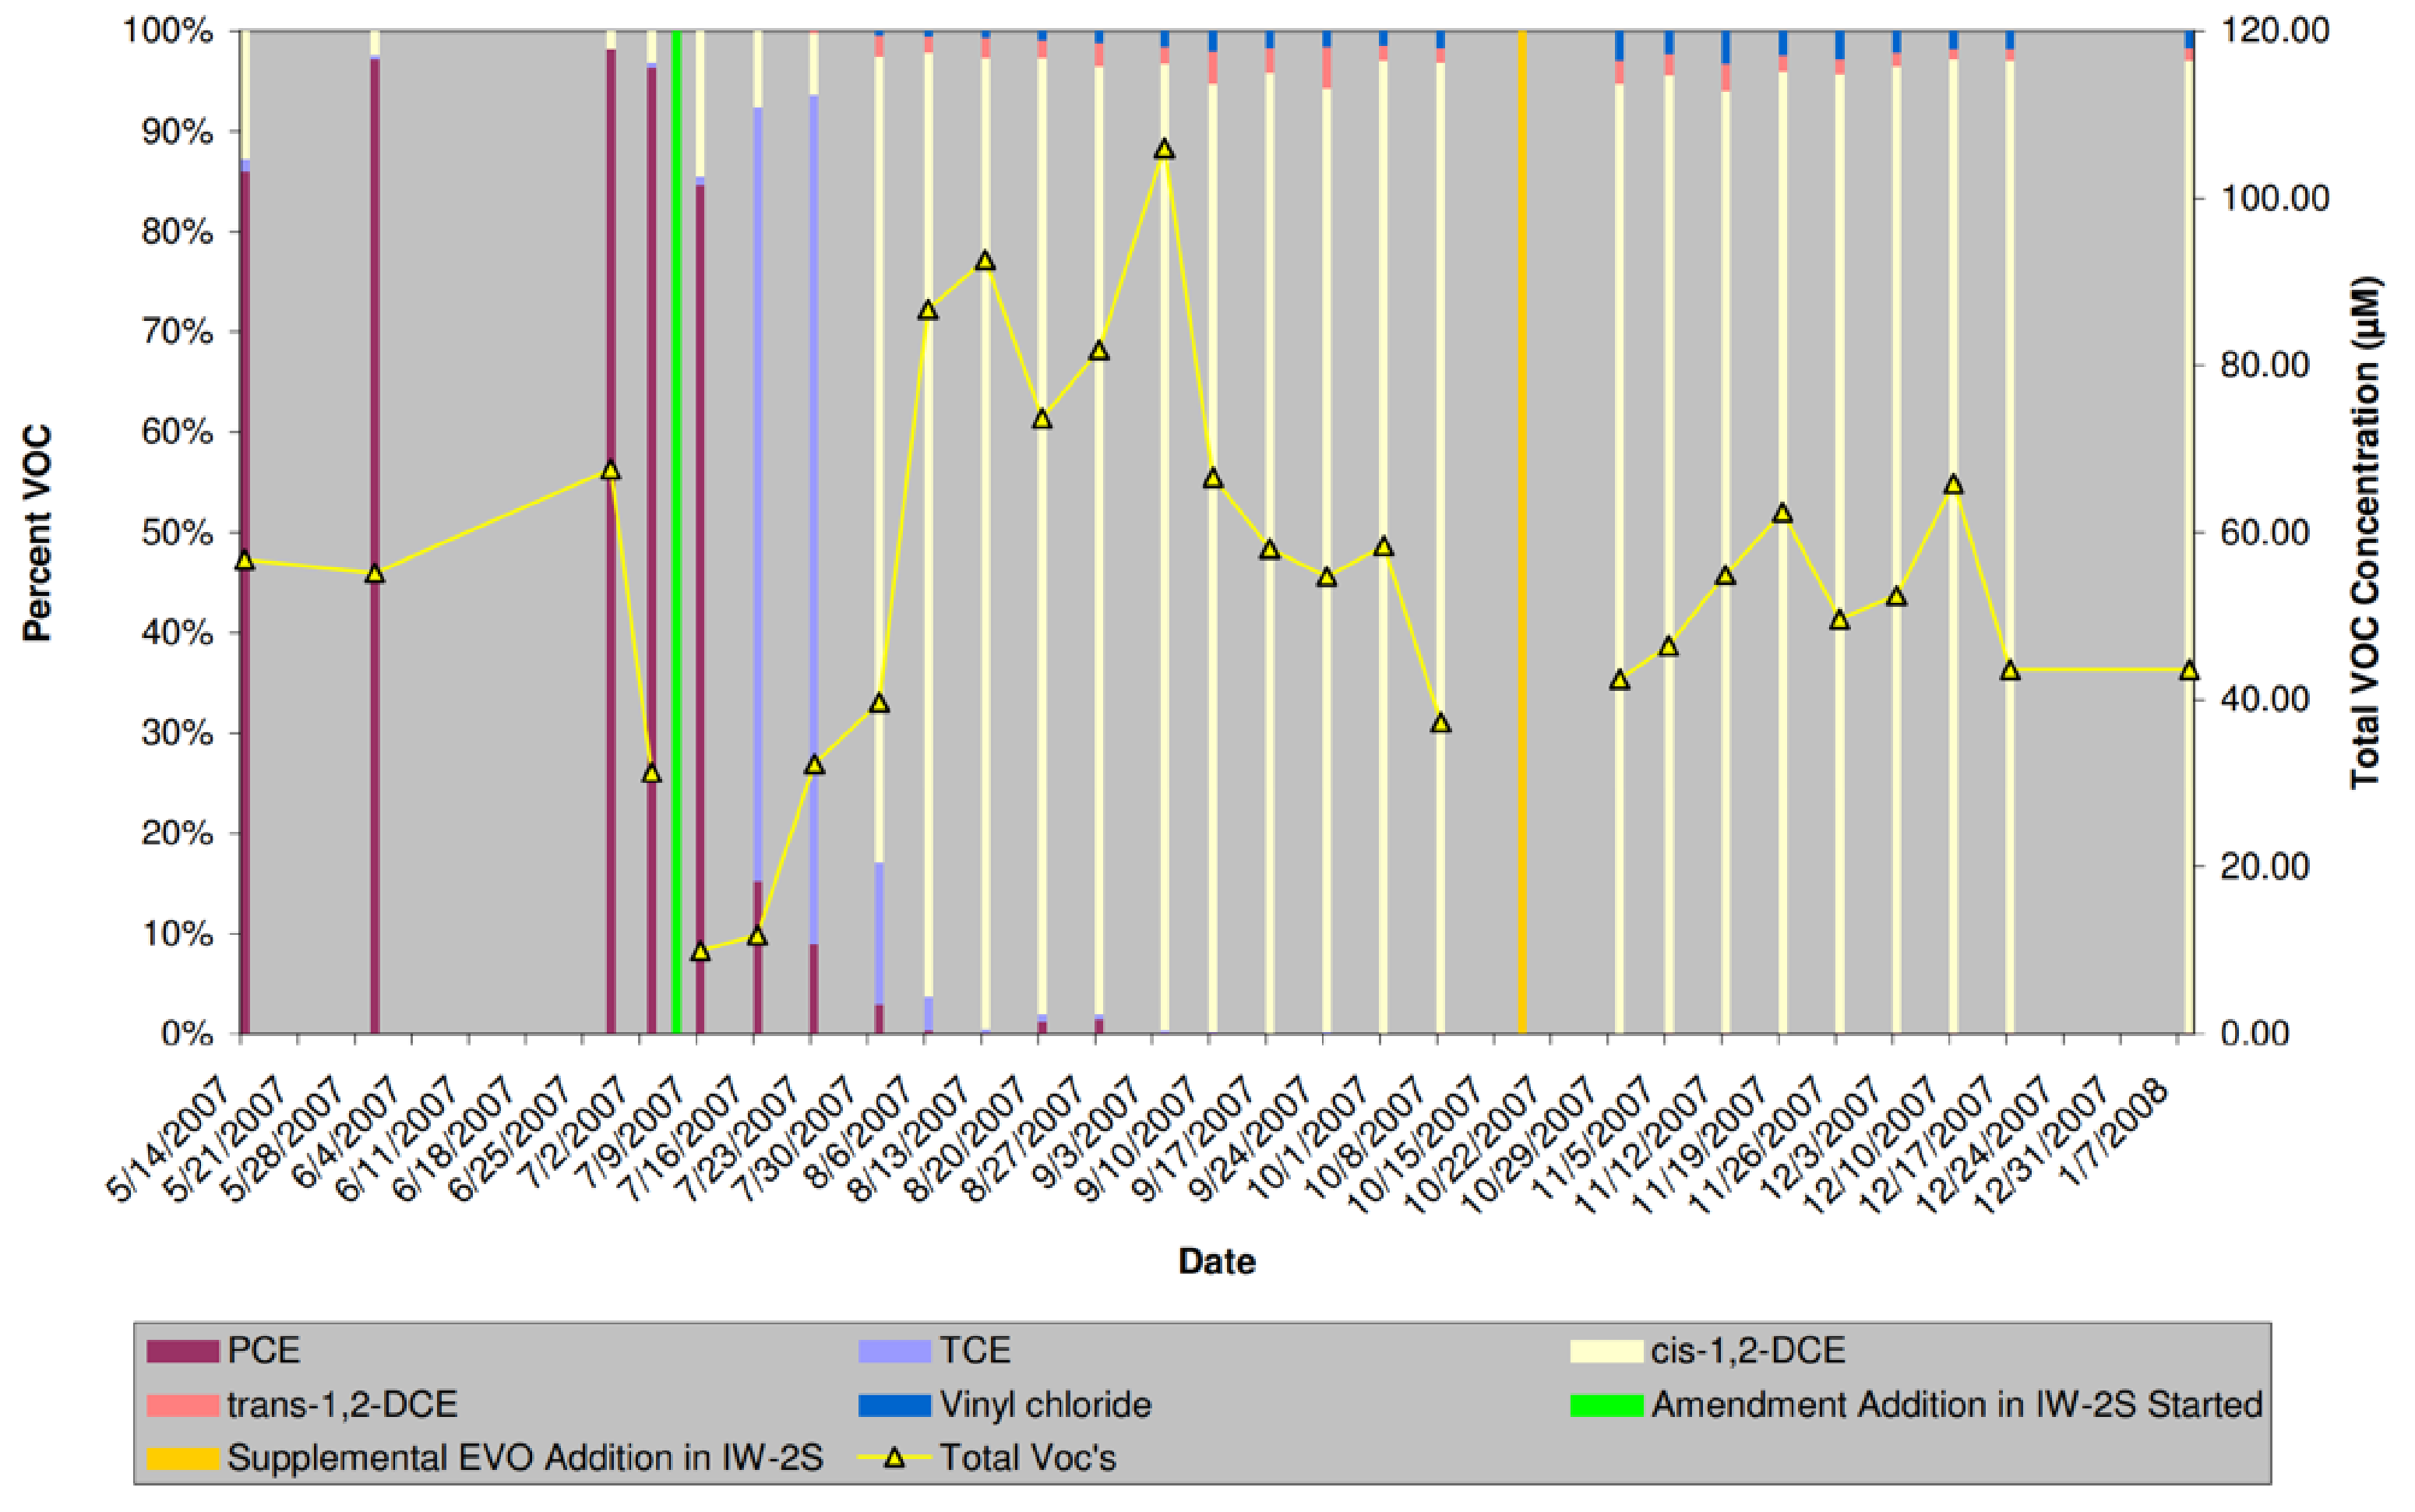
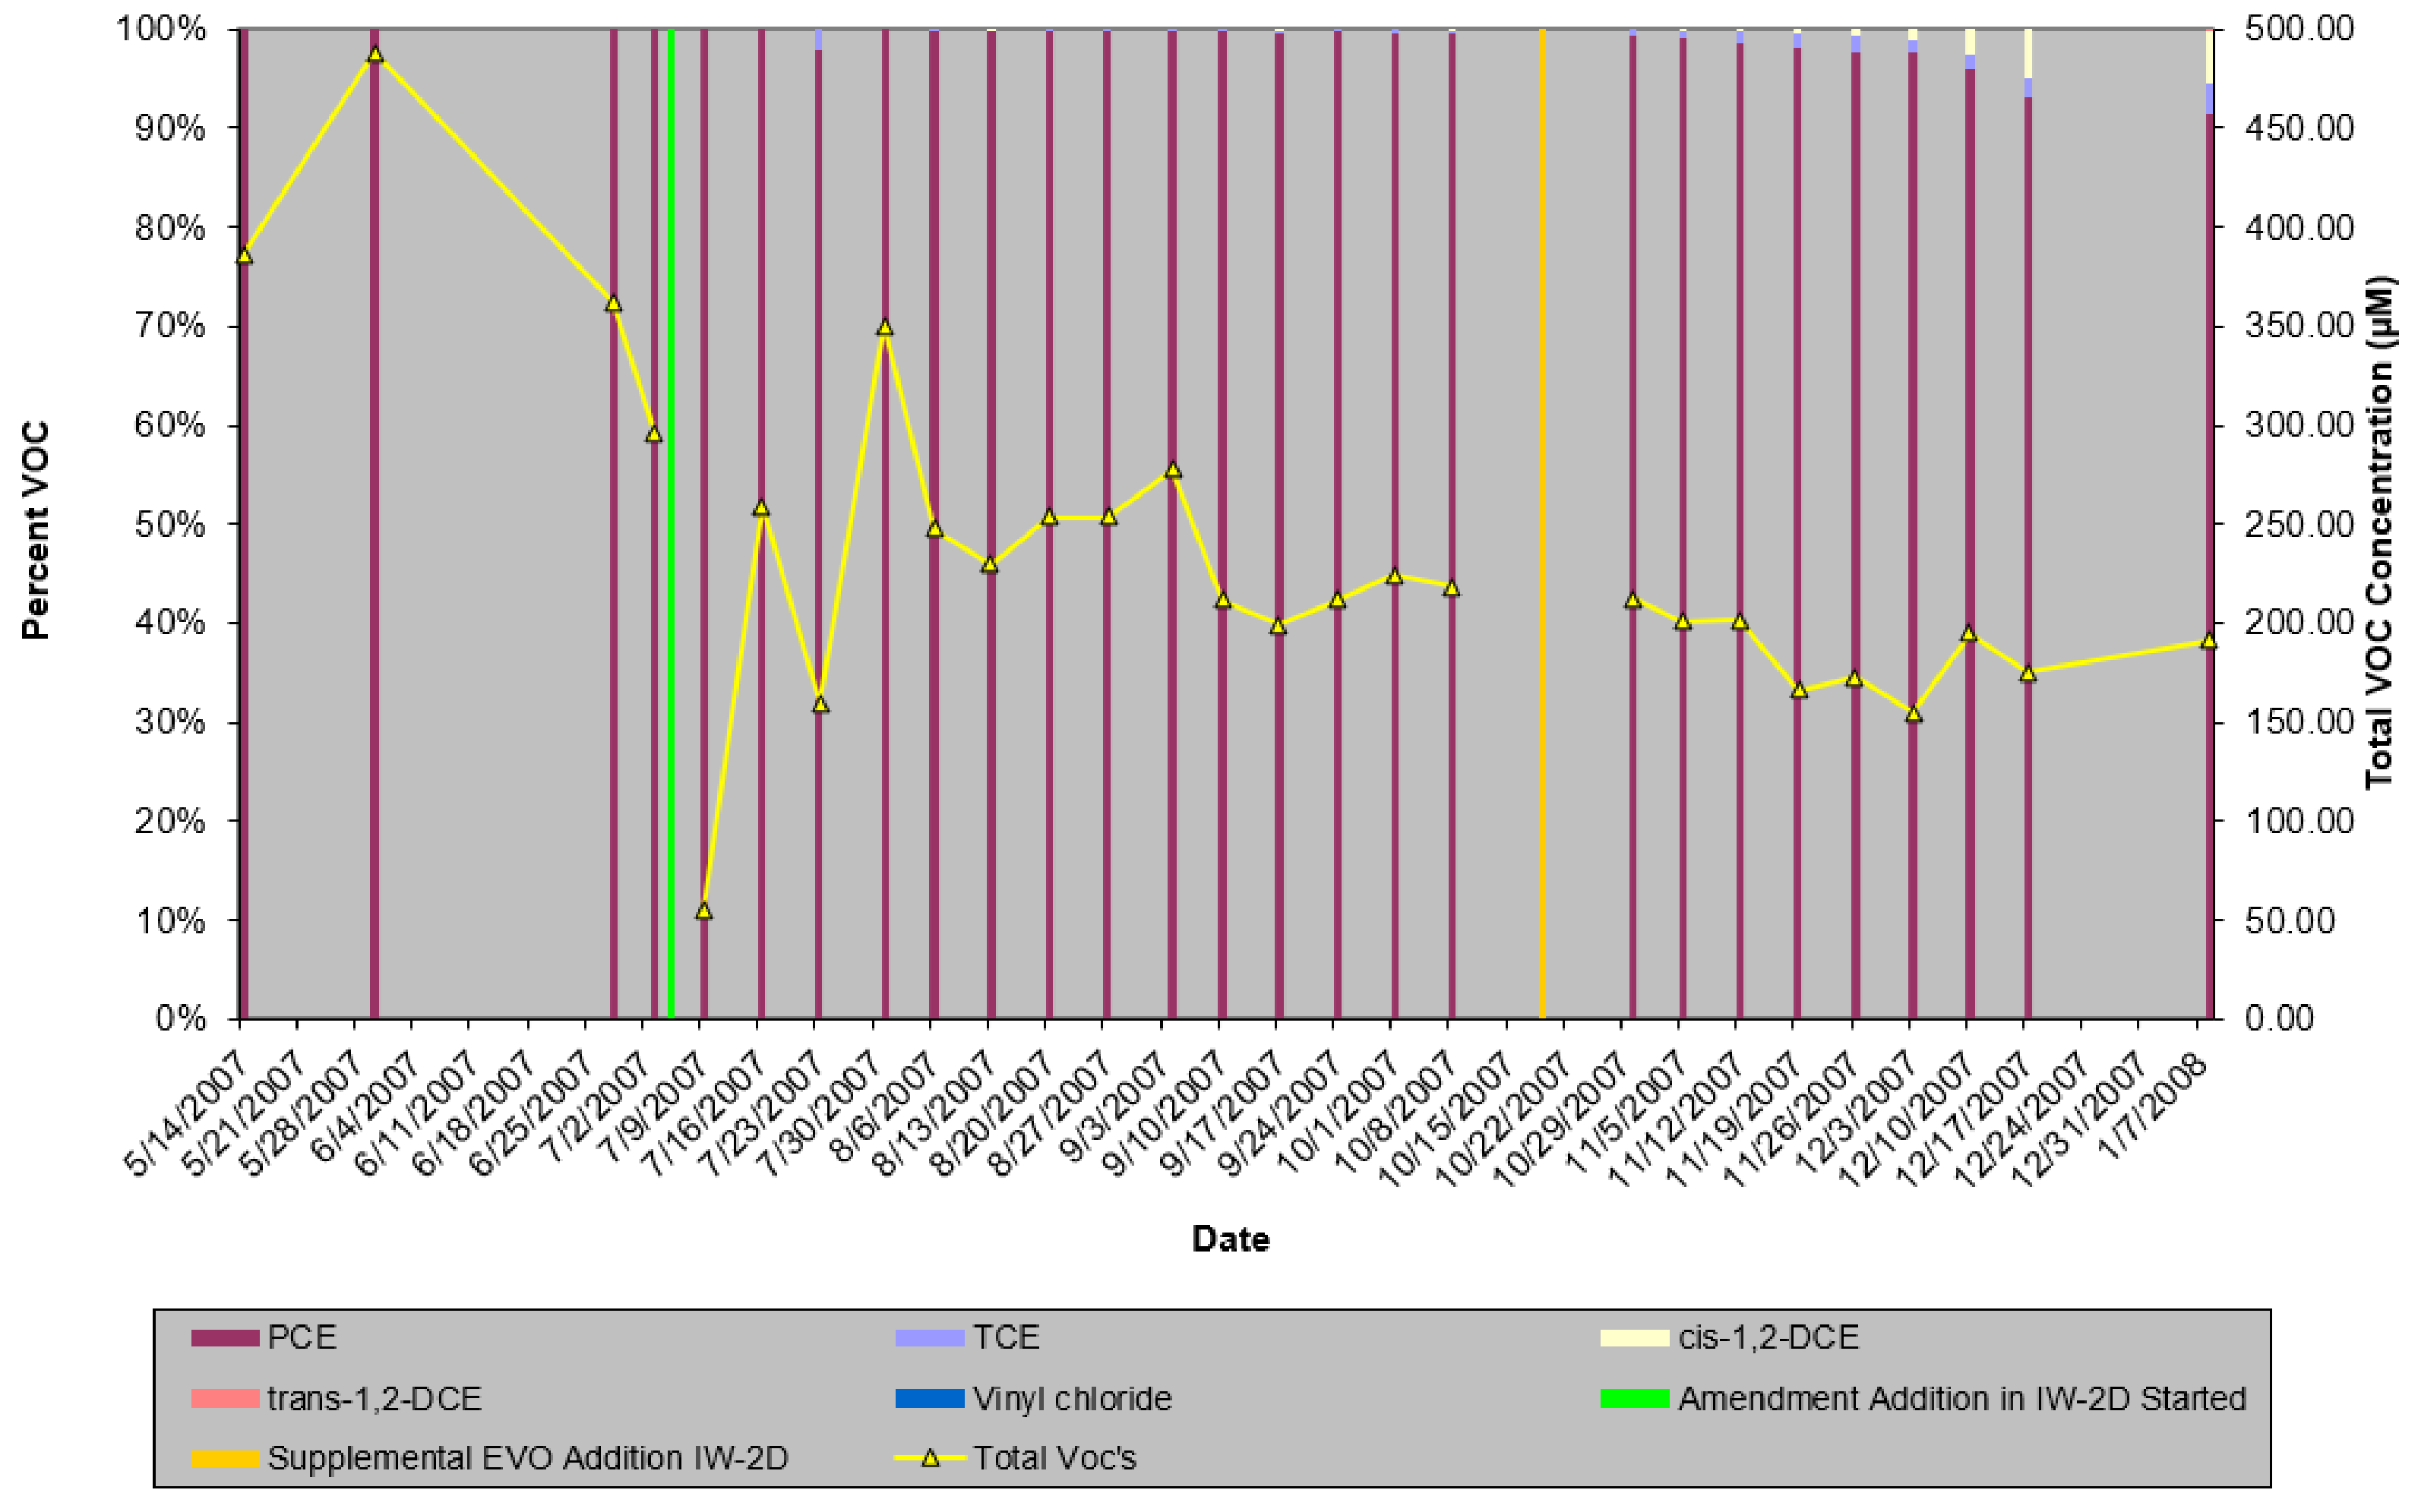
The subsections below provide details on the shallow and deep injection well and source-area monitoring well cVOC sampling and analyses results. Percent cVOC and total cVOC concentrations at EW-3, IW-3D, and SMW-3S and SMW-3D are summarized in Figure 8, Figure 9, Figure 10 and Figure 11, respectively.
IW-2S/EW-3 cVOC Results
A comparison of cVOC analyses prior to and following the addition of EVO shows that total cVOCs increased from a baseline of 52.73 μM to a peak of 106.03 μM detected on 4 September 2007, followed by a decrease to 43.60 μM by 8 January 2008. PCE concentrations steadily dropped from 8250 μg/L to 9.8 μg/L on 8 January 2008. TCE increased from a baseline average of 48.3 μg/L to a high of 3600 μg/L on 23 July 2007, and then steadily decreased to non-detectable (<2.0 μg/L) after 26 November 2007. Cis-DCE increased from 261 μg/L to a high of 9900 μg/L on 04 September 2007, and then decreased to 4100 μg/L by 8 January 2008. Trans DCE increased from non-detectable (<5.0 μg/L) to a peak of 150 μg/L detected on 21 November 2007, and concentrations fell to 48 μg/L as of 8 January 2008. Vinyl chloride was non-detectable (<5.0 μg/L) until 31 July 2007. A peak was detected at 110 μg/L on 12 November 2007, and concentrations decreased to 46 μg/L by 8 January 2008.
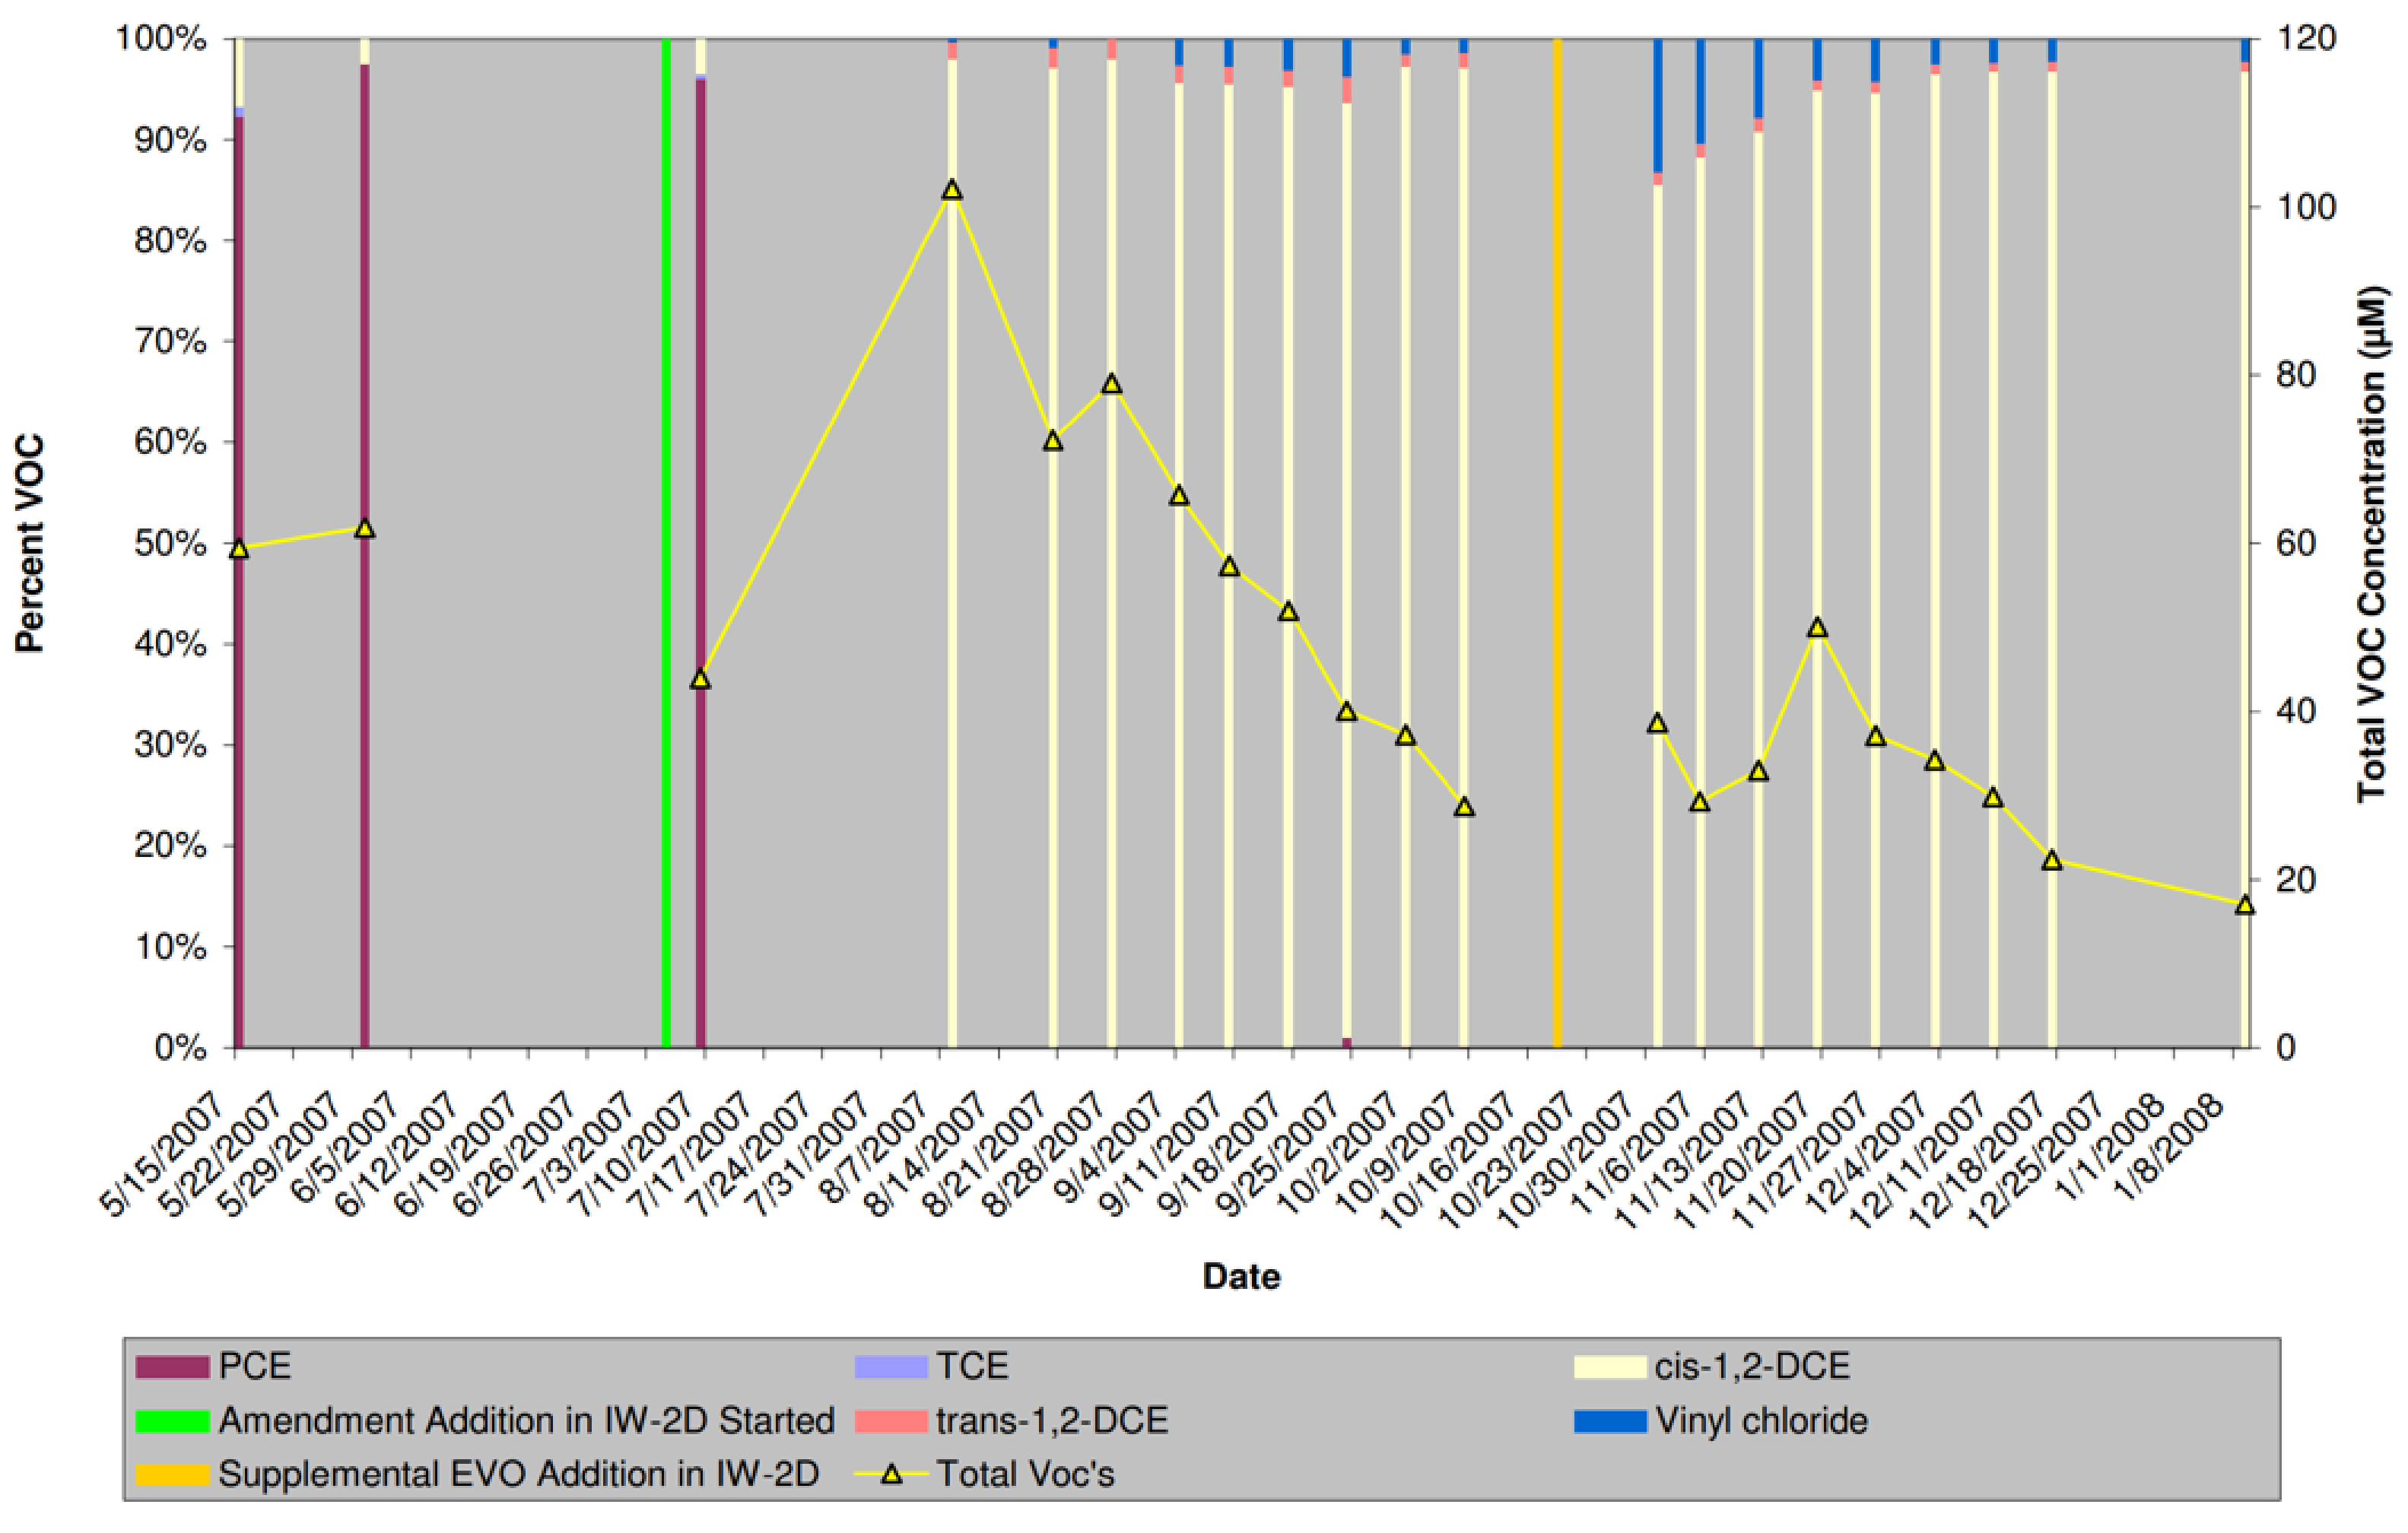
IW-2D/EW-3 cVOC Results
A comparison of cVOC analyses prior to and following the addition of EVO shows that total cVOCs decreased in SMW-3D from 383 μM to 191.5 μM by 8 January 2008. PCE concentrations steadily dropped from 63,500 μg/L to 29,000 μg/L by 8 January 2008. TCE concentrations, which were non-detectable (<20 μg/L) at baseline, increased to 94 μg/L prior to the supplemental EVO addition. Eventually, TCE reached a concentration of 800 μg/L by 8 January 2008. Cis- DCE was not detected from baseline until 30 October 2007. Levels increased to 1000 μg/L on 9 January 2008. Trans-DCE was first detected on 10 December 2007 at a concentration of 9.7 μg/L and reached 16 μg/L on 8 January 2008. Vinyl chloride is and has been non-detectable (<2.0 μg/L) since of 8 January 2008.
An analysis of samples collected from IW-3D showed that total VOCs decreased from a baseline 60.6 μM to 57.9 μM prior to the supplemental EVO injection, and then decreased to 17.1 μM on 9 January 2008. PCE concentrations steadily dropped from a baseline average of 9550 μg/L to being non-detectable (<2.0 μg/L) on 09 January 2008. TCE decreased from a baseline average of 45 μg/L to non-detectable (<2.0 μg/L) on 5 November 2007. Cis-DCE increased from 270 μg/L to a high of 9700 μg/L detected on 8 August 2007, then decreased to 1600 μg/L by 9 January 2008. Trans DCE concentrations increased from being non-detectable (<20 μg/L) to a peak of 160 μg/L detected on 27 October 2007, and then decreased to 18 μg/L on 09 January 2008. Vinyl chloride levels were non-detectable (<20 μg/L) until 8 August 2007, reached a peak of 320 μg/L on 31 October 2007, and then decreased to 24 μg/L on 9 January 2008.
Figure 8.
Comprehensive test cell data summary: EVO + hydrogen gas, EW-3% VOC, and total VOC concentration.
Figure 8.
Comprehensive test cell data summary: EVO + hydrogen gas, EW-3% VOC, and total VOC concentration.

Figure 9.
Comprehensive test cell data summary: EVO + hydrogen gas, IW-3D/IW-2D, IW-3D % VOC, and total VOC concentration.
Figure 9.
Comprehensive test cell data summary: EVO + hydrogen gas, IW-3D/IW-2D, IW-3D % VOC, and total VOC concentration.

Figure 10.
Comprehensive test cell data summary: EVO + hydrogen gas, SMW-3S% VOC, and total VOC concentration.
Figure 10.
Comprehensive test cell data summary: EVO + hydrogen gas, SMW-3S% VOC, and total VOC concentration.

Figure 11.
Comprehensive test cell data summary: EVO + hydrogen gas, SMW-3D% VOC, and total VOC concentration.
Figure 11.
Comprehensive test cell data summary: EVO + hydrogen gas, SMW-3D% VOC, and total VOC concentration.

3.3. Microbiological Analysis Results
MMM analysis results from each test cell are discussed below.
Dairy Whey Test Cell (HSE-6/HSI-8): An analysis of HSE-6 groundwater samples showed a 1.5X order-of-magnitude (OM) increase in total population and a 4.5XOM increase in sulfate-reducing bacteria (SRBs) following the dairy whey addition. A comparison of PLFA analysis results prior to and following whey addition also showed an OM increase in total biomass. The bacteria Dehalococcoides (DHC), an important genus known to completely reduce cVOCs to ethane [16,17,18,19], increased 6X from baseline to 11 July 2007 (4.6 cells/mL vs. 27.3 cells/mL). The DHC population returned to baseline levels by the conclusion of the pilot test. The gene for the vinyl chloride reduction enzyme (vinyl chloride reductase (VC-RDase) and the gene for the TCE reduction enzyme (TCE-RDase) were not detected in baseline samples but were detected in samples collected after the dairy whey addition.
EL Test Cell (HSE-11/HSI-14): Analysis HSE-11 groundwater samples showed a 1.5X OM increase in total population and a 6X OM increase in SRBs following the addition of EL. DHC population levels remained relatively unchanged in the EL test cell at less than ten cells per milliliter of groundwater. Additionally, an increased presence DHC was observed and VC-RDase was detectable after the addition of EL. A comparison of PLFA results prior to and following EL addition showed an order-of-magnitude increase in total biomass and an approximate 20% increase in Firmicutes (fermenting bacteria).
EVO Test Cell (HSE-14/HSI-19): Analysis of DNA extracted from HSE-14 groundwater samples showed a 1.5XOM increase in total population and a 6.5XOM increase in SRBs following the addition of EVO. The DHC population increased from non-detectable to approximately 100 cells per milliliter at the approximate midpoint of the test duration. By the end of the test the DHC population level dropped but remained detectable. Additionally, VC-RDase, which was not detected prior to EVO addition, was detected as part of the biorecirculation sampling. Comparison PLFA analysis results prior to and following EVO addition showed a 2XOM increase in total biomass, and an approximate 15% increase in Firmicutes.
Source Zone EVO + Hydrogen Gas Infusion Test Cell (EW-3/IW-2S and IW-2D): Analysis of microbial DNA extracted from EW-3 groundwater samples showed a 2XOM in total population and a 4.5XOM increase in SRBs. The most encouraging aspects of the microbiological analysis were the changes in DHC. During the last three months of sampling (November 2007 through January 2008), DHC levels were observed to steadily increase from a background concentration of between 0.164 cells/milliliter and 9.98 cells/milliliter to 235 cells/milliliter. Comparison of PFLA results prior to and following EVO and hydrogen gas addition showed a 2.5XOM increase in total biomass, and an approximate 3-fold increase in Firmicutes.
Summary: The microbial consortia in the shallow aquifer was shown to contain the microbes (e.g., DHC) and the genes necessary for complete reductive dechlorination. Furthermore, EVO increased and supported respiration of cVOCs better when compared with the dairy whey and EL. MMM results tracked changes in the microbial consortium correlated to reductive chlorination. Select groundwater samples from the site were subjected to shotgun metagenomic analysis. Results from baseline to five months after the start of full-scale remedial action have already been published [20]. The MMM results in the present study are supported by the metagenomic analyses. Results incorporating over five years of genomic data, including 16S amplicons, are now available (manuscript in preparation).
4. Discussion
The selection of the electron donor may be the most important parameter for complete and rapid reductive dichlorination of chlorinated solvent contamination in groundwater. Previous studies have indicated that molecular hydrogen (H2) plays a prominent role in the reductive dechlorination [13,21]. Complex donors (polylactates, vegetable oil, and dairy whey) supply the H2 as they are utilized by the subsurface microbial consortia.
Data from laboratory and field demonstrations of enhanced reductive dechlorination suggest that the rate and quantity of H2 made available to the microbial population must be carefully controlled to limit the competition for the H2 from microbial groups other than the dechlorinators [21,22]. These other competing microbial groups include methanogens and sulfate reducers. If too much H2 is available, the diversity of the consortia can shift and those organisms that are more efficient at utilizing the H2 than the dechlorinators can become prominent, resulting in inefficient utilization of the bio-amendments [21,23].
Trends in the contaminant concentration changes observed during the pilot testing were assessed using the U.S. EPA freeware package ProUCL 5.0 [24], which provides tools needed to statistically analyze environmental data. Specifically, the ProUCL 5.0 statistical test module was used to determine the confidence of trends in data. Specifically, the nonparametric trend test known as the Mann–Kendall (M-K) test was used with a 95% level of significance (LOC) for assessing the significance of trends in time-series datasets [25]. These trend analyses and other pertinent observations are discussed for each test cell in the subsections below.
4.1. Ethyl Lactate Test Cell (HSI-14/HSE-11)
A steady rate of reductive dechlorination of PCE to DCE was observed during the first half of the test. Trend analysis of the datasets support this conclusion in that the PCE and TCE concentrations over the first half of the test showed evidence of significant decline but no significant change during the second half. Vinyl chloride was not detected in any of the samples collected during the first half of the test. TOC showed evidence of a steady and significant decline, indicating that it was being utilized by the aquifer-borne microorganisms. TOC breakthrough and peak detection time matched well with the tracer test, suggesting that EL has a low adsorption to soil mass and high mobility in the aquifer.
EVO was added at the test duration midpoint. Immediately following total cVOC concentrations increased, likely a result of its desorption from the soil into the EVO. VC was detected in the test cell extraction well for the first time one month following the EVO addition.
4.2. EVO Test Cell (HSI-19/HSE-14)
Total cVOC levels peaked at approximately six weeks following the initial addition of EVO, likely again due to its desorption induced by the EVO. Following the peak, total cVOCs levels steadily dropped over the next month of the test at which point it remained relatively unchanged. M-K trend analyses of these portions of the dataset showed that during the month following the peak in PCE concentration there was evidence of a significant decline, followed by no significant changes in rate. VC was detected following the initial dose of EVO, indicating that complete ERD was occurring. TOC breakthrough and peak detection times did not match well with the conservative tracer test run in this test cell suggesting that EVO has high retention in the aquifer matrix and lower mobility in the groundwater.
Following the second dose of EVO, total dissolved chlorinated ethene concentrations again increased, including an initial peak in PCE and TCE. However, vinyl chloride also increased in the test cell extraction well, peaking about six weeks following the second EVO dose. Within approximately five weeks following EVO addition, PCE and TCE were below detection limits and total chlorinated ethene concentrations dropped from their peak. In addition, DCE and vinyl chloride concentrations dropped along with TOC levels. The results and findings stemming from the EVO test cell are similar to the successful approaches and studies contained in the protocol for in situ bioremediation of chlorinated solvents using edible oil [26].
Using the TOC levels detected at HSE-14 following its peak detections, substrate utilization rates were calculated throughout the test. Employing the Lineweaver–Burke Double Reciprocal Method, the inverses of these rates were plotted against the corresponding inverse of the midpoint substate concentrations to determine the half-saturation constant (Km) and the maximum utilization rate (Vmax) for this test cell. The Monod kinetics constants estimated were 153 mg/L and 8.7 mg/L per day for the Km and Vmax, respectively. These results were used to refine the electron donor dosing amounts and system recirculation periods as well as to define TOC monitoring targets for full scale operations.
4.3. Dairy Whey Test Cell (HSI-8/HSE-6)
A steady rate of reductive dechlorination of PCE to DCE was observed during the first four months of the test, after which levels remained relatively unchanged. VC was not detected in any of the samples collected between baseline and the midpoint of the test. Similar to the trend analyses performed at the EL and EVO test cells, the declines in PCE and TCE concentrations were statistically significant. Additionally, TOC was observed to steadily increase over the first seven weeks of the test, after which it steadily dropped. TOC breakthrough and peak detection times did not match well with the conservative tracer test run in this test cell suggesting that like EVO, dairy whey is retained in the aquifer matrix and its mobility is limited; however, it appeared to have less retention and greater mobility compared with EVO. The results observed in the dairy whey test cell were similar to those observed by others [27].
As a result of the EVO addition at the midpoint of the test, total dissolved chlorinated ethene concentrations increased, and vinyl chloride was detected in the test cell. Within approximately five weeks following this midpoint EVO addition, PCE and TCE levels were below detection limits and total cVOC levels, including DCE, dropped.
4.4. Source Zone Test Cell (EVO + Hydrogen Gas Infusion)
Results from samples collected at four wells (the extraction and injection wells EW-3 and IW-3D and two monitoring wells located in-between the injection and extraction wells, SMW-3S and SMW-3D) were used to assess the expected performance of full-scale enhanced bioremediation at the source zone. The extraction well used for recirculation at the source zone was EW-3. Approximately 0.9 m (3 feet) from EW-3 and in line with nested injection well IW-3S/D is the nested monitoring well SMW-3S/D. The shallow monitoring well SMW-3S was screened in the higher permeability material in the upper portion of the shallow aquifer at between approximately 1.5 m and 5.5 m (5 feet and 18 feet) bgs. The deep monitoring well SMW-3D was screened in the deeper low-permeability unit between approximately 6.1 m and 7.6 m (20 feet and 25 feet) bgs. Injection well IW-3D, which is located approximately 3.1 m (10 feet) southeast of the nested injection well IW-2S/D and 5.2 m (17 feet) north-northeast of extraction well EW-3, was screened in the low-permeability unit (similar to SMW-3D) and was used as an additional monitoring point. Monitoring at each of these sites is discussed below.
EW-3 Test Cell Extraction Well: After their initial increase, cVOC levels declined over the month before the midpoint EVO addition. During this period a steady rate of reductive dechlorination of PCE to DCE was observed, including the production of vinyl chloride. A trend analysis of PCE and TCE time-series datasets from the EW-3 samples showed evidence of significant decline during this month-long period. The trends in TOC levels at EW-3 matched approximately what was observed at the EVO Test Cell extraction well HSE-14.
SMW-3S Shallow Monitoring Well: The trends observed at SMW-3S closely resemble those observed from analysis of results from samples collected from EW-3. An M-K trend analysis of the time-series dataset showed evidence of significant decline in PCE and TCE as a result of enhanced reductive dichlorination.
IW-3D Test Cell Injection Well: Similar to the EW-3 observations, total cVOC levels steadily declined up to the second dose of EVO after they peaked following the initial injection of EVO. During this month-long period a steady and rapid rate of reductive dechlorination of PCE to DCE, including the production of vinyl chloride, was observed. The M-K trend analyses of the time-series datasets of the total cVOC, PCE, and TCE concentrations showed evidence of a statistically significant decline. Prior to the second dose of EVO, vinyl chloride production peaked and began to drop. The trend in VC levels matched the peak and drop in TOC levels. As a result of the second dose of EVO, total dissolved chlorinated VOC concentrations slightly increased before steadily decreasing. The concentrations of DCE and VC tracked the rise and fall of TOC concentration. By the end of test, PCE and TCE were not detectable.
SMW-3D Deep Monitoring Well: Unlike the results from the shallow monitoring well SMW-3S and the test cell extraction well EW-3, the M-K trend analysis of the time-series datasets showed no evidence of a significant change in total cVOC concentrations or its components (PCE/TCE/DCE) at SMW-3D prior to the administration of the second dose of EVO. The majority (>99%) of the cVOC mass remained as PCE and the total concentration remained relatively unchanged compared with baseline sampling results. After the additional dose of EVO, changes in the distribution of chlorinated ethenes began to appear and TOC levels began to increase slightly. At the end of the test the majority (>91%) of the cVOC mass at SMW-3D remained as PCE. VC was not detected, and TOC levels, although above background levels, were low at approximately 5 mg/L.
Summary: Recent studies have shown that DNAPL source longevity may be reduced by as much as an order of magnitude (e.g., from hundreds of years to decades) by ERD [28,29]. The pilot test results suggest that similar treatment success could be achieved in the source area by ERD. Additionally, moving EVO into the lower portion of the shallow aquifer is difficult due to its low permeability from the greater fractions of silt and clay in the aquifer matrix. However, since IW-3D is constructed like SMW-3D, it can be said that once EVO substrate is distributed in the tighter, deeper portion of the shallow aquifer source zone, complete ERD should in this zone will occur. Careful and frequent addition of substrate to this region of the shallow aquifer will be key in successfully remediating the source zone.
5. Conclusions
Based on the findings through the field pilot test, EVO along with a yeast-extract based nutrient mixture was selected as the bio-amendment of choice for treatment of the affected aquifer. TOC and cVOC monitoring can be used to track progression and assess the need for additional substrate dosing. Electron acceptor and general water quality analyses can be performed on a less frequent (e.g., yearly) basis. Using the existing infrastructure and because of the limited costs, hydrogen gas infusion should continue at the source area during full scale treatment. As the source zone area treatment progresses, recirculation of the treated source zone groundwater with the other portions of the system may be beneficial due to the diversity of the source area consortia as it relates to halogenated hydrocarbon degraders. A periodic (yearly) check for those organisms that respire cVOCs completely (e.g., Dehalococcoides) will assist in determining potentially recalcitrant areas of the ERD remediation system.
Author Contributions
Conceptualization, P.G., A.B. and R.A.R.; methodology, P.G., A.B., R.A.R. and J.M.; software, P.G.; validation, P.G., A.B., R.A.R. and J.M.; formal analysis, P.G. and A.B.; investigation, P.G. and A.B.; resources, P.G., A.B., R.A.R. and J.M.; data curation, P.G. and A.B.; writing—original draft preparation, P.G. and A.B.; writing—review and editing, R.A.R. and J.M.; visualization, P.G. and A.B.; supervision, R.A.R. and J.M.; project administration, P.G. and A.B. All authors have read and agreed to the published version of the manuscript.
Funding
The project was funded by US EPA Superfund Program: North Railroad Avenue Plume (USEPA ID: NMD986670156): https://cumulis.epa.gov/supercpad/cursites/csitinfo.cfm?id=0604299.
Institutional Review Board Statement
Not applicable.
Informed Consent Statement
Not applicable.
Data Availability Statement
Data presented in this paper can be obtained from the New Mexico Environment Department by public records request (https://www.env.nm.gov/public-record-request/). Requestor should cite the North Railroad Avenue Plume project, data presented contained in the Field Test Plan Results Report, North Railroad Avenue Plume Superfund Site dated 25 February 2008.
Conflicts of Interest
The authors declare no conflict of interest.
Appendix A
Figure A1.
Heat map of bio-amendment addition (TOC) and dissolved chlorinated hydrocarbon during and following the pilot test.
Figure A1.
Heat map of bio-amendment addition (TOC) and dissolved chlorinated hydrocarbon during and following the pilot test.

References
- Duke Engineering & Services. Remedial Investigation Report, North Railroad Avenue Plume Superfund Site; NPL #NMD986670156; New Mexico Environmental Department Superfund Oversight Section Archive: Española, NM, USA, 2001. [Google Scholar]
- Duke Engineering & Services. Feasibility Study Report, North Railroad Avenue Plume Superfund Site; NPL #NMD986670156; New Mexico Environmental Department Superfund Oversight Section Archive: Española, NM, USA, 2001. [Google Scholar]
- INTERA Incorporated. Final Design Report, North Railroad Avenue Plume; New Mexico Environmental Department Superfund Oversight Section Archive: Española, NM, USA, 2002. [Google Scholar]
- AMEC Earth & Environmental. Final Revised Field Test Plan Hot-Spot Bioremediation System North Railroad Avenue Plume Superfund Site; NPL# NMED986670156; New Mexico Environmental Department Superfund Oversight Section Archive: Española, NM, USA, 2006. [Google Scholar]
- John, C. Fry, Direct Method and Biomass Estimation. In Method in Microbiology; Elsevier Science: Amsterdam, The Netherlands, 1990; Volume 22, pp. 41–85. Available online: https://0-www-sciencedirect-com.brum.beds.ac.uk/science/article/abs/pii/S0580951708702393#aep-abstract-id7 (accessed on 8 October 2021).
- Peacock, A.D.; White, D.C. Hydrocarbon and Lipid Microbiology Protocols; Microbial Biomass and Community Composition Analysis Using Phospholipid Fatty Acids; Springer: Berlin, Germany, 2016; pp. 65–76. Available online: https://0-link-springer-com.brum.beds.ac.uk/protocol/10.1007%2F8623_2016_213 (accessed on 8 October 2021).
- Muyzer, G.; de Waal, E.C.; Uitterlinden, A.G. Profiling of complex microbial populations by denaturing gradient gel electrophoresis analysis of polymerase chain reaction-amplified genes coding for 16S rRNA. Appl. Environ. Microbiol. 1993, 59, 695–700. [Google Scholar] [CrossRef] [PubMed] [Green Version]
- Löffler, F.E.; Sun, Q.; Li, J.; Tiedje, J.M. 16S rRNA gene-based detection of tetrachloroethene-dechlorinating Desulfuromonas and Dehalococcoides species. Appl. Environ. Microbiol. 2000, 66, 1369–1374. [Google Scholar] [CrossRef] [PubMed] [Green Version]
- Jugder, B.E.; Ertan, H.; Bohl, S.; Lee, M.; Marquis, C.P.; Manefield, M. Marquis and Michael Manefield Organohalide Respiring Bacteria and Reductive Dehalogenases: Key Tools in Organohalide Bioremediation. Front. Microbiol. 2016, 7, 249. [Google Scholar] [CrossRef] [PubMed]
- Chiang, S.Y.D.; Mora, R.; Diguiseppi, W.H.; Davis, G.; Sublette, K.; Gedalanga, P.; Mahendra, S. Characterizing the intrinsic bioremediation potential of 1,4-dioxane and trichloroethene using innovative environmental diagnostic tools. J. Environ. Monit. 2012, 14, 2317–2326. [Google Scholar] [CrossRef] [PubMed]
- Anantharaman, K.; Brown, C.T.; Hug, L.A.; Sharon, I.; Castelle, C.J.; Probst, A.J.; Thomas, B.C.; Singh, A.; Wilkins, M.J.; Karaoz, U.; et al. Banfield Thousands of microbial genomes shed light on interconnected biogeochemical processes in an aquifer system. Nat. Commun. 2016, 7, 13219. [Google Scholar] [CrossRef] [PubMed]
- Zinder, S.H.; Gossett, J.M. Reductive Dechlorination of Tetrachloroethene by a High Rate Anaerobic Microbial Consortium. Environ. Health Perspect. 1995, 103 (Suppl. 5), 5–7. [Google Scholar] [PubMed]
- Persons Corporations, Principles and Practices of Enhanced Anaerobic Bioremediation of Chlorinated Solvents Prepared for Air Force Center for Civil Engineer Center, Naval Facilities Engineering Command and Environmental Security Technology Certification Program. 2004. Available online: https://frtr.gov/matrix/documents/Enhanced-In-Situ-Reductive-Dechlorinated-for-Groundwater/2004-Principles-and-Practices-of-Enhanced-Anaerobic-Bioremediation-of-Chlorinated-Solvents.pdf (accessed on 19 October 2021).
- United States Environmental Protection Agency. Method 8260 (SW-846): Volatile Organic Compounds by Gas Chromatography/Mass Spectrometry (GC/MS), Revision 3; United States Environmental Protection Agency: Washington, DC, USA, 2006. [Google Scholar]
- United States Environmental Protection Agency. Method 9060A (SW-846): Total Organic Carbon by Carbonaceous Analyzer, Revision 2; United States Environmental Protection Agency: Washington, DC, USA, 2004. [Google Scholar]
- Scheutz, C.; Durant, N.D.; Dennis, P.; Hansen, M.H.; Jørgensen, T.; Jakobsen, R.; Cox, E.E.; Bjerg, P.L. Concurrent ethene generation and growth of Dehalococcoides containing vinyl chloride reductive dehalogenase genes during an enhanced reductive dechlorination field demonstration. Environ. Sci. Technol. 2008, 42, 9302–9309. [Google Scholar] [CrossRef] [PubMed]
- van der Zaan, B.; Hannes, F.; Hoekstra, N.; Rijnaarts, H.; de Vos, W.M.; Smidt, H.; Gerritse, J. Correlation of Dehalococcoides 16S rRNA and chloroethene-reductive dehalogenase genes with geochemical conditions in chloroethene-contaminated groundwater. Appl. Environ. Microbiol. 2010, 76, 843–850. [Google Scholar] [CrossRef] [PubMed] [Green Version]
- Clark, K.; Taggart, D.M.; Baldwin, B.R.; Ritalahti, K.M.; Murdoch, R.W.; Hatt, J.K.; Löffler, F.E. Normalized Quantitative PCR Measurements as Predictors for Ethene Formation at Sites Impacted with Chlorinated Ethenes. Environ. Sci. Technol. 2018, 52, 13410–13420. [Google Scholar] [CrossRef] [PubMed]
- Åkesson, S.; Sparrenbom, C.J.; Paul, C.J.; Jansson, R.; Holmstrand, H. Characterizing natural degradation of tetrachloroethene (PCE) using a multidisciplinary approach. Ambio 2021, 55, 1074–1088. [Google Scholar] [CrossRef] [PubMed]
- Reiss, R.A.; Guerra, P.; Makhnin, O. Metagenome phylogenetic profiling of microbial community evolution in a tetrachloroethene-contaminated aquifer responding to enhanced reductive dechlorination protocols. Stand. Genom. Sci. 2016, 11, 88. [Google Scholar] [CrossRef] [PubMed] [Green Version]
- Yang, Y.; McCarty, P.L. Competition for Hydrogen within a Chlorinated Solvent Dehalogenating Anaerobic Mixed Culture. Environ. Sci. Technol. 1998, 32, 3591–3597. [Google Scholar] [CrossRef]
- Koenigsberg, S.S.; Sandefur, C.A. The Use of Hydrogen Release Compound for the Accelerated Bioremediation of Anaerobically Degradable Contaminants: The Advent of the Time-Release Electron Donors. Remediation 1999, 10, 31–53. [Google Scholar] [CrossRef]
- Fennell, D.E.; Gossett, J.M.; Zinder, S.H. Comparison of Butyric Acid, Ethanol, Lactic Acid, and Propionic Acid as Hydrogen Donors for the Reductive Dechlorination of Tetrachloroethene. Environ. Sci. Technol. 1997, 31, 918–926. [Google Scholar] [CrossRef]
- United States Environmental Protection Agency. ProUCL Version 5.0.00 Technical Guide, Statistical Software for Environmental Data Sets with and without Nondetect Observations; United States Environmental Protection Agency: Washington, DC, USA, 2013. [Google Scholar]
- Hollander, M.; Wolfe, D.A. Nonparametric Statistical Methods, 2nd ed.; John Wiley & Sons: New York, NY, USA, 1999. [Google Scholar]
- Solutions IES, Inc.; Terra Systems, Inc. (TSI); Parsons Infrastructure & Technology Group, Inc. Final Protocol for In Situ Bioremediation of Chlorinated Solvents Using Edible Oil for United State Air Force Center for Engineering and the Environmental. 2007. Available online: https://clu-in.org/download/remed/Final-Edible-Oil-Protocol-October-2007.pdf (accessed on 19 October 2021).
- Tarnawski, S.-E.; Rossi, P.; Brennerova, M.V.; Stavelova, M.; Holliger, C. Validationofan Integrative Methodology to Assess and Monitor Reductive Dechlorination of Chlorinated Ethenes in Contaminated Aquifers. Front. Environ. Sci. 2016, 4, 7. [Google Scholar] [CrossRef] [Green Version]
- Christ, J.A.; Ramsburg, C.A.; Abriola, L.M.; Pennell, K.D.; Löffler, F.E. Coupling Aggressive Mass Removal with Microbial Reductive Dechlorination for Remediation of DNAPL Source Zones: A Review and Assessment. Environ. Health Perspect. 2005, 113, 465–477. [Google Scholar] [CrossRef] [PubMed] [Green Version]
- Durant, N.; Smith, L.; Condit, W. Technical Memorandum: Design Considerations for Enhanced Reductive Dechlorination Prepared for Naval Facilities Engineering Command. 2015. Available online: https://www.navfac.navy.mil/content/dam/navfac/Specialty%20Centers/Engineering%20and%20Expeditionary%20Warfare%20Center/Environmental/Restoration/er_pdfs/d/navfacexwc-ev-tm-1501-erd-design-201503f.pdf (accessed on 19 October 2021).
Figure 1.
North Railroad Avenue Plume Superfund Site. Approximate groundwater plumes prior to remediation and the groundwater flow directions in the shallow aquifer (red plume with red arrow) and deep aquifer (blue plume and blue arrow) are shown. The location of the source of contamination, a former dry cleaner/laundromat business, is also shown.

Figure 2.
Pilot test cell well pairs. The substrate formulations added to each test cell at the beginning and midpoint of the pilot testing are shown.
Figure 2.
Pilot test cell well pairs. The substrate formulations added to each test cell at the beginning and midpoint of the pilot testing are shown.

Figure 3.
Cross-section of a typical test cell. Induced flow between the injection and extraction wells is shown.
Figure 3.
Cross-section of a typical test cell. Induced flow between the injection and extraction wells is shown.

Figure 4.
Field test plan procedure flow chart.

Figure 5.
Comprehensive test cell data summary: Ethyl lactate/EVO, HSE-11/HSI-14, HSE-11% VOC, and total VOC concentration.
Figure 5.
Comprehensive test cell data summary: Ethyl lactate/EVO, HSE-11/HSI-14, HSE-11% VOC, and total VOC concentration.

Figure 6.
Comprehensive test cell data summary: EVO, HSE-14/HSI-19, HSE-14% VOC, and total VOC concentration.
Figure 6.
Comprehensive test cell data summary: EVO, HSE-14/HSI-19, HSE-14% VOC, and total VOC concentration.

Figure 7.
Comprehensive test cell data summary: Whey/EVO, HSE-6/HSI-8, HSE-6% VOC, and total VOC concentration.
Figure 7.
Comprehensive test cell data summary: Whey/EVO, HSE-6/HSI-8, HSE-6% VOC, and total VOC concentration.


Table 1.
Summary of electron donor addition, sampling analysis, and method details by test cell.
| Test Cell Name | Ethyl Lactate Test | EVO Test | Dairy Whey Test | Source Zone Test |
|---|---|---|---|---|
| Well Pair | HIS-14/HSE-11 | HIS-19/HSE-14 | HIS-8/HSE-6 | IW-2S/IW-2D/EW-3 |
| Target Zone | Hot Spot | Hot Spot | Hot Spot | Source Zone |
| Electron Donor | Ethyl Lactate | EVO | Dairy Whey | EVO |
| Date | 6/12/2007 | 6/12/2007 | 6/20/2007 | 7/5/2007@IW-2D 7/6/2007@IW-2S |
| Amount | 1457.38 L (385 gal) | 1381.68 L (365 gal) | 997.90 kg (2200 lb) | 1249.19 L (330 gal) |
| Nutrient Mix | 246.05 L (65 gal) | 283.91 L (75 gal) | 283.91 L (75 gal) | 227.13 L (60 gal) |
| Rate | 2.68 lpm (4.7 gpm) | 15.14 lpm (4 gpm) | 9.46 lpm (2.5 gpm) | |
| Recirculation Time | 2 weeks | 5 month | 15 days | 81 days |
| Supplement EVO | YES | YES | YES | YES |
| Date | 10/12/2007 | 10/11/2007 | 10/15/2007 | 10/18/2007 |
| Amount | 946.35 L (250 gal) | 946.35 L (250 gal) | 946.35 L (250 gal) | 832.79 L (220 gal) |
| Injection Period | 6 h | 6 h | 6 h | 5 h |
| Nutrient Mix | 227.13 L (60 gal) | 227.13 L (60 gal) | 227.13 L (60 gal) | 227.13 L (60 gal) |
| Injection Period | 2 h | 2 h | 2 h | 2 h |
| Sampled Well | HSE-11 | HSE-14 | HSE-6 | EW-3 |
| VOC Analysis Performed and Methods | cVOC, EPA 8260 | cVOC, EPA 8260 | cVOC, EPA 8260 | cVOC, EPA 8260 |
| TOC, EPA 9060 | TOC, EPA 9060 | TOC, EPA 9060 | TOC, EPA 9060 | |
| # of VOC Samples | 32 | 32 | 32 | 27 |
| MMM Analysis Performed and Methods | Total Biomass | Total Biomass, PLFA | Total Biomass, PLFA | Total Biomass, PLFA |
| Taxomonic ID with PLFA | Taxomonic ID with PLFA | Taxomonic ID with PLFA | Taxomonic ID with PLFA | |
| SRBs, CENSUS(qPCR) | SRBs, CENSUS(qPCR) | SRBs, CENSUS(qPCR) | SRBs, CENSUS(qPCR) | |
| DHC, CENSUS (qPCR) | DHC, CENSUS (qPCR) | DHC, CENSUS (qPCR) | DHC, CENSUS (qPCR) | |
| Functional Genes CENSUS (qPCR) | Functional Genes CENSUS (qPCR) | Functional Genes CENSUS (qPCR) | Functional Genes CENSUS (qPCR) | |
| # of MMM Samples | 6 | 6 | 6 | 6 |
| Analytical Result | Figure 5 | Figure 6 | Figure 7 | Figures 8–11 |
Publisher’s Note: MDPI stays neutral with regard to jurisdictional claims in published maps and institutional affiliations. |
© 2021 by the authors. Licensee MDPI, Basel, Switzerland. This article is an open access article distributed under the terms and conditions of the Creative Commons Attribution (CC BY) license (https://creativecommons.org/licenses/by/4.0/).
Share and Cite
MDPI and ACS Style
Guerra, P.; Bauer, A.; Reiss, R.A.; McCord, J. In Situ Bioremediation of a Chlorinated Hydrocarbon Plume: A Superfund Site Field Pilot Test. Appl. Sci. 2021, 11, 10005. https://0-doi-org.brum.beds.ac.uk/10.3390/app112110005
AMA Style
Guerra P, Bauer A, Reiss RA, McCord J. In Situ Bioremediation of a Chlorinated Hydrocarbon Plume: A Superfund Site Field Pilot Test. Applied Sciences. 2021; 11(21):10005. https://0-doi-org.brum.beds.ac.uk/10.3390/app112110005
Chicago/Turabian StyleGuerra, Peter, Akemi Bauer, Rebecca A. Reiss, and Jim McCord. 2021. "In Situ Bioremediation of a Chlorinated Hydrocarbon Plume: A Superfund Site Field Pilot Test" Applied Sciences 11, no. 21: 10005. https://0-doi-org.brum.beds.ac.uk/10.3390/app112110005
Note that from the first issue of 2016, this journal uses article numbers instead of page numbers. See further details here.