Article

Hospital Site Suitability Assessment Using Three Machine Learning Approaches: Evidence from the Gaza Strip in Palestine

by
Khaled Yousef Almansi
1,2,*,
Abdul Rashid Mohamed Shariff
2,3,
Ahmad Fikri Abdullah
2,3 and
Sharifah Norkhadijah Syed Ismail
4
1
Department of Civil Engineering, Faculty of Engineering, Universiti Putra Malaysia (UPM), Serdang 43400, Malaysia
2
GISRC Research Group, Universiti Putra Malaysia, Serdang 43400, Malaysia
3
Department of Biological and Agricultural Engineering, Faculty of Engineering, Universiti Putra Malaysia (UPM), Serdang 43400, Malaysia
4
Department of Environmental and Occupational Health, Faculty of Medicine and Health Sciences, Universiti Putra Malaysia (UPM), Serdang 43400, Malaysia
*
Author to whom correspondence should be addressed.
Submission received: 3 September 2021 / Revised: 12 October 2021 / Accepted: 14 October 2021 / Published: 22 November 2021
(This article belongs to the Special Issue Remote Sensing and GIS in Environmental Monitoring)

Abstract

:
Palestinian healthcare institutions face difficulties in providing effective service delivery, particularly in times of crisis. Problems arising from inadequate healthcare service delivery are traceable to issues such as spatial coverage, emergency response time, infrastructure, and manpower. In the Gaza Strip, specifically, there is inadequate spatial distribution and accessibility to healthcare facilities due to decades of conflicts. This study focuses on identifying hospital site suitability areas within the Gaza Strip in Palestine. The study aims to find an optimal solution for a suitable hospital location through suitability mapping using relevant environmental, topographic, and geodemographic parameters and their variable criteria. To find the most significant parameters that reduce the error rate and increase the efficiency for the suitability analysis, this study utilized machine learning methods. Identification of the most significant parameters (conditioning factors) that influence a suitable hospital location was achieved by employing correlation-based feature selection (CFS) with the search algorithm (greedy stepwise). Thus, the suitability map of potential hospital sites was modeled using a support vector machine (SVM), multilayer perceptron (MLP), and linear regression (LR) models. The results of the predicted sites were validated using CFS cross-validation and the receiver operating characteristic (ROC) curve metrics. The CFS analysis shows very high correlations with R2 values of 0.94, 0. 93, and 0.75 for the SVM, MLP, and LR models, respectively. Moreover, based on areas under the ROC curve, the MLP model produced a prediction accuracy of 84.90%, SVM of 75.60%, and LR of 64.40%. The findings demonstrate that the machine learning techniques used in this study are reliable, and therefore are a promising approach for assessing a suitable location for hospital sites for effective health delivery planning and implementation.

1. Introduction

The Gaza Strip has faced several challenges in the last seven decades that have led to the poor distribution of infrastructural facilities, especially in the healthcare sector which, notably, is of the utmost importance. The healthcare sector suffers inadequate spatial coverage and poor planning standards in their distribution in line with population and urban growth. A report published by the World Health Organization [1] narrated the vulnerable population groups suffering from the lack of access to primary healthcare, emergency services, and mental health services in Palestine. According to the report, there are 250,000 people in communities within the restricted access areas (about 2 km of the Gaza Strip border); over a million people fall into vulnerable groups across the Gaza Strip, including 287,000 neonates and children, 60,000 pregnant women, 700,000 chronic disease patients, 41 000 elderly people, and 6475 of the most vulnerable people with a disability due to conflict.
Central to improving healthcare service delivery in the region under study is the issue of location. A suitably located hospital addresses important issues such as accessibility within a reasonable distance and time at a reasonable cost, availability of space that meets current service operational capacity and, at the same time, accommodates future development/emergency needs, capability for the projected target service population, and delivering community obligations [2,3,4]. From the forego, it is obvious that finding suitable sites for locating a hospital is a multicriteria problem that has numerous fundamental societal factors to be considered for the maximum benefit.
Among healthcare experts and other stakeholders, there are mixed views and arguments on which criteria are most important–social, environmental, or economic. However, the entire decision-making process requires a multidisciplinary approach, involving healthcare professionals, government officials, engineers, environmentalists and social scientists, and other stakeholders [5]. On the part of the government, locating a hospital in the most appropriate place will help enhance the efficient allocation of medical resources, matching the provision of healthcare with the social and economic demands. In addition, it will ease the coordination of urban–rural health service development network and social challenges [6]. From the citizen point of view, building a hospital in a suitable location will improve access to healthcare services, minimizes emergency response time, improves citizen medical service satisfaction, and ultimately enhances the quality of life [7,8]. For the healthcare services investors and operators, locating a hospital in the right place will certainly reduce the cost and guarantee a return on investment. For this, stakeholders usually employ the services of cost accounting to adapt to the development of the market economy. Overall, suitably locating a hospital in the appropriate site enhances the competitive advantage, and promotes branding, marketing, and human resources supply [6].
The optimal location of healthcare facilities is crucial to healthcare service delivery, accessibility, cost, and time response to patient-centered emergency needs. Over the recent decades, the capabilities of geospatial technologies have been utilized to optimize suitable site selection for different purposes [9]. Site suitability assessment has been widely accepted as a tool for making objective decisions related to locating public infrastructures by considering and balancing key factors such as topography, land availability, land use, population, economic, and other relevant parameters [2]. For example, the siting of some facilities requires that the site is free of any natural and environmental interference, such as natural hazard, noise, or business or traffic hazards, while at the same time is accessible to the present and future populations [10,11].
The advances in computational intelligence have promoted the development of different algorithms, techniques, and procedures to solve issues of location problems such as site suitability, hazard susceptibility mapping, and spatial prediction [12,13,14]. In recent times, artificial intelligence and machine learning algorithms have gained wide applicability in the field of geosciences. For example, identifying suitable land for agricultural purposes [15], predicting locations susceptible to flooding [14,16,17,18], landslides [19,20,21], forest fire [22,23], and groundwater potential [24,25,26] have been accomplished using prominent algorithms such as artificial neural network (ANN), support vector machine (SVM), multilayer perceptron (MLP), multivariate adaptive regression splines (MARS), boosted regression tree (BRT), fuzzy logic, and logistic regression. Locating a healthcare facility like a hospital is a critical multicriteria location-based problem but based on a thorough literature search by the authors, no work has been reported specifically for a hospital location using these novel techniques to optimize the decision-making process despite its success in similar fields. This study investigates the efficiency of SVM, MLP, and LR models to predict suitable locations to site a hospital in the Gaza Strip. The outcome of this study will provide a methodology to assist in the site suitability assessment of hospitals in the study area for efficient healthcare planning, management, and delivery.

2. Background

The site selection of public facilities is a strategic matter. The selection of a public facility site usually results in success or failure, especially a hospital [27]. The selection of a hospital location is theorized as a problem of multicriteria decision making that includes many criteria that can be conflicting and dependent, or independent [28]. Various studies have used geographic information systems (GIS) to select a proper site for constructing a new hospital. The analytical hierarchy process (AHP) developed by Saaty (1980) is one of the most valuable methods which plays a major role in the optimal preference selection [29,30]. Wu et al. [31] identified the optimal location of hospitals in Taiwan and performed a sensitivity analysis utilizing AHP together with a modified method of Delphi. Another study by Lin and Tsai [32] implemented an expert system for the selection of the health utilities for ideal cities. The researchers utilized a combined system operated by the analytic network process (ANP) integrated with the TOPSIS method. Vahidnia et al. [33] suggested a combination method of GIS and a fuzzy AHP for hospital site selection in Tehran. Another research project used a fuzzy AHP (FAHP) to select a suitable site for constructing a new hospital in Ankara by Aydın [34]. Soltani and Marandi [35] proposed a two-stage method of fuzzy multicriteria. First, the authors assessed developable parcels using GIS and FAHP, while for the second, they employed a fuzzy ANP (FANP).
Previous studies have demonstrated the use of several approaches to analyze datasets with a different application for different parameters [12,13,14,36]. Among the methods used are correlation feature selection, multilayer perceptron, support vector machines, and linear regression models. These are machine learning’s most common models, and yet they have not been applied in hospital site suitability which motivated their selection and application. Correlation feature selection (CFS) is a method of choosing a feature that uses subset evaluators and search algorithms to produce the most accurate subset for each dataset. In this analysis, the correlation feature selection subset evaluator and the search method of greedy stepwise were applied directly to the algorithm of the feature selection. The subset ranked the features according to the correlation with the class label and other features using the correlation feature selection subset evaluator (CfsSubsetEval). The subsets of the features that were highly correlated with the class label and less correlated with other features were classified as giving a higher value. Moreover, this method eliminates inappropriate and repetitive features of the dataset [37,38,39]. The greedy stepwise search begins from the blank set, then defines the variables through the forward selection, and also reduces the unwanted variables through the back selection to get the most accurate subset of the feature. A new set of nominee feature subsets forms by attaching additional features to the most accurate subset during the search process. After evaluating all of the subsets, the best feature subset is selected. The algorithm persists these processes until the newly created set of the subsets exceeds no more than the best existing subset [39,40,41].
The multilayer perceptron (MLP) is an important artificial neural network model that feeds sets of input data to a suitable set of outputs. The MLP model helps understand the system behavior according to input notes and can round values without prior knowledge of the data relationships [42]. MLP has many advantages, such as distributing training datasets that are not based on the presumptions, and no decision is required regarding the relevant importance of individual input measures, and most of the input measures are chosen according to the weight adjustment throughout the training phase [43]. MLP is comprised of various layers of nodes that are directed in lines, completely associated with each layer. It has been largely utilized in classification [44,45]. Three major structures are input layers, hidden layers, and output layers, which construct the neural networks of a MLP (Figure 1). The input layers are considered to be factors of relevance and the output layers are the categorized outcomes, while the hidden layers are the categorized layers to convert the inputs to the outputs.
The support vector machine (SVM) is an important machine learning model that is based on the theoretical foundation of statistical learning and applies the principle of structural risk reduction, which Cortes and Vapnik first introduced in 1995 [15,46,47]. The SVM works through a learning algorithm that makes use of high-dimensional features. The precision of the SVM model largely depends on specifying the parameters of its model. Structured strategies for selecting the parameters are critical, and it is extremely important to arrange the alignment of the model parameters. SVMs have been successfully performed for multiple purposes [16,19,48,49,50]. The SVM is a supervised learning algorithm usually used to sort images of different classes of images from different disciplines. The SVM has been used in classification problems of two classes and is usable for the analysis of the classification of linear and nonlinear data. The SVM produces two types of hyperplanes in a high-dimensional space, namely, single and multiple hyperplanes. The optimum hyperplane splits the data into several classes with the highest division between classes. The nonlinear classifier employs several kernels for margins estimation. The primary purpose of these kernels (i.e., radial basis, polynomial, sigmoid, and linear) is to increase the margins between the individual hyperplanes. Recently, researchers have developed a very good number of promising applications due to the growing interest in SVMs [14,36,51].
Linear regression (LR) is the most popular regression model which is generally employed to discover the relationship between a dependent variable and a single or multiple explanatory variables. In terms of the number of explanatory variables, a linear regression has two types of models, which are simple and multiple. A simple linear regression is the case of an explanatory variable that contains one independent variable (predictor) and a continuous dependent variable (response). Multiple linear regression is the case where more than one explanatory variable (predictors) is present. The linear regression model is used to indicate the linear dependence of one variable on another, to gauge the estimations of one variable from the estimations of different variables, and to address the linear dependence of one variable over the other to show the other features of its variability [52].

3. Materials and Methods

3.1. Study Area and Data Used

The Gaza Strip is one of the administrative regions of Palestine, located on the southwestern Mediterranean coast. Geographically, it is located between longitudes 34°13″ E and 34°34″ E and latitudes 31°13″ N and 31°59″ N with an approximate area of about 365 km2 and an altitude ranging between 0 m and 90 m above mean sea level (MSL) [53]. The population of the Gaza Strip is reported to be about 2 million people (5315 people per square kilometer) according to the Palestinian Central Bureau of Statistics [54]. The Gaza Strip is bordered in the east by the Sinai Peninsula, Egypt in the south, and Israeli settlements in the east and north (Figure 2). In terms of climate, the Gaza Strip belongs to the temperate Mediterranean climate and the arid climate of the Negev and Sinai deserts’ climatic zones with annual rainfall ranges of about 335 mm/y and temperature between 27 °C and 13 °C [55]. The Gaza Strip is made up of five administrative regions, namely, the Gaza Governorate, which is the capital of the Gaza Strip and accounts for about 34.3% of the population of the Gaza Strip [56], the North Governorate, the Middle Governorate, Khan Yunis, and the Rafah Governorates in the south.
In this study, the process of assessing site suitability for locating a hospital in the Gaza Strip involves a number of datasets on the geodemographics, the environment, and the topography, as well as remote sensing imagery obtained from the Ministry of Local Government, the United Nation Relief and Work Agency (UNRWA), and the United States Geological Survey (USGS) data archive. The Gaza Strip and its governorates’ boundary data (in shapefile), neighborhood data, and land-use base map were provided by the Ministry of Local Government; the geographic position of the hospitals was provided by the health ministry; the population census data of 2018 was obtained from the Ministry of Interior, while the no-go zone, aerial photo, and digital elevation model (DEM) were obtained from the UNRWA. In addition to these sources, Landsat 8 imagery acquired on June 2016, and downloaded from the USGS data depository on April 2018 (http://earthexplorer.usgs.gov, accessed on 4 November 2021) was utilized to update the land-use map. From these datasets, 15 conditioning factors were obtained: population number, population density, distance from road, distance from main road, distance from river, distance from residential areas, distance from agricultural land, distance from refugee camps, slope, altitude, plan curvature, topographic wetness index, topographic roughness index, and stream power index. Based on the literature sources [12,13,57], the conditioning factors are identified as important criteria for determining hospital locations.

3.2. Methodology

First, we obtained the sampling dataset of 29 hospital inventory points from the Gaza Strip Ministry of Health and an additional 29 nonhospital locations were randomly selected and added to the hospital points as the dependent variable. This was followed by the generation of 15 conditioning factors (independent variables) generated from the data collected from the various sources mentioned earlier. Thereafter, the raster values of the 15 conditioning factors corresponding to the position of the sampling points were extracted for these points as input for the modeling process. For the modeling operation in Weka, using SVM, MLP, and LR algorithms, the sampling data, comprised of a combination of the dependent and independent variables, was divided into a 70% and 30% ratio for the model training and validation, respectively, and the results were subsequently used to produce hospital site susceptibility maps. The performance of the models was evaluated using the 30% testing sample dataset through the interpretation of the statistical evaluation metrics, including the sensitivity, specificity, and area under the curve (AUC) parameters. Figure 3 shows the overall methodology of the study.

3.3. Data Preparation

To assess suitable sites for locating hospitals in the Gaza Strip, the datasets collected in digital format from different organizations were assembled in a GIS environment and evaluated for quality and suitability for the purpose by comparing them with the Landsat 8 imagery and high-resolution Google Earth map. The conditioning factors used are categorized under three classifications: environmental (land use related), topographic, and geodemographic factors. In the literature, there is no consensus among researchers on specific factors to be used for location suitability assessments. However, some specific factors that have been widely used by researchers indicate their importance in the location-based decision-making process [58,59]. From each of the classifications, the relevant data layers were organized for further processing. All of the conditioning factors were transformed to 10 m resolution raster products using ArcGIS 10.5.
The topography of an area has a direct impact on site selection because it controls a number of natural processes that constitute environmental concerns, such as flooding and erosion. In this study, the 6 topographical factors identified to be relevant to assessing hospital site suitability are slope, altitude, plan curvature, topographic wetness index, topographic roughness index, and stream power index (Figure 4a–f). These data layers were derived from the 20 m resolution DEM obtained from the UNRWA.
Human settlement is largely controlled by natural phenomena, such as the physical landscape, water availability, vegetation/forest distribution, and fertile soil for crop production. For the environmental variables, 6 data layers, including roads, main road, river network, residential area, agricultural land, and refugee camps, were extracted from the land use data. Using the Euclidean distance tool, the distance from any road, the distance from a main road, the distance from the river network, the distance from a residential area, the distance from an agricultural area, and the distance from a refugee camp, the conditioning factors were generated (Figure 4g–l). The Euclidean distance analysis allows quantifying the spatial relationship between the factors and the suitable location in linear distance [13,20,60,61,62].
In any community, the inhabitants are not spread evenly; this accounts for the variation in population density along different societal dimensions that influence the choice of siting a new hospital [6,63,64,65,66]. In terms of the cost and response time, locating a hospital close to where people live has a direct implication on the emergency response during disasters. Combining the demographic parameters to the geographic factors allows for the addition of population size and density as important factors to provide a comprehensive foundation for the analysis and planning of the health service. In the current study, the population data obtained from the Ministry of Interior 2018 census data of districts and governorate area were interpolated using the inverse distance weightage (IDW) algorithm [13] to generate a raster data layer and were combined with the vector map of each district in ArcGIS 10.5, thus the population size and the population density geodemographic factors (Figure 4m,n) were produced.

3.3.1. Environmental Factors

The distances from road and main road, river network, residential areas, agriculture areas, and refugee camps merit special attention Accessibility is key to locating a hospital, so, the decision makers are usually interested in locations close to roads, particularly main roads; the nearer to the road a hospital is sited, the better for ease of service delivery and facility maintenance. Beyond the advantages of proximity to a road is also the concern about noise pollution from motor vehicles and/or a railway line. Therefore, there is always a compromise between how far or close to roads the ideal location should be.
The distance from a river is considered another related conditioning factor. As water runoff increases and drains into streams/rivers, there is a risk of floods in areas abutting the river, particularly at a lower elevation and slope. In this respect, the distance of a potential site from streams/rivers is an important criterion.
Healthcare facilities are sited to serve the people; thus, residential areas are favorable targets for locating a healthcare facility. The nearer a hospital is to a residential area, the better. The residential factor is normally examined in terms of the population data and distribution, which is converted to a thematic map layer in raster format. The better the information provided, the better the resulting factor contributes to the overall accuracy.
Food security is important to the well-being of any society. So, policies exist all over the world to prohibit the location of facilities on land designated as agricultural lands. For this, a specified distance away from agricultural areas is imposed as a condition to evaluate whether a candidate piece of land that is suitable for building a hospital is outside of agricultural land.
Political crisis and civil unrest across the world gave birth to a completely new settlement called a refugee camp. Such refugee camps are an important factor to be considered in the site selection for suitable space to construct a hospital and other healthcare facilities. The reason being that refugee camps are always overcrowded, often unorganized, and without the provision for basic infrastructure. This is the case in the Gaza Strip, which has been in crises for decades.

3.3.2. Topographical Factors

The slope and elevation altitude are geographical characteristics that influence high accelerated runoff potential (high altitude, high slopes) and water stagnation areas that are highly prone to flooding, generally at low altitudes and slope. These factors determine how stable the topography is to the slope related hazard, such as flooding, landslides, and erosion. With respect to building siting, many studies have identified the slope and altitude as vital conditioning factors [67,68,69].
Like the slope and altitude, the plan curvature influences the runoff potential of any topography. It is described as the surface perpendicular to the direction of the maximum slope [70]. A negative plan curvature indicates areas where there is a convergent (accelerated) overland flow, while positive values show the divergent areas with a decelerated overland flow.
The stream power index (SPI) is a secondary product of the DEM that indicates the power of flowing water and erosion potential based on the presumption that the erosive power of a topography is related to the quantity of water discharge to the definite catchment area. The SPI is computed from the combination of the information of the catchment area and slope gradient [71] using the formula introduced by Moore and Wilson [72].
S P I = A tan β / b
where A is the specific catchment area and β is the local slope gradient computed in degrees.
The topographic wetness index (TWI) is a secondary derivative of the DEM obtained from the flow accumulation and flow direction. High values of this index is indicative of areas favoring water accumulation. It has been widely used to measure the effect of topography in terms of the location and size of the saturated source of water runoff [73]. The TWI can be calculated using the equation [74]:
T W I = log e A b tan β
where A denotes flow accumulation in square meters, b refers to the pixel width through which water flows in meters, and β (radian) represents the slope.
The topographic roughness index (TRI) is also a secondary derivative of a topographic product that characterizes the variability in elevation within a spatial unit [71]. This factor is used to define landform components. The terrain roughness is usually considered with other terrain attributes in order to understand and describe the landform process that differentiates the geomorphological units [75]. The TRI is derived using the following equation proposed by Riley [76].
T R I = x ( m a x 2 m i n 2 )
where m a x denotes the pixel largest value in nine rectangular altitude neighborhoods, and m i n denotes the minimum value.

3.3.3. Geodemographic Factors

Population size is associated with the demand and performance of a hospital. Population density is directly linked to the demand and supply factors. In addition, it influences the effectiveness and performance of healthcare service delivery to the citizenry. Population density is the number of people per unit area, e.g., persons per square meter or kilometer, calculated using the census data on a census tract base as the spatial unit of analysis.

3.4. Model Implementation and Validation
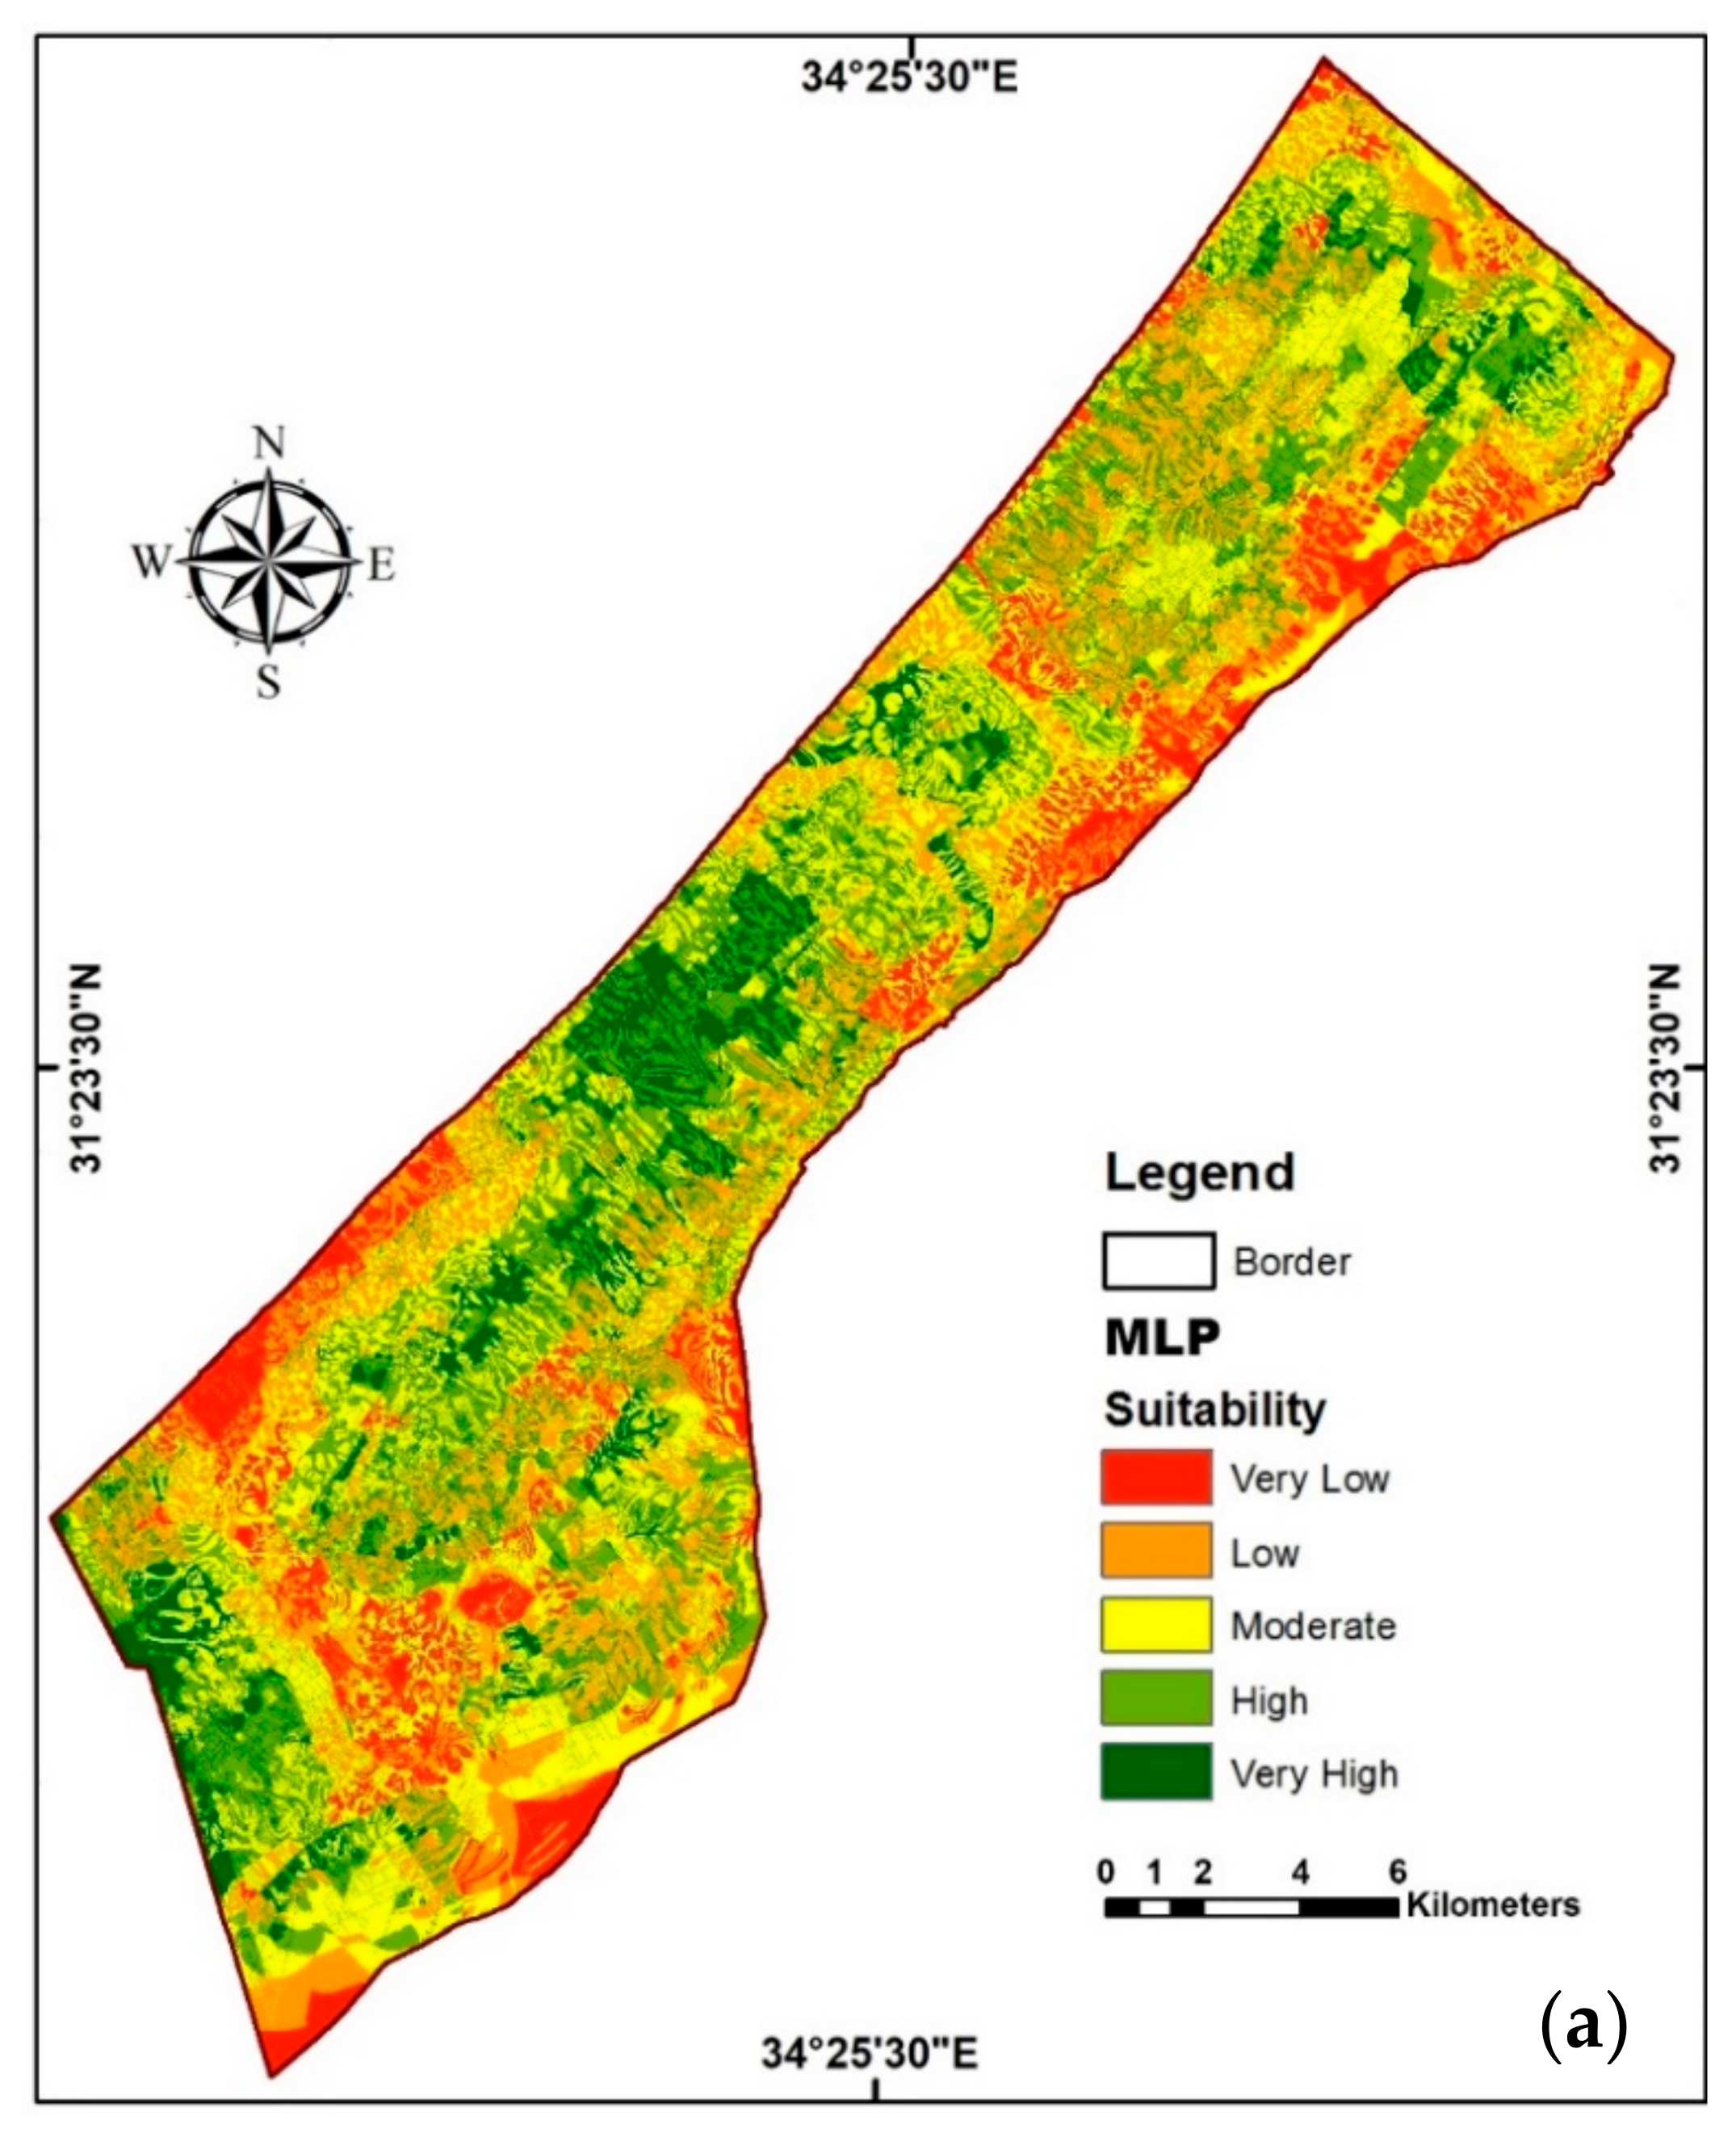
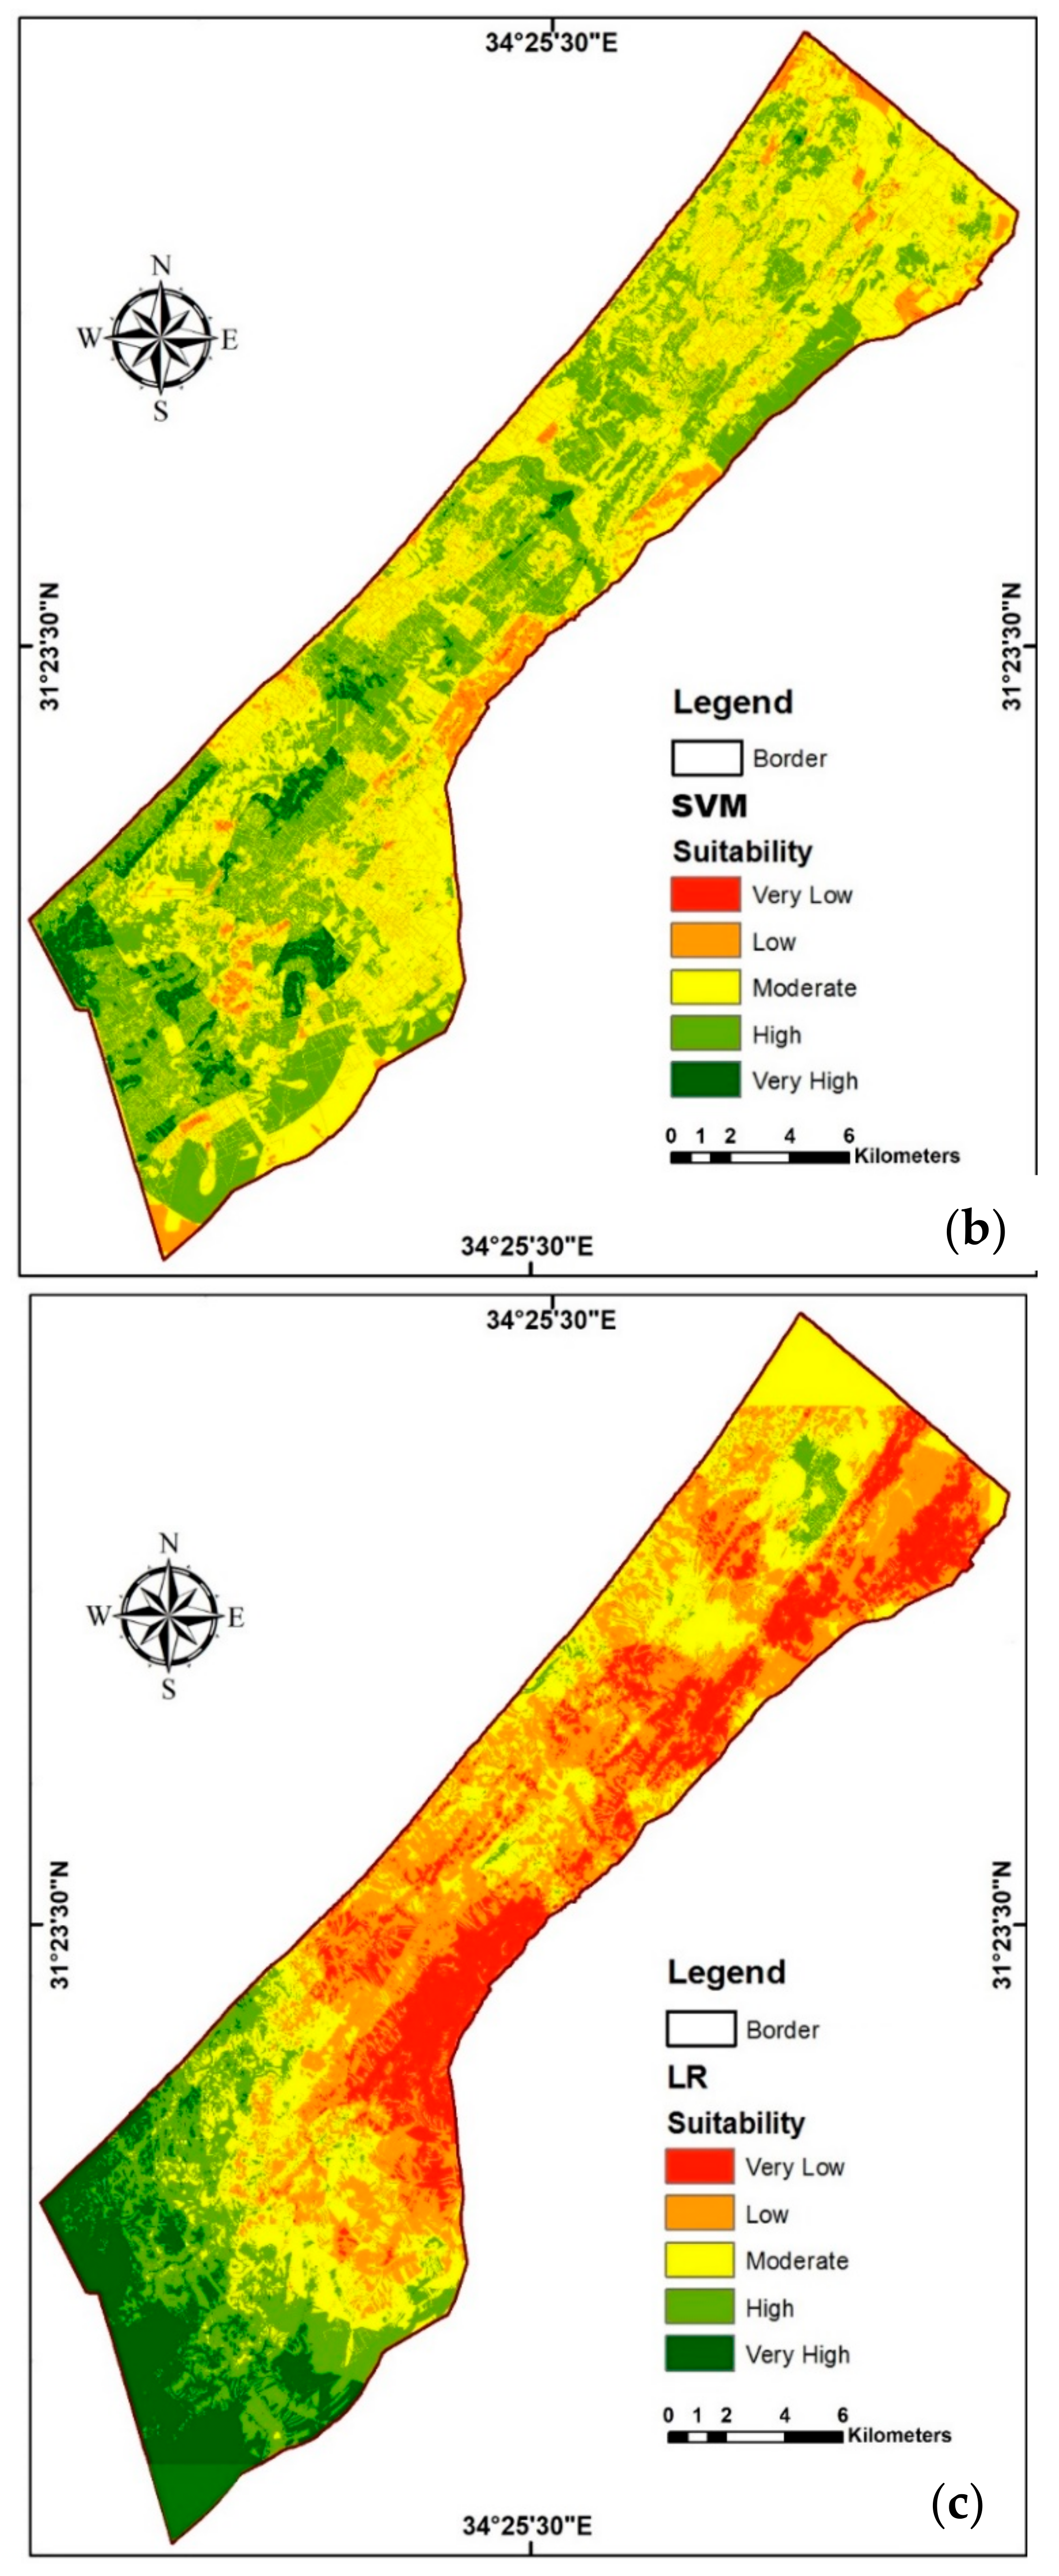
As mentioned earlier, the current study implements SVM, MLP, and LR models in Waikato Environment for Knowledge Analysis (Weka Version 3.8.2, developed by the University of Waikato, New Zealand [77]. Using the random partition algorithm in Weka, the sampling data was divided into training and validation data subsets in the ratio 70% (41 points) and 30% (17 points), respectively. In practice, there is no generally acceptable mechanism for partitioning a sampling dataset; the choice varies in the literature, usually depending on the quantity and quality of the sample data [61]. Before using the data for modeling, it was subjected to a correlation-based feature selection (CFS), employing the greedy stepwise search algorithm 10-fold cross-validation method to reduce the error rate, increase efficiency, and to achieve a better performance [78,79]. CFS is an efficient feature selection technique; the greedy algorithm adds either the most favorable feature or deletes the most unfavorable one in each round [80]. In the current study, the process ranks attributes in their order of influence on the model. The resulting models were executed in ArcGIS 10.5 and the output raster data was reclassified into five suitability classes using the quantile classification method [13] to produce the final hospital suitability maps. The quantile method is an efficient classification technique that measures equivalent representation of each class by statistically evaluating the range of raster values in the input layer [81].
Validation is essentially a necessary step in any predictive modeling task. In this study, the data was divided into 70% training dataset and 30% test dataset for validation. For every classifier, a 10-fold cross-validation was executed. The cross-validation process splits the dataset into 10 subgroups; 9 subgroups utilized for training and the remaining subgroup for testing. In each step of the 10-fold processing stage, a different segment is utilized for testing the accuracy and the final result represents the average of the 10 results [82]. The performance of each model was assessed using the correlation coefficient (R2), and the associated quantitative metrics, root mean square error (RMSE), mean absolute error (MAE), relative absolute error (RAE), and root relative squared error (RRSE) for the cross-validation result. In addition, the overall performance of the models was validated using the receiver operating characteristics (ROC) accuracy assessment parameter, specifically, sensitivity, specificity, and area under the curve (AUC) measures.

4. Results

An assessment of the independent variables (conditioning factors) relative to the dependent variable (hospital location) using the correlation feature selection provides insight into the degree of importance of each conditioning factor to the overall model building. The CFS analysis ranks the parameters according to the correlation with the class label and the other parameters (Table 1). From the table, it can be observed that the relative influence between hospital locations and the other parameters showed that the population density and distance from the road had the highest values of CFS (100%), closely followed by the distance from the main road and the distance from the residential area (90%). The factors in the mid-range are the distance from agricultural land and population number (70%), slope, plan curvature, and no-go zone with a relative influence value of 60%, 50%, and 40%, respectively. Those with a low relative influence on hospital siting are altitude, the distance from the refugee camp (20%), and the distance from a river (10%). The result also reveals that SPI, TWI, and TRI have 0% influence and therefore were eliminated from the model building process. The CFS evaluation is based on merit, evaluated based on the coefficient of correlation and error rates [83].
In this study, we investigate the performance of the SVM, MLP, and LR models at different stages of the modeling process. The first is at the level of feature selection to appraise the conditioning factors relative to the models through an analysis of the cross-validation accuracy measures (correlation coefficient, MAE, RMSE, RAE, and RRSE). The second stage assesses the performance of the model, also determined using the ROC curve metrics; sensitivity, specificity, and area under curve (AUC) values. Table 2 presents detailed result of both of the stages of evaluation.
The cross-validation result revealed a high correlation between the conditioning factors and hospital site for the models used (Table 2). SVM and MLP have a very high correlation with the R2 value of 0.94 and 0.93, respectively. However, the SVM has the lowest error rate with the MAE, RMSE, and RAE value of 0.011%, 0.001%, and 4.18%, respectively compared to 0.07%, 0.231%, and 13.62% for the MLP classifier. The LR model also indicates a moderately high correlation with the R2 value of 0.75 but with a slightly high error rate based on the reported MAE, RMSE, and RAE value of 0.25, 0.31, and 0.60, respectively. The cross correlation is a pre-modeling assessment of the applicability of the SVM, MLP, and LR models for predicting a suitable site to locate a hospital with the conditioning factors considered in the study.
Figure 5 and Table 2 show the result of the model performance evaluation using the 30% validation (testing) dataset. The graph of sensitivity–specificity plots provides a visual and statistical understanding of how well the models can classify a suitable site for a hospital location from an unsuitable position. It can be seen from the figure that the ROC curves of the three models approach the upper left corner of the plot. This is interpreted to mean a high overall accuracy [84]. Comparatively, the results of the modeling process yield a superior classification capability with sensitivity (lower band) and specificity (upper band) values of (0.82, 0.88), (0.71, 0.80), and (0.60, 0.69) for the MLP, SVM, and LR models, respectively (Table 2). The model performance based on the area under the ROC curve analysis produced an overall accuracy value of 0.85, 0.76, and 0.64 for the MLP, SVM, and LR models with a standard error of 0.017, 0.021, and 0.024, respectively, at 95% confidence interval.
The results of the hospital site suitability map are presented in Figure 6. The maps were generated from the effective conditioning factors with a relative influence greater than zero (in Table 1) to determining potentially suitable sites in which to locate hospitals in the study area. The modeling process exploits the interaction between these indicators (independent variables) based on the sampled dataset to establish a relationship that accurately produces the hospital site suitability map using SVM, MLP, and LR models. In each map, the degree of susceptibility is categorized into five classes: very high, high, moderate, low, and very low (Figure 6), utilizing the quantile classification method [13].
Obviously, there is spatial variation in the respective suitability class across the models. For example, the MLP output map (Figure 6a) shows a relatively balanced presence of all the suitability classes across the study area. However, the central region, a section of the southern part, and small portion in the north indicate very high suitability levels. Moreover, the SVM-generated map (Figure 6b) is biased to very high (in small areas), high, and moderate classes, whereas the low and very low classes rarely exist. Unlike the other maps, the LR map product shows a distinct pattern (Figure 6c); the study area appears divided into two where the very high and high suitability classes occupy the southern section and the low and very low classes, interposed with the moderate class, are in the central and northern part of the Gaza Strip.
The quantitative analysis has shown that for the MLP, the very high, high, and moderate suitability classes cover 10.10%, 27.74%, and 29.82%, approximately 36.9 km2, 101.25 km2, and 108.8 km2, respectively. Moreover, the low and very low classes take up 21.62% (78.9 km2) and 10.72% (39.15 km2). For the suitability map produced with the SVM model (Figure 6b), the very high (3.65%), low (9.85%), and very low (0.35%) suitability classes represent a relatively very small percentage of the total area (~13.85%) which constitutes 50.5 km2. Meanwhile, the larger percentage of the area is shared between the high and moderate suitable classes (36.38 and 49.77% respectively),, amounting to 314.5 km2 with the latter occupying nearly half of the study area. Moreover, for the LR-generated suitability map (Figure 6c), the model predicts spatial coverage of 10.78%, 15.02%, 23.47%, 32.61%, and 18.12% for the very high, high, moderate, low, and very low suitability class, respectively, representing 39.35 km2, 54.80 km2, 85.65 km2, 119.10 km2, and 66.10 km2, respectively

5. Discussion

Determining an appropriate method to identify suitable locations to build a hospital is a difficult process that involves taking decisions on the appropriate conditioning factors and dealing with the spatial heterogeneity associated with them. Therefore, the first step to ensure a reliable result was to assess how related the chosen variables considered are to determining a potential hospital location by examining their relative influence and correlation with the models using the 10-fold cross-correlation approach. Through this process, the conditioning factors that have no contribution were excluded from the modeling process. Moreover, the correlation values obtained, 0.94, 0. 93, and 0.75 for the SVM, MLP, and LR, respectively, shows that the variables considered are fit for the purpose. Top on the list of relative influence are population density and the distance from the road (100%), the distance from the main road and from residential areas (90%), the distance from agricultural land and population number (70%), while the slope, plan curvature, and no-go zone are in the average with a relative influence of 60%, 50%, and 40%, respectively. This indicates that human factors dominate the choice of location rather than topographic factors since the altitude of a place determines the slope, curvature, and other morphometric elements.
The model performance evaluation is based on the ROC curve parameters (sensitivity, specificity, and AUC) measured on a standard scale of 0–1; where a value <0.6 indicates low accuracy, while those between 0.6–0.7, 0.7–0.8, 0.8–0.9, and >0.9 are interpreted to be in the accuracy range of either moderate, good, very good, or excellent [61]. The sensitivity and specificity metrics interactively provide insight into the classification capability of the models. Sensitivity, otherwise called the true positive, indicates how well a model can classify the sampled data to truly identify the ideal position to build a hospital, while the specificity (or true negative) indicates the model’s ability to correctly classify unsuitable locations through the sample data. The sensitivity–specificity values obtained for the MLP model are 0.82, 0.88, SVM are 0.71, 0.80, and LR are 0.60, 0.69. According to Idrees and Pradhan [84], on a scale of 0 to 1, the closer the value obtained is to 1, the better the capability of the model in classifying data. In this study, the overall performance evaluation produced AUC values of 0.85, 0.76, and 0.64 for the MLP, SVM, and LR model, which fall into very good, good, and moderate accuracy, respectively.
Using the knowledge of the first author about the study area, combined with exploration of high-resolution Google Earth map, we observed that the result of the MLP truly reflects the natural environmental setting of the study area (consistent with previous reports in the study area [54]). For example, the very high and high suitable area occurred in the cities with more population and easy accessibility (Figure 6a). Similarly, the low and very low suitable area appears in areas designated as a no-go zone, open land, and very sparsely populated area. In contrast, the SVM result (Figure 6b) predicts high and moderate classes in areas such as a no-go zone and open unoccupied areas ordinarily considered inappropriate as optimal locations. The map in Figure 6c (LR model) partitions the classes into upper, middle, and lower bands as a contiguous neighbor in a way that neither reflects the input data nor the reality on the ground.
The application of SVM, MLP, and LR models in this study provides scientific evidence of the resourcefulness of multilayer (ML) techniques for a hospital site suitability assessment similar to the results obtained in other fields of study, such as flooding [14,16,17,18], landslide [19,20,21], forest fire [22,23], erosion, and water resources [24,25,26], etc. In this investigation, MLP and SVM perform satisfactorily with AUC values of 85% and 76%, respectively, compared to the LR model which produced poor results. Obviously, the MLP model is the most appropriate and stable model because of its ability to constructs and weight the conditioning factors using a nonlinear projection, unlike the LR model that analyzes the conditioning factors as linear functions [21]. The MLP model, for each training sample subset, calculates the neuron output from each layer and makes a prediction with the final layer (forward pass). The prediction is based on how fast the variation between the predicted and the actual output is calculated to get the prediction error, which is subsequently used to vary the weights of the neurons in all of the previous layers (backpropagation) until it reaches the optimal prediction accuracy [43,85]. This intricate procedure allows it to handle both linear and nonlinear datasets accurately.
The result of the SVM model based on the standard evaluation [86,87] is normally acceptable, but in this study, it is observed that the classification map appears more suitable than it is in the actual situation. This is traceable to the influence of the neighboring training points of the optimal hyperplane using the radial basis function which employs a nonlinear kernel function to project a linear model [22,88,89,90], even though not all of the conditioning factors exhibit a linear feature. As a result, error is introduced in the classification result, particularly in the very high and very low suitability classes. Similarly, the LR model employs a linear function [52], contrary to the characteristics of the conditioning factors. For instance, it is observed that some conditioning factors which have a high relative influence, in turn have a negative effect on determining hospital site suitability. In the Gaza Strip, road, river, and population density influenced the LR model most but contrary factors such as altitude and slope, both of which have a low relative influence, indicate a relatively high sensitivity in the resulting suitability map. Perhaps, testing SVM with other kernels may improve the accuracy but caution needs to be observed with the LR model.

6. Conclusions

The prolonged conflict in Palestine over the past seven decades has inflicted enormous suffering to the Palestinians, particularly in the health sector. The Gaza Strip, which is one of the most important service sectors in terms of population, suffers from an inadequate distribution of healthcare service facilities. This paper examined three novel prediction models, multilayer perceptron (MLP), support vector machine (SVM), and linear regression (LR), to optimize and analyze the influence that some selected factors considered have to influence assessing hospital site suitability. The models were considered because they have been successfully implemented in different areas of study and proven to be superior to the traditional methods. Motivated by the void in the research in the application of these methods for hospital site suitability prediction, the models have been experimented in this study and the result is validated at different stages of the work.
In this study, fifteen hospital site suitability conditioning factors were optimized and ranked using the CFS algorithm (greedy stepwise search method). The process permits the identification of factors that contribute to determining a suitable site and, thus, the unfit factors detected can be removed to minimize error in the model. The result of the CFS indicated that twelve conditioning factors (slope degree, altitude, plan curvature, distance from the road, distance from the main road, distance from the residential area, distance from the agricultural area, distance from the refugee camp, distance from the river, density of population, populations number, no-go zone) are fit for use. The topographic wetness index, topographic roughness index, and stream power index factors were excluded based on our investigations. Amongst the three models implemented, the MLP model has proven not only to perform optimally but produced a more balance result in terms of the reality of the study area. According to the experimental result, it is valid to conclude that MLP is the most suitable machine learning method as provided in the validation results with the CFS and the AUC values. The outcome is very reasonable in agreement with the location of existing hospitals and field inspection. In summary, the high performance achieved with the MLP model indicates that the proposed approach is appropriate and promising for hospital site suitability assessment. With further studies, experimenting different kernels, accuracy of the SVM may be improved. Based on this study, the authors believe the LR model should be used for hospital site suitability assessment with caution because it is unable to capture the nonlinear characteristics of the conditioning factors. Future studies may involve investigating other machine learning models for the same purpose, integrating advanced optimization and ensemble methods to improve the model predictive efficiency. Traffic variations within the day, variations between the weekdays, weekends, holidays, and celebration effects on traffic are also the subject of future studies.

Author Contributions

K.Y.A.: conceptualization, methodology, data acquisition, data analysis, validation, and manuscript writing. A.R.M.S., A.F.A. and S.N.S.I. supervised. All authors have read and agreed to the published version of the manuscript.

Funding

The research is supported by the Universiti Putra Malaysia.

Institutional Review Board Statement

Not applicable.

Informed Consent Statement

Not applicable.

Data Availability Statement

Available on request.

Acknowledgments

The authors would like to thank the Universiti Putra Malaysia for providing all facilities during this research.

Conflicts of Interest

The authors declare no conflict of interest.

References

  1. Reinicke, C.; MacDonald, J.; Donald, J. Report of a Field Assessment of Health Conditions in the Occupied Palestinian Territory; World Health Organization Reports, Palestine 2016; World Health Organization: Geneva, Switzerland, 2016; Available online: https://apps.who.int/gb/Statements/Report_Palestinian_territory/Report_Palestinian_territory-en.pdf (accessed on 4 November 2021).
  2. Ahmed, S.; Adams, A.M.; Islam, R.; Hasan, S.M.; Panciera, R. Impact of traffic variability on geographic accessibility to 24/7 emergency healthcare for the urban poor: A GIS study in Dhaka, Bangladesh. PLoS ONE 2019, 14, e0222488. [Google Scholar] [CrossRef] [PubMed] [Green Version]
  3. Higgs, G.; Langford, M.; Jarvis, P.; Page, N.; Richards, J.; Fry, R. Using Geographic Information Systems to investigate variations in accessibility to ‘extended hours’ primary healthcare provision. Health Soc. Care Commun. 2019, 27, 1074–1084. [Google Scholar] [CrossRef] [PubMed]
  4. Strozzi, F.; Garagiola, E.; Trucco, P. Analysing the attractiveness, availability and accessibility of healthcare providers via social network analysis (SNA). Decis. Support Syst. 2019, 120, 25–37. [Google Scholar] [CrossRef]
  5. Turnbull, J.; Martin, D.; Lattimer, V.; Pope, C.; Culliford, D. Does distance matter? Geographical variation in GP out-of-hours service use: An observational study. Br. J. Gen. Pract. 2008, 58, 471–477. [Google Scholar] [CrossRef]
  6. Zhou, L.; Wu, J. GIS-Based Multi-Criteria Analysis for Hospital Site Selection in Haidian District of Beijing. 2012. Available online: https://www.diva-portal.org/smash/record.jsf?pid=diva2:555935 (accessed on 4 November 2021).
  7. Al-Assar, K.A.M. The Assessment and Planning of Health Services in the Middle Governorate of the Gaza Strip Using Geographic Information System. Master’s Thesis, The Islamic University Gaza, Gaza, Palestine, 2014. [Google Scholar]
  8. Almansi, K.Y.M. Evaluation of the Service Areas and Accessibility of the Tertiary Hospitals Using GIS in Gaza Strip. Master’s Thesis, Universiti Putra Malaysia, Serdang, Malaysia, 2016. [Google Scholar]
  9. Kumar, M.; Mario Denis, D.; Mohammad Ali Gabril, E.; Nath, S.; Paul, A.; Mukesh Kumar, C. Site Suitability Analysis for Urban Development Using Geospatial Technologies and AHP: A Case Study in Prayagraj, Uttar Pradesh, India. Pharma Innov. J. 2019, 8, 676–681. [Google Scholar]
  10. LaGro, J.A., Jr. Site Analysis: Informing Context-Sensitive and Sustainable site Planning and Design; John Wiley & Sons: Hoboken, NJ, USA, 2013. [Google Scholar]
  11. Samani, Z.N.; Karimi, M.; Alesheikh, A.A. A novel approach to site selection: Collaborative multi-Criteria decision making through geo-social network (Case study: Public parking). ISPRS Int. J. Geo-Inf. 2018, 7, 82. [Google Scholar] [CrossRef] [Green Version]
  12. Jebur, M.N. Universiti Putra Malaysia Multi Remote Sensing Data in Landslide Detection and Modelling. 2015. Available online: http://psasir.upm.edu.my/id/eprint/58131/1/FK2015105IR.pdf (accessed on 4 November 2021).
  13. Mojaddadi, H.R. Flood Risk Assessment Using Multi-Sensor Remote Sensing, Geographic Information System, 2D Hydraulic and Machine Learning Based Models. 2018. Available online: https://opus.lib.uts.edu.au/handle/10453/133315 (accessed on 4 November 2021).
  14. Tehrany, M.S.; Kumar, L.; Shabani, F. A novel GIS-based ensemble technique for flood susceptibility mapping using evidential belief function and support vector machine: Brisbane. Aust. Peer J. 2019, 7, e7653. [Google Scholar] [CrossRef]
  15. Ornella, L.; Tapia, E. Supervised machine learning and heterotic classification of maize (Zea mays L.) using molecular marker data. Comput. Electron. Agric. 2010, 74, 250–257. [Google Scholar] [CrossRef]
  16. Xiong, J.; Li, J.; Cheng, W.; Wang, N.; Guo, L. A GIS-based support vector machine model for flash flood vulnerability assessment and mapping in China. ISPRS Int. J. Geo-Inf. 2019, 8, 297. [Google Scholar] [CrossRef] [Green Version]
  17. Singh, A.; Singh, K.K. Satellite image classification using Genetic Algorithm trained radial basis function neural network, application to the detection of flooded areas. J. Vis. Commun. Image Represent. 2017, 42, 173–182. [Google Scholar] [CrossRef]
  18. Tehrany, M.S.; Pradhan, B.; Jebur, M.N. Flood susceptibility analysis and its verification using a novel ensemble support vector machine and frequency ratio method. Stoch. Environ. Res. Risk Assess. 2015, 29, 1149–1165. [Google Scholar] [CrossRef]
  19. Pandey, V.K.; Pourghasemi, H.R.; Sharma, M.C. Landslide susceptibility mapping using maximum entropy and support vector machine models along the highway corridor, Garhwal Himalaya. Geocarto Int. 2020, 35, 168–187. [Google Scholar] [CrossRef]
  20. Pham, B.T.; Tien Bui, D.; Prakash, I.; Dholakia, M.B. Hybrid integration of Multilayer Perceptron Neural Networks and machine learning ensembles for landslide susceptibility assessment at Himalayan area (India) using GIS. Catena 2017, 149, 52–63. [Google Scholar] [CrossRef]
  21. Bui, D.T.; Tuan, T.A.; Klempe, H.; Pradhan, B.; Revhaug, I. Spatial prediction models for shallow landslide hazards: A comparative assessment of the efficacy of support vector machines, artificial neural networks, kernel logistic regression, and logistic model tree. Landslides 2016, 13, 361–378. [Google Scholar]
  22. Thach, N.N.; Ngo DB, T.; Xuan-Canh, P.; Hong-Thi, N.; Thi, B.H.; Nhat-Duc, H.; Dieu, T.B. Spatial pattern assessment of tropical forest fire danger at Thuan Chau area (Vietnam) using GIS-based advanced machine learning algorithms: A comparative study. Ecol. Inform. 2018, 46, 74–85. [Google Scholar] [CrossRef]
  23. Stojanova, D.; Panov, P.; Kobler, A.; Džeroski, S. Learning to predict forest fires with different data mining techniques. In Proceedings of the Data Mining and Data Warehouses (SiKDD 2006), Ljubljana, Slovenia, 17 October 2006. [Google Scholar]
  24. Kim, G.B. A study on the establishment of groundwater protection area around a saline waterway by combining artificial neural network and GIS-based AHP. Environ. Earth Sci. 2020, 79, 117. [Google Scholar] [CrossRef]
  25. Lu, F.; Zhang, H.; Liu, W. Development and application of a GIS-based artificial neural network system for water quality prediction: A case study at the Lake Champlain area. J. Oceanol. Limnol. 2019, 38, 1835–1845. [Google Scholar] [CrossRef]
  26. Maier, H.R.; Dandy, G.C. Neural networks for the prediction and forecasting of water resources variables: A review of modelling issues and applications. Environ. Model. Softw. 2000, 15, 101–124. [Google Scholar] [CrossRef]
  27. Chatterjee, D.; Mukherjee, B. Potential hospital location selection using AHP: A study in rural India. Int. J. Comput. Appl. 2013, 71, 1–7. [Google Scholar] [CrossRef]
  28. Kahraman, C.; Gundogdu, F.K.; Onar, S.C.; Oztaysi, B. Hospital Location Selection Using Spherical Fuzzy TOPSIS. In Proceedings of the 2019 Conference of the International Fuzzy Systems Association and the European Society for Fuzzy Logic and Technology (EUSFLAT 2019), Prague, Czech Republic, 9–13 September 2019; Atlantis Press: Prague, Czech Republic, 2019. [Google Scholar]
  29. Dey, P.K.; Ramcharan, E.K. Analytic hierarchy process helps select site for limestone quarry expansion in Barbados. J. Environ. Manag. 2008, 88, 1384–1395. [Google Scholar] [CrossRef]
  30. Saaty, T. The Analytic Hierarchy Process; McGraw-Hill: New York, NY, USA, 1980. [Google Scholar]
  31. Wu, C.R.; Lin, C.T.; Chen, H.C. Optimal selection of location for Taiwanese hospitals to ensure a competitive advantage by using the analytic hierarchy process and sensitivity analysis. Build. Environ. 2007, 42, 1431–1444. [Google Scholar] [CrossRef]
  32. Lin, C.T.; Tsai, M.C. Development of an expert selection system to choose ideal cities for medical service ventures. Expert Syst. Appl. 2009, 36, 2266–2274. [Google Scholar] [CrossRef]
  33. Vahidnia, M.H.; Alesheikh, A.A.; Alimohammadi, A. Hospital site selection using fuzzy AHP and its derivatives. J. Environ. Manag. 2009, 90, 3048–3056. [Google Scholar] [CrossRef]
  34. Aydın, Ö. Hospital Location for Ankara with Fuzzy AHP. Dokuz Eylül Univ. Fac. Econ. Adm. Sci. J. 2009, 24, 87–104. [Google Scholar]
  35. Soltani, A.; Marandi, E.Z. Hospital site selection using two-stage fuzzy multi-criteria decision-making process. J. Urban Environ. Eng. 2011, 5, 32–43. [Google Scholar] [CrossRef]
  36. Ahmad, I.; Basheri, M.; Iqbal, M.J.; Rahim, A. Performance comparison of support vector machine, random forest, and extreme learning machine for intrusion detection. IEEE Access 2018, 6, 33789–33795. [Google Scholar] [CrossRef]
  37. Hall, M.A. Correlation-Based Feature Selection for Machine Learning. Ph.D. Thesis, University of Waikato, Hamilton, New Zealand, 1999. [Google Scholar]
  38. Onik, A.R.; Haq, N.F.; Alam, L.; Mamun, T.I. An analytical comparison on filter feature extraction method in data mining using J48 classifier. Int. J. Comput. Appl. 2015, 124, 1–8. [Google Scholar]
  39. Sahoo, G.; Kumar, Y. Analysis of parametric & non parametric classifiers for classification technique using WEKA. Int. J. Inf. Technol. Comput. Sci. 2012, 4, 43. [Google Scholar]
  40. Sadeghi, R.; Zarkami, R.; Sabetraftar, K.; Van Damme, P. Application of genetic algorithm and greedy stepwise to select input variables in classification tree models for the prediction of habitat requirements of Azolla filiculoides (Lam.) in Anzali wetland, Iran. Ecol. Model. 2013, 251, 44–53. [Google Scholar] [CrossRef]
  41. Wald, R.; Khoshgoftaar, T.M.; Napolitano, A. Optimizing wrapper-based feature selection for use on bioinformatics data. In Proceedings of the The Twenty-Seventh International Flairs Conference, Pensacola Beach, FL, USA, 21–23 May 2014. [Google Scholar]
  42. Walker, A.L. Machine learning in geosciences and remote sensing. Geosci. Front. 2016, 7, 3–10. [Google Scholar] [CrossRef] [Green Version]
  43. Gardner, M.W.; Dorling, S.R. Artificial neural networks (the multilayer perceptron)—A review of applications in the atmospheric sciences. Atmos. Environ. 1998, 32, 2627–2636. [Google Scholar] [CrossRef]
  44. Adeyemo, O.O.; Adeyeye, T.O.; Ogunbiyi, D. Comparative study of ID3/C4. 5 decision tree and multilayer perceptron algorithms for the prediction of typhoid fever. Afr. J. Comput. ICT 2015, 8, 103–112. [Google Scholar]
  45. Haykin, S. Neural Networks and Learning Machines, 3/E; Pearson Education India: Delhi, India, 2010. [Google Scholar]
  46. Cortes, C.; Vapnik, V. Support-vector networks. Mach. Learn. 1995, 20, 273–297. [Google Scholar] [CrossRef]
  47. Jain, P.; Garibaldi, J.M.; Hirst, J.D. Supervised machine learning algorithms for protein structure classification. Comput. Biol. Chem. 2009, 33, 216–223. [Google Scholar] [CrossRef]
  48. Bao, Y.; Hu, Z.; Xiong, T. A PSO and pattern search based memetic algorithm for SVMs parameters optimization. Neurocomputing 2013, 117, 98–106. [Google Scholar] [CrossRef] [Green Version]
  49. Friedrichs, F.; Igel, C. Evolutionary tuning of multiple SVM parameters. Neurocomputing 2005, 64, 107–117. [Google Scholar] [CrossRef]
  50. Lorena, A.C.; De Carvalho, A.C. Evolutionary tuning of SVM parameter values in multiclass problems. Neurocomputing 2008, 71, 3326–3334. [Google Scholar] [CrossRef]
  51. Bamakan SM, H.; Wang, H.; Yingjie, T.; Shi, Y. An effective intrusion detection framework based on MCLP/SVM optimized by time-varying chaos particle swarm optimization. Neurocomputing 2016, 199, 90–102. [Google Scholar] [CrossRef]
  52. Shelke, M.B.; Badade, K.B. Processing of Incomplete Data Sets: Prediction of Missing Values by using Multiple Regression. Int. J. Comput. Electron. Res. 2013, 2, 5. [Google Scholar]
  53. Al-Qutob, M.A.; Al-Rimawi, F. Analysis of Different Rare Metals, and Rare Earth Metals in Harvested Rain Water in Gaza Strip/Palestine by ICP/MS-Data and Health Aspects. Sci. Res. Publ. 2016, 8, 905–912. [Google Scholar] [CrossRef] [Green Version]
  54. Palestinian Central Bureau of Statistics (PCBS). Statistical Year Book of Palestine; PCBS: Ramallah, Palestine, 2017.
  55. El Baba, M.; Kayastha, P.; Huysmans, M.; De Smedt, F. Evaluation of the groundwater quality using the water quality index and geostatistical analysis in the Dier al-Balah Governorate, Gaza Strip, Palestine. Water 2020, 12, 262. [Google Scholar] [CrossRef] [Green Version]
  56. Ajjur, S.B.; Mogheir, Y.K. Flood hazard mapping using a multi-criteria decision analysis and GIS (case study Gaza Governorate, Palestine). Arab. J. Geosci. 2020, 13, 1–11. [Google Scholar] [CrossRef]
  57. Miller, A.J. Assessing landslide susceptibility by incorporating the surface cover index as a measurement of vegetative cover. Land Degrad. Dev. 2013, 24, 205–227. [Google Scholar] [CrossRef]
  58. Mojaddadi, H.; Pradhan, B.; Nampak, H.; Ahmad, N.; Ghazali AH, B. Ensemble machine-learning-based geospatial approach for flood risk assessment using multi-sensor remote-sensing data and GIS. Geomatics. Nat. Hazards Risk 2017, 8, 1080–1102. [Google Scholar] [CrossRef] [Green Version]
  59. Tehrany, M.S.; Pradhan, B.; Jebur, M.N. Flood susceptibility mapping using a novel ensemble weights-of-evidence and support vector machine models in GIS. J. Hydrol. 2014, 512, 332–343. [Google Scholar] [CrossRef]
  60. Pham, B.T.; Tien Bui, D.; Dholakia, M.B.; Prakash, I.; Pham, H.V. A Comparative Study of Least Square Support Vector Machines and Multiclass Alternating Decision Trees for Spatial Prediction of Rainfall-Induced Landslides in a Tropical Cyclones Area. Geotech. Geol. Eng. 2016, 34, 1807–1824. [Google Scholar] [CrossRef]
  61. Kalantar, B.; Ueda, N.; Idrees, M.O.; Janizadeh, S.; Ahmadi, K.; Shabani, F. Forest Fire Susceptibility Prediction Based on Machine Learning Models with Resampling Algorithms on Remote Sensing Data. Remote Sens. 2020, 12, 3682. [Google Scholar] [CrossRef]
  62. Chen, W.; Yan, X.; Zhao, Z.; Hong, H.; Bui, D.T.; Pradhan, B. Spatial prediction of landslide susceptibility using data mining-based kernel logistic regression, naive Bayes and RBFNetwork models for the Long County area (China). Bull. Eng. Geol. Environ. 2019, 78, 247–266. [Google Scholar] [CrossRef]
  63. McLafferty, S.L. GIS and health care. Annu. Rev. Public Health 2003, 24, 25–42. [Google Scholar] [CrossRef]
  64. Maantay, J.A.; Maroko, A.R.; Herrmann, C. Mapping population distribution in the urban environment: The Cadastral-based expert dasymetric system (CEDS). Cartogr. Geogr. Inf. Sci. 2007, 34, 77–102. [Google Scholar] [CrossRef]
  65. Devkota, K.C.; Regmi, A.D.; Pourghasemi, H.R.; Yoshida, K.; Pradhan, B.; Ryu, I.C.; Dhital, M.R.; Althuwaynee, O.F. Landslide susceptibility mapping using certainty factor, index of entropy and logistic regression models in GIS and their comparison at Mugling-Narayanghat road section in Nepal Himalaya. Nat. Hazards 2013, 65, 135–165. [Google Scholar] [CrossRef]
  66. Youzi, H.; Nemati, G.; Emamgholi, S. The Optimized Location of Hospital Using an Integrated Approach GIS and Analytic Hierarchy Process: A Case Study of Kohdasht City. Int. J. Econ. Manag. Sci. 2018, 7. [Google Scholar] [CrossRef]
  67. Dai, F.C.; Lee, C.F. Landslide characteristics and slope instability modeling using GIS, Lantau Island, Hong Kong. Geomorphology 2002, 42, 213–228. [Google Scholar] [CrossRef]
  68. Ayalew, L.; Yamagishi, H.; Ugawa, N. Landslide susceptibility mapping using GIS-based weighted linear combination, the case in Tsugawa area of Agano River, Niigata Prefecture, Japan. Landslides 2004, 1, 73–81. [Google Scholar] [CrossRef]
  69. Gómez, H.; Kavzoglu, T. Assessment of shallow landslide susceptibility using artificial neural networks in Jabonosa River Basin, Venezuela. Eng. Geol. 2005, 78, 11–27. [Google Scholar] [CrossRef]
  70. Lawther, A. The Application of GIS-Based Binary Logistic Regression for Slope Failure Susceptibility Mapping in the Western Grampian Mountains, Scotland. 2008. Available online: http://lup.lub.lu.se/student-papers/record/3558914 (accessed on 4 November 2021).
  71. Conforti, M.; Pascale, S.; Robustelli, G.; Sdao, F. Evaluation of prediction capability of the artificial neural networks for mapping landslide susceptibility in the Turbolo River catchment (northern Calabria, Italy). Catena 2014, 113, 236–250. [Google Scholar] [CrossRef]
  72. Moore, I.D.; Wilson, J.P. Length-slope factors for the revised universal soil loss equation: Simplified method of estimation. J. Soil Water Conserv. 1992, 47, 423–428. [Google Scholar]
  73. Bui, D.T.; Ho, T.C.; Revhaug, I.; Pradhan, B.; Nguyen, D.B. Landslide susceptibility mapping along the national road 32 of Vietnam using GIS-based J48 decision tree classifier and its ensembles. In Cartography from Pole to Pole; Springer: Berlin/Heidelberg, Germany, 2014; pp. 303–317. [Google Scholar]
  74. Beven, K.J.; Kirkby, M.J.; Kirkby, A.J. A physically based, variable contributing area model of basin hydrology/Un modèle à base physique de zone d’appel variable de l’hydrologie du bassin versant) A physically based, variable contributing area model of basin hydrology/Un modèle à base physique de zone d’appel variable de l’hydrologie du bassin versant A physically based, variable contributing area model of basin hydrology. Hydrol. Sci. J. 1979, 24, 43–69. [Google Scholar] [CrossRef] [Green Version]
  75. Althuwaynee, O.F.; Pradhan, B.; Park, H.J.; Lee, J.H. A novel ensemble bivariate statistical evidential belief function with knowledge-based analytical hierarchy process and multivariate statistical logistic regression for landslide susceptibility mapping. Catena 2014, 114, 21–36. [Google Scholar] [CrossRef]
  76. Riley, S.J.; DeGloria, S.D.; Elliot, R. Index that quantifies topographic heterogeneity. Intermt. J. Sci. 1999, 5, 23–27. [Google Scholar]
  77. Katla, S.; Xu, D.; Wu, Y.; Pan, Q.; Wu, X. DPWeka: Achieving Differential Privacy in WEKA. In Proceedings of the 2017 IEEE Symposium on Privacy-Aware Computing, PAC 2017, Washington, DC, USA, 1–4 August 2017. [Google Scholar] [CrossRef] [Green Version]
  78. Hall, M. Correlation-Based Feature Selection for Discrete and Numeric Class Machine Learning. Ph.D. Thesis, University of Waikato, Hamilton, New Zealand, 2000. [Google Scholar]
  79. Pourhashemi, S.; Mashalizadeh, A. A Novel Feature Selection Method Using CFS with Greedy-Stepwise Search Algorithm in e-mail Spam Filtering; AMO—Advanced Modeling and Optimization: 2013. Available online: https://camo.ici.ro/journal/vol15/v15c21.pdf (accessed on 4 November 2021).
  80. Guyon, I.; Elisseeff, A. An introduction to variable and feature selection. J. Mach. Learn. Res. 2003, 3, 1157–1182. [Google Scholar]
  81. Mayfield, C.J. Automating the Classification of Thematic Rasters for Weighted Overlay Analysis in GeoPlanner for ArcGIS. Ph.D. Thesis, University of Redlands, Redlands, CA, USA, 2015. [Google Scholar]
  82. Borra, S.; Di Ciaccio, A. Measuring the prediction error. A comparison of cross-validation, bootstrap and covariance penalty methods. Comput. Stat. Data Anal. 2010, 54, 2976–2989. [Google Scholar] [CrossRef]
  83. Azeez, O.S.; Pradhan, B.; Shafri, H.Z.; Shukla, N.; Lee, C.W.; Rizeei, H.M. Modeling of CO emissions from traffic vehicles using artificial neural networks. Appl. Sci. 2019, 9, 313. [Google Scholar] [CrossRef] [Green Version]
  84. Idrees, M.O.; Pradhan, B. Hybrid Taguchi-Objective Function optimization approach for automatic cave bird detection from terrestrial laser scanning intensity image. Int. J. Speleol. 2016, 45, 289–301. [Google Scholar] [CrossRef] [Green Version]
  85. Murata, N.; Yoshizawa, S.; Amari, S.I. Network information criterion-determining the number of hidden units for an artificial neural network model. IEEE Trans. Neural Netw. 1994, 5, 865–872. [Google Scholar] [CrossRef] [Green Version]
  86. Huang, S.; Cai, N.; Pacheco, P.P.; Narrandes, S.; Wang, Y.; Xu, W. Applications of support vector machine (SVM) learning in cancer genomics. Cancer Genom. Proteom. 2018, 15, 41–51. [Google Scholar]
  87. Noble, W.S. What is a support vector machine? Nat. Biotechnol. 2006, 24, 1565. [Google Scholar] [CrossRef]
  88. Krell, M.M. Generalizing, decoding, and optimizing support vector machine classification. arXiv preprint 2018, arXiv:1801.04929. [Google Scholar]
  89. Hoang, N.D.; Bui, D.T.; Liao, K.W. Groutability estimation of grouting processes with cement grouts using differential flower pollination optimized support vector machine. Appl. Soft Comput. 2016, 45, 173–186. [Google Scholar] [CrossRef]
  90. Hoang, N.D.; Tien Bui, D. A novel relevance vector machine classifier with cuckoo search optimization for spatial prediction of landslides. J. Comput. Civ. Eng. 2016, 30, 04016001. [Google Scholar] [CrossRef]
Figure 1. Neural network (MLP) model.
Applsci 11 11054 g001
Figure 2. Map of the study area showing Palestine (a) and the Gaza Strip (b).
Applsci 11 11054 g002
Figure 3. Overall methodological flowchart.
Applsci 11 11054 g003
Figure 4. Conditioning factors considered for the hospital site suitability; (a) elevation altitude, (b) slope surface, (c) plan curvature, (d) topographic wetness index, (e) topographic roughness index, (f) stream power index, (g) distance from road, (h) distance from river, (i) distance from main road (j) distance from residential, (k) distance from agriculture, (l) distance from refugee camps (m) population size, (n) population density, and (o) no−go zone.
Applsci 11 11054 g004aApplsci 11 11054 g004bApplsci 11 11054 g004cApplsci 11 11054 g004d
Figure 5. Comparative plot of the ROC curve for MLP, SVM, and LR.
Applsci 11 11054 g005
Figure 6. Suitability map produced using (a) multilayer perceptron, (b) support ector machine, and (c) linear regression models.
Applsci 11 11054 g006aApplsci 11 11054 g006b
Table 1. Relative influence (%) of the effective parameters.
ParametersValuesRelative Influence %
Population densityDensity of population100%
RoadDistance from the road100%
Main roadDistance from the main road90%
ResidentialDistance from the residential90%
AgricultureDistance from the agriculture70%
PopulationPopulations number70%
SlopeSlope degree60%
CurvaturePlan curvature50%
Prohibited zoneNo-go zone40%
AltitudeAltitude20%
Refugee campDistance from the refugee camp20%
RiverDistance from the river10%
TRITopographic roughness index0%
TWITopographic wetness index0%
SPIStream power index0%
Table 2. Model validation result: area under the curve and CFS 10-fold cross correlation.
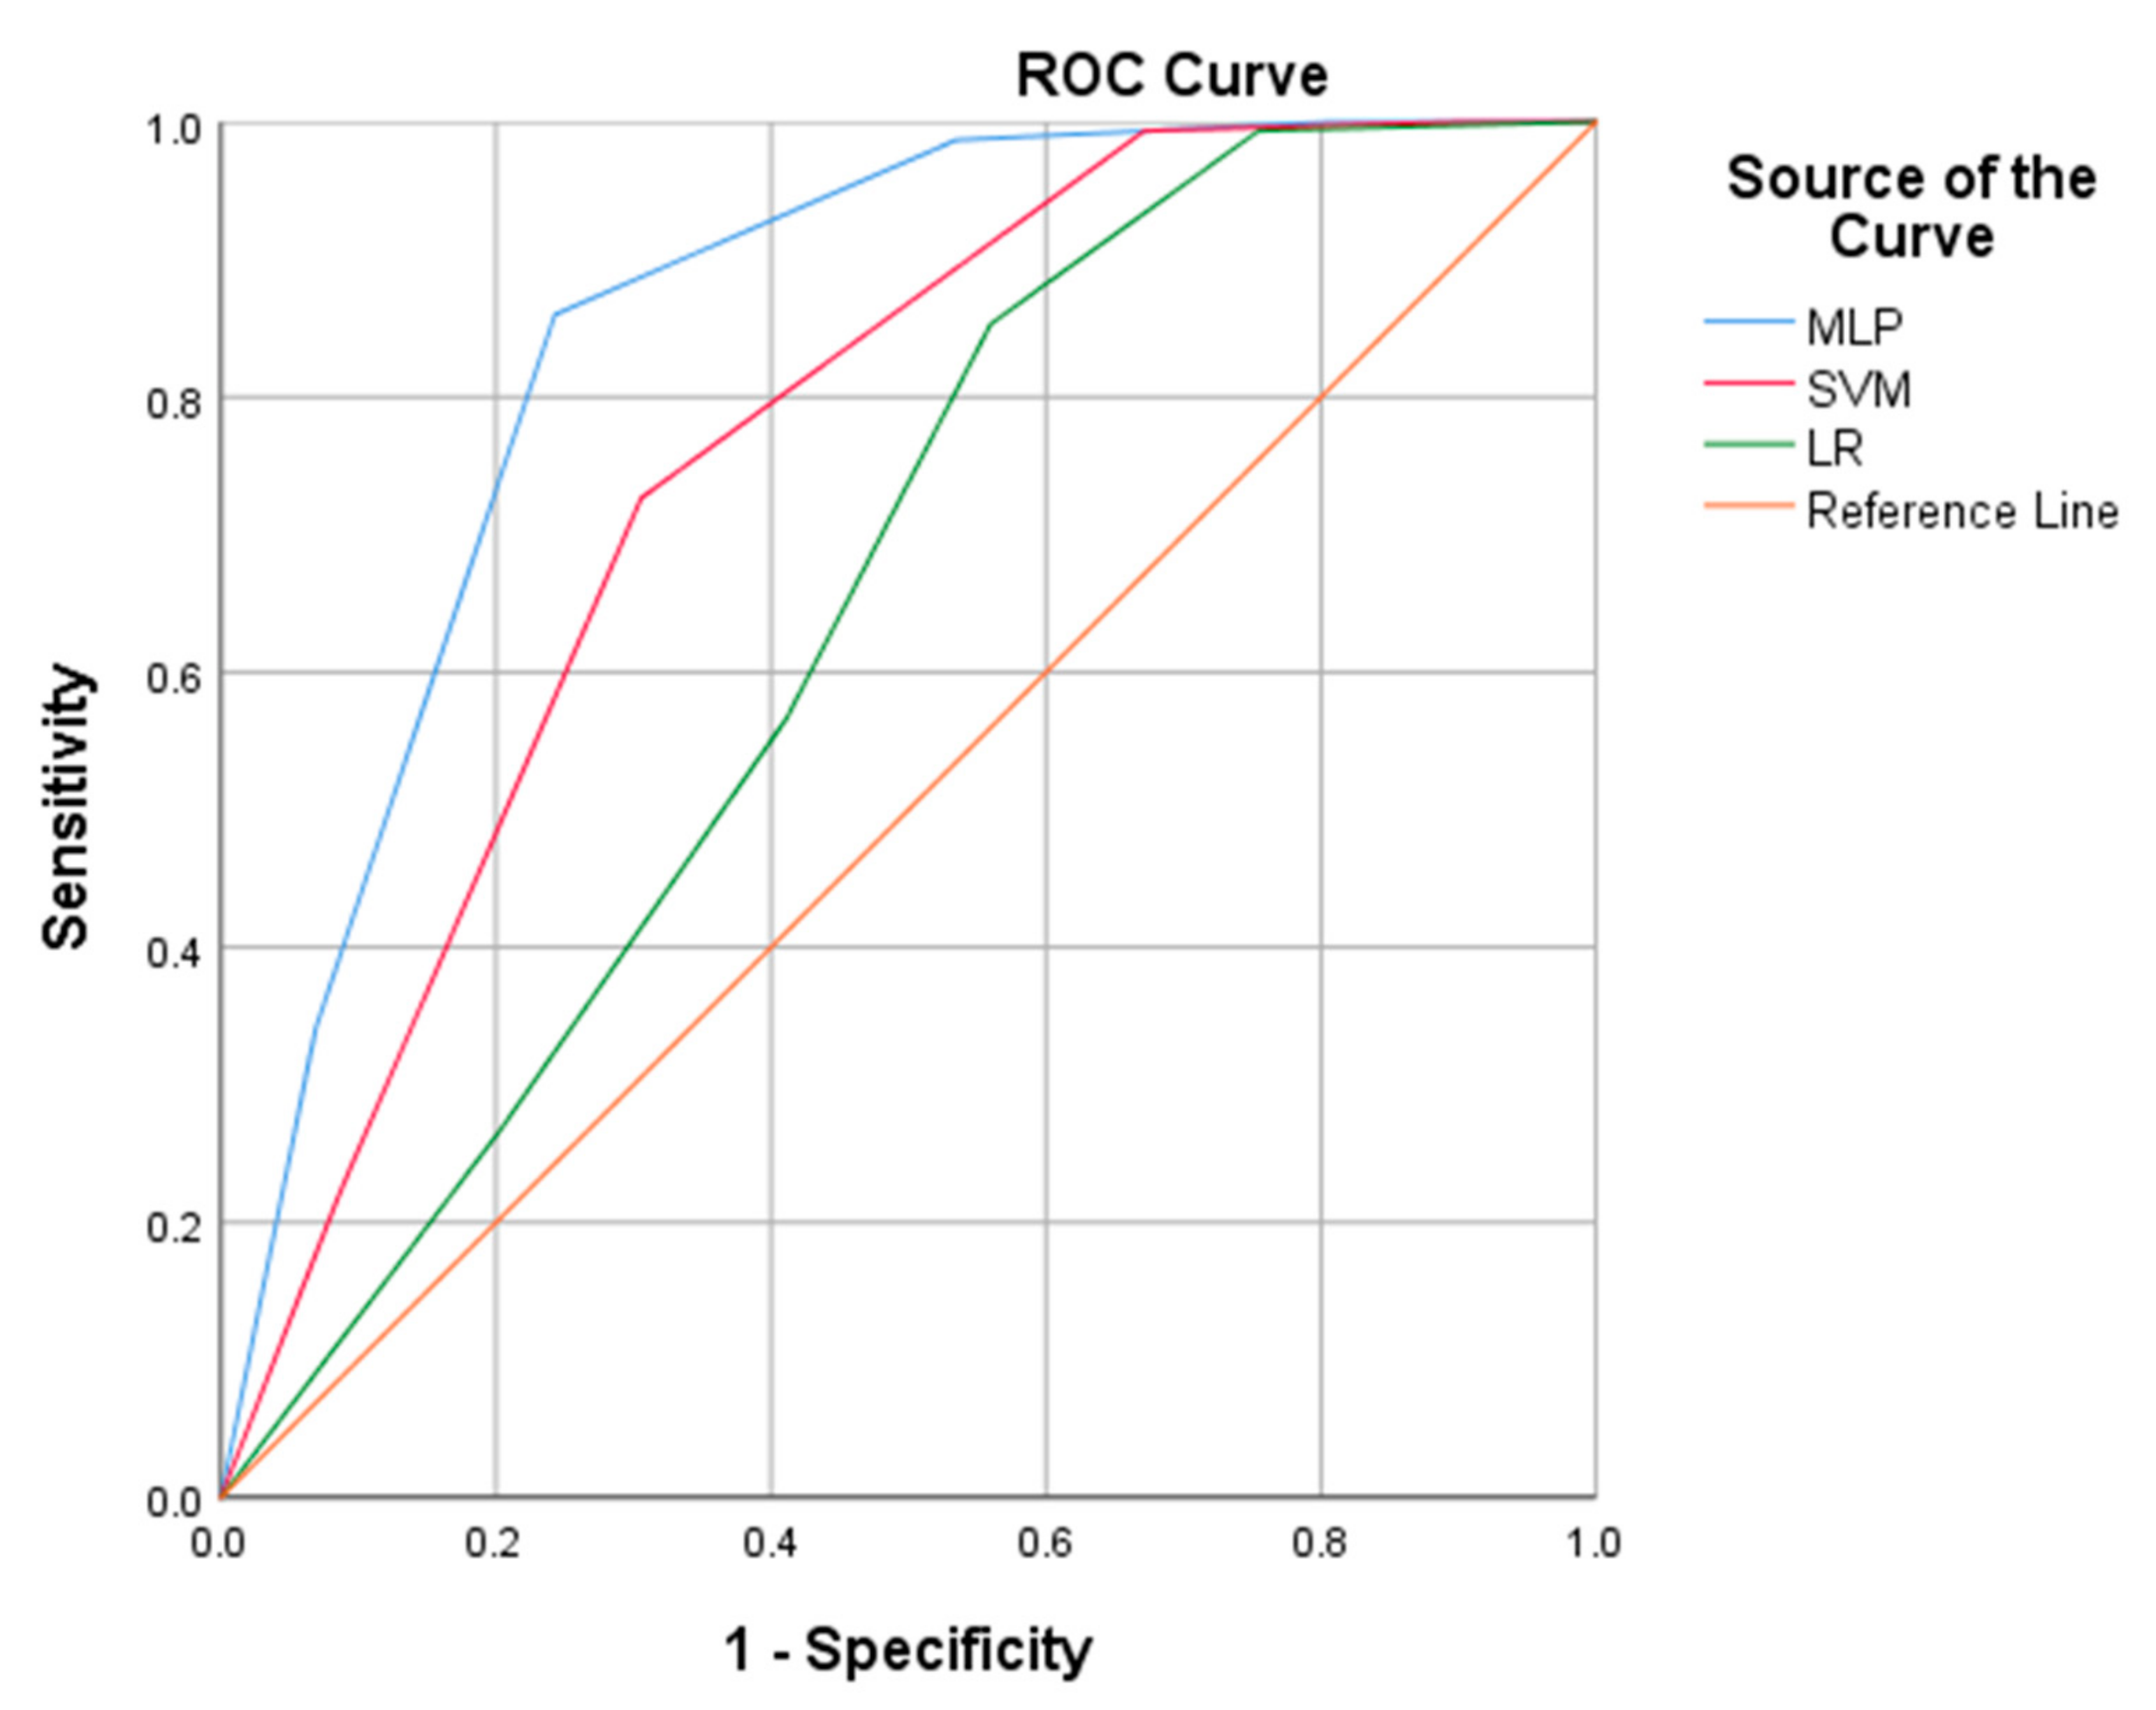
95% Confidence Interval
Model AUCStd ErrorLower BoundUpper Bound
MLP 0.8490.0170.8160.883
SVM 0.7560.0210.7140.798
LR 0.6440.0240.5960.692
10-Fold cross-correlation method
R2MAERMSERAE(%)RRSE(%)
MLP0.9250.0700.23113.6225.20
SVM0.9400.0110.0014.1812.23
LR0.7510.2540.31019.7340.58
Publisher’s Note: MDPI stays neutral with regard to jurisdictional claims in published maps and institutional affiliations.

