Article

Response of Biological Gold Nanoparticles to Different pH Values: Is It Possible to Prepare Both Negatively and Positively Charged Nanoparticles?

1
Institute of Microbiology, Czech Academy of Sciences, 142 20 Prague, Czech Republic
2
Department of Medical Sciences, Shahrood Branch, Islamic Azad University, Shahrood 4318936199, Iran
3
Center of Molecular Structure, Institute of Biotechnology, Czech Academy of Sciences, 252 50 Prague, Czech Republic
*
Author to whom correspondence should be addressed.
Both with the same contributions and preferably as first authors.
Submission received: 7 November 2021 / Revised: 27 November 2021 / Accepted: 2 December 2021 / Published: 6 December 2021

Abstract

:
The mycelium-free supernatant (MFS) of a five-day-old culture medium of Fusarium oxysporum was used to synthesize gold nanoparticles (AuNPs). The experimental design of the study was to answer the question: can this production process of AuNPs be controllable like classical chemical or physical approaches? The process of producing AuNPs from 1 mM tetrachloroauric (III) acid trihydrate in MFS was monitored visually by color change at different pH values and quantified spectroscopically. The produced AuNPs were analyzed by transmission electron microscopy, scanning electron microscopy, and energy-dispersive X-ray spectroscopy. The presence of capping agents was confirmed by Fourier transform infrared spectroscopy (FTIR). Two AuNP samples with acidic and alkaline pH were selected and adjusted with the pH gradient and analyzed. Finally, the size and zeta potential of all samples were determined. The results confirmed the presence of the proteins as capping agents on the surface of the AuNPs and confirmed the production of AuNPs at all pH values. All AuNP samples exhibited negative zeta potential, and this potential was higher at natural to alkaline pH values. The size distribution analysis showed that the size of AuNPs produced at alkaline pH was smaller than that at acidic pH. Since all samples had negative charge, we suspect that there were other molecules besides proteins that acted as capping agents on the surface of the AuNPs. We conclude that although the biological method of nanoparticle production is safe, green, and inexpensive, the ability to manipulate the nanoparticles to obtain both positive and negative charges is limited, curtailing their application in the medical field.

1. Introduction

There are many different types of nanoparticles (NPs) used in science and technology. However, only some of them, such as gold (AuNPs), silver (AgNPs), and some metal oxide NPs, which are known to be biocompatible, non-toxic, or moderately toxic, are used in the medical field. Gold nanoparticles exhibit specific optical properties due to the fact of their localized surface plasmon resonance (LSPR), which can be modulated by adjusting their size and shape [1,2]. Due to the fact of their special physical properties, they have been used in analytical systems [3], biological imaging [4,5,6], and photothermal therapy [7]. Another notable application of AuNPs is their use as drug [8] and gene delivery systems [9,10,11] in cancer treatment [12]. There are three basic approaches to producing NPs, referred to as physical, chemical, and biological techniques, and each has its advantages and disadvantages [13,14]. Although a high percentage of NP production utilizes physical and chemical methods, there has recently been an increased focus on using biological processes or their products in NP production. This is due to the improved properties of NPs in terms of biocompatibility and an environmentally friendly means of production [13,15].
Filamentous fungi are eukaryotic microorganisms that colonize almost every ecological niche on Earth. Being indispensable players in the carbon cycle, they are essential members of the ecosystem [16,17]. They are also important pathogens of plants [18], animals, and humans [19,20]. Nevertheless, fungi have great potential in industrial utilization in many biotechnological applications [21]. The biotechnological synthesis of NPs is one of these applications. Many filamentous fungal strains have been investigated for their use in the biological synthesis of AuNPs including the mesophilic genera Aspergillus, Penicillium, Fusarium, Trichoderma, Paecilomyces, Rhizopus, Chaetomium, and Stemphylium [22,23]. A set of 27 thermophilic genera was also tested [14]. In the biological synthesis method, the nanoparticles are usually reduced by intracellular microbial products, such as enzymes or extracellular substances, that include proteins, polysaccharides, and other secreted biomaterials [24]. Thus, the NP reduction process can take place inside or outside the microbial cells, and the reducing agents and the reduction process can be enzymatic or non-enzymatic [24]. An inherent feature of all these different types of bioreduction is that the microbial products also serve as capping agents that cover the surface of the produced NPs. Some of these agents are proteins, and their presence on the surface of the NPs affects the stability of the nanoparticles and prevents their aggregation [25]. These capping agents are responsible for the surface zeta potential of unmodified AuNPs. Several techniques are available to detect the presence of capping agents on NP surfaces such as Fourier transform infrared spectroscopy (FTIR) and sodium dodecyl sulfate-polyacrylamide gel electrophoresis (SDS-PAGE) [25]. In this report, we analyzed the response of the capping agents (secreted by Fusarium oxysporum into the culture medium) to pH variations before and after AuNP production. The experiments aimed to evaluate the relationship between the pH variations and the zeta potential, size, and agglomeration of the final AuNPs. The obtained characteristics of AuNPs after biological production could enable us to understand their activity under physiological conditions and help to answer the fundamental question: can this fungal production of AuNPs be a controllable process like the other non-biological methods?

2. Experimental

2.1. Microbial Strain and Culture Condition

For this study, F. oxysporum was acquired from the Culture Collection of Fungi of Charles University (CCF 3732, isolated from waste bags in Bohemia, Czech Republic). It was cultured in Sabouraud Dextrose Broth (SDB) at 30 °C for 5 days with shaking (150 rpm) to release its enzymes and extracellular material [26].

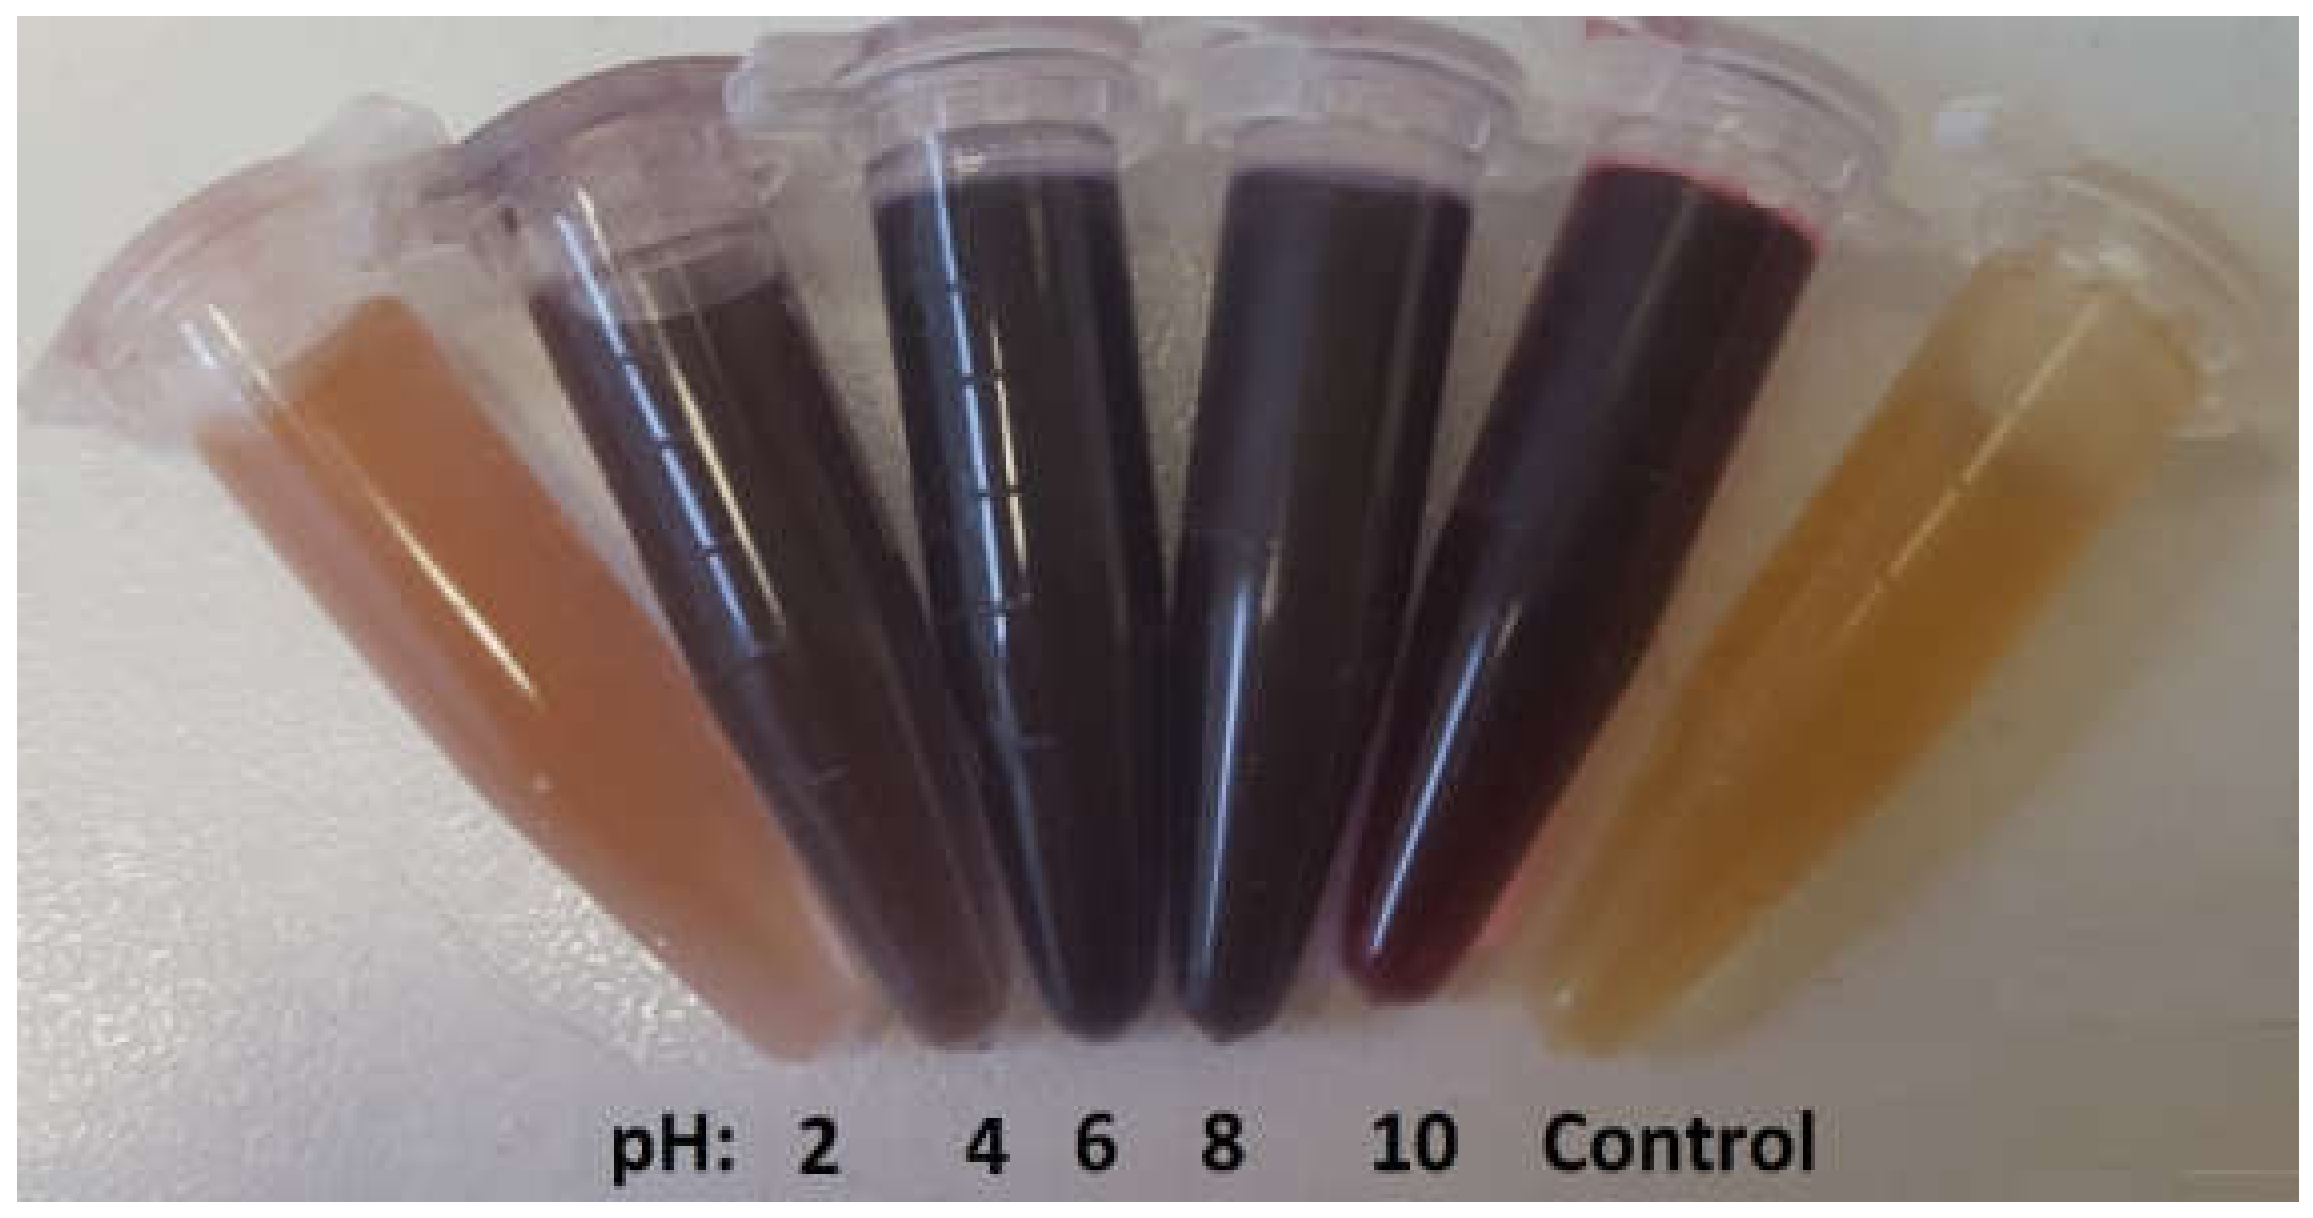
2.2. pH Adjustment Prior to AuNP Production

The mycelium-free supernatant was used for AuNP production. The mycelia were separated by centrifugation at 8228 rcf for 10 min, and 100 mL of the obtained supernatant was divided into five flasks (20 mL each). Twenty microliters µL of HAuCl4·3H2O (Sigma–Aldrich, Prague, Czech Republic) solution in ddH2O were added to each flask at a final concentration of 1 mmol. To analyze the effects of pH variation on the size and zeta potential of AuNPs, the mycelium-free supernatant vials were adjusted to final pH values of 2, 4, 6, 8, and 10 with 1 molar solution of HCl and/or NaOH. The HCl and/or NaOH volumes that were used varied from 10 to 100 µL based on the pH that was chosen. The flasks were incubated at 37 °C and 200 rpm for 24 h. A flask containing fresh SDB medium containing 1 mM HAuCl4 was incubated in parallel and used as a control.

2.3. Visible Light Spectrophotometry

After incubation of the samples, the color of the fungal supernatant changed from the original yellow color to different shades due to the nanoparticle LSPR, proving AuNP production. The absorption curves of the samples were observed at wavelengths of 400–700 nm using a NanoDrop spectrophotometer (Thermo Fisher Scientific, Waltham, MA, USA). Fresh SDB medium was used as a blank, and a maximum absorbance peak (MAP) at 500–550 nm indicated that AuNP synthesis occurred [26].

2.4. Purification of AuNPs

AuNPs were washed with ddH2O. The samples were centrifuged at 22,000 rcf for 30 min, and the pellet was dissolved in ddH2O. This procedure was repeated three times, and the AuNPs were dispersed in ddH2O and used for further analyses [26].

2.5. Transmission Electron Microscopy (TEM) for AuNPs Samples with pH Adjusted Prior to Production

The shapes and sizes of the prepared AuNPs were determined using a Philips CM100 TEM (Philips EO, Eindhoven, The Netherlands). In this step, the samples prepared at pH 2, 6, and 10 were analyzed. A 5 µL drop of each sample was applied to the glow-discharge-activated Cu carbon-coated grid (30 s, 1 kV, 10 mA) and after 30 s of adsorption, the sample was blotted with filter paper and air-dried at room temperature. Analysis TEM was performed at 80 kV. Digital images, 2048 × 2048 px at a 14 bit depth, were obtained with a Veleta slow-scan CCD camera (EMSIS, Muenster, Germany) [27]. The size of the AuNPs in the selected samples was determined from the digital images taken at a magnification of 0.28 nm using the “Analysis modul” of the AnalySis software suite v.5.2 (EMSIS, Muenster, Germany). Statistical processing of the data and graphical outputs were performed in the R environment (R Core Team, 2021) [27].

2.6. Scanning Electron Microscope (SEM) for AuNP Samples with the pH Adjusted Prior to Production

SEM and energy-dispersive X-ray spectroscopy (EDS) were performed using an FEI Nova Nano SEM 450 scanning electron microscope (FEI, Brno, Czech Republic) equipped with an Ametek® EDAX Octane Plus SDD detector and TEAM™ EDS Analysis Systems (AMETEK B.V., Tilburg, The Netherlands). Using EDS analysis, the elemental composition of aggregated and individual nanoparticles was determined. Ten millimeter by ten millimeter glow-discharge-activated silicon wafers and normal silicon wafers were used for sample preparation [28]. A 10 µL drop of the sample was applied to each silicon wafer and air-dried at 56 °C for 4 h. Dried silicon wafers were glued to standard aluminum pins with conductive silver lacquer (Leitsilber, Ropertz-GmbH, Munich, Germany) and air-dried overnight at 56 °C [29].

2.7. Fourier Transform Infrared Spectroscopy (FTIR) Analysis

The surface composition of the AuNPs was determined for one sample using FTIR spectral analysis. Twenty microliters uL of the concentrated water solution of each sample were added to the ATR crystal and incubated for at least 60 min to stabilize the temperature and sediment the particles on the crystal’s surface. The spectrum of AuNP water dispersion was recorded using a Vertex 70v FTIR spectrometer (Bruker Optics GmbH, Ettlingen, Germany) in a BioATRII cell with a ZnSe crystal in the absorption mode. The spectrum was recorded in the MIR range between 900 and 4000 cm−1 against the ddH2O background at 25 °C with a resolution of 4 cm−1. The spectrum represents the average of 128–300 scans [26].

2.8. Size Distribution and Zeta Potential Analyses

The particle size and zeta potential of the AuNPs were determined using a Zetasizer Nano ZS90 instrument (Malvern Panalytical, Malvern, UK), DLS (dynamic light scattering using a non-invasive backscattering technique), and ELS (electrophoretic light scattering) in aqueous dispersion. The parameters of the measurements were colloidal gold, refractive index of 0.18, and absorbance of 3.43. All measurements were performed at room temperature in ZEN2112 (size) DTS and 1070 (zeta potential) cuvettes. Back-scatter technology (174.7) was used for size analysis. Water served as the dispersant and the temperature was 25 °C [30]. In this step, the pH-adjusted samples (i.e., before AuNP production) were analyzed.

2.9. pH Adjustment after AuNP Preparation

The sample that had the best size, zeta potential value, and shape from the previous step and a sample with the same pH of the intact fungal culture were used in this study. Their pH values were adjusted to 2, 4, 6, 8, and 10 with molar solutions of HCl and NaOH. A NanoDrop spectrophotometer was used to analyze the samples (the wavelengths were between 400 and 700 nm, and the blank was ddH2O). The washing of AuNPs was conducted according to the previous section, and the samples were analyzed using TEM and SEM. A Zetasizer Nano ZS90 instrument was used to analyze the size and zeta potential of all samples.

3. Results and Discussion

In this study, AuNPs were prepared using the biological method at different pH values to understand the relationship between the ambient pH and the size, shape, agglomeration, and zeta potential of AuNPs, all of which are directly triggered by the nanoparticle capping agents. We analyzed the manipulation flexibility of such nanoparticles. For this purpose, we adjusted the pH values of the mycelium-free supernatant before and after AuNP production and used serial pH values.

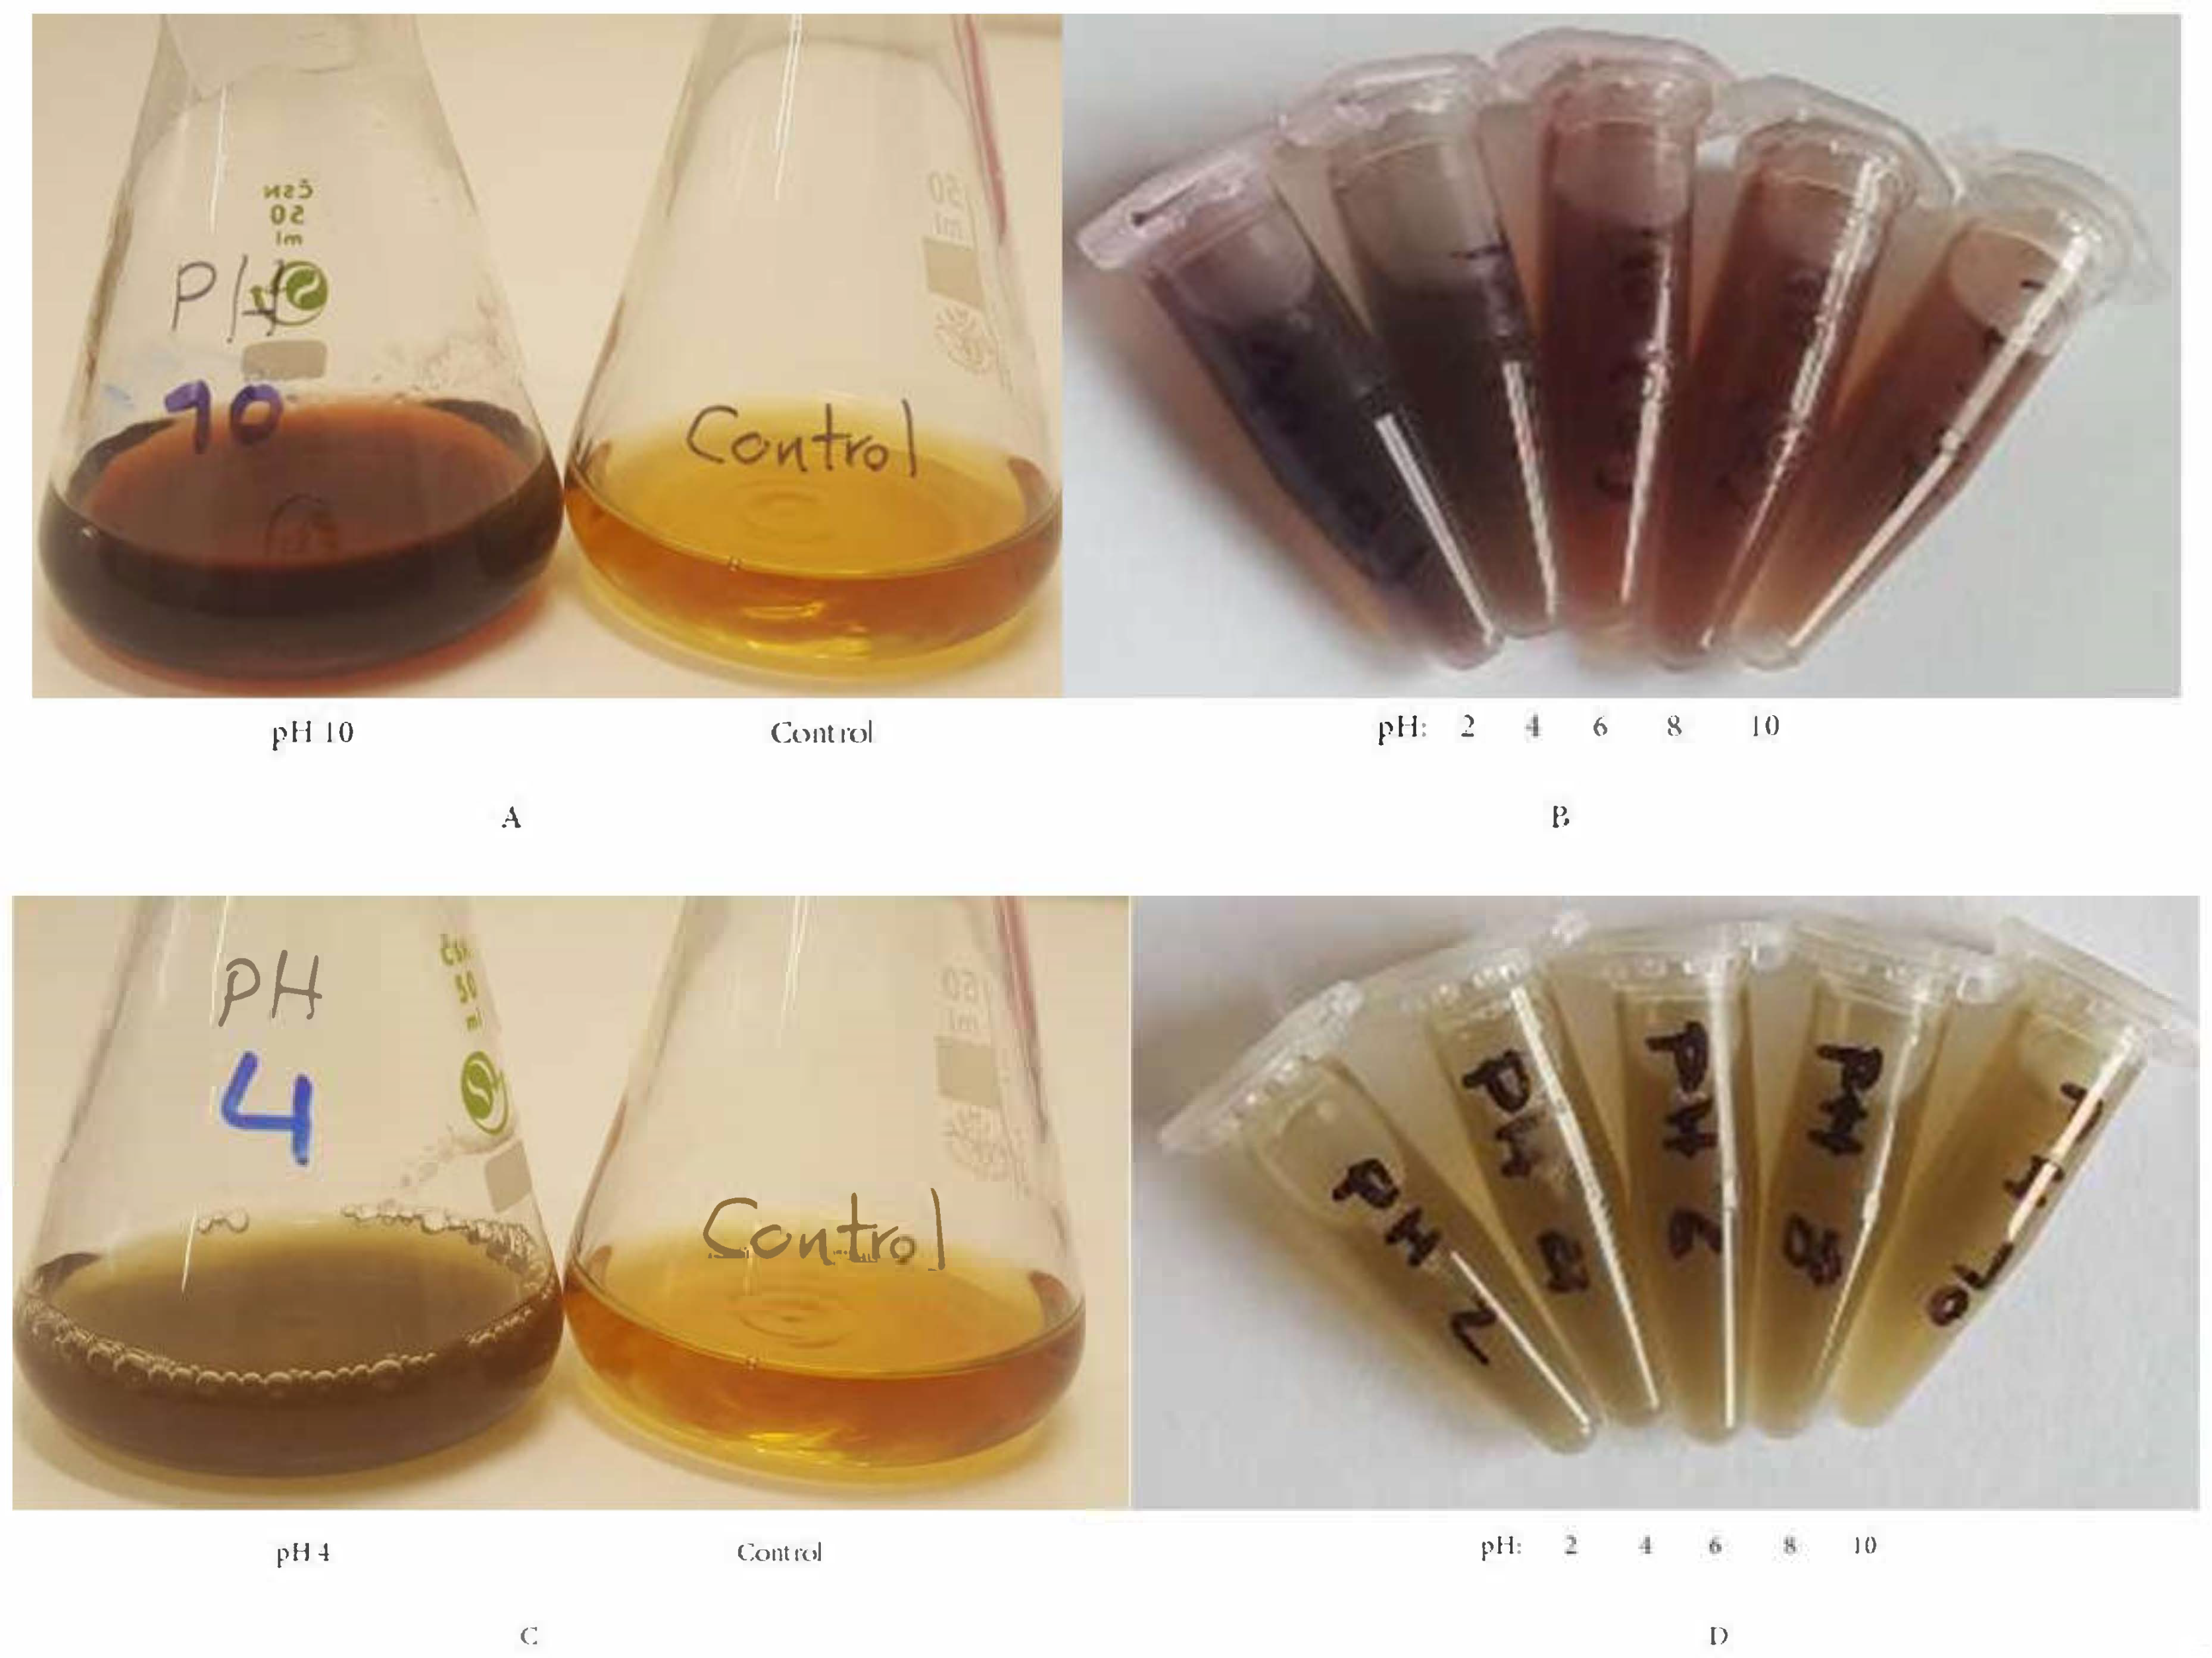
3.1. pH Adjustment before AuNPs Production

After the pH of the mycelium-free supernatant was adjusted to pH 2, 4, 6, 8, and 10 and incubation was performed, color changes were observed in all experimental flasks except the control. Figure 1 shows the color changes of the culture supernatant. Due to the LSPR of AuNPs, a range of colors, such as green, brown, purple, and red, were observed.

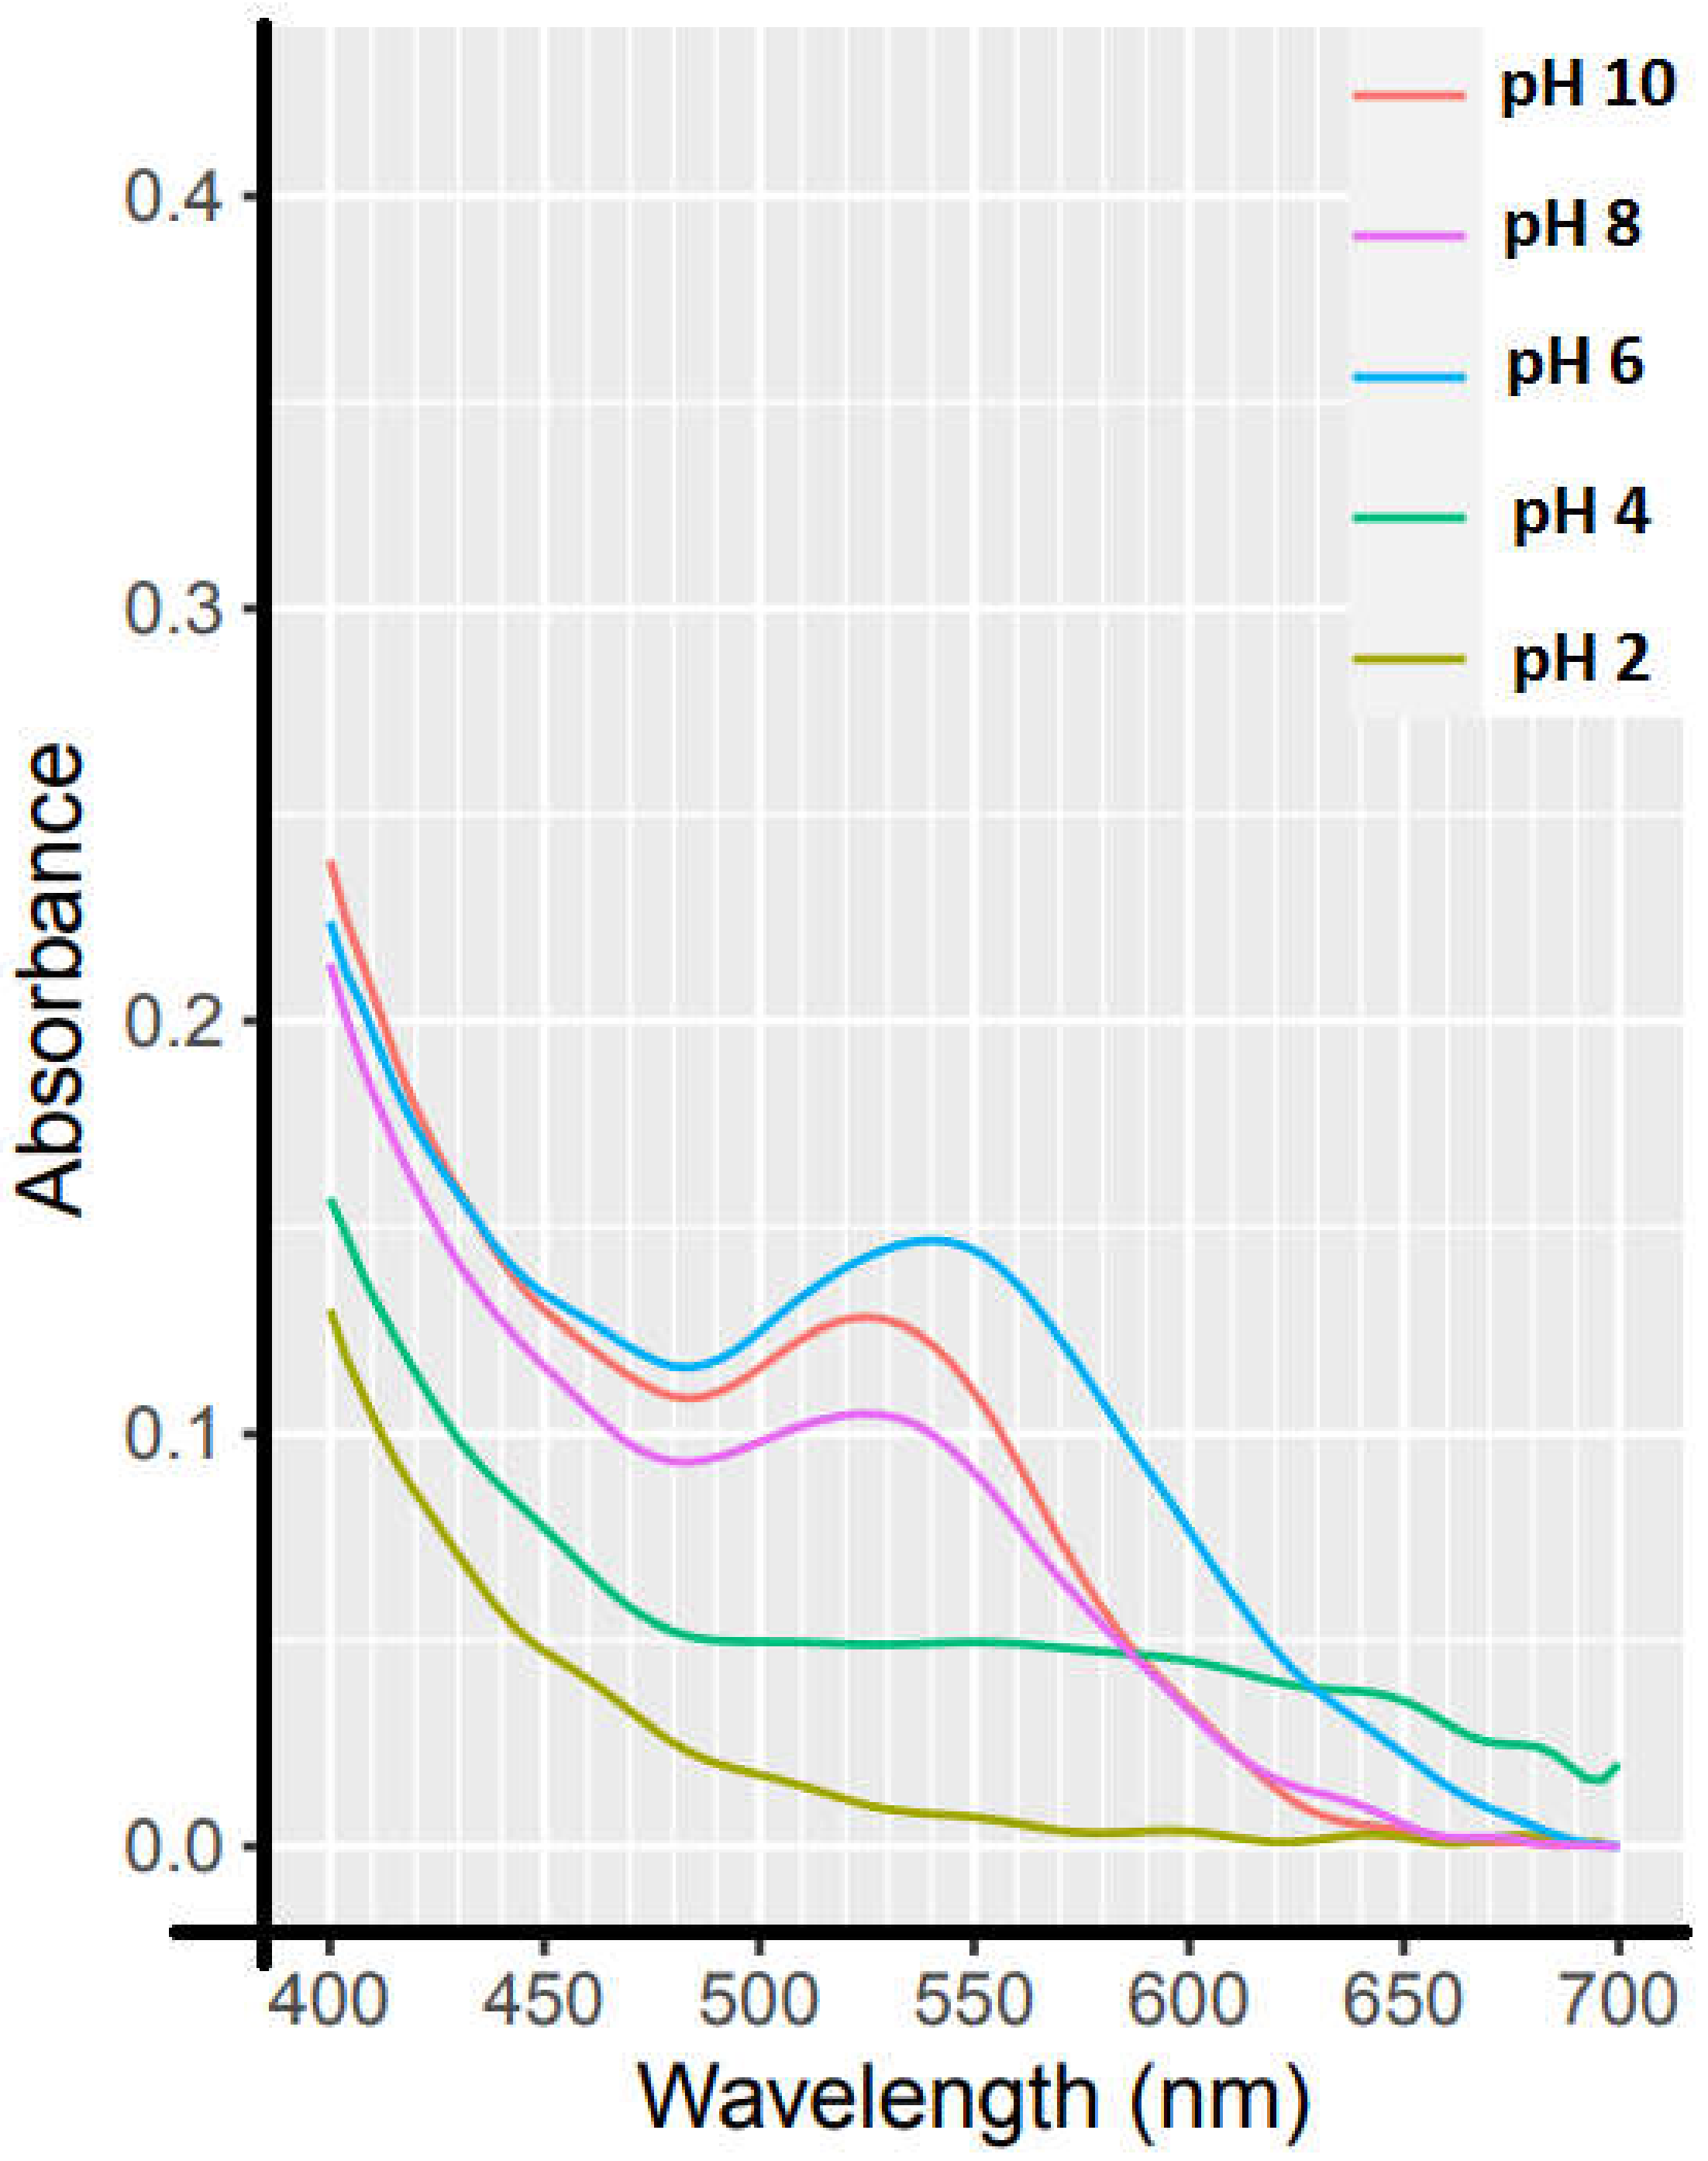
3.2. Visible Light Spectrophotometer

The absorbance curves of the samples were recorded using a NanoDrop spectrophotometer at 400–700 nm. Figure 2 shows the obtained spectra of AuNPs prepared at different pH values (i.e., pH 2, 4, 6, 8, and 10). Most of the spectra showed MAP, but the best one was for the sample with pH 10 at 536 nm. These differences in the AuNP MAPs are related to their unique LSPR properties.
The optical densities (ODs) of some of the samples were more than 1. To obtain more accurate results, all the samples were diluted with ddH2O at a ratio of 1:2.
As can be seen in Figure 2, although most of the samples possessed MAPs, they were not necessarily in the range between 500 and 550 nm. That means some of the samples had larger sizes than usual. As Figure 2 shows, there was no MAP for the sample at pH 2, and there were two MAPs for the sample at pH 4, one in the range of 500–550 nm and the other was in the range of 600–650 nm, which indicate that these two samples were polydispersed. According to Murphy et al., two different MAPs are a sign of the presence of rod-shaped nanoparticles, and one MAP is due to the presence of spheres [31]. Hence, for AuNPs the ones green in color and produced at pH 4 were probably rod-shaped. For pH 2, the produced nanoparticles might be agglomerated, because no MAP was observed. As will be discussed in the TEM part, these data are consistent with the TEM findings.

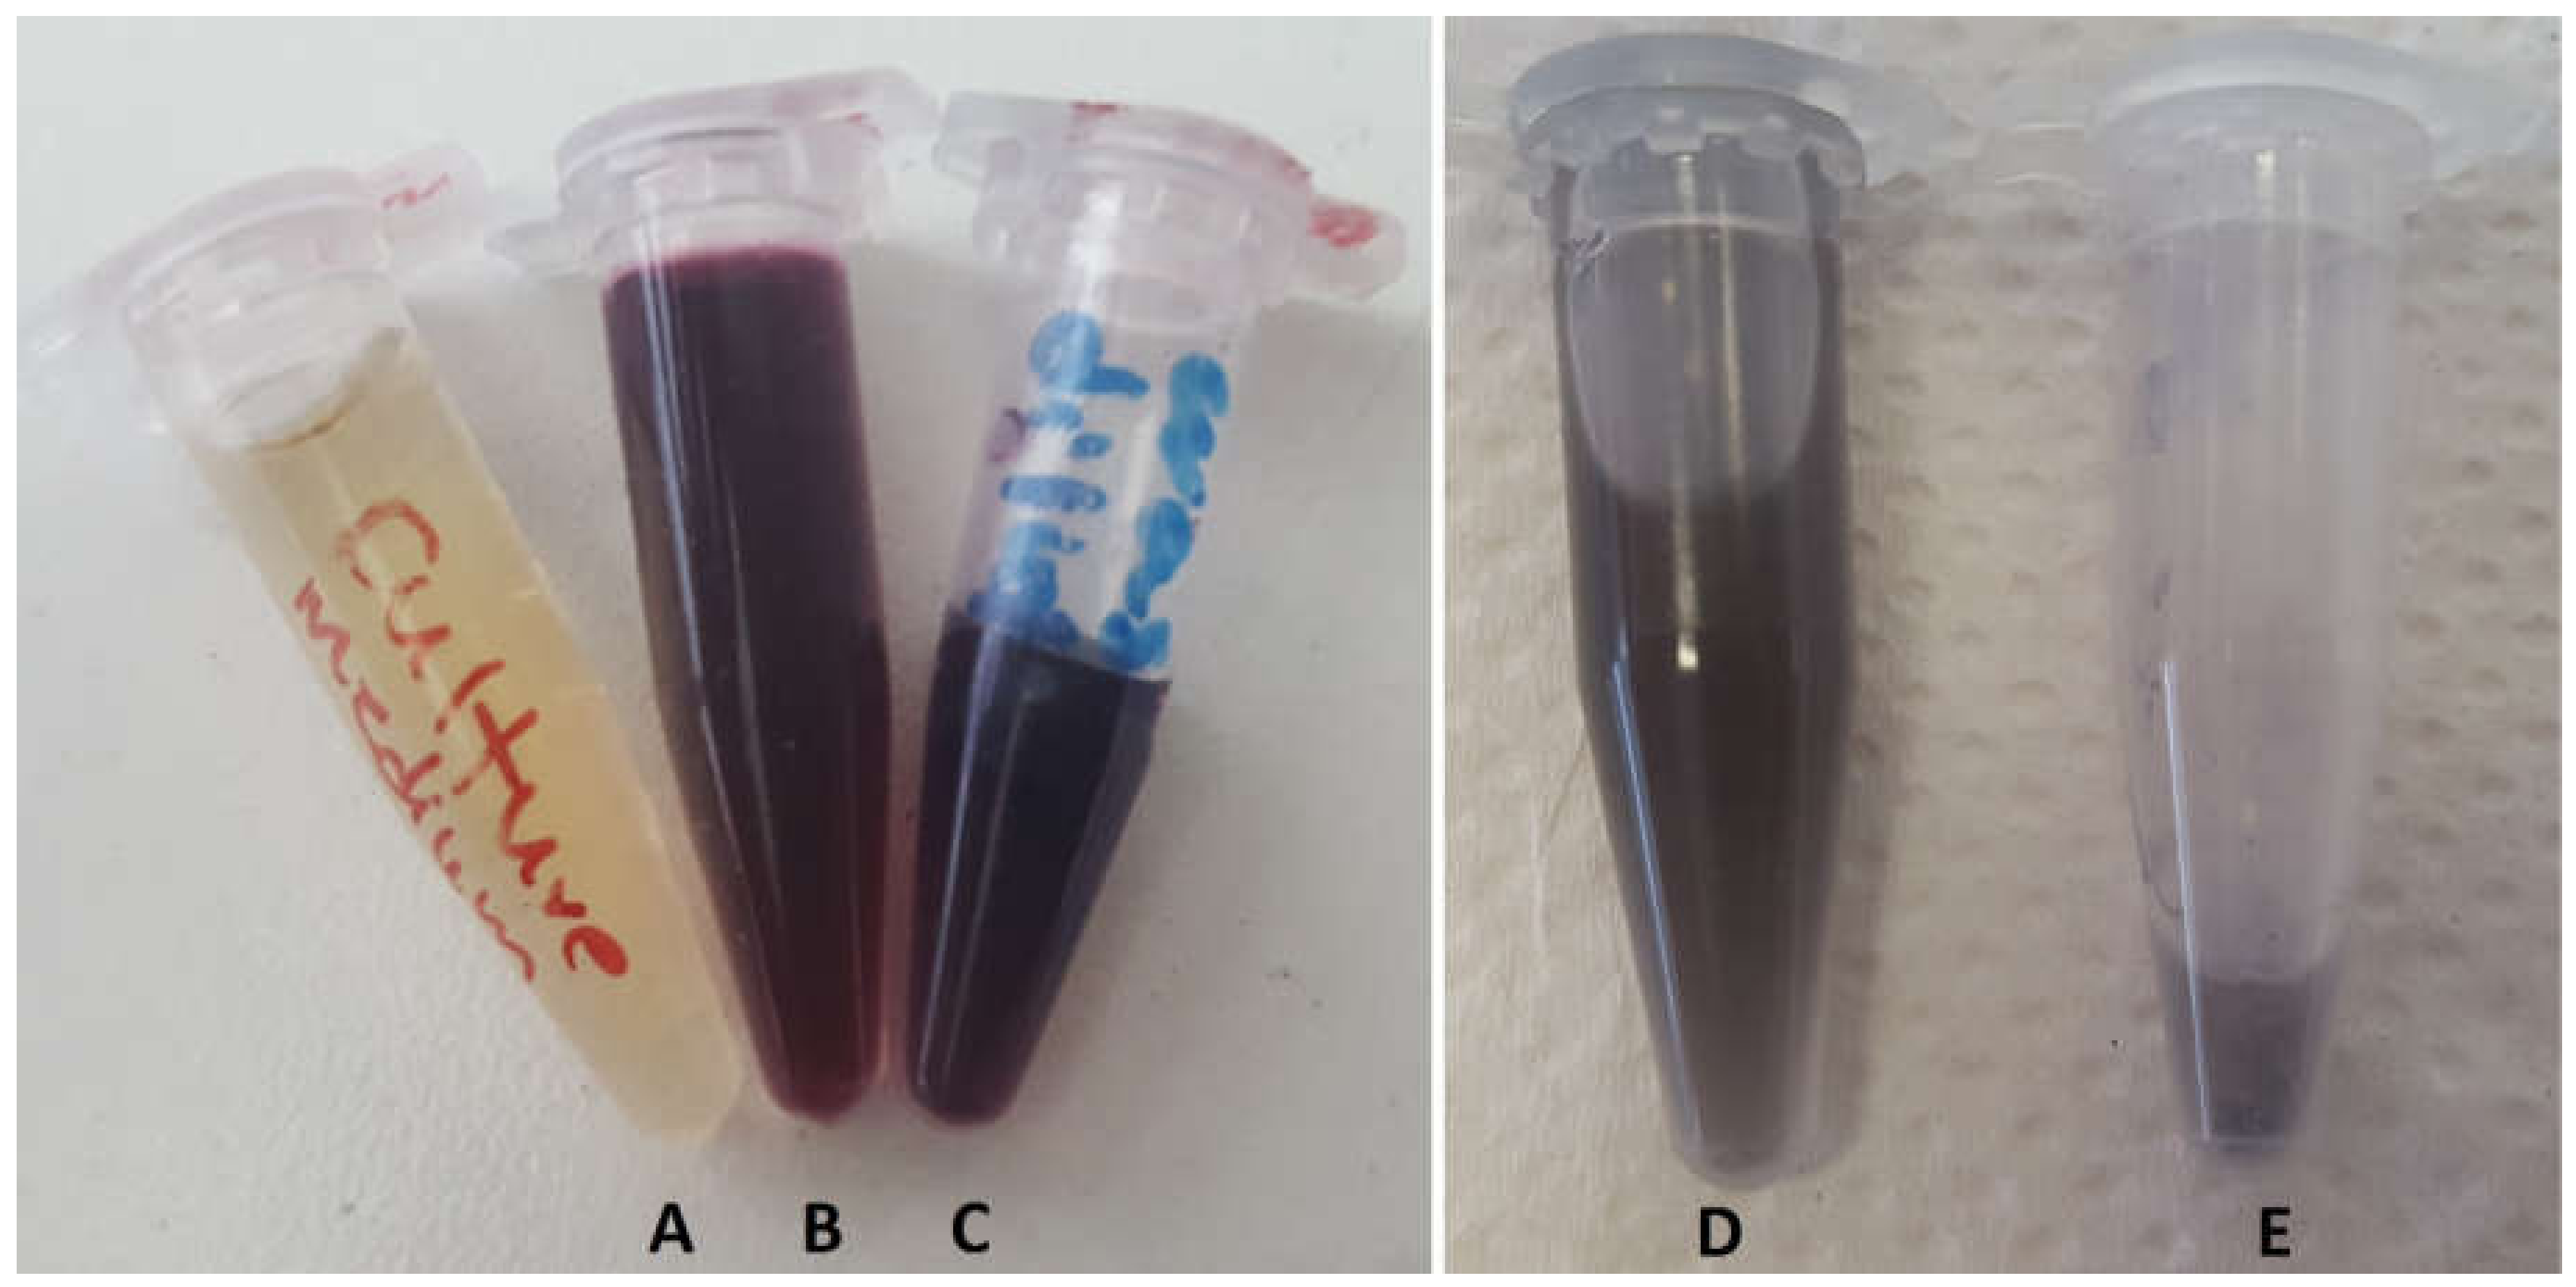
3.3. Purification of the AuNPs

The AuNPs were washed with ddH2O. After washing the samples at pH values of 2 and 4, the resulting sediment was not well dissolved in the ddH2O, and the samples were agglomerated, but that was not seen in the sample with a pH value of 10 (Figure 3). As for the samples at pH 6 and 8, little sedimentation was observed, but most of the nanoparticles were in colloidal form. Therefore, the behavior of the nanoparticles formed at different pH values was different after the washing.

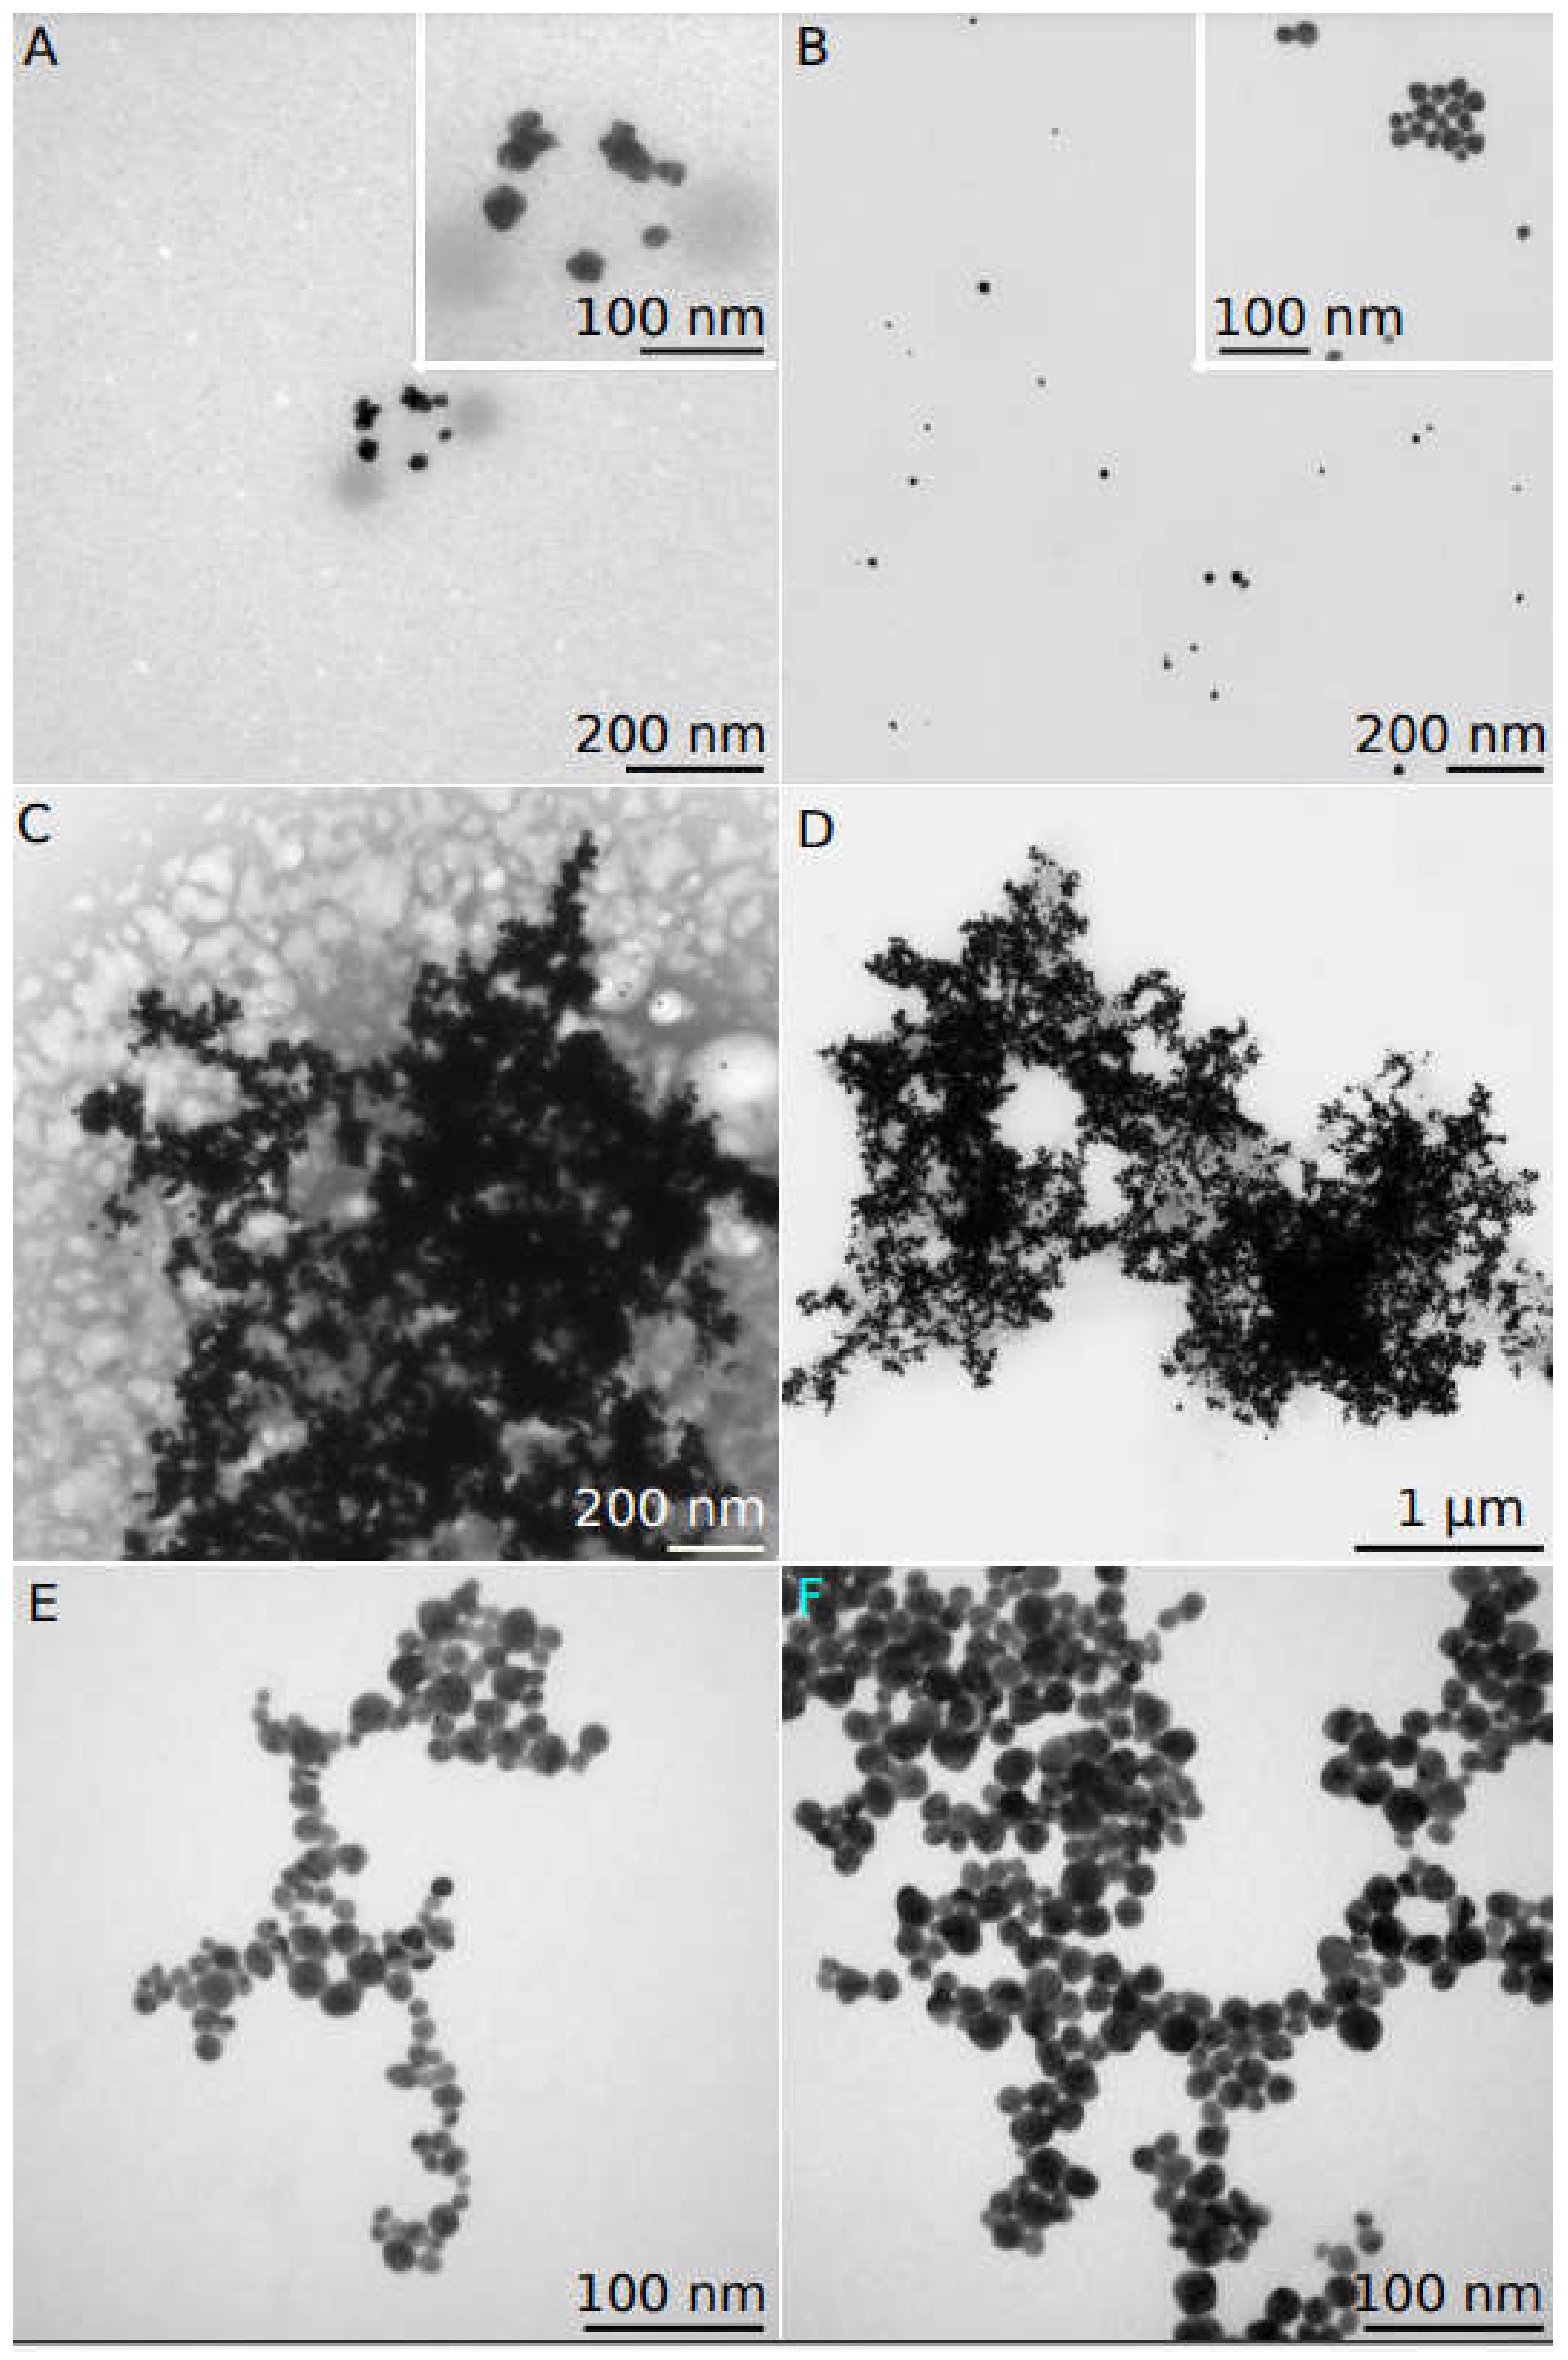
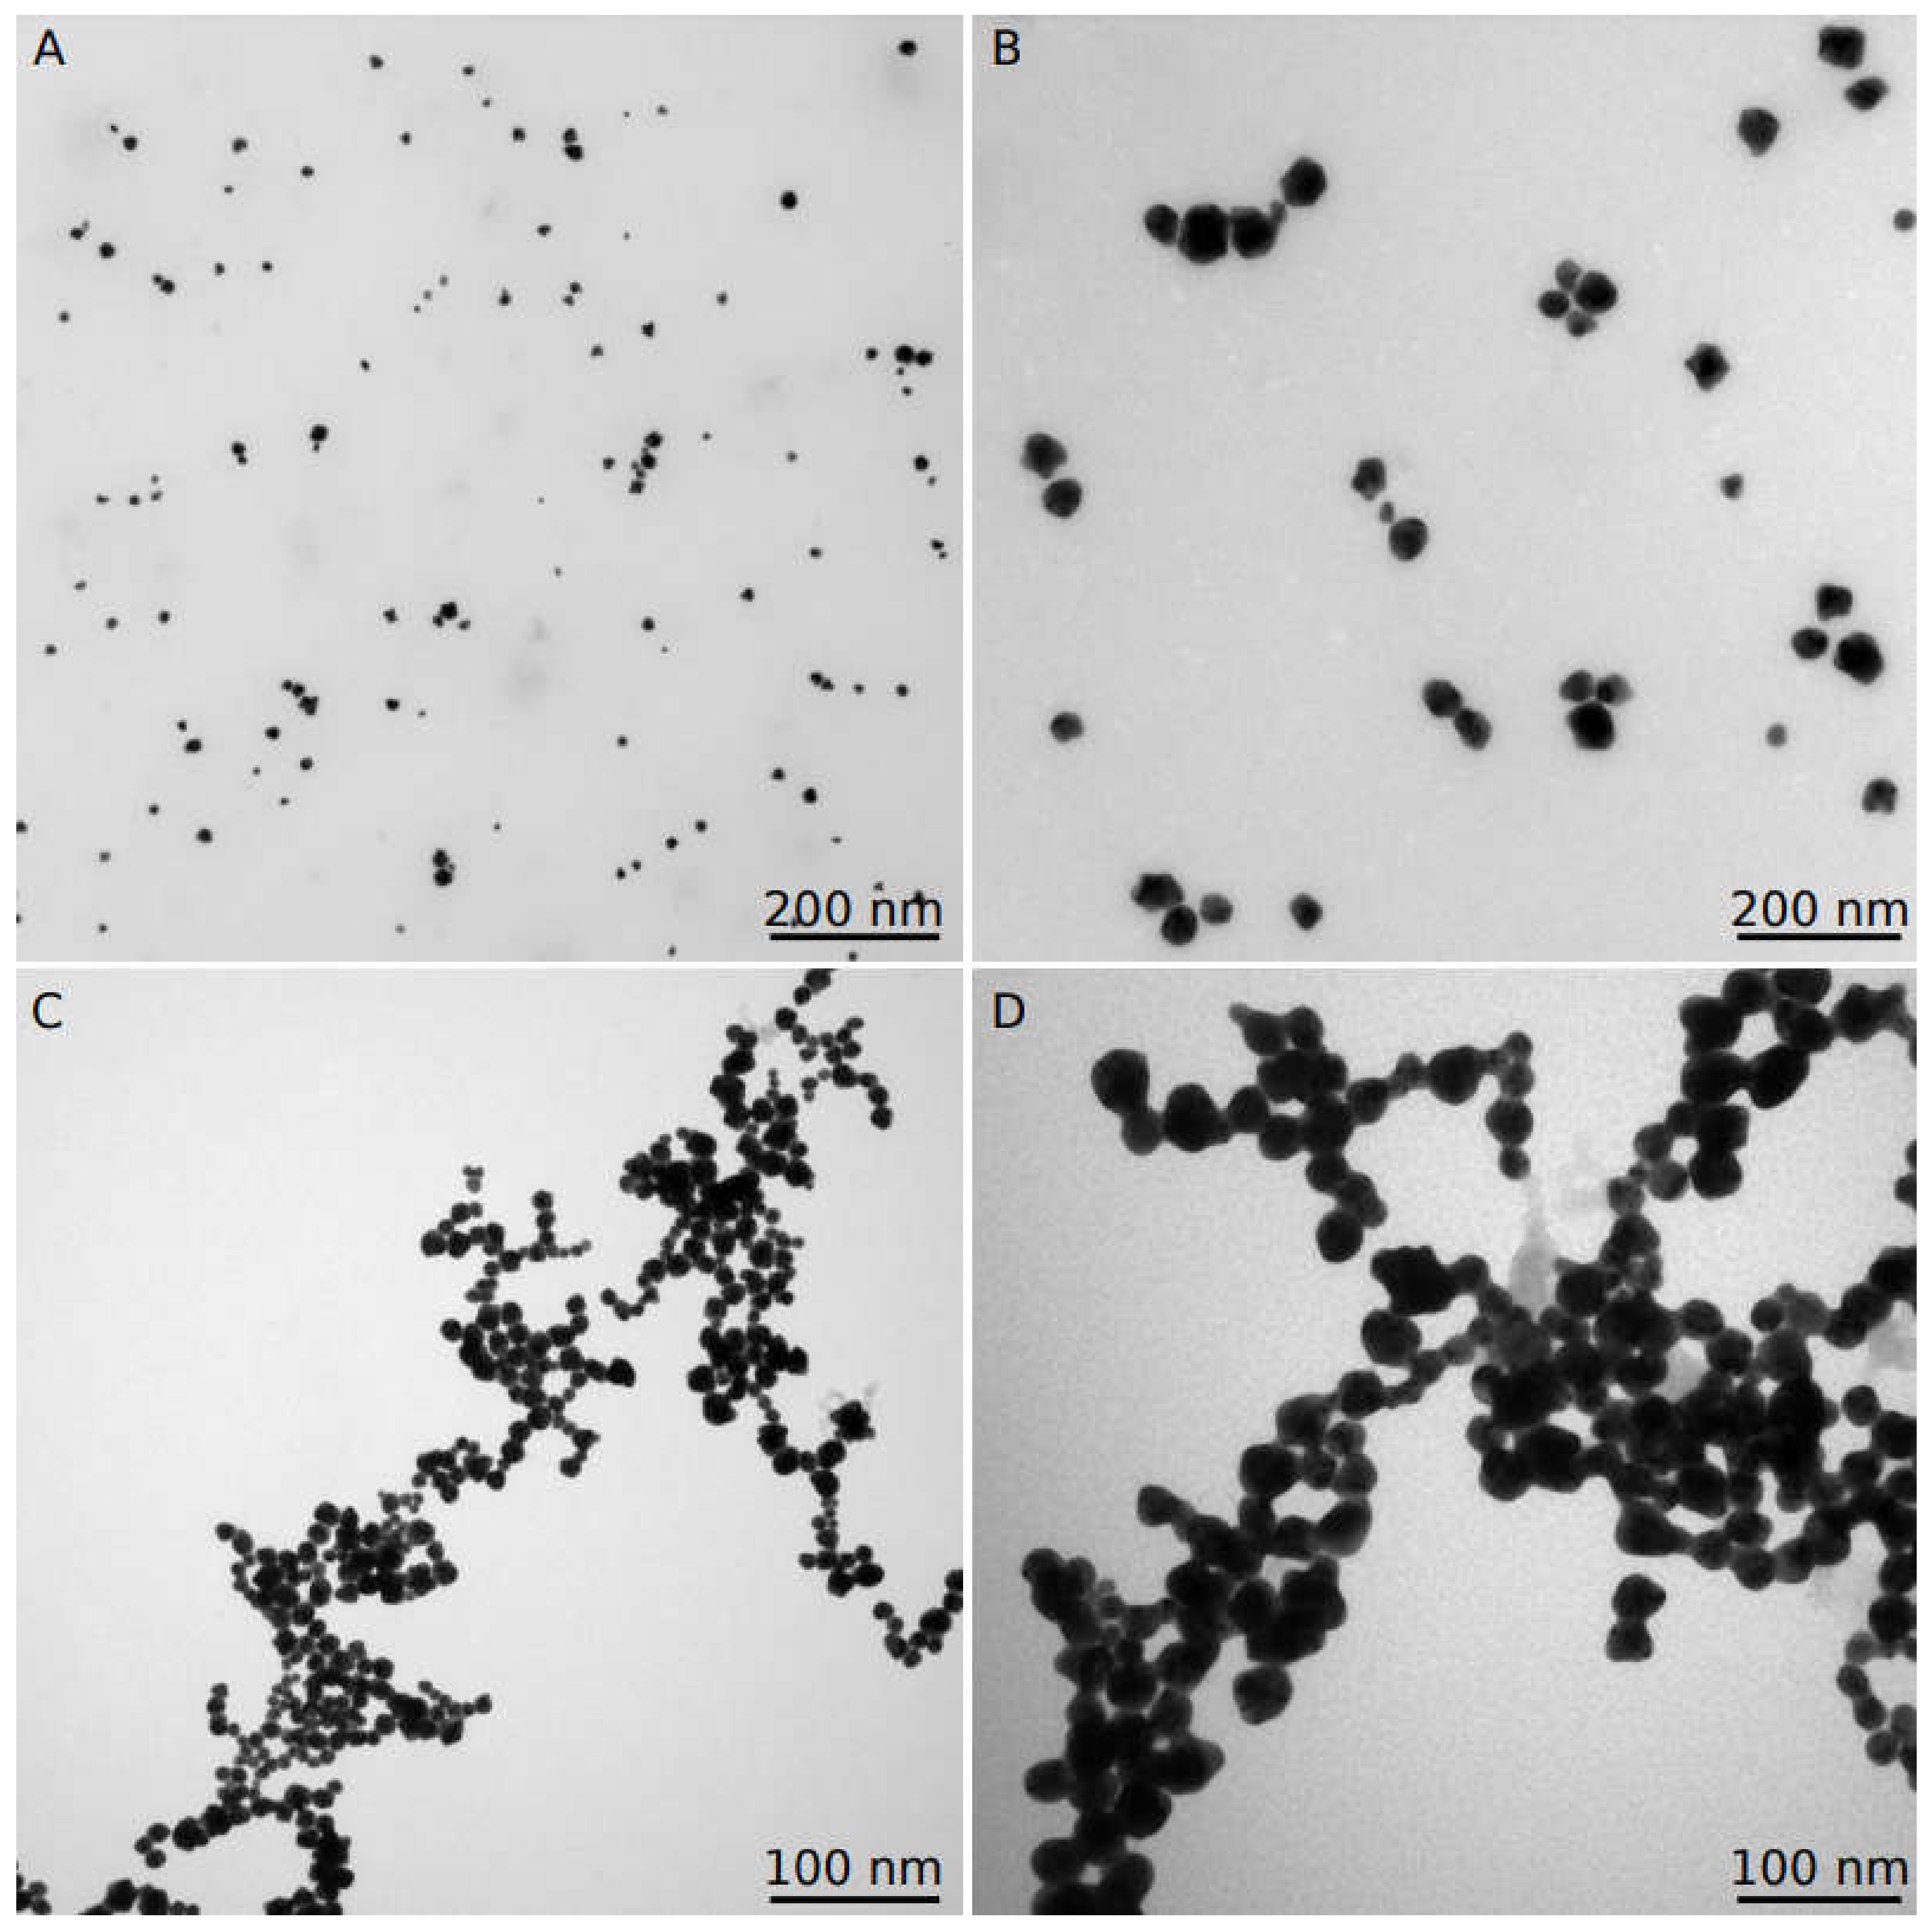
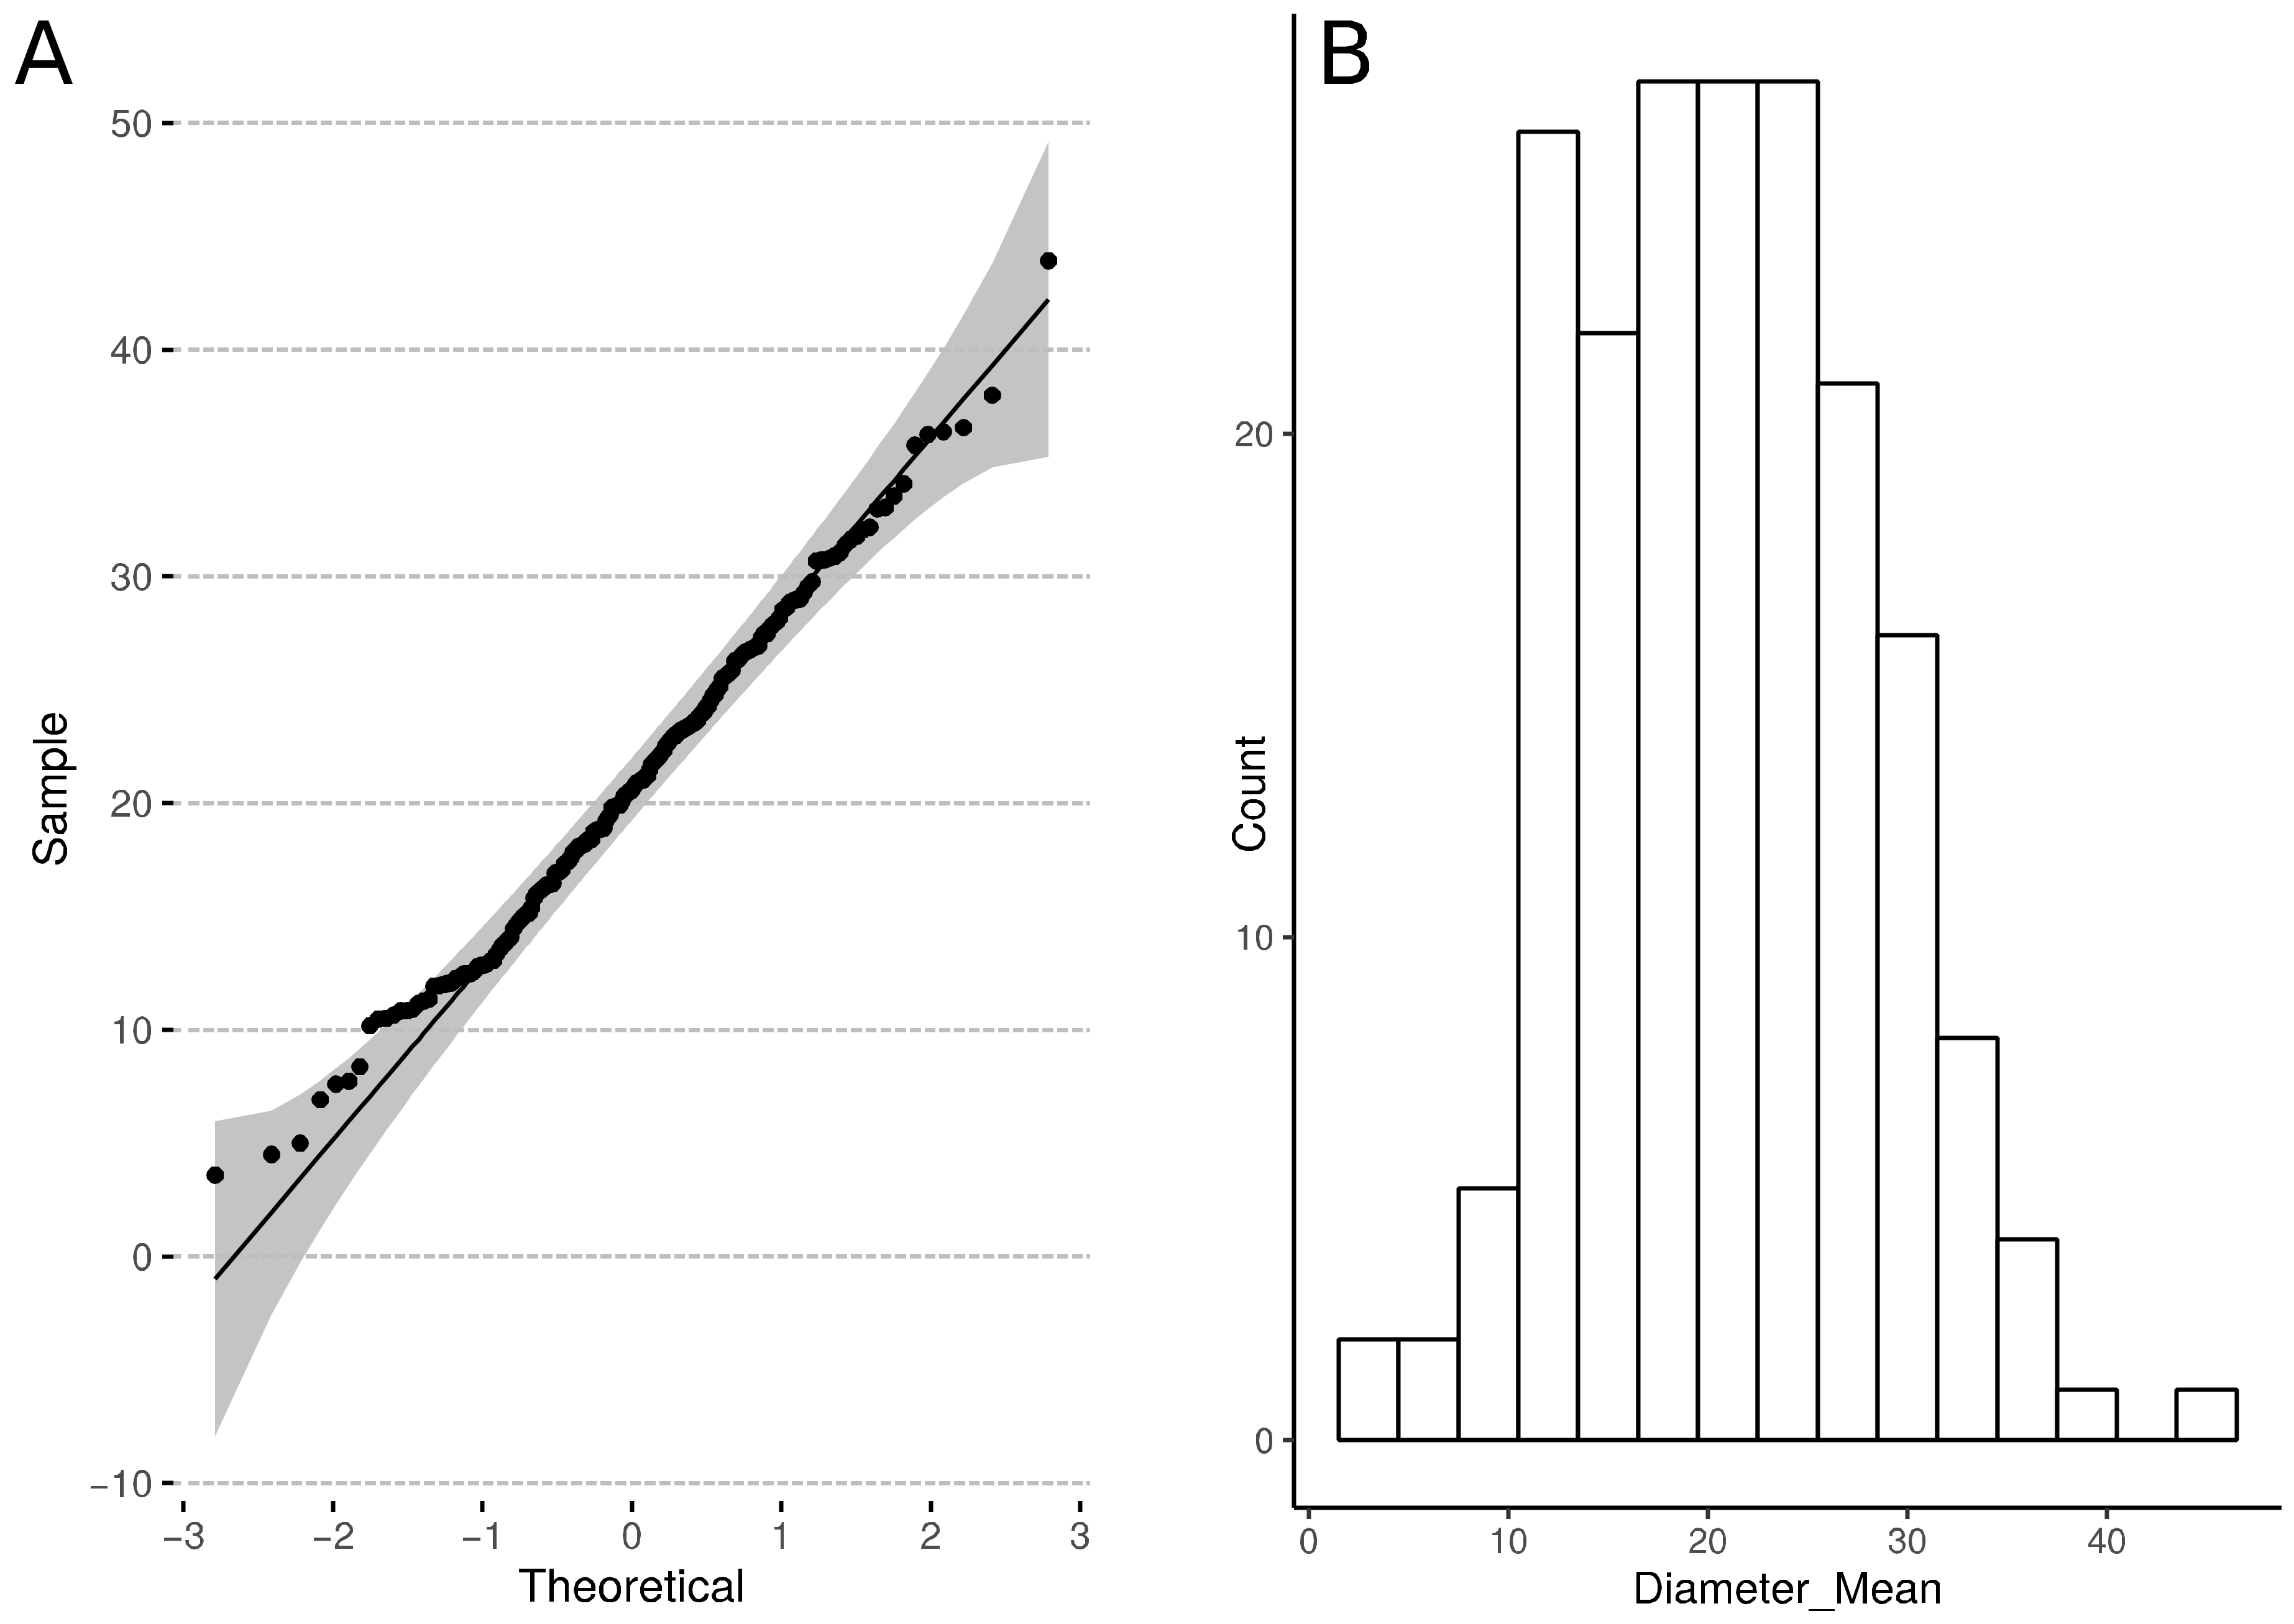
3.4. TEM for AuNPs Samples with pH Adjusted Prior to Production

TEM analysis was performed for the samples at pH 2, 6, and 10. The results are shown in Figure 4.
As shown in Figure 4, the gold nanoparticles were not agglomerated at pH 2 before washing (Figure 4A), but they agglomerated afterwards (Figure 4C,D), indicating that they were unstable at the corresponding pH. The insert in Figure 4A shows some closely connected AuNPs without distinct boundary lines. This is in accordance with the observation from spectrophotometry as well as the results of Murphy et al. [31] (see Figure 2). However, we did not perform TEM for the sample with an initial pH of 4, and thus we cannot conclude that the AuNPs at pH 4 were rod-shaped (according to Murphy et al.), but the size distribution assay (see Figure 14) showed that that they were polydispersed and their sizes were over 100 nm.
After washing, the nanoparticles were in a stable form at pH 6 and 10 and did not agglomerate (Figure 4B,E,F). The inset in Figure 4B shows that some AuNPs in close contact were separated by distinct boundaries. Image analysis confirmed this, and the thresholding procedure for particles easily separates them. The particle size analysis for the sample with an initial pH of 6 is shown in Table 1. Statistical analysis of the measured AuNP diameters confirmed the Gaussian distribution of the measured values (Figure 5). The mean diameter of AuNPs for the sample with an initial pH of 6 was 16 ± 5 nm. The value of the mean diameter of the AuNPs differed from the value of the z-average determined by DLS (Figure 14). A similar discrepancy in the size of AuNPs determined by TEM and DLS was described by Eaton et al. for AuNPs with a nominal diameter of 15 nm [32]. According to Maguire et al., the digital images from TEM differ from the DLS results because DLS measures the hydrodynamic diameter, unlike TEM, which only measures the diameter of the nanoparticles [33]. DLS results usually give larger sizes than TEM, and a combination of methods is needed to properly understand the size and distribution of the AuNPs [32]. Although TEM can show precise AuNP diameters, it cannot not show the dispersity and stability of the nanoparticles, which can be distinguished using other techniques such as DLS and spectrophotometry. For example, it was shown that for silica nanoparticles, DLS showed their solution behavior, while this could not be detected by TEM [32]. Analysis of the average size of the samples with the Zetasizer revealed that some samples of the AuNPs discussed in this article were approximately in a normal distribution.

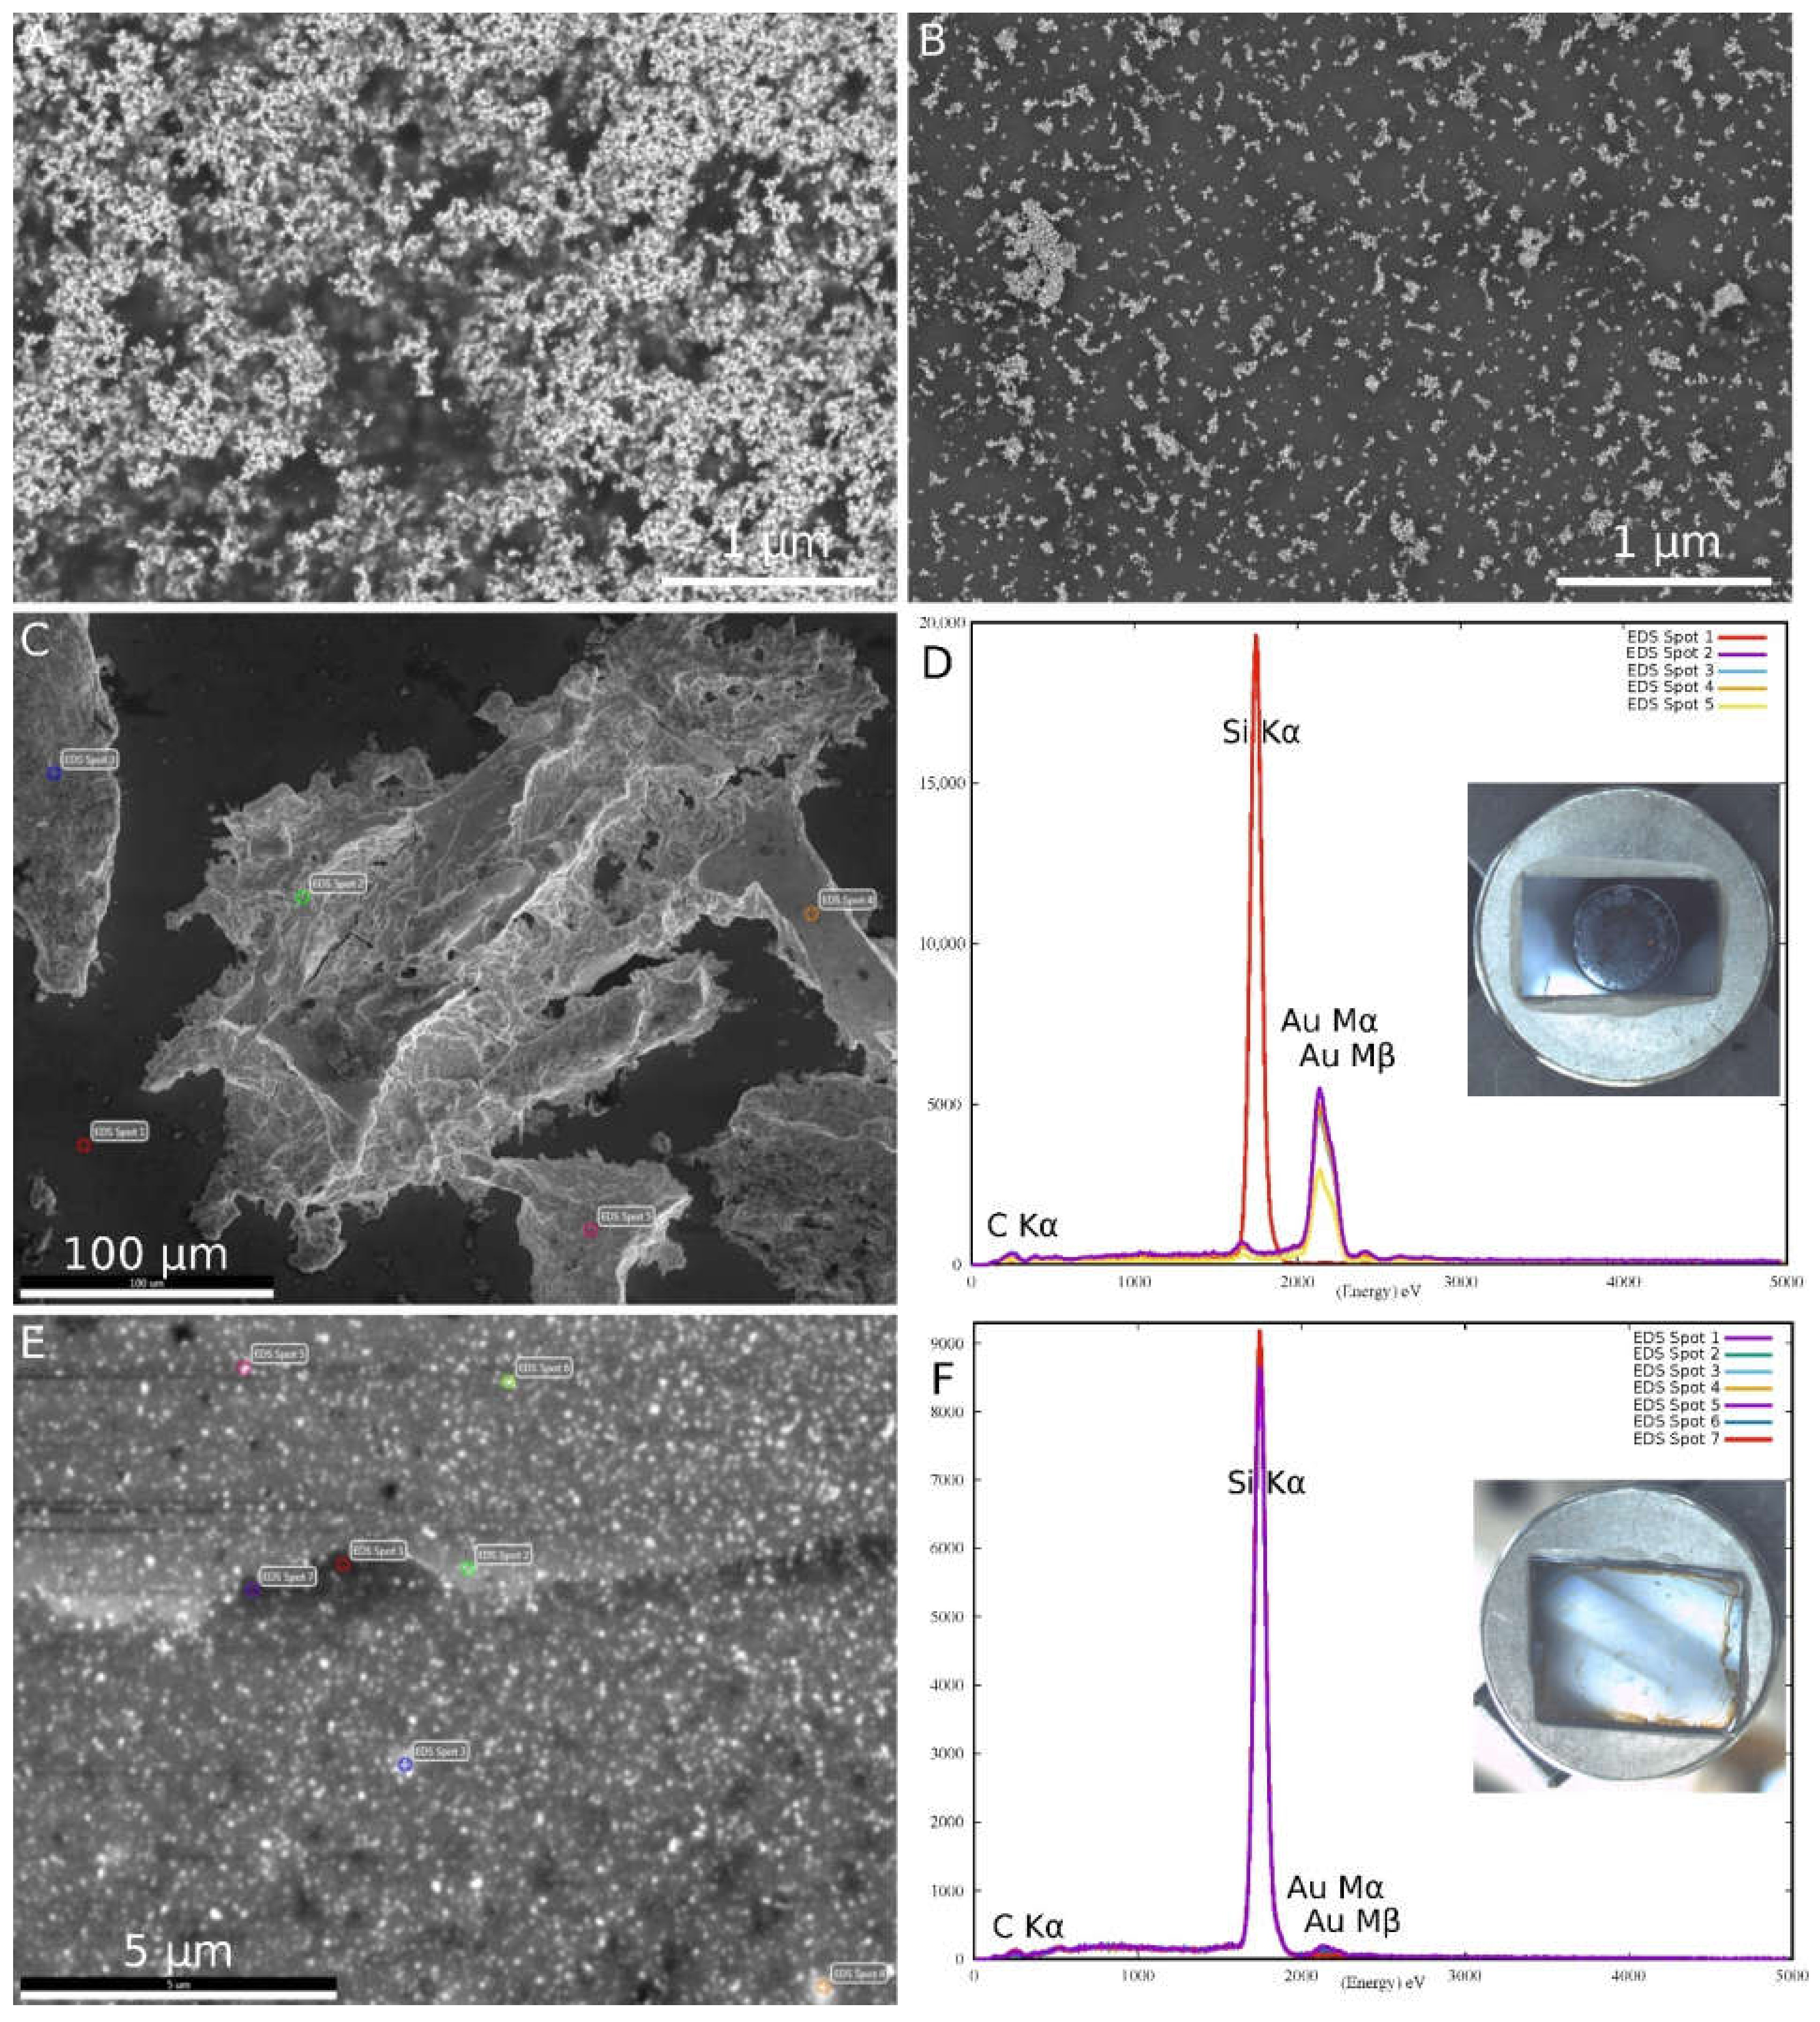
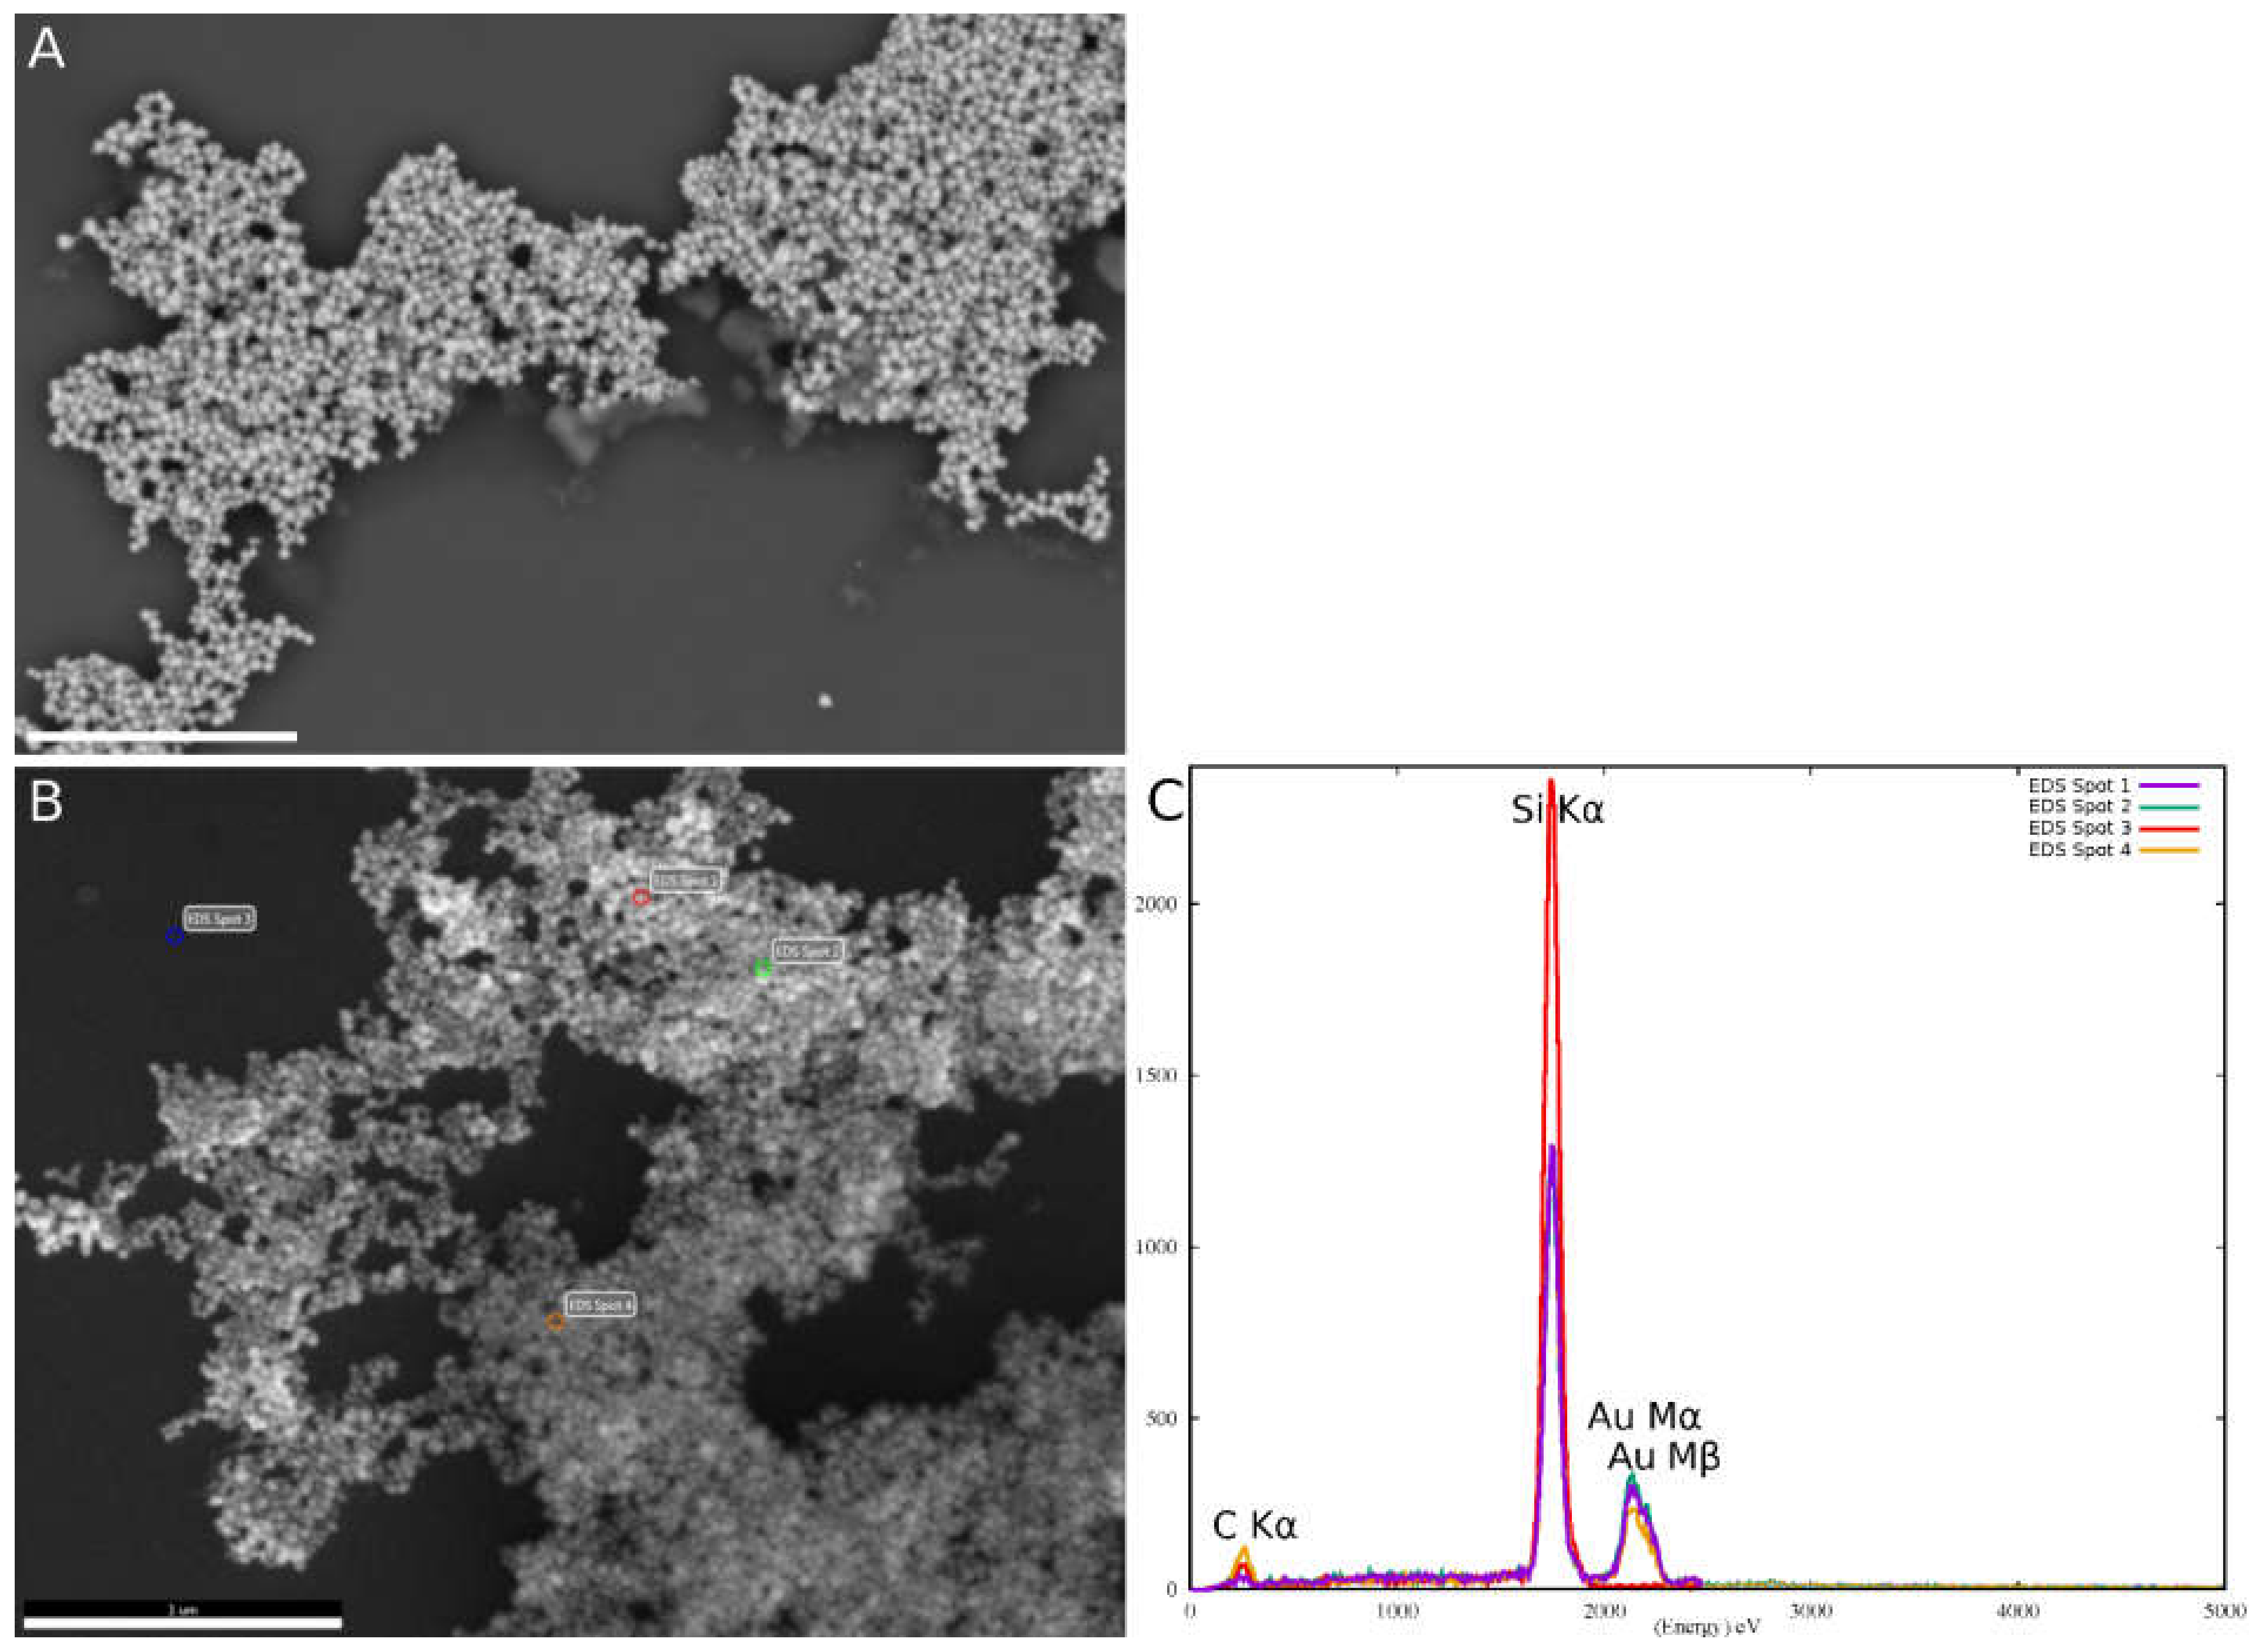
3.5. SEM for AuNP Samples with pH Adjusted Prior to Production
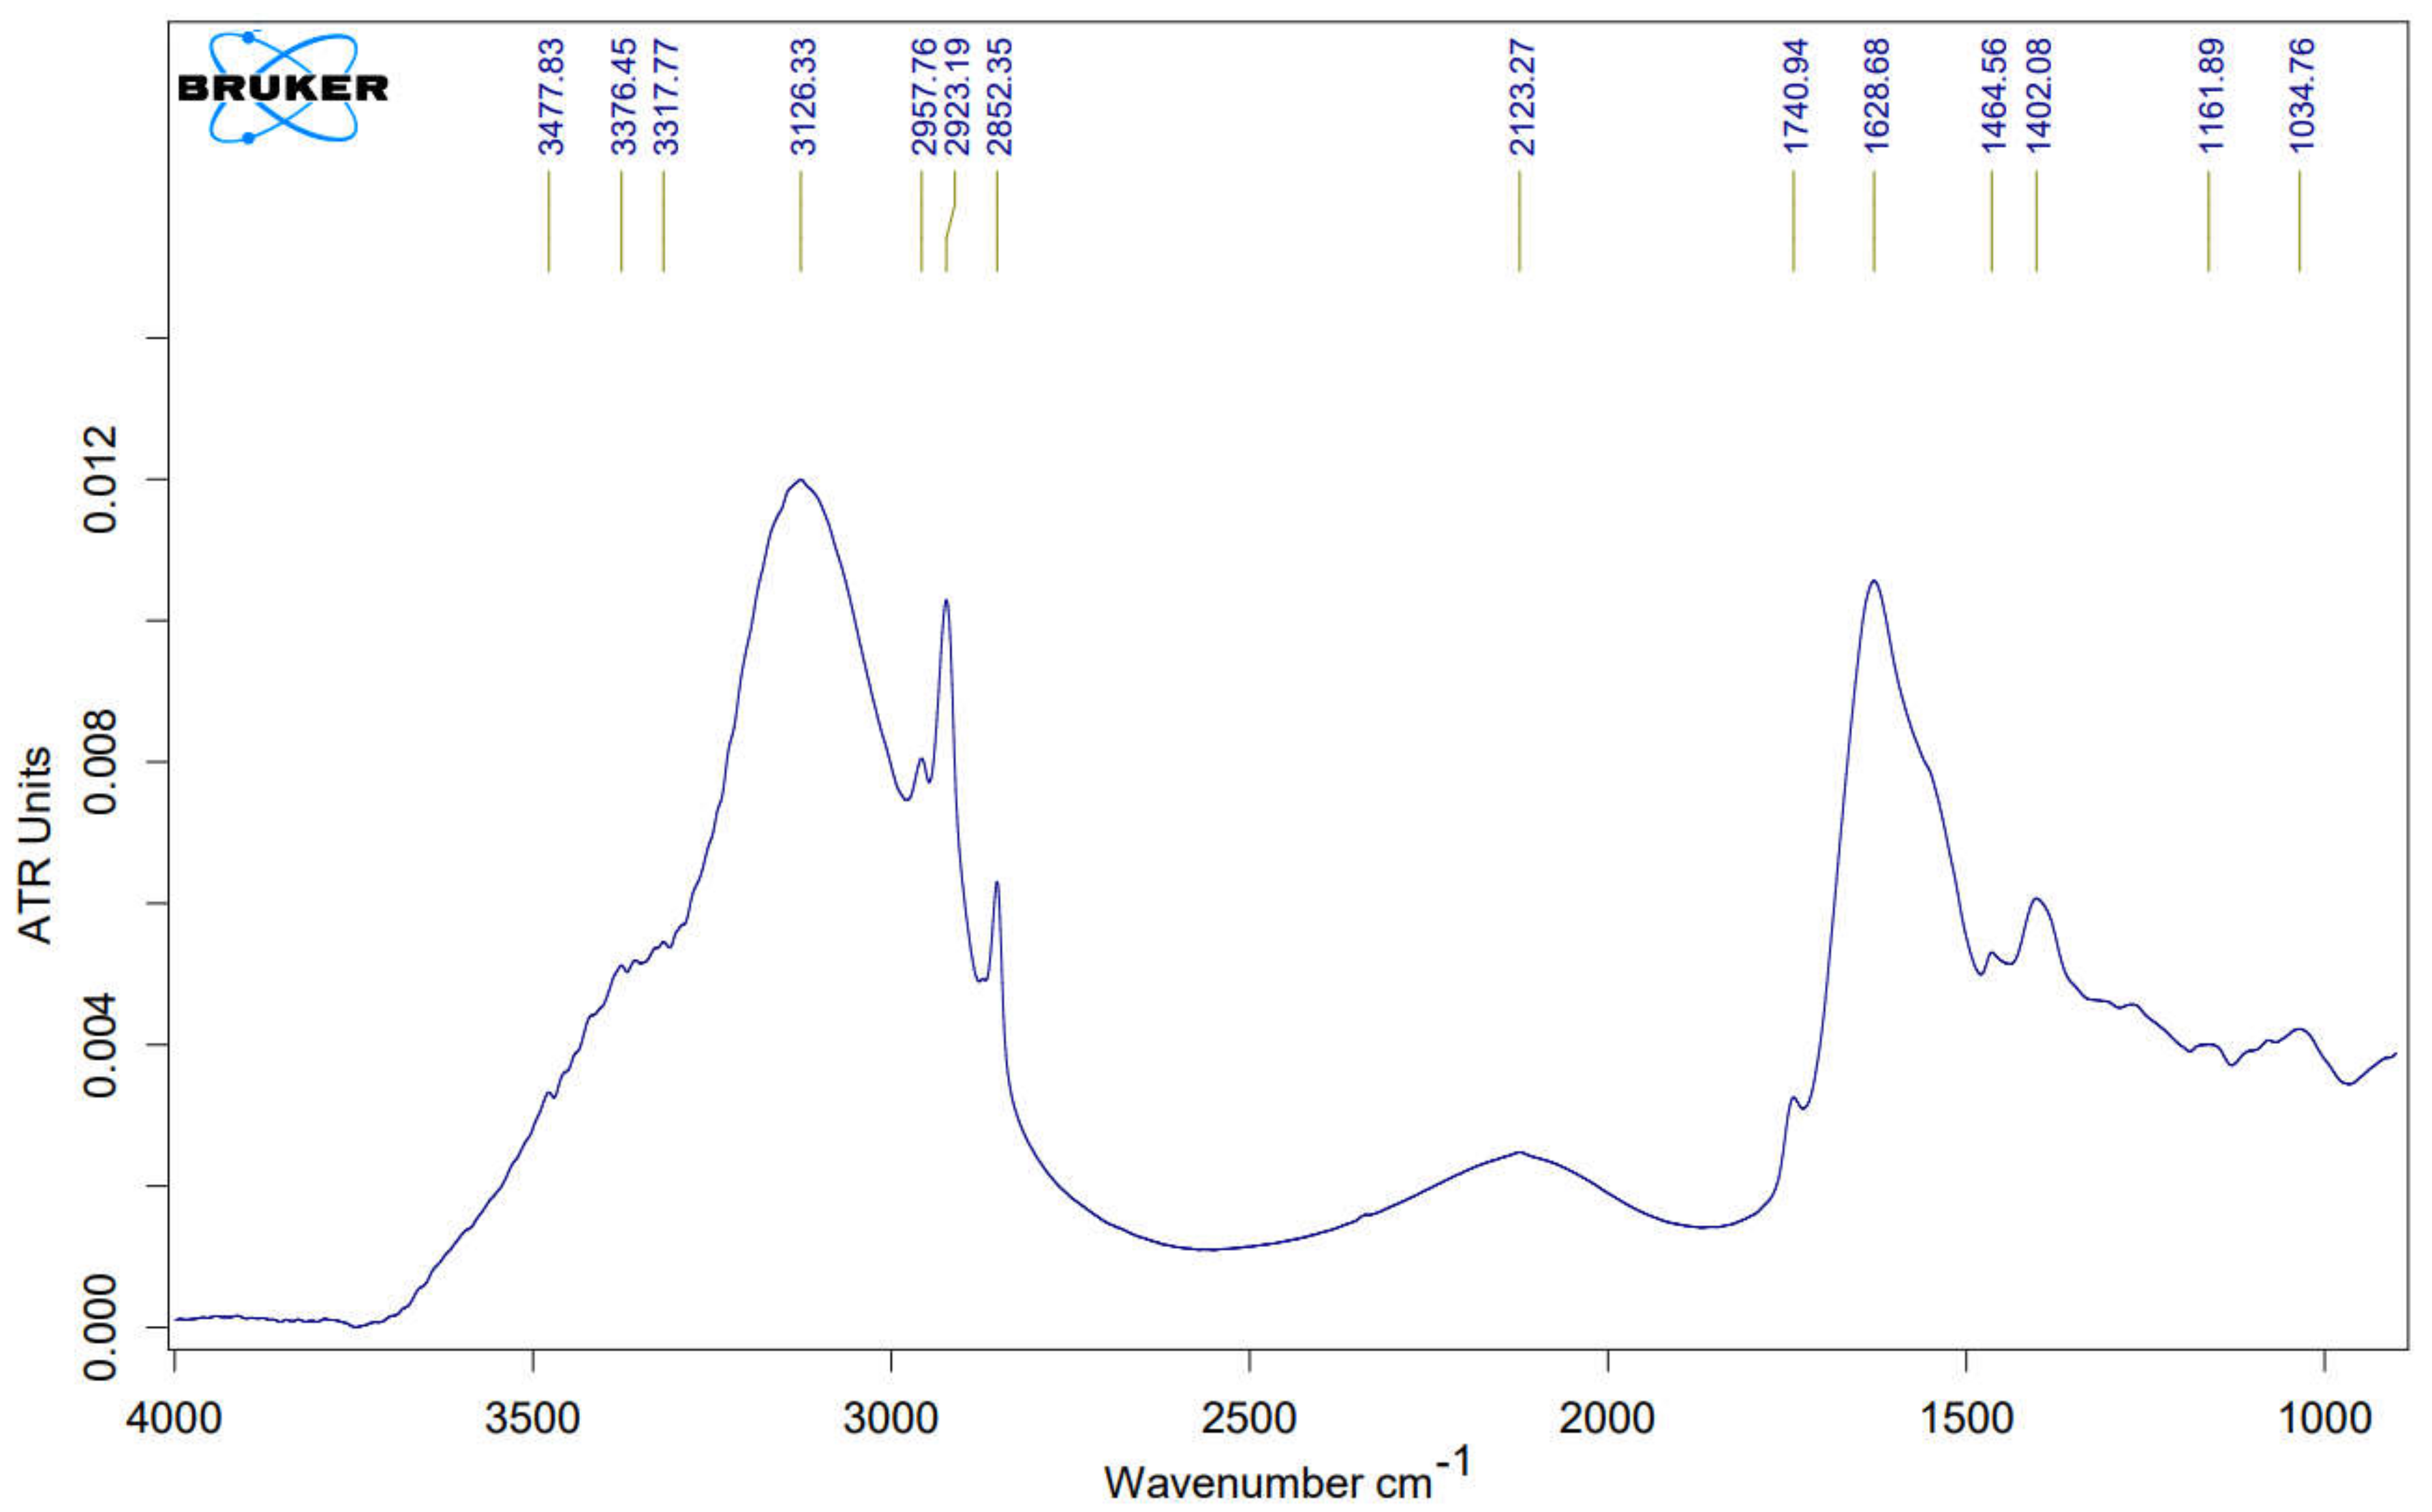
Figure 6 shows the data obtained from SEM and EDS analyses. EDS proved the formation of AuNPs in the samples.
The EDS results showed there were organic compounds in the samples (distinct C Kα peaks) due to the presence of capping agents on the surface of AuNPs. Moreover, the Si peak can be seen in the EDS results, which represents the presence of silicon from the bed of the wafer. The unwashed samples contained a high concentration of organic compounds that hid the AuNPs under a thick dried organic layer. This also caused severe sample charging problems.

3.6. FTIR Analysis

The sample at pH 10 was chosen for FTIR analysis, and the results are shown in Figure 7. The FTIR data confirmed the presence of capping agents on the surface of the AuNPs. Since the FTIR spectra of the AuNPs were recorded in aqueous dispersion, the water spectrum was subtracted as a background, but there were still some water peaks present in the spectra. In particular, the peaks at 3400 cm−1, 2123 cm−1, and 1630 cm−1 correspond to water. The peak 2123 cm−1 corresponded to the combined band of O–H scissors–bending and the broad liberation band shown previously [36]. The broad band between 3800 and3000 cm−1 was caused by O–H stretching: the shoulder at approximately 3300–3400 cm−1 was from the solvent water, while the narrower peak at 3100 cm−1 corresponded to the O–H stretching of the carboxylic acids. Three narrow peaks at 3000 cm−1 represent the C–H (CH3) stretching vibrations of the capping agents present. In the region of the amine bands, there was an indication of the presence of C=O vibrations (1740 cm−1) as well as an N–H bending peak (1550 cm−1), which leads us to believe that the capping agent may be proteinous in origin.

3.7. pH Adjustment after AuNPs Preparation

According to the color change, visible spectra curves, and different microscopic approaches, the best results were obtained for the sample at pH 10 of all the tested samples. Our experiments showed that when the mycelium-free supernatant was directly used for nanoparticle preparation, the pH was 3.86 and the obtained color was dark green. That AuNP sample was used along with the pH 10 sample for the subsequent pH adjustment experiment. As for the sample with an initial pH of 10, the color of the AuNPs changed rapidly after the pH was readjusted, indicating that the changes in pH resulted in a different size of the nanoparticles. Adjusting that sample to pH 2 resulted in a gray color; pH 4 resulted in a brown color; and pH 6, 8, and 10 turned into a range from purple to red (Figure 8A,B). Since this type of AuNP responded quickly and easily to the pH changes in the environment, it could be used as a biologically based nanosensor. Based on this property, we will try to develop a colorimetric sensor for the visual determination of pH in biological samples in the future.
The pH readjustment of the AuNPs with an initial pH of 4 resulted in the same color (green) for all of the samples (Figure 8C,D). Based on the size analysis described below, the size of the AuNPs produced at pH 10 was below 100 nm, and the size of AuNPs produced at pH 4 was above 100 nm. Thus, after the production of AuNPs, pH adjustment could only be performed for the samples with sizes below 100 nm. In the green AuNP samples, since the initial size of the nanoparticles was above 100 nm, they could agglomerate. Thus, pH adjustment had no further effect on the color of the dispersion and the AuNPs could not be dissociated by pH adjustment. The spectrophotometry results confirmed that, unlike the AuNPs with an initial pH of 10, the ODs of the AuNPs with an initial pH of 4 in the sample did not change. Figure 9 shows the spectra of the AuNPs with an initial pH of 10. Prior to spectrophotometry, all the samples were diluted 1:2 with ddH2O, as their ODs were above 1. The maximum absorbance peak for pH 10 (after readjustment of pH) was 525 nm.
As can be seen in Figure 9, samples at pH 2 and 4 did not have MAPs, which indicates that they were polydispersed nanoparticles.

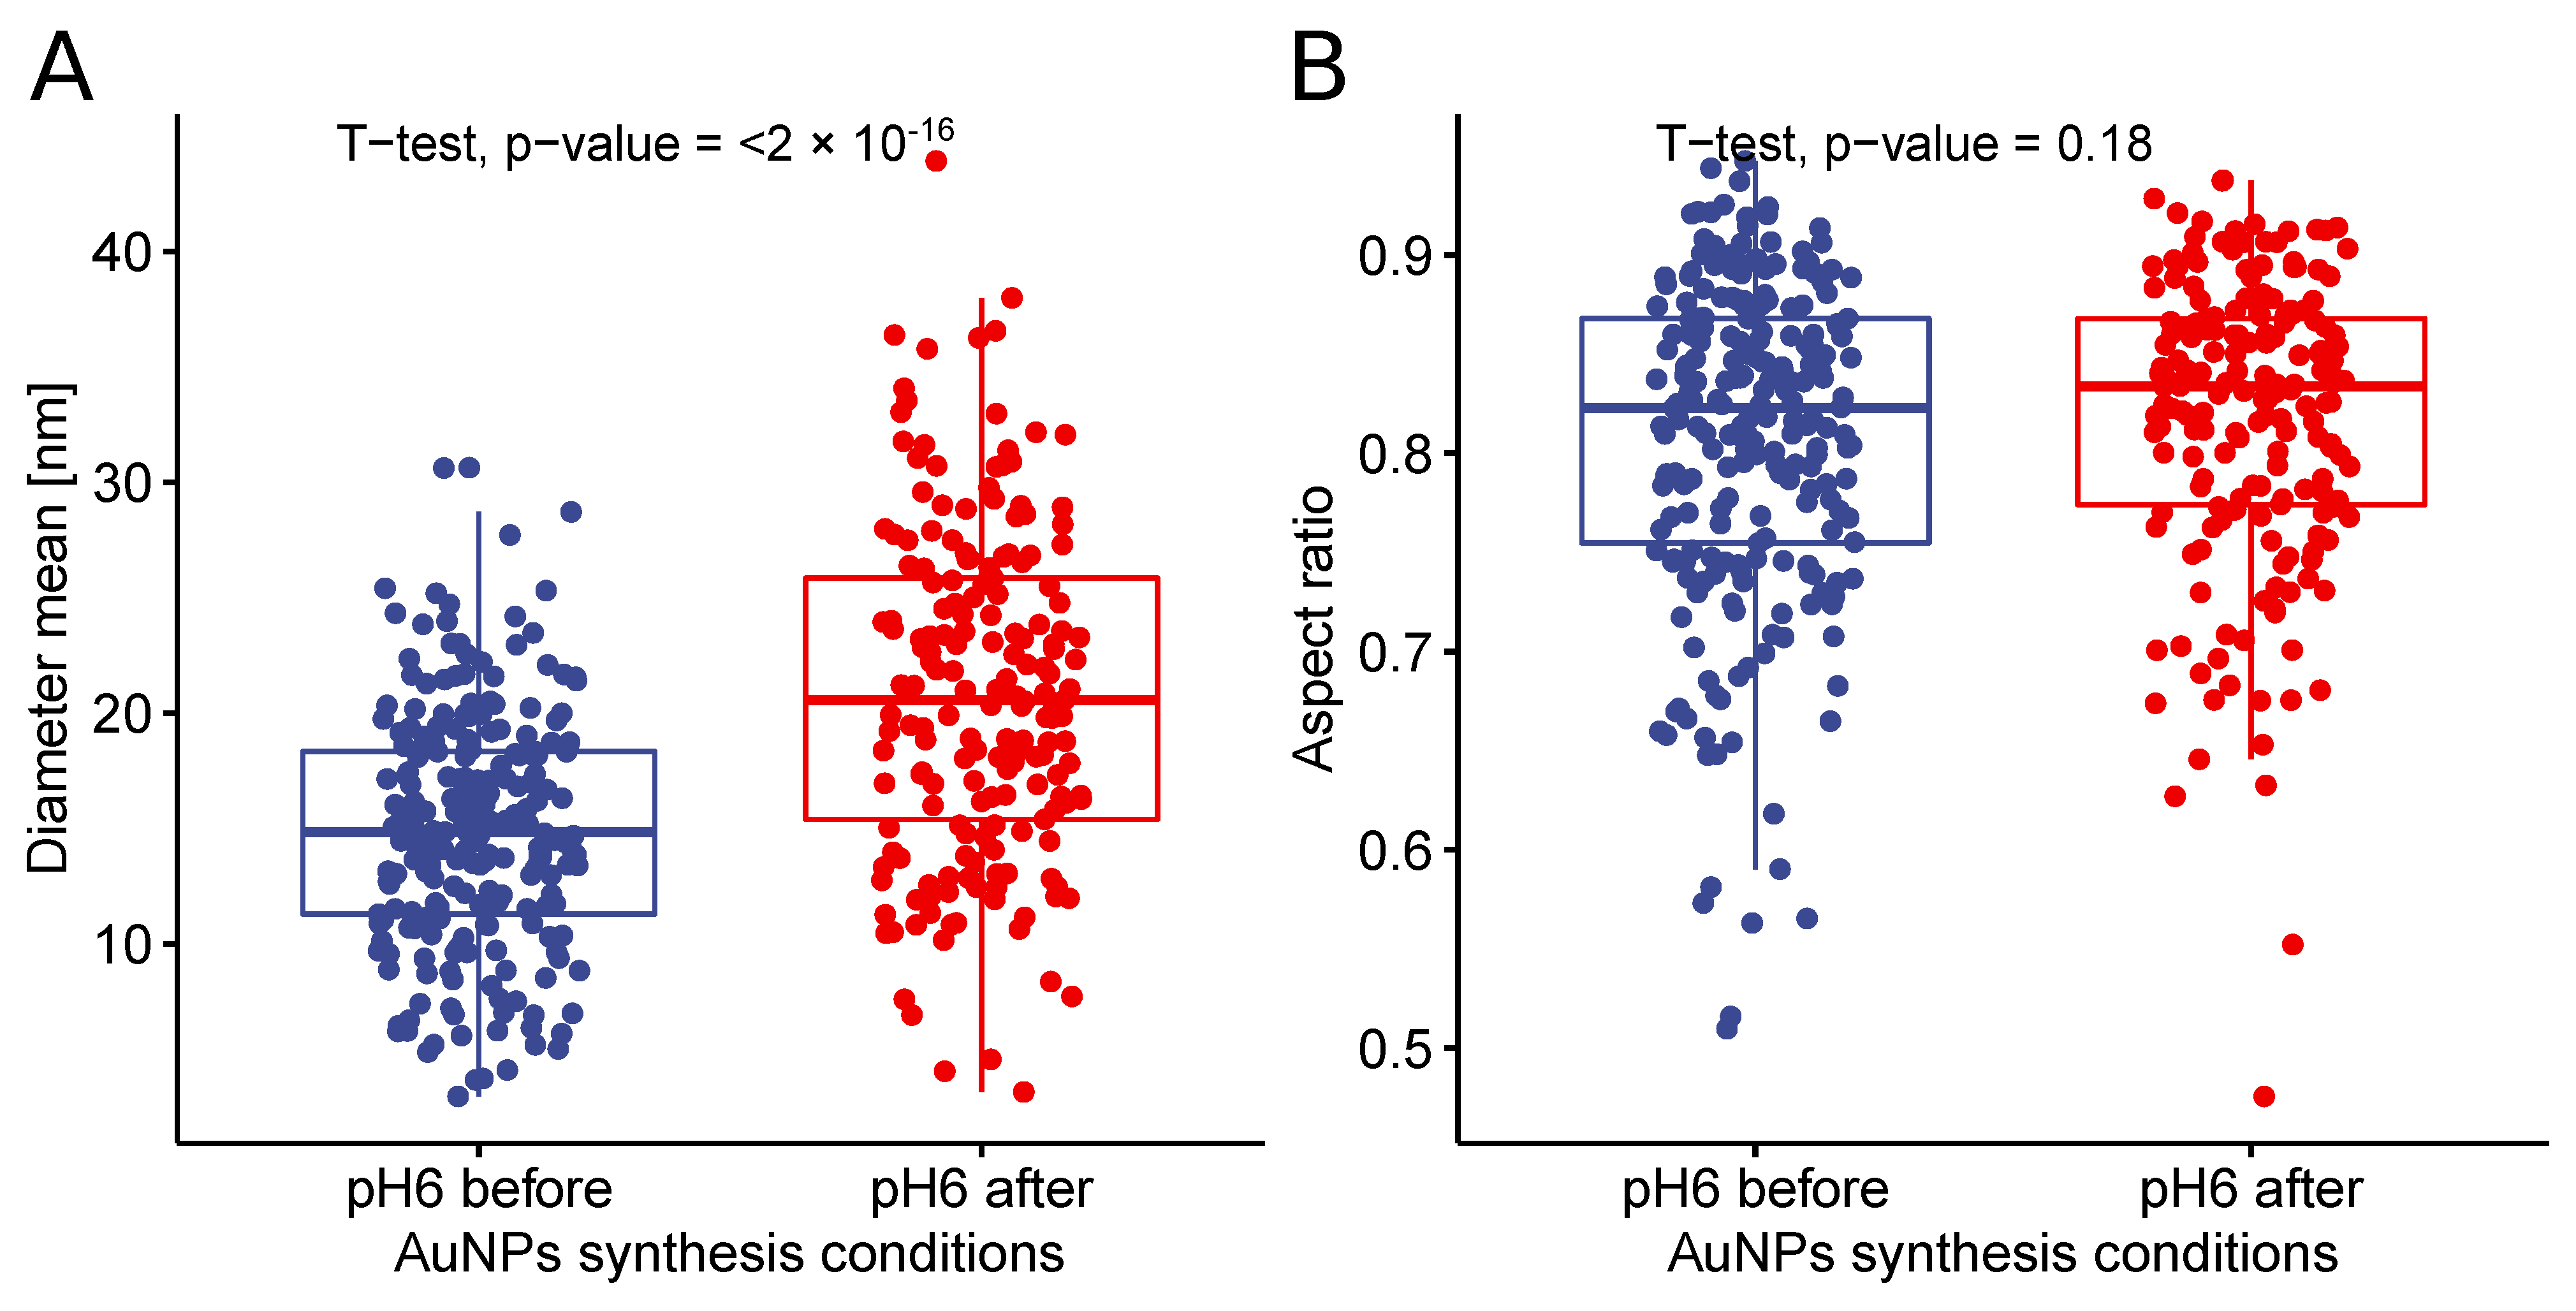
3.8. TEM for AuNP Samples with pH Adjusted after Production

Unwashed samples were unsuitable for TEM analysis, because the high amount of organic material present covered the surface of the grids and prevented the acquisition of ideal TEM images. In addition, the samples at pH 2 and 4 were agglomerated after the washing process, so we only analyzed the washed samples at pH 6 and 10. TEM Results are shown in Figure 10.
The statistical analysis of the measured AuNP diameters (Figure 11) for the sample with the pH adjusted to 6 after AuNP preparation is shown in Table 2. The mean diameter of AuNPs for this sample was 20 ± 7 nm. The value of the mean diameter of the AuNPs that had an initial pH before production that was six was different from that of the above sample. These data demonstrate the differences between nanoparticles that had a pH that was adjusted before or after their preparation. A comparison of these two samples based on their mean diameter values (boxplots and t-test) is shown in Figure 12. The ratio shows that the particles were not perfect spheres but had a similar shape to each other.
As shown in Figure 12, although the shapes of the prepared nanoparticles were similar in the two different methods of nanoparticle preparation (i.e., pH was adjusted before and after the preparation of AuNPs), the AuNPs were smaller in the sample that had the pH value adjusted before the preparation of the nanoparticles than the other one.

3.9. SEM for AuNPs Samples with pH Adjusted after Production

SEM and EDS analyses were performed for the pH-adjusted AuNP samples, and Figure 13 shows the obtained data. Moreover, the EDS results obtained from the sample at pH 10 prove the presence of AuNPs in the sample.

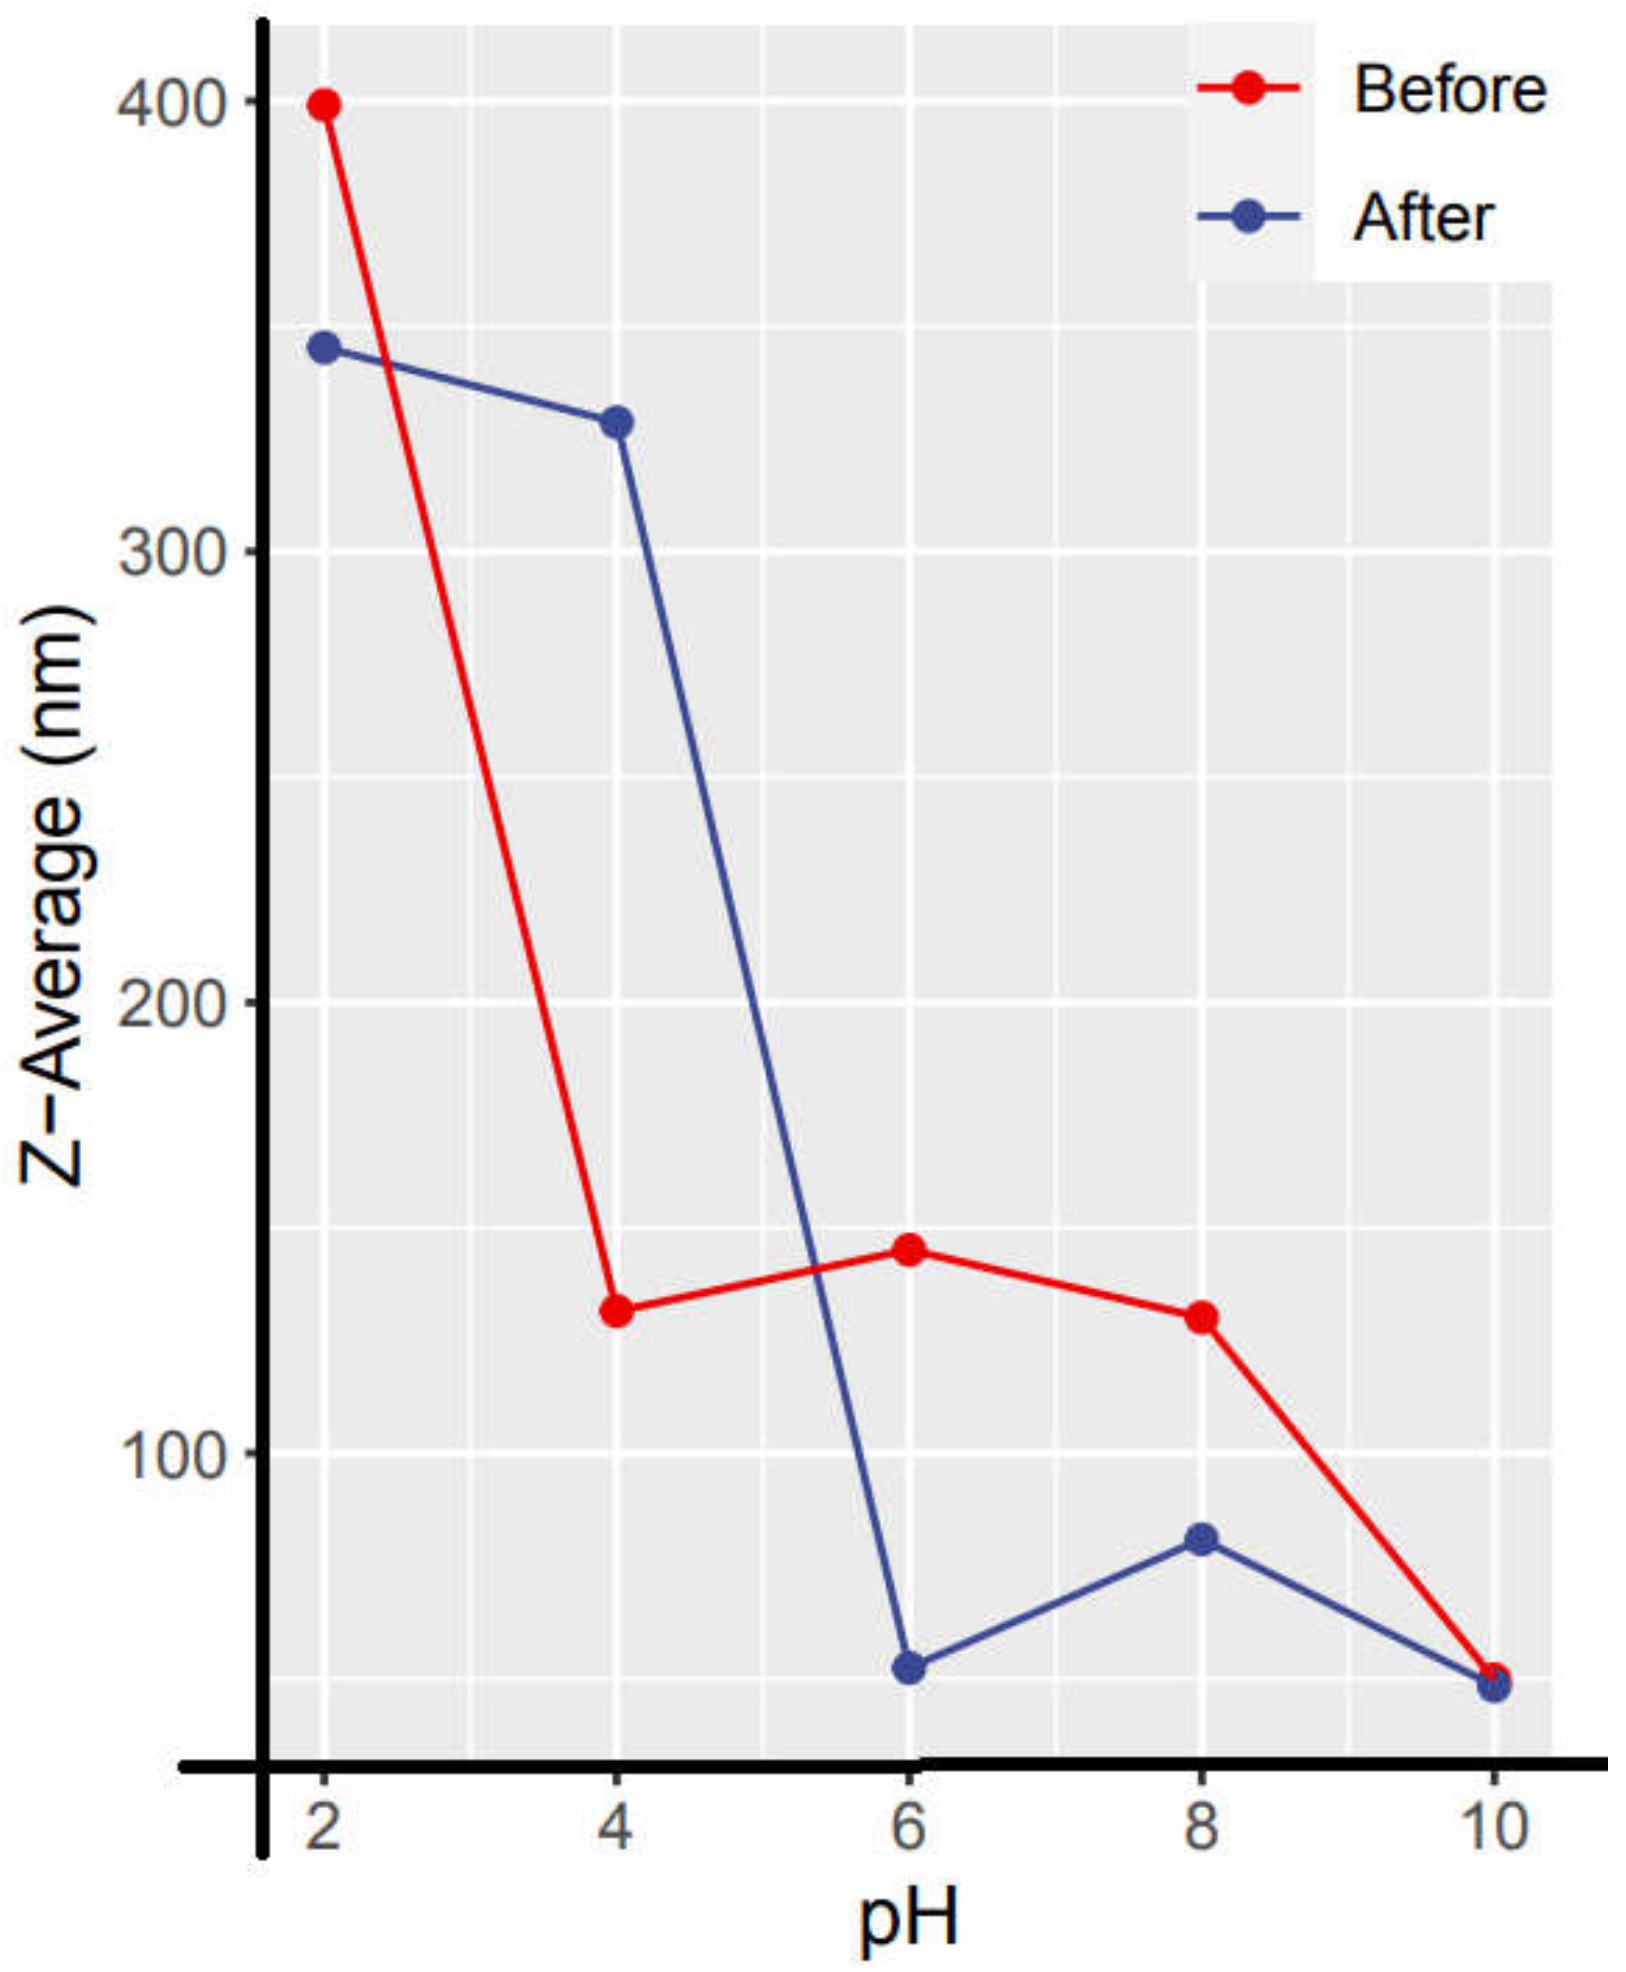
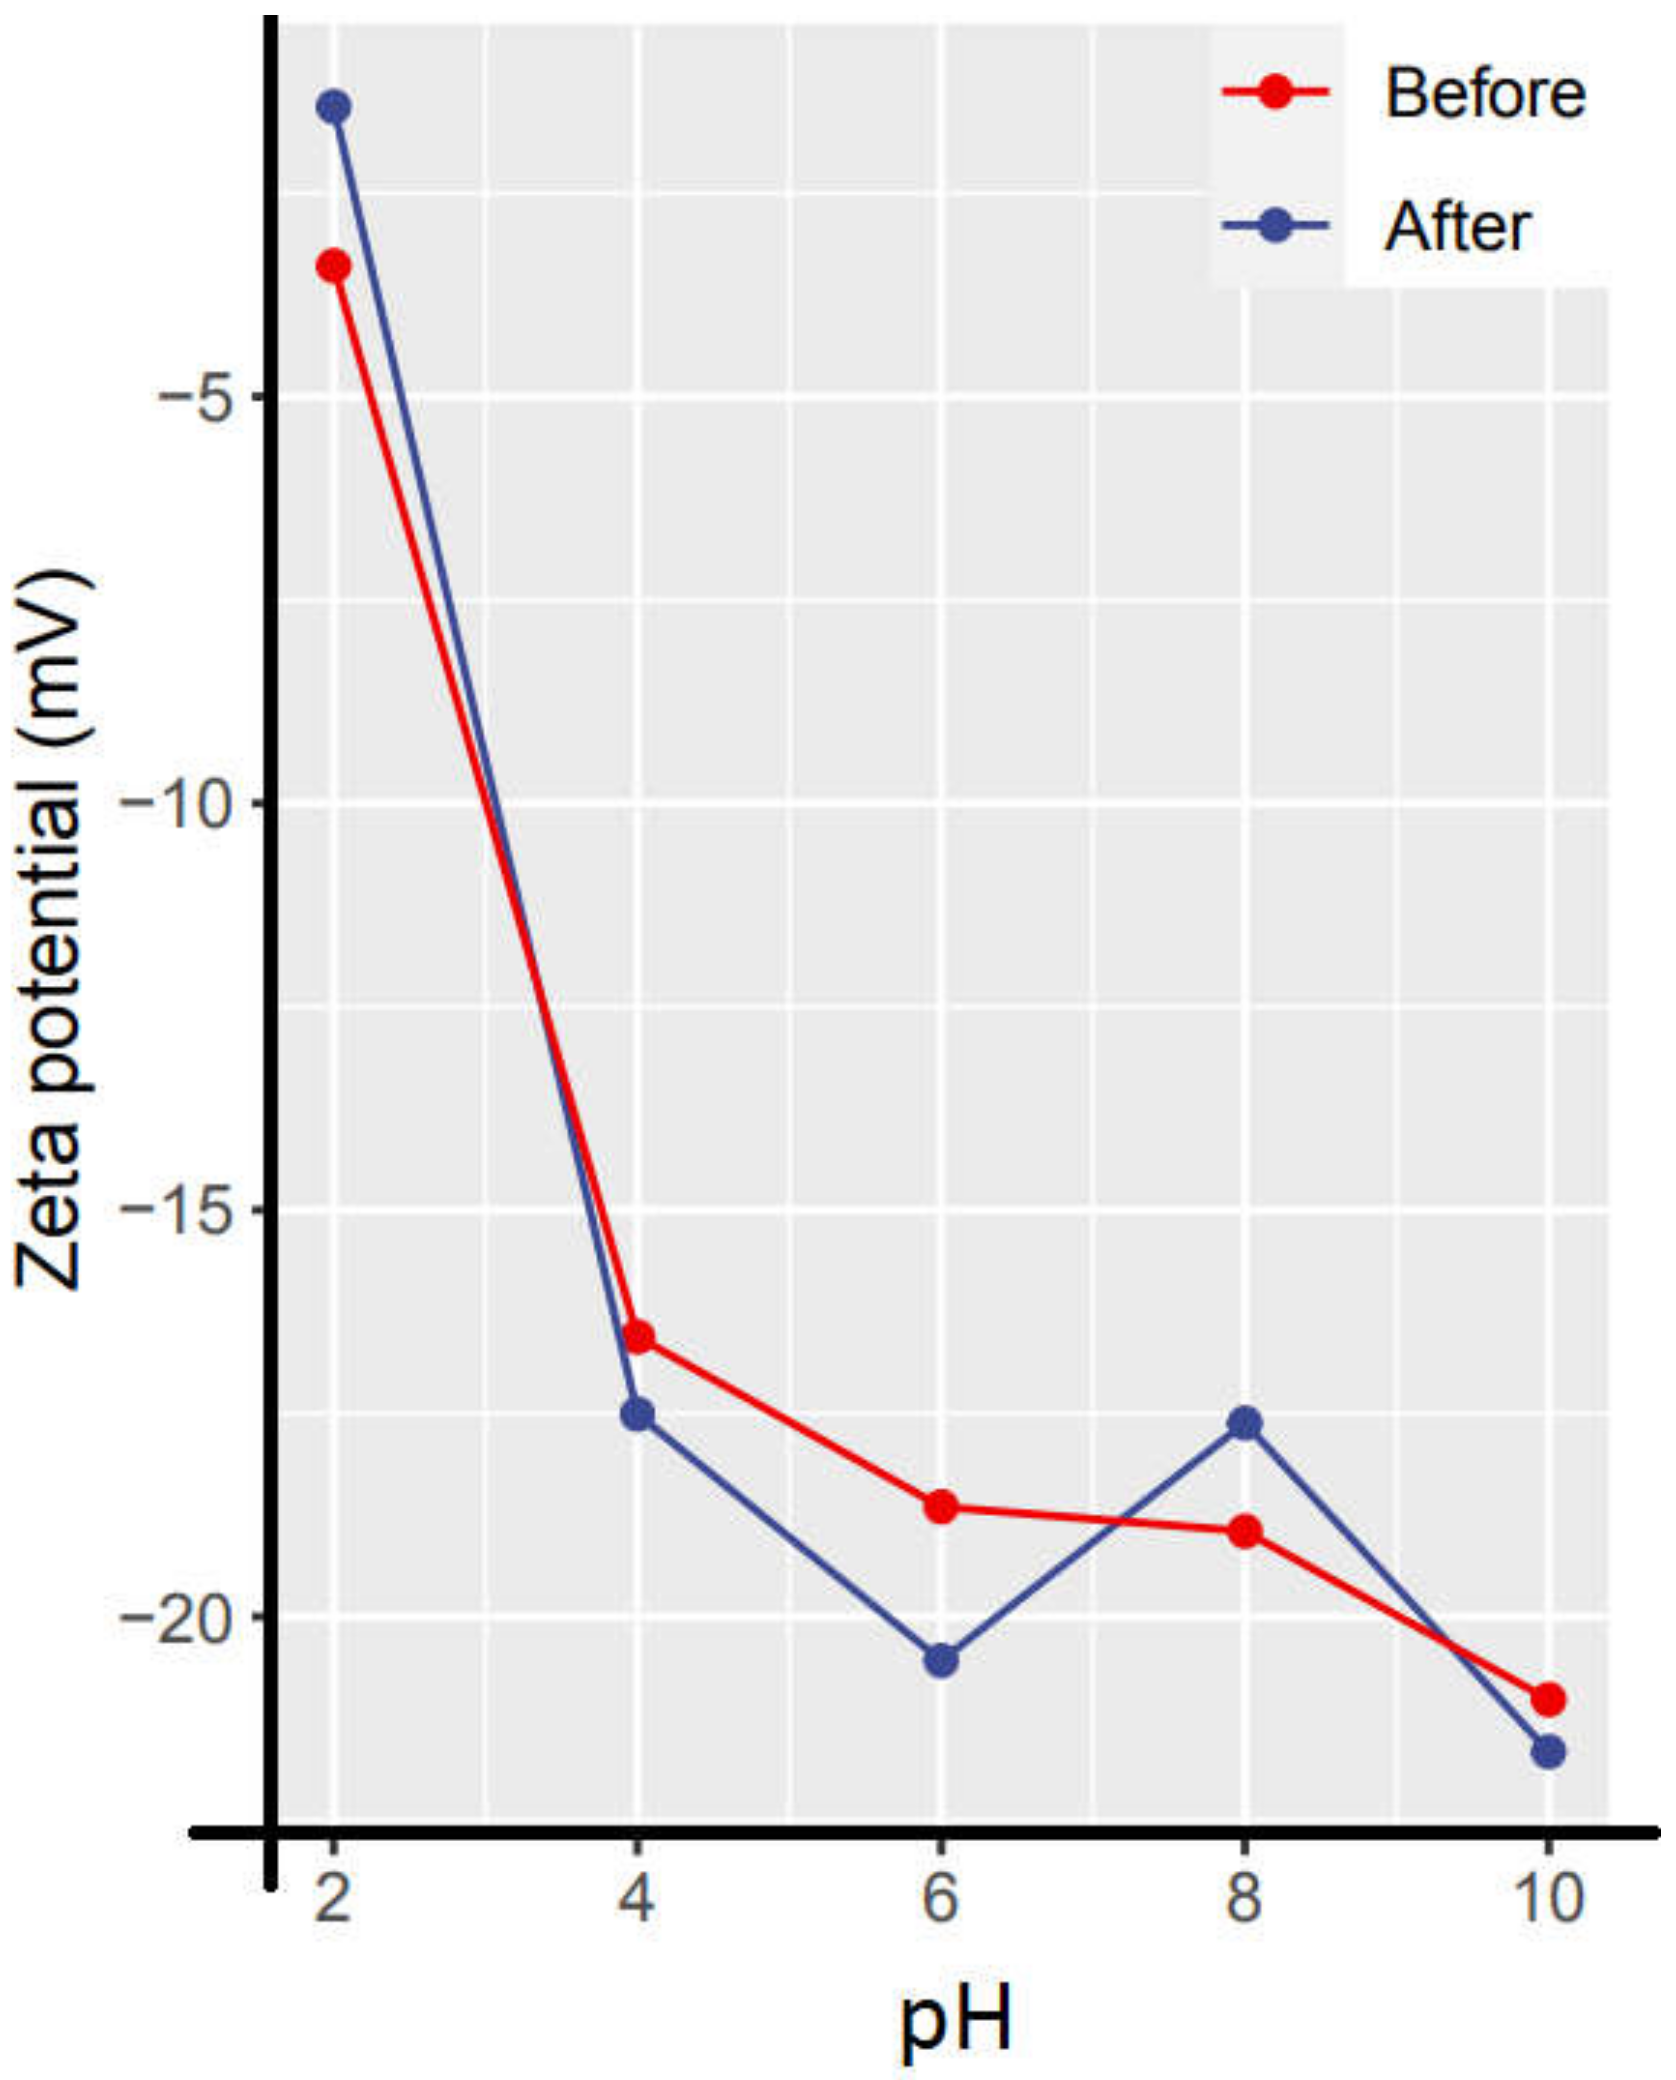
3.10. Analyses of Size Distribution and Zeta Potential

The average particle size and zeta potential values obtained from all samples (with adjusted pH values before and after AuNP preparation) are shown in Figure 14 and Figure 15. The data (Figure 15) show that all AuNPs exhibited negative zeta potential (in all pH variants). However, at alkaline pH, the AuNPs held a more negative charge than at acidic pH. Moreover, more favorable zeta potential was obtained in the samples that had a pH that was adjusted after AuNP preparation. Acidic pH induced the production of larger AuNPs with unfavorably low negative charge, which promoted agglomeration. Figure 14 shows the hydrodynamic diameter (Z-average) at different pH values. The size distribution analysis (Figure 14) confirmed that adjusting the pH after AuNP production resulted in better peaks. It was reported previously that an alkaline environment is preferred in the biological production of nanoparticles [37], because the repulsion between H+ and Au+ ions in the acidic environment decreases the chance of assembling Au+ ions into AuNPs. In this study, we report, for the first time, that acidic pH is unfavorable for the biological production of AuNPs due to the nearly neutral zeta potential of the produced nanoparticles. The zeta potential being close to zero resulted in unstable nanoparticles with a tendency to agglomerate. Since the preferred nanoparticle size for medical application is below 50 nm [38], the AuNPs produced or placed in the acidic pH range are suboptimal due to the fact of their larger size. Thus, to obtain AuNPs of preferable size and zeta potential by the biological method, we propose to prepare them with an initial pH of 10. Subsequent lowering of the environmental pH to the physiological pH (close to 7.2) results in AuNPs with favorable size and zeta potential.
Mishra et al. used Penicillium rugulosum for the preparation of AuNPs and adjusted the mycelium-free supernatant to different pH values of 2, 4, 6, 8, and 10 and showed that the best pH values were between four and six [39], which is different from this study, where the best pH values were between 6 and 10. In addition, Lim et al. showed that the best pH values for the production of AuNPs by Saccharomyces cerevisae were between pH four and six [40], and Mishra et al. showed that the best pH values for the production of AuNPs by Penicillium brevicompactum were between five and eight [41]. These differences may be due to the differences in the capping agents that were secreted by the fungal strains. In addition, they did not use other methods to analyze the size distribution, such as DLS or SEM, and they did not compare the effects of different pH values before and after the production of AuNPs on the nanoparticle size distribution, zeta potential, and type of capping agent.
Unlike the other methods of AuNP production (i.e., chemical and physical methods), which offer the easy production of positively charged nanoparticles [42,43], this cannot be achieved using the biological production method.
In chemical or physical methods of nanoparticle production, the charge of the nanoparticles depends on the charge of the reducing and stabilizing agent [2]. In the biological method of nanoparticle production, the charge depends on capping agents, which are reported to be secreted microbial proteins. There are some reports that use SDS-PAGE and FTIR techniques to reveal those proteins [25,44]. In 2010, Reddy et al. showed that capping proteins with molecular weights between 25 and 66 kDa are responsible for the surface capping of AuNPs produced by Bacillus subtilis [25]. In our study, FTIR results confirmed the presence of the proteins on the surface of AuNPs. At the natural pH, the acidic amino acids are aspartate (Asp) and glutamate (Glu). The pI values for Asp and Glu are 2.77 and 3.22, respectively [45]. We hypothesized that the capping agents in our experiment had a high content of those two amino acids, which were responsible for the negative charge of AuNPs. At pH 2, these amino acids would have a positive charge and, thus, we expected to obtain positively charged AuNPs. However, we did not confirm that hypothesis. We believe that there are other molecules in addition to the proteins (confirmed by the FTIR technique) that form capping agents on the surface of AuNPs. It was recommended to use more precise techniques, such as X-ray photoelectron spectroscopy (XPS) or nuclear magnetic resonance (NMR), for the detection of these non-protein molecules [46,47]. In the future, we plan to analyze the surface of AuNPs using those approaches and reveal the composition of the capping agent formed during our AuNP production.
In summary, while using a biological method to produce nanoparticles is safe, fast, inexpensive, and environmentally friendly, it does not offer a wide range of nanoparticle charge manipulation (from negative to positive). In our previous research, we conjugated chemotherapeutic drugs directly to the biologically prepared AuNPs by electrostatic interactions [24,26]. The interaction was based on the effector molecule used. A minor modification to the cargo can make a significant difference in the interaction with AuNPs. For example, dsDNA or dsRNA molecules could not attach to the non-biological AuNPs with the negative surface charge [48]. However, this was not the case for ssDNA [48] and ssRNA [49] molecules. Those molecules possessed negative charge due to the fact of their phosphate groups, preventing an ionic bond to the negatively charged AuNPs. Nevertheless, the conjugation occurred via electrostatic interactions, as those nucleic acids, like the polar molecules, adsorbed to the negatively charged AuNPs via their nitrogen bases [48,49].
Using polyethyleneimine (PEI) [42] or cetyltrimethylammonium bromide (CTAB) [43] is another way to change the surface charge of the nanoparticles. These molecules have been successfully used to obtain positively charged non-biological AuNPs. Considering that the main advantage of the biologically prepared AuNPs is the avoidance of additional chemicals, we prefer to avoid such compounds if possible.
Based on the results of TEM (Figure 4, Figure 5, Figure 10, Figure 11 and Figure 12 and Table 1 and Table 2) and the average size distribution (hydrodynamic diameter) (Figure 14), the sizes of the nanoparticles measured by TEM were smaller than those obtained by DLS. According to Maguire et al., the digital images from TEM differ from DLS [33]. On this basis, the results of these two different techniques are complementary and aligned. In this study, we used three different techniques (i.e., TEM, SEM, and DLS) to determine the dimensions of the AuNPs. According to Eaton et al., although all three methods were able to characterize the AuNPs, SEM and DLS were the least suitable for small AuNPs, and TEM was able to measure very small particles [32].

4. Conclusions

In conclusion, the production of AuNPs by F. oxysporum is possible at different pH values. The AuNPs possessed negative zeta potential with the pH gradient used. More favorable size and zeta potential values were obtained at natural to alkaline pH values (from 6 to 10). We demonstrated that after the production of AuNPs, pH adjustment could only be performed for the samples produced at the natural to alkaline pH values, resulting in AuNPs with sizes below 100 nm. The surface charge of the produced AuNPs was negative at all pH variants tested. The capping agents directly controlled the AuNPs’ surface charge, and we suggest the presence of non-protein molecules within the capping agent. Thus, in the future, we plan to conduct different experiments to reveal the composition of the capping agent using SDS-PAGE, which will be followed by liquid chromatography mass spectrometry (LC-MS/MS). Moreover, using NMR as well as XPS will help us to distinguish the non-protein molecules that served as the capping agent. The biological method of producing nanoparticles is safe, fast, simple, and environmentally friendly. However, it suffers from the restricted possibility to manipulate the AuNPs’ surface charge, resulting in limited application in the medical field. If in the future biological AuNPs are intended for drug or gene delivery applications, we recommend that the best way is to use the AuNPs in their natural forms and to manipulate the cargo for linking to biological AuNPs.

Author Contributions

Conceptualization, Methodology, and Investigation P.P.; Software, Formal Analysis, TEM and SEM; and Imaging and Analyzing, O.B.; Validation and Writing—Review and Editing, M.P.; Writing—Original Draft and Visualization, E.N.; Software, FTIR and DLS; Analyses, and Interpretations, V.D.; Supervision, Resources, and Project administration, V.B. All authors have read and agreed to the published version of the manuscript.

Funding

This work was supported by ESF International Mobility of Researchers—MSCA-IF IV (Institute of Microbiology of CAS, v.v.i.) No. CZ.02.2.69/0.0/0.0/20_079/0017812.

Institutional Review Board Statement

Not applicable.

Informed Consent Statement

Not applicable.

Data Availability Statement

Not applicable.

Acknowledgments

We wish to thank CMS-Biocev (“Biophysical Techniques, Crystallization, Diffraction, Structural Mass Spectrometry”) of CIISB, the Instruct-CZ Centre, supported by MEYS CR (LM2018127). We also wish to thank Miroslav Kolařík, Head of the Laboratory of Fungal Genetics and Metabolism, for help with fungal cultivation.

Conflicts of Interest

The authors declare no conflict of interest.

References

  1. Liz-Marzán, L.M. Tailoring surface plasmons through the morphology and assembly of metal nanoparticles. Langmuir 2006, 22, 32–41. [Google Scholar] [CrossRef]
  2. Jans, H.; Jans, K.; Lagae, L.; Borghs, G.; Maes, G.; Huo, Q. Poly (acrylic acid)-stabilized colloidal gold nanoparticles: Synthesis and properties. Nanotechnology 2010, 21, 455702. [Google Scholar] [CrossRef] [PubMed]
  3. Wu, C.-S.; Liu, F.-K.; Ko, F.-H. Potential role of gold nanoparticles for improved analytical methods: An introduction to characterizations and applications. Anal. Bioanal. Chem. 2011, 399, 103–118. [Google Scholar] [CrossRef] [PubMed]
  4. Hermann, R.; Walther, P.; Müller, M. Immunogold labeling in scanning electron microscopy. Histochem. Cell Biol. 1996, 106, 31–39. [Google Scholar] [CrossRef] [PubMed]
  5. Roth, J.; Bendayan, M.; Orci, L. Ultrastructural localization of intracellular antigens by the use of protein A-gold complex. J. Histochem. Cytochem. 1978, 26, 1074–1081. [Google Scholar] [CrossRef]
  6. Wu, Y.; Ali, M.R.K.; Chen, K.; Fang, N.; El-Sayeda, M.A. Gold nanoparticles in biological optical imaging. Nano Today 2019, 24, 120–140. [Google Scholar] [CrossRef]
  7. Riley, R.S.; Day, E.S. Gold nanoparticle—Mediated photothermal therapy: Applications and opportunities for multimodal cancer treatment. Wiley Interdiscip. Rev. Nanomed. Nanobiotechnol. 2017, 9, e1449. [Google Scholar] [CrossRef]
  8. Pala, R.; Anju, V.; Dyavaiah, M.; Busi, S.; Nauli, S.M. Nanoparticle-mediated drug delivery for the treatment of cardiovascular diseases. Int. J. Nanomed. 2020, 15, 3741. [Google Scholar] [CrossRef] [PubMed]
  9. Ding, Y.; Jiang, Z.; Saha, K.; Kim, C.S.; Kim, S.T.; Landis, R.F.; Rotello, V.M. Gold nanoparticles for nucleic acid delivery. Mol. Ther. 2014, 22, 1075–1083. [Google Scholar] [CrossRef] [Green Version]
  10. Ghosh, P.S.; Kim, C.-K.; Han, G.; Forbes, N.S.; Rotello, V.M. Efficient gene delivery vectors by tuning the surface charge density of amino acid-functionalized gold nanoparticles. ACS Nano 2008, 2, 2213–2218. [Google Scholar] [CrossRef] [PubMed] [Green Version]
  11. KC, R.B.; Thapa, B.; Bhattarai, N. Gold nanoparticle-based gene delivery: Promises and challenges. Nanotechnol. Rev. 2014, 3, 269–280. [Google Scholar]
  12. Padayachee, J.; Singh, M. Therapeutic applications of CRISPR/Cas9 in breast cancer and delivery potential of gold nanomaterials. Nanobiomedicine 2020, 7, 1849543520983196. [Google Scholar] [CrossRef]
  13. Pourali, P.; Badiee, S.H.; Manafi, S.; Noorani, T.; Rezaei, A.; Yahyaei, B. Biosynthesis of gold nanoparticles by two bacterial and fungal strains, Bacillus cereus and Fusarium oxysporum, and assessment and comparison of their nanotoxicity in vitro by direct and indirect assays. Electron. J. Biotechnol. 2017, 29, 86–93. [Google Scholar] [CrossRef]
  14. Molnár, Z.; Bódai, V.; Szakacs, G.; Erdélyi, B.; Fogarassy, Z.; Sáfrán, G.; Varga, T.; Kónya, Z.; Tóth-Szeles, E.; Szűcs, R. Green synthesis of gold nanoparticles by thermophilic filamentous fungi. Sci. Rep. 2018, 8, 1–12. [Google Scholar] [CrossRef]
  15. Graily-Moradi, F.; Mallak, A.M.; Ghorbanpour, M. Biogenic Synthesis of Gold Nanoparticles and Their Potential Application in Agriculture. In Biogenic Nano-Particles and their Use in Agro-Ecosystems; Springer: Berlin/Heidelberg, Germany, 2020; pp. 187–204. [Google Scholar]
  16. Baldrian, P. Forest microbiome: Diversity, complexity and dynamics. FEMS Microbiol. Rev. 2017, 41, 109–130. [Google Scholar] [CrossRef] [PubMed] [Green Version]
  17. Zhang, T.; Liu, H.; Lv, B.; Li, C. Regulating strategies for producing carbohydrate active enzymes by filamentous fungal cell factories. Front. Bioeng. Biotechnol. 2020, 8, 691. [Google Scholar] [CrossRef] [PubMed]
  18. Horbach, R.; Navarro-Quesada, A.R.; Knogge, W.; Deising, H.B. When and how to kill a plant cell: Infection strategies of plant pathogenic fungi. J. Plant Physiol. 2011, 168, 51–62. [Google Scholar] [CrossRef]
  19. Meyer, V.; Andersen, M.R.; Brakhage, A.A.; Braus, G.H.; Caddick, M.X.; Cairns, T.C.; de Vries, R.P.; Haarmann, T.; Hansen, K.; Hertz-Fowler, C. Current challenges of research on filamentous fungi in relation to human welfare and a sustainable bio-economy: A white paper. Fungal Biol. Biotechnol. 2016, 3, 1–17. [Google Scholar] [CrossRef] [PubMed] [Green Version]
  20. Paterson, R.R.M.; Lima, N. Filamentous fungal human pathogens from food emphasising Aspergillus, Fusarium and Mucor. Microorganisms 2017, 5, 44. [Google Scholar] [CrossRef] [Green Version]
  21. Hyde, K.D.; Xu, J.; Rapior, S.; Jeewon, R.; Lumyong, S.; Niego, A.G.T.; Abeywickrama, P.D.; Aluthmuhandiram, J.V.; Brahamanage, R.S.; Brooks, S. The amazing potential of fungi: 50 ways we can exploit fungi industrially. Fungal Divers. 2019, 97, 1–136. [Google Scholar] [CrossRef] [Green Version]
  22. Kitching, M.; Ramani, M.; Marsili, E. Fungal biosynthesis of gold nanoparticles: Mechanism and scale up. Microb. Biotechnol. 2015, 8, 904–917. [Google Scholar] [CrossRef]
  23. Vágó, A.; Szakacs, G.; Sáfrán, G.; Horvath, R.; Pécz, B.; Lagzi, I. One-step green synthesis of gold nanoparticles by mesophilic filamentous fungi. Chem. Phys. Lett. 2016, 645, 1–4. [Google Scholar] [CrossRef]
  24. Pourali, P.; Yahyaei, B.; Afsharnezhad, S. Bio-synthesis of gold nanoparticles by Fusarium oxysporum and assessment of their conjugation possibility with two types of β-lactam antibiotics without any additional linkers. Microbiology 2018, 87, 229–237. [Google Scholar] [CrossRef]
  25. Reddy, A.S.; Chen, C.-Y.; Chen, C.-C.; Jean, J.-S.; Chen, H.-R.; Tseng, M.-J.; Fan, C.-W.; Wang, J.-C. Biological synthesis of gold and silver nanoparticles mediated by the bacteria Bacillus subtilis. J. Nanosci. Nanotechnol. 2010, 10, 6567–6574. [Google Scholar] [CrossRef] [PubMed]
  26. Yahyaei, B.; Pourali, P. One step conjugation of some chemotherapeutic drugs to the biologically produced gold nanoparticles and assessment of their anticancer effects. Sci. Rep. 2019, 9, 1–15. [Google Scholar] [CrossRef] [PubMed] [Green Version]
  27. Arslan, Y.; Matoušek, T.; Kratzer, J.; Musil, S.; Benada, O.; Vobecký, M.; Ataman, O.; Dědina, J. Gold volatile compound generation: Optimization, efficiency and characterization of the generated form. J. Anal. At. Spectrom. 2011, 26, 828–837. [Google Scholar] [CrossRef]
  28. Benada, O.; Pokorný, V. Modification of the Polaron sputter—Coater unit for glow—Discharge activation of carbon support films. J. Electron Microsc. Tech. 1990, 16, 235–239. [Google Scholar] [CrossRef] [PubMed]
  29. Navarro Pacheco, N.I.; Roubalova, R.; Semerad, J.; Grasserova, A.; Benada, O.; Kofronova, O.; Cajthaml, T.; Dvorak, J.; Bilej, M.; Prochazkova, P. In Vitro Interactions of TiO2 Nanoparticles with Earthworm Coelomocytes: Immunotoxicity Assessment. Nanomaterials 2021, 11, 250. [Google Scholar] [CrossRef] [PubMed]
  30. Park, S.; Lee, W.J.; Park, S.; Choi, D.; Kim, S.; Park, N. Reversibly pH-responsive gold nanoparticles and their applications for photothermal cancer therapy. Sci. Rep. 2019, 9, 1–9. [Google Scholar]
  31. Murphy, C.J.; Gole, A.M.; Stone, J.W.; Sisco, P.N.; Alkilany, A.M.; Goldsmith, E.C.; Baxter, S.C. Gold nanoparticles in biology: Beyond toxicity to cellular imaging. Acc. Chem. Res. 2008, 41, 1721–1730. [Google Scholar] [CrossRef] [PubMed]
  32. Eaton, P.; Quaresma, P.; Soares, C.; Neves, C.; De Almeida, M.; Pereira, E.; West, P. A direct comparison of experimental methods to measure dimensions of synthetic nanoparticles. Ultramicroscopy 2017, 182, 179–190. [Google Scholar] [CrossRef] [PubMed]
  33. Maguire, C.M.; Rösslein, M.; Wick, P.; Prina-Mello, A. Characterisation of particles in solution–A perspective on light scattering and comparative technologies. Sci. Technol. Adv. Mater. 2018, 19, 732–745. [Google Scholar] [CrossRef] [PubMed]
  34. Mangiafico, S. Summary and Analysis of Extension Program Evaluation in R, v. 1.2. 1.; Rutgers Cooperative Extension: New Brunswick, NJ, USA, 2016. [Google Scholar]
  35. Mangiafico, S. Summary and Analysis of Extension Program Evaluation in R Version 1.15.0. 2016. Available online: https://rcompanion.org/documents/RHandbookProgramEvaluation.pdf (accessed on 11 November 2021).
  36. Mojet, B.L.; Ebbesen, S.D.; Lefferts, L. Light at the interface: The potential of attenuated total reflection infrared spectroscopy for understanding heterogeneous catalysis in water. Chem. Soc. Rev. 2010, 39, 4643–4655. [Google Scholar] [CrossRef] [PubMed]
  37. Gurunathan, S.; Kalishwaralal, K.; Vaidyanathan, R.; Venkataraman, D.; Pandian, S.R.K.; Muniyandi, J.; Hariharan, N.; Eom, S.H. Biosynthesis, purification and characterization of silver nanoparticles using Escherichia coli. Colloids Surf. B Biointerfaces 2009, 74, 328–335. [Google Scholar] [CrossRef]
  38. Hoshyar, N.; Gray, S.; Han, H.; Bao, G. The effect of nanoparticle size on in vivo pharmacokinetics and cellular interaction. Nanomedicine 2016, 11, 673–692. [Google Scholar] [CrossRef] [PubMed] [Green Version]
  39. Mishra, A.; Tripathy, S.K.; Yun, S.-I. Fungus mediated synthesis of gold nanoparticles and their conjugation with genomic DNA isolated from Escherichia coli and Staphylococcus aureus. Process. Biochem. 2012, 47, 701–711. [Google Scholar] [CrossRef]
  40. Lim, H.-A.; Mishra, A.; Yun, S.-I. Effect of pH on the extra cellular synthesis of gold and silver nanoparticles by Saccharomyces cerevisae. J. Nanosci. Nanotechnol. 2011, 11, 518–522. [Google Scholar] [CrossRef] [PubMed]
  41. Mishra, A.; Tripathy, S.K.; Wahab, R.; Jeong, S.-H.; Hwang, I.; Yang, Y.-B.; Kim, Y.-S.; Shin, H.-S.; Yun, S.-I. Microbial synthesis of gold nanoparticles using the fungus Penicillium brevicompactum and their cytotoxic effects against mouse mayo blast cancer C 2 C 12 cells. Appl. Microbiol. Biotechnol. 2011, 92, 617–630. [Google Scholar] [CrossRef] [PubMed]
  42. Song, W.J.; Du, J.Z.; Sun, T.M.; Zhang, P.Z.; Wang, J. Gold nanoparticles capped with polyethyleneimine for enhanced siRNA delivery. Small 2010, 6, 239–246. [Google Scholar] [CrossRef] [PubMed]
  43. Miao, X.; Ning, X.; Li, Z.; Cheng, Z. Sensitive detection of miRNA by using hybridization chain reaction coupled with positively charged gold nanoparticles. Sci. Rep. 2016, 6, 1–9. [Google Scholar]
  44. Fayaz, A.M.; Girilal, M.; Rahman, M.; Venkatesan, R.; Kalaichelvan, P. Biosynthesis of silver and gold nanoparticles using thermophilic bacterium Geobacillus stearothermophilus. Process. Biochem. 2011, 46, 1958–1962. [Google Scholar] [CrossRef]
  45. Guan, H.; Zhou, P.; Zhou, X.; He, Z. Sensitive and selective detection of aspartic acid and glutamic acid based on polythiophene–gold nanoparticles composite. Talanta 2008, 77, 319–324. [Google Scholar] [CrossRef] [PubMed]
  46. Belsey, N.A.; Shard, A.G.; Minelli, C. Analysis of protein coatings on gold nanoparticles by XPS and liquid-based particle sizing techniques. Biointerphases 2015, 10, 019012. [Google Scholar] [CrossRef] [PubMed] [Green Version]
  47. Bourg, M.-C.; Badia, A.; Lennox, R.B. Gold−sulfur bonding in 2D and 3D self-assembled monolayers: XPS characterization. J. Phys. Chem. B 2000, 104, 6562–6567. [Google Scholar] [CrossRef]
  48. Li, H.; Rothberg, L. Detection of specific sequences in RNA using differential adsorption of single-stranded oligonucleotides on gold nanoparticles. Anal. Chem. 2005, 77, 6229–6233. [Google Scholar] [CrossRef] [PubMed]
  49. Shawky, S.M.; Bald, D.; Azzazy, H.M. Direct detection of unamplified hepatitis C virus RNA using unmodified gold nanoparticles. Clin. Biochem. 2010, 43, 1163–1168. [Google Scholar] [CrossRef]
Figure 1. Color changes of mycelium-free supernatant in response to different pH values.
Applsci 11 11559 g001
Figure 2. Visible spectra of five samples with different pH values (pH values were adjusted before the preparation of AuNPs). The samples were diluted 1:2 with ddH2O.
Applsci 11 11559 g002
Figure 3. Samples with different pH levels before and after the washing process exhibited different behavior: (A) control (mycelium-free supernatant); (B) gold nanoparticles prepared at pH 10 before washing; (C) gold nanoparticles prepared at pH 10 after washing; (D) gold nanoparticles prepared at pH 4 before washing; (E) gold nanoparticles prepared at pH 4 after washing.
Applsci 11 11559 g003
Figure 4. TEM images obtained from different samples: (A) unwashed sample at pH 2; (B) washed sample at pH 6; (C,D) washed sample at pH 2; (E,F) washed sample at pH 10. Scale bars: (A) = 200 nm; (B) = 200 nm; (C) = 200 nm; (D) = 1 µm; (E,F) = 100 nm; the inserts in (A,B) = 100 nm.
Applsci 11 11559 g004
Figure 5. Particle analysis of TEM images of washed sample at pH 6 (the pH was adjusted before the preparation of the AuNPs). The probability plot (A) and histogram (B) confirmed an approximately normal distribution of the mean diameter of the particles.
Applsci 11 11559 g005
Figure 6. SEM and EDS images of different samples. (A) SEM results of a washed pH 2 sample of glow-discharge-activated silicon wafer. (B) SEM results of a washed sample at pH 10 from glow-discharge-activated silicon wafer. (C,D) EDS analysis of a washed sample on a non-activated silicon wafer support. Drying the sample on a hydrophobic surface resulted in the formation of large aggregates of AuNPs at the edge of the dried sample. The individual spot positions marked in (C) and the corresponding spectra can be seen in (D). (E,F) EDS analysis of a washed sample at pH 10 on an activated silicon wafer support. The aggregation of AuNPs at the edge of the sample was minimized; however, the Au signal from the individual AuNPs was weak, while the intensity of the Si Kα peak from the silicon wafer support was predominant. The inserts in (D,F) show the effect of non-activated (D) and activated (F) silicon wafer supports on the final SEM sample formation after air-drying. Scale bars: (A,B) = 1 µm; (C) = 100 µm; (E) = 5 µm.
Applsci 11 11559 g006
Figure 7. FTIR analysis of AuNPs at pH 10 confirmed the presence of proteins as capping agents.
Applsci 11 11559 g007
Figure 8. pH adjustment after AuNP preparation. Two samples with acidic and alkaline pH were used (pH 4 and 10): (A) initial color of the sample at pH 10 in contrast to control; (B) color-changed AuNPs after second pH adjustment; (C) initial color of the sample at pH 4 in contrast to control; (D) color-changed AuNPs after the second pH adjustment.
Applsci 11 11559 g008
Figure 9. Visible spectra of five samples with different pH values (here the pH values were adjusted after the preparation of AuNPs with an initial pH of 10). The samples were diluted 1:2 with ddH2O.
Applsci 11 11559 g009
Figure 10. TEM Images obtained from different samples: (A,B) washed sample at pH 6; (C,D) washed sample at pH 10. Scale bars for (A,C) = 200 nm; (B,D) = 100 nm.
Applsci 11 11559 g010
Figure 11. Particle analysis of TEM images of a washed sample at pH 6 (pH was adjusted after the AuNPs were prepared). The probability plot (A) and histogram (B) confirmed an approximately normal distribution of the mean diameter of the particles.
Applsci 11 11559 g011
Figure 12. Blue dots correspond to the nanoparticles that had a pH value that was adjusted before AuNP preparation, and the red dots correspond to nanoparticles that had a pH value that was adjusted after AuNP preparation. (A) The mean diameter of AuNPs prepared at pH 6; (B) the aspect ratio of AuNPs prepared at pH 6.
Applsci 11 11559 g012
Figure 13. SEM and EDS images obtained from different samples: (A,B) SEM results of the washed sample at pH 10; (C) EDS results of the washed sample at pH 10. The samples were placed on glow-discharge-activated silicon wafers.
Applsci 11 11559 g013
Figure 14. Average size (hydrodynamic diameter) of AuNPs obtained at different pH values.
Applsci 11 11559 g014
Figure 15. Zeta potential of the obtained AuNPs at different pH values. The different pH values were adjusted before and after the preparation of AuNPs.
Applsci 11 11559 g015
Table 1. Summary of descriptive statistics of the AuNPs size of the washed sample at pH 6 (the pH was adjusted prior to the preparation of the AuNPs) shown in Figure 4B and Figure 5. The table summarizes the standard output of the R function describe see details in Mangiafico [34,35]. Vars = number of variables in a data set; N = size of a data set; mean = arithmetic mean; SD = standard deviation; median = the mean value in a data set; trimmed = mean trimmed to 60%, 20% off each side; mad = the absolute deviation of the median; min = minimum value in a data set; max = maximum value in a data set; skew = skewness, the degree of asymmetry in a data set; kurtosis = a measure of extreme outliers; SE = standard error of the mean.
VarsNMeanSDMedianTrimmedMadMinMaxRangeSkewKurtosisSE
Diameter_Mean1416.016.35.215.915.94.94.840.335.50.91.70.3
Diameter_Min1416.012.84.712.512.64.51.528.226.60.40.10.2
Diameter_Max1416.018.25.717.717.85.16.147.441.31.02.60.3
Table 2. Summary of descriptive statistics of the size of a washed sample at pH 6 (the pH was adjusted after the preparation of the AuNPs) shown in Figure 10A,B. Abbreviations are shown in Table 1.
VarsNMeanSDMedianTrimmedMadMinMaxRangeSkewKurtosisSE
Diameter_Mean118920.87.320.620.77.83.643.940.30.2−0.20.5
Diameter_Min118918.56.818.418.37.32.241.339.10.2−0.10.5
Diameter_Max118922.47.722.122.38.34.047.743.70.2−0.20.6
Publisher’s Note: MDPI stays neutral with regard to jurisdictional claims in published maps and institutional affiliations.

