Article

Reuse of Pruning Waste from Subtropical Fruit Trees and Urban Gardens as a Source of Nutrients: Changes in the Physical, Chemical, and Biological Properties of the Soil

by
Marino Pedro Reyes-Martín
1,*,
Irene Ortiz-Bernad
1,
Antonio M. Lallena
2,
Layla M. San-Emeterio
3,
M. Lourdes Martínez-Cartas
4 and
Emilia Fernández Ondoño
1
1
Department of Soil Science and Agricultural Chemistry, University of Granada, Av. de Fuente Nueva s/n, 18071 Granada, Spain
2
Department of Atomic, Molecular and Nuclear Physics, University of Granada, Av. de Fuente Nueva s/n, 18071 Granada, Spain
3
Department of Biogeochemistry and Plant and Microbial Ecology, Institute of Natural Resources and Agrobiology (IRNAS), Av. Reina Mercedes 10, 41012 Seville, Spain
4
Department of Chemical, Environmental and Materials Engineering, University of Jaen, Campus Las Lagunillas s/n, 23071 Jaen, Spain
*
Author to whom correspondence should be addressed.
Submission received: 20 November 2021 / Revised: 9 December 2021 / Accepted: 21 December 2021 / Published: 25 December 2021
(This article belongs to the Special Issue From Organic Wastes to Bioresources: Toward a Circular Economy)

Abstract

:
A field experiment was conducted on the Andalusian coast (Granada, Southern Spain) to study the time course of nutrient release into the soil after the addition of bagged pruning waste from subtropical orchard trees (avocado, cherimoya, and mango) and urban garden waste over three two-year periods. N, P, and K concentrations were greater in the garden waste, whilst avocado and cherimoya pruning waste registered the highest values for Mg. In general, micronutrient contents were low in all waste, especially Cu. Macronutrient release followed a three-phase dynamic: fast initial release, intermediate stabilization, and final increase. Garden waste showed a similar time course in all three trees and released greater concentrations of K and P. The annual decomposition rate factor k was negative for N and Ca in the avocado tree, indicating strong biological activity in this plot. Avocado, cherimoya, and garden waste showed a good microbial degradation, improving soil quality by increasing carbon and nitrogen contents as well as soil microbial activity. As for the mango tree, its special microclimatic conditions appeared to favor waste photodegradation, thus eliminating nutrients that were not incorporated into the soil. Soil enzymatic activities increased in the avocado and cherimoya trees with the addition of all waste. In the mango tree, only an increase in urease was detected after the addition of garden waste. Our results suggest that the time course of organic waste in different subtropical trees grown on similar soils is significantly conditioned by the microclimatic characteristics.

1. Introduction

Agricultural production requires regular use of inorganic fertilizers. However, inorganic fertilizers are increasingly scarce and difficult to obtain from natural resources; additionally, their excessive application increases soil and water contamination and may contribute to create unsustainable food systems when the nutrient flows are badly used [1]. Therefore, the use of waste products appears to be an optimal option for enhancing nutrient soil restoration [2]. Even though agricultural macronutrient flows (N, P, and K) are controlled mainly by inorganic fertilizers, other nutrient resources, such as atmospheric deposition, crop waste, and livestock manure, represent major inputs, which are still largely unknown [3,4]. Additionally, cover crops constitute a good strategy of supplying essential nutrients that contribute to more ecologically sustainable management, particularly in the context of organic farming practices [5].
Studies concerning Na, Ca, and Mg dynamics in soils after the spreading of crop wastes report correlations among these nutrients and with soil quality [6]. Nevertheless, data on the inputs of micronutrients (Fe, Mn, Cu, and Zn) are widely unavailable. Micronutrients are as essential as macronutrients for crop development and their deficiency causes multiple imbalances in the plant’s physiology. Micronutrient fertilizers are applied mainly in soluble forms, such as chelates, fertilizing mixtures, or sprays. However, these soluble compounds are frequently lost by leaching and are not assimilated by the crops [7].
As another essential element for agrosystem soil improvement, organic matter contributes to soil structure development and consequently to soil’s water retention capacity [8], among other important physical and biological properties [9,10]. In addition, soil C sequestration in the form of organic matter efficiently helps mitigate climate change [11,12].
Pruning waste can provide nutrients to crops. This contribution depends on the nutrient amount as well as the composition and decomposition rate of the waste [13]. The decomposition of plant remains is vital in ecosystems and, besides releasing nutrients, this material also increases the content of soil organic matter [14], thus enhancing soil quality.
Tree crops generate large amounts of wastes that are traditionally incinerated, with the consequent loss of some nutrients and C [15]. The application of crop debris on the soil surface helps to reduce soil erosion, increase soil C sequestration, and return part of the nutrients to the environment, thereby promoting more sustainable agriculture [12]. This also applies to garden wastes that, in certain areas, such as the subtropical coast of Andalusia (S Spain), can be used for nutrient supplementation. Among other factors, the waste quality depends on the C:N and lignin:N ratios [6,16,17], the P and K contents [18,19], and the lignin proportion [20]. As shown in previous studies [21], nutrient release can alter soil microbial activity. This has been reported for activities of enzymes such as β-glucosidase and dehydrogenase [22], as well as urease and phosphatase, over time periods longer than six years [23].
In previous studies performed on the subtropical coast of Andalusia (S Spain) [24], we have demonstrated that pruning waste from avocado, mango, cherimoya, and gardens are mineralized depending on their C:N ratios and hemicellulose, cellulose, and lignin contents, in agreement with other authors [18].
In the present study, our hypothesis is that nutrient release from pruning waste is controlled by several factors, including initial concentrations of C and N, soil quality, microclimatic characteristics, and soil microbial activity that can be detected through changes in soil enzymatic activities.
The aim of this work is to study the time course of nutrient release to the soil after the addition of bagged pruning waste of subtropical crops (avocado, cherimoya, and mango) and urban garden waste over three two-year periods. For this, we seek to determine (1) the initial and final contents of macronutrients and micronutrients in different pruning waste, (2) the nutrient release to the soil, and (3) the effect of nutrient release on the changes observed in soil properties and soil enzymatic activities.

2. Materials and Methods

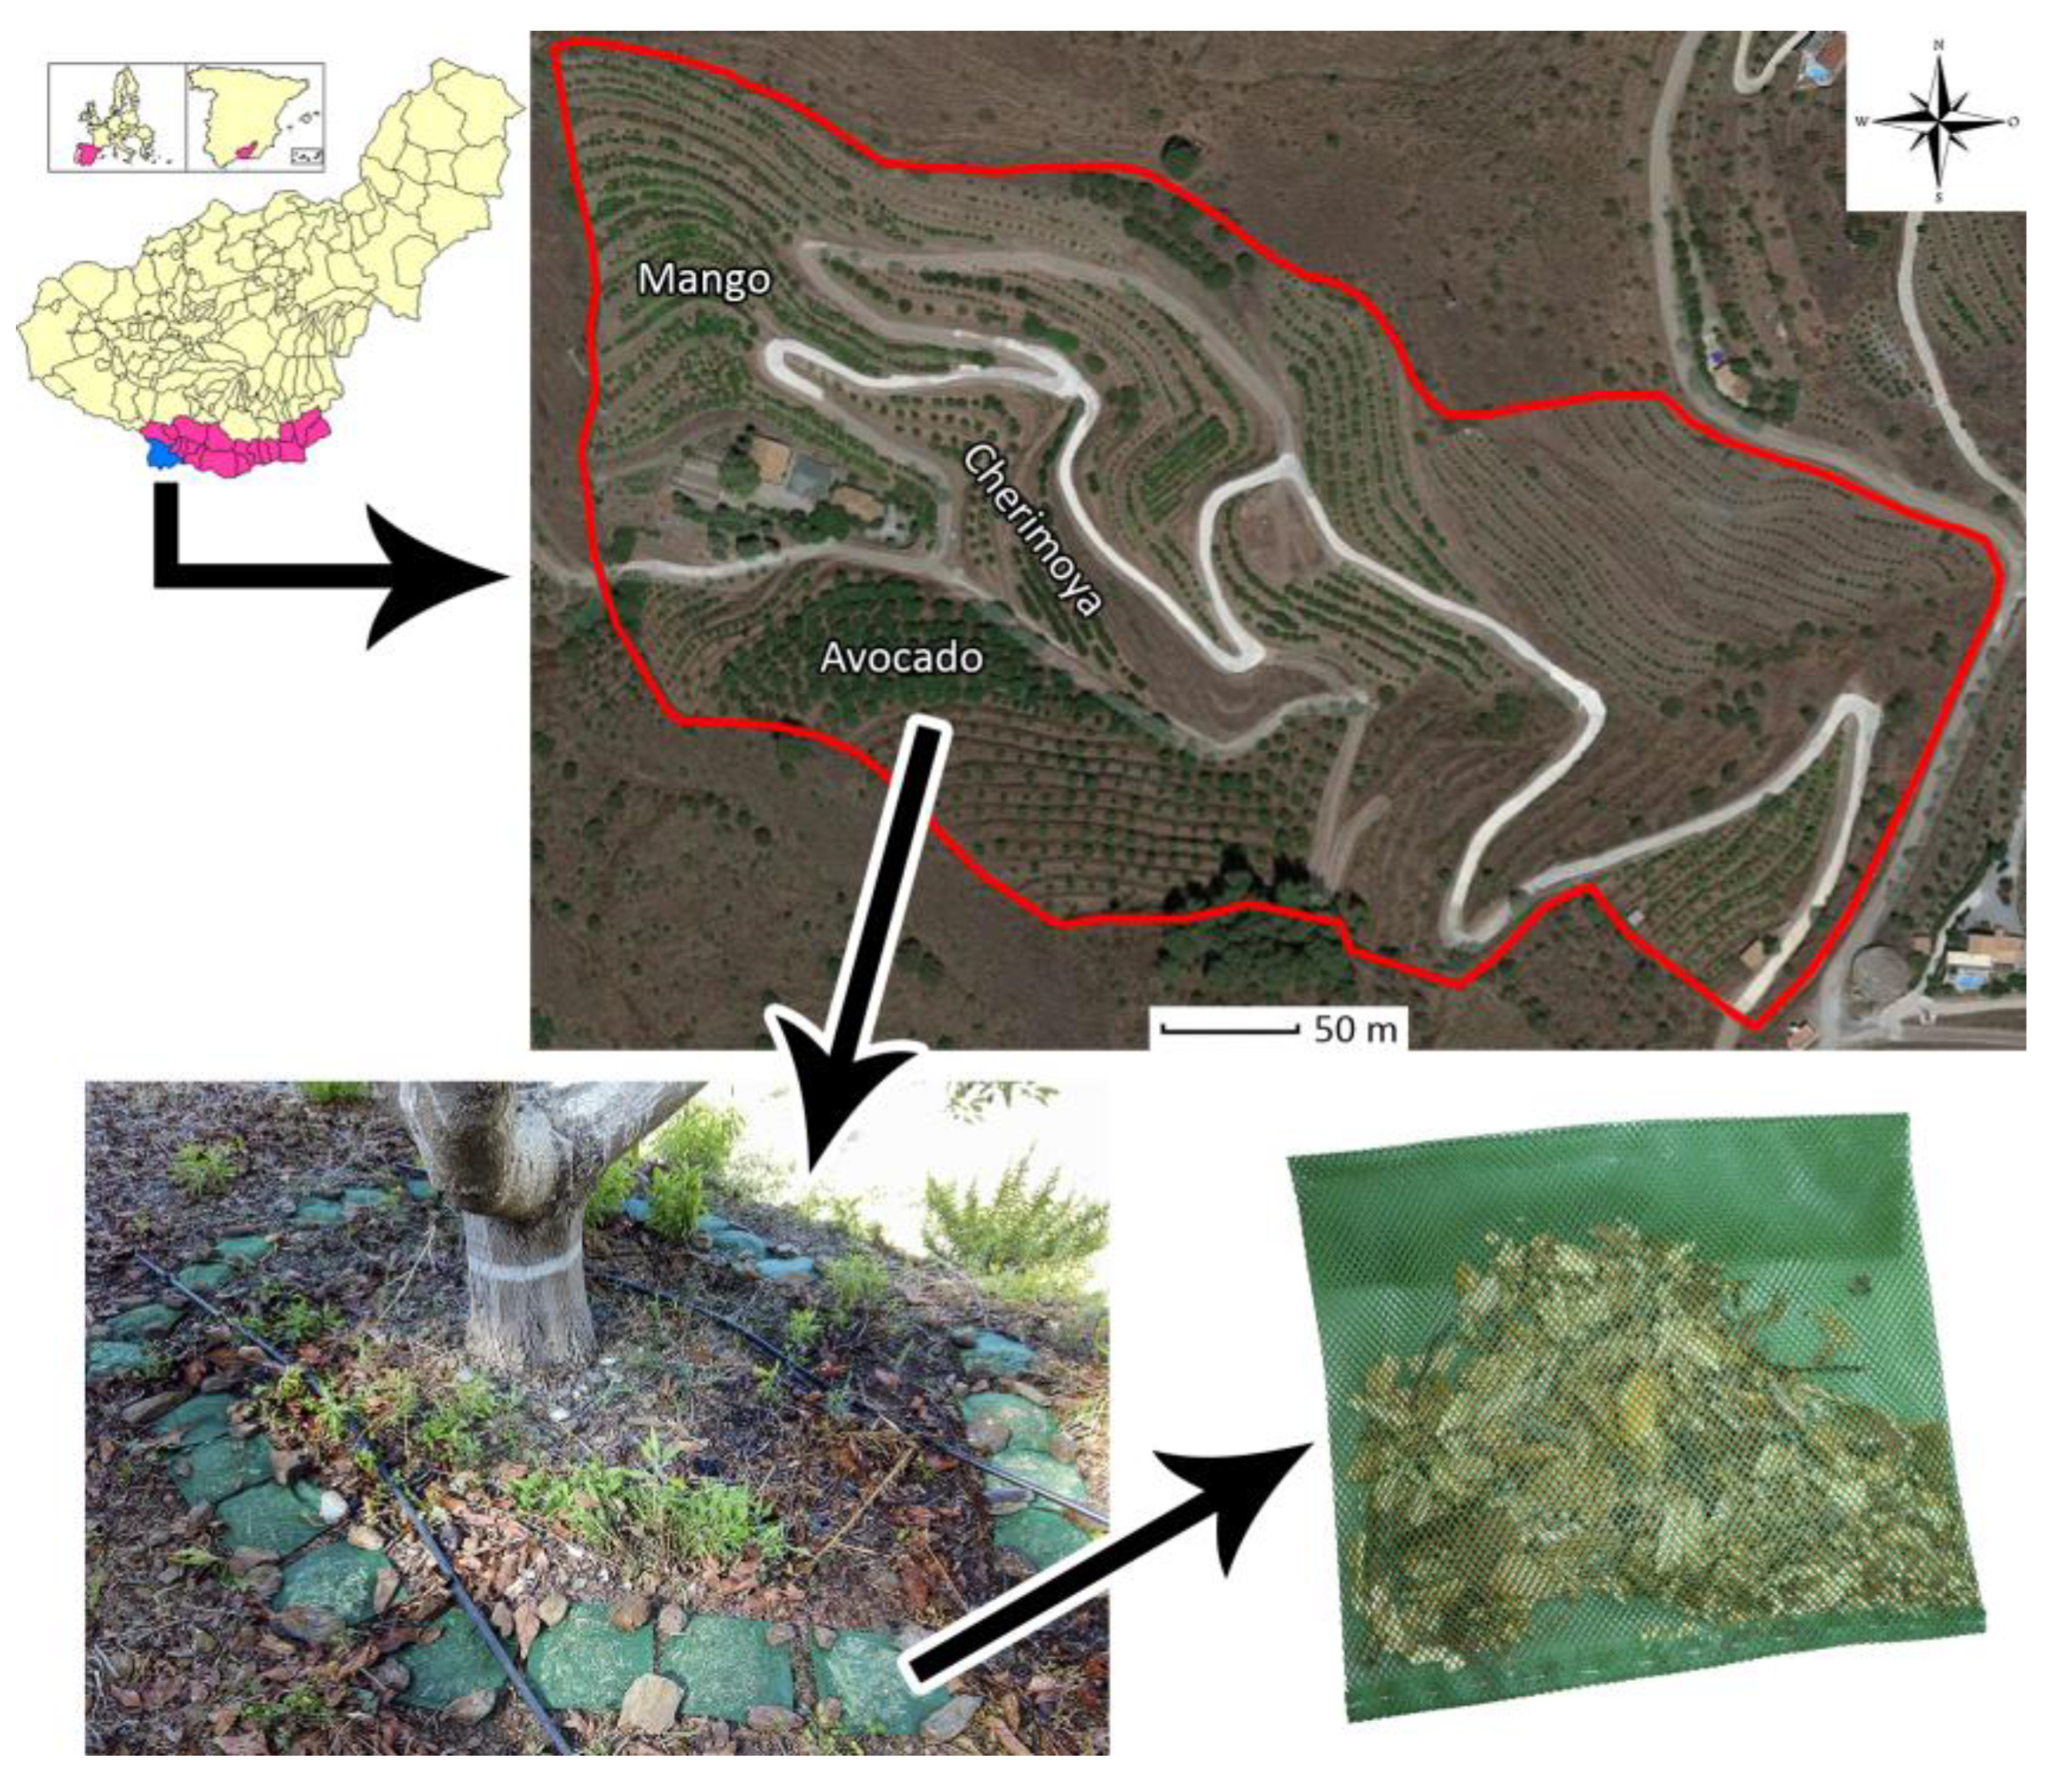
2.1. Study Sites and Experimental Design

The three study sites were located in the experimental farm “El Zahorí” (36°45′54.2″ N, 3°39′55.0″ W, 235 m a.s.l.), in the municipality of Almuñécar (Granada, S Spain) (Figure 1). The experiments were conducted using bagged pruning waste under the canopies of avocado trees (Persea americana Mill.), cherimoya trees (Annona cherimola Mill.), and mango trees (Mangifera indica), grown on soils classified by the FAO (Food and Agriculture Organization) as Eutric Escalic Anthrosols [25], formed on schists.
The experimental farm is located in an area with slopes that vary between 30 and 60%. The crops are located on flat terraces. The climate is subtropical Mediterranean, with an average temperature during the study period of 21.3 °C (maximum average monthly temperature of 30.5 °C and minimum of 6.9 °C), average relative humidity of 77%, accumulated rainfall of 5323.6 mm, and accumulated evapotranspiration (ETo) of 7322.2 mm. The avocado, cherimoya, and mango crops have a planting frame of 8, 6, and 3 m and an age of 29, 21, and 14 years, respectively. Data related to the soil properties analyzed at the beginning of the experiment appear in Table 1.
Fertilizer was applied with fertigation including N, P, K, Fe (chelated), Zn, and B. Trees were pruned every year and different amounts of pruning debris were collected depending on the crop, reaching approximate values of 12 kg/tree in avocado, 6 kg/tree in cherimoya, and 3 kg/tree in mango.
To study the decomposition of the pruning waste, we applied the standard technique of bagging, as in many other studies for the decomposition of dead leaves [26,27]. Under each of these trees (avocado, cherimoya, and mango), bags of PVC net measuring 26 × 26 cm with a 2 mm mesh size were filled with 100 g of fresh shredded pruning waste and then sealed (sewn with nylon thread) and placed 50 cm from the tree trunk after the layer of dead leaves naturally present on the soil surface was removed. It was planned to take three samples (bags) of each type in five sampling periods. Thus, under each tree, 15 bags with pruning waste of the same species, plus another 15 bags with pruning waste from gardens, were placed, for a total of 30 bags under each of the 3 trees, as shown in Figure 1.
At the beginning of the experiment, three representative samples of fresh pruning waste of each kind were taken, to determine initial values for reference. After 3, 6, 12, 18, and 24 months, samples of each kind of tree were collected and taken to the Department of Soil Sciences and Agricultural Chemistry of the University of Granada for analysis. This experiment was repeated for three two-year periods, two of these overlapping in time.
Before starting the treatments at the beginning of the experiment, soil samples under each experimental tree were taken in order to obtain data of the initial soil composition. At the end of the last experiment, soil samples under each pruning bag and soil samples without treatment were taken as well. All these soil samples were taken from a depth of 0–10 cm, using a core sampler (8 × 10 cm, diameter × height), and taken to the lab for an analysis.

2.2. Sample Preparation and Laboratory Analysis

For each sampling period, the samples were collected, labelled, and transported to the laboratory. The pruning and garden wastes were removed from the bags and later weighed after removing the soil particles adhering to the vegetative parts. All samples were then dried for 72 h in a forced-air oven at 65 °C and weighed again, as seen in Table 2. The samples were mixed intensively to a homogeneous composition. From the total volume of dry samples, a representative sample was finely ground in a mill (IKA Werke M20) and screened, using a sieve (C.I.S.A. RP-03) to a particle size of 0.25 to 1 mm. Then, samples were stored in plastic tubes labeled for subsequent analysis.
The macronutrients and micronutrients (Ca, Mg, Na, K, Fe, Cu, Mn, Zn) of the pruning and garden waste were determined by acid digestion of the samples in a microwave digestion oven (XP1500Plus, MARS®), using the foliar function. Subsequently, all the nutrients of the acidic aqueous solution determined were analyzed by atomic absorption spectrometer (SpectrAA 220 FS Varian), except for P [28], which was analyzed using a UV/visible Spectrophotometer (Thermo Helios Alpha UV/Vis Spectrophotometer).
For the determination of the total C and N content of the pruning waste, a representative sample (0.3 g) was used in each case, using an induction furnace and thermal conductivity (LECO TruSpec CN), and values were expressed as percentages.
The soil samples were homogenized and passed through a 2 mm sieve. The pH of the soil samples using a glass electrode (Metrohm 914 pH/conductometer), applying a soil:water ratio of 1:2.5 [29]. The same ratio was used to determine conductivity (Metrohm 914 pH/conductometer). The total C and N content in the soil samples was determined by the same method as used with the pruning waste samples but using 0.15 g of sample. The total organic carbon (TOC) was measured by applying the method used elsewhere [30] and subsequently modified [31] by oxidation with potassium dichromate. Finally, through the cylinder method, bulk density was determined as recommended elsewhere [32].

2.3. Nutrient Release

For all the study periods, nutrient release was calculated using the following formula [33]:
Nt = C0 − [1 − (W0Wt)/Wt]
where Nt is the amount of nutrients released or absorbed (g nutrient/100 g tissue) after a time t (in years), C0 is the initial nutrient concentration (g nutrient/100 g tissue), W0 is the initial dry weight (g), Wt is the dry weight (g) after time t, and Ct is the nutrient concentration after time t (g nutrient/100 g tissue). Given that [34]:
Wt = W0 exp(−k t)
the annual decomposition rate factor k was calculated using Equation (3), as follows:
k = − (1/t) ln (Wt/W0)
Additionally, the decay times T50 and T95 for which the dry weight reduced to 50 and 5% of the initial weight were calculated, as performed elsewhere, by Equations (4) and (5), as follows:
T-50% = (1/k)·ln 2
T-95% = (1/k)·ln 0.05

2.4. Analysis of Soil Enzymatic Activities

The soil samples were kept moist, with the same moisture level as when they were collected. First, the moisture of each sample was measured and then the β-glucosidase, phosphatase, dehydrogenase, and urease activities were measured following the methods detailed elsewhere, respectively [35,36,37,38]. For β-glucosidase and phosphatase activities the results were expressed in µmol p-nitrophenol (PNP) g−1 dry soil matter h−1, for dehydrogenase in µg INTF g−1 dry soil matter h−1 and for urease in µmol N-NH4+ g−1 dry soil matter h−1. Three repeats and one control were made for each sample.

2.5. Statistical Analysis

Normality and homoscedasticity were checked prior to all the analyses, using the Kolmogorov–Smirnov test and Levene’s test, respectively. Where these requirements were met, a variance of analysis (ANOVA) was carried out to compare the differences among groups, and Student’s t-test were applied to compare pairs of groups. A principal components analysis (PCA) was made to establish relations among the nutrients. Statistical analyses were performed at a confidence level of 95% using RStudio 2015 (Rstudio Team, Boston, MA, USA).

3. Results

3.1. Pruning Waste

3.1.1. Initial and Final Composition of the Pruning Waste

The pruning waste used in this study proved heterogeneous in terms of the initial nutrient composition, shown in Table 2. The contents in cellulose, hemicellulose, and lignin can be checked against values reported previously [24].
The avocado waste showed the highest initial C:N ratio of all waste with significant differences, given by their highest C and lowest N concentrations. The initial highest values of Ca, Mg, and Cu were found in the avocado waste. On the other hand, the garden waste registered the highest P values, with significant differences, and the highest content in Na and K but with no significant differences.

3.1.2. Weight Loss

No statistically significant differences were found between the three replications of each experiment for the same sampling period—Figure 2. During the first year of the study, the weight loss was progressive, and significant differences were detected only between the sampling at 3 months and the sampling at 12 months. Nevertheless, samplings at 18 and 24 months differed significantly with respect to samplings during the first year and also to each other.

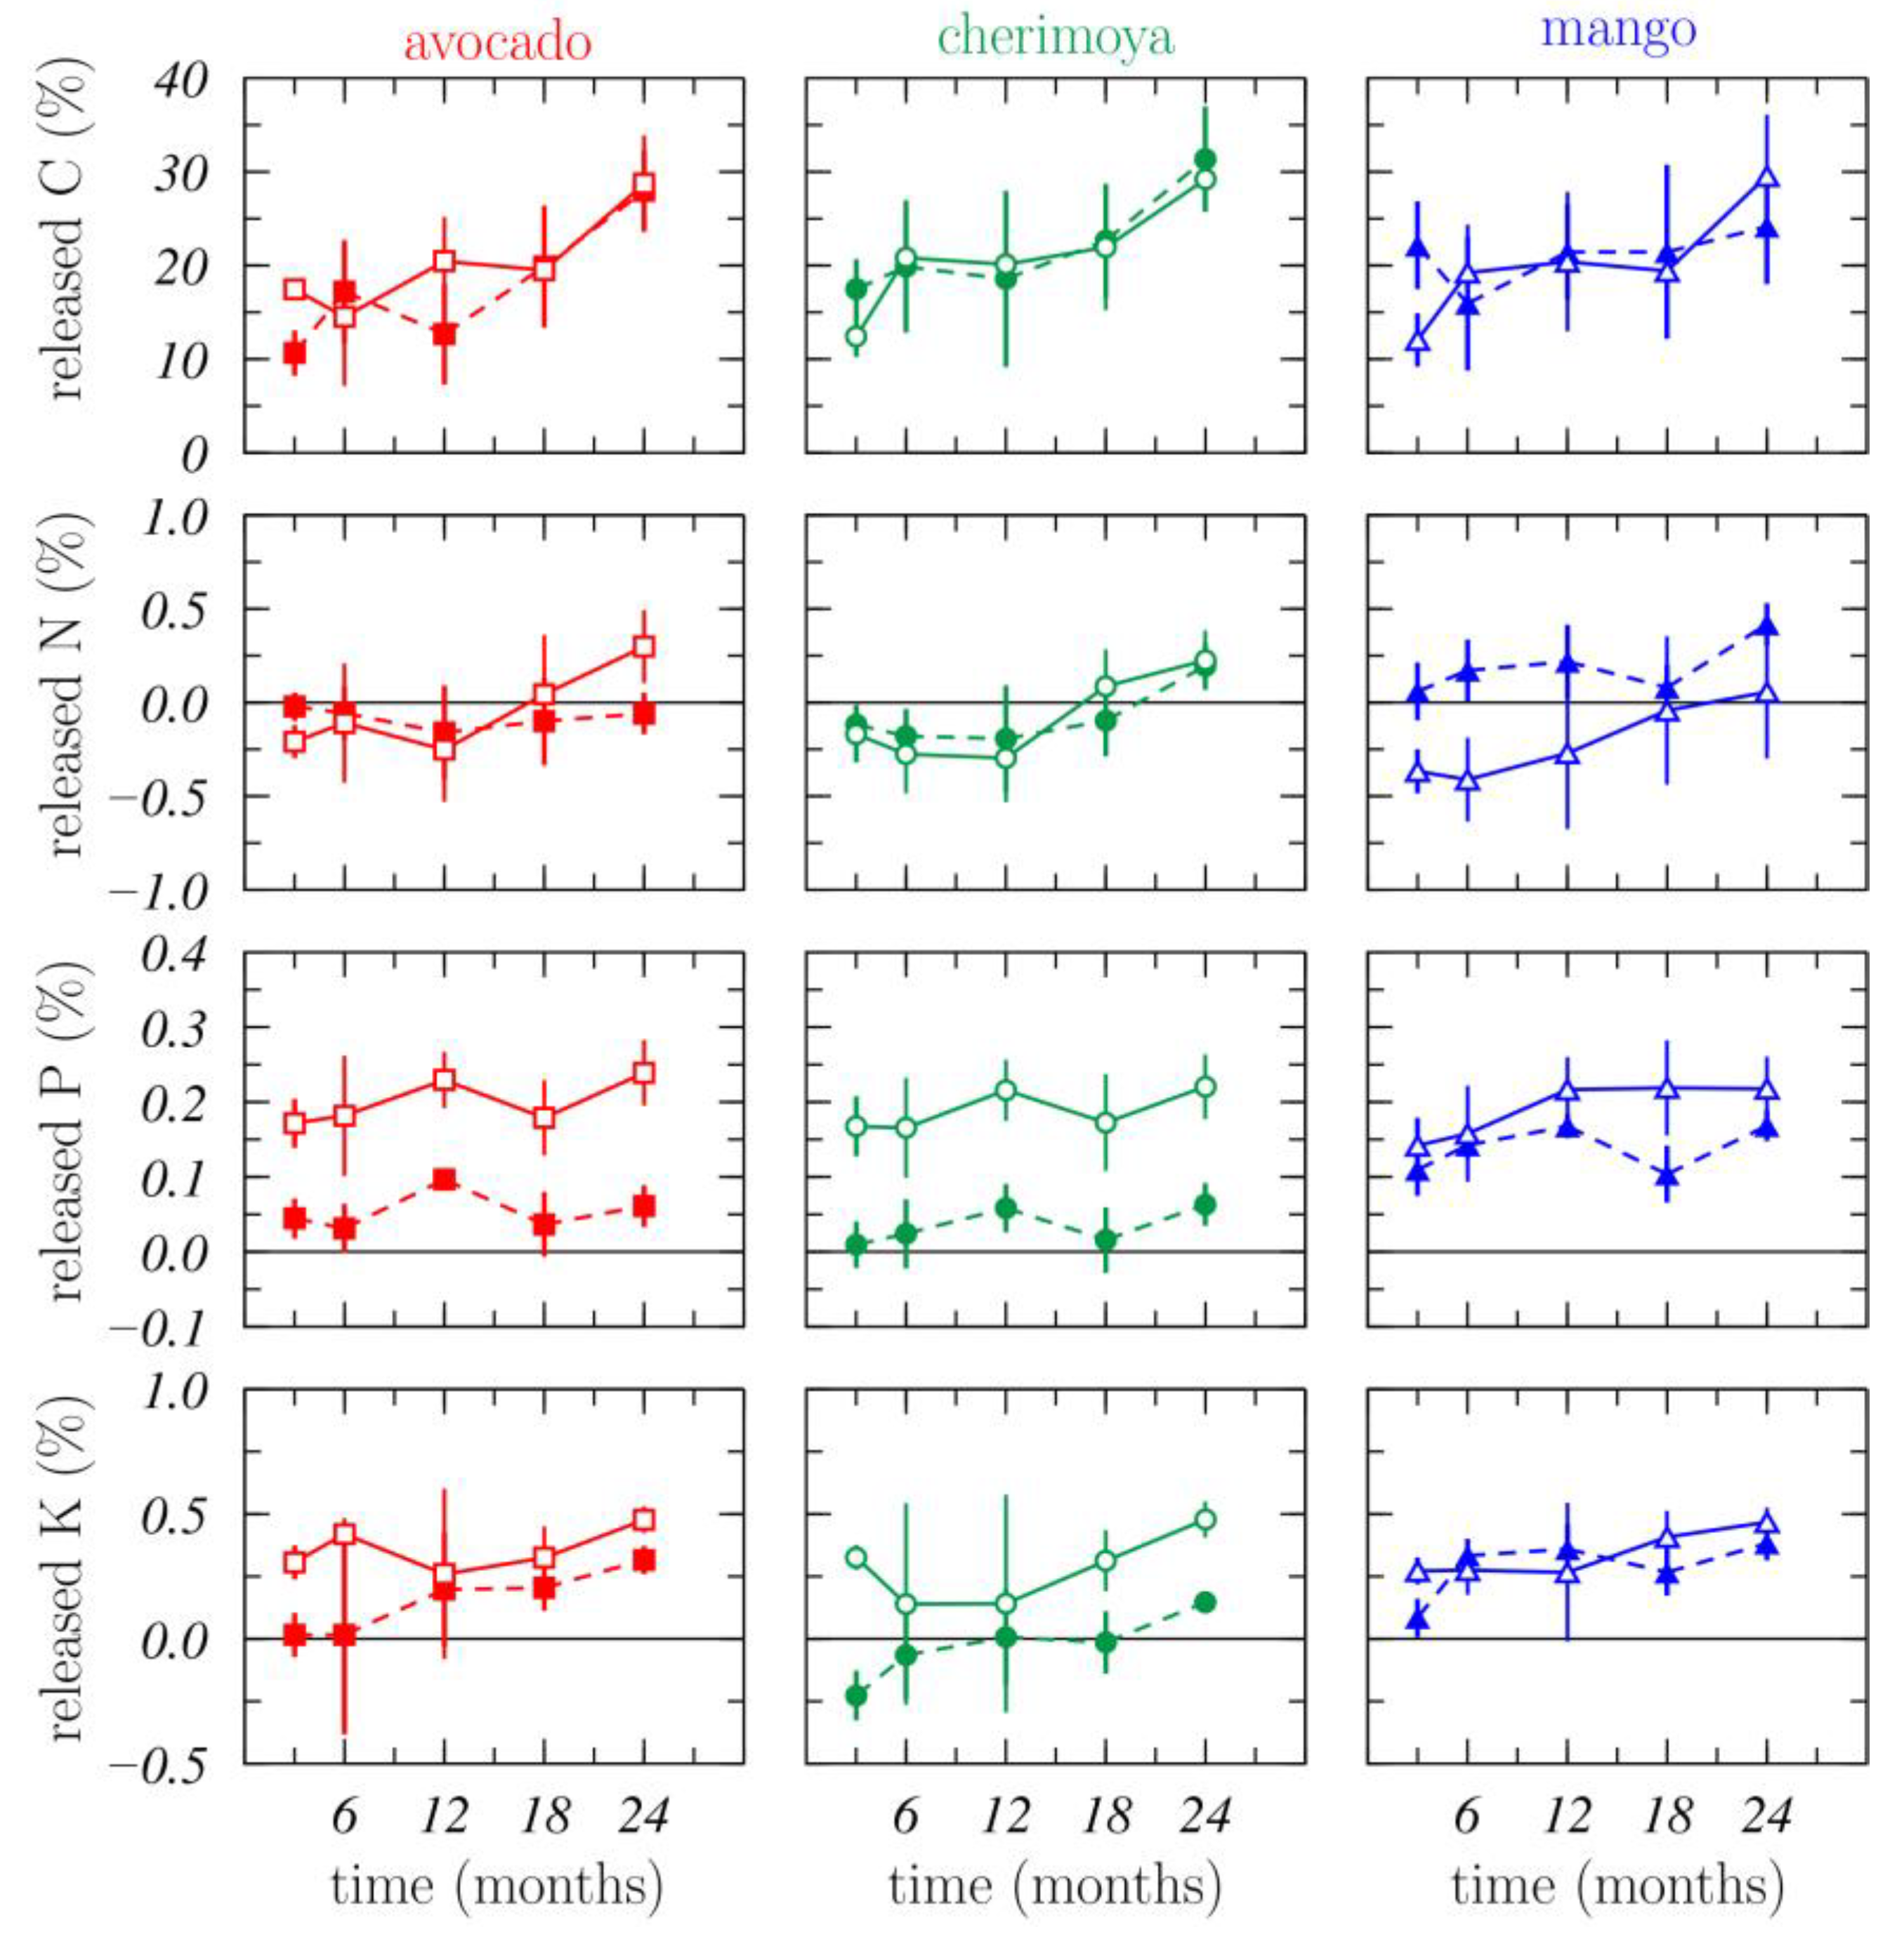
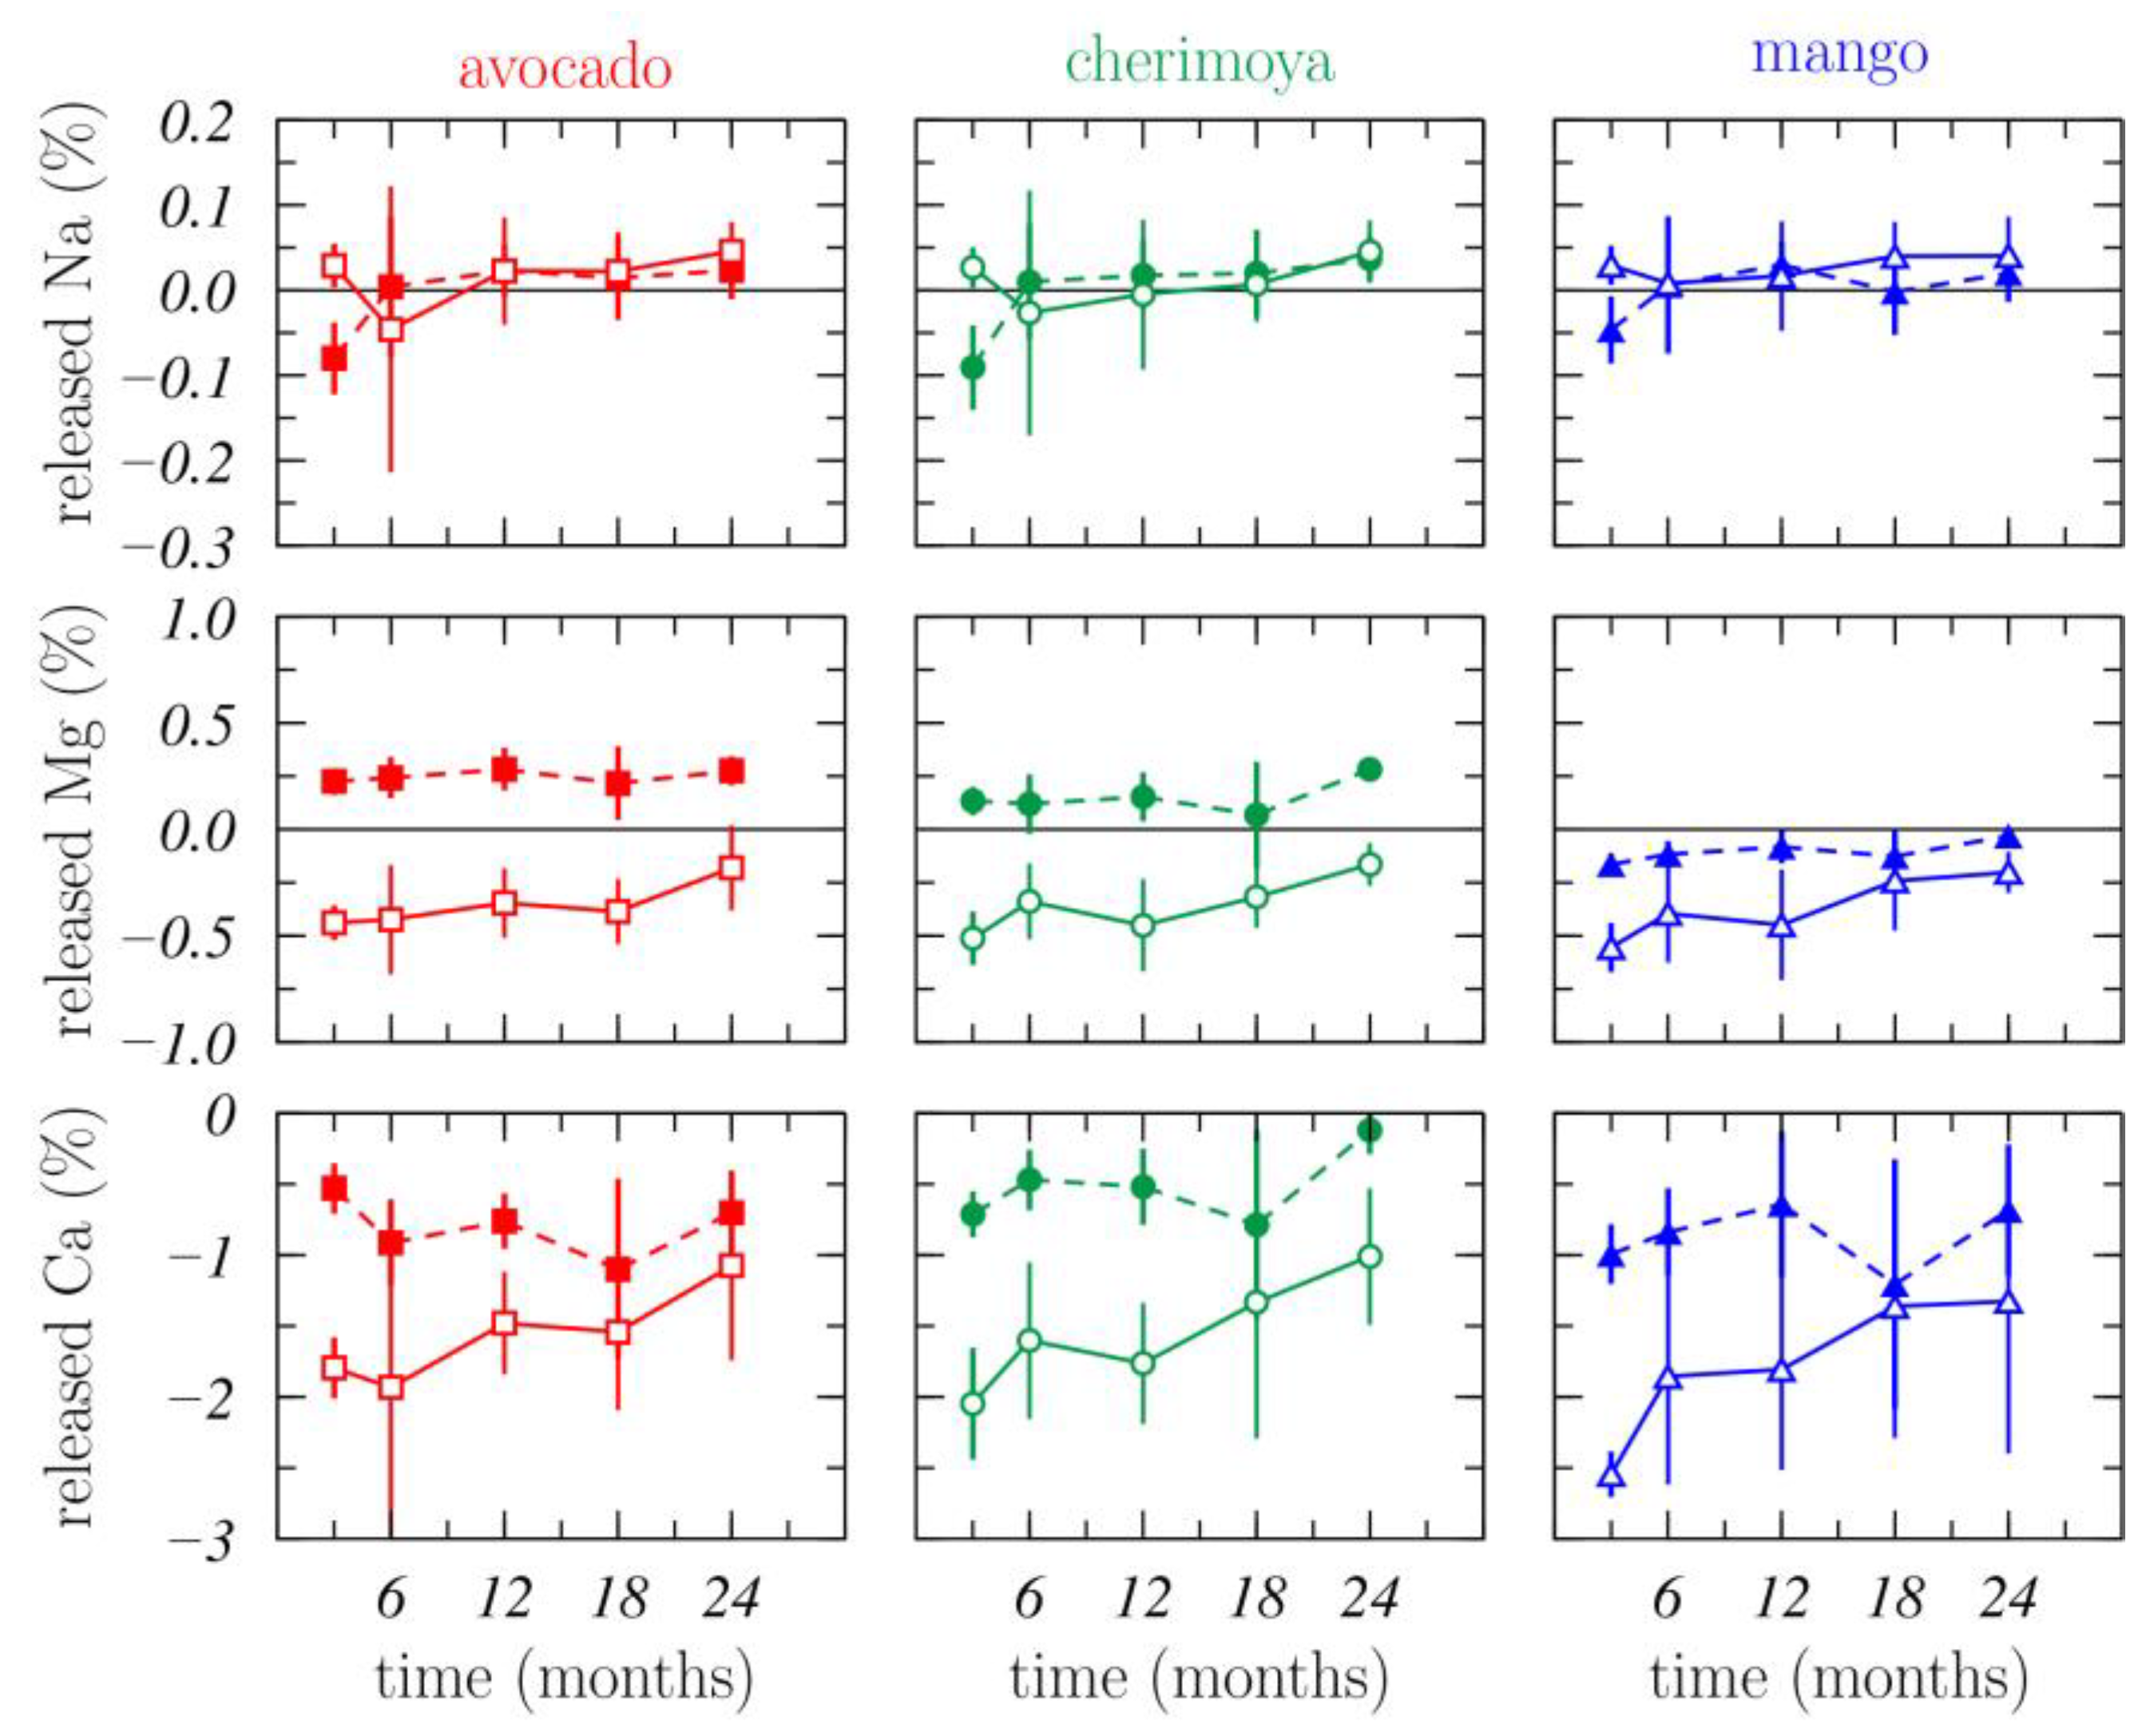
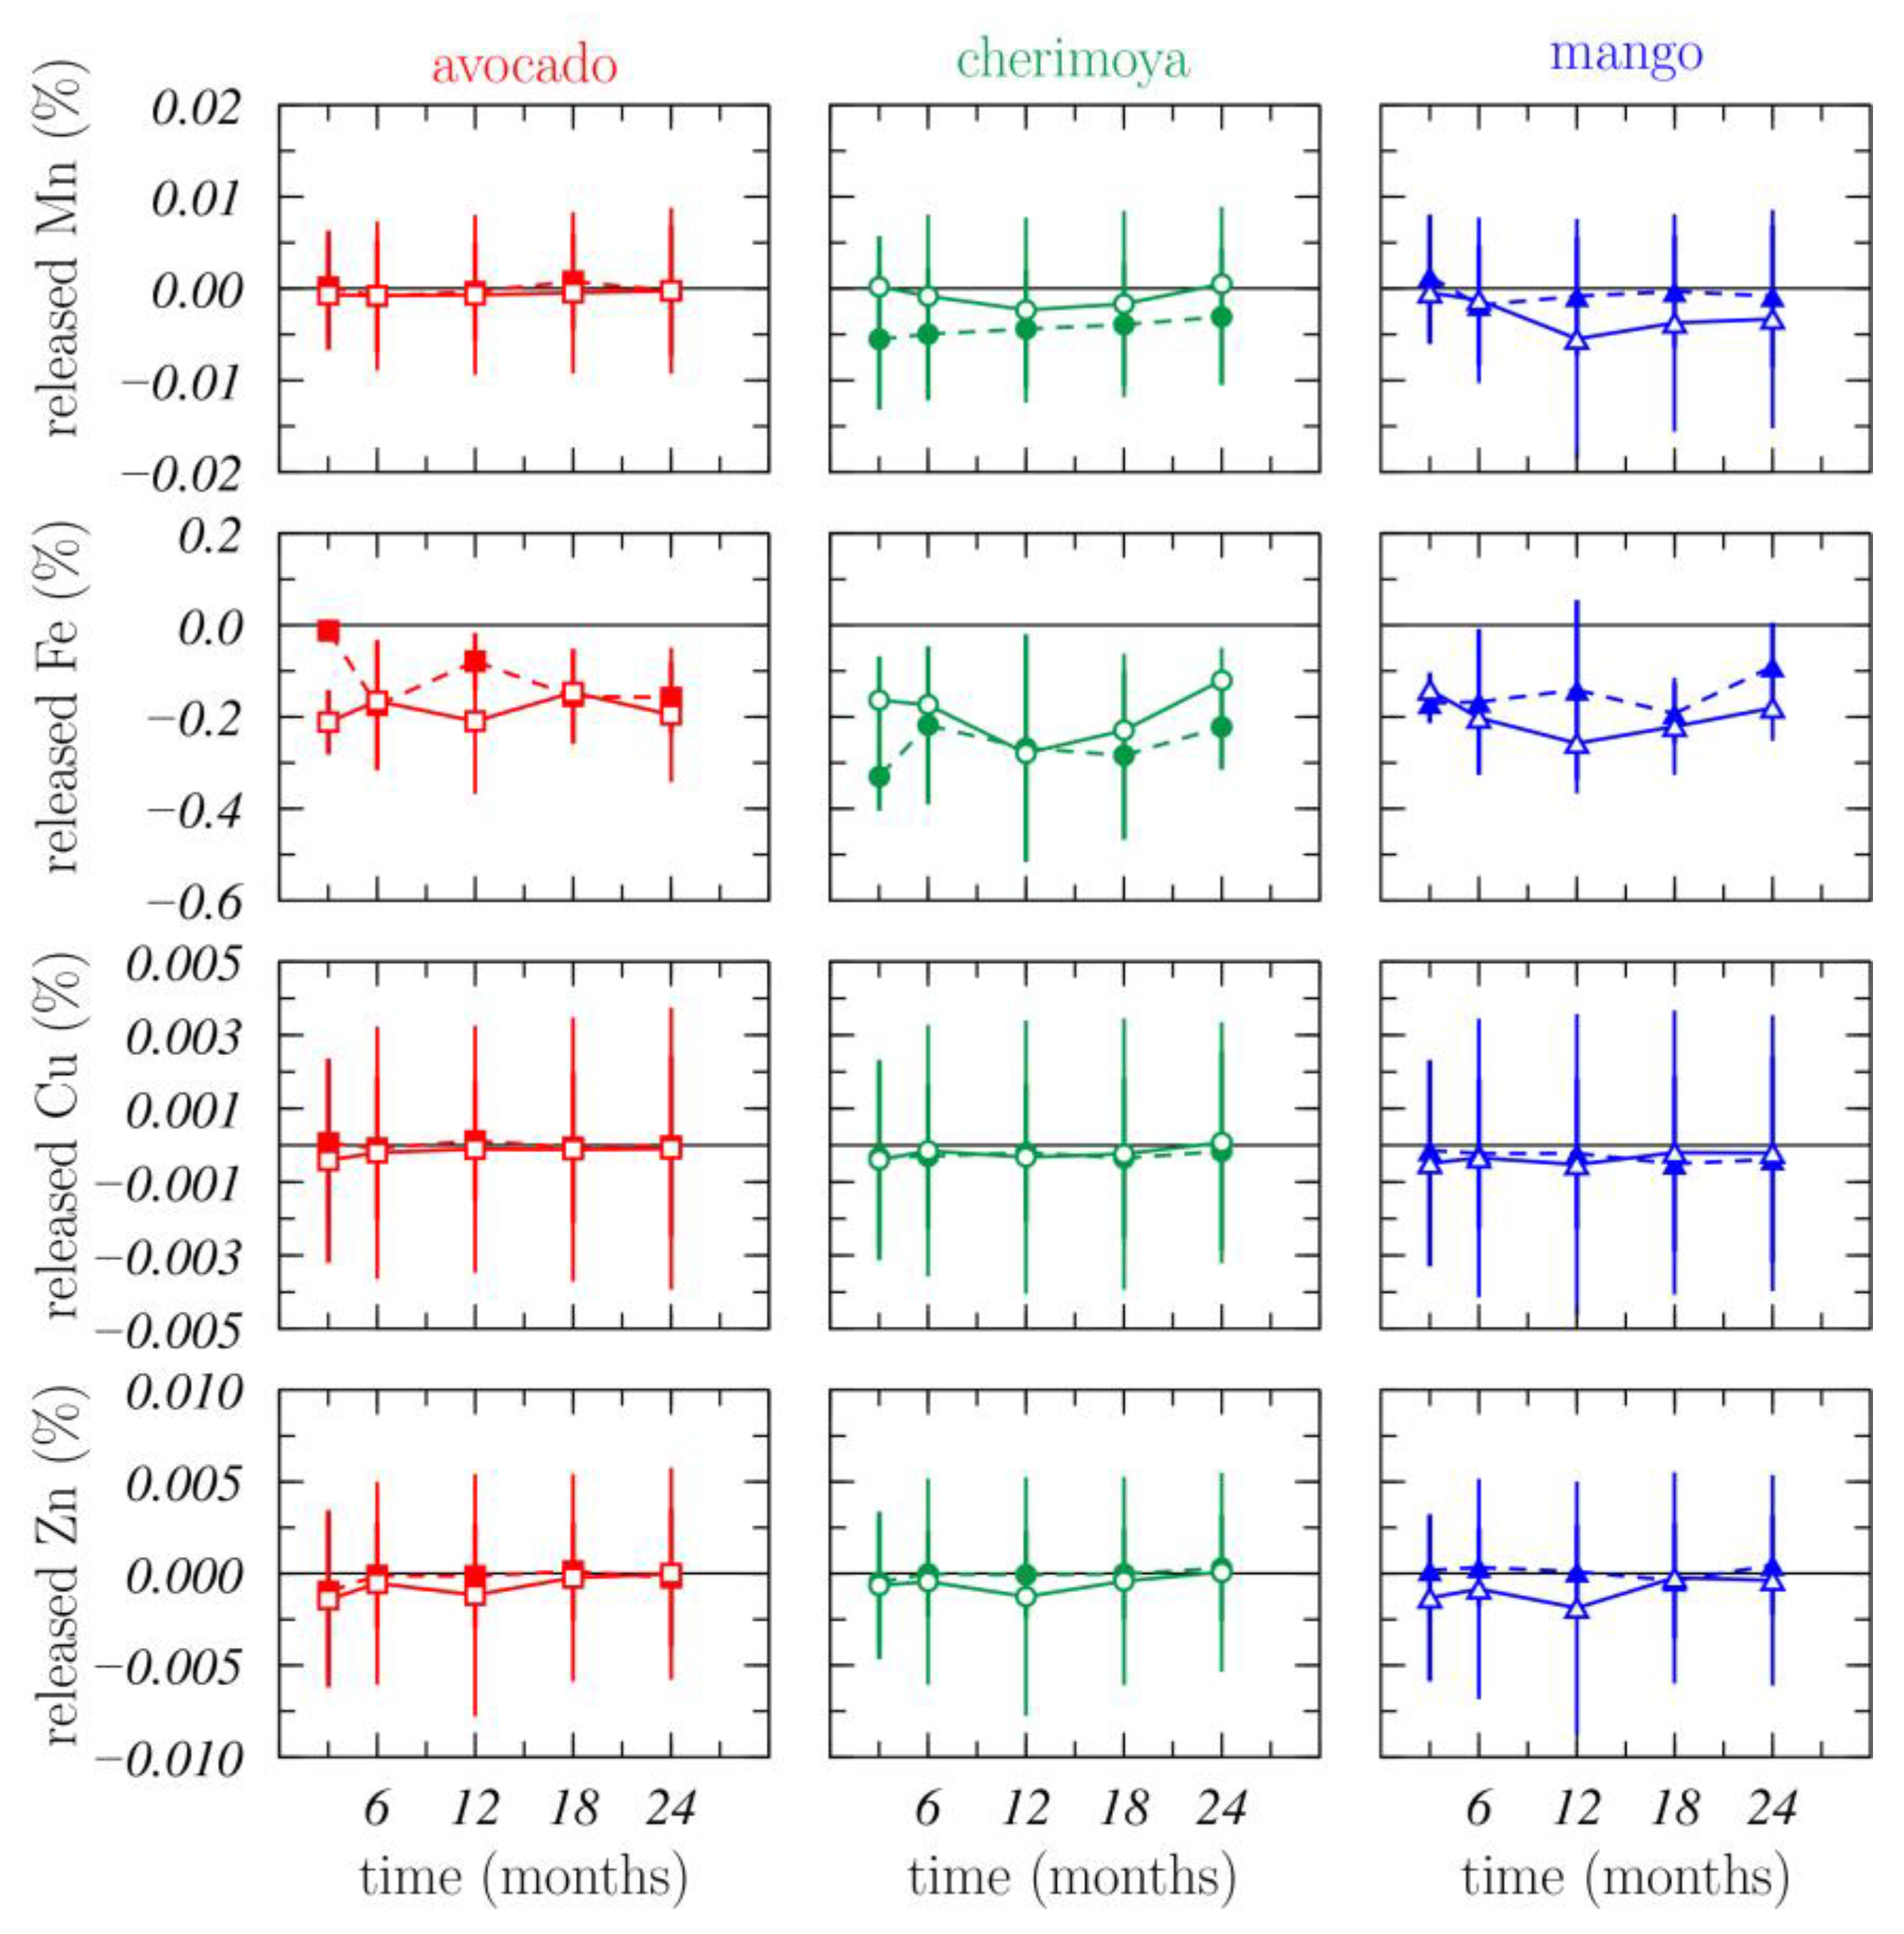
3.1.3. Nutrient Release

Nutrient release is shown in Figure 3, Figure 4 and Figure 5.
The C release dynamic was similar in the trees and for all kinds of waste, showing significant differences in mango and avocado at 3 months between the garden waste and the pruning debris (Figure 3). During the rest of the experiment, C release was moderate and significantly increased at 24 months. This tendency over time was also found for N, P, and K, but N release proved negative in the first samplings. In avocado and cherimoya, and to a lesser extent in mango, P and K releases were higher in the garden waste than in the pruning waste.
The Na concentrations were very low in all waste and only a slight release was noted at the end of the experiment. The Ca release was higher than Na while Mg release was positive in avocado and mango waste with significant differences with respect to the garden waste under each tree (Figure 4).
The Mn, Cu, and Zn releases were almost zero in all waste and even negative for Fe (Figure 5). Significant differences between waste for these micronutrients were noted only at certain sampling points.

3.1.4. Nutrient Dynamics

Table 3 shows the mean values of the annual decay rate constants (k) and mean decay time to 50 (T50) and 95% (T95) of macro-elements and micro-elements in all waste during the experiment.
Annual decay rates were more homogeneous in garden waste than in pruning debris, except for N, C, Ca, and Mg under avocado, Na under cherimoya, and P under mango.
Some elements were not released over time, did not increase their concentrations, or their concentrations were so low that changes could not be assessed. This was observed for Cu and Mn under mango, and Fe and Mn in garden waste under mango, and Fe, Cu, Ca, and N under avocado. In all these cases, k values were negative and the mean decay times were not calculated.
The highest k values were registered for K in cherimoya and in the garden waste under mango. The lowest k value was recorded in mango for C, thus showing the longest residence time in the tree. On the contrary, N, Mg, and P had higher k values in mango than in any other waste.
The mean decay time for most elements oscillated between 1 and 2 years and T95 ranged between 5 and 10 years with some exceptions.
The PCA performed with the all element concentrations in all the studied waste (Figure 6) showed that the time course of the garden waste was similar under all three trees and had a strong positive relation with the concentration and release of K and P, this explaining 40% of the sample variability.
The samples from the avocado and cherimoya waste appeared on the opposite axis and had positive significant correlations with Ca, Mg, and the C:N ratio, the latter being especially high in avocado. The samples from mango were scattered and occupied the central part of the graph.
As expected, the micronutrients Ca and Na showed no special trends in any of the waste except for the mango samples.

3.2. Soils

3.2.1. Time Course of Soil Properties

Table 1 shows some of the soil properties before the experiment, indicating that the soils had low contents of organic carbon and textures dominated by sand and silt fractions. The gravel contents were frequently higher than 50%, thus facilitating drainage but also reducing the volume of fine earth.
At the beginning of the experiment soils under cherimoya and mango had higher pH values than under avocado, showing significant differences (Table 1).
At the end of the experiment (after 72 months) all the analyzed soil properties have undergone changes, even in the untreated soils, but especially in the soils under pruning and garden waste. The bulk density decreased in all soils especially under the avocado pruning waste (AA) and garden waste under avocado tree (GA). The soil without pruning waste under the avocado tree (SA) also showed lower bulk density values but with no significant differences (Table 4). The decrease in bulk density in the soils under cherimoya and mango showed no significant differences with the soils without pruning waste but significant differences were found with the soil before the experiment.
Organic carbon increased in all soils under all three trees, due to pruning waste treatments on the soil under litter bags, litterfall, and cover crop on the soil without treatment. The soils under the litter bags showed significant differences in the avocado pruning waste, which also showed a sharp increase in N and the C:N ratio.

3.2.2. Soil Enzymatic Activities

Soil enzymatic activities at the end of the experiment are presented in Table 5.
In the avocado tree, the four enzymatic activities studied were significantly higher in the soils under waste than in the bare soil, with lower differences for the phosphatase activity. Soil dehydrogenase and urease activities were higher under GA.
Significant differences were found in the soils under the cherimoya tree, especially in dehydrogenase and urease activities.
However, under the mango tree, no significant differences were noted in the soil enzymatic activities between the soils under waste and the bare soils except for a higher urease activity under garden waste (GM).

4. Discussion

Traditional models have indicated that the release of nutrients is broadly correlated with biological activity, quality of the organic waste, and the climate, particularly precipitation [39]. In arid and semi-arid environments, these models do not fully explain the decomposition of organic wastes; whereas, the effect of solar radiation can cause a photochemical mineralization of organic matter, unrelated to soil biota [40]. Weight loss, shown in Figure 1, and the release dynamics of C, N, P, K (Figure 2), and Ca (Figure 3) correspond to the three phases described by other authors for organic wastes with high C:N ratios, as in the present study. The three phases are as follows: firstly, a rapid release phase, followed by an immobilization phase and a new mobilization phase at the end [13,41].
However, C:N ratio values do not in all cases explain the differences observed between the different types of pruning waste. In the present study, avocado wastes—those with the highest C:N ratio (greater than 90)—lost 50% of their mass after 24 months. This corresponds to the C content with a k value of 0.32, exceeded only by the garden waste under the cherimoya tree (0.38) (Table 3). A negative k value for nitrogen, together with an increase in all soil enzymatic activities (Table 5), led to a significant surge of microbial activity in the soil. Therefore, the moist conditions and low radiation exposure due to the large canopy of the avocado tree favored the microbial decomposition of wastes. Their quality did not appear to determine their dynamics, since the garden waste presented lower k values for C, showing a lower C:N ratio and higher P and K concentrations, although not for P and K released (Figure 3).
The quality of wastes under the avocado tree did not appear to be the cause of these results. Garden wastes presented the lowest C:N ratio. These wastes also increased the enzymatic activities with respect to those measured in control soils. However, in the last two samplings, garden waste began to release N, reaching a k value exceeded only by that of the mango waste (Table 4). This waste also released higher percentages of K and especially P (Figure 1), which initially had higher concentrations than in the other pruning wastes. The release of P was especially notable due to its relationship with its demand by microbial communities [42]. The k value for C release (0.172) was lower than that found for other wastes except for those under mango (k = 0.07). Soil quality improved under both avocado and garden remains, increasing the C and N content and decreasing the bulk density (Table 3).
Mango waste presented an exceptional dynamic. The C:N ratio was high but lower than for avocado waste. Carbon release was very slow, registering the lowest k value (0.070). Nonetheless, these wastes presented a high k value for N, P, and K. Soil properties only slightly changed with the application of organic wastes, such as a lower pH under greater soil organic carbon content Table 3 and Table 4, and the enzymatic activities were also the lowest of all the soils studied Table 5. The availability of basic cations in the soil can be affected by the pH, and therefore by the activity of microbial communities in the soil [43]. The N release curve had negative values for almost all the pruning and garden wastes during the first 18 months. Pruning waste from the mango tree registered positive values, indicating that, while the N content rose in all the pruning wastes together with the biological activity, in this case, the trend fell as the urease activity rose.
At least two factors may explain these results. On the one hand, mango was the youngest tree in which the edaphic characteristics were the least stable, these determining the quality of the soil biota. On the other hand, the tree canopy was smaller than those of the avocado and cherimoya trees, which were located on terraces facing south, where the radiation exposure was thus more intense. Where changes in the C content under cherimoya and avocado may be attributed to biological activity, contributing to a higher C-sequestration potential, in the mango tree, the mineralization of organic wastes may have been controlled by photodegradation processes, as pointed out by other authors for a semi-arid ecosystem [40]. Photodegradation processes result in C losses in semi-arid environments [44], but also in moist environments [45], reflected also in soil quality.
The cherimoya tree presented intermediate characteristics, being more alike to the avocado tree, since it also presented negative N release during the first stage of the study, as well as an increase in glucosidase, dehydrogenase, and urease enzymatic activities. This led to a higher decomposition of all the organic wastes [46]. However, a significant increase in soil properties was not appreciable (Table 3). The k value proved intermediate, having an intermediate k between the wastes from the two crops and the highest for the release of K. The cherimoya tree loses its leaves during winter season and the soil is thus more exposed to direct sunlight for greater time of the year, a situation that may affect the loss of nutrients. However, other authors have found no evidence that solar radiation may override the soil biological activity in subtropical environments [45]. In addition, it has been pointed out elsewhere that UV-B radiation is responsible for increasing the efficiency of extracellular enzymes of microbial activity [12,47], as we found in the present study.
The nutrient release in the garden waste was alike to what was found in all three trees. The dynamics of P and K from garden wastes significantly differed from those of avocado and cherimoya wastes. Garden waste registered the highest concentrations of K and especially P, which, together with the biological activity under avocado and cherimoya trees, released more of these elements than in the case of pruning waste. P and K concentrations in garden waste explained more than 48% of the variability of the wastes (Figure 6).
Sodium dynamics proved the same in all plots, contrary to Ca and Mg dynamics. The release of Mg was positive and constant throughout the study period for garden waste, except under the mango tree, and negative for the crop waste. Ca was significantly different under the three trees and in all cases higher under the garden waste. The dynamics of these elements agree with previous findings in forest ecosystems [48].
Mn, Cu, Zn, and Fe were not released by any wastes (Figure 3); their relative proportion either increased over time or even slightly declined during the waste decomposition, as observed elsewhere [48]. Nevertheless, this increase was minor compared with that reported in pine needles [49].

5. Conclusions

The N, P, and K contents were predominantly higher in the garden waste. Cherimoya and avocado waste showed the highest Mg values and, in general, micronutrient concentrations were very low, especially Cu. The C, N, P, K, and Ca releases followed a three-phase dynamic in the tree waste that had higher C:N rates compared with the garden waste: fast initial release, intermediate stabilization, and final increase in nutrient release. Garden waste showed different nutrient dynamics under certain circumstances and significantly released more K and P than did the tree waste. The weight loss was directly related to the C time course in all the wastes although in the last sampling the loss was also positively correlated with K, P, Ca, Mg, Mn, and Zn. Reusing pruning waste as a mulch is a good strategy to provide essential nutrients to it, contributing to a more ecologically sustainable management.
Changes in soil properties and enzymatic activities indicated the predominant processes that occurred in the different trees: microbial decomposition in avocado, photodegradation in mango, and a combination of both in cherimoya. A noticeable improvement in soil quality was found when microbial decomposition was favored. Our results suggest that the microclimatic characteristics significantly condition the time course of the decomposition of pruning waste in different subtropical trees grown on similar soils.

Author Contributions

Conceptualization, M.P.R.-M., I.O.-B. and E.F.O.; methodology, M.P.R.-M.; software, M.P.R.-M., A.M.L.; validation, M.P.R.-M., I.O.-B. and E.F.O.; formal analysis, M.P.R.-M., L.M.S.-E., M.L.M.-C.; investigation, I.O.-B. and E.F.O.; resources, I.O.-B. and E.F.O.; data curation, M.P.R.-M., L.M.S.-E.; writing—original draft preparation, M.P.R.-M. and E.F.O.; writing—review and editing, M.P.R.-M., I.O.-B., A.M.L., L.M.S.-E., M.L.M.-C. and E.F.O.; visualization, M.P.R.-M., L.M.S.-E., M.L.M.-C.; supervision, E.F.O.; project administration, I.O.-B. and E.F.O.; funding acquisition, I.O.-B. and E.F.O. All authors have read and agreed to the published version of the manuscript.

Funding

Authors appreciate the financial support of this work by the Spanish Ministry of Economy and Competitiveness (Project CGL-2013-46665-R) and the European Regional Development Fund (ERDF).

Institutional Review Board Statement

Not applicable.

Acknowledgments

The authors are grateful to the Almuñécar City Council and Dionisio Franco Tarifa for the help in the field work and the space to carry out the experiments.

Conflicts of Interest

The authors declare no conflict of interest.

References

  1. Kuokkanen, A.; Mikkilä, M.; Kuisma, M.; Kahiluoto, H.; Linnanen, L. The need for policy to address the food system lock-in: A case study of the Finnish context. J. Clean. Prod. 2017, 140, 933–944. [Google Scholar] [CrossRef]
  2. van der Wiel, B.Z.; Weijma, J.; van Middelaar, C.E.; Kleinke, M.; Buisman, C.J.N.; Wichern, F. Restoring nutrient circularity: A review of nutrient stock and flow analyses of local agro-food-waste systems. Resour. Conserv. Recycl. X 2019, 3, 100014. [Google Scholar] [CrossRef]
  3. Bellarby, J.; Surridge, B.W.; Haygarth, P.M.; Liu, K.; Siciliano, G.; Smith, L.; Rahn, C.; Meng, F. The stocks and flows of nitrogen, phosphorus and potassium across a 30-year time series for agriculture in Huantai county, China. Sci. Total Environ. 2018, 619, 606–620. [Google Scholar] [CrossRef] [PubMed] [Green Version]
  4. Chen, A.; Zhang, W.; Sheng, R.; Liu, Y.; Hou, H.; Liu, F.; Ma, G.; Wei, W.; Qin, H. Long-term partial replacement of mineral fertilizer with in situ crop residues ensures continued rice yields and soil fertility: A case study of a 27-year field experiment in subtropical China. Sci. Total Environ. 2021, 787, 147523. [Google Scholar] [CrossRef] [PubMed]
  5. Hansen, V.; Eriksen, J.; Jensen, L.S.; Thorup-Kristensen, K.; Magid, J. Towards integrated cover crop management: N, P and S release from aboveground and belowground residues. Agric. Ecosyst. Environ. 2021, 313, 107392. [Google Scholar] [CrossRef]
  6. Sukitprapanon, T.S.; Jantamenchai, M.; Tulaphitak, D.; Vityakon, P. Nutrient composition of diverse organic residues and their long-term effects on available nutrients in a tropical sandy soil. Heliyon 2020, 6, e05601. [Google Scholar] [CrossRef] [PubMed]
  7. Mikula, K.; Izydorczyk, G.; Skrzypczak, D.; Mironiuk, M.; Moustakas, K.; Witek-Krowiak, A.; Chojnacka, K. Controlled release micronutrient fertilizers for precision agriculture—A review. Sci. Total Environ. 2020, 712, 136365. [Google Scholar] [CrossRef]
  8. Lal, R. Soil carbon sequestration impacts on global climate change and food security. Science 2004, 304, 1623–1627. [Google Scholar] [CrossRef] [Green Version]
  9. Dawson, J.J.; Smith, P. Carbon losses from soil and its consequences for land-use management. Sci. Total Environ. 2007, 382, 165–190. [Google Scholar] [CrossRef]
  10. Adetunji, A.T.; Ncube, B.; Mulidzi, R.; Lewu, F.B. Management impact and benefit of cover crops on soil quality: A review. Soil Tillage Res. 2020, 204, 104717. [Google Scholar] [CrossRef]
  11. Stavi, I.; Argaman, E. No-till systems: Gains and drawbacks for carbon sequestration, ecosystem services and environmental health. Carbon Manag. 2014, 5, 123–125. [Google Scholar] [CrossRef]
  12. Wang, H.; Wang, S.; Yu, Q.; Zhang, Y.; Wang, R.; Li, J.; Wang, X. No tillage increases soil organic carbon storage and decreases carbon dioxide emission in the crop residue-returned farming system. J. Environ. Manag. 2020, 261, 110261. [Google Scholar] [CrossRef] [PubMed]
  13. Ordóñez-Fernández, R.; De Torres, M.R.R.; Román-Vázquez, J.; González-Fernández, P.; Carbonell-Bojollo, R. Macronutrients released during the decomposition of pruning residues used as plant cover and their effect on soil fertility. J. Agric. Sci. 2015, 153, 615–630. [Google Scholar] [CrossRef]
  14. Prescott, C.E. Do rates of litter decomposition tell us anything we really need to know? For. Ecol. Manag. 2005, 220, 66–74. [Google Scholar] [CrossRef]
  15. Smil, V. Crop Residues: Agriculture’s Largest Harvest: Crop residues incorporate more than half of the world’s agricultural phytomass. Bioscience 1999, 49, 299–308. [Google Scholar] [CrossRef] [Green Version]
  16. Moritsuka, N.; Yanai, J.; Mori, K.; Kosaki, T. Biotic and abiotic processes of nitrogen immobilization in the soil-residue interface. Soil Biol. Biochem. 2004, 36, 1141–1148. [Google Scholar] [CrossRef]
  17. Cornwell, W.K.; Cornelissen, J.H.; Amatangelo, K.; Dorrepaal, E.; Eviner, V.T.; Godoy, O.; Hobbie, S.E.; Hoorens, B.; Kurokawa, H.; Pérez-Harguindeguy, N.; et al. Plant species traits are the predominant control on litter decomposition rates within biomes worldwide. Ecol. Lett. 2008, 11, 1065–1071. [Google Scholar] [CrossRef]
  18. Li-Hua, T.U.; Hong-Ling, H.U.; Ting-Xing, H.U.; Zhang, J.; Xian-Wei, L.I.; Li, L.I.U.; Yin-Long, X.I.A.O.; Gang, C.H.E.N.; Ren-Hong, L.I. Litterfall, litter decomposition, and nutrient dynamics in two subtropical bamboo plantations of China. Pedosphere 2014, 24, 84–97. [Google Scholar] [CrossRef]
  19. Prescott, C.E. Litter decomposition: What controls it and how can we alter it to sequester more carbon in forest soils? Biogeochemistry 2010, 101, 133–149. [Google Scholar] [CrossRef]
  20. Aguilar Bustamante, V. Análisis de datos provenientes de ensayos de descomposición y mineralización de residuos vegetales. Calera 2005, 5, 50–54. [Google Scholar]
  21. Brennan, E.B.; Acosta-Martinez, V. Cover cropping frequency is the main driver of soil microbial changes during six years of organic vegetable production. Soil Biol. Biochem. 2017, 109, 188–204. [Google Scholar] [CrossRef]
  22. Zibilske, L.M.; Makus, D.J. Black oat cover crop management effects on soil temperature and biological properties on a Mollisol in Texas, USA. Geoderma 2009, 149, 379–385. [Google Scholar] [CrossRef]
  23. Feng, H.; Sekaran, U.; Wang, T.; Kumar, S. On-farm assessment of cover cropping effects on soil C and N pools, enzyme activities, and microbial community structure. J. Agric. Sci. 2021, 1–11. [Google Scholar] [CrossRef]
  24. Reyes-Martín, M.P.; Martínez-Cartas, M.L.; Ortiz-Bernad, I.; San-Emeterio, L.M.; Fernández-Ondoño, E. Mineralization of bagged pruning waste in agrosystem on the subtropical coast of Andalusia (Spain). J. Agric. Sci. 2020, 158, 634–645. [Google Scholar] [CrossRef]
  25. IUSS Working Group WRB. World Reference Base for Soil Resources 2014, Update 2015; International soil classification system for naming soils and creating legends for soil maps; World Soil Resources Reports No. 106; FAO: Rome, Italy, 2015; 192p. [Google Scholar]
  26. Falconer, J.G.; Wright, J.W.; Beall, H.W. The decomposition of certain types of forest litter under field conditions. Am. J. Bot. 1933, 196–203. [Google Scholar] [CrossRef]
  27. Kurz-Besson, C.; Coûteaux, M.M.; Thiéry, J.M.; Berg, B.; Remacle, J. A comparison of litterbag and direct observation methods of Scots pine needle decomposition measurement. Soil Biol. Biochem. 2005, 37, 2315–2318. [Google Scholar] [CrossRef]
  28. Olsen, S.R.; Sommers, L.E. Phosphorus. In Methods of Soil Analysis Part 2 Chemical and Microbiological Properties; American Society of Agronomy, Soil Science Society of America: Madison, WI, USA, 1982; Volume 2, pp. 403–430. [Google Scholar]
  29. Jackson, M.L.; Beltrán, J. Análisis Químico de Suelos (No. 631.41 J335 1982.); Omega: Barcelona, Spain, 1964. [Google Scholar]
  30. Walkley, A.; Black, I.A. An examination of the Degtjareff method for determining soil organic matter, and a proposed modification of the chromic acid titration method. Soil Sci. 1934, 37, 29–38. [Google Scholar] [CrossRef]
  31. Tyurin, I.V. Analytical procedure for a comparative study of soil humus. Trudy Poch. Inst. Dokuchaev. 1951, 33, 5–21. [Google Scholar]
  32. Håkansson, I. A method for characterizing the state of compactness of the plough layer. Soil Tillage Res. 1990, 16, 105–120. [Google Scholar] [CrossRef]
  33. Entry, J.A.; Rose, C.L.; Cromack, K., Jr. Litter decomposition and nutrient release in ectomycorrhizal mat soils of a Douglas fir ecosystem. Soil Biol. Biochem. 1991, 23, 285–290. [Google Scholar] [CrossRef]
  34. Olson, J.S. Energy storage and the balance of producers and decomposers in ecological systems. Ecology 1963, 44, 322–331. [Google Scholar] [CrossRef] [Green Version]
  35. Eivazi, F.; Tabatabai, M.A. Glucosidases and galactosidases in soils. Soil Biol. Biochem. 1988, 20, 601–606. [Google Scholar] [CrossRef]
  36. Tabatabai, M.A.; Bremner, J.M. Use of p-nitrophenyl phosphate for assay of soil phosphatase activity. Soil Biol. Biochem. 1969, 1, 301–307. [Google Scholar] [CrossRef]
  37. Tabatabai, M.A. Soil enzymes. In Methods of Soil Analysis: Part 2 Microbiological and Biochemical Properties; American Society of Agronomy, Soil Science Society of America: Madison, WI, USA, 1994; Volume 5, pp. 775–833. [Google Scholar] [CrossRef]
  38. Kandeler, E.; Gerber, H. Short-term assay of soil urease activity using colorimetric determination of ammonium. Biol. Fertil. Soils 1988, 6, 68–72. [Google Scholar] [CrossRef]
  39. Austin, A.T. Differential effects of precipitation on production and decomposition along a rainfall gradient in Hawaii. Ecology 2002, 83, 328–338. [Google Scholar] [CrossRef]
  40. Austin, A.T.; Vivanco, L. Plant litter decomposition in a semi-arid ecosystem controlled by photodegradation. Nature 2006, 442, 555–558. [Google Scholar] [CrossRef]
  41. Weerakkody, J.; Parkinson, D. Input, accumulation and turnover of organic matter, nitrogen and phosphorus in surface organic layers of an upper montane rainforest in Sri Lanka. Pedobiologia 2006, 50, 377–383. [Google Scholar] [CrossRef]
  42. Pourhassan, N.; Bruno, S.; Jewell, M.D.; Shipley, B.; Roy, S.; Bellenger, J.P. Phosphorus and micronutrient dynamics during gymnosperm and angiosperm litters decomposition in temperate cold forest from Eastern Canada. Geoderma 2016, 273, 25–31. [Google Scholar] [CrossRef]
  43. Bahnmann, B.; Mašínová, T.; Halvorsen, R.; Davey, M.L.; Sedlák, P.; Tomšovský, M.; Baldrian, P. Effects of oak, beech and spruce on the distribution and community structure of fungi in litter and soils across a temperate forest. Soil Biol. Biochem. 2018, 119, 162–173. [Google Scholar] [CrossRef]
  44. Smith, W.K.; Gao, W.E.I.; Steltzer, H.; Wallenstein, M.D.; Tree, R. Moisture availability influences the effect of ultraviolet-B radiation on leaf litter decomposition. Glob. Chang. Biol. 2010, 16, 484–495. [Google Scholar] [CrossRef]
  45. Marinho, O.A.; Martinelli, L.A.; Duarte-Neto, P.J.; Mazzi, E.A.; King, J.Y. Photodegradation influences litter decomposition rate in a humid tropical ecosystem, Brazil. Sci. Total Environ. 2020, 715, 136601. [Google Scholar] [CrossRef]
  46. Tejada, M.; Benítez, C. Effects of different organic wastes on soil biochemical properties and yield in an olive grove. Appl. Soil Ecol. 2020, 146, 103371. [Google Scholar] [CrossRef]
  47. Baker, N.R.; Allison, S.D. Ultraviolet photodegradation facilitates microbial litter decomposition in a Mediterranean climate. Ecology 2015, 96, 1994–2003. [Google Scholar] [CrossRef] [PubMed]
  48. Hristovski, S.; Berg, B.; Melovski, L. Limitless decomposition in leaf litter of Common beech: Patterns, nutrients’ and heavy metal’s dynamics. Pedobiologia 2014, 57, 131–138. [Google Scholar] [CrossRef]
  49. Berg, B.; McClaugherty, C. Decomposition as a process. In Plant Litter: Decomposition, Humus Formation, Carbon Sequestration; Springer: Berlin/Heidelberg, Germany, 2008; pp. 11–33. [Google Scholar]
Figure 1. Location of the sampling area, aerial image of the farm, placement of the different bagged pruning waste under the avocado, chirimoya, and mango trees, and detail of the bagged pruning waste.
Applsci 12 00193 g001
Figure 2. Weight loss from pruning waste of the subtropical species (avocado, cherimoya, and mango) and garden waste under the three trees for each sampling period expressed as percentages of Wt/W0. Wt—dry weight (g) after time t (months); W0—initial dry weight (g).
Applsci 12 00193 g002
Figure 3. Release of C, N, P, and K at each sampling period (3, 6, 12, 18, and 24 months). The solid line represents the concentrations of the garden waste and the broken line the concentration of the subtropical waste in the respective tree.
Applsci 12 00193 g003
Figure 4. Release of Na, Mg, and Ca at each sampling period (3, 6, 12, 18, and 24 months). The solid line represents the concentrations of the garden waste and the broken line the concentration of the subtropical waste in the respective tree.
Applsci 12 00193 g004
Figure 5. Release of Mn, Fe, Cu, and Zn in each sampling period (3, 6, 12, 18, and 24 months). The solid line represents the concentrations of the garden waste and the broken line the concentration of the subtropical waste in the respective tree.
Applsci 12 00193 g005
Figure 6. Principal component analysis (PCA) performed with the element concentrations of all the pruning waste studied.
Applsci 12 00193 g006
Table 1. Mean values of the soil properties analyzed at the beginning of the experiment below the avocado, cherimoya, and mango trees.
pHEC (dS m−1)BD (kg dm−3)OC (%)N (%)C/NClay (%)Silt (%)Sand (%)
Avocado 7.0 (0.1) a0.5 (0.1) a1.1 (0.0) a1.9 (0.6) a0.1 (0.0) a12.4 (1.7) a9.8 (0.3) a39.8 (0.7) a50.4 (1.0) ab
Cherimoya 8.2 (0.4) b0.4 (0.2) a1.2 (0.0) a0.8 (0.2) b0.1 (0.0) ab12.8 (1.0) a7.1 (0.1) b38.6 (1.5) ab54.3 (1.4) b
Mango 8.5 (0.2) b0.1 (0.0) a1.3 (0.0) a1.0 (0.3) b0.1 (0.0) b13.7 (1.1) a9.5 (1.2) a41.1 (0.6) b49.3 (1.6) a
Note: EC—electrical conductivity; BD—bulk density; OC—organic carbon. Data not sharing a common letter are statistically different between trees (Tukey’s test, p < 0.05); standard deviation in brackets.
Table 2. Mean values of the initial and final nutrient composition in the bagged pruning and garden waste.
Initial Nutrient CompositionFinal Nutrient Composition
AACCMMGGAACCMMGAGCGM
Fe (mg/kg)109.9 (12.6) a123.7 (6.3) a201 (11.6) a123.7 (26.9) a3306.2 (955.2) ab5638.1 (2270.6) b2517.5 (2188.0) ab4686.6 (3095.8) b3236.2 (1302.8) ab4160.8 (864.3) ab
Cu (mg/kg)6.6 (0.0) a4.7 (0.5) a4.7 (0.5) a5.8 (0.0) a13.4 (4.6) a15.9 (8.4) a18 (6.0) a15.2 (9.4) a12.2 (4.4) a16.6 (1.9) a
Mn (mg/kg)49.2 (3.8) cde20.4 (2.8) e58.6 (2.6) bcde38.1 (0.8) de101.1 (35.3) abcd125.5 (43.7) abc132.2 (17.8) ab89.6 (35.4) bcde79.7 (27.0) bcde158.6 (56.5) a
Zn (mg/kg)13.8 (1.0) a10.5 (2.0) a11.1 (0.5) a14.6 (2.6) ab32.5 (7.0) ab18.7 (7.7) ab14.4 (10.2) a33.1 (21.8) ab33.5 (11.1) ab38.7 (2.9) b
P (%)0.1 (0.0) bc0.1 (0.0) bc0.2 (0.0) b0.3 (0.0) a0.1 (0.0) b0.1 (0.0) bc0 (0.0) c0.1 (0.1) bc0.2 (0.0) b0.1 (0.0) b
K (%)0.5 (0.0) ab0.3 (0.0) c0.5 (0.0) ab0.6 (0.0) a0.4 (0.1) bc0.3 (0.0) c0.2 (0.1) c0.2 (0.0) c0.2 (0.1) c0.3 (0.1) c
Na (%)0.1 (0.0) a0.1 (0.0) a0.1 (0.0) a0.1 (0.0) a0.1 (0.0) a0.1 (0.0) a0.1 (0.1) a0.1 (0.0) a0.1 (0.0) a0.1 (0.0) a
Ca (%)0.3 (0.0) a0.2 (0.0) a0.2 (0.0) a0.2 (0.0) a2 (0.6) ab0.7 (0.4) a2.0 (1.2) ab2.9 (1.4) b3.0 (1.3) b3.0 (1.5) b
Mg (%)0.5 (0.0) ab0.4 (0.1) abc0.0 (0.0) c0.0 (0.0) c0.5 (0.1) ab0.3 (0.1) abc0.1 (0.1) bc0.5 (0.4) ab0.5 (0.2) a0.5 (0.1) a
C (%)47.4 (0.1) a47.4 (0.2) a45.7 (0.1) ab45.6 (0.1) ab39.4 (4.8) abc35.8 (3.8) bc42.1 (3.7) ab36.1 (7.8) bc38.5 (3.8) abc32.6 (5.8) c
N (%)0.5 (0.1) de0.7 (0.1) cde0.6 (0.0) cde0.8 (0.1) bcde1.2 (0.1) abc1.1 (0.2) abcd0.4 (0.3) e1.1 (0.4) abcd1.3 (0.3) ab1.4 (0.3) a
C/N90.2 (9.9) ab70.3 (8.9) ab73.5 (0.9) ab59.1 (4.6) ab33.1 (4.8) b32.7 (8.3) b151.5 (112.4) a42.3 (24.5) b31.1 (9.9) b22.9 (1.9) b
Note: AA—avocado pruning waste; CC—cherimoya pruning waste; MM—mango pruning waste; G—urban garden waste; GA—urban garden waste under avocado tree; GC—urban garden waste under cherimoya tree; GM—urban garden waste under mango tree. Data not sharing a common letter are statistically different in nutrient content (Tukey test, p < 0.05). Standard deviation in brackets.
Table 3. Mean values of annual decay rate constant (k) and mean decay times to 50 (T50) and 95% (T95) of the initial macro-elements and micro-elements in all waste.
OwnGarden
k (Years−1)T50 (Years)T95 (Years)k (Years−1)T50 (Years)T95 (Years)
FeA−1.34--0.154.5719.75
C0.203.4815.030.203.4715.00
M0.097.9234.21−0.16--
CuA−0.02--0.242.8612.36
C0.125.7524.830.302.309.93
M−0.25--0.154.7020.30
MnA−0.02--0.0611.1248.05
C0.223.1213.470.125.7824.99
M−0.27--−0.34--
ZnA0.174.1017.710.342.038.78
C0.361.938.340.233.0513.17
M0.135.4623.580.203.4314.82
PA0.332.088.980.381.827.85
C0.381.837.920.282.5010.80
M0.611.144.950.451.556.69
KA0.571.215.220.431.616.98
C0.800.873.760.461.516.54
M0.581.205.170.581.195.13
NaA0.531.305.610.144.9721.49
C0.601.165.000.079.8842.69
M0.431.606.930.116.5628.35
CaA−0.13--0.203.4815.03
C0.561.235.320.322.199.46
M0.164.3118.630.401.747.54
MgA0.116.3227.300.262.6411.42
C0.461.516.540.511.355.83
M0.641.084.690.501.396.02
CA0.322.149.250.174.0417.45
C0.302.3310.070.381.807.80
M0.079.8342.490.262.7011.67
NA−0.04--0.361.938.33
C0.272.6111.280.342.038.77
M0.461.526.570.252.8212.20
Note: A—avocado; C—cherimoya; M—mango; -—negative k values and the mean decay times were not calculated.
Table 4. Mean values of the soil properties analyzed at the end of the experiment.
pHEC (dS m−1)BD (kg dm−3)OC (%)N (%)C/N
AA6.7 (0.2) a0.4 (0.0) a0.5 (0.2) ab9.8 (0.4) c0.7 (0.0) e14.5 (0.5) a
GA7.2 (0.2) bc1.3 (0.0) e0.4 (0.1) a7.8 (1.9) b0.5 (0.1) d13.5 (2.1) a
SA7.1 (0.0) bc0.5 (0.0) b0.8 (0.1) bc1.4 (0.5) a0.2 (0.0) b10.3 (4.0) a
CC7.8 (0.1) e1.9 (0.1) f0.7 (0.1) abc2.4 (1.0) a0.2 (0.0) bc11.2 (3.8) a
GC7.6 (0.1) de0.5 (0.0) b0.8 (0.1) c2.3 (1.3) a0.1 (0.0) a29.0 (22.9) a
SC7.0 (0.1) b0.7 (0.0) c0.7 (0.1) abc2.2 (0.5) a0.2 (0.0) b14.0 (0.6) a
MM7.3 (0.1) c0.6 (0.0) b0.7 (0.1) abc3.1 (1.6) a0.2 (0.0) b13.9 (0.8) a
GM7.4 (0.1) cd0.4 (0.0) a0.7 (0.1) abc2.7 (0.3) a0.2 (0.0) bc15.0 (2.5) a
SM7.3 (0.0) c0.8 (0.0) d0.6 (0.1) abc3.2 (0.8) a0.3 (0.0) c12.9 (3.0) a
Note: EC—electrical conductivity; BD—bulk density; OC—organic carbon. AA—avocado pruning waste; CC—cherimoya pruning waste; MM—mango pruning waste; G—urban garden waste; GA—urban garden waste under avocado tree; GC—urban garden waste under cherimoya tree; GM—urban garden waste under mango tree; SA—soil without added pruning waste under the avocado tree; SC—soil without added pruning waste under the cherimoya tree; SM—soil without added pruning under the mango tree. Data not sharing a common letter are statistically different among crops (Tukey’s test, p < 0.05); standard deviation in brackets.
Table 5. Mean values of the soil enzymatic activities analyzed at the end of the experiment.
Glucosidase (µmol PNP g−1 h−1)Dehydrogenase (µg INTF g−1 h−1)Urease (µmol N-NH4+ g−1 h−1)Phosphomonoesterase (µmol PNP g−1 h−1)
AA0.3 (0.1) c7.4 (1.4) c1.2 (0.3) abc0.2 (0.0) a
GA0.3 (0.0) bc8.3 (1.1) c2.1 (0.7) c0.2 (0.1) a
SA0.1 (0.0) a2.8 (1.8) a0.5 (0.3) a0.1 (0.0) a
CC0.2 (0.0) bc7.0 (1.0) c1.5 (0.2) bc0.2 (0.1) a
GC0.2 (0.1) bc6.7 (1.0) bc0.8 (0.3) ab0.2 (0.1) a
SC0.2 (0.1) ab2.9 (1.0) ab0.5 (0.2) ab0.2 (0.1) a
MM0.2 (0.0) abc4.6 (1.6) abc0.9 (0.2) ab0.1 (0.0) a
GM0.2 (0.1) abc4.8 (2.0) abc1.2 (0.1) ab0.1 (0.0) a
SM0.2 (0.0) bc4.7 (1.0) abc0.7 (0.3) ab0.2 (0.1) a
Note: AA—soil under avocado pruning waste; CC—soil under cherimoya pruning waste; MM—soil under mango pruning waste; GA—soil under urban garden waste below avocado tree; GC—soil under urban garden waste below cherimoya tree; GM—soil under urban garden waste below mango tree; SA—soil without added pruning waste under the avocado tree; SC—soil without added pruning waste under the cherimoya tree; SM—soil without added pruning under the mango tree. Data not sharing a common letter are statistically different in enzymatic activity (Tukey’s test, p < 0.05), standard deviation in brackets.
Publisher’s Note: MDPI stays neutral with regard to jurisdictional claims in published maps and institutional affiliations.

