
Intelligent Prediction of Stuck Pipe Using Combined Data-Driven and Knowledge-Driven Model

1
Jianghan Machinery Research Institute Limited Company of CNPC, Wuhan 430000, China
2
School of Petroleum Engineering, China University of Petroleum, Beijing 102249, China
3
State Key Laboratory of Petroleum Resources and Prospecting, Beijing 102249, China
*
Author to whom correspondence should be addressed.
Appl. Sci. 2022, 12(10), 5282; https://0-doi-org.brum.beds.ac.uk/10.3390/app12105282
Submission received: 27 April 2022
/
Revised: 12 May 2022
/
Accepted: 16 May 2022
/
Published: 23 May 2022
(This article belongs to the Special Issue Artificial Intelligence Applications in Petroleum Exploration and Production)
Abstract
:Stuck pipe phenomena can have disastrous effects on drilling performance, with outcomes that can range from time delays to loss of expensive machinery. In this work, we provide three methods for the prediction of stuck pipe. The first method targets the detection of friction coefficient which can represent the trend of stuck pipe. The second method targets the prediction of probability for stuck pipe using ANN (artificial neural network). The last model establishes a comprehensive indicator based on the first and the second method using fuzzy mathematics which can give more accurate probability for stuck pipe. The results show that the best model is the last one which can predict stuck pipe events with a F1 of 0.98 and a FAR (false alarm rate) of 1%. Preliminary experimental results on the available dataset indicate that the use of the proposed model and can help mitigate the stuck pipe issue.
1. Introduction
Drilling is a key process to oil and gas exploration and development which is full of randomness, uncertainty and concealment. It is necessary to place several thousand meters of drill pipe in a narrow space with a diameter of only 200–500 mm. Unreasonable design of engineering parameters and unclear understanding of the formation often lead to complex downhole accidents (lost circulation, well collapse, stuck pipe, etc.), among which stuck pipe is one of the most common accidents.
According to the statistics of complex accidents in the South China Sea during 2009–2018, about 45% of them were stuck pipe [1]. Mudlog data from Tarim Oilfield in China shows that it takes about 3 months to deal with a serious stuck pipe accident which increases non-productive times and seriously affects drilling efficiency. Therefore, the timely prediction of stuck pipe events is considered a primary necessity to assist the drilling team in the decision-making process, so that appropriate countermeasures can be put in effect before the situation slips out of hand.
Mudlog data shows that the stuck pipe accidents occur in the process of tripping and drilling with varying degrees of severity. For example, in some highly deviated wells and horizontal wells, the stuck pipe accident is often accompanied in the process of tripping, but it is usually not serious. On the contrary, more attention is paid to the stuck pipe during drilling. Once the drill string is completely stuck, it can only be lifted by explosion and a new side drilling scheme need to be redesigned, which seriously restricts the safety and efficiency of drilling. Therefore, we focus on the real-time prediction of stuck pipe in the process of drilling.
Many approaches have been developed to predict and reduce the risk of stuck pipe. In summary, the analysis and prediction of stuck pipe accidents can be divided into two parts: data-driven and knowledge-driven.
For the knowledge-driven model, cuttings, wellbore tortuosity and other factors will eventually lead to the increase of torque and drag which can lead to the occurrence of stuck pipe accident. Therefore, researchers use the torque and drag model to invert the friction coefficient to realize the qualitative analysis of stuck pipe trend in the view of mechanics. However, this method is mainly used to analyze and deal with the stuck pipe after drilling considering that the WOB (weight on bit) and TOB (torque on bit) cannot be transmitted in real time.
For the data-driven model, researchers applied support vector machine, random forest, neural network and other algorithms to the prediction of stuck pipe. However, the generalization ability and reliability of the intelligent model need to be further improved due to the quantity and quality of samples and the differences between blocks.
Based on previous research, we establish a comprehensive indicators based on the knowledge-driven and data-driven model using fuzzy mathematics, which is expected to realize accurate prediction of stuck pipe and ensure the safety and efficiency of drilling
The remaining of this paper is organized as follows: Section 2 discusses the literature review of the prediction methods of stuck pipe. Section 3 introduces our proposed method. Section 4 explains the experimental results and discusses the main findings and finally Section 5 concludes this research and provides some plans for future work.
2. Related Research
This section introduces the related research on the analysis and prediction of stuck pipe, including knowledge-driven and data-driven model.
For the knowledge-driven model, in [2], the paper shows how to estimate two friction coefficients on a foot-by-foot basis at the wellsite with both measurement-while-drilling (MWD) and surface values of weight on bit (WOB) and torque. A log of the coefficients with depth can be used to diagnose drilling problems in directional wells. Field examples are given that show how the technique detects incipient stuck pipe. Since downhole data cannot be transmitted in real time, this method is mainly used after drilling. In [3], they present the results of the application of torque and drag model to directional wells drilled worldwide which was effectively used in these cases to aid in planning the directional program before spudding, to monitor the wells during drilling, and to analyze particular drilling problems after completion. In [4], the paper describes investigation of the friction between the pipe and the mud cake. It was found that the apparent coefficient of friction, or the “stuck pipe” coefficient, was not a constant; instead, it increased with increased time of contact between plate and mud cake. They think that the friction factor and mud cake quality are the factors that cannot be ignored. In [5], mud logging and daily reports of 75 wells in one of Iranian Southwest oil fields were studied. Mud weight, yield point, plastic viscosity and so on, a total of seven parameters were employed to introduce a new parameter called Reducing Stuck Index (RSI). For this field, the comparison of RSI of the current well with those of drilled wells predicted the probability of occurrence of stuck pipe very well. In [6], Dunbar conducted a theoretical study on the bit stuck pipe caused by borehole deformation. It is found that this phenomenon is related largely to the magnitude of the lateral earth stresses, formation mechanical properties, and drilling-tool geometry.
For the data-driven models, Kingsborough [7] used the multivariate discriminant analysis method to study stuck pipe for the first time. This method can be used to distinguish mechanical stuck, differential pressure stuck and non-stuck. Murillol [8] introduced mathematical methods such as fuzzy comprehensive discrimination and neural networks to predict stuck pipe, and proposed new methods for early warning and risk assessment of stuck pipe. Multivariate statistical regression and a discrimination analysis were developed for an Iranian field and presented by Shoraka [9] to predict and reduce the risks of stuck pipe. Biegler and Kuhn [10] used multivariate analysis to quantify the impact of design variables on the overall stuck pipe.
Artificial Neural Network (ANN) has been extensively used in literature to solve stuck pipe related issues. Some studies used ANN to predict a stuck pipe [11,12,13], using different input parameters and data sizes, which were collected from several fields. They concluded that ANN was capable of predicting stuck pipe events with varying model accuracy. In [13], Siruvuri suggested coupling the ANN model output with a drilling log viewer for monitoring. In [14], Elahi Naraghi applied several methods including ANN to predict stuck pipe events. Their study showed that both ANN and adaptive neuro-fuzzy inference systems are capable of predicting stuck pipe events with the same accuracy and suggested using ANN for simplicity. In [15], Albaiyat used ANN along with the support vector machine to predict stuck pipe events. In [16], Fuzzy logic and active learning were used for stuck pipe prediction. In [17], Automated real-time modeling and data analysis used to predict the risk of stuck pipe events were addressed by Salminen. In [18], Shahbazi and Shahri developed a stuck pipe risk analysis prediction model by introducing a stuck pipe index parameter. In [19], Zhigang Shan divided the drilling conditions into three situations and use ANN to realize the prediction of stuck-pipe. In [20], Runqiao Yu selected nine parameters and used the method of system dynamic cluster analysis to divide the stuck pipe accidents into three categories: mechanical stuck pipe, differential pressure stuck pipe and circulation stuck pipe. In [21], Jianming Liu have obtained the downhole engineering parameters according to the downhole measuring tools and established an intelligent model using stochastic forest algorithm. In [22], Brankovic have developed three indicators based on mudlog data, which aim to detect three different physical phenomena associated with the insurgence of stuck pipe. A statistical model that relates these features to documented stuck-pipe events was then developed using advanced machine learning tools.
Through the analysis of the above related research, it is found that the stuck pipe analysis method based on knowledge-driven model is mainly used for monitoring and qualitative analysis of stuck pipe, but it is difficult to achieve prediction and quantitative analysis. Meanwhile, the accuracy and reliability of data-driven stuck pipe analysis method need to be further improved due to the number and quality of stuck pipe samples.
Therefore, on the basis of previous studies, we put forward a comprehensive evaluation method which combines the knowledge-driven model with the data-driven model through fuzzy mathematics theory.
3. Proposed Methodology
We provide three methods for the prediction of stuck pipe. The first method targets the detection of friction coefficient which can represent the trend of stuck pipe. The second method targets the prediction of probability for stuck pipe using ANN. The last model establishes a comprehensive indicator based on the first and the second method using fuzzy mathematics. Finally, we compare these three methods with the data from a well in Tarim Oilfield, China.
3.1. Real-Time Analysis of Stuck Pipe Trend Based on Inversion of Friction Coefficient
The friction coefficient during drilling is a comprehensive resistance coefficient, which includes not only the friction between string and wellbore, but also the additional resistance caused by keyway, cuttings bed, mud viscous resistance and other factors. These factors are closely related to stuck pipe phenomenon, so the friction coefficient of string can characterize the stuck condition to a certain extent.
Four basic parameters are needed to realize the real-time inversion of friction coefficient, including hook tension, torque, WOB and TOB. The hook tension and torque can be measured in real time. WOB and TOB can be measured by downhole measurement tools which is usually stored in downhole tools and read after tripping out. So it is difficult to realize the real-time transmission of WOB and TOB under the existing technical conditions, which leads to the failure of real-time inversion of friction coefficient during drilling. Therefore, the neural network technology is used to realize the real-time calculation of WOB and TOB [23].
3.1.1. Real-Time Intelligent Calculation of WOB and TOB
Mudlog Data Preprocessing
- ①
- Feature selection
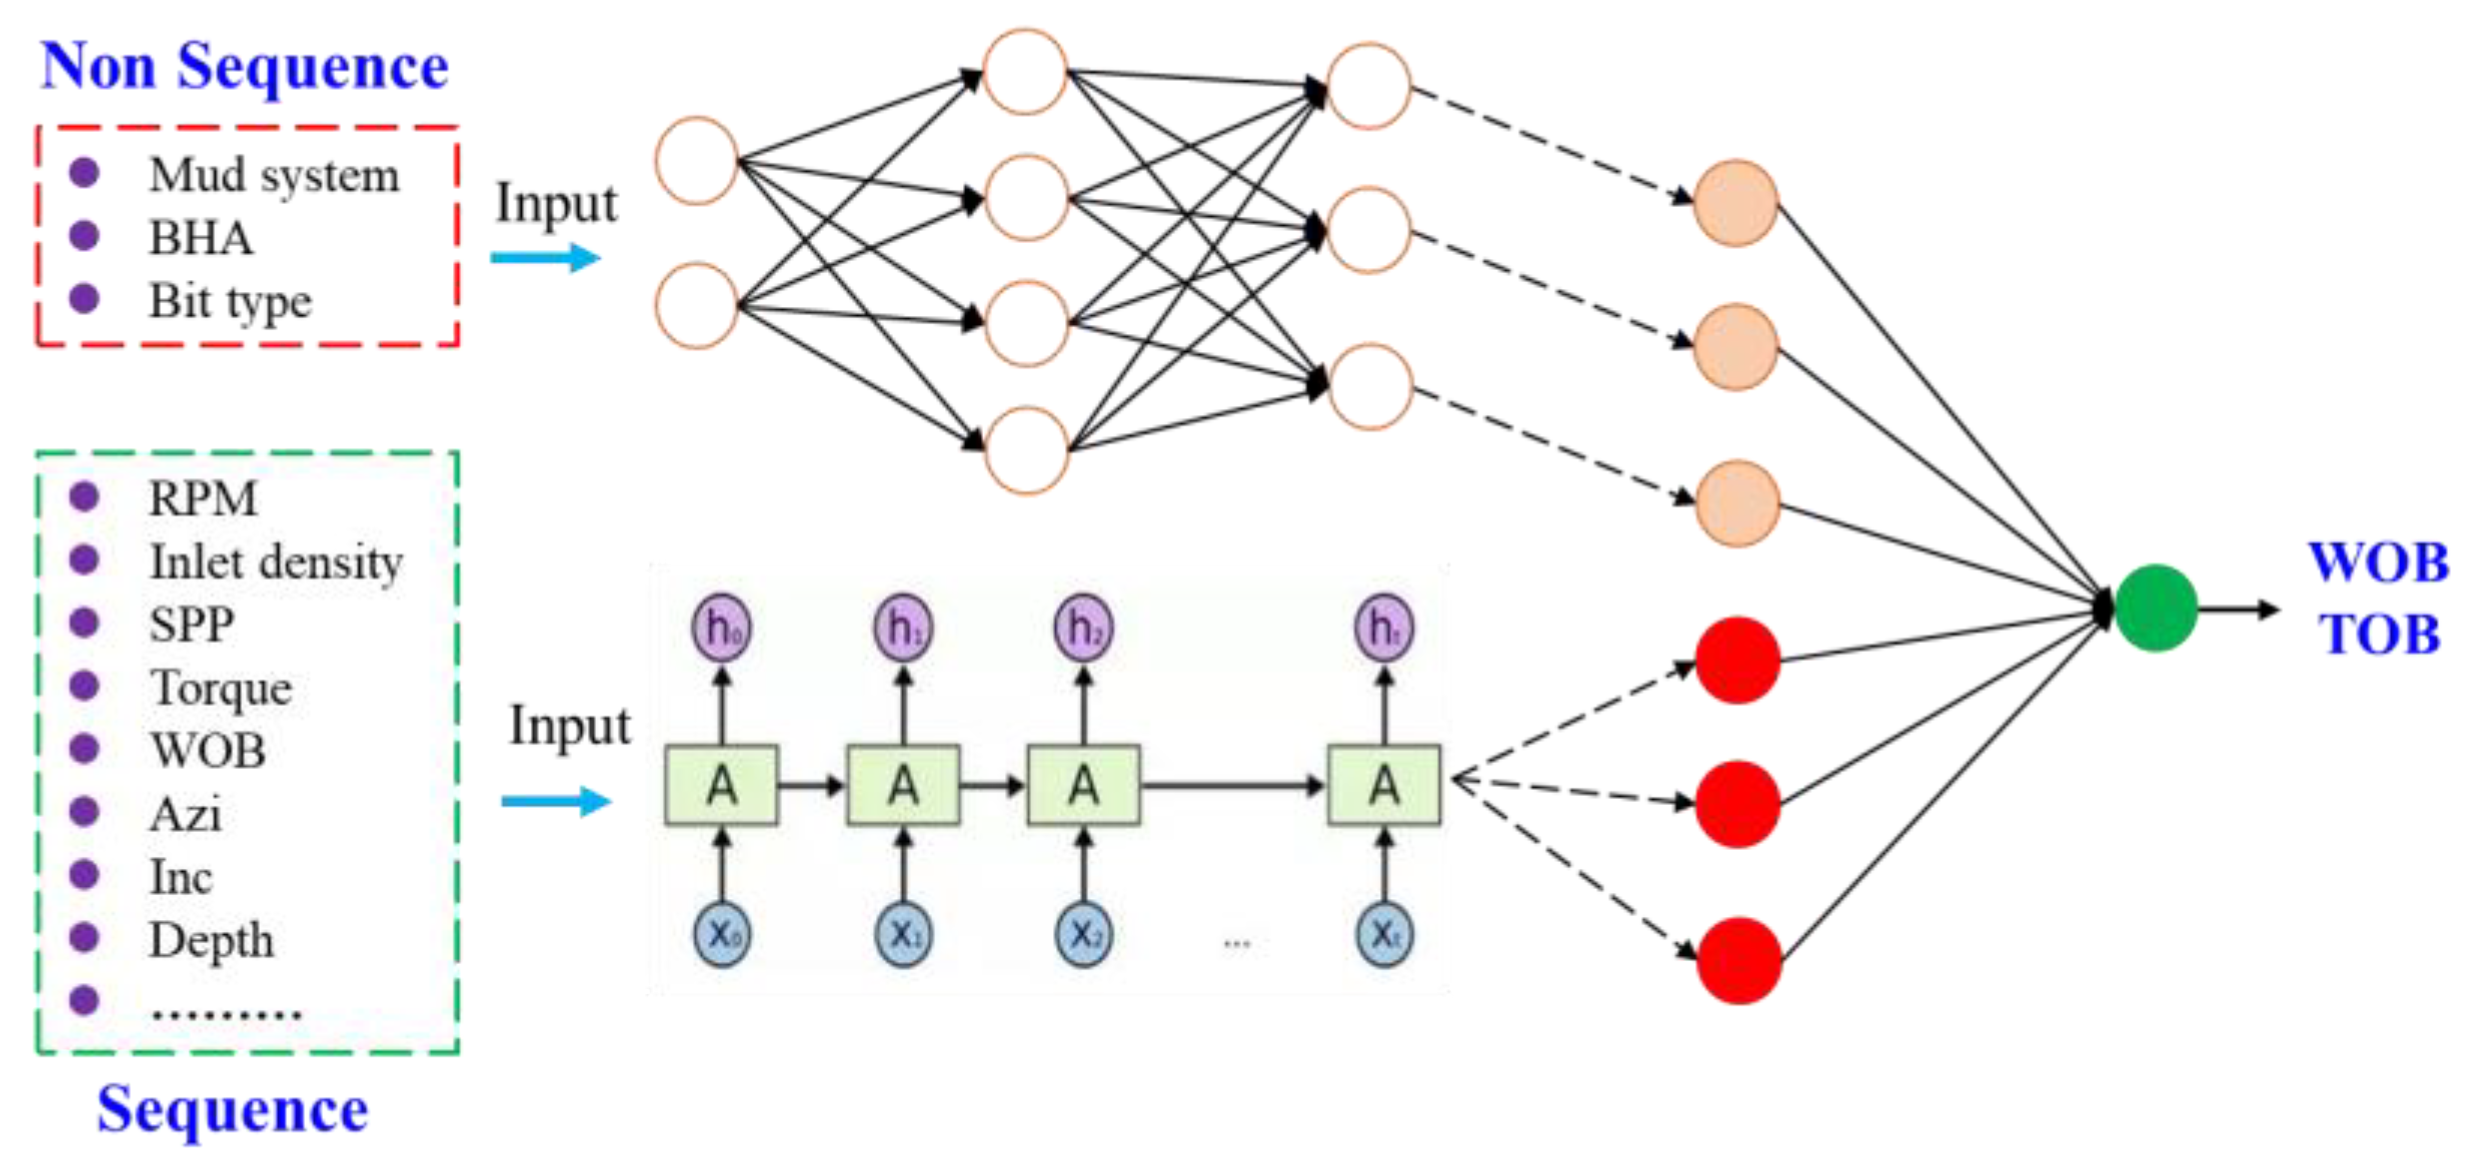
The WOB and TOB are related to many factors during drilling. Through the analysis of physical problems, the following parameters are selected as input parameters. Among them, the time sequence parameters are: WOB, TOB, depth, inclination, azimuth, torque, rpm, stand pipe pressure, outlet flow, inlet density, outlet density, total pool volume, hook tension, mud density, mud viscosity, mud plastic viscosity. Non-sequential parameters include: mud system, BHA (bottom hole assembly) and bit type.
- ②
- Normalization
For sequential parameters, considering that mudlog parameters rarely have extreme maximum and minimum values and are restricted by drilling equipment capabilities, the maximum and minimum parameters can be set in advance or obtained by statistical analysis, so the minimax normalization method is used to normalize the time series data.
For non-sequential parameters, the mud system is divided into water-based, oil-based and gas-based; Bit types are divided into PDC and cone; BHA is divided into pendulum, eyeful and tower. The above parameters are digitized by one hot method.
Neural Network Optimization and Structure Design
According to the characteristics of mudlog data in sequence and non-sequence, the adaptive neural networks, namely BP [24] and LSTM [25] networks, are selected.
The formula of BP neural network is as follows,
xt is the current input; wh is the weight matrix of hidden layer; bh is the offset vector of the hidden layer; f is the activation function; ht is the current output.
The BP neural network with the unidirectional communication is a static network. Although it can approximate arbitrarily complex functions, it cannot infer the subsequent information based on the previous information which does not have the memory ability.
LSTM network with self-feedback can transfer the information of hidden layer neurons to the next hidden layer neurons. It has certain memory ability and obvious advantages in dealing with sequential problems.
The formula of LSTM neural network is as follows.
Forget gate:
Input gate:
Output gate:
xt is the current input; ht−1 is the output at the previous moment; Wf is the weight matrix of the forget gate neuron in LSTM; bf is the bias vector of the forget gate neuron in LSTM; ft is the forget gate neuron in LSTM The output of the cell; Wi is the weight matrix of the input gate neuron in LSTM; bi is the bias vector of the input gate neuron in LSTM; it is the output of the input gate neuron in LSTM; Wo is the weight of the output gate neuron in LSTM Matrix; bo is the bias vector of the output gate neuron in LSTM; Ot is the output of the output gate neuron in LSTM; is the sigmoid activation function.
The BP neural network in Figure 1 is used to input non-sequential data which are digitized by one-hot and have a dimension of 8. An input sample of the BP network is a one-dimensional vector.
The LSTM network in Figure 1 is used to input sequential data. The historical time step is selected as 5, and a data sample input to the LSTM network is a 5 × 16 matrix.
Training, Testing and Optimization of BP-LSTM
The data from 74 wells in the same block of Tarim Oilfield is used to test and optimize the BP-LSTM model. The data of 52 wells are used for training and the rest for testing.
The number of network layers, the number of neurons, dropout and activation function are optimized and each model is trained 120 epochs. The three indexes of MAPE (mean absolute percentage error), RMSE (root mean square error) and model complexity which is the number of parameters to be trained are combined to optimize the model. The experimental scheme of the BP-LSTM model is shown in Table 1.
ytrue is the measured value; ypre is the predicted value; N is the number of samples.
Calculation Results of WOB and TOB
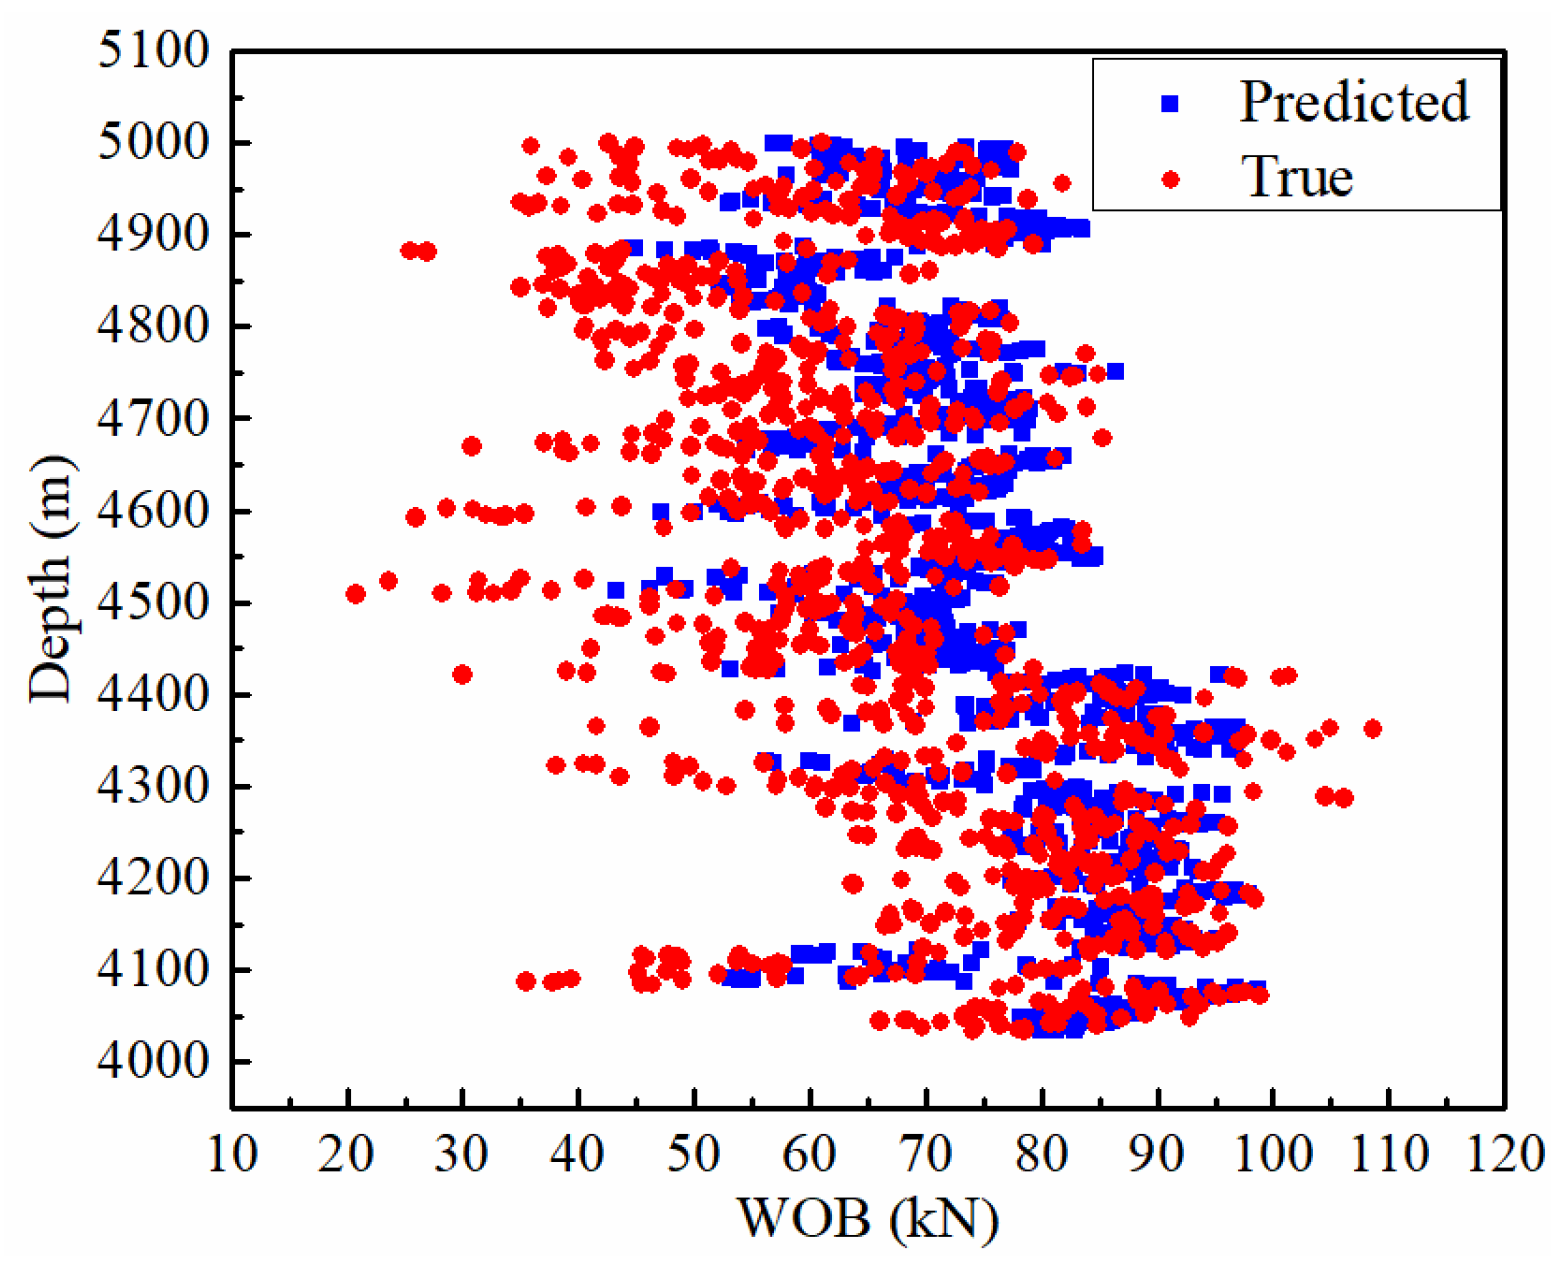
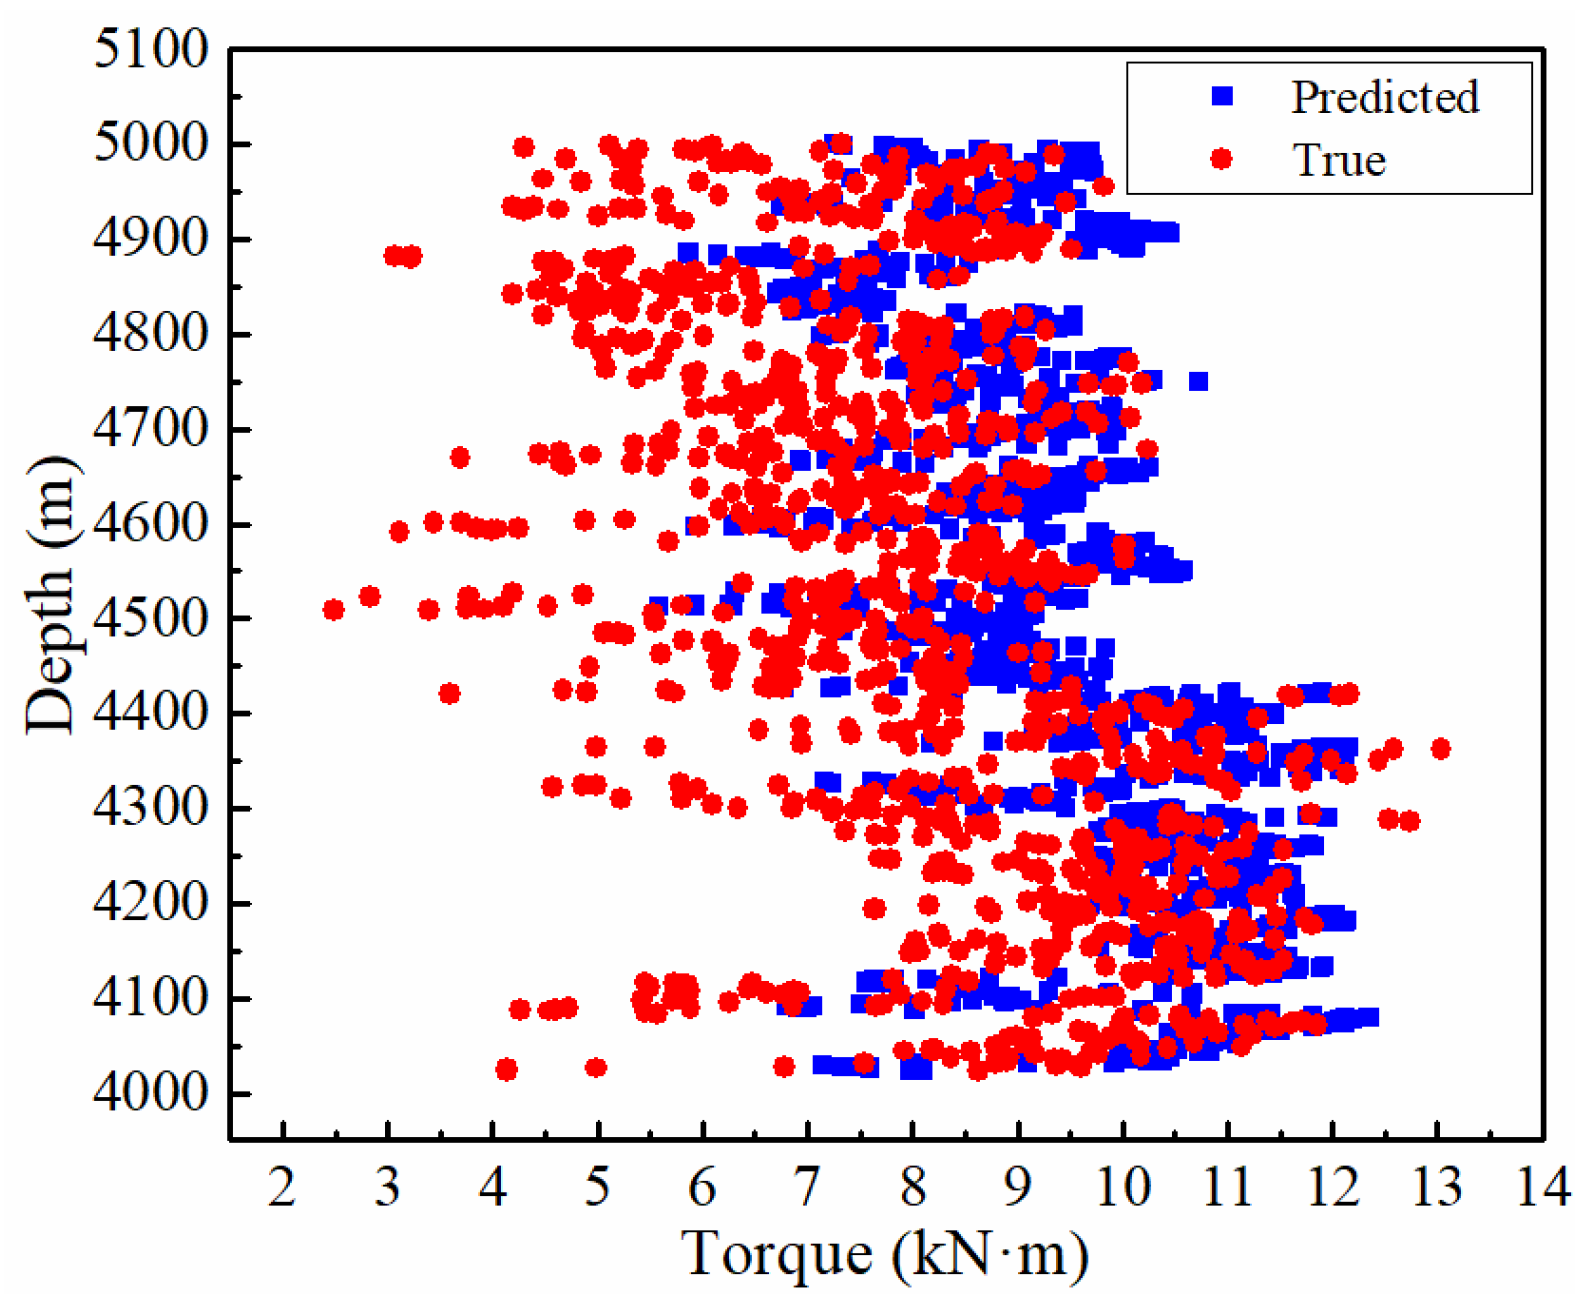
The results of WOB and TOB are shown in Figure 2 and Figure 3, respectively. The RMSE and MAPE of WOB is 23.8 kN and 13.0%, respectively. The RMSE and MAPE of TOB is 2.8 kN·m and 12.8%, respectively.
The BP-LSTM neural network is used to realize the real-time prediction of WOB and TOB, which lays a foundation for the real-time inversion of friction coefficient.
3.1.2. Real-Time Inversion of Friction Coefficient
Torque and Drag Model
The classical torque and drag models include soft string model [26] and stiff string model [27]. The soft string model without any consideration for the string stiffness is simple and applied earlier, but it is only suitable for vertical wells or wells with small inclination. The stiff string model with considering the stiffness of string is more complex, but it is more suitable for extended reach wells, horizontal wells and other non-straight wells. The stiff string model is used for the real-time inversion of friction coefficient.
The stiff string model is as follows:
“”: Negative for lifting condition, positive for lowering condition; F: axial load on the drill string, N; S: depth, m; q: Gravity per unit length of drill string, N/m; : inclination angle, rad; EI: bending stiffness of drill string, N m2; : Contact force between drill string and wellbore, N/m; : Axial friction coefficient; Circumferential friction coefficient; : hole curvature, rad/m.
Calculation formula of borehole curvature :
Calculation formula of contact force on drill string:
: azimuth, rad; : borehole torsion, rad/m.
Real-Time Inversion of Friction Coefficient
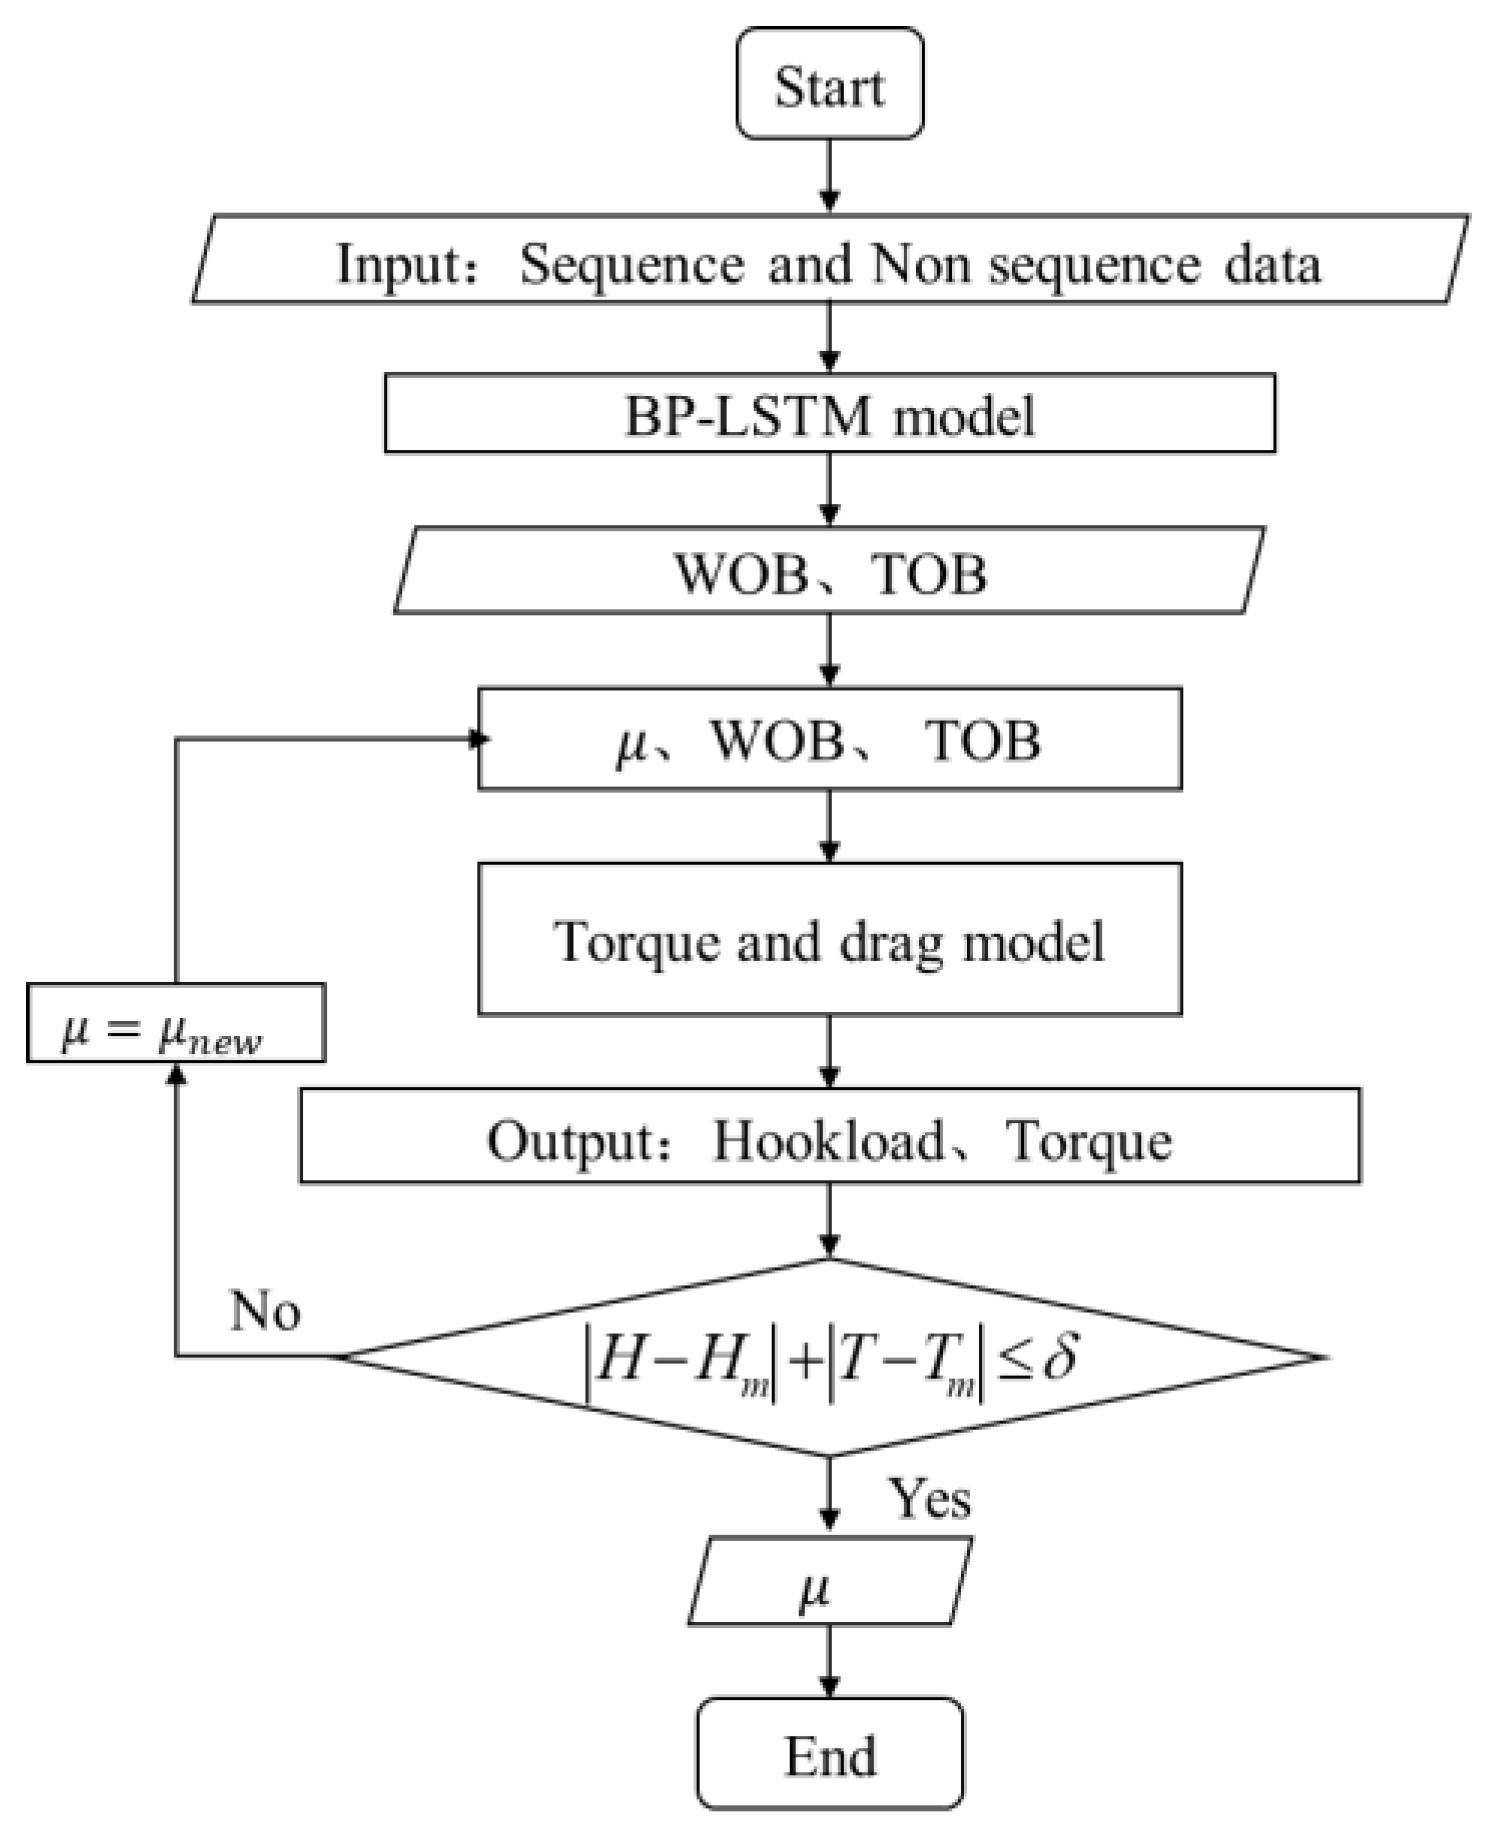
Taking the above four basic parameters into the torque and drag model, the real-time inversion of friction coefficient can be realized by dichotomy, as shown in Figure 4. The inversion result of friction coefficient is shown in Section 3.3.
3.2. Intelligent Prediction of Stuck Pipe Probability Based on LSTM
3.2.1. Establishment of Stuck Sample
Firstly, it is necessary to determine the stuck date and time according to the mudlog data report, and then mark the normal sample and the stuck sample.
Figure 5 shows the changes in hook tension and torque throughout the day on 2 May It can be seen that the time of stuck pipe is around 20:48:08 from the figure.
As shown in Figure 6, it is the change of hook tension and torque from 20:11:28 to 21:21:28. During 20:50:28–20:51:28, the torque suddenly increases from 14.2 to 19.6 kN, which is consistent with the mudlog data report. Therefore, the accurate time of stuck pipe can be determined as 20:51:28.
The stuck pipe is a sudden accident, that is, the time from the beginning of the stuck pipe to the complete stuck pipe is very short, and sufficient time cannot be left to adjust the drilling parameters in time to avoid the stuck pipe. Therefore, it is necessary to mark the period before the stuck pipe as stuck pipe samples in order to achieve the purpose of forecasting in advance. The data of 20:28:28–20:50:28 are labeled as stuck pipe samples, and 20:11:28–20:27:28 are labeled as normal samples.
3.2.2. Selection of Characteristic Parameters for Stuck Pipe
Based on the mudlog data and the analysis of the factors affecting the stuck, we use 15 parameters: bit depth, hook tension, stand pipe pressure, torque, weight on bit, rpm, total pump stroke, inlet/outlet temperature, Inlet/outlet conductance, inlet/outlet density, inlet/outlet flow.
3.2.3. Training, Testing and Optimization of Intelligent Prediction Model for Stuck Pipe
Generally, the optimal hyper-parameter combination is obtained through trial and error. We optimize the following parameters: time-stepping of the input data, the learning rate, the number of LSTM network layers, the number of LSTM neurons, and the activation function. In order to reduce the number of tests, the orthogonal test method (L18.3.5) is used to set the test plan [28].
The FAR (false alarm rate), MAR (missed alarm rate) and F1 are used to evaluate and optimize the model. The evaluation indexes of classification problems are shown in Table 2, The relevant calculation formulas are as follows.
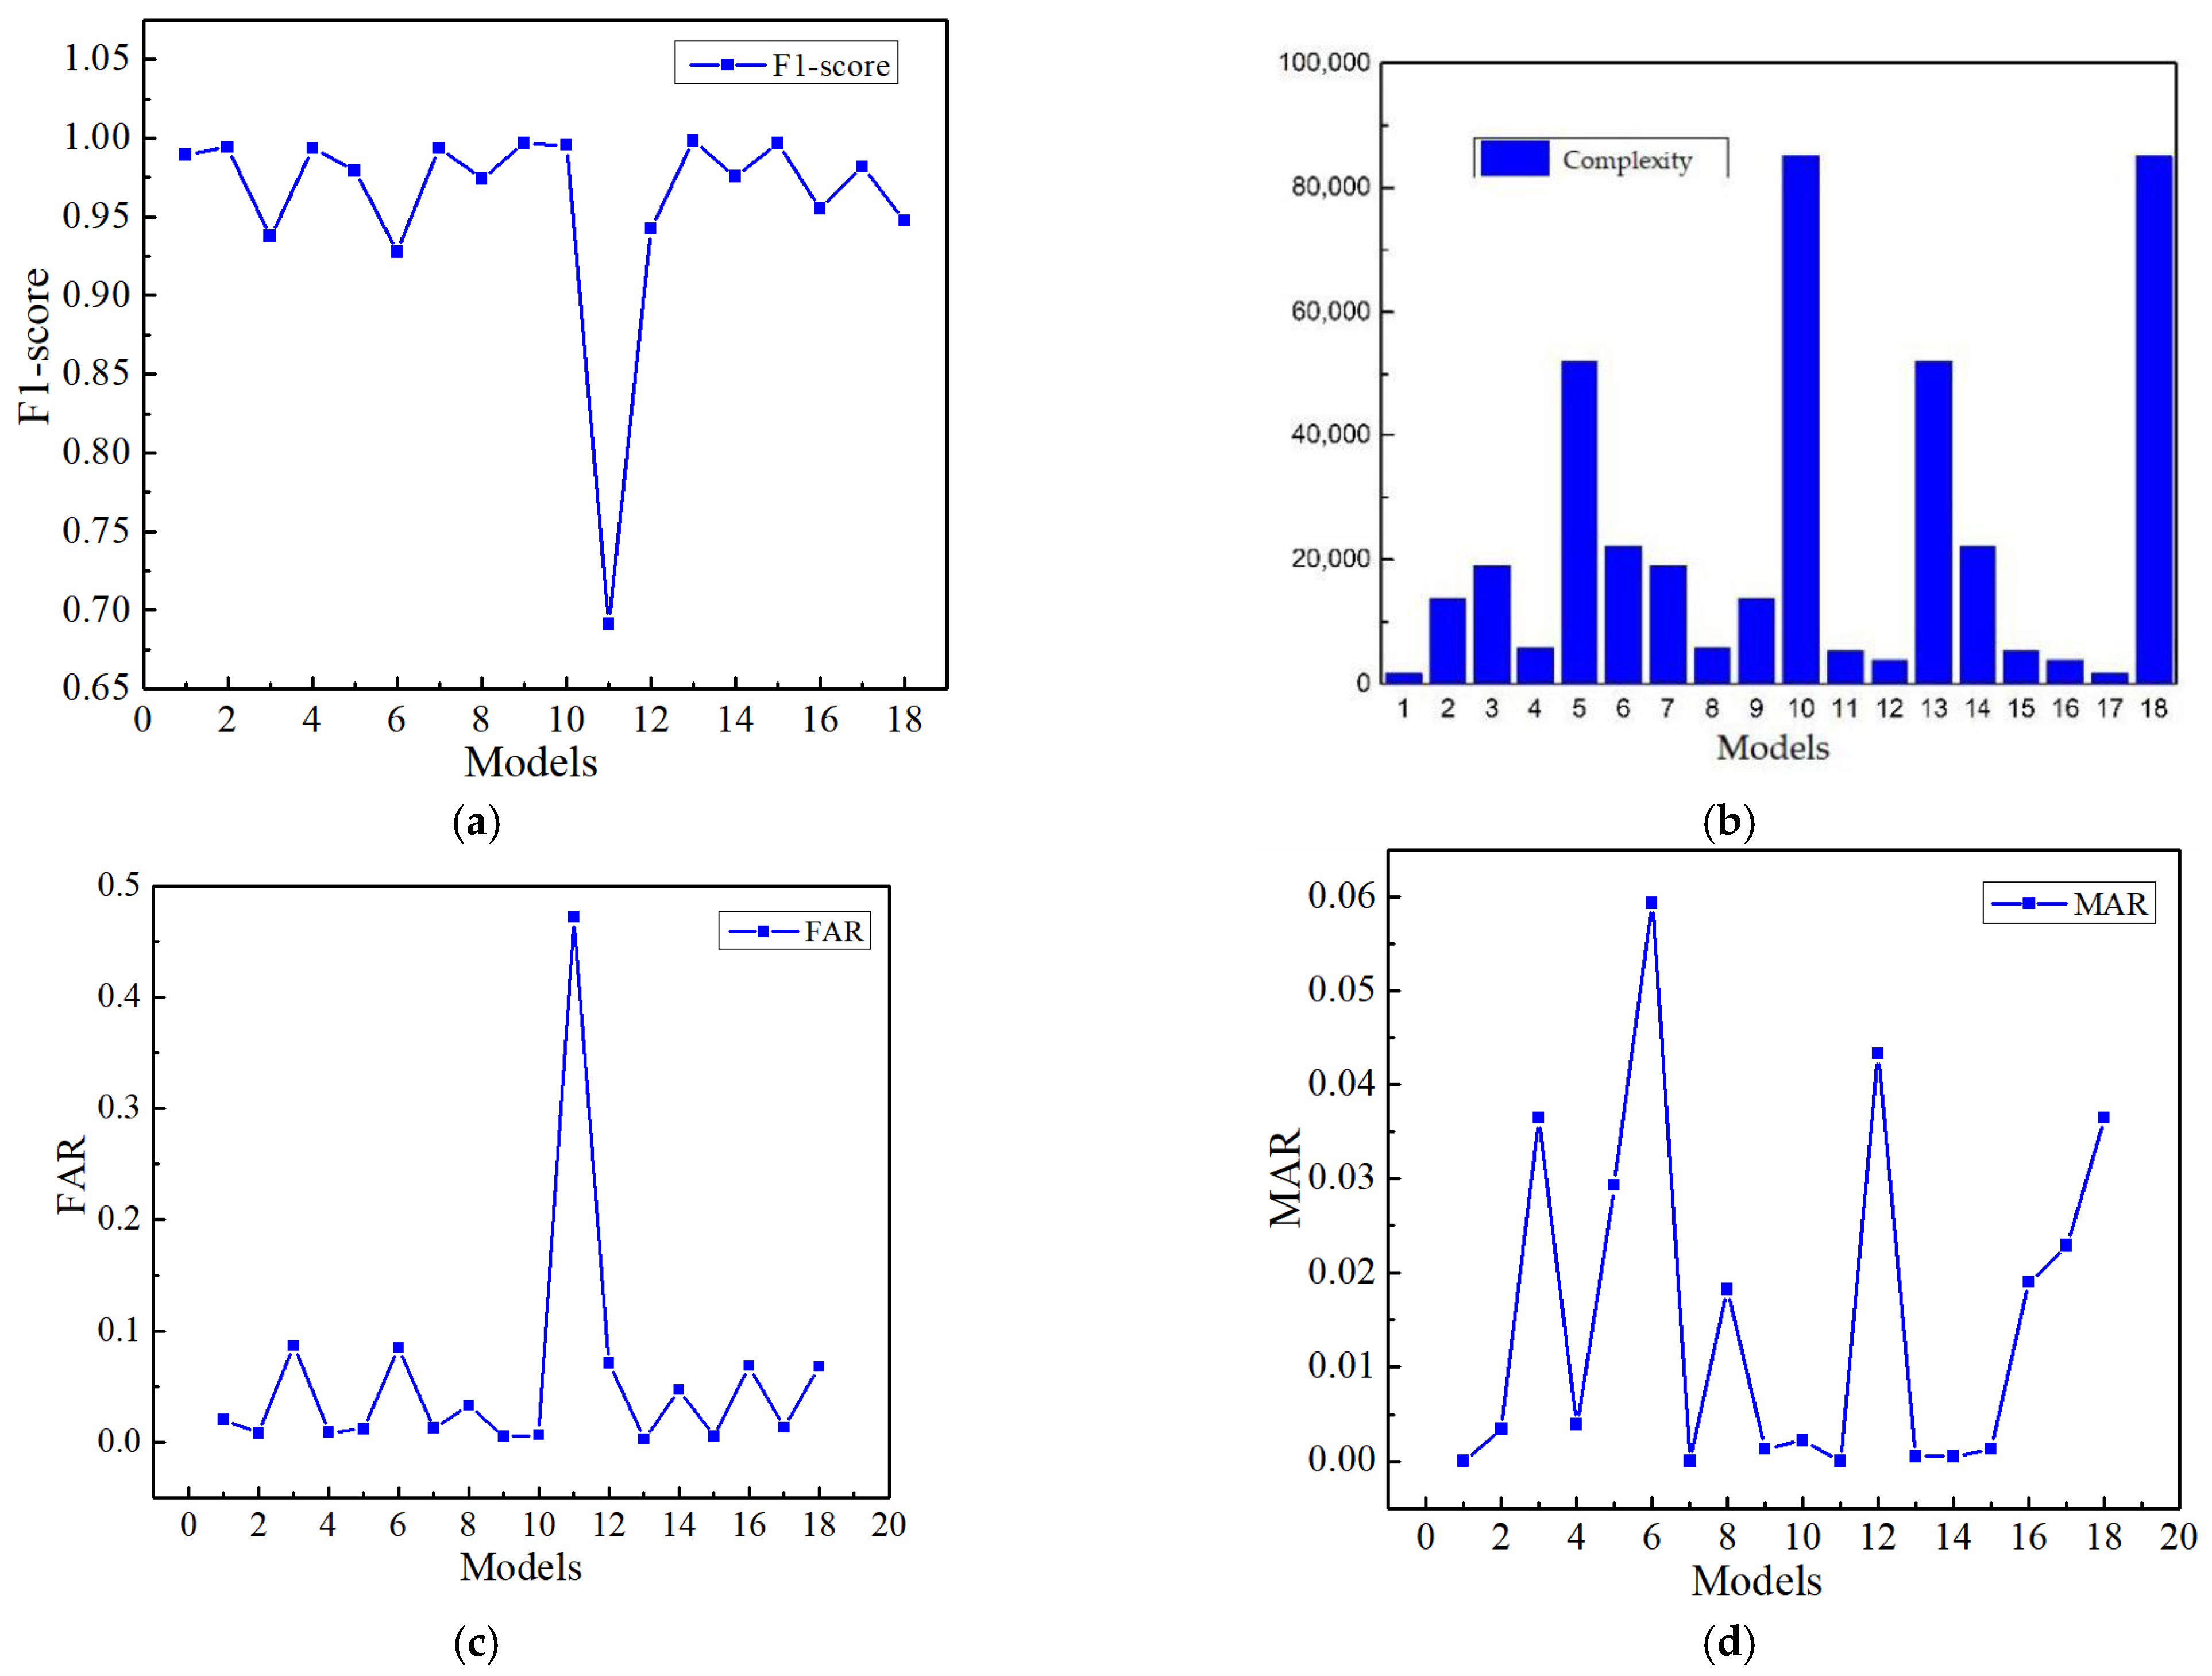
We combine FAR, MAR, F1 and model complexity to optimize the model. The evaluation indicators of each model are shown in Figure 7.
F1 has been widely employed in information retrieval which can well evaluate the advantages and disadvantages of the classification model [29]. Therefore, our criterion for model selection is to select a model with low complexity when F1 are not significantly different. The larger the F1, the better the model. As shown in Figure 7a, the first, second, fourth, seventh, ninth, tenth, thirteenth, fifteenth and seventeenth models have higher F1, and the values are close to each other. Considering there are not many training samples, in order to prevent over fitting and improve the generalization ability of the model, as shown in Figure 7b, the first and the seventeenth model with lower complexity are selected.
In the process of drilling, we pay more attention to the MAR, that is, we can accept a certain FAR, but cannot accept the MAR (all stuck can be predicted, but some non-stuck may be predicted as stuck). Therefore, when using the FAR and the MAR to optimize the model, the model with the lower MAR should be selected. As shown in Figure 7d, the first model with smaller MAR is selected as the best model.
The prediction results of the best model are shown in Section 3.3. The prediction result is given by stuck pipe probability, and when the probability is greater than 0.4, it is considered as stuck pipe, otherwise it is not.
3.3. Comprehensive Evaluation Method of Stuck Pipe Based on Fuzzy Mathematics
Through the analysis of Section 3.1 and Section 3.2, two evaluation indicators of stuck pipe are finally obtained. One is the evaluation index based on the torque and drag model, that is, the friction coefficient, and the other is the evaluation index based on the data-driven model, that is, the probability of stuck pipe.
The above two indicators can measure the possibility of stuck pipe to a certain extent. Considering that there are many fuzziness and uncertainty in drilling process, fuzzy mathematics theory is used to establish a comprehensive evaluation on the basis of the two sub-indices to realize comprehensive evaluation of stuck pipe.
3.3.1. Establishment of Fuzzy Set for Stuck Pipe
The American scientist Zadeh [30] extended the value of the ordinary set characteristic function from {0, 1} to [0, 1], thus creating the fuzzy set theory, and has the following definition:
Let X be a space of points (objects), with a generic element of X denoted by x. Thus, X = {x}, if there is a real-valued function , such that,
Then A is a fuzzy set on X. In order to distinguish it from ordinary sets, the characteristic function is called a membership function. This function describes that the element x in the X belongs to the set A to the degree .
Different values of membership function correspond to different membership degrees of x to set A.
When , x does not belong to A at all; When , x belongs to A completely; When , x belongs to A to the extent of .
Based on the above fuzzy mathematics theory, the following fuzzy set of stuck pipe, S, can be established. The fuzzy set S indicates that “stuck pipe may occur”, Suppose that the membership degree of each element in the to the fuzzy set S is , then the stuck pipe fuzzy set S can be expressed in the following form:
are the various evaluation indexes of stuck pipe. Two evaluation indexes were used, friction coefficient and probability of stuck pipe. is the membership function of stuck pipe, and the final fuzzy set S can be simplified into the following form,
3.3.2. Determination of Membership Function
For the stuck pipe fuzzy set, it is necessary to give the degree of membership of each stuck evaluation index to the fuzzy set S. Therefore, when using fuzzy mathematics theory, it is very important to find or design an appropriate membership function. The determination of membership function is subjective. Different people will give different results for the same problem. Finally, the Sigmoid-type function is selected as the membership function of the stuck pipe fuzzy set.
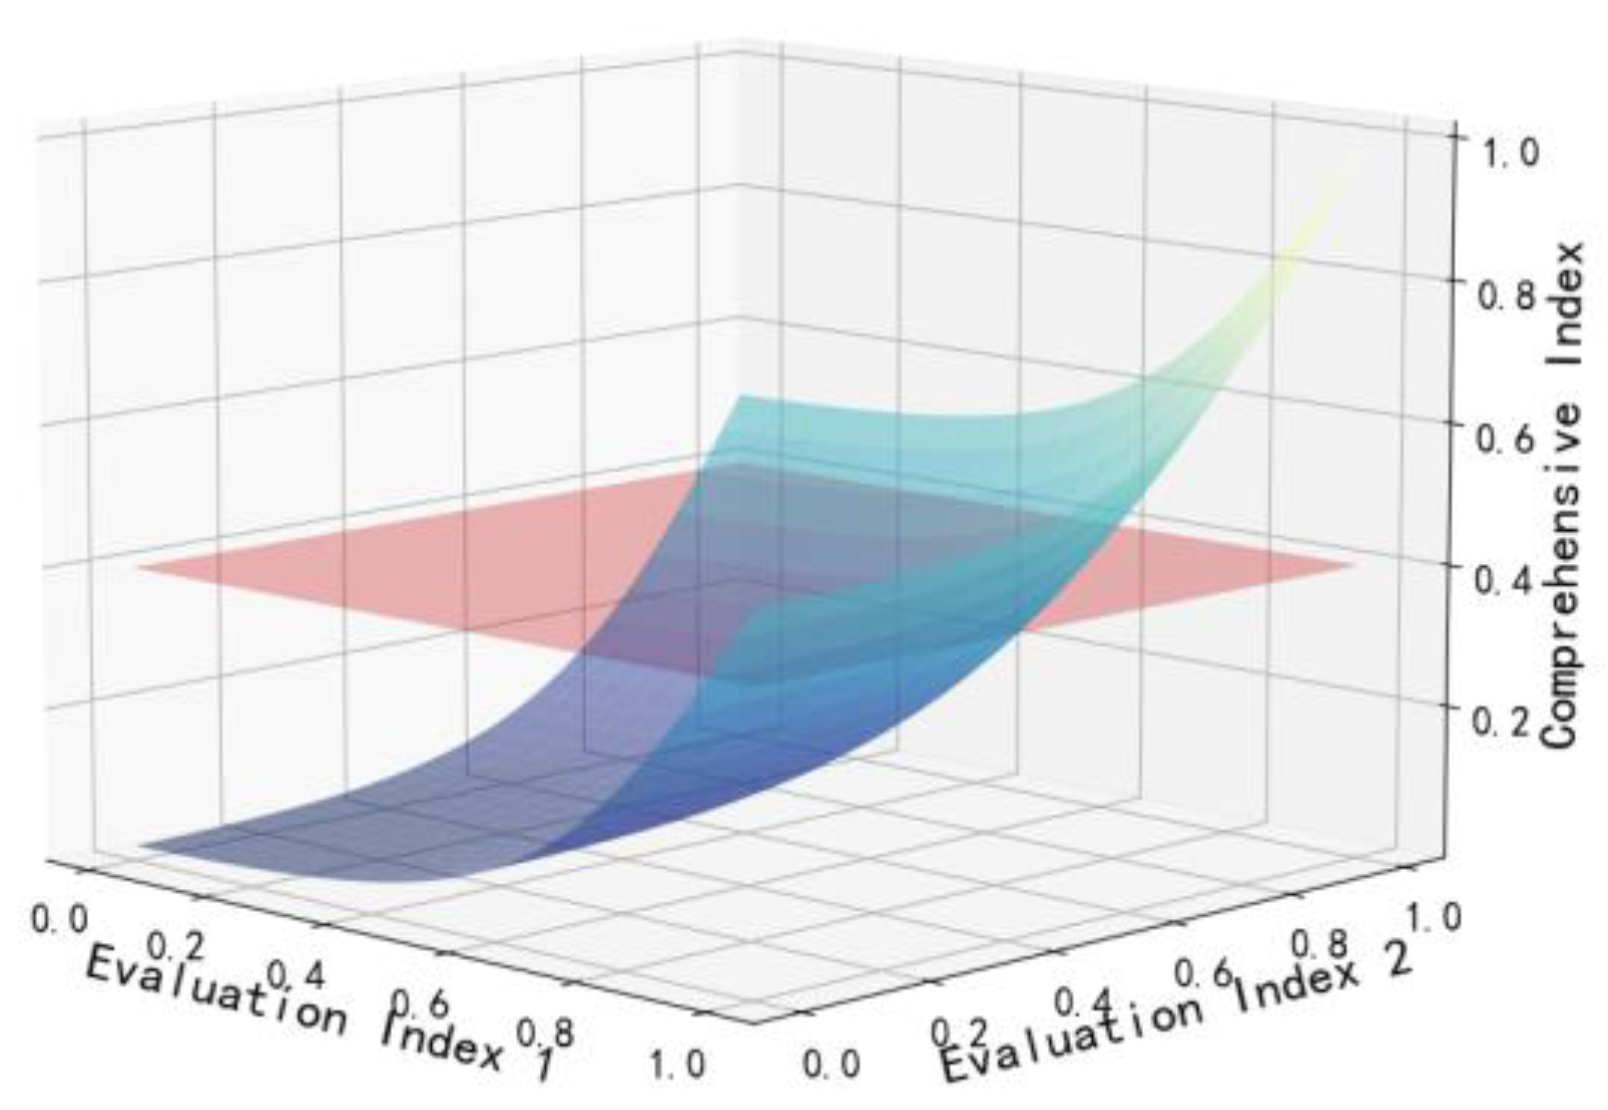
The range of the two sub-evaluation indexes in the is between 0 and 1. Theoretically, when the two sub indexes are both small (between 0 and 0.5), it means that the final possibility of stuck pipe is very small at this time, that is, the possibility of stuck pipe obtained by the comprehensive evaluation index is also very small. However, when either of the two indexes is larger (0.5–1), it indicates that the possibility of stuck pipe is greater, that is, the probability of stuck pipe obtained by comprehensive evaluation index is greater. As shown in Figure 8, it can be found that the sigmoid function can simulate a similar situation, that is, when x is between 0 and 0.5, it can be simply considered that y increases linearly with x, when x is between 0.5 and 1, y increases exponentially with x. When there is basically no stuck pipe risk, the comprehensive evaluation index value for stuck pipe will be small. When there is a certain stuck pipe risk, the sigmoid function will further expand the possibility, that is, the comprehensive evaluation index will be larger.
3.3.3. Establishment of Comprehensive Evaluation Index for Stuck Pipe
After determining the membership function of the fuzzy set, a comprehensive index of stuck pipe can be constructed. The fuzzy set S is expressed as,
The value range of the two indexes and after the membership function are between 0 and 0.5, so the two elements in the stuck pipe fuzzy set can be simply linearly added as the final comprehensive evaluation index,
As shown in Figure 9, the blue surface represents the surface composed of values of evaluation index 1 (friction coefficient,), evaluation index 2 (probability of stuck pipe) and comprehensive index. The red plane represents the threshold value of the comprehensive evaluation index.
In order to reduce the rate of missing alarm, the threshold value of comprehensive evaluation index of stuck pipe is set to 0.4, that is, when the comprehensive evaluation index is less than 0.4, it is considered that there is basically no risk of stuck pipe. The smaller the index is, the smaller the probability of stuck pipe is. When the comprehensive evaluation index is greater than 0.4, it is considered that there is a risk of stuck pipe. The larger the index is, the greater the probability is.
4. Results and Discussion
The paper analyzes the stuck pipe case of well A in Tarim Oilfield, China. The stuck pipe occurred at 6110.58 m. After various rescue measures, the accident was not successfully resolved, so it was finally decided to sidetrack again. It took about 3 months from the occurrence of the stuck pipe to the continuation of drilling, which seriously affected the drilling efficiency.
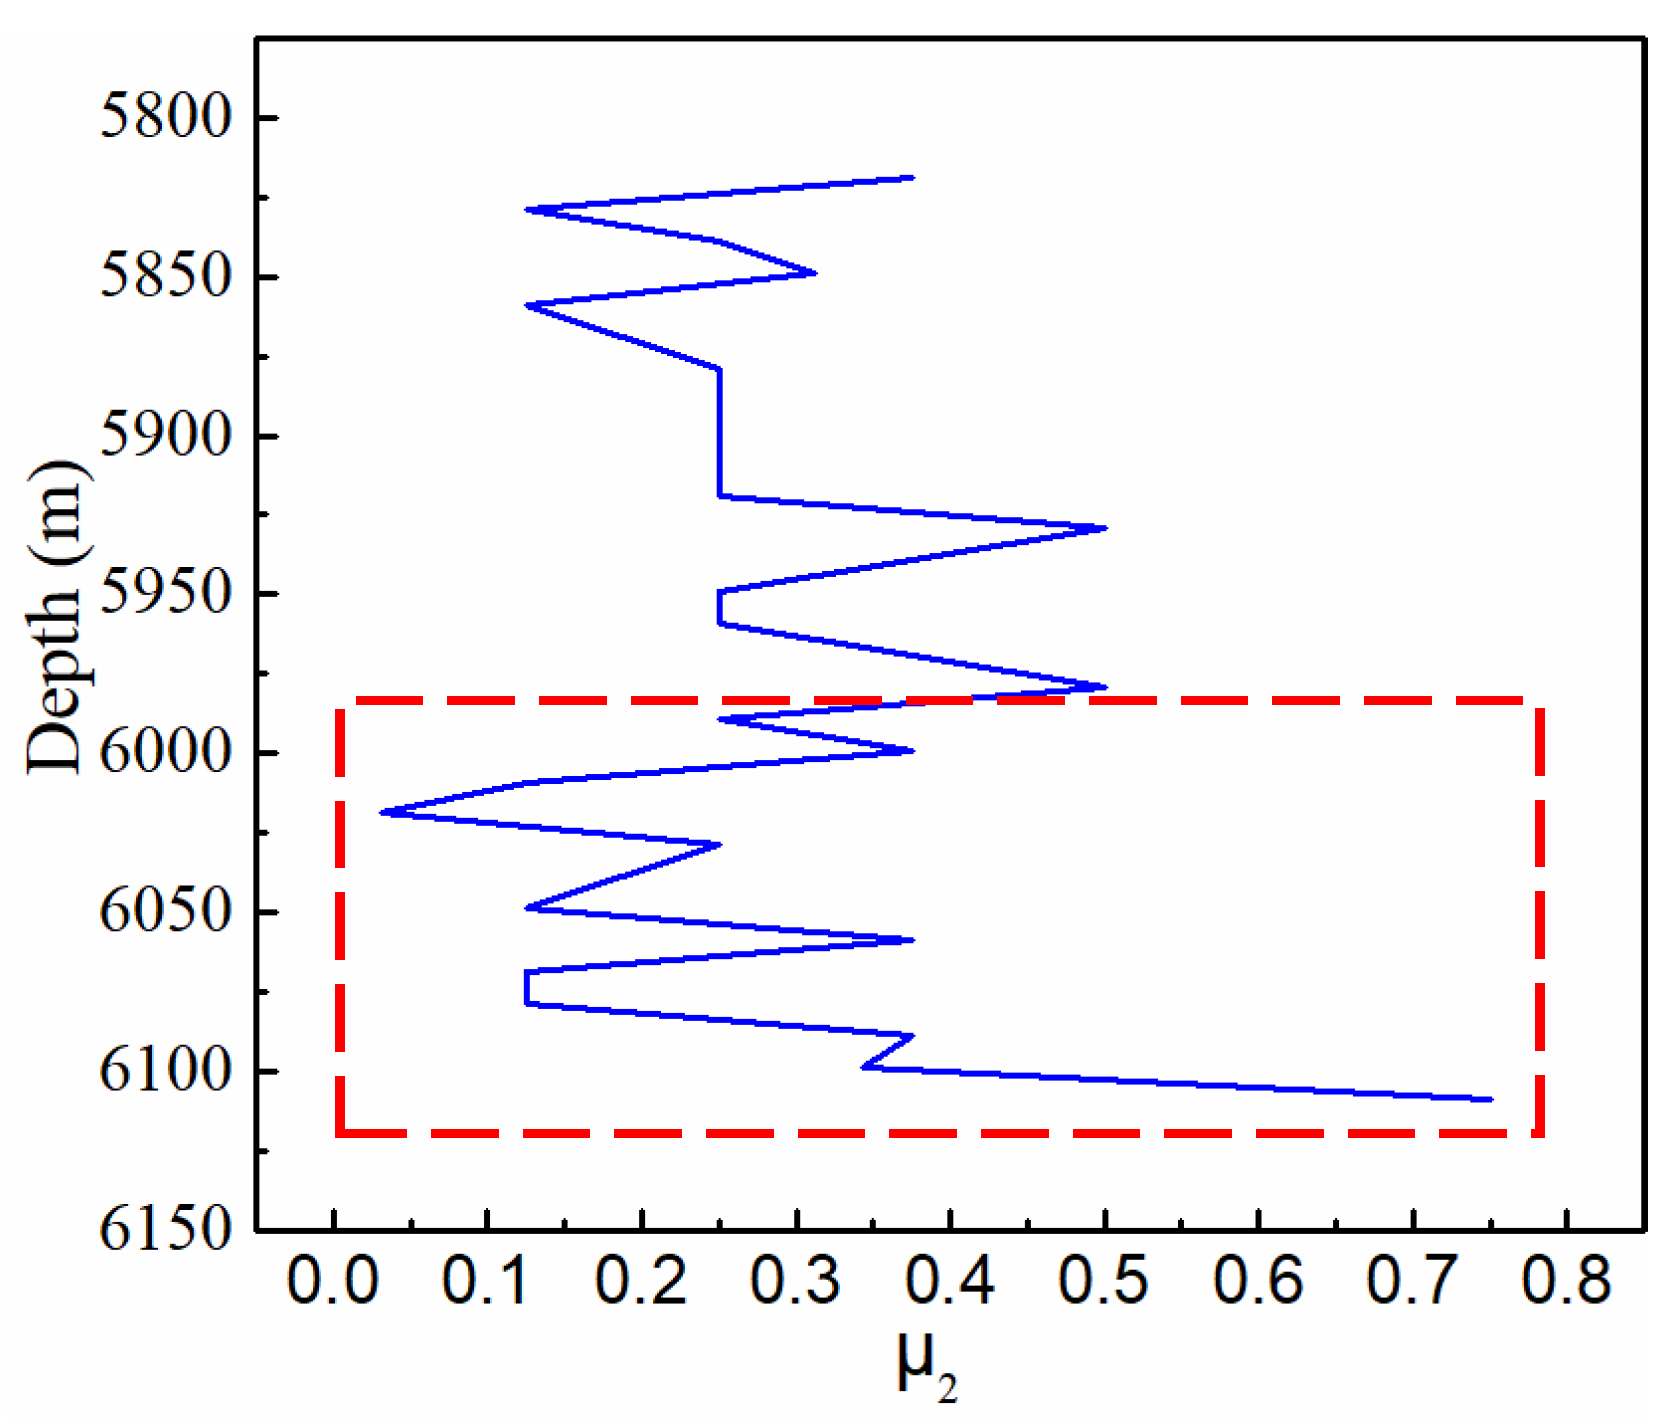
Figure 10 shows the stuck pipe index 1 (friction coefficient), which is calculated by the real-time inversion method of friction coefficient established in Section 3.1, and its change can characterize the stuck pipe trend to a certain extent.
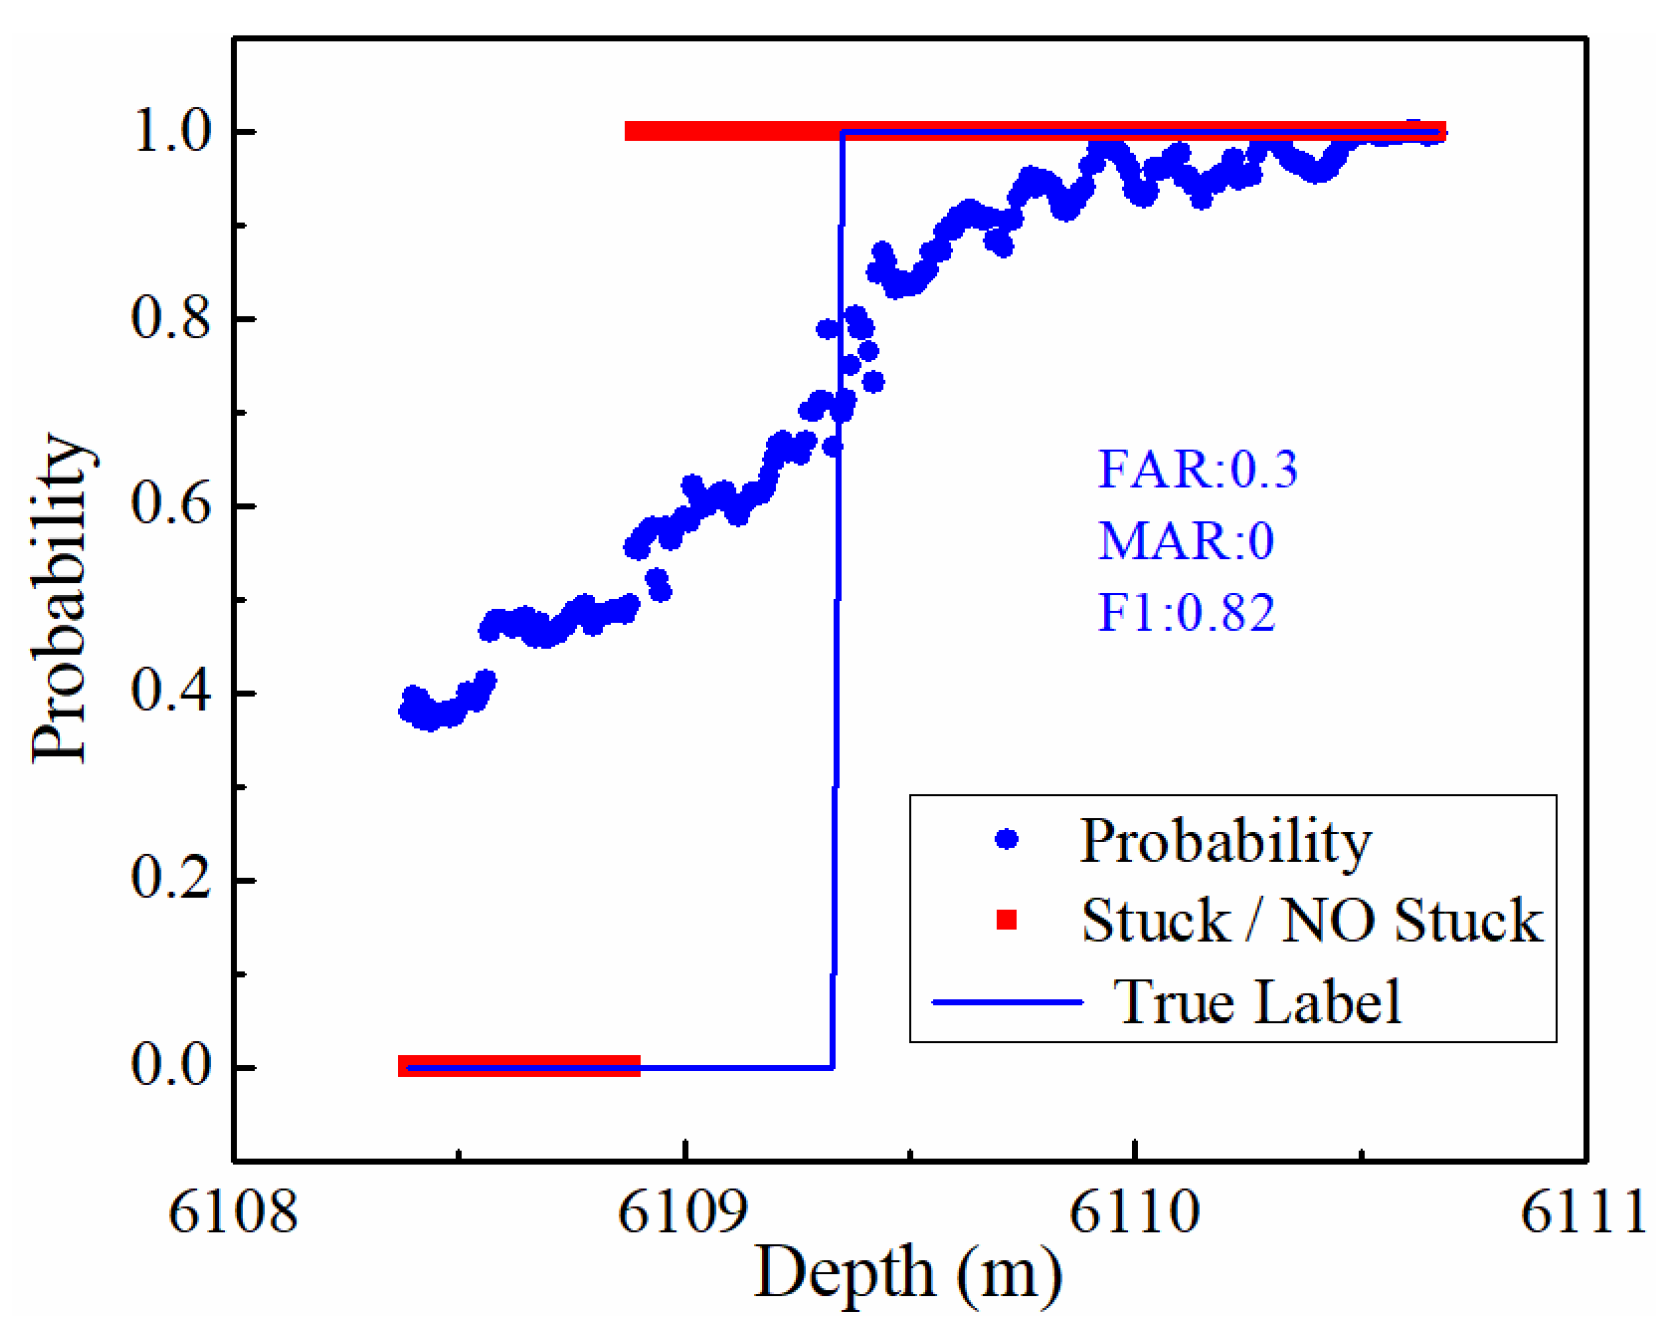
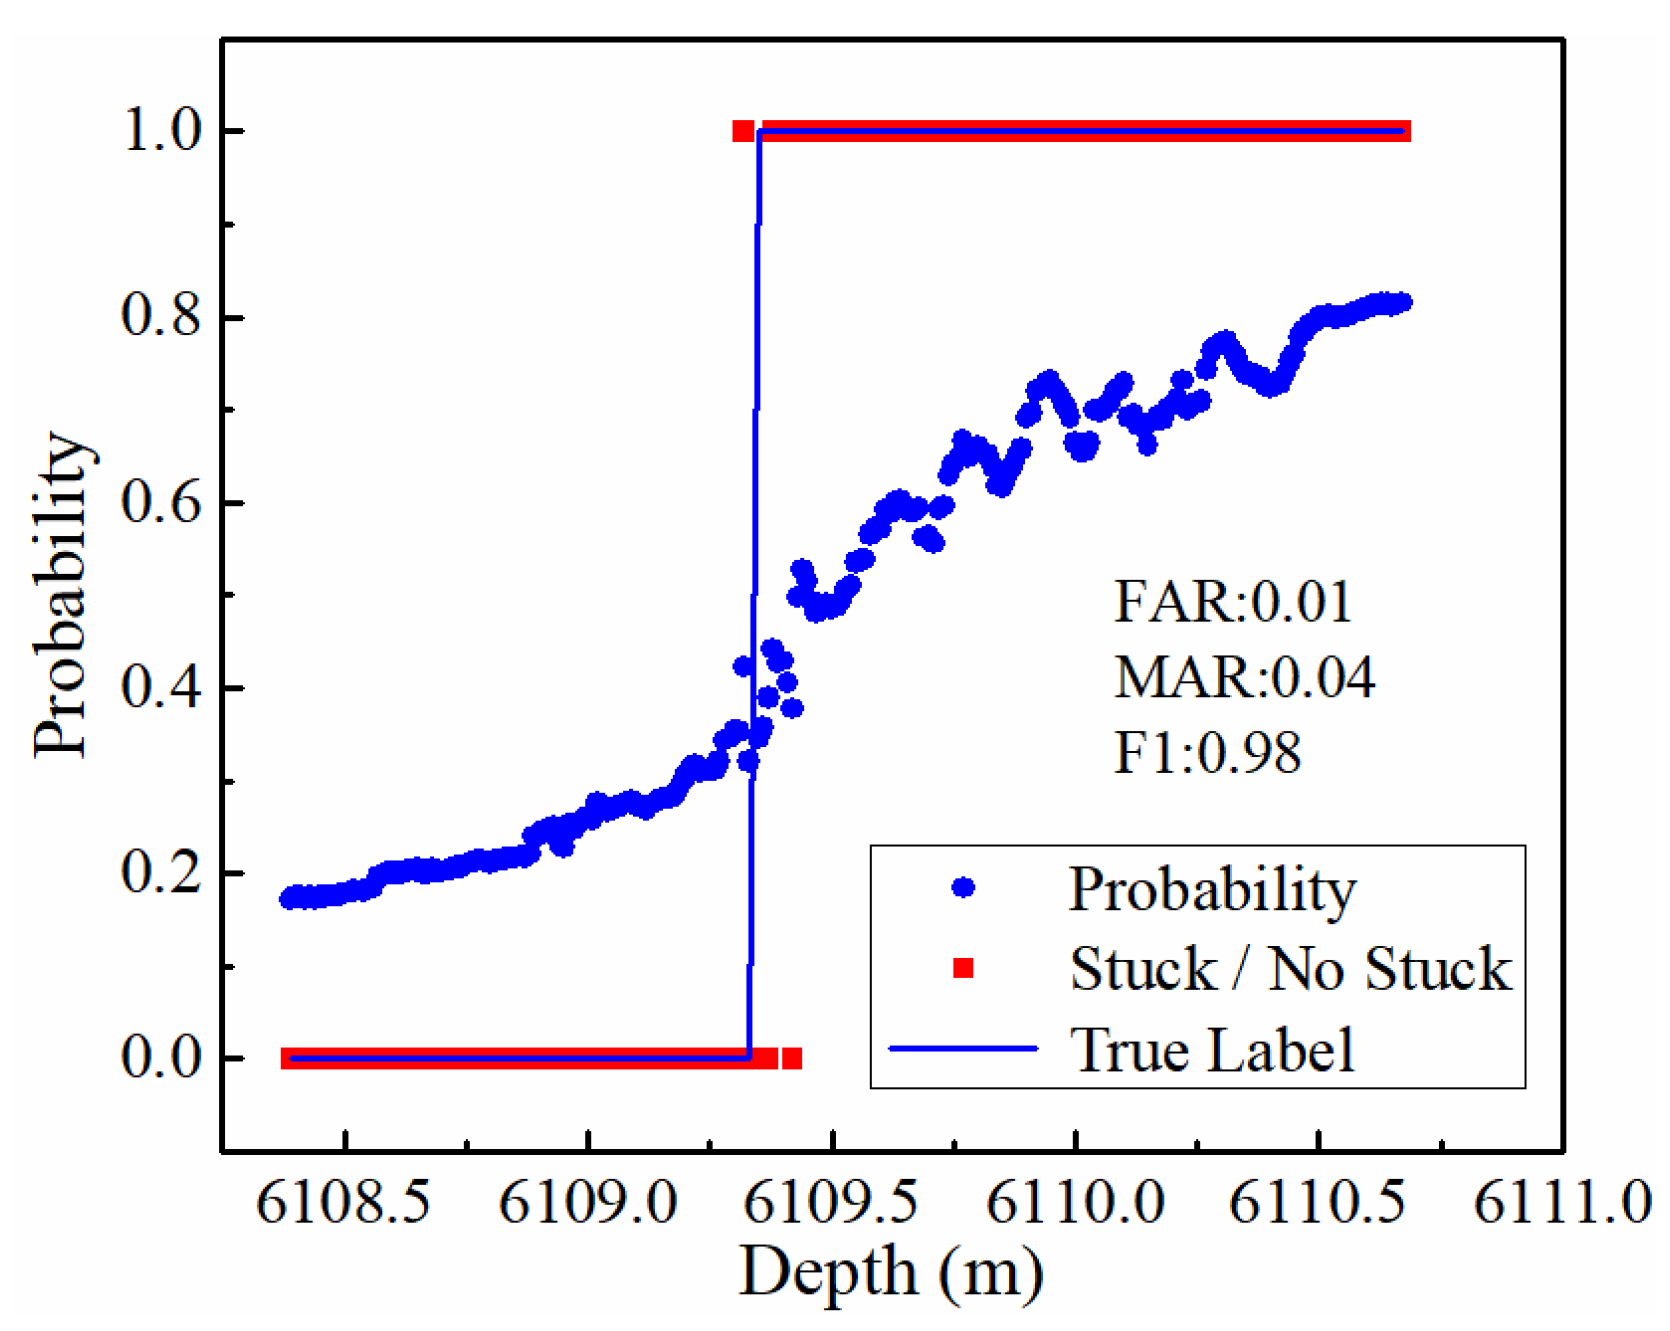
Figure 11 shows the stuck pipe index 2 (stuck pipe probability), which is obtained from the intelligent prediction model of stuck pipe probability based on the LSTM network in Section 3.2, which can provide early warning of stuck pipe through the changes of mudlog data. The red straight line indicates the predicted result of stuck (stuck/non stucking). Blue scatter indicates the probability of stuck pipe. The blue straight line represents the real sample of the site (0: no stuck, 1: stuck).
Figure 12 shows the comprehensive prediction of stuck pipe by using the comprehensive evaluation index established in Section 3.3.
As shown in Figure 10, it is found that the friction coefficient increases gradually from 6000 m to 6110 m. The friction coefficient increases sharply from 0.35 to 0.75 around 6110 m, which indicates the risk of stuck pipe. However, Real-time inversion of friction coefficient can only achieve qualitative evaluation, and it is difficult to accurately predict stuck pipe.
It can be seen from Figure 11 that the evaluation indexes predicted by the intelligent prediction model are: FAR: 0.3, MAR: 0, F1: 0.82. It can be found that although the MAR is 0, the FAR is relatively high, reaching 30%. Although a certain FAR is allowed for the prediction of stuck pipe, the FAR is too high, which will affect the drilling efficiency to a certain extent.
It can be seen from Figure 12 that the comprehensive evaluation indexes for stuck pipe are: FAR: 0.01, MAR: 0.04, F1: 0.98. Compared with the intelligent prediction model, the FAR is lower, only 1%. However, there is a certain MAR, which is 4%. Although for the prediction of stuck pipe, the existence of MAR will cause a certain risk to the site, this paper has marked some normal samples as stuck samples when dividing stuck samples, and it can be found from the figure that the 4% missed alarm rate is only the samples that is artificially marked as stuck samples are missed, and the real stuck samples have not been missed.
As shown in Table 3, the three prediction methods are compared and analyzed. First of all, trend analysis method of friction coefficient has a long history. In this paper, the neural network model is introduced to realize the real-time calculation of the WOB and TOB, and further realize the real-time monitoring and trend analysis of the friction coefficient during drilling, but it is still qualitative analysis, and it is difficult to give the accurate quantitative index.
The intelligent prediction of stuck pipe based on LSTM network can give accurate quantitative index of stuck pipe. However, through the analysis of FAR, MAR and F1, it is found that the prediction of stuck pipe based on data-driven method has a high FAR of 30%, which will have a certain impact on the site.
The comprehensive evaluation index for stuck pipe is obtained by combining two stuck sub-indexes through fuzzy mathematics. It realizes the prediction of stuck pipe based on data-driven and knowledge-driven model. Through the analysis of evaluation indexes such as FAR, MAR, and F1, it is found that although the MAR is 4% (the missing is only the artificially marked stuck sample, not the real stuck sample), the FAR is only 1%, compared with the FAR obtained by intelligent method, the FAR is reduced by 96%, which greatly reduces the false alarm of stuck pipe.
5. Conclusions
The prediction of stuck pipe is very challenging due to the hybrid nature of the drilling process (which consists of different activities), the variability of geological conditions, the combined occurrence of adverse events etc.
Three prediction methods of stuck pipe are established. In the first method, the neural network technology is used to calculate WOB and TOB in real-time. Combined with the torque and drag model, the real-time inversion of the friction coefficient is realized. The analysis method of stuck pipe trend based on the friction coefficient is finally established. In the second method, intelligent prediction of stuck pipe probability is realized by using mudlog data and LSTM network. Finally, a comprehensive prediction model is established, which combines knowledge-driven model (the first method) with data-driven model (the second method) using fuzzy mathematics theory.
For future work, we plan to look for more stuck pipe samples. On the one hand, we can increase the stability and generalization ability of the intelligent prediction model. On the other hand, we will use more samples to determine a reasonable threshold of stuck pipe instead of setting thresholds artificially.
Author Contributions
Conceptualization, X.S. and S.Z.; methodology, S.Z., X.S. and Z.Z.; software, X.Y. and M.L.; validation, S.Z.; formal analysis, S.Z. and X.S.; investigation, S.Z. and Z.Z.; resources, M.L.; data curation, S.Z.; writing—original draft preparation, S.Z. and Z.Z.; writing—review and editing, S.Z. and X.S.; supervision, X.S.; funding acquisition, X.S. All authors have read and agreed to the published version of the manuscript.
Funding
This research was funded by National Key Research and Development Program of China (funded by National Natural Science Foundation of China, No. 2019YFA0708300), the Strategic Cooperation Technology Projects of CNPC and CUPB (funded by China National Petroleum Corporation, No. ZLZX2020-03), the National Science Fund for Distinguished Young Scholars (funded by National Natural Science Foundation of China, No. 52125401) and Science Foundation of China University of Petroleum, Beijing (funded by China University of petroleum, Beijing, No. 2462022SZBH002).
Institutional Review Board Statement
Not applicable.
Informed Consent Statement
Not applicable.
Data Availability Statement
The data are not publicly available due to involve the information of Chinese oil fields and need to be kept confidential.
Acknowledgments
The authors want to thank the National Natural Science Foundation of China and the CNPC for the financial support.
Conflicts of Interest
The authors declare no conflict of interest.
References
- Wu, S.N.; Chen, M.Y.; Fan, J.C.; Zhang, L.B.; Yang, X.Q.; Feng, H.Z. Statistical analysis of lost time events in drilling and completion of HTHP wells in South China Sea, Safety production science and technology in China. J. Saf. Sci. Technol. 2020, 16, 14–20. [Google Scholar]
- Lesage, M.; Falconer, I.G.; Wick, C.J. Evaluating Drilling Practice in Deviated Wells with Torque and Weight Data. SPE Drill. Eng. 1988, 3, 248–252. [Google Scholar] [CrossRef]
- Brett, J.F.; Beckett, A.D.; Holt, C.A.; Smith, D.L. Uses and Limitations of Drillstring Tension and Torque Models for Monitoring Hole Conditions. SPE Drill. Eng. 1989, 4, 223–229. [Google Scholar] [CrossRef]
- Annis, M.R.; Monaghan, P.H. Differential Pressure Stuck pipe-Laboratory Studies of Friction Between Steel and Mud Filter Cake. J. Pet. Technol. 1962, 14, 537–543. [Google Scholar] [CrossRef]
- Shahbazi, K.; Meschi, M.; Shahri, E. A New Criteria to Predict Stuck Pipe Occurrence. In Proceedings of the North Africa Technical Conference and Exhibition, Cairo, Egypt, 14–17 February 2010. [Google Scholar]
- Dunbar, M.E.; Warren, T.M.; Kadaster, A.G. Bit Stuck pipe Caused by Borehole Deformation. SPE Drill. Eng. 1986, 1, 417–425. [Google Scholar] [CrossRef]
- Hempkins, W.B.; Kingsborough, R.H.; Lohec, W.E.; Nini, C.J. Multivariate Statistical Analysis of Stuck Drillpipe Situations. SPE Drill. Eng. 1987, 2, 237–244. [Google Scholar] [CrossRef]
- Murillo, A.; Neuman, J.; Samuel, R. Pipe stuck pipe prediction and avoidance using adaptive fuzzy logic and neural network modeling. In Proceedings of the SPE Production and Operations Symposium, Oklahoma City, OK, USA, 4–8 April 2009; pp. 244–258. [Google Scholar]
- Shoraka, S.; Shadizadeh, S.R.; Shahri, M.P. Prediction of Stuck Pipe in Iranian South Oil Fields Using Multivariate Statistical Analysis. In Proceedings of the Nigeria Annual International Conference and Exhibition, Abuja, Nigeria, 30 July–3 August 2011. [Google Scholar]
- Biegler, M.W.; Kuhn, G.R. Advances in Prediction of Stuck Pipe Using Multivariate Statistical Analysis. In Proceedings of the IADC/SPE Drilling Conference, Dallas, TX, USA, 15–18 February 1994. [Google Scholar]
- Sasannejad, A.; Shahbazi, K. A New Approach for Estimating Free Point in Fishing of Stuck Pipe using Artificial Neural Network. Int. J. Comput. Appl. 2013, 82, 53–57. [Google Scholar] [CrossRef]
- Nezhad, M.M.; Ashoori, S.; Hooshmand, P.; Mirzaee, M. Stuck Drill Pipe Prediction with Networks Neural in Maroon Field. J. Basic Appl. Sci. Res. 2012, 6, 5570–5575. [Google Scholar]
- Siruvuri, C.; Nagarakanti, S.; Samuel, R. Stuck Pipe Prediction and Avoidance: A Convolutional Neural Network Approach, Stuck Pipe Prediction and Avoidance: A Convolutional Neural Network Approach. In Proceedings of the IADC/SPE Drilling Conference, Miami, FL, USA, 21–23 February 2006. [Google Scholar]
- Naraghi, M.E.; Ezzatyar, P.; Jamshidi, S. Adaptive Neuro Fuzzy Inference System and Artificial Neural Networks: Reliable approaches for pipe stuck prediction. Aust. J. Basic Appl. Sci. 2013, 7, 604–618. [Google Scholar]
- Heinze, L.; Al-Baiyat, I.A. Implementing Artificial Neural Networks and Support Vector Machines in Stuck Pipe Prediction. In Proceedings of the SPE Kuwait International Petroleum Conference and Exhibition, Kuwait City, Kuwait, 10–12 December 2012. [Google Scholar]
- Naraghi, M.E.; Ezzatyar, P.; Jamshidi, S. Prediction of drilling pipe stuck pipe by active learning method (ALM). J. Pet. Gas Eng. 2013, 4, 173–183. [Google Scholar] [CrossRef]
- Salminen, K.; Cheatham, C.; Smith, M.; Valiulin, K. Stuck Pipe Prediction Using Automated Real-Time Modeling and Data Analysis. SPE Drill. Complet. 2017, 32, 184–193. [Google Scholar] [CrossRef]
- Shahbazi, K.; Shahri, M.P. The Development of a Window for Stuck Pipe Prediction. Pet. Sci. Technol. 2012, 30, 176–192. [Google Scholar] [CrossRef]
- Shan, Z.G.; Shao, W.G.; Chen, J.T. Application of artificial neural network in real time prediction of stuck pipe. Geol. Explor. 2000, 36, 10–12. [Google Scholar]
- Yu, R.Q. Research on prediction technology of stuck pipe accident. Pet. Drill. Tech. 1996, 24, 15–17. [Google Scholar]
- Liu, J.M.; Li, Y.M.; Zhang, T.; Song, J.M. Research on PCA-RF-Based Stuck Pipe Prediction Method. Available online: https://scjg.cnki.net/kcms/detail/detail.aspx?filename=BJGY202101004&dbcode=CJFQ&dbname=CJFD2021&v=MTY2NTJUZzJYMmhzeEZyQ1VSN3VlWnVacUZ5dmxWTC9BSnlmTWQ3RzRITkRNcm85RllJUitDMzg0emg0WG5EMEw= (accessed on 1 May 2022).
- Brankovic, A.; Matteucci, M.; Restelli, M.; Ferrarini, L.; Piroddi, L.; Spelta, A.; Zausa, F. Data-driven indicators for the detection and prediction of stuck-pipe events in oil&gas drilling operations. Upstream Oil Gas Technol. 2021, 7, 100043. [Google Scholar] [CrossRef]
- Song, X.Z.; Zhu, S.; Li, G.S.; Zeng, Y.J.; Guo, H.J.; Hu, Z.J. Prediction of hook tension and torque based on bp-lstm dual input network. J. China Univ. Pet. (Ed. Nat. Sci.) 2022, 46, 76–84. [Google Scholar]
- Rumelhart, D.; Hinton, G.E.; Williams, R.J. Learning Representations by Back Propagating Errors. Nature 1986, 323, 533–536. [Google Scholar] [CrossRef]
- Hochreiter, S.; Schmidhuber, J. Long short-term memory. Neural Comput. 1997, 9, 1735–1780. [Google Scholar] [CrossRef]
- Johancsik, C.A.; Friesen, D.B.; Dawson, R. Torque and Drag in Directional Wells-Prediction and Measurement. J. Pet. Technol. 1984, 36, 987–992. [Google Scholar] [CrossRef]
- Ho, H.-S. An Improved Modeling Program for Computing the Torque and Drag in Directional and Deep Wells. In Proceedings of the SPE Annual Technical Conference and Exhibition, Houston, TX, USA, 2–5 October 1988. [Google Scholar]
- Li, L.; Huang, B.; Zhang, G.; Wang, D.; Dai, M.; Yang, Z.; Wang, C. Optimization of Ammonium Sulfate Crystals Based on Orthogonal Design. J. Cryst. Growth 2021, 570, 126217. [Google Scholar] [CrossRef]
- Baeza-Yates, R.; Ribeiro-Neto, B. Modern Information Retrieval; ACM Press: New York, NY, USA, 1999. [Google Scholar]
- Zadeh, L.A. Fuzzy sets. Inf. Control. 1965, 8, 338–353. [Google Scholar] [CrossRef] [Green Version]
Figure 1.
BP-LSTM dual input network structure.

Figure 2.
Comparison of predicted and true WOB.

Figure 3.
Comparison of predicted and true TOB.

Figure 4.
Flow chart of real time inversion for friction coefficient.

Figure 5.
Hook tension and torque changes in the whole day on 2 May.

Figure 6.
Hook tension and torque changes from 20:11:28 to 21:21:28.

Figure 7.
Different evaluation indexes of classification model. (a) F1 of each model; (b) Complexity of each model; (c) FAR of each model; (d) MAR of each model.
Figure 7.
Different evaluation indexes of classification model. (a) F1 of each model; (b) Complexity of each model; (c) FAR of each model; (d) MAR of each model.

Figure 8.
Function curve in sigmoid form.

Figure 9.
Schematic diagram of comprehensive evaluation index surface and threshold plane.

Figure 10.
Variation trend of friction coefficient.

Figure 11.
Intelligent prediction of stuck pipe probability.

Figure 12.
Prediction of stuck by comprehensive evaluation index.


Table 1.
Test table of BP-LSTM network model.
| Layers (BP) | Neurons (BP) | Layers (LSTM) | Neurons (LSTM) | Dropout | Activation Function | WOB (kN) | TOB (kN·m) | |||
|---|---|---|---|---|---|---|---|---|---|---|
| RMSE (kN) | MAPE (%) | RMSE (kN·m) | MAPE (%) | |||||||
| 1 | 1 | 32 | 1 | 16 | 0.1 | sigmoid | 77.3 | 39.5 | 6.2 | 29.0 |
| 2 | 1 | 64 | 1 | 32 | 0.3 | tanh | 23.8 | 13.0 | 2.8 | 12.8 |
| 3 | 1 | 128 | 1 | 64 | 0.2 | relu | 24.6 | 13.0 | 3.1 | 14.0 |
| 4 | 2 | 32 | 2 | 16 | 0.3 | relu | 35.3 | 18.9 | 3.6 | 16.1 |
| 5 | 2 | 64 | 2 | 32 | 0.2 | sigmoid | 76.7 | 39.2 | 5.5 | 25.7 |
| 6 | 2 | 128 | 2 | 64 | 0.1 | tanh | 23.9 | 12.8 | 2.9 | 13.3 |
| 7 | 3 | 32 | 3 | 16 | 0.2 | tanh | 28.5 | 16.3 | 3.2 | 14.7 |
| 8 | 3 | 64 | 3 | 32 | 0.1 | relu | 27.1 | 14.5 | 3.4 | 16.6 |
| 9 | 3 | 128 | 3 | 64 | 0.3 | sigmoid | 78.4 | 39.9 | 9.4 | 40.1 |
Table 2.
Evaluation indexes of classification problem.
| Real Category | Forecast Category | |
|---|---|---|
| Positive (Stuck) | Negative (Non Stuck) | |
| Positive (Stuck) | True Positive | False Negative |
| Negative (Non stuck) | False Positive | True Negative |
Table 3.
Comparison of three prediction methods of stuck pipe.
| Method | FAR | MAR | F1 | |
|---|---|---|---|---|
| Qualitative | Friction coefficient | / | / | / |
| Quantitative | Intelligent prediction | 0.3 | 0.0 | 0.82 |
| Comprehensive evaluation | 0.01 | 0.04 | 0.98 |
Publisher’s Note: MDPI stays neutral with regard to jurisdictional claims in published maps and institutional affiliations. |
© 2022 by the authors. Licensee MDPI, Basel, Switzerland. This article is an open access article distributed under the terms and conditions of the Creative Commons Attribution (CC BY) license (https://creativecommons.org/licenses/by/4.0/).
Share and Cite
MDPI and ACS Style
Zhu, S.; Song, X.; Zhu, Z.; Yao, X.; Liu, M. Intelligent Prediction of Stuck Pipe Using Combined Data-Driven and Knowledge-Driven Model. Appl. Sci. 2022, 12, 5282. https://0-doi-org.brum.beds.ac.uk/10.3390/app12105282
AMA Style
Zhu S, Song X, Zhu Z, Yao X, Liu M. Intelligent Prediction of Stuck Pipe Using Combined Data-Driven and Knowledge-Driven Model. Applied Sciences. 2022; 12(10):5282. https://0-doi-org.brum.beds.ac.uk/10.3390/app12105282
Chicago/Turabian StyleZhu, Shuo, Xianzhi Song, Zhaopeng Zhu, Xuezhe Yao, and Muchen Liu. 2022. "Intelligent Prediction of Stuck Pipe Using Combined Data-Driven and Knowledge-Driven Model" Applied Sciences 12, no. 10: 5282. https://0-doi-org.brum.beds.ac.uk/10.3390/app12105282
Note that from the first issue of 2016, this journal uses article numbers instead of page numbers. See further details here.