Article

Relationship between Induced Polarization Relaxation Time and Hydraulic Characteristics of Water-Bearing Sand

1
Geotechnical and Structural Engineering Research Center, Shandong University, Jinan 250061, China
2
School of Qilu Transportation, Shandong University, Jinan 250061, China
3
School of Civil Engineering, Shandong University, Jinan 250061, China
4
Shandong Hi-Speed Group Co., Ltd., Jinan 250101, China
5
School of Civil and Transportation Engineering, Hohai University, Nanjing 210098, China
6
General Institute of Water Resources and Hydropower Planning and Design, Ministry of Water Resources, Beijing 100120, China
*
Author to whom correspondence should be addressed.
Submission received: 25 May 2022 / Revised: 3 June 2022 / Accepted: 3 June 2022 / Published: 5 June 2022
(This article belongs to the Section Civil Engineering)

Abstract

:
The induced polarization method has become a popular method for evaluating formation permeability characteristics in recent years because of its sensitivity to water and water-bearing porous media. In particular, the induced polarization relaxation time can reflect the macroscopic characteristics of the porous media of rock and soil. Therefore, in order to study the relationship between relaxation time and permeability, eight quartz sand samples of different grain sizes were used to simulate water-bearing sand layers under different geological conditions, and the induced polarization experiment and the Darcy seepage experiment were carried out on the same sand sample. The experimental results show that relaxation time and permeability are closely correlated with the grain size of quartz sand samples. According to the experimental data, the power function equation is a better fit for describing the relationship between permeability and relaxation time. It is worth noting that the equations obtained are only empirical equations for quartz sand samples, and they may not be applicable to all geological conditions.

1. Introduction

With the increasing number of deep and long tunnels being constructed, water and mud burst disasters in front of these tunnels have become more frequent due to surrounding water-bearing structures, and this has become an important problem that needs to be solved in the construction of tunnels [1,2]. The water permeability of a water-bearing structure (that is, its permeability characteristics) directly determines the magnitude and scale of water inrush. It is essential to estimate the magnitude and scale of water inrush through the proper evaluation of the permeability characteristics of water-bearing structures [3]. In general, laboratory measurements of borehole samples, as well as field methods such as pumping or pressure experiments, are used to understand the permeability characteristics of water-bearing structures in front of tunnel faces [4]. However, these methods are expensive, and due to a shortage of samples and in situ experiments, their results often suffer from hysteresis and one-sidedness. The induced polarization method has the advantage of being sensitive to the porous media of formations and not being subject to topographical factors, and it is being used more and more frequently to predict the hydraulic characteristics of the formation [5,6].
The induced polarization method is a geophysical method based on the induced polarization effect in porous media, which is dependent on the difference between the induced polarization parameters of different rock and soil media. By observing the complex conductivity and polarizability of the rock–soil medium, we can derive information such as the “real part”, characterizing the charge conduction characteristics, and the “imaginary part”, characterizing the charge storage characteristics in complex conductivity [7,8]. Permeability determines the resistance of porous materials to fluid flow [9,10]. In the detection of disaster-causing, water-bearing structures in tunnels, the fluid is usually groundwater, and its properties are relatively stable. Therefore, the permeability (k) can be used to evaluate the permeability of the entire formation. In 1957, the induced polarization method was first proved to be applicable to groundwater detection, which showed that the permeability of shallow aquifers can be evaluated by the relevant parameters of the induced polarization decay curve [11]. Börner et al. (1996) used the constant phase angle model to quantitatively interpret the results of field spectral induced polarization measurements, which could separate the electrical volume and interface effect. By using a Kozeny–Carman-like equation, the hydraulic permeability can be estimated [12]. Combined with the Kozeny–Carman formula, the relationship between permeability, porosity and specific surface area can be obtained [13,14,15,16]. In addition, some scholars have found that the correlation between the imaginary part of complex conductivity and the specific surface area is weak when using British sandstone for experiments and that it is difficult to satisfy the accuracy requirements for predicting permeability [17]. Hördt et al. (2007) verified the permeability coefficient of different field data using the empirical equations by Börner et al. (1996) and Slater and Lesmes (2002) and showed the limitations of their method; they suggested that using the relaxation time for estimating the permeability [18].
In the study of relaxation time, Lesmes and Morgan (2001) proposed to use the relaxation time distribution to assess the grain size distribution [19]. Scott and Barker (2003) found a correlation between the distributions of pore throat diameters and relaxation time through the sandstone test. After that, increasing literature showed that relaxation time was positively correlated with the square of pore throat diameter or grain size [20,21,22]. In terms of the prediction of permeability by relaxation time, Binley et al. (2005) verified the positive correlation between the permeability and the relaxation time for water-saturated sandstones [17]. Some scholars have shown that permeability calculations can be carried out by using the correlation between relaxation time and pore size and that the calculated results are typically in good agreement with directly measured permeability [23]. The relaxation time spectrum inversion method is used for obtaining the induced polarization relaxation time spectrum of a sample via the time–domain decay curve; in turn, the induced polarization relaxation time spectrum can then be used for characterizing porous media distribution and to estimate its permeability [24,25,26]. By introducing the formation factor, Joseph et al. (2016) proposed that the relaxation time can be used to better predict the permeability of the samples in their study [27]. In addition, some scholars have studied from the perspective of Debye decomposition that the relaxation time and permeability conform to a power–law relationship in the sandstone samples; this suggests that the relaxation time parameter is a good indicator for permeability evaluation [28]. The above research shows that relaxation time and permeability could have a good correlation.
In this paper, we mainly expand the factual database of water-bearing sand samples. Then relaxation time and permeability curves using grain size as the link are established, providing an expression of the relationship between these two parameters suitable for water-bearing sand samples. Eight kinds of quartz sand samples were used to simulate a water-bearing sand layer under different conditions, and in situ experiments and laboratory testing were carried out through multiple predesigned experimental devices. The first was an induced polarization experiment, where tanks of different sizes were filled with quartz sand samples of different grain sizes, and the relaxation times were measured. The second experiment involved the measurement of permeability. Using the same sample, a Darcy percolation experiment was performed to determine the sample’s permeability parameters in order to obtain its actual permeability. By treating the grain size of the water-bearing sand samples as an intermediate quantity, the relationship between relaxation time and permeability was established. This relationship is further clarified to verify the effectiveness of the use of this method for estimating induced polarization permeability. The results of this study could provide a theoretical basis for the advanced detection of permeability via tunnel-induced polarization.

2. Experimental Principles and Method

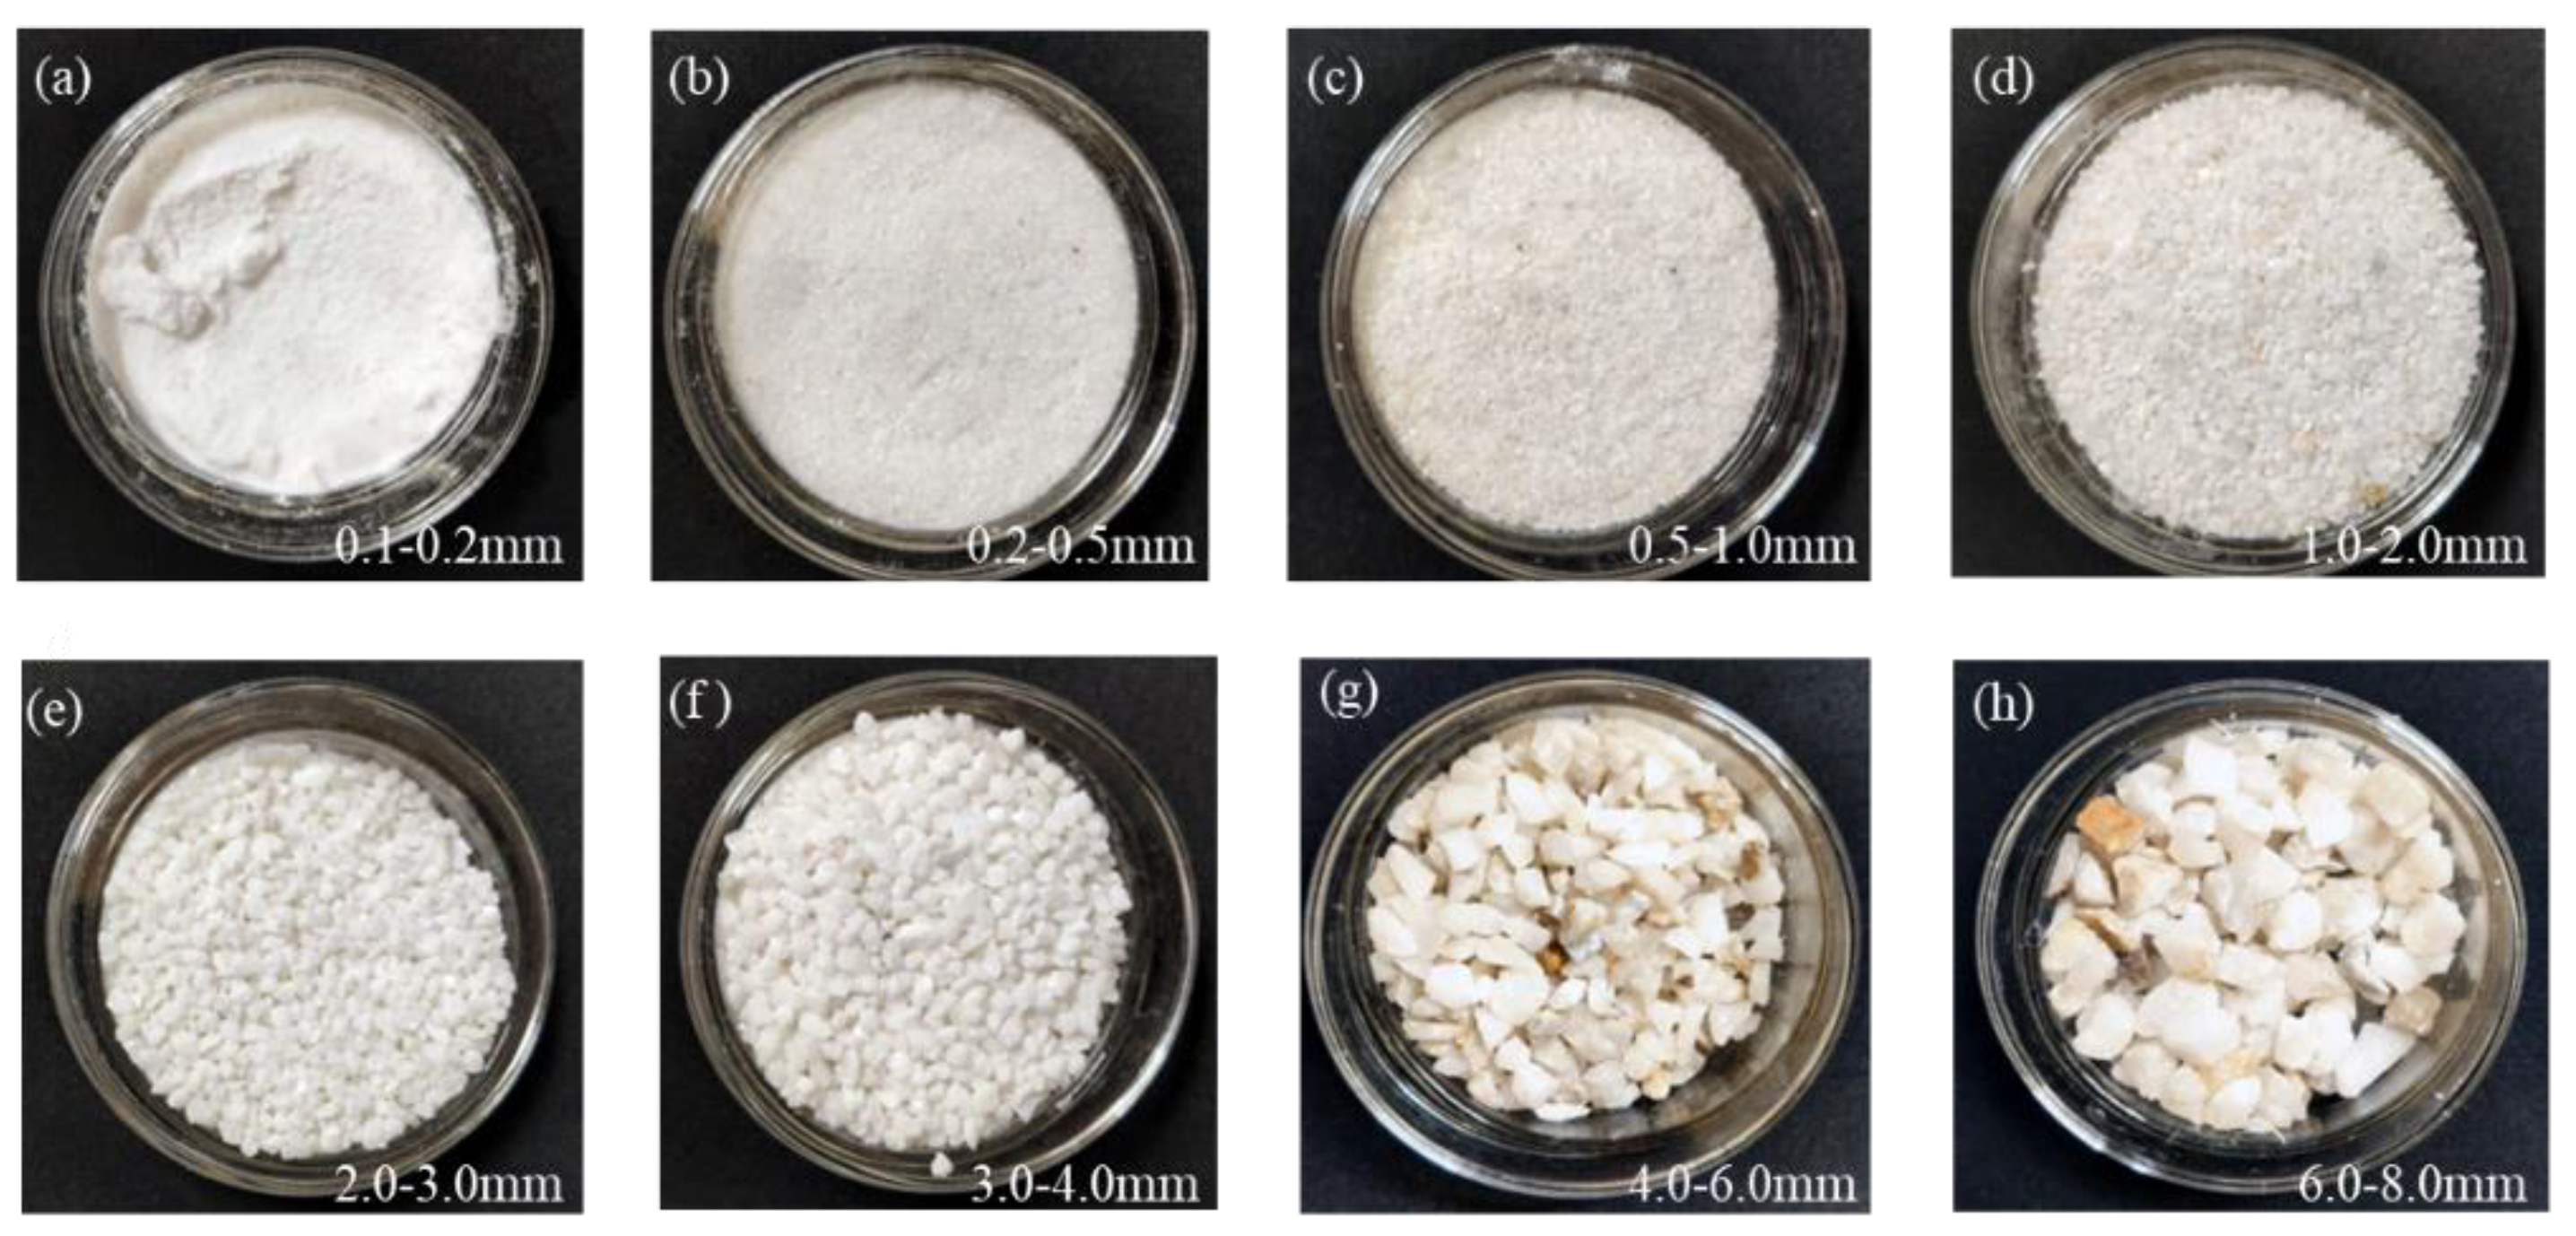
2.1. Quartz and Sample Preparation

In order to simulate different porous media of various formations, quartz sand samples were used as formation simulation material. Fine quartz sand samples were selected in order to ensure differentiation of grain size [29,30]. This experiment used custom-made screens with different apertures to screen the quartz sand samples, which makes this type of research more suitable for use in field engineering. The quartz sand samples were divided into 8 grain sizes of 0.1~0.2 mm, 0.2~0.5 mm, 0.5~1 mm, 1~2 mm, 2~3 mm, 3~4 mm, 4~6 mm and 6~8 mm.
Sieved quartz sand samples could still have some impurities, and in order to avoid clay or other impurities having a significant impact on the induced polarization effect, the sieved sand samples were cleaned, dried and then had water poured over their top until saturation before testing. Water samples from a tunnel project were utilized to simulate the actual engineering conditions. The quartz sand samples, after screening and cleaning, are shown in Figure 1. At the same time, in order to reduce the influence of temperature on the induced polarization effect, the measurements were to be carried out in an environment with small temperature changes.

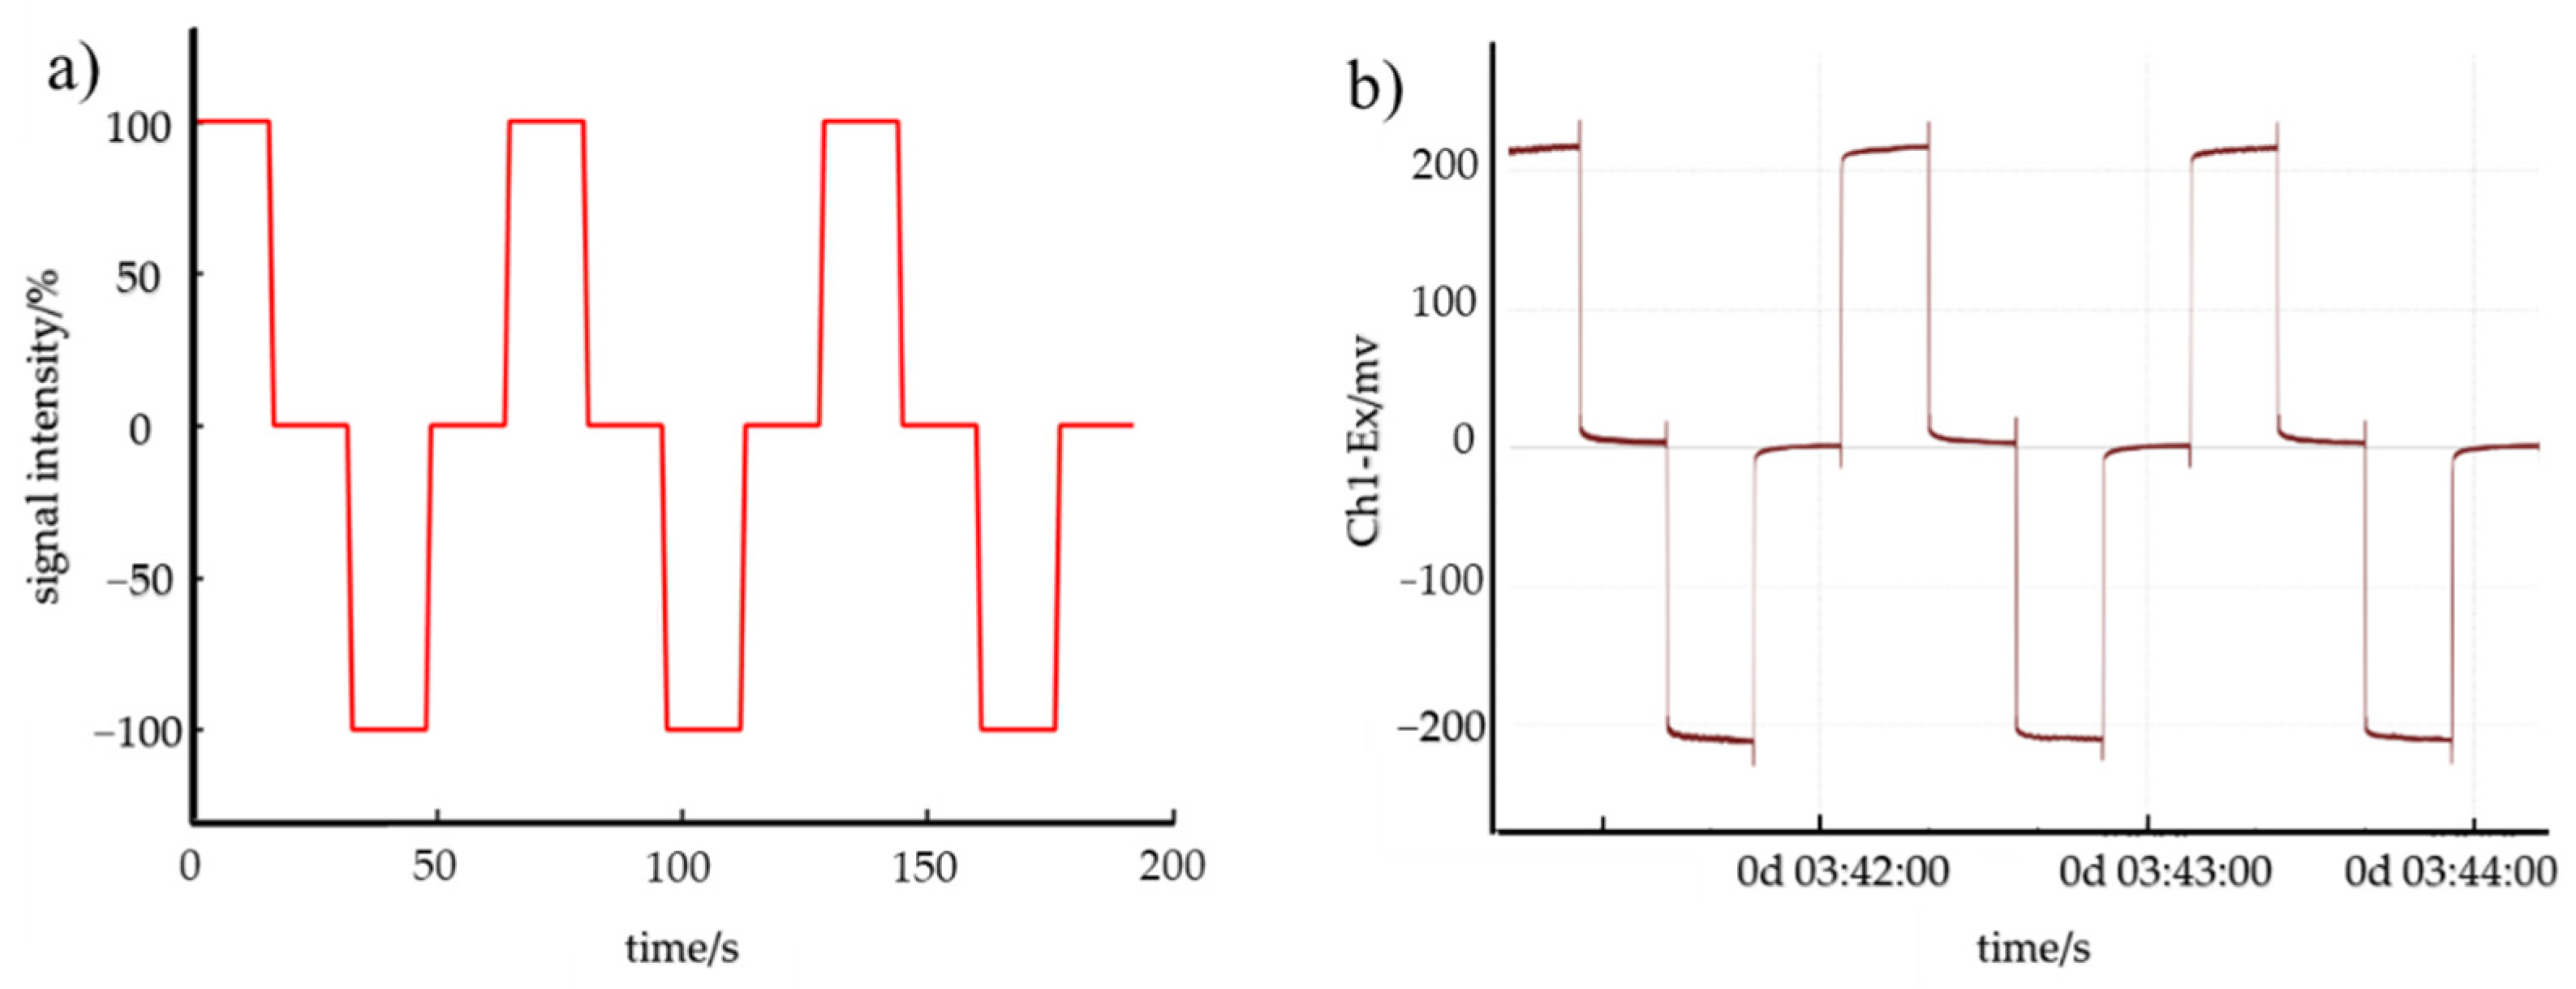
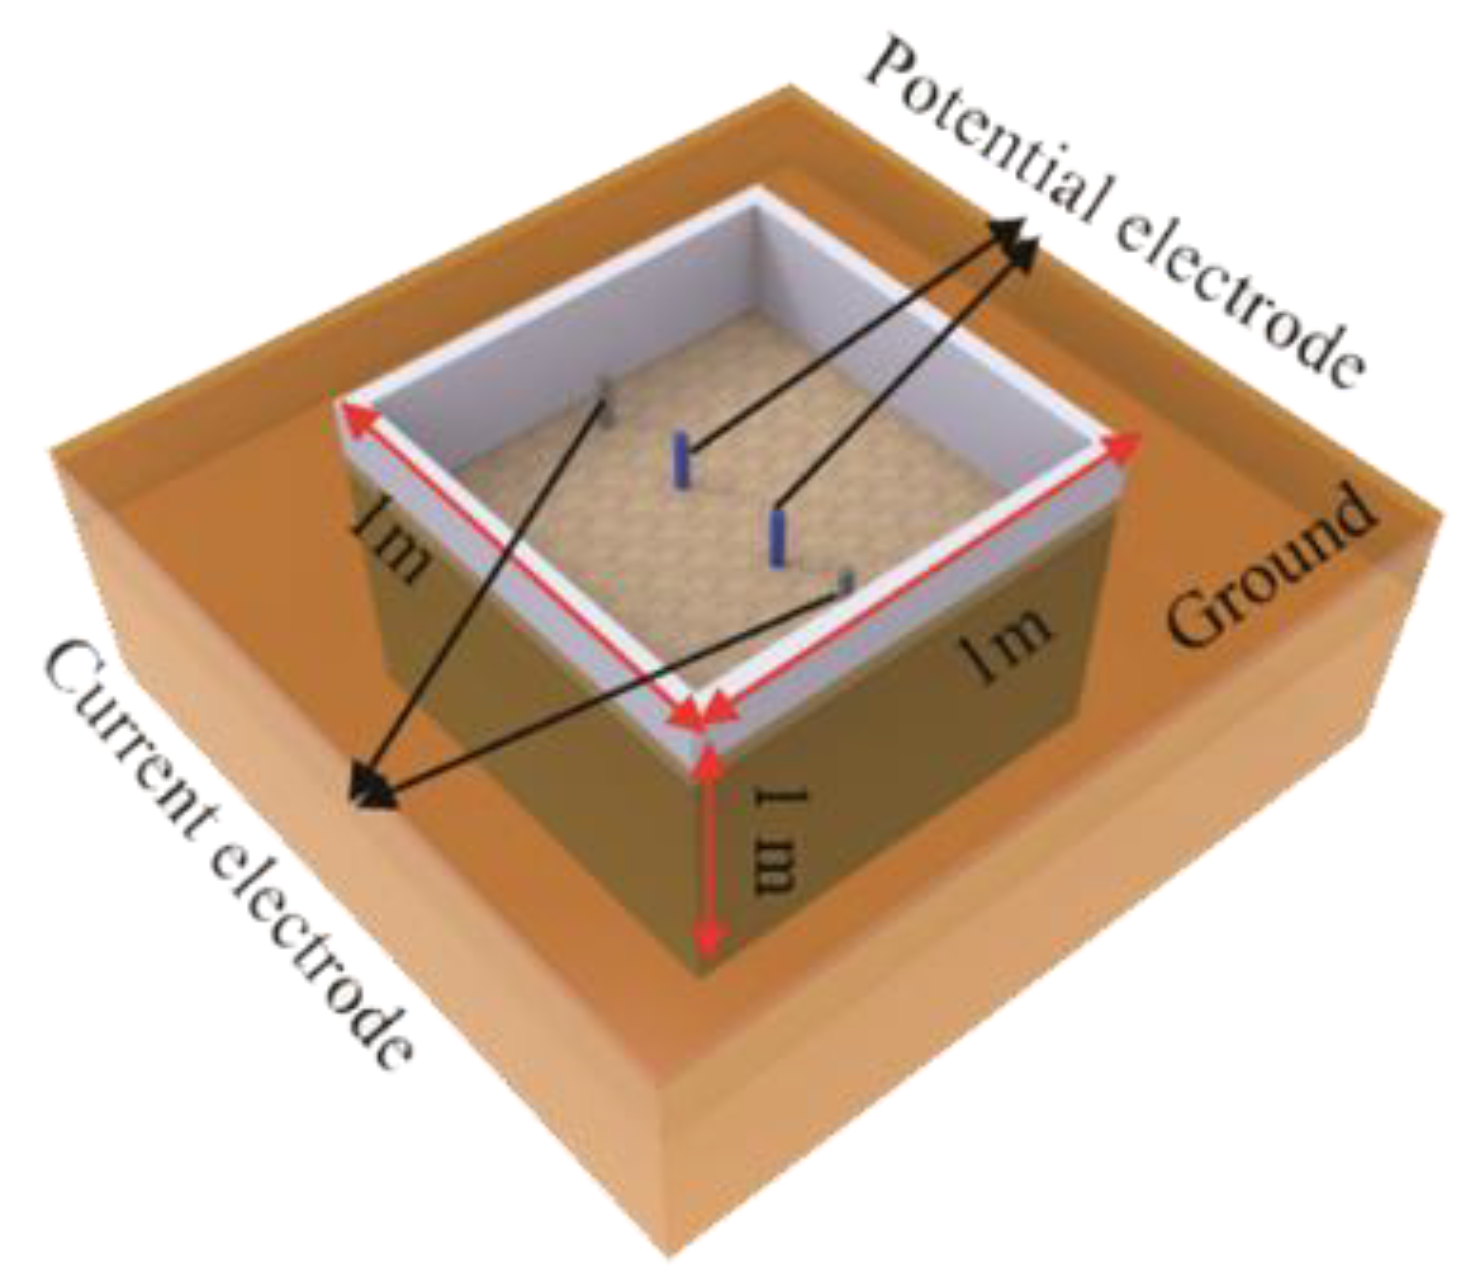
2.2. Induced Polarization Experiment

The most commonly used means of detection in the induced polarization method are the time-domain and frequency-domain methods. Time-domain measurement has the advantages of high efficiency and convenient operation in the field. Through the measurement of a charge and discharge process, all time-domain induced polarization observation data can be obtained, which can greatly reduce fieldwork time and may improve working efficiency. Therefore, the time-domain measurement method was used for the experimental study of induced polarization. In the device used for observation in the experiment, a four-electrode arrangement was used for measurement. The outer side had two current electrodes. In order to reduce the influence of polarization from the current and potential electrodes on the measurement results, the current electrode, A/B, used graphite electrodes, as shown in Figure 2a. There were two potential electrodes on the inner side. In order to avoid the polarization of the electrodes influencing the observation data, there were two potential electrodes, M/N, on the inner side, using Ag/AgCl nonpolarized electrodes, as shown in Figure 2b. The electrolyte used was saturated with a KCL solution, which was replaced regularly; the purpose of this was to prevent the electrolyte from failing due to long-term use and to minimize the influence of the electrode’s polarization on the measurement result.
The experiment transmitter used was a Pentium WDFZ-10T excited polarization transmitter. The signal transmitter was connected to the current electrode, which could transmit DC square wave signals with different duty cycles and different power supply durations, and measured the current transmitted signal. The receiver used was a Horn3D full-function IP instrument with a sampling frequency of up to 250 Hz, and it collected full-waveform time series data.
The transmission and reception periods were both 64 s. In order to eliminate the influence of DC offset caused by a unidirectional power supply, each cycle used square wave pulses of opposite polarity to supply power, with a duty cycle of 50%; that is, the power supply duration was the same as the power-off duration. At the same time, in order to reduce accidental errors in data processing, multiple cycles of power supply and power-off measurements were performed; the power supply current signal of the transmitter is shown in Figure 3a.
In terms of data collection, the receiver used a late synchronization method without manually synchronizing the transmitted signal. The obtained observation signal is shown in Figure 3b. It can be seen there that the secondary field voltage slowly decayed within a certain period of time after the power supply signal was turned off.
A larger, outdoor, square experiment tank with a size of 100 cm × 100 cm × 100 cm was used, as shown in Figure 4. The side walls and bottom were made of cement. Data were collected in full sequence, and time-domain decay information was obtained.

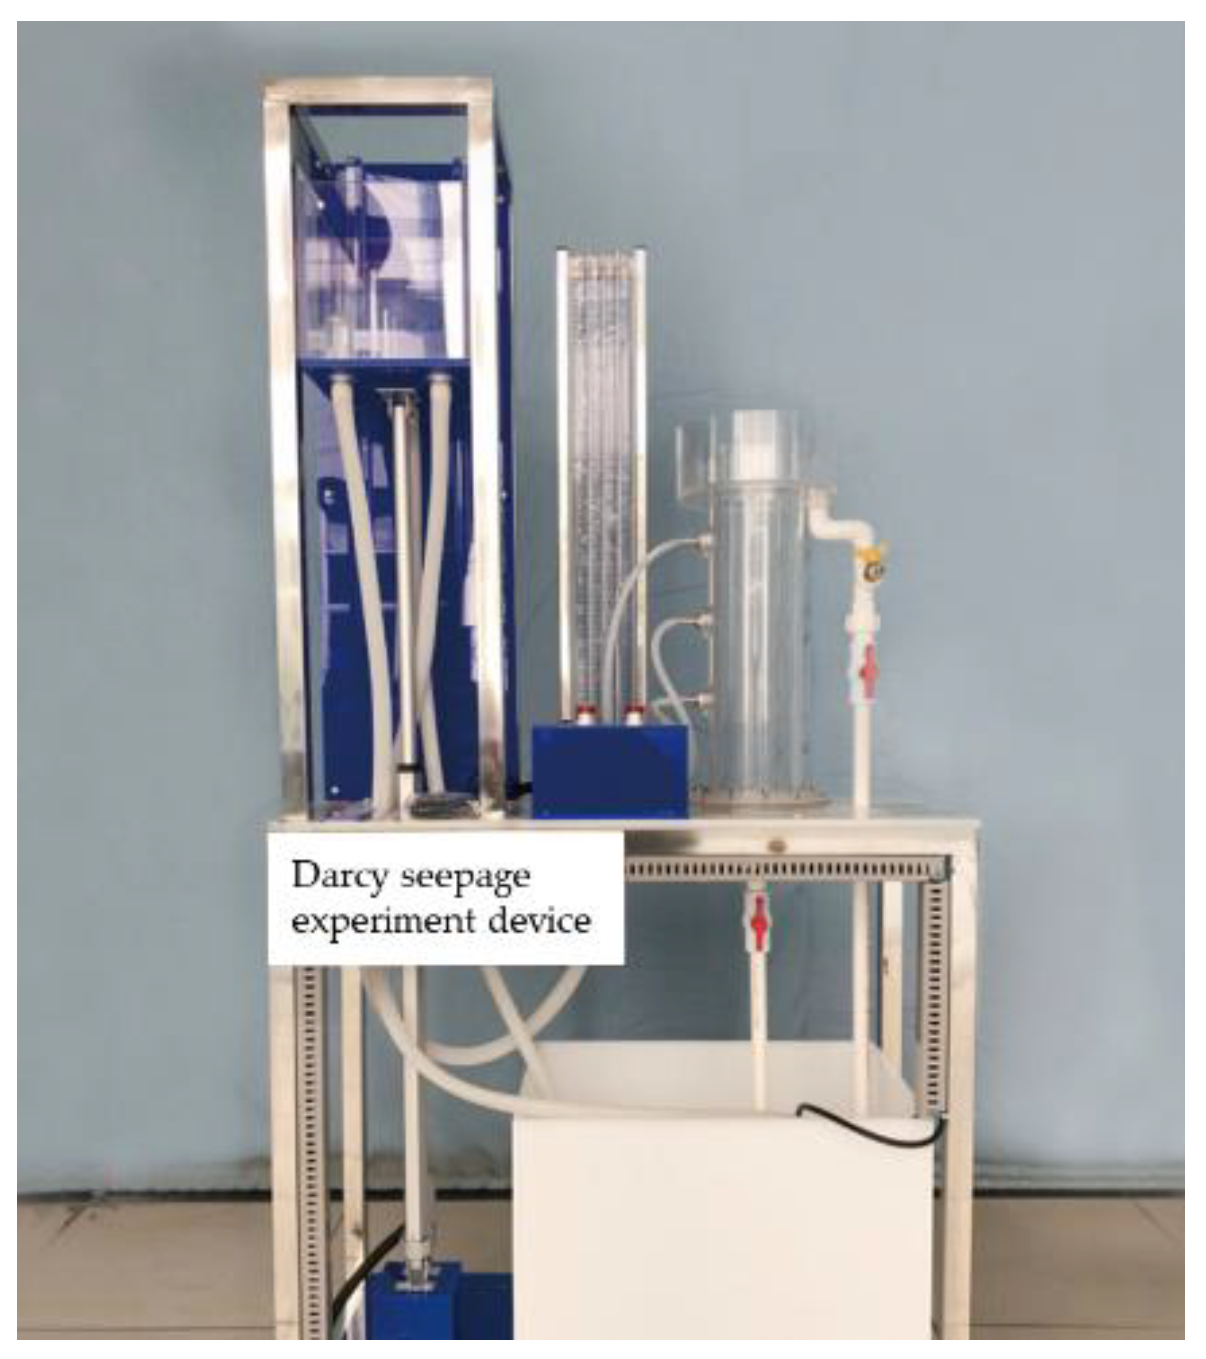
2.3. Darcy Flow Experiment

In order to obtain the actual permeability coefficient of the quartz sand samples and calculate the permeability, a Darcy seepage experiment device was used to conduct seepage experiments on quartz sand samples with different grain sizes. Since the sample was highly water-permeable, the measurement was carried out via the constant head method. The experimental instrument is shown in Figure 5; the current experiment system is mainly comprised of five parts:
  • Water supply device: This ensured the continuous replenishment of the experimental water and kept the water head stable during the experiment.
  • Permeation device: An acrylic cylinder was used to place the experiment sample, the upper end was equipped with a water inlet, the side was equipped with a pressure measuring hole, the lower end was equipped with a water outlet and the bottom was equipped with a permeable filter plate.
  • Pressure measuring device: This connected the pressure-measuring tube with the pressure-measuring hole to measure the pressure head on different sections.
  • Drainage device: This set a series of round holes in the piezometric tube to adjust the drainage water level.
  • Other equipment: A stopwatch, 1000 mL measuring cylinder, beaker, funnel, glass rod, thermometer, tube clamp, rubber tube, suction balloon, etc.
Before the formal experiment, we first determined the relationship between the permeability of the quartz sand sample and the head loss and tested the experimental instrument. After confirming that the experimental instrument was in good condition, a permeability measurement of 8 kinds of homogeneous quartz sand samples with different grain sizes was carried out. Furthermore, according to Darcy’s law, the seepage flow (Q) of the cross-section through the infiltration device was found to be proportional to the column cross-section (A) and the hydraulic slope (I) and was related to the hydraulic conductivity, K [31].
Q = KAI
I = (H2H1)/L.
Here, I represents the hydraulic gradient, H1 and H2 are the heads of the piezometer and L is the length of the seepage path and the units are meters. The experimental process was as follows:
  • Connecting the instrument: Check the state of the instrument (for example, whether the piezometer tube and the infiltration device are airtight) and record the inner diameter of the infiltration device, the distance between the piezometer tubes and other parameters.
  • Filling the sample: First, we installed a permeable filter plate at the bottom of the infiltration device, then loaded the sample. Each time a certain thickness was loaded, a certain degree of vibration was performed with a glass rod.
  • Saturated sample: We injected water from top to bottom until a water film appeared on the surface of the sample.
  • Experimental measurement: After the water level of the piezometric pipe was stable, we recorded the piezometric water level and started to measure the seepage flow out of the permeation device within a certain period of time. After repeating the measurement, we changed the hydraulic slope of the device and repeated the above process for subsequent measurements. In order to prevent the osmotic pressure of the device from changing too drastically and damaging the original structure of the sample, the hydraulic gradient was increased or decreased step by step to avoid jumping changes.
The permeability coefficient (K) can be used to evaluate the difficulty of the fluid passing through the pore framework of rock and soil, and its definition is shown in Equation (3).
K = kρg/μ
Here, ρ is the fluid density, g is the acceleration due to gravity and μ is the hydrodynamic viscosity coefficient.
The Darcy seepage experiment can be used to test samples of different grain sizes. According to the above operation method, the flow rate was changed 2–3 times to obtain the flow rate, time, water head and other parameters, and the permeability coefficient and permeability were calculated with Equation (3). We recorded and analyzed the experimental data.

3. Results and Discussions

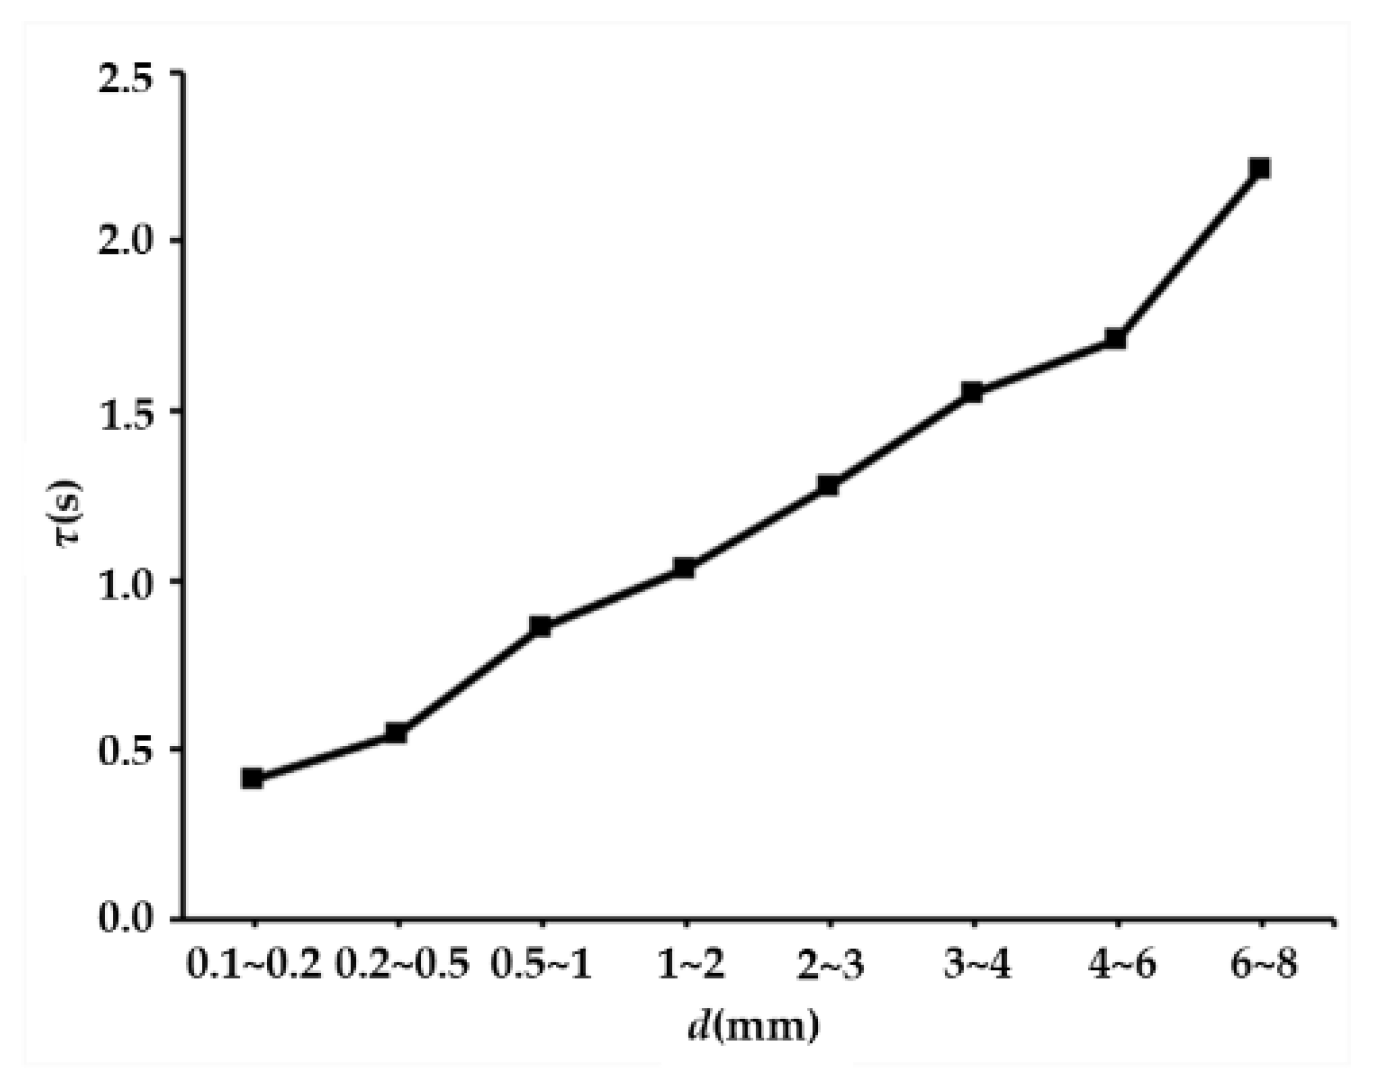
3.1. Relaxation Time Measurements

In order to verify the repeatability of the experimental data and reduce the impact of accidental errors on the measurement results, the same measurement device was used to perform repeated observations on the same sample. The apparent resistivity in the time domain can be calculated using the following formula [32]:
ρ(t) = G·∆U(t)/I,
where ∆U(t) and I are the voltage difference and the current injected into the ground, respectively. In addition, the parameter G represents the geometric factor, the expression of which can be derived according to the electrode arrangement of the quadrupole method [33].
G = 2π/(1/AM − 1/BM − 1/AN + 1/BN)
Subsequently, the apparent resistivity in the time-domain is converted into the frequency by the Fourier transform, and the expression of complex resistivity is then obtained with
ρ(iw) = G·∆U(iw)/I(iw).
According to the complex resistivity parameter in Equation (6), the resistivity phase distribution can be obtained, which is shown in Equation (7) [34].
φ = arctan(ρ/ρ′)
Here, the parameters ρ″ and ρ′ represent the real and imaginary parts of the complex resistivity, respectively.
The relaxation time that needs to be studied in this paper is related to the phase peak position (wφpeak) and the relaxation time (τ), which can be obtained using the following relationship in Equation 8 [34]. The parameters m and c are the chargeability and exponent, respectively.
wφpeak = 1/τ·(1 − m)1/2c
Furthermore, ignoring the trivial influence of chargeability m and exponent c. The relaxation of time can be calculated by using the frequency of the phase peak fpeak [35].
τ = 1/2πfpeak
Therefore, the distribution of relaxation time within different grain sizes was obtained through experiments and data processing, and the results can be seen in Table 1.
The relaxation time curves of eight quartz sand samples of different grain sizes are shown in Figure 6. In this figure, it can be seen that, with the increase in grain size, the numerical value of relaxation time also increased.

3.2. Permeability Measurements

Through measurements, the inner diameter of the instrument was found to be D = 6.4 cm; the cross-sectional area of the quartz sand sample was found to be A = 0.0033 m2, and the pressure measurement interval was found to be L = 10 cm. The outdoor temperature was continuously measured for three days, and the average temperature during this period was 20 °C; thus, the hydrodynamic viscosity coefficient was 0.001 Pa·s. The constant head method was used to perform this experiment. After the water flow remained stable, the experimental data were recorded when the amount of water flowing out of the drain reached 1000 mL. The permeability coefficient of the sample can be calculated through the measurement results of the Darcy seepage experiment, and the permeability of the quartz sand samples of this grain size can be obtained by conversion via Equation (3). The experimental data are shown in Table 2.
It can be seen that, with the increase in the grain size of the quartz sand samples, there was a significant difference in the time required to achieve the same seepage flow, and the difference between the minimum and maximum time was close to 10 times more. The reason for this phenomenon is that the pore throat diameter and the permeability have a positive relationship, indicating that the permeability is smaller in the small grain size, resulting in a slower flow rate. Through data such as flow, time, pressure head, etc., it is possible to calculate parameters such as seepage flow, seepage velocity, water level difference and hydraulic gradient, and it is also possible to obtain the permeability coefficient and permeability from Darcy’s law. The experimental results show in Figure 7 that the evolution of the permeability is closely correlated with the grain sizes of the sand samples.

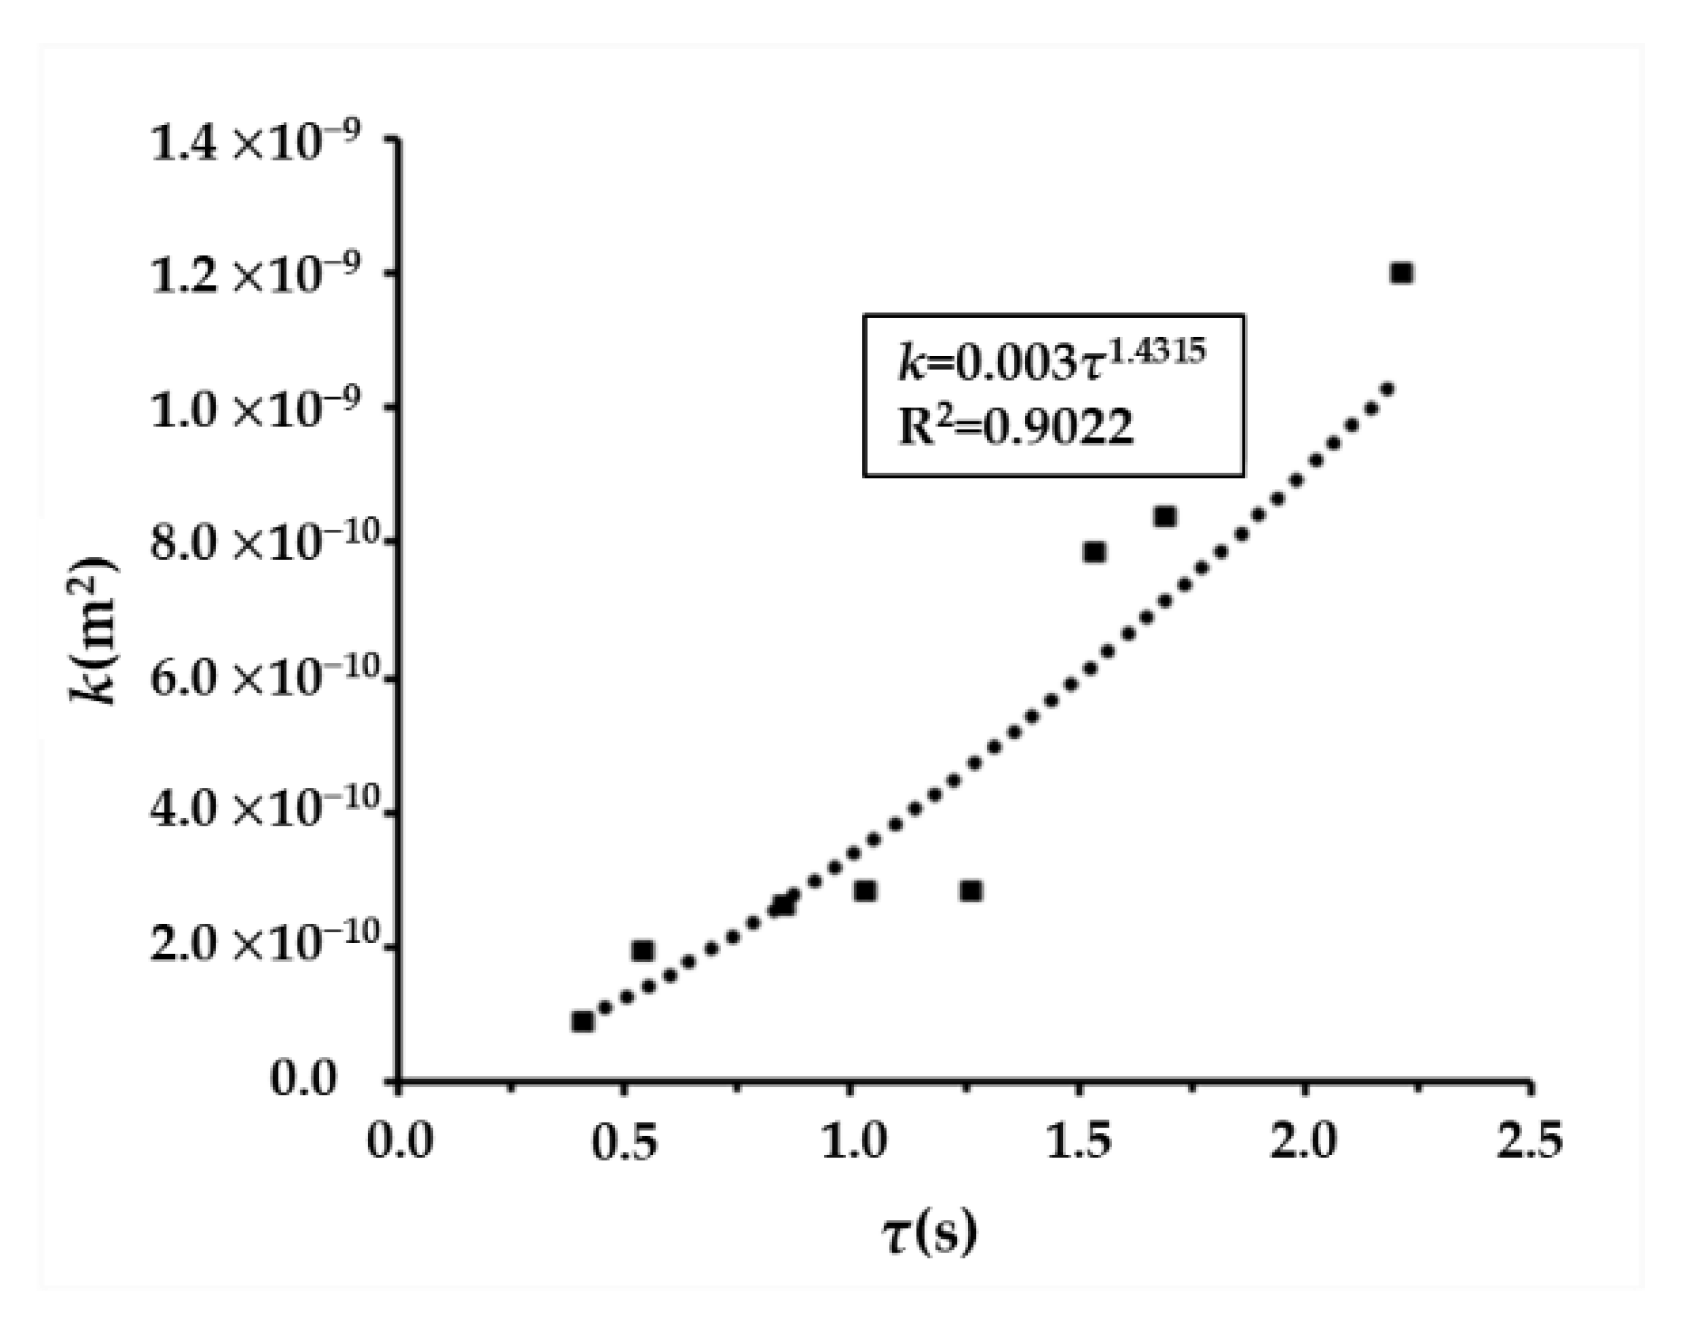
3.3. Fitting of Curves

It is well known that the permeability information of sand samples is very important for groundwater exploration, and the induced polarization method is sensitive to hydraulic parameters. The time required for ions to reach equilibrium after the current is cut off in the electric double layer theory is relaxation time, and this diffusion seems to have a relationship with permeability. Therefore, grain size is used as a link to analyze permeability and relaxation time in this paper.
According to the experimental data, the power function equation can be used to fit the relaxation time and permeability of the same grain size sand sample; thus, the empirical equations for the relationship between the permeability and relaxation time can be obtained, and the relationship between relaxation time and permeability can be established. The fitting equation is given below.
k = 0.003τ1.4315.
The relationship between relaxation time and permeability within the same grain size is shown in Figure 8 below. The dotted line in Figure 8 represents the fitted curve.

4. Conclusions

In this paper, eight kinds of quartz sands with different grain sizes were used to measure relaxation time and permeability using the field time-domain induced polarization experiment system and the Darcy flow experiment system. According to the experimental data, the following conclusions can be derived:
(1)
Relaxation time and permeability increase with an increase in quartz sand grain size, and the increasing trend gradually accelerates, which has a significant positive correlation.
(2)
By using the grain size of a water-bearing sand sample as the intermediate quantity, the relationship curve between permeability and relaxation time within the same grain size can be formed through a mathematical fitting. Furthermore, the power function equation describing the correlation between relaxation time and permeability is obtained.
(3)
With regard to the relationship between permeability and relaxation time, the data in Figure 8 provide theoretical support for predicting the behavior of water bodies via the tunnel-induced polarization method, and it is even possible to improve the accuracy of predictions.
In this paper, the relationship was obtained from the quartz sands experiment. However, these methods may not be applicable in all geological conditions, and the coefficients may vary in different experimental conditions.

Author Contributions

Conceptualization, Z.M. and L.N.; methodology, Z.M.; validation, L.N. and N.L.; formal analysis, X.Y. and Z.D.; investigation, J.S.; resources, X.X. and K.W.; data curation, X.X.; writing—original draft preparation, Z.M.; writing—review and editing, Z.D.; visualization, Z.M.; supervision, L.N. and Z.M.; project administration, L.N.; funding acquisition, X.X. and K.W. All authors have read and agreed to the published version of the manuscript.

Funding

This research was funded by Science & Technology Program of Department of Transport of Shandong Province, grant number 2019B47_2.

Institutional Review Board Statement

Not applicable.

Informed Consent Statement

Not applicable.

Data Availability Statement

All of the data reported in the paper are presented in the main text. Any other data can be provided on request.

Conflicts of Interest

The authors declare no conflict of interest.

References

  1. Li, S.C.; Liu, R.T.; Zhang, Q.S.; Zhang, X. Protection against water or mud inrush in tunnels by grouting: A review. J. Rock Mech. Geotech. Eng. 2016, 8, 753–766. [Google Scholar] [CrossRef] [Green Version]
  2. Qin, S.W.; Ma, Z.J.; Jiang, C.D.; Lin, J.; Bai, M.Z.; Lin, T.T.; Yi, X.F.; Shang, X.L. Application of magnetic resonance sounding to tunnels for advanced detection of water-related disasters: A case study in the Dadushan Tunnel, Guizhou, China. Tunn. Undergr. Space Technol. 2019, 84, 364–372. [Google Scholar] [CrossRef]
  3. Ni, X.D.; Wang, Y.; Lu, Y.G. Study of meso-mechanism of seepage failure in tunnel excavation process. Chin. J. Rock Mech. Eng. 2010, 29, 4194–4201. [Google Scholar]
  4. Attwa, M.; Günther, T. Spectral induced polarization measurements for predicting the hydraulic conductivity in sandy aquifers. Hydrol. Earth Syst. Sci. 2013, 17, 4079–4094. [Google Scholar] [CrossRef] [Green Version]
  5. Slater, L. Near Surface Electrical Characterization of Hydraulic Conductivity: From Petrophysical Properties to Aquifer Geometries—A Review. Surv. Geophys. 2007, 28, 169–197. [Google Scholar] [CrossRef]
  6. Koch, K.; Revil, A.; Holliger, K. Relating the permeability of quartz sands to their grain size and spectral induced polarization characteristics. Geophys. J. Int. 2012, 190, 230–242. [Google Scholar] [CrossRef] [Green Version]
  7. Weller, A.; Börner, F.D. Measurements of spectral induced polarization for environmental purposes. Environ. Geol. 1996, 27, 329–334. [Google Scholar] [CrossRef]
  8. Weller, A.; Breede, K.; Slater, L.; Nordsiek, S. Effect of changing water salinity on complex conductivity spectra of sandstones. Geophysics 2011, 76, F315–F327. [Google Scholar] [CrossRef]
  9. Lesmes, D.P.; Frye, K.M. Influence of pore fluid chemistry on the complex conductivity and induced polarization responses of Berea sandstone. J. Geophys. Res. 2001, 106, 4079–4090. [Google Scholar] [CrossRef]
  10. Revil, A.; Florsch, N. Determination of permeability from spectral induced polarization in granular media. Geophys. J. Int. 2010, 3, 1480–1498. [Google Scholar] [CrossRef]
  11. Vacquier, V.; Holmes, C.R.; Kintzinger, P.R.; Lavergne, M. Prospecting for ground water by induced electrical polarization. Geophysics 1957, 22, 660–687. [Google Scholar] [CrossRef]
  12. Borner, F.; Schopper, J.; Weller, A. Evaluation of transport and storage properties in the soil and groundwater zone from induced polarization measurements. Geophys. Prospect. 1996, 44, 583–601. [Google Scholar] [CrossRef]
  13. Schon, J.H. Physical Properties of Rocks: Fundamentals and Principles of Petrophysics; Heilbig, K., Treitel, S., Eds.; Elsevier: New York, NY, USA, 1996; p. 18. [Google Scholar]
  14. Slater, L.; Lesmes, D.P. Electrical-hydraulic relationships observed for unconsolidated sediments. Water Resour. Res. 2002, 38, 31–44. [Google Scholar] [CrossRef]
  15. Slater, L.; Barrash, W.; Montrey, J.; Binley, A. Electrical-hydraulic relationships observed for unconsolidated sediments in the presence of a cobble framework. Water Resour. Res. 2014, 50, 5721–5724. [Google Scholar] [CrossRef] [Green Version]
  16. Slater, L.; Ntarlagianni, D.; Wishart, D.B. On the relationship between induced polarization and surface area in metal-sand and clay-sand mixtures. Geophysics 2006, 71, A1–A5. [Google Scholar] [CrossRef]
  17. Binley, A.; Slater, L.; Fukes, M.; Cassiani, G. The relationship between frequency dependent electrical conductivity and hydraulic properties of saturated and unsaturated sandstone. Water Resour. Res. 2005, 41, W12417. [Google Scholar] [CrossRef]
  18. Hördt, A.; Blaschek, R.; Kemna, A.; Zisser, N. Hydraulic conductivity estimation from induced polarisation data at the field scale—The Krauthausen case history. J. Appl. Geophys. 2007, 62, 33–46. [Google Scholar] [CrossRef]
  19. Lesmes, D.P.; Morgan, F.D. Dielectric spectroscopy of sedimentary rocks. J. Geophys. Res. 2001, 106, 13329–13346. [Google Scholar] [CrossRef]
  20. Leroy, P.; Revil, A.; Kemna, A.; Cosenza, P.; Ghorbani, A. Complex conductivity of water-saturated packs of glass beads. J. Colloid Interface Sci. 2008, 321, 103–117. [Google Scholar] [CrossRef]
  21. Kruschwitz, S.; Binley, A.; Lesmes, D.; Elshenawy, A. Textural controls on low-frequency electrical spectra of porous media. Geophysics 2010, 75, WA113–WA123. [Google Scholar] [CrossRef]
  22. Kruschwitz, S.; Prinz, C.; Zimathies, A. Study into the correlation of dominant pore throat size and SIP relaxation frequency. J. Appl. Geophys. 2016, 135, 375–386. [Google Scholar] [CrossRef]
  23. Niu, Q.; Revil, A. Connecting complex conductivity spectra to mercury porosimetry of sedimentary rocksInduced polarization and pore sizes. Geophysics 2015, 81, E17–E32. [Google Scholar] [CrossRef]
  24. Titov, K.; Tarasov, A.; Ilyin, Y.; Seleznev, N.; Boyd, A. Relationships between induced polarization relaxation time and hydraulic properties of sandstone. Geophys. J. Int. 2010, 180, 1095–1106. [Google Scholar] [CrossRef] [Green Version]
  25. Tong, M.S.; Li, L.; Wang, W.N.; Jiang, Y.Z. Determining capillary-pressure curve, pore-size distribution, and permeability from induced polarization of shaley sand. Geophysics 2006, 71, N33–N40. [Google Scholar] [CrossRef]
  26. Tong, M.S.; Li, L.; Wang, W.N.; Jiang, Y.Z. A time-domain induced-polarization method for estimating permeability in a shaly sand reservoir. Geophys. Prospect. 2006, 54, 623–631. [Google Scholar] [CrossRef]
  27. Joseph, S.; Ingham, M.; Gouws, G. Spectral-induced polarization measurements on sieved sands and the relationship to permeability. Water Resour. Res. 2016, 52, 4226–4246. [Google Scholar] [CrossRef] [Green Version]
  28. Zisser, N.; Kemna, A.; Nover, G. Relationship between low-frequency electrical properties and hydraulic permeability of low-permeability sandstones. Geophysics 2010, 75, E131–E141. [Google Scholar] [CrossRef]
  29. Wu, Y.; Wang, X.; Shen, J.H.; Cui, J.; Zhu, C.Q.; Wang, X.Z. Experimental study on the impact of water content on the strength parameters of coral gravelly sand. J. Mar. Sci. Eng. 2020, 8, 634. [Google Scholar] [CrossRef]
  30. Wang, X.; Wu, Y.; Cui, J.; Zhu, C.Q.; Wang, X.Z. Shape Characteristics of Coral Sand from the South China Sea. J. Mar. Sci. Eng. 2020, 8, 803. [Google Scholar] [CrossRef]
  31. Horton, G.W. Darcy’s Law. Am. J. Phys. 1964, 32, 569. [Google Scholar] [CrossRef]
  32. Loke, M.H.; Chambers, J.E.; Rucker, D.F.; Kuras, O.; Wilkinson, P.B. Recent developments in the direct-current geoelectrical imaging method. J. Appl. Geophys. 2013, 95, 135–156. [Google Scholar] [CrossRef]
  33. Wilkinson, P.B.; Chambers, J.E.; Meldrum, P.I.; Gunn, D.A.; Ogilvy, R.D.; Kuras, O. Predicting the movements of permanently installed electrodes on an active landslide using time-lapse geoelectrical resistivity data only. Geophys. J. Int. 2010, 183, 543–556. [Google Scholar] [CrossRef] [Green Version]
  34. Tarasov, A.; Titov, K. On the use of the Cole–Cole equations in spectral induced polarization. Geophys. J. Int. 2013, 195, 352–356. [Google Scholar] [CrossRef]
  35. Abdulsamad, F.; Florsch, N.; Camerlynck, C. Spectral induced polarization in a sandy medium containing semiconductor materials: Experimental results and numerical modelling of the polarization mechanism. Near Surf. Geophys. 2017, 15, 669–683. [Google Scholar] [CrossRef]
Figure 1. Sand of samples with different grain size grades. (a) 0.1–0.2 mm; (b) 0.2–0.5 mm; (c) 0.5–1 mm; (d) 1–2 mm; (e) 2–3 mm; (f) 3–4 mm; (g) 4–6 mm; (h) 6–8 mm.
Applsci 12 05735 g001
Figure 2. The current electrode and potential electrode. (a) Graphite current electrode; (b) Ag/AgCl nonpolarized potential electrode.
Applsci 12 05735 g002
Figure 3. Signal waveform curve. (a) Schematic of current signal; (b) measured full-waveform signal.
Applsci 12 05735 g003
Figure 4. Experiment in outdoor laboratory tank.
Applsci 12 05735 g004
Figure 5. Schematic diagram of Darcy seepage tester.
Applsci 12 05735 g005
Figure 6. Relaxation time of sand samples.
Applsci 12 05735 g006
Figure 7. Permeability of sand samples.
Applsci 12 05735 g007
Figure 8. Relationship between relaxation time and permeability.
Applsci 12 05735 g008
Table 1. Relaxation time of sand samples.
Grain Size (mm)The Relaxation Time (s)
0.1~0.20.410
0.2~0.50.541
0.5~1.00.857
1.0~2.01.035
2.0~3.01.273
3.0~4.01.552
4.0~6.01.705
6.0~8.02.215
Table 2. Darcy experiment results.
Grain Size
(mm)
Time
T (s)
Water Volume
w (m3)
Flow
Q (m3/s)
Piezometer Water Level (cm)Water Level Difference
(cm)
H1H2
Hydraulic Gradient
I
Permeability Coefficient
K (m/s)
Permeability
(m2)
H1H2
0.1~0.21890.0015.3 × 10−6202181.89.1 × 10−49.1 × 10⁻¹¹
0.2~0.592.60.0011.1 × 10−5202181.81.9 × 10−31.9 × 10⁻¹⁰
0.5~1.066.30.0011.5 × 10−5202181.82.6 × 10−32.6 × 10⁻¹⁰
1.0~2.0620.0011.6 × 10−5202181.82.8 × 10−32.8 × 10⁻¹⁰
2.0~3.061.50.0011.6 × 10−5202181.82.8 × 10−32.8 × 10⁻¹⁰
3.0~4.0220.0014.5 × 10−5202181.87.9 × 10−37.9 × 10⁻¹⁰
4.0~6.020.60.0014.9 × 10−5202181.88.4 × 10−38.4 × 10⁻¹⁰
6.0~8.014.30.0017.0 × 10−5202181.81.2 × 10−21.2 × 10⁻⁹
Publisher’s Note: MDPI stays neutral with regard to jurisdictional claims in published maps and institutional affiliations.

