Time-Sequential Working Wavelength-Selective Filter for Flat Autostereoscopic Displays

Abstract
:1. Introduction
2. Switchable Color Filter Barrier for Autostereoscopic Display Design
2.1. Basic Structure of Switchable Wavelength-Selective Barriers for Multiview 3D Display
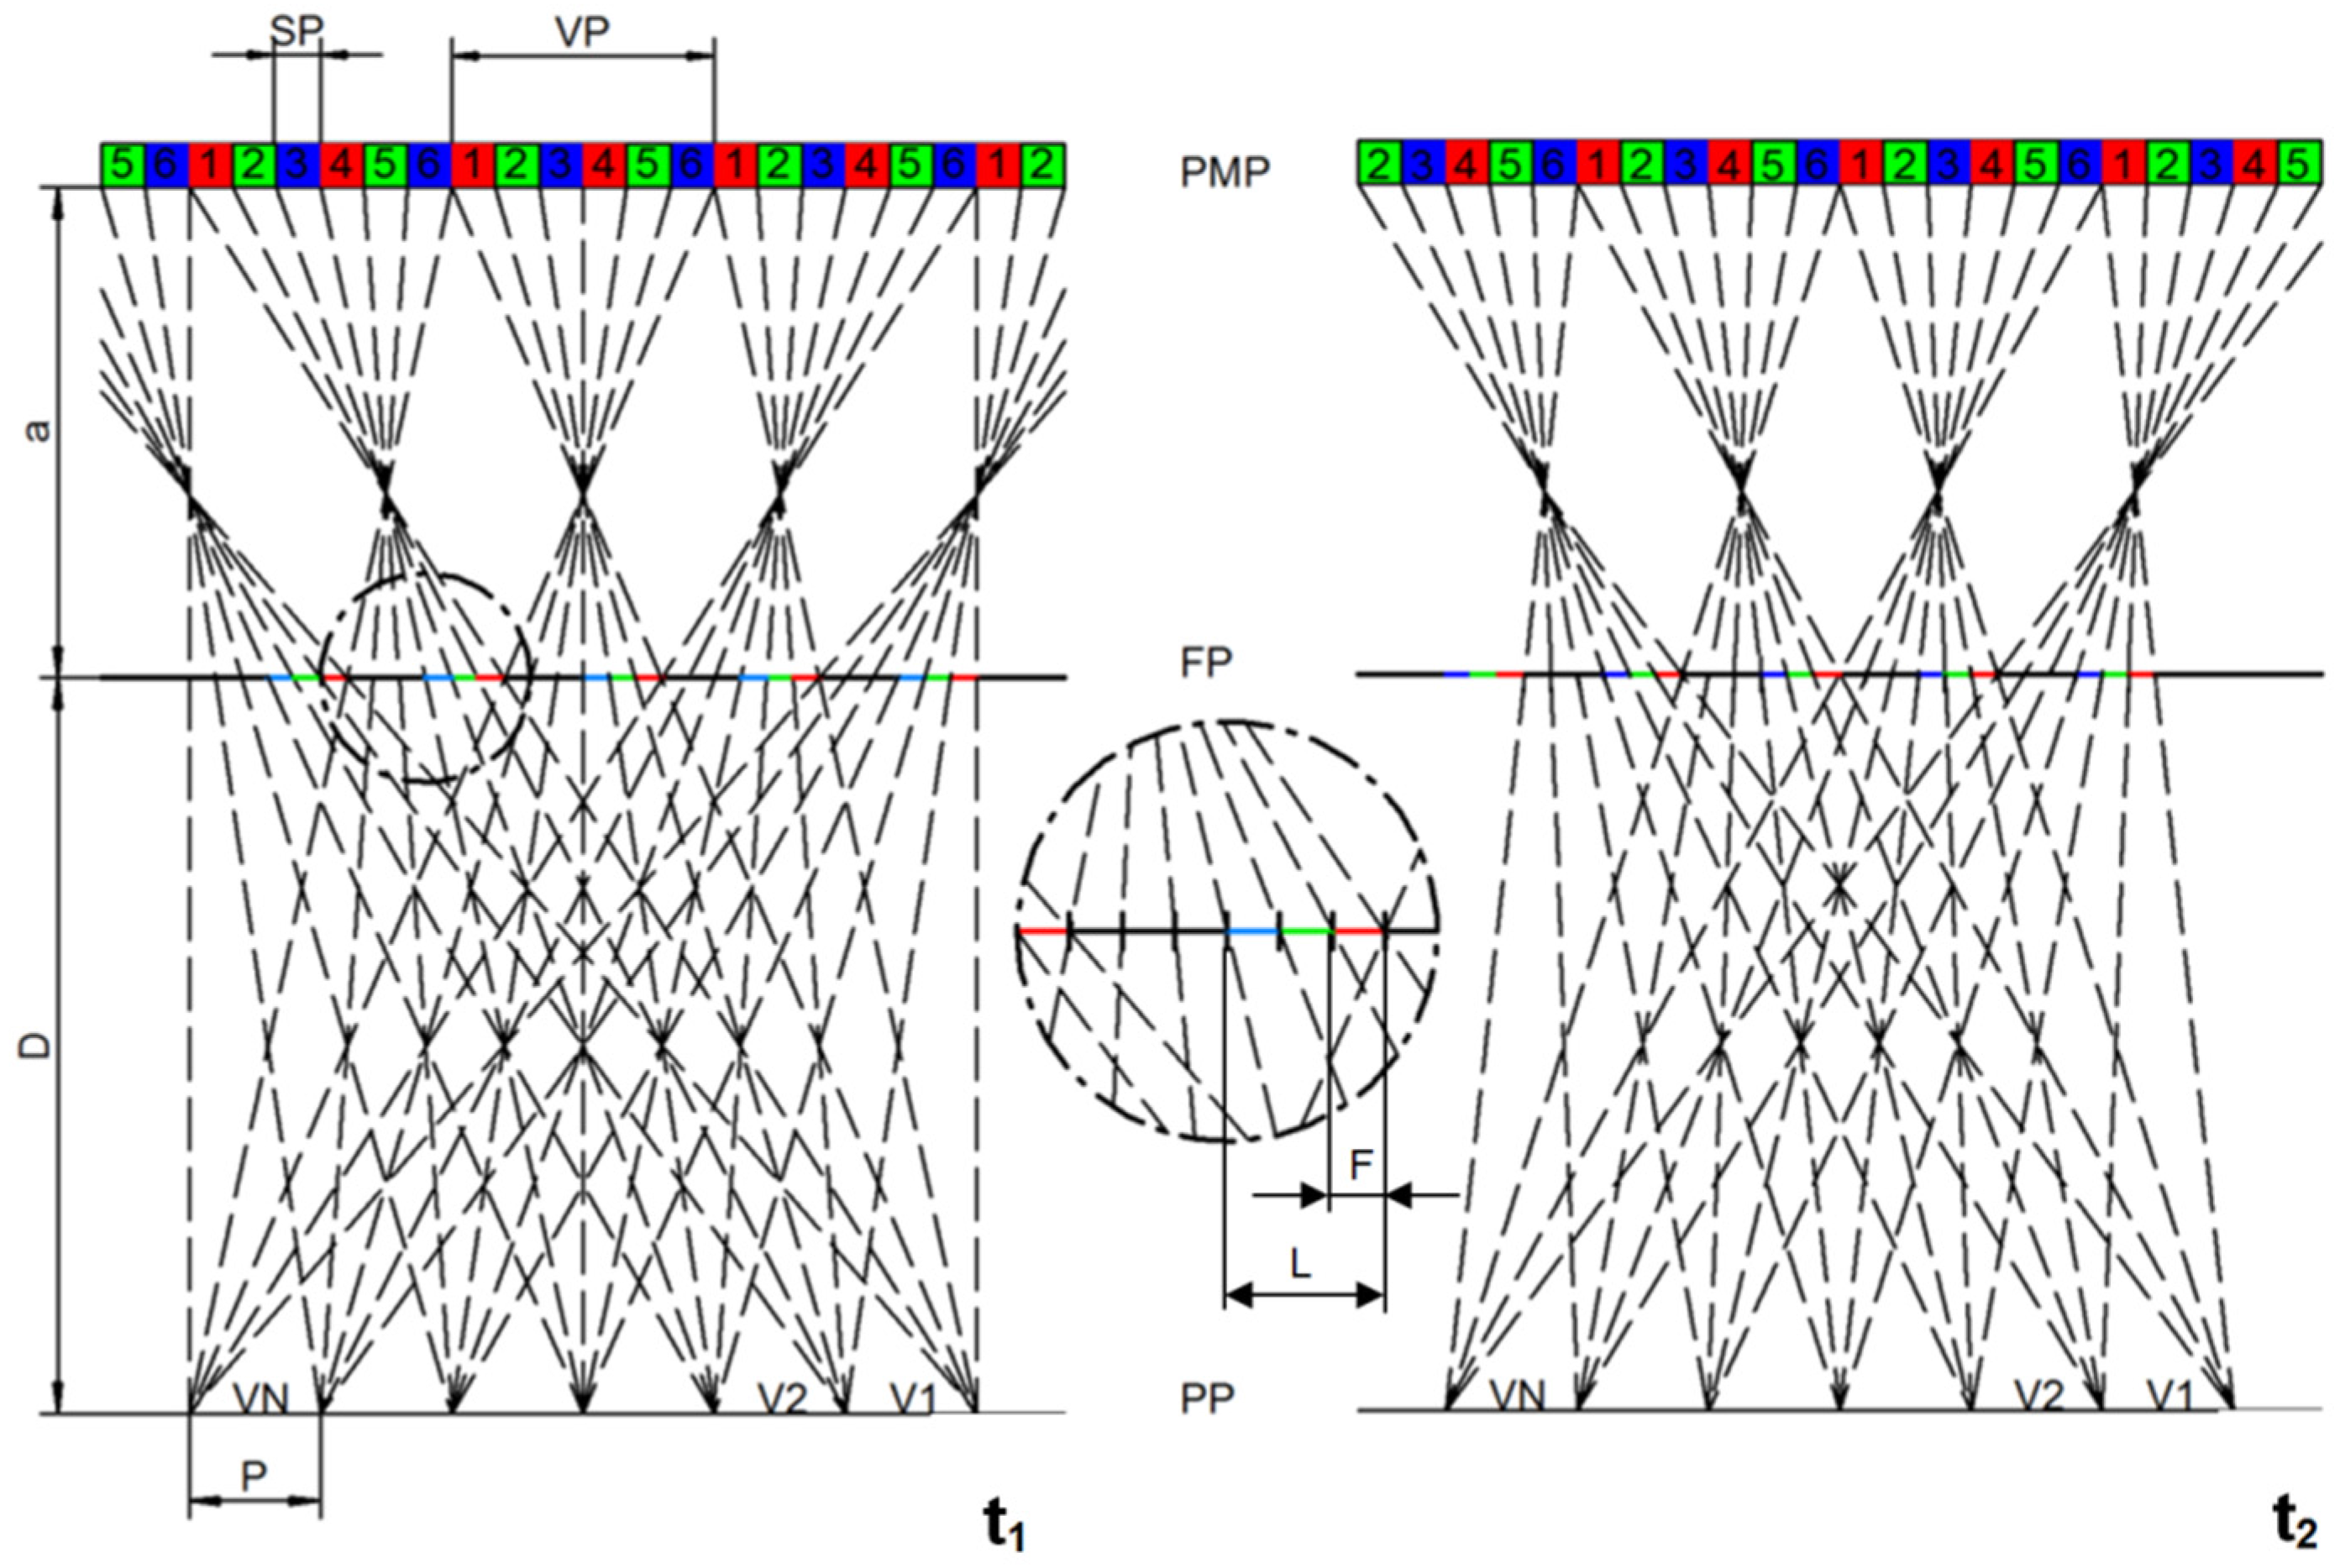
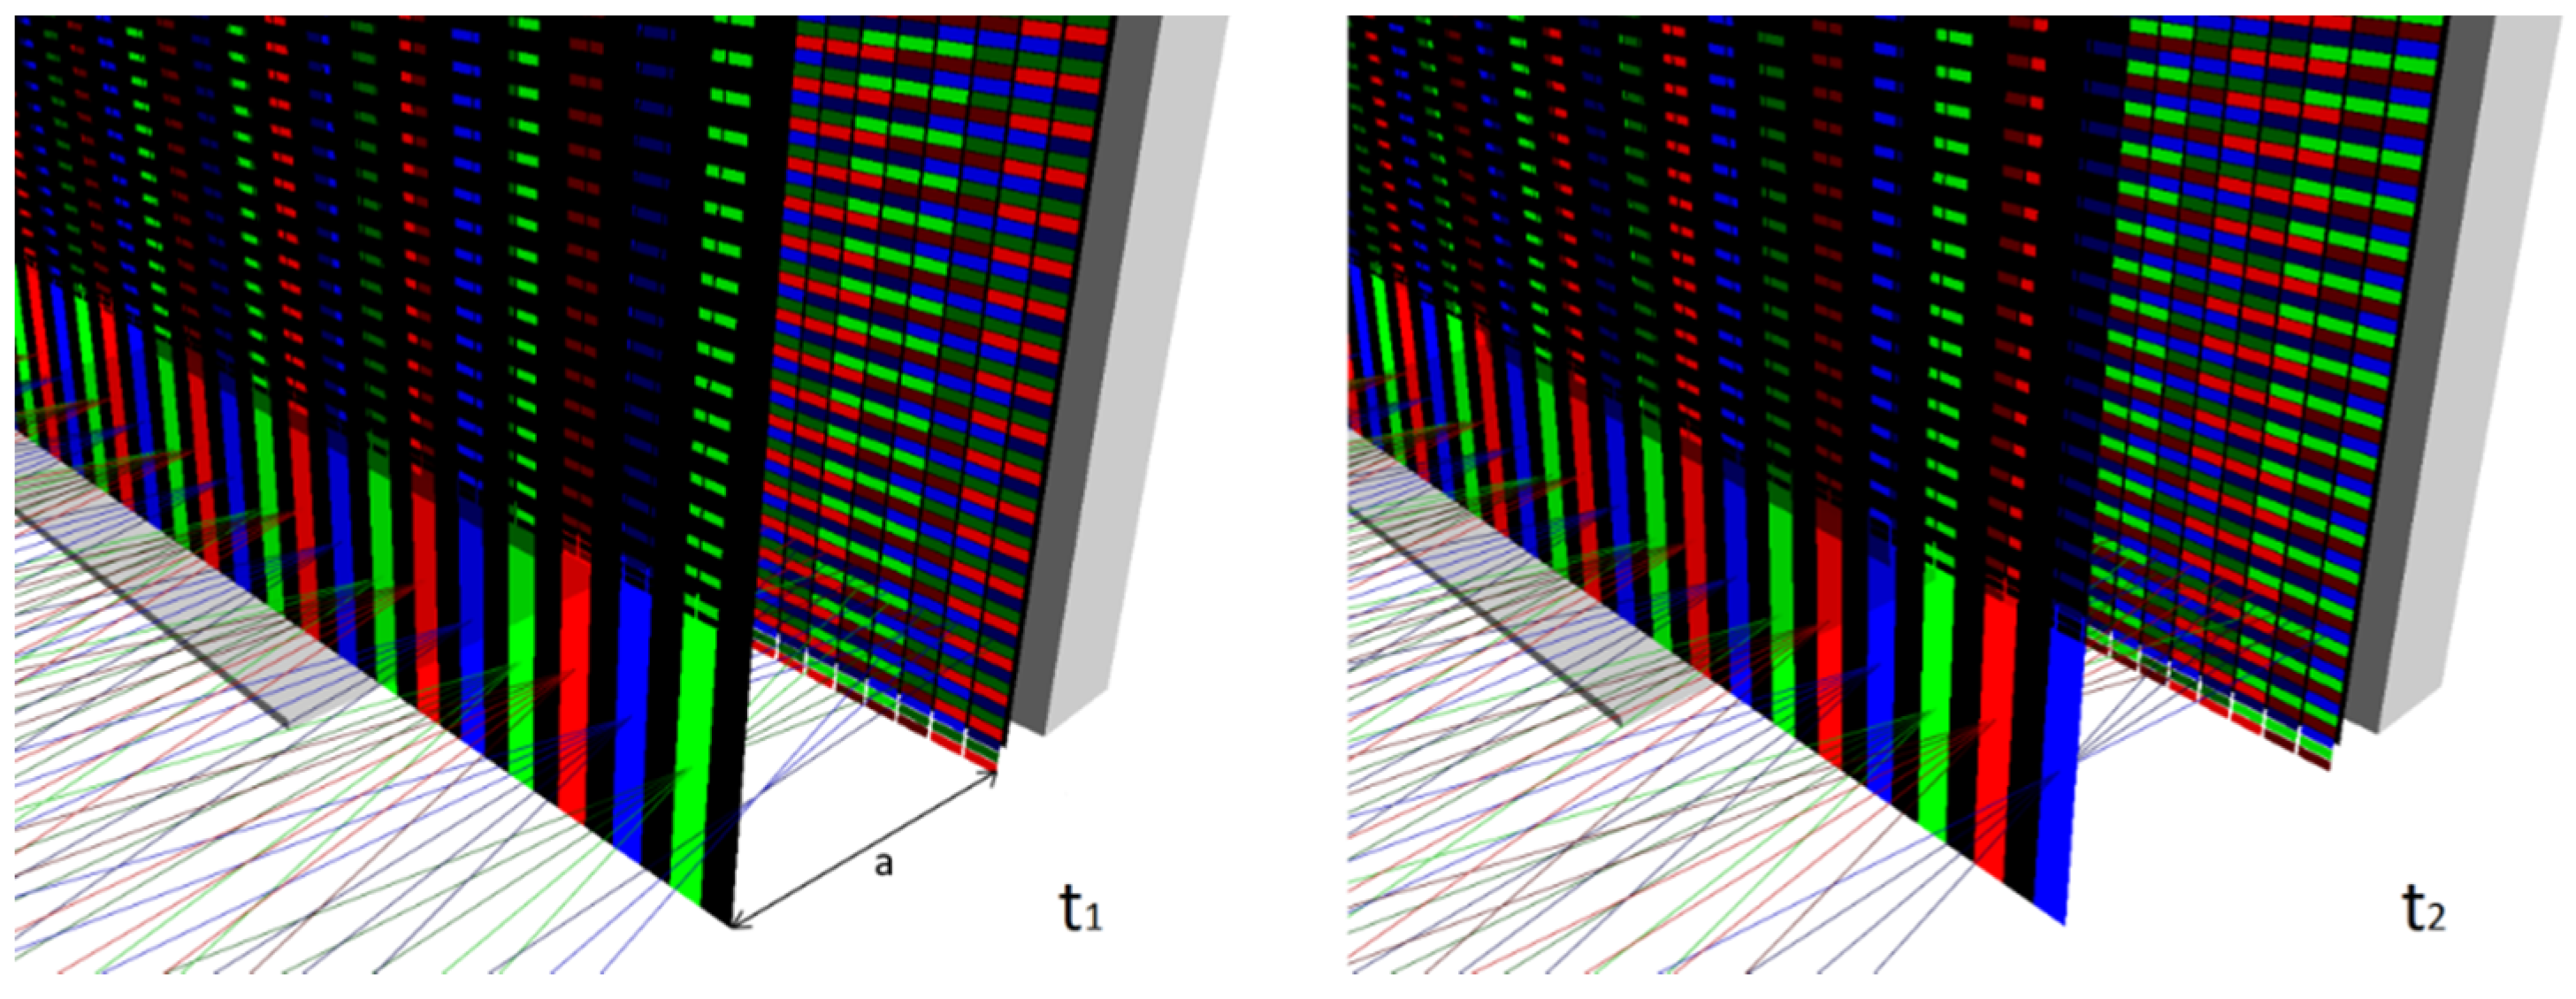
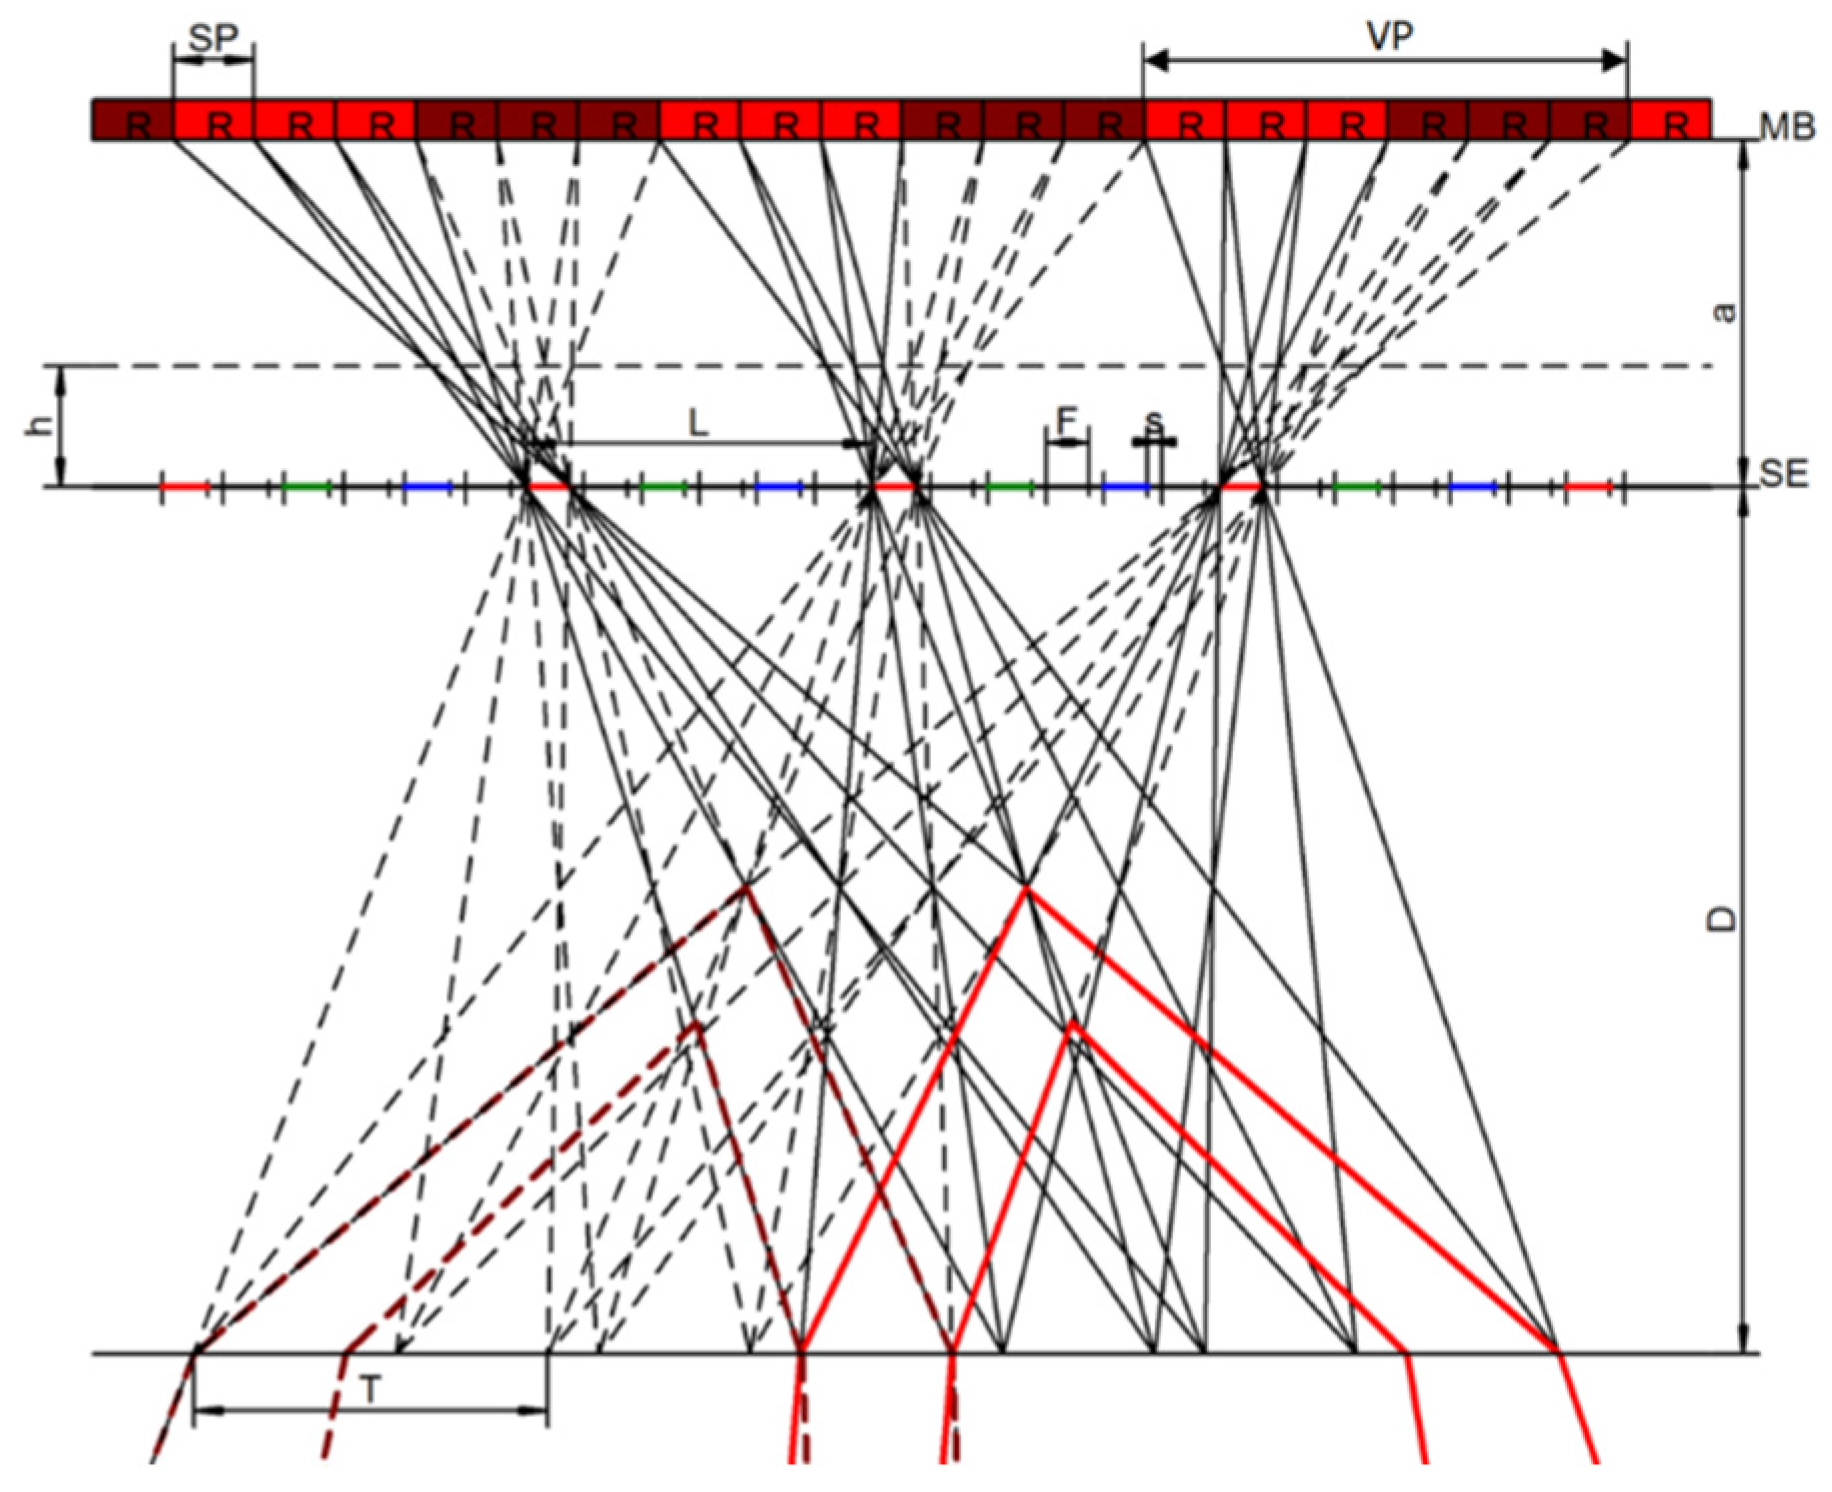
2.2. Geometric Considerations
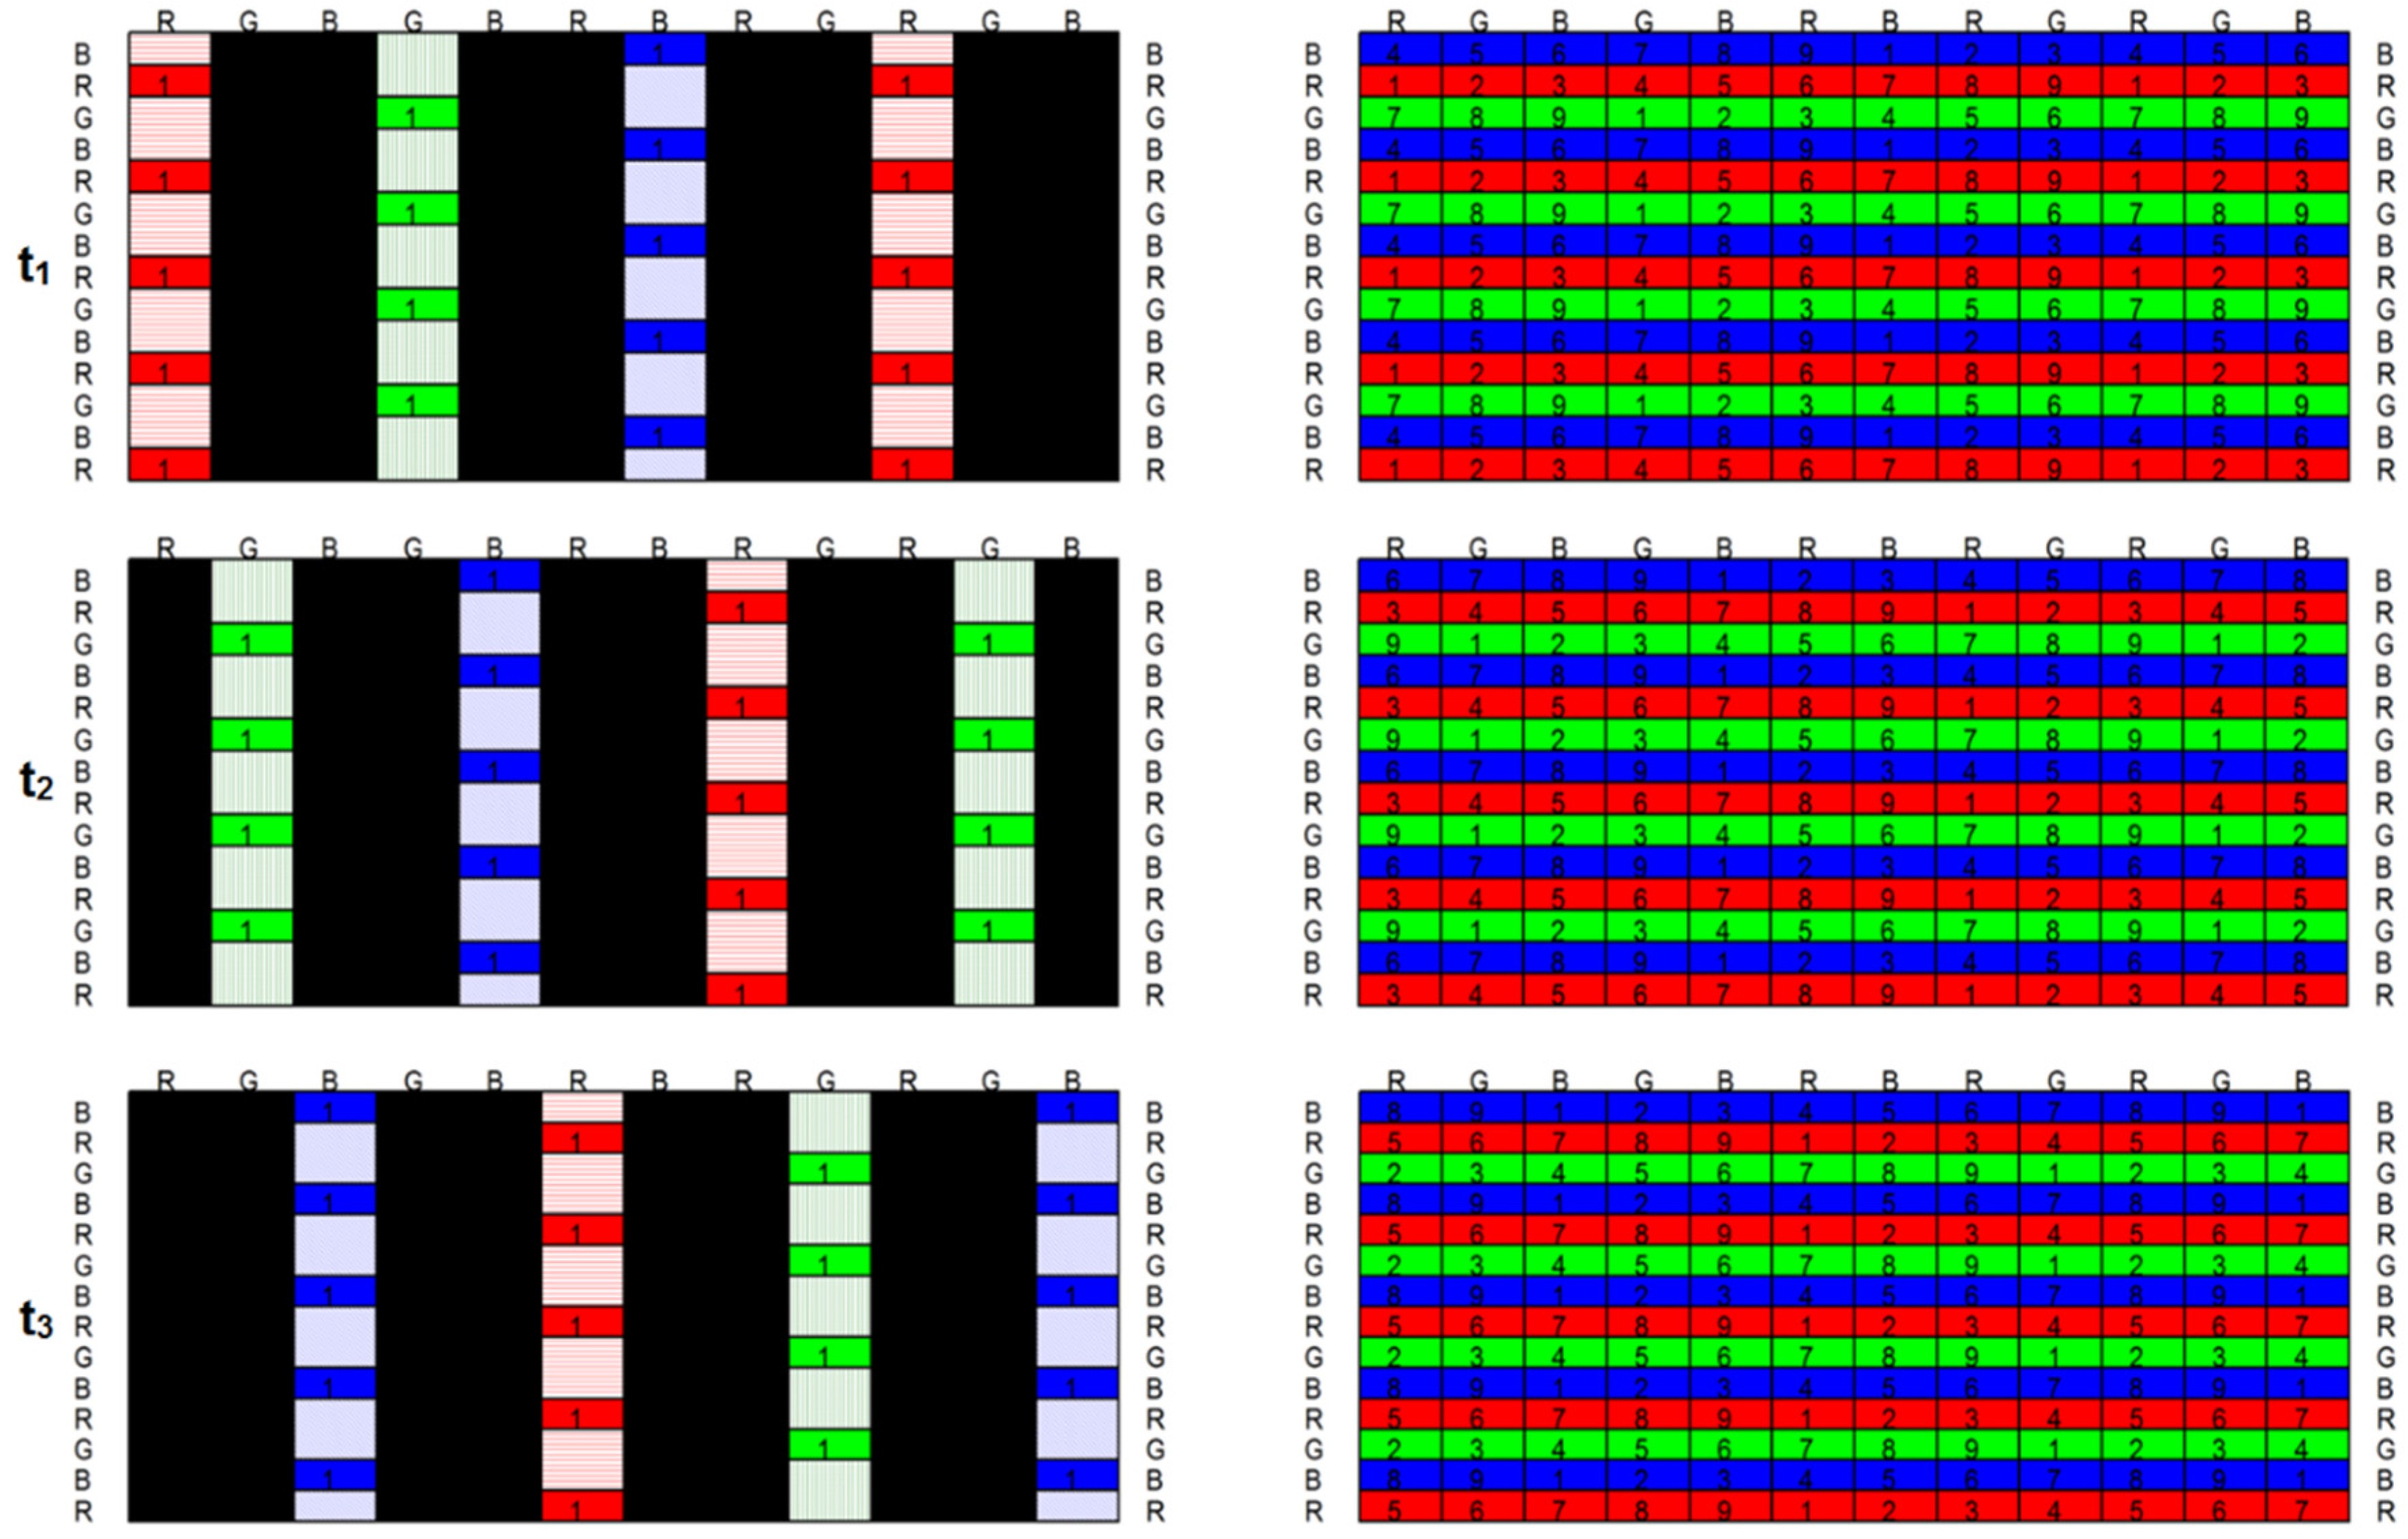
2.3. Switching Mode
2.4. Resolution and Luminance
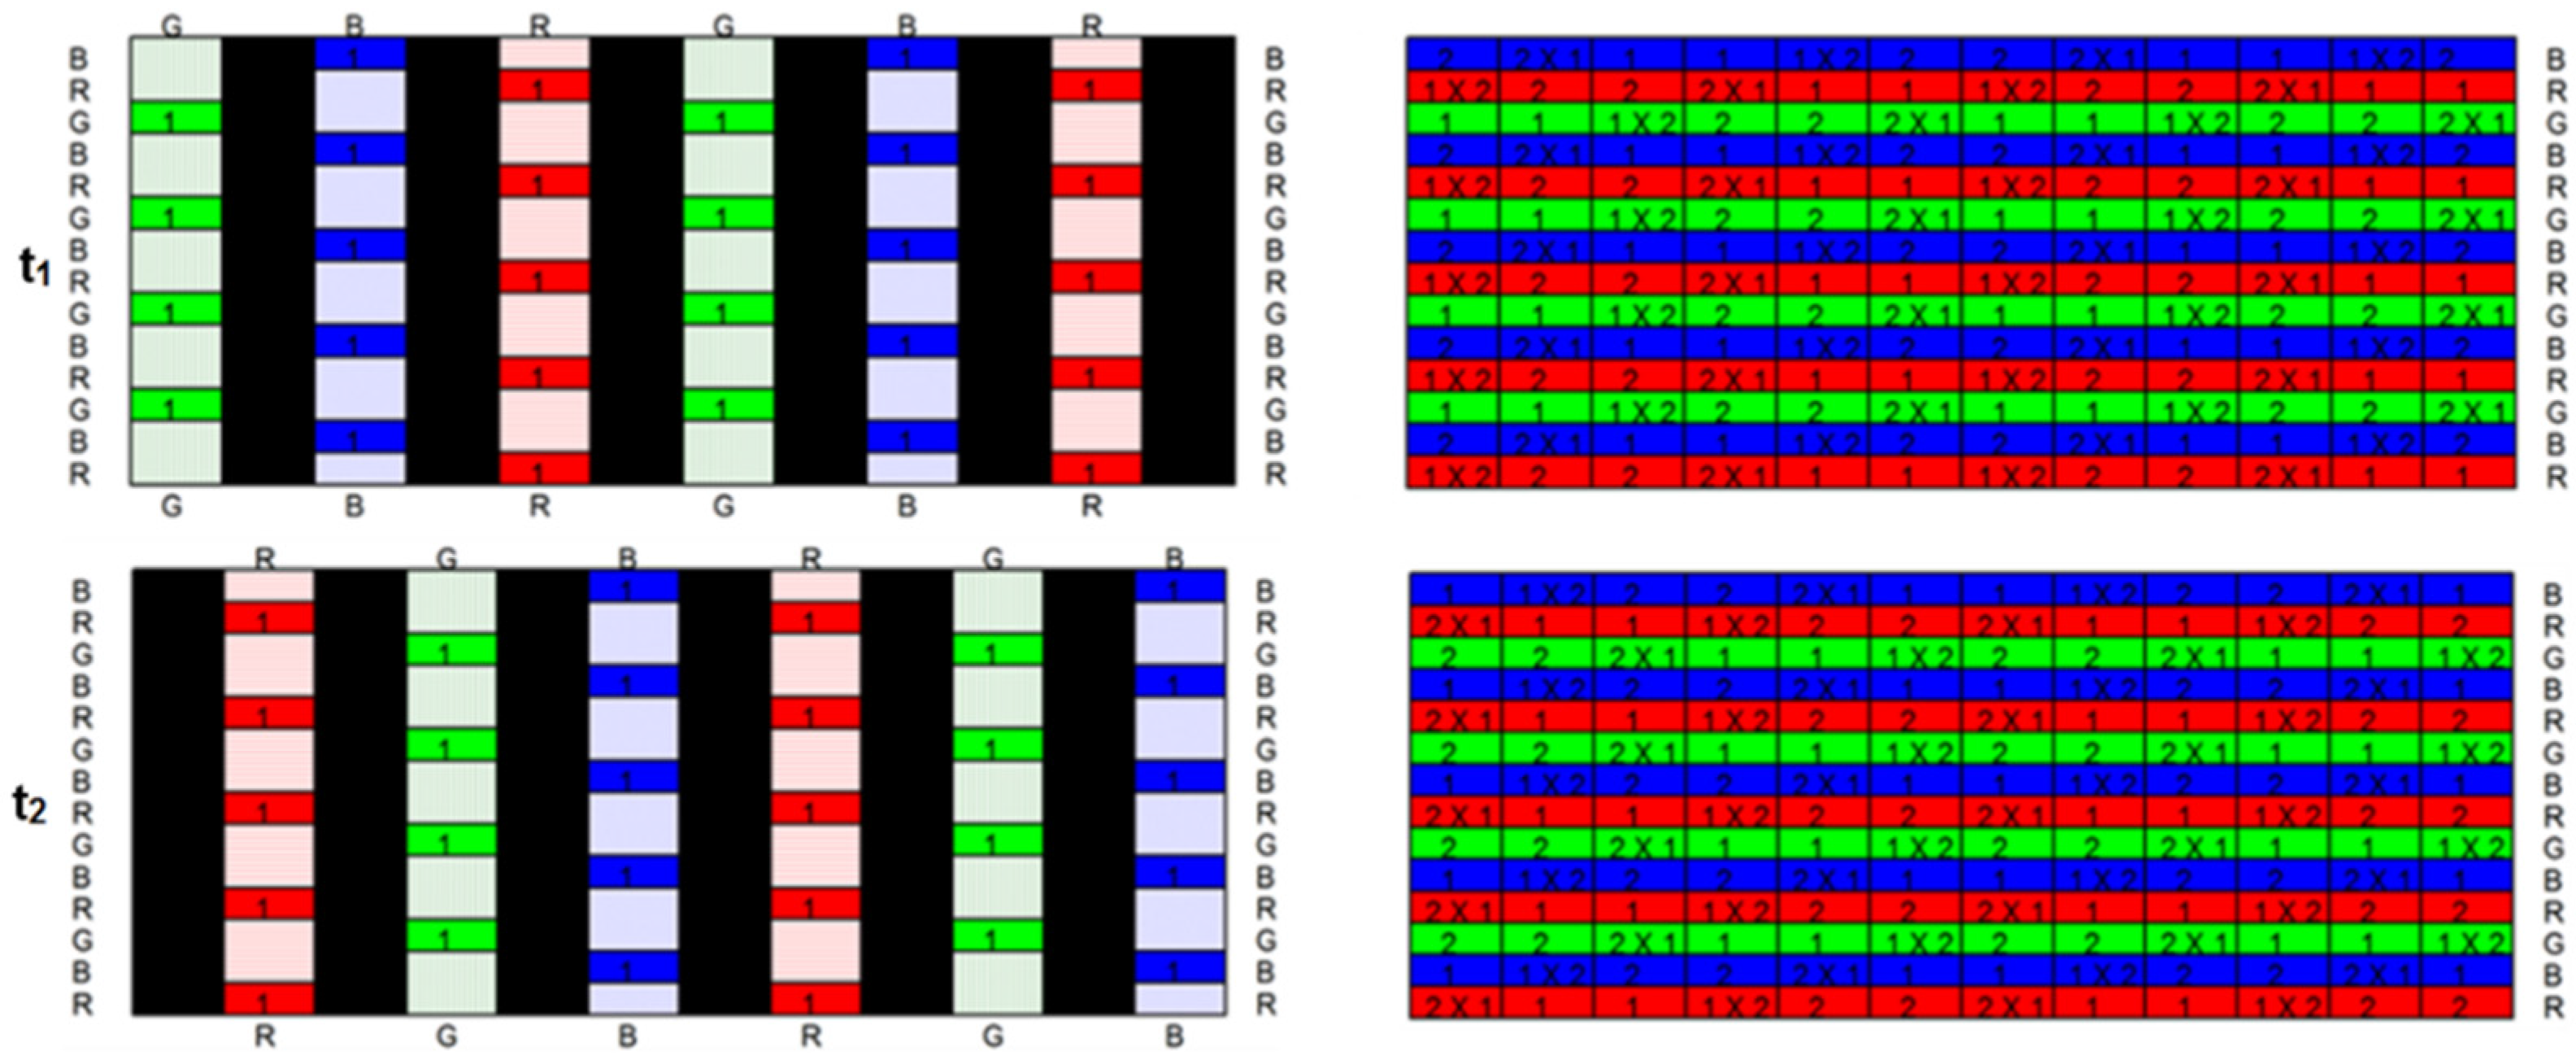
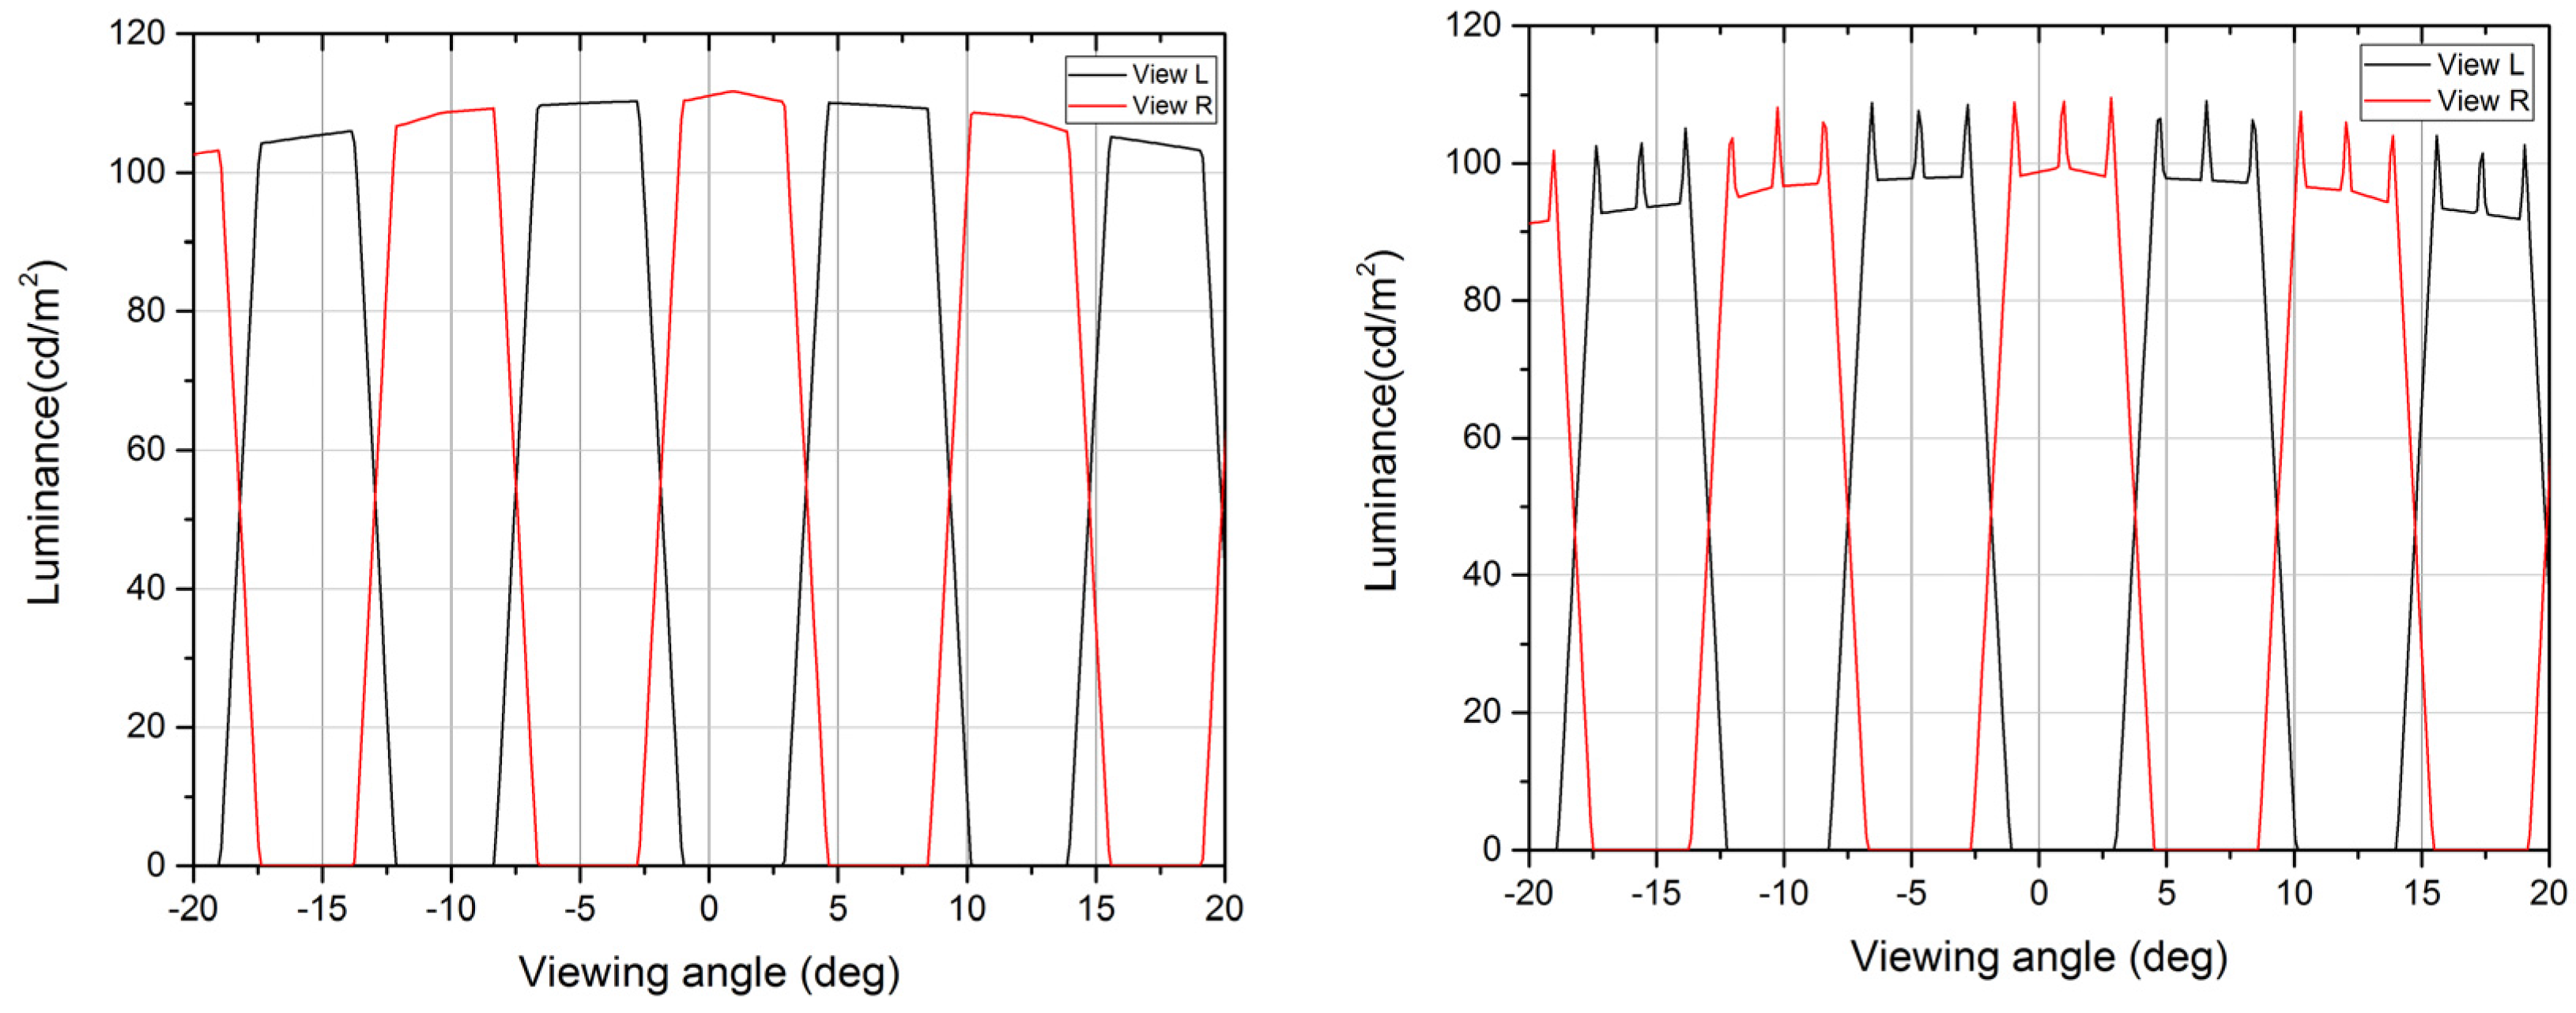
2.5. Two View Mode
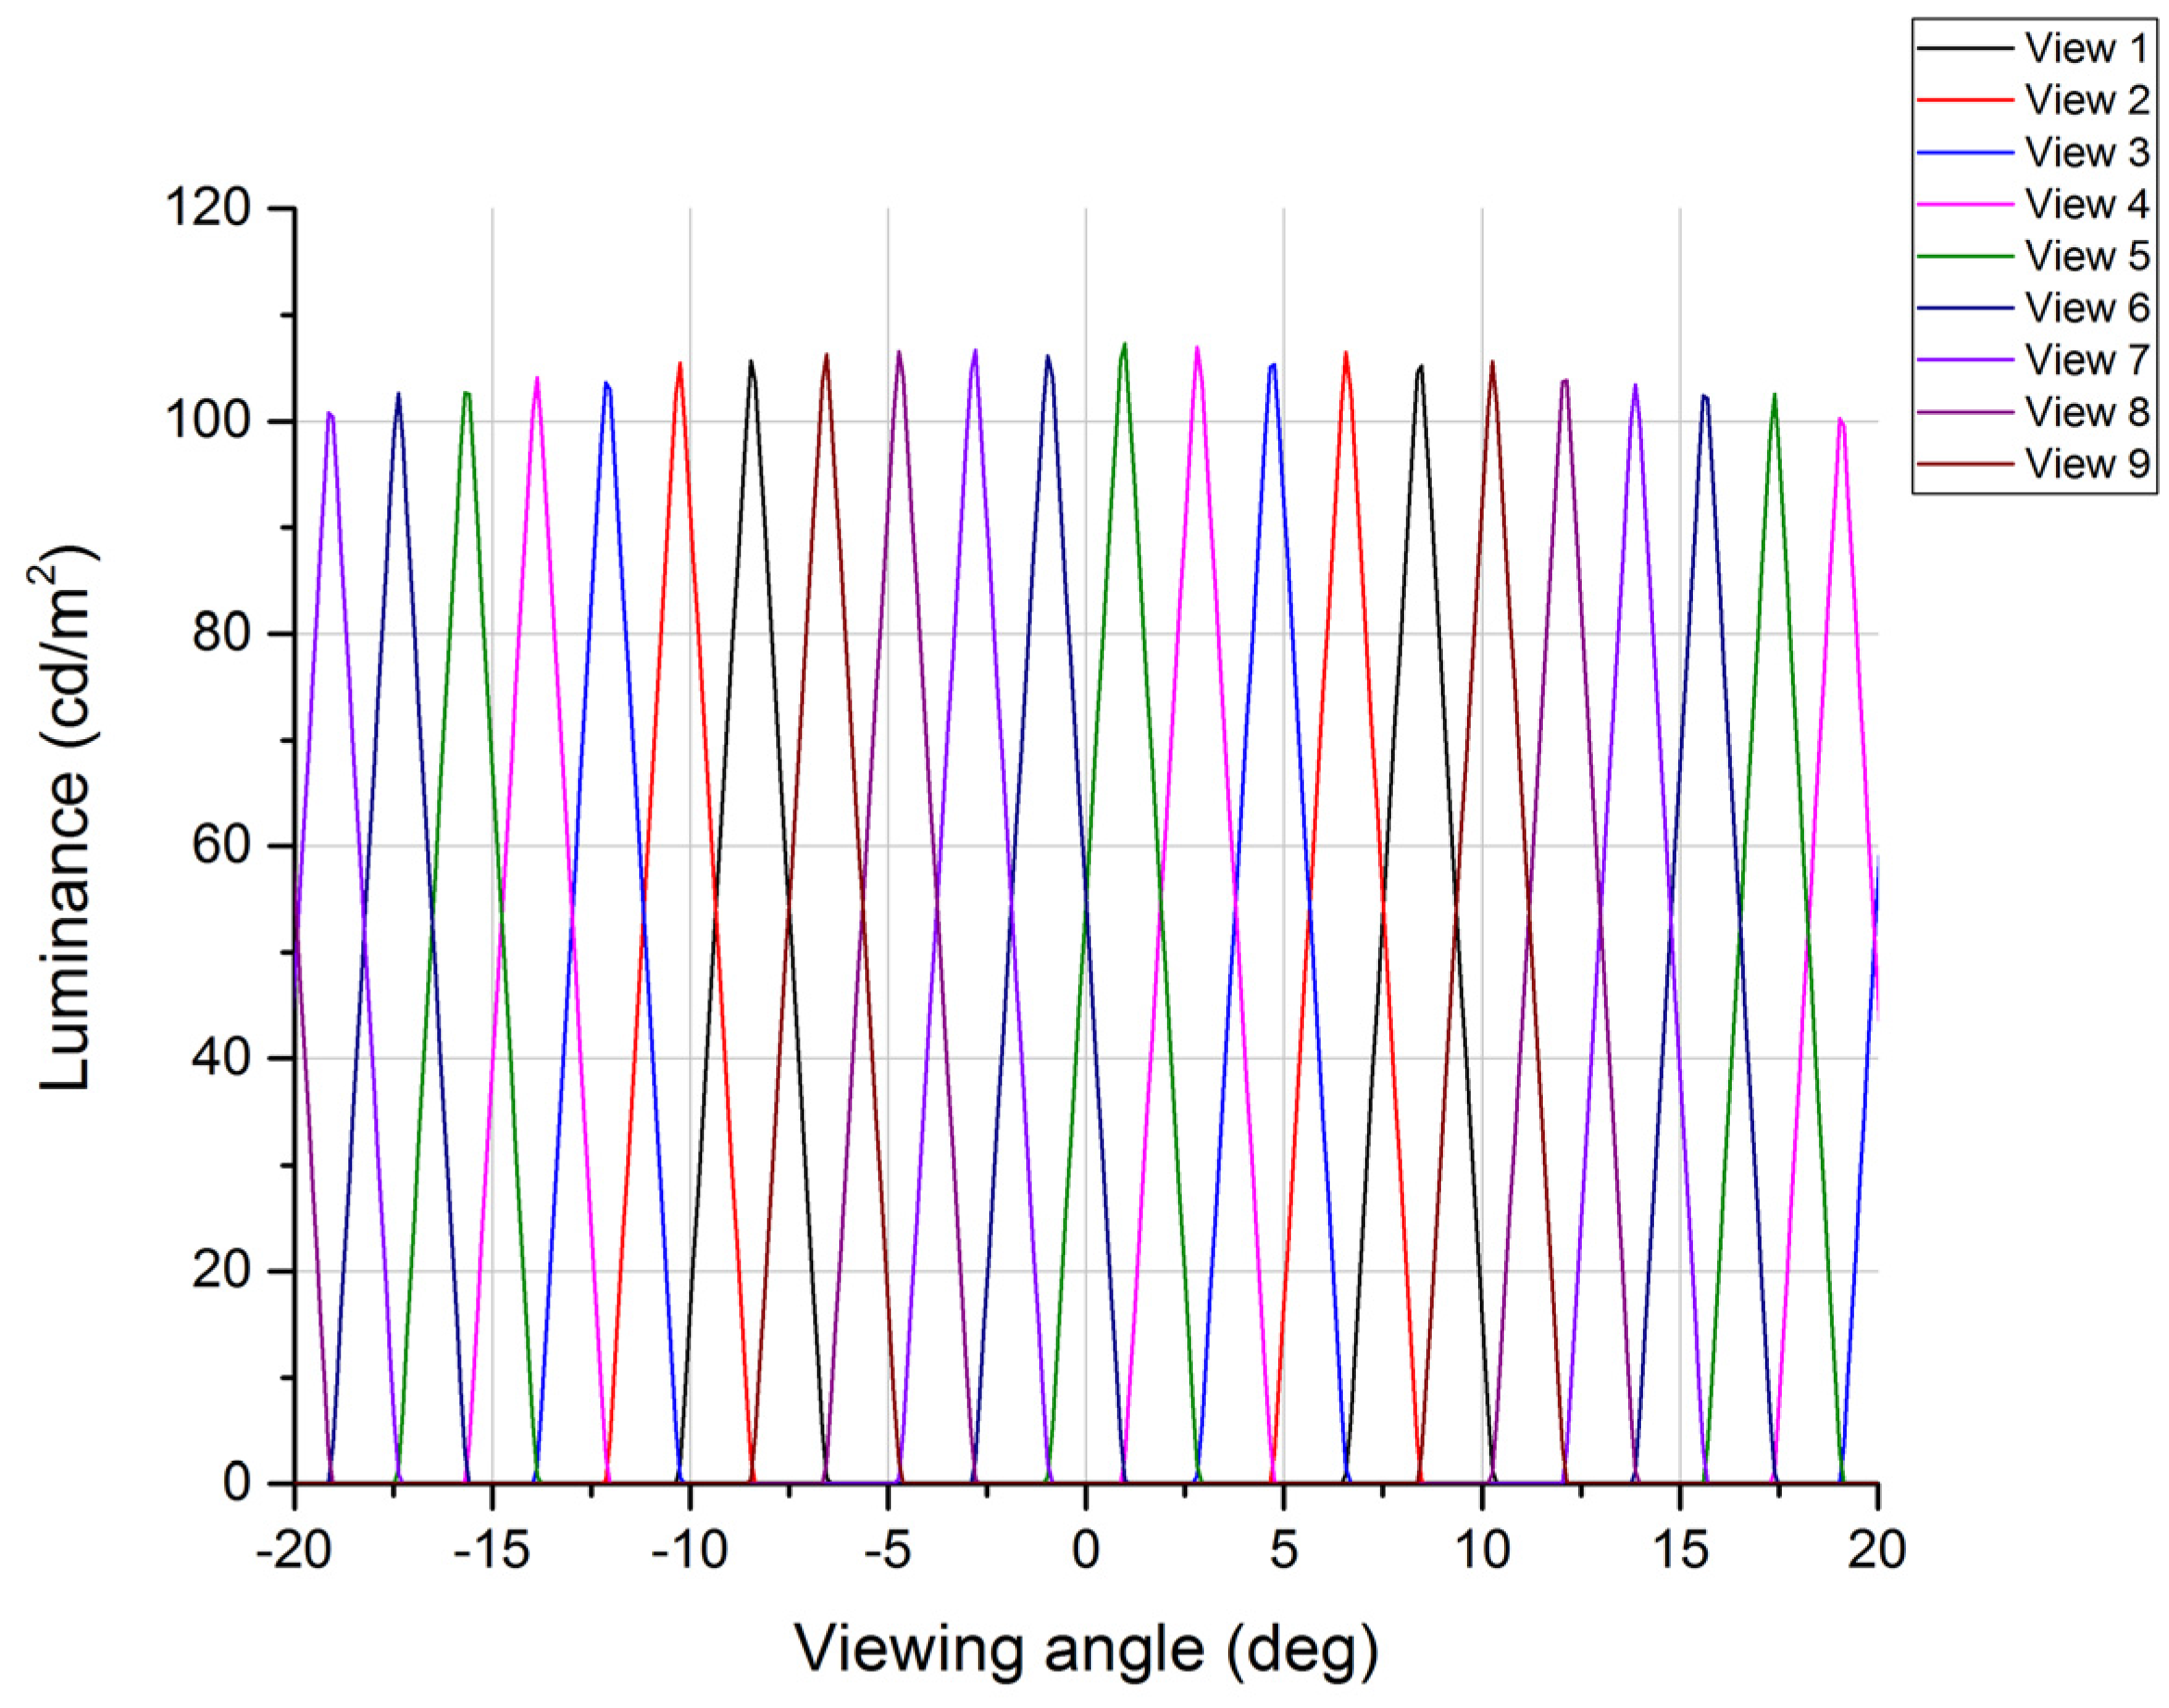
2.6. n-View Mode
3. Experiments and Results
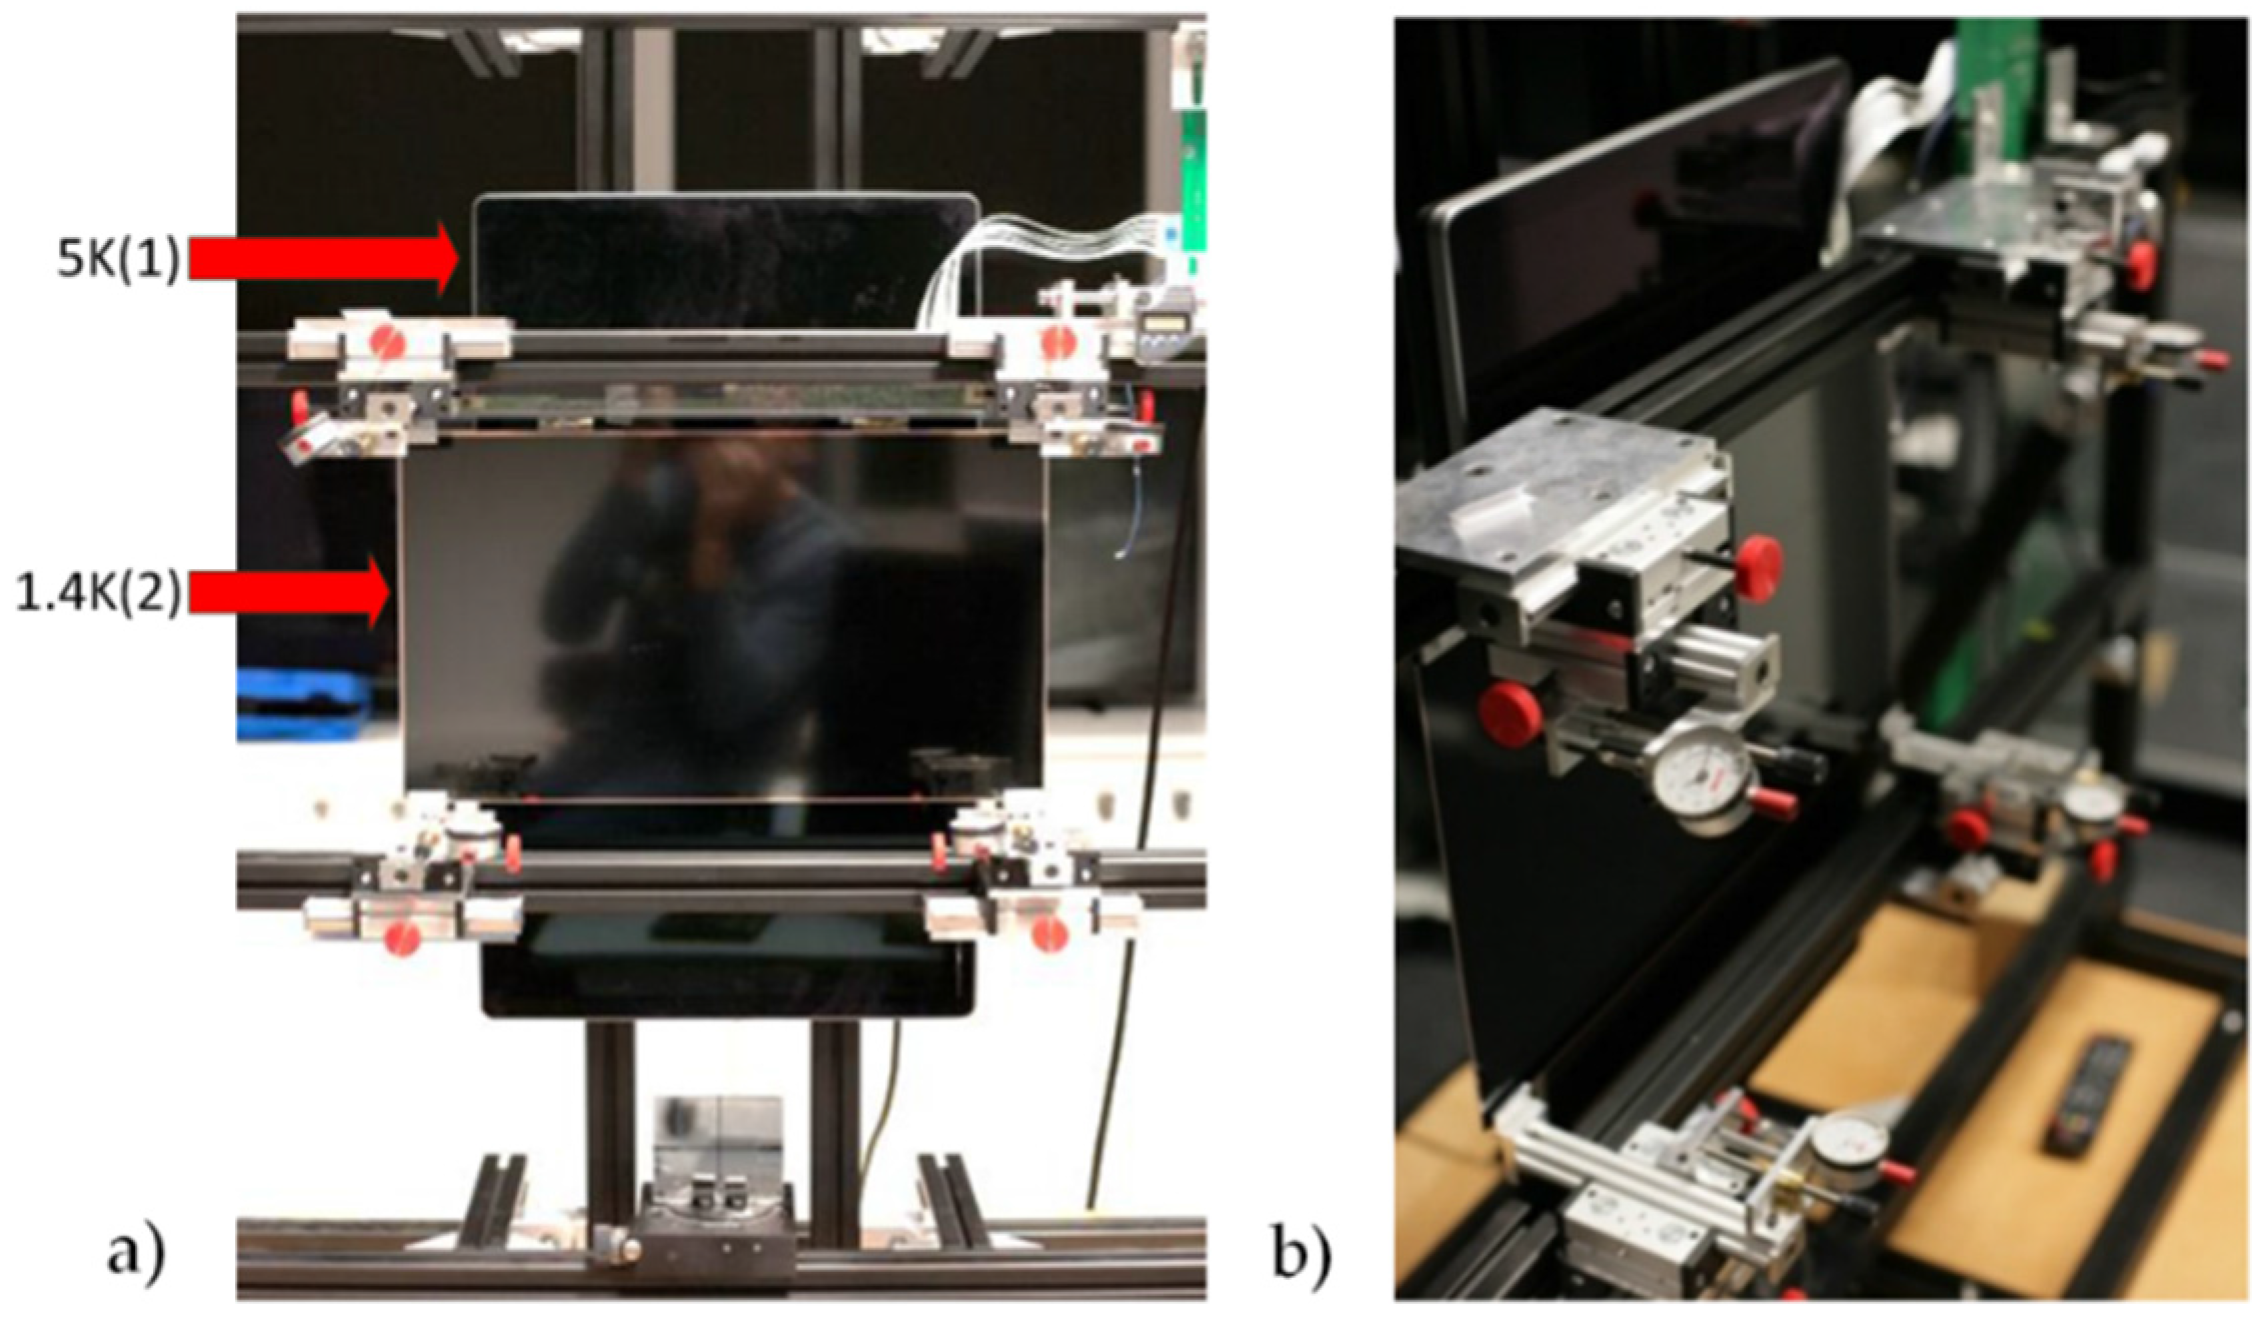
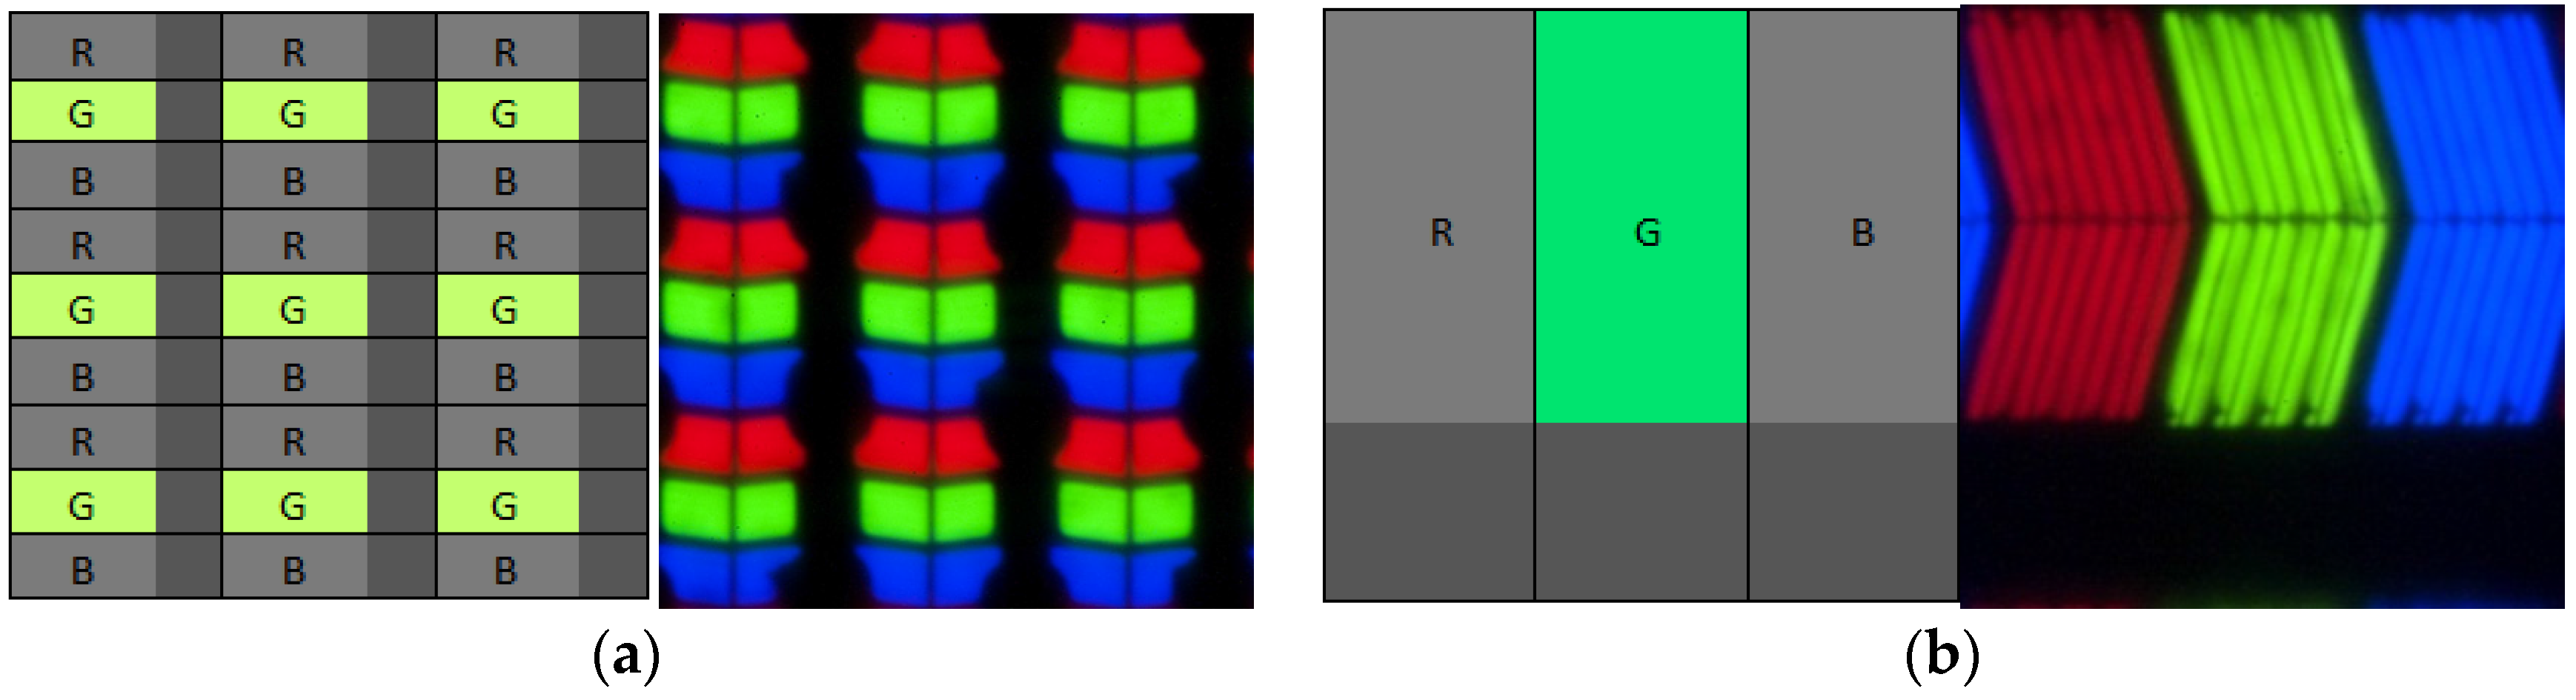
3.1. Verification of Switchable Color Filter Array Assembled with a Large Area Color Display
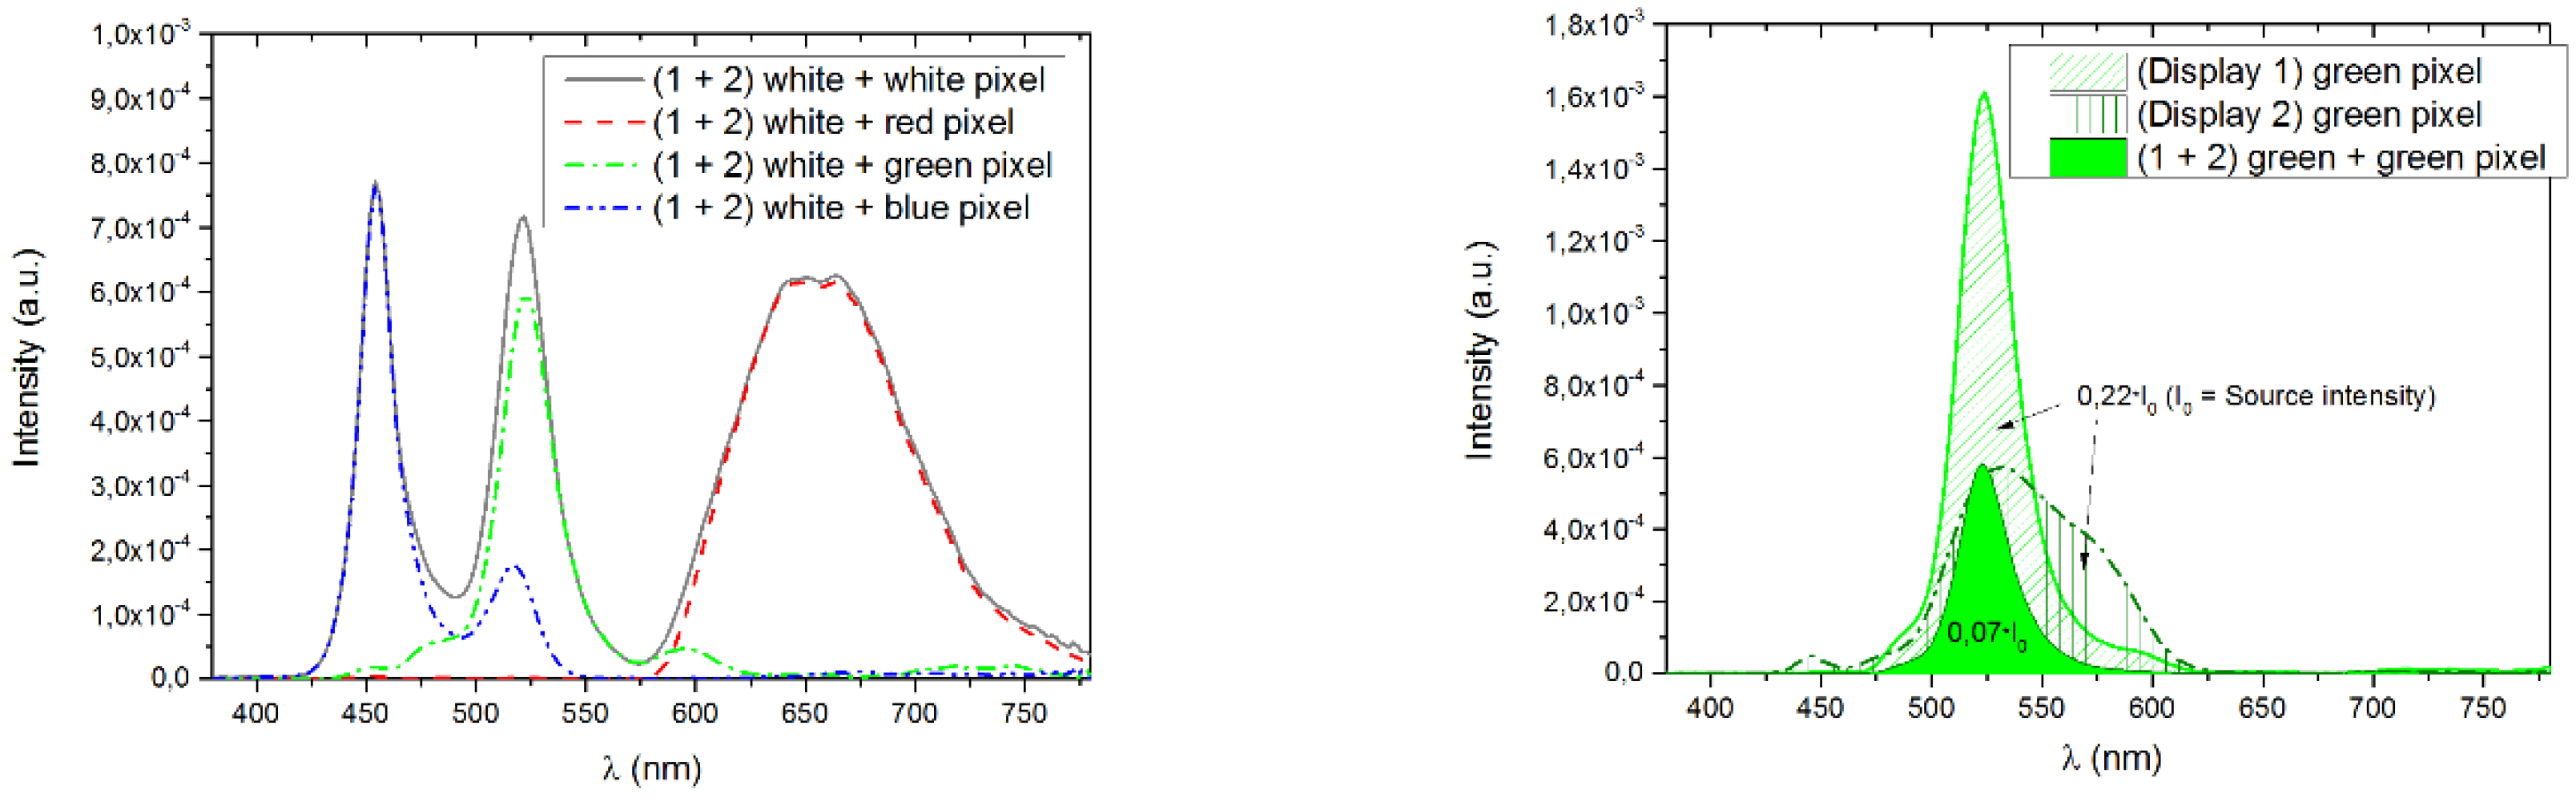
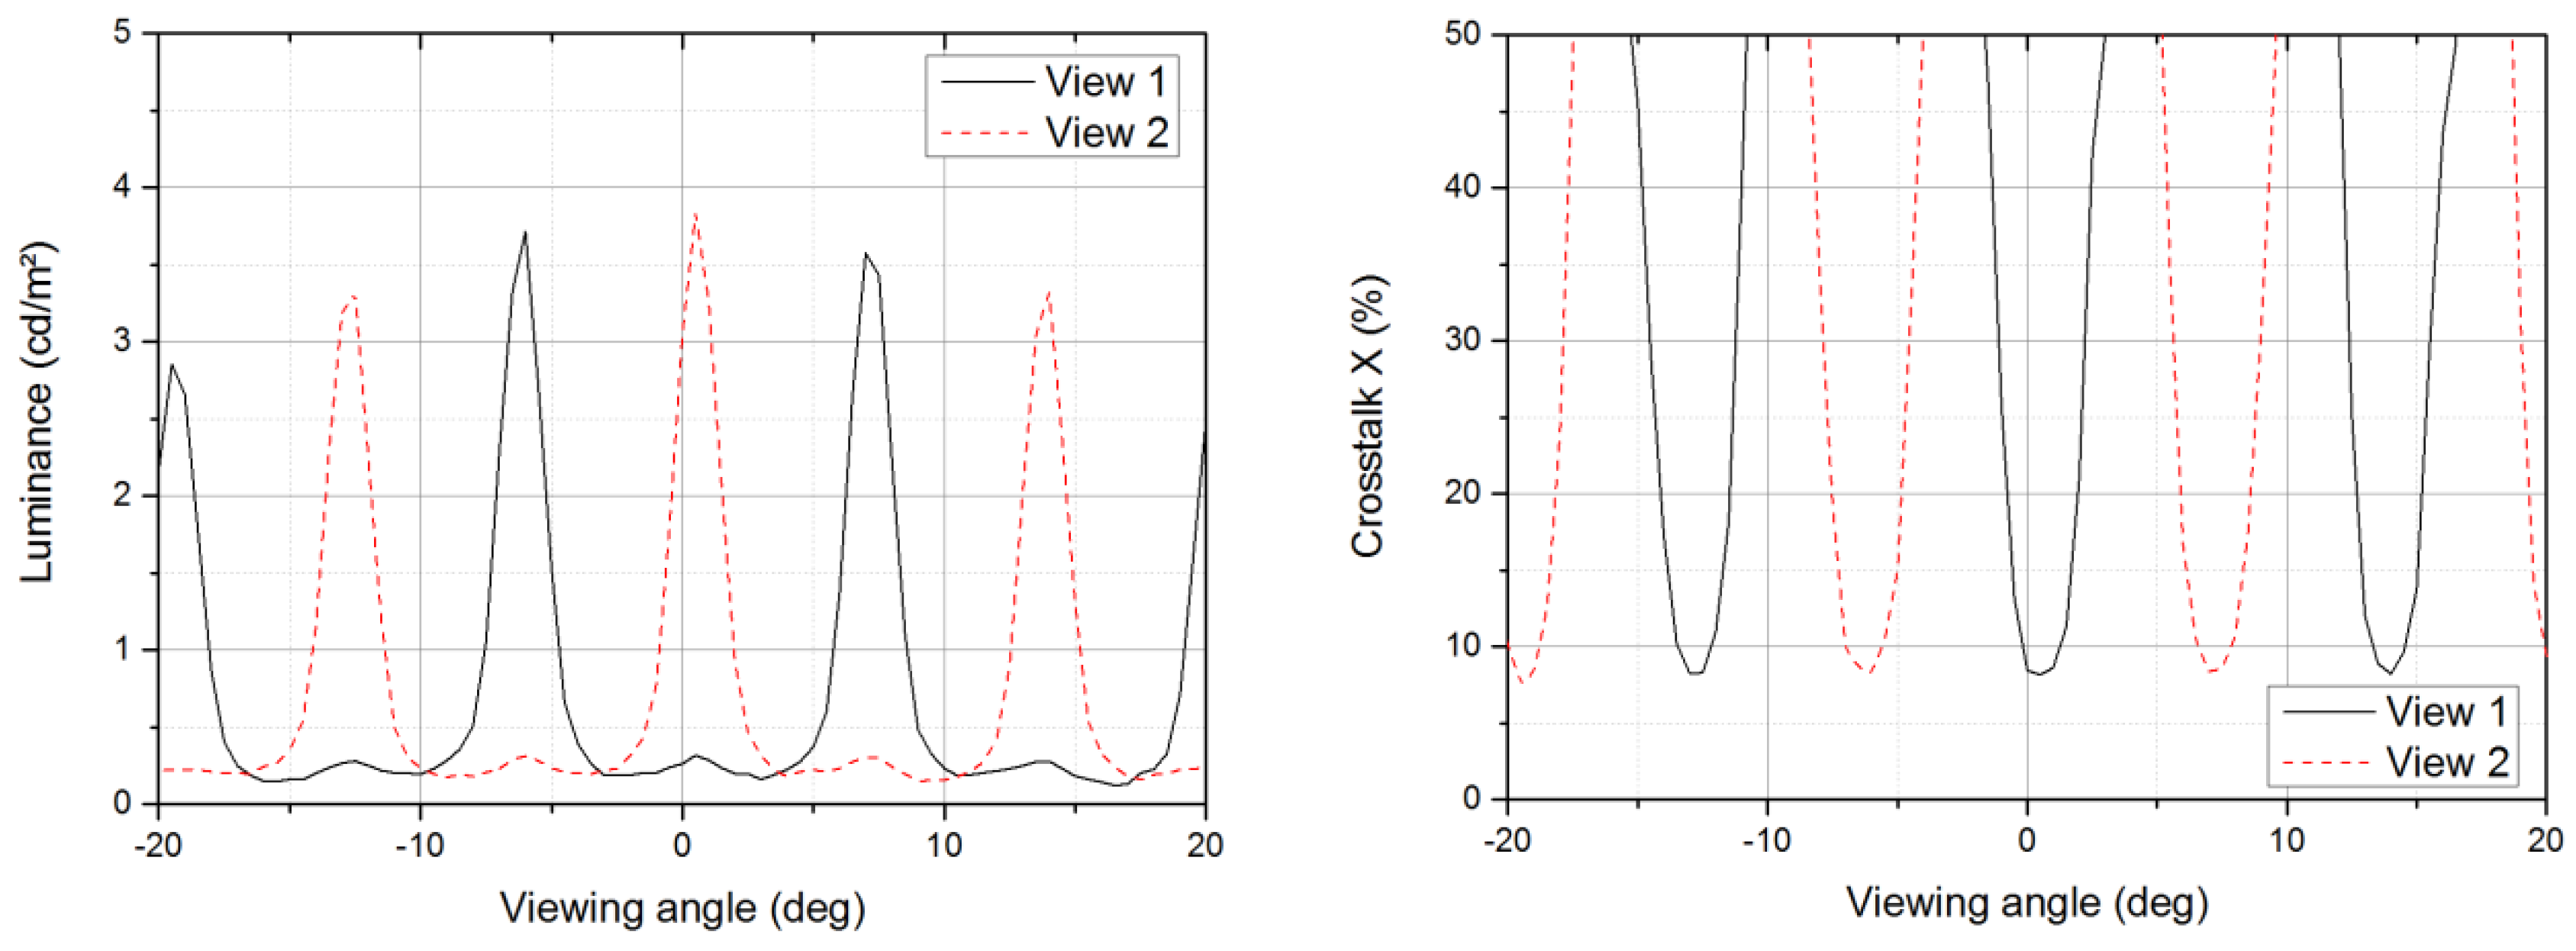
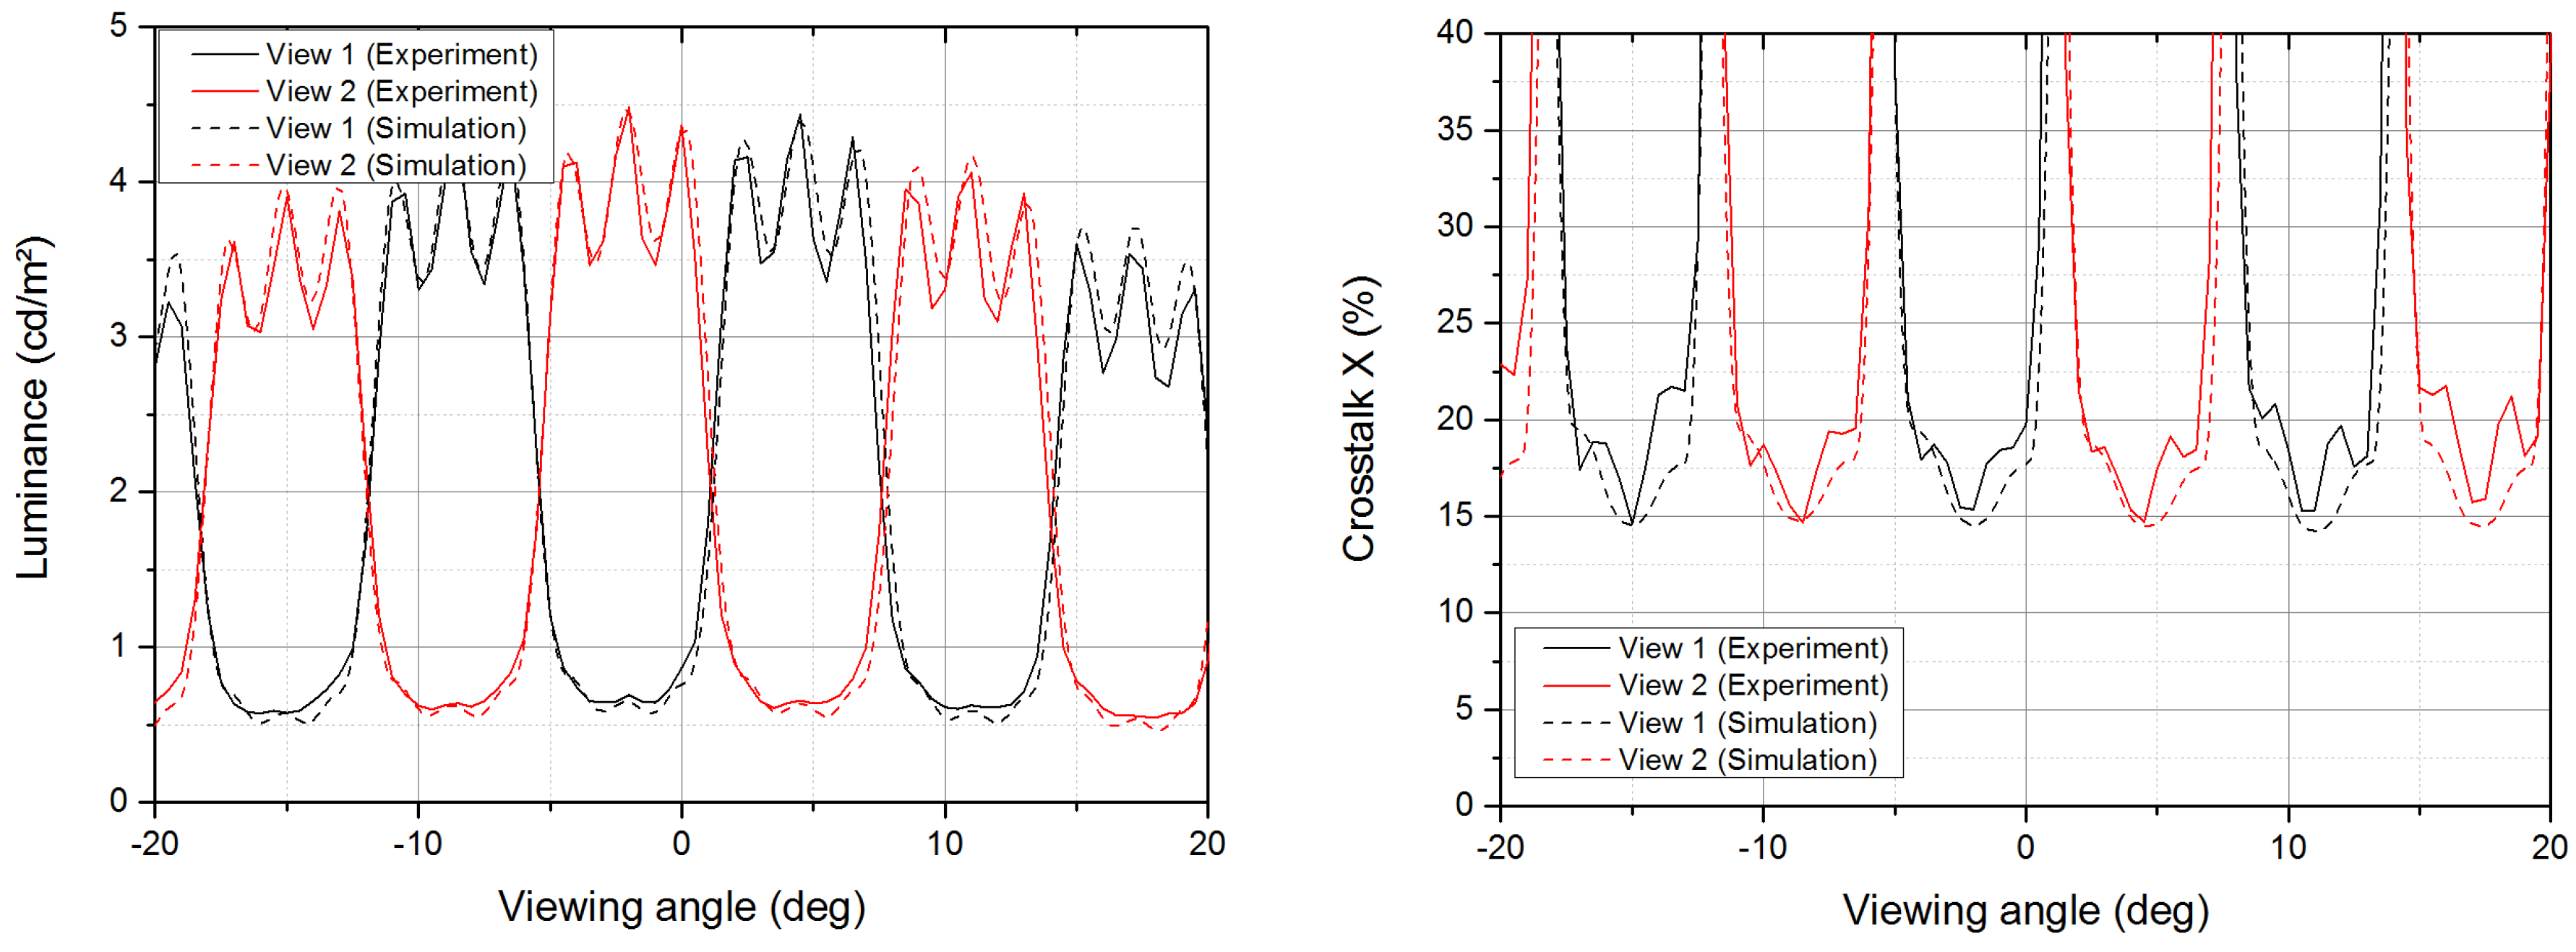
3.2. Spectral, Luminance and Crosstalk Measurements
3.3. Evaluation of Novel Fast Tunable Interference Color Filter
4. Discussion
5. Methods and Materials
Acknowledgments
Author Contributions
Conflicts of Interest
References
- Urey, H.; Chellappan, V.K.; Erden, E.; Surman, P. State of the Art in Stereoscopic and Autostereoscopic Displays. Proc. IEEE 2011, 99, 540–555. [Google Scholar] [CrossRef]
- ISO. Ergonomics of Human-System Interaction—Part 331: Optical Characteristics of Autostereoscopic Display; ISO TR-9241-331:2011(E), Technical Report; ISO: Geneva, Switzerland, 2011. [Google Scholar]
- Zhang, Q.; Kakeya, H. Time-Division Quadplexing Parallax Barrier Employing RGB Slits. JDT 2016, 12, 626–631. [Google Scholar]
- Zhang, Q.; Kakeya, H. Time-division multiplexing parallax barrier based on primary colors. SPIE 2014, 9011. [Google Scholar] [CrossRef]
- Bartmann, R.; Kuhlmey, M.; Netzbandt, R.; de la Barré, R. Simulation of autostereoscopic displays by geometrical ray tracing and implication of optical effects. In Proceedings of the 3DTV-Conference: The True Vision—Capture, Transmission and Display of 3D Video (3DTV-CON), Budapest, Hungary, 2–4 July 2014.
- De la Barré, R.; Hopf, K.; Jurk, S.; Leiner, U. TRANSFORMERS–Autostereoscopic Displays Running in Different 3D Operating Modes. SID Symp. Dig. Tech. Pap. 2011, 42, 452–455. [Google Scholar] [CrossRef]
- Jurk, S.; Kuhlmey, M.; de la Barré, R. A new type of multiview display, IS&T/SPIE Electronic Imaging 2015. In Proceedings of the Stereoscopic Displays and Applications XXVI, San Francisco, CA, USA, 9–11 February 2015.
- Woltman, S.J.; Jay, G.D.; Crawford, G.P. Liquid-crystal materials find a new order in biomedical applications. Nat. Mater. 2007, 6, 929–938. [Google Scholar] [CrossRef] [PubMed]
- Gat, N. Imaging spectroscopy using tunable filters: A review. Proc. SPIE 2000, 4056. [Google Scholar] [CrossRef]
- Beeckman, J.; Neyts, K.; Vanbrabant, P.J.M. Liquid-crystal photonic applications. Opt. Eng. 2011, 50, 081202. [Google Scholar] [CrossRef] [Green Version]
- Patel, J.S.; Saifi, M.A.; Berreman, D.W.; Andreadakis, C.L.N.; Lee, S.D. Electrically tunable optical filter for infrared wavelength using liquid crystals in a Fabry-Pérot étalon. Appl. Phys. Lett. 1990, 57, 1718–1720. [Google Scholar] [CrossRef]
- Abdulhalim, I. Non-display bio-optic applications of liquid crystals. Liq. Cryst. Today 2011, 20, 44–60. [Google Scholar] [CrossRef]
- Kong, Y.; Yang, G.; Huang, X. Multiple-stage liquid crystal tuned filter. Opt.-Int. J. Light Electron Opt. 2011, 122, 1723–1729. [Google Scholar] [CrossRef]
- Hamdi, R.; Farha, R.M.; Redadaa, S.; Benkelfat, B.E.; Abed, D.; Halassi, A.; Boumakh, Y. Optical bandpass Lyot filter with tunable bandwidth. In Proceedings of the 19th International Conference on Telecommunications (ICT), Jounieh, Lebanon, 23–25 April 2012.
- Okoshi, T. Three-Dimensional Imaging Techniques; Academic Press: New York, NY, USA; San Francisco, CA, USA; London, UK, 1976. [Google Scholar]
- Schmidt, A.; Grasnick, A. Multi-viewpoint Autostereoscopic Displays from 4D-Vision. SPIE 2002, 4660, 216–217. [Google Scholar]
- Bartmann, R.; Kuhlmey, M.; Netzbandt, R.; de la Barré, R. Validation of subpixel area based simulation for autostereoscopic displays with parallax barriers. In Proceedings of the International Conference on 3D Imaging (IC3D), Liège, Belgium, 9–10 December 2014.
- Kuhlmey, M.; Jurk, S.; Duckstein, B.; de la Barré, R. Automated simulation and evaluation of autostereoscopic multiview 3D display designs by time-sequential and wavelength-selective filter barrier, SPIE Optical Systems Design 2015. Comput. Opt. Proc. SPIE 2015, 9630. [Google Scholar] [CrossRef]
- Jurk, S.; Kuhlmey, M.; Bartmann, R.; Duckstein, B.; de la Barré, R. Autostereoscopic display concept with time-sequential wavelength-selective filter-barrier. Proc. SPIE Adv. Disp. Technol. VI 2016, 9770. [Google Scholar] [CrossRef]
- Jurk, S.; de la Barré, R. A new Tracking Approach for XYZ-User-Adaption of Stereoscopic Content. In Proceedings of the Electronic Displays Conference, Nuremberg, Germany, 25–27 February 2014.
- De la Barré, R.; Jurk, S. Improvements of aid free 3D Presentation. In Proceedings of the Electronic Displays Conference, Nuremberg, Germany, 2–3 March 2011.
- Tamura, N.; Tsumura, N.; Miyake, Y. Masking Model for accurate Colorimetric characterization of LCD. In Proceedings of the 10th IS&T/SID Color Imaging Conference 2002, Scottsdale, AZ, USA, 12–15 November 2002; pp. 312–316.
- Yoshida, Y.; Yamamoto, Y. Color Calibration of LCDs. In Proceedings of the 10th Color Imaging Conference, Scottsdale, AZ, USA, 12–15 November 2002; pp. 303–311.
- Becker, M. Metrology Issues for LCD-TV. pp. 1–11, © Display-Metrology&Systems 2005. Available online: http://www.display-messtechnik.de/fileadmin/template/main/docs/metrology4lcd-tv.pdf (accessed on 10 December 2016).
- Mantiuk, R.; Daly, S.; Kerofsky, L. The luminance of pure black: Exploring the effect of surround, in the context of electronic displays. In Proceedings of the Human Vision and Electronic Imaging XXI, IS&T/SPIE’s Symposium on Electronic Imaging, San Jose, CA, USA, 18–21 January 2010; pp. 7527–7531.
- Wen, S.; Wu, R. Two-Primary Crosstalk Model for Characterizing Liquid Crystal Displays. Res. Appl. Wiley Period. 2006, 31, 102–108. [Google Scholar] [CrossRef]
- Isaacs, S.; Placido, F.; Abdulhalim, I. Investigation of liquid crystal Fabry–Pérot tunable filters: Design, fabrication, and polarization independence. Appl. Opt. 2014, 53, H91–H101. [Google Scholar] [CrossRef] [PubMed]
- Schadt, M.; Seiberle, H.; Schuster, A. Optical patterning of multi-domain liquid-crystal. Nature 1996, 381, 212–215. [Google Scholar] [CrossRef]
- Neill, M.O.; Kelly, S.M. Photoinduced surface alignment for liquid crystal displays. J. Phys. D Appl. Phys. 2000, 33, R67. [Google Scholar] [CrossRef]
- Garmire, E. Theory of quarter-wave-stack dielectric mirrors used in a thin Fabry-Pérot filter. Appl. Opt. 2003, 42, 5442–5449. [Google Scholar] [CrossRef] [PubMed]
- Seeboth, A.; Lötzsch, D.; Rabe, C.; Frach, P.; Gittner, M.; Bartzsch, H.; de la Barré, R.; Bartmann, R.; Vergöhl, M.; Bruns, S.; et al. Electrically Controlled Interference Color Filter. Patent WO 2016113051A1, 21 July 2016. [Google Scholar]
- Hirabayashi, K.; Tsuda, H.; Kurokawa, T. Tunable liquid-crystal Fabry-Pérot interferometer filter for wavelength-division multiplexing communication systems. J. Lightwave Technol. 1993, 11, 2033–2043. [Google Scholar] [CrossRef]
- Dąbrowski, R.; Kula, P.; Herman, J. High Birefringence Liquid Crystals. Crystals 2013, 3, 443–482. [Google Scholar] [CrossRef]
- Gauza, S.; Kula, P.; Dabrowski, R.; Sasnouski, G.; Lapanik, V. Review Paper: High Optical Anisotropy Nematic Single Compounds and Mixtures. Trans. Electr. Electron. Mater. 2012, 13, 2–5. [Google Scholar] [CrossRef]
- Hird, M. Fluorinated liquid crystals—Properties and applications. Chem. Soc. Rev. 2007, 36, 2070–2095. [Google Scholar] [CrossRef] [PubMed]
- Masia, B.; Wetzstein, G.; Didyk, P.; Gutierrez, D. A Survey of Computational Displays. Pushing the Boundaries of Optics, Computation and Perception. Comput. Graph. 2013, 37, 1012–1038. [Google Scholar]
- Wetzstein, G.; Lanman, D.; Gutierrez, D.; Hirsch, M. Computational Displays. In SIGGRAPH 2012 Course; ACM: New York, NY, USA, 2012. [Google Scholar]
- Wetzstein, G.; Lanman, D.; Hirsch, M.; Raskar, R. Tensor Displays: Compressive Light Field Synthesis using Multilayer Displays with Directional Backlighting. ACM Trans. Graph. 2012, 31, 80. [Google Scholar] [CrossRef]
- Heide, F.; Wetzstein, G.; Raskar, R.; Heidrich, W. Adaptive Image Synthesis for Compressive Displays. SIGGRAPH. ACM Trans. Graph. 2013, 32, 132. [Google Scholar] [CrossRef]
- Johnson, P.V.; Kim, J.; Banks, M.S. The visibility of color breakup and a means to reduce it. J. Vis. 2014, 14, 10. [Google Scholar] [CrossRef] [PubMed]
- Baron, P.C. Saccadic color breakup in field sequential color displays: An overview. In Proceedings of the Americas Display Engineering and Applications Conference (ADEAC06), Atlanta, GA, USA, 24–26 October 2006.
- Seeboth, A. Orientation layers for liquid crystals in liquid crystal displays. Displays 1999, 20, 131–136. [Google Scholar] [CrossRef]
- Seeboth, A. Electro-optical behavior of polymer-dispersed liquid crystals. Thin Solid Films 1993, 223, 140–142. [Google Scholar] [CrossRef]


| Device | Resolution | Pixel-Pitch |
|---|---|---|
| Display 1 | 5120 × 2880 (5 K) | 11,655 µm |
| Display 2 | 1366 × 720 (1.4 K) | 34,950 µm |
| Spectral Luminance | Display 1 (5 K) | Display 2 (1.4 K) * | Demonstrator, Displays 1 + 2 |
|---|---|---|---|
| White Pixel Luminance | 214 cd/m2 | 158 cd/m2 | 18.6 cd/m2 |
| Red Pixel Luminance | 56 cd/m2 | 32 cd/m2 | 5.3 cd/m2 |
| Green Pixel Luminance | 146 cd/m2 | 109 cd/m2 | 9.8 cd/m2 |
| Blue Pixel Luminance | 12 cd/m2 | 17 cd/m2 | 0.9 cd/m2 |
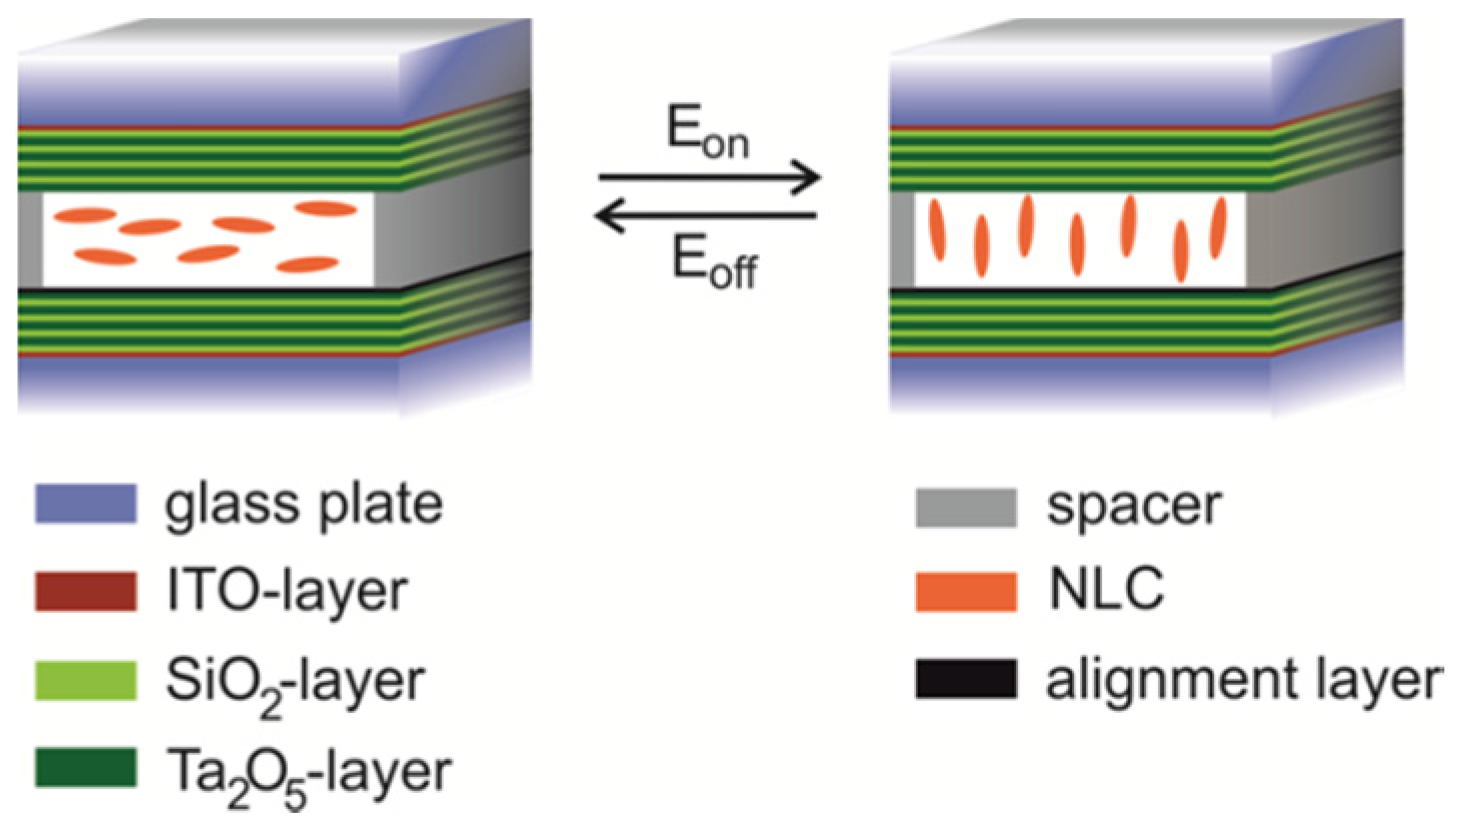
| Device | Mirror Design (1) | Mirror Materials SiO2/Ta2O5 | Electrode ITO (Indium Tin Oxide) | Spacer SiO2 |
|---|---|---|---|---|
| I | (HL)4 H | 106 nm/73 nm | 40 nm | 817 nm |
| II | (HL)4 H | 96 nm/64 nm | 40 nm | 753 nm |
| III | (HL)4 H | 76 nm/51 nm | 40 nm | 583 nm |
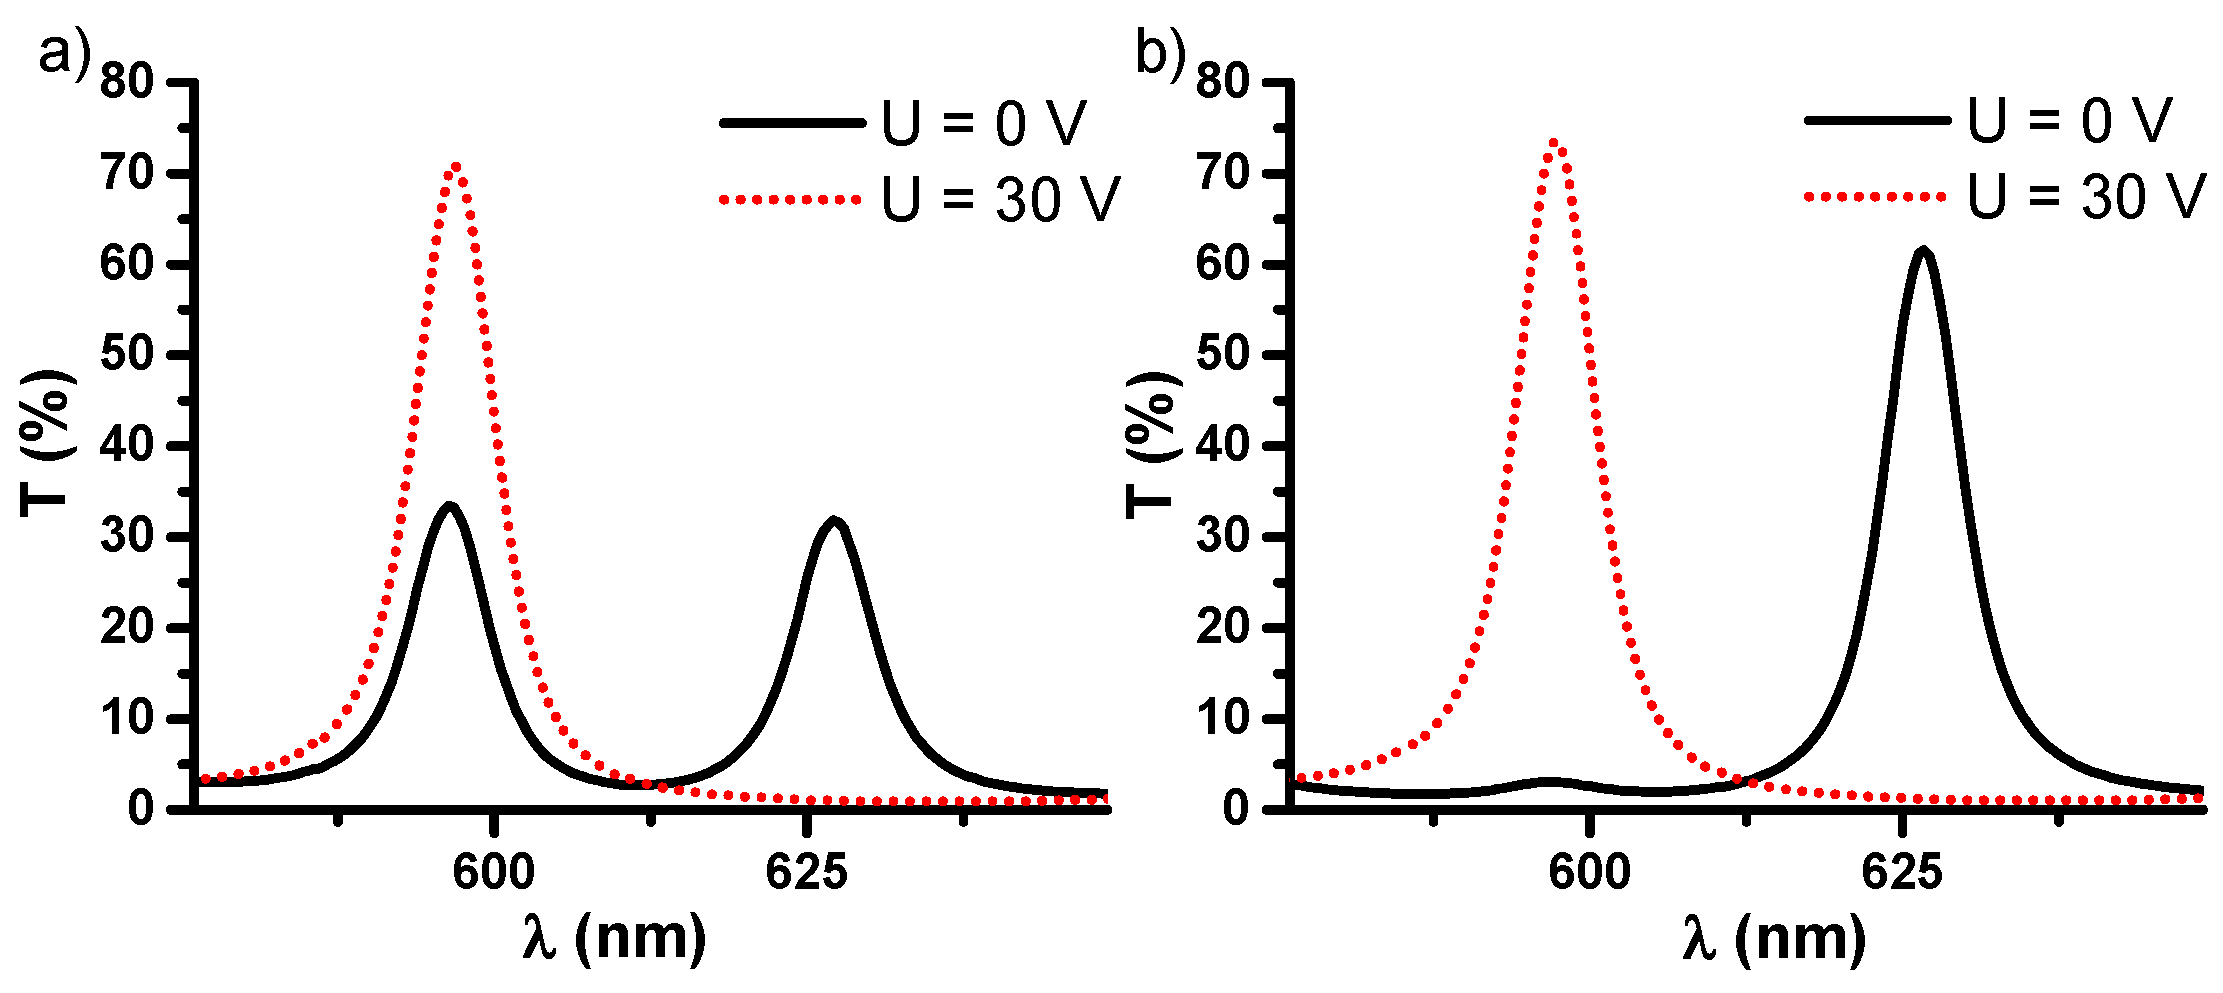
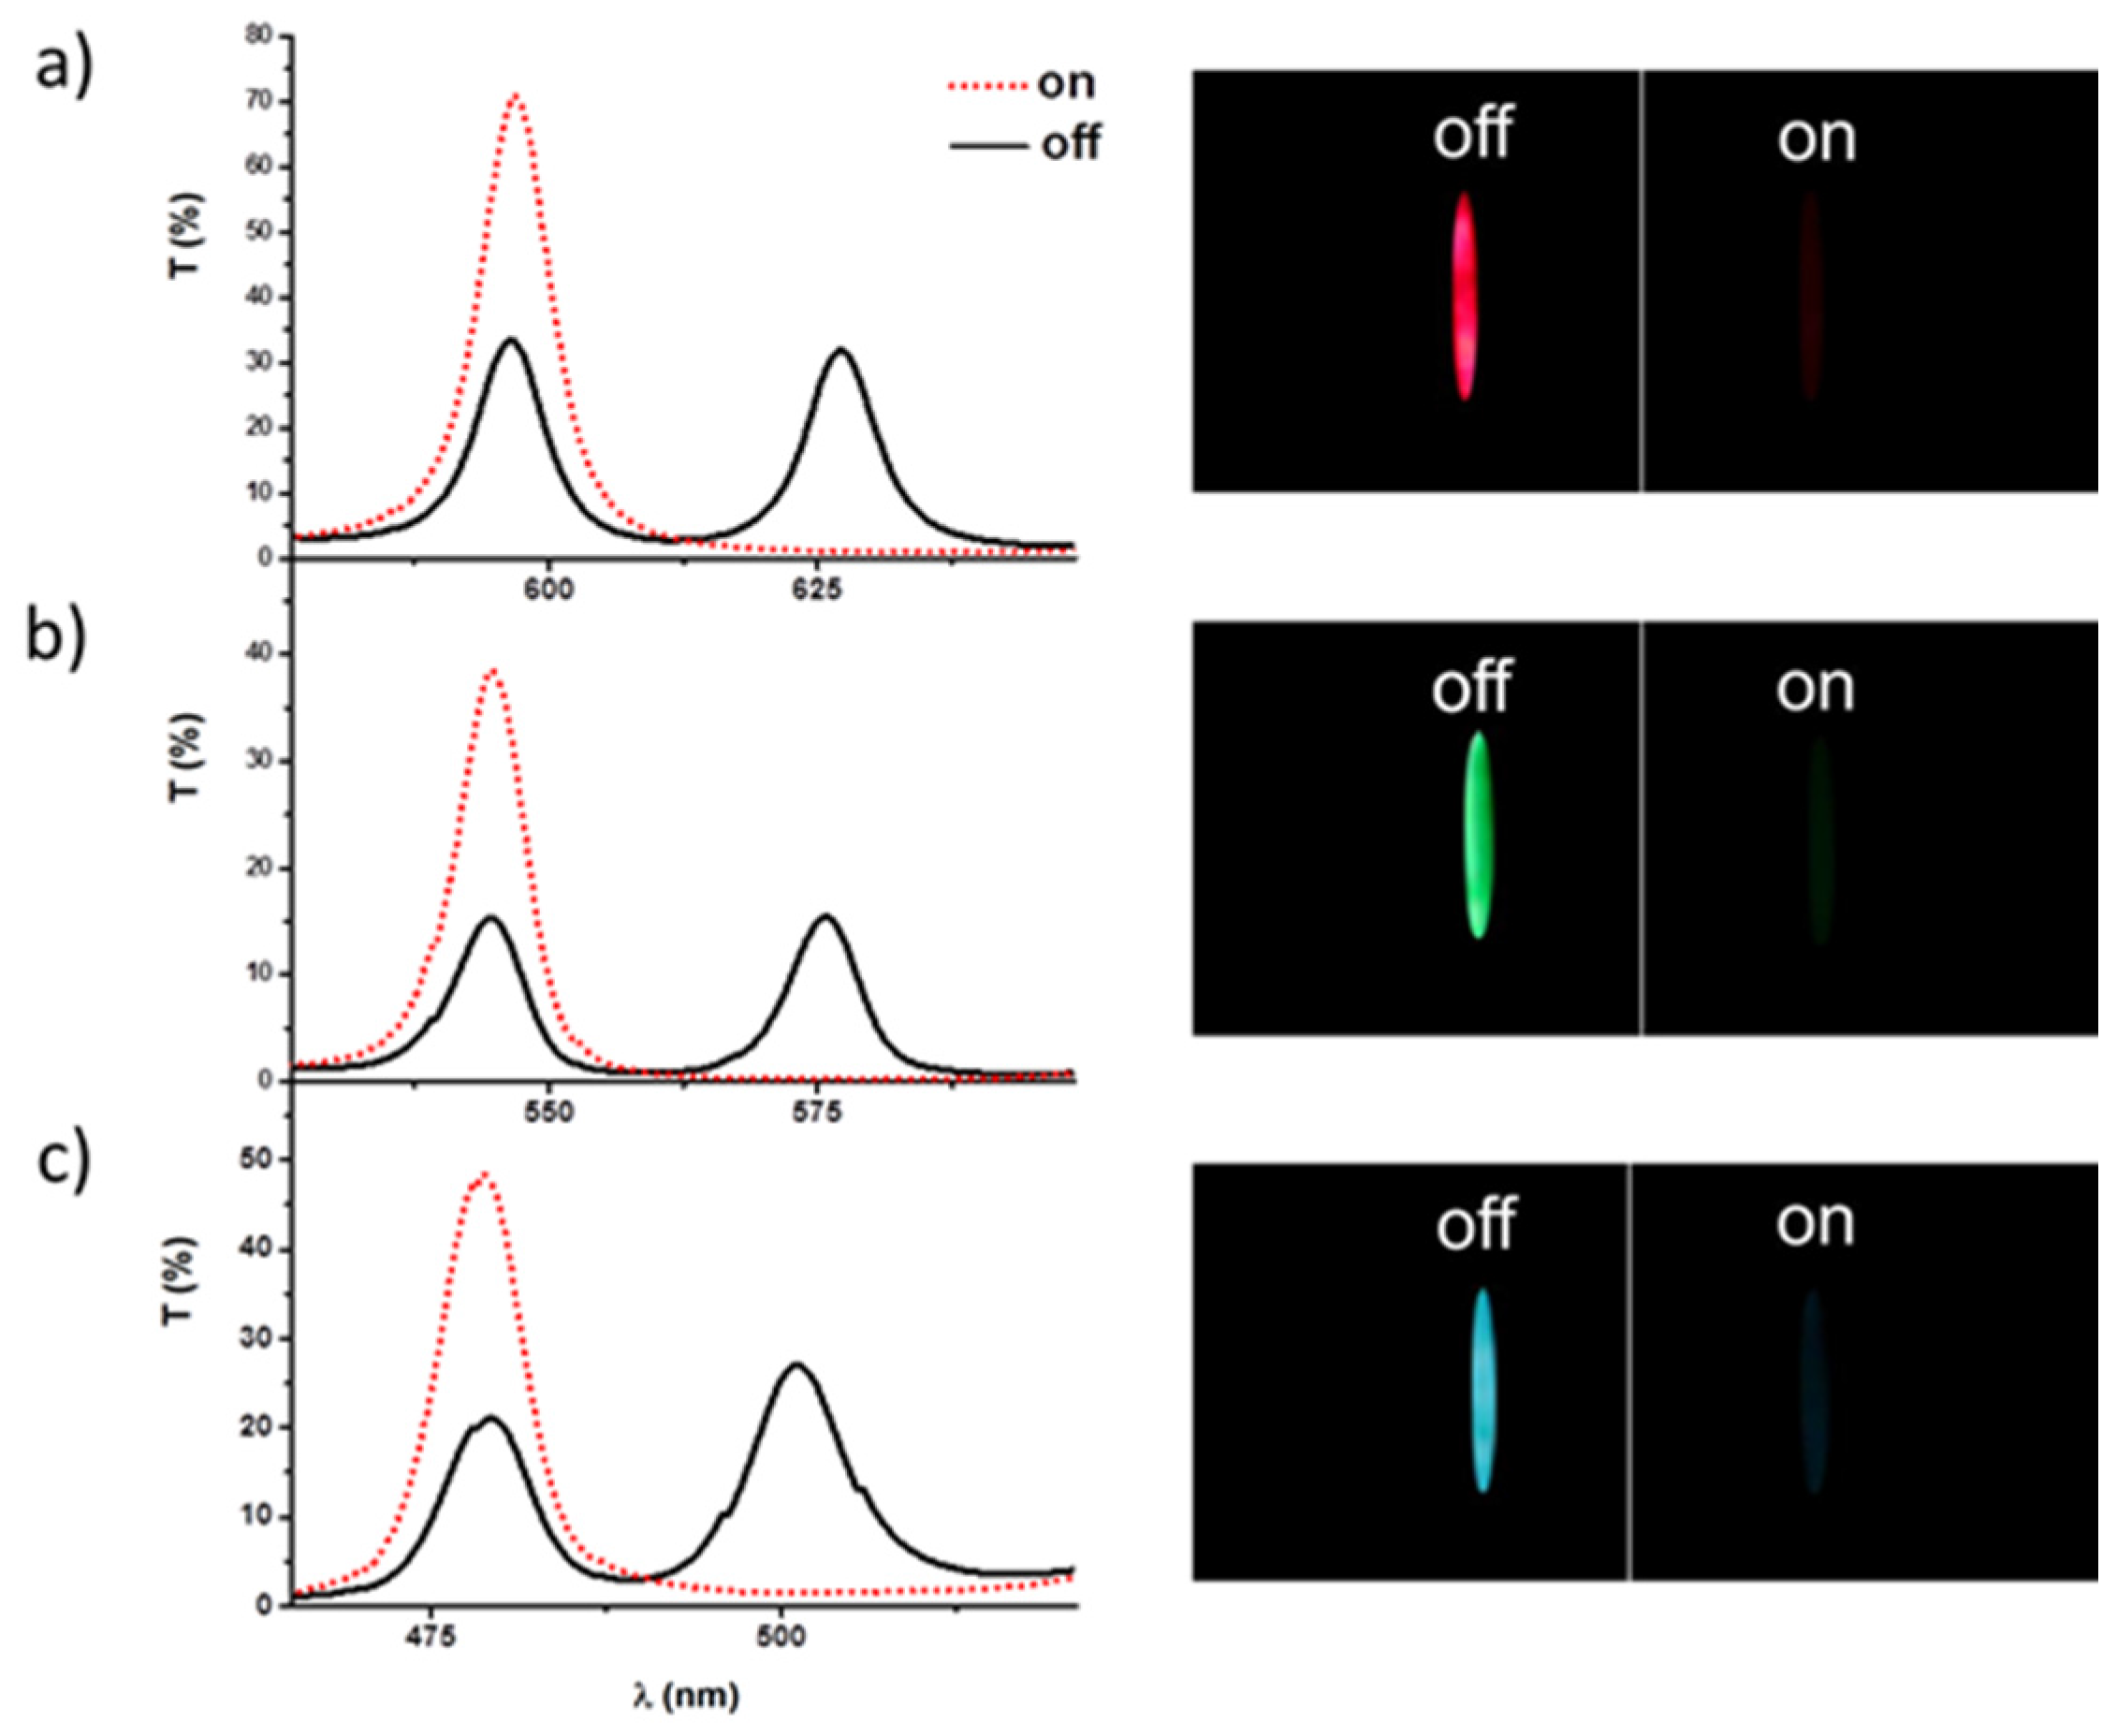
| Device | Switching On-State | Switching Off-State | Switching Times (U = 30 V) | ||
|---|---|---|---|---|---|
| No. | λmax of the 2λ Resonance Peak | λmax of the 2λ Resonance Peaks | ton | toff | |
| I | 597 nm | 596 nm | 627 nm | 0.11 ms | 1.1 ms |
| II | 545 nm | 544 nm | 576 nm | 0.11 ms | 1.1 ms |
| III | 479 nm | 479 nm | 501 nm | 0.10 ms | 1.1 ms |
© 2017 by the authors. Licensee MDPI, Basel, Switzerland. This article is an open access article distributed under the terms and conditions of the Creative Commons Attribution (CC BY) license ( http://creativecommons.org/licenses/by/4.0/).
Share and Cite
Barré, R.D.l.; Bartmann, R.; Jurk, S.; Kuhlmey, M.; Duckstein, B.; Seeboth, A.; Lötzsch, D.; Rabe, C.; Frach, P.; Bartzsch, H.; et al. Time-Sequential Working Wavelength-Selective Filter for Flat Autostereoscopic Displays. Appl. Sci. 2017, 7, 194. https://0-doi-org.brum.beds.ac.uk/10.3390/app7020194
Barré RDl, Bartmann R, Jurk S, Kuhlmey M, Duckstein B, Seeboth A, Lötzsch D, Rabe C, Frach P, Bartzsch H, et al. Time-Sequential Working Wavelength-Selective Filter for Flat Autostereoscopic Displays. Applied Sciences. 2017; 7(2):194. https://0-doi-org.brum.beds.ac.uk/10.3390/app7020194
Chicago/Turabian StyleBarré, René De la, Roland Bartmann, Silvio Jurk, Mathias Kuhlmey, Bernd Duckstein, Arno Seeboth, Detlef Lötzsch, Christian Rabe, Peter Frach, Hagen Bartzsch, and et al. 2017. "Time-Sequential Working Wavelength-Selective Filter for Flat Autostereoscopic Displays" Applied Sciences 7, no. 2: 194. https://0-doi-org.brum.beds.ac.uk/10.3390/app7020194