Article

Question-Driven Methodology for Analyzing Emergency Room Processes Using Process Mining

1
Computer Science Department, School of Engineering, Pontificia Universidad Católica de Chile, Santiago 8320000, Chile
2
Internal Medicine Department, School of Medicine, Pontificia Universidad Católica de Chile, Santiago 8320000, Chile
3
Department of Biomedical Informatics and Medical Education, School of Medicine, University of Washington, Seattle, WA 98109, USA
4
Instituto Universitario de las Tecnologías de la Información y de las Comunicaciones (ITACA), Universitat Politécnica de València, Valencia 46022, Spain
5
Unidad Mixta de Reingeniería de Procesos Sociosanitarios (eRPSS), Instituto de Investigación Sanitaria del Hospital Universitario y Politecnico La Fe, Bulevar Sur S/N, Valencia 46026, Spain
*
Author to whom correspondence should be addressed.
Submission received: 30 January 2017 / Revised: 7 March 2017 / Accepted: 15 March 2017 / Published: 21 March 2017
(This article belongs to the Special Issue Smart Healthcare)

Abstract

:
In order to improve the efficiency and effectiveness of Emergency Rooms (ER), it is important to provide answers to frequently-posed questions regarding all relevant processes executed therein. Process mining provides different techniques and tools that help to obtain insights into the analyzed processes and help to answer these questions. However, ER experts require certain guidelines in order to carry out process mining effectively. This article proposes a number of solutions, including a classification of the frequently-posed questions about ER processes, a data reference model to guide the extraction of data from the information systems that support these processes and a question-driven methodology specific for ER. The applicability of the latter is illustrated by means of a case study of an ER service in Chile, in which ER experts were able to obtain a better understanding of how they were dealing with episodes related to specific pathologies, triage severity and patient discharge destinations.

1. Introduction

The Emergency Room (ER) has become one of the most significant first-contact points with the healthcare system [1]. ER must provide the required services to screen, examine and provide care to patients in the most effective way. This has led to increased efforts to improve the service levels, to reduce overcrowding and to provide prompt and efficient care [2]. With these efforts comes a series of questions about what is the best way to make this happen, especially about how to improve ER processes. Based on the knowledge and use of historical information related to process execution within ER, it is possible to provide answers to a number of questions frequently posed by experts in the field. Examples of frequently-posed questions in the ER field include: What exactly generates the bottlenecks that lead to increased waiting times? What do cases in which patients have to endure long waiting times have in common? Are patients being attended to in line with established protocols? Why are there delays in the hospitalization of patients? In the past, multiple techniques have been used in order to provide answers to such questions, as well as to obtain further knowledge about ER processes, such as business process redesign [3], evidence-based medicine [4,5] and lean [6], among others.
Our approach centers on the use of process mining as the main component for responding to the questions posed by the experts. Process mining is a relatively young research discipline that focuses on extracting knowledge from data generated and stored in the databases of (corporate) information systems; in this case, the Hospital Information Systems (HIS). In turn, process execution data are extracted as event logs. An event log can be viewed as a set of traces (also known as cases, or in the emergency room, episodes), each containing all of the activities executed for a particular process instance. Process mining has been applied to Healthcare (HC) in the past, giving rise to a number of significant advantages [7]. For example, it helps to identify and to understand which process is followed in a specific medical procedure (e.g., during surgery [8,9], cardiovascular disease management [10] or during the treatment of cancer patients [11]); it helps to clarify the social relationships between the actors involved in the process (e.g., task delegation or collaboration patterns [12]); and it enables experts to verify levels of compliance with internal or external guidelines [13]. However, since process mining is an emerging discipline, there are still a number of limitations to its application, including the limited implementation of HIS that are process aware and that record event logs, as well as the difficulties involved in data extraction, the limited interpretation of data to respond to questions frequently posed by experts, the lack of methods for responding to the questions and the high dependence of experts on the process mining discipline, among others [7].
Previously, data from ER have been used to conduct three case studies that involve the application of process mining [14,15,16]. The case studies have provided information regarding the flow of executed activities (e.g., triage and examinations carried out), the relationships between available resources and the identification of opportunities to reduce waiting times for treatment.
In the first case study, undertaken in Portugal [14], a methodology was proposed, through the use of clustering techniques, to help generate simple process models. The models provide insight into the control flow of healthcare processes, their performance and their adherence to institutional guidelines. The methodology provides a series of steps, which should be followed. However, the methodology is not specific for ER, it depends on clustering techniques, and it fails to provide solutions to ER data management. Furthermore, its implementation relates to a suite that is specific to the needs of the particular hospital in which the study was conducted.
The second case was an exploratory study undertaken using data from ER processes from four hospitals in Australia [15]. It identified the process from each respective hospital and subsequently compared the results, highlighting the areas in which processes were executed differently. As part of this comparative study, the steps followed for the creation of the event logs used were described. However, it failed to generate either a detailed method or one specific for ER that might be reused in other medical centers. Both cases illustrate the problems in dealing with complex and interlaced process models, called spaghetti models, and the need to work closely with experts from both the medical and process mining fields.
The third case [16] refers to a study into the process of pediatric patients with asthma attended to in ER, using a visualization tool developed in a hospital in the United States. This case study identified the process model followed for attending to patients. However, it failed to specify a formal method with which to conduct the study, and it does not detail how the method might be replicated in other areas of ER.
As a result of the literature review conducted [7] and previously undertaken case studies, the need to resolve four important requirements has been identified. First, a methodology based on process mining that provides answers to questions frequently posed by ER experts is needed. An ER expert is a professional that works in ER and has knowledge about how ER processes are performed; some roles that are usually included in this group are physicians, nurses, technicians and administrative resources, among others. Previous case studies have merely defined mechanisms for obtaining simple process models, leaving the inclusion of ER experts in the field as work to be conducted in the future. Second, data reference models that represent the data from ER processes are required in order to ensure that data are stored in a structured manner. Such models need to be process-aware and able to facilitate the creation of event logs. Third, there is a need to reduce the spaghetti effect when discovering ER process models, through the use of a methodology that is driven by specific ER questions. Finally, the fourth is the need to establish methods to apply process mining and data analysis techniques in flexible environments, such as the emergency room.
To fulfill these four requirements a methodology is proposed. This methodology uses both process mining and data analysis techniques, to provide answers to the questions frequently posed by experts, using the data stored in a process-oriented data reference model. The methodology will provide the guide, the data reference model will provide the data structures, and the frequently posed questions will help reduce the spaghetti effect.
ER processes are intrinsically flexible, since they must adapt to the particular characteristics of each patient. This flexible nature is evidenced through the presence of typical and atypical behavior in the ER [17]. However, there have been attempts to establish certain guidelines on how to treat patients, for example by creating guidelines to address specific diagnoses [18]. Our methodology deals with the flexible nature of the ER processes by identifying Frequently-Posed Questions (FPQs) that will guide the different stages of the methodology: which data must be extracted, the data model to be used, the building of the event log and the analysis to be performed. Moreover, episode filtering will help to reduce the event logs to only include the behavior that is desired to be studied for each FPQ.
The structure of the article is as follows: Section 2 defines the questions frequently posed by experts in ER. Section 3 describes the proposed methodology and the proposed data reference models. Section 4 describes a case study in which the methodology has been put into practice. Section 5 provides a discussion of the results obtained, and the article culminates with the conclusions and future work of the authors in Section 6.

2. Frequently-Posed Questions

Prior to explaining the aforementioned methodology and data reference models, it is necessary to identify the type of questions posed by ER experts regarding the relevant processes. Accordingly, two types of frequently-posed questions can be identified (Figure 1): first, general questions that are established in a generic manner for the executed process; and second, episode-oriented questions that are based on specific ER characteristics and the executed activities.
We have established the general questions in a previous research work [7], based on the experience of ER experts. The general questions involve understanding how patients are attended to, what activities are executed, how long it takes to attend to patients in accordance with the severity of their particular needs, how resources interact and levels of compliance with associated protocols and standards [19,20]. Many of the questions fit directly with different generic approaches that recommend process mining. The approaches relate to process discovery, conformance checking, performance analysis and organizational analysis, as defined in the process mining literature [19]. Process discovery is directly related to describing the control flow in which process activities are performed by means of a process model. Diverse algorithms, such as heuristic miner or genetic miner, can be used to create a process model from an event log. An example of this type of question is as follows: What is the process (or how are the activities executed) for treating patients with different diagnoses, for example patients with appendicitis or pneumonia? Conformance checking is based on comparing a process model with an event log to verify whether the process is executed in accordance with that model. An example of this type of question is as follows: Are internal protocols being followed in the care provided in the ER? Performance analysis is based on the analysis of the execution times of specific activities, subprocesses or the complete process. An example of this type of question is as follows: What are the activities that increase the episode duration in the ER for patients over 60 years? Finally, organizational analysis is based on discovering the relationships between the resources that execute the tasks included in the event log, by means of social analysis metrics (e.g., “handover of work” or “doing similar tasks”). An example of this type of question is as follows: What is the type of interaction between doctors and nurses during patient care in the emergency room?
The episode-oriented questions are based on certain clinical characteristics or data obtained when executing the process activities that are specific to ER, for example the color of the triage or the discharge destination of a patient. The questions were obtained from gauging the genuine needs of the ER experts regarding their processes, by means of interviews, literature reviews and the personal ER experience of one of the authors of this article. Three different types have been established, which can be extended to include additional data and activities in order to broaden the analysis, as well as the possible combinations thereof: triage-driven questions, stay duration-driven questions and patient discharge-driven questions.
The triage-driven questions are based on the concept of triage, which relates to the process of evaluating patients arriving at ER in order to prioritize attention in accordance with the urgency of their needs and the services required [2]. There are a number of defined systems that establish color-coded classifications according to the needs of the patient, e.g., the Manchester triage system [21]. The Manchester triage system is a five category triage system based on expert knowledge. It helps the classification of patients according to five different colors (red, orange, yellow, green and blue), regarding the severity of the episode and the immediate need of attention; red being the most severe cases and blue being the least [21]. Generally, this task is executed by a nurse. It involves gaining an understanding of the needs of the patient and assigning them a color in line with the severity of their condition, for example red for patients in a critical state. Questions relating to this type are those for which the expert requires information regarding certain types of cases, for example: What process is executed for patients who are triaged green? What are the key activities executed for specific diagnoses in which the majority of patients are triaged orange?
The stay duration-oriented questions are based on the time in which the activities are executed for each case. The stay duration of a patient is the total time in which they are attended in the ER. This value might be denoted in units of time, for example two or four hours, or by means of categories according to a short stay (e.g., episodes of less than six hours) or a long stay (e.g., episodes longer than six hours). The duration values for the questions are established by the expert according to their questions. Examples of the questions include: What are the characteristics of episodes that last less than three hours? What is the process executed for attending to long-stay patients?
The ER patient discharge-driven questions are based on the destination of the patient after leaving ER, e.g., if they are formally admitted to the hospital or discharged home. The options can vary according to the characteristics and circumstances of the medical center, for example the ER may not be located in the patient’s preferred hospital, resulting in a request to be moved. In our analysis, the term ‘inpatient’ will be used to refer to a patient admitted to the hospital following a discharge from ER, whereas ‘outpatient’ will be used to refer to an ER patient who was sent home. Examples of questions include: What are the clinical characteristics and activities executed during the episodes in which patients are hospitalized? What process is followed for attending to patients that are discharged and sent home?
In addition, compound questions can be detected from several characteristics of the episodes, combining triage, stay duration and patient discharge. For example: What activities are undertaken for patients who are triaged green, have a long stay in ER and whose final destination is to be admitted to the hospital? What characterizes the process followed by short-stay patients, who are triaged yellow or green, and sent home? What process is followed by long-stay patients who are triaged orange? Are there cases in which a patient who is triaged red is sent home? Furthermore, there are additional medical and demographic data that can be used to identify new categories of questions according to the analysis required in ER. For example, other categories may include different types of diagnoses, the resources involved, the physical infrastructure and the age and gender of the patients.
In addition to conducting an analysis led by each of the categories separately, they can be combined to obtain more specific and in-depth results, according to the requirements of the frequently-posed question. For example, those that attempt to describe the process (process discovery) that relate to red or orange category episodes (triage-driven questions) or those that require verification regarding whether they comply with existing regulations or protocols (conformance checking) in long-stay episodes (stay duration oriented questions). As the level of specificity of the question increases, the required level of combination between the categories also increases in order to produce the correct answer. Understanding the frequently-posed questions and their categories can help to produce both a data extraction guide and a methodology for the application of data and process analysis.

3. Methods

This section outlines a proposal for a data reference model for ER and its accompanying methodology. In conjunction, they provide the necessary tools to guide the search for answers to the frequently-posed questions by ER experts. The proposed methodology is evaluated in a case study in Section 4.

3.1. Data Reference Model for ER

This section provides information on how to build a data model, in order to apply process mining techniques to answer FPQs. First the data sources are discussed, followed by the definition of a data model for ER data.

3.1.1. Data Sources

Data from ER processes are stored in Hospital Information Systems (HIS), i.e., information systems designed to manage all aspects of a hospital’s operation, including its medical, administrative, financial and legal issues, and the corresponding processing of services. As in general healthcare, the architecture of HIS in ER can be as follows: integrated [14], in which all data are in the same system; distributed [22], in which a specific system provides support for episodes; and the remaining data, such as medication data or medical staff data, are stored on different systems; or any intermediate point between the two extreme cases. Data extraction is challenging because the systems have heterogeneous architectures, including legacy systems developed ad hoc for the needs of each particular hospital. The disadvantage of the systems and repositories is that, despite them being able to store large quantities of data, they are not geared towards recording information regarding processes, which in turn, results in great difficulty when analyzing hospital processes. Accordingly and based on the concept of integrated HIS, we propose a data reference model that allows data to be stored and used for analysis on the process perspective.

3.1.2. Data Reference Model

Data reference models are common across a wide range of areas [23]. For example, in [20,
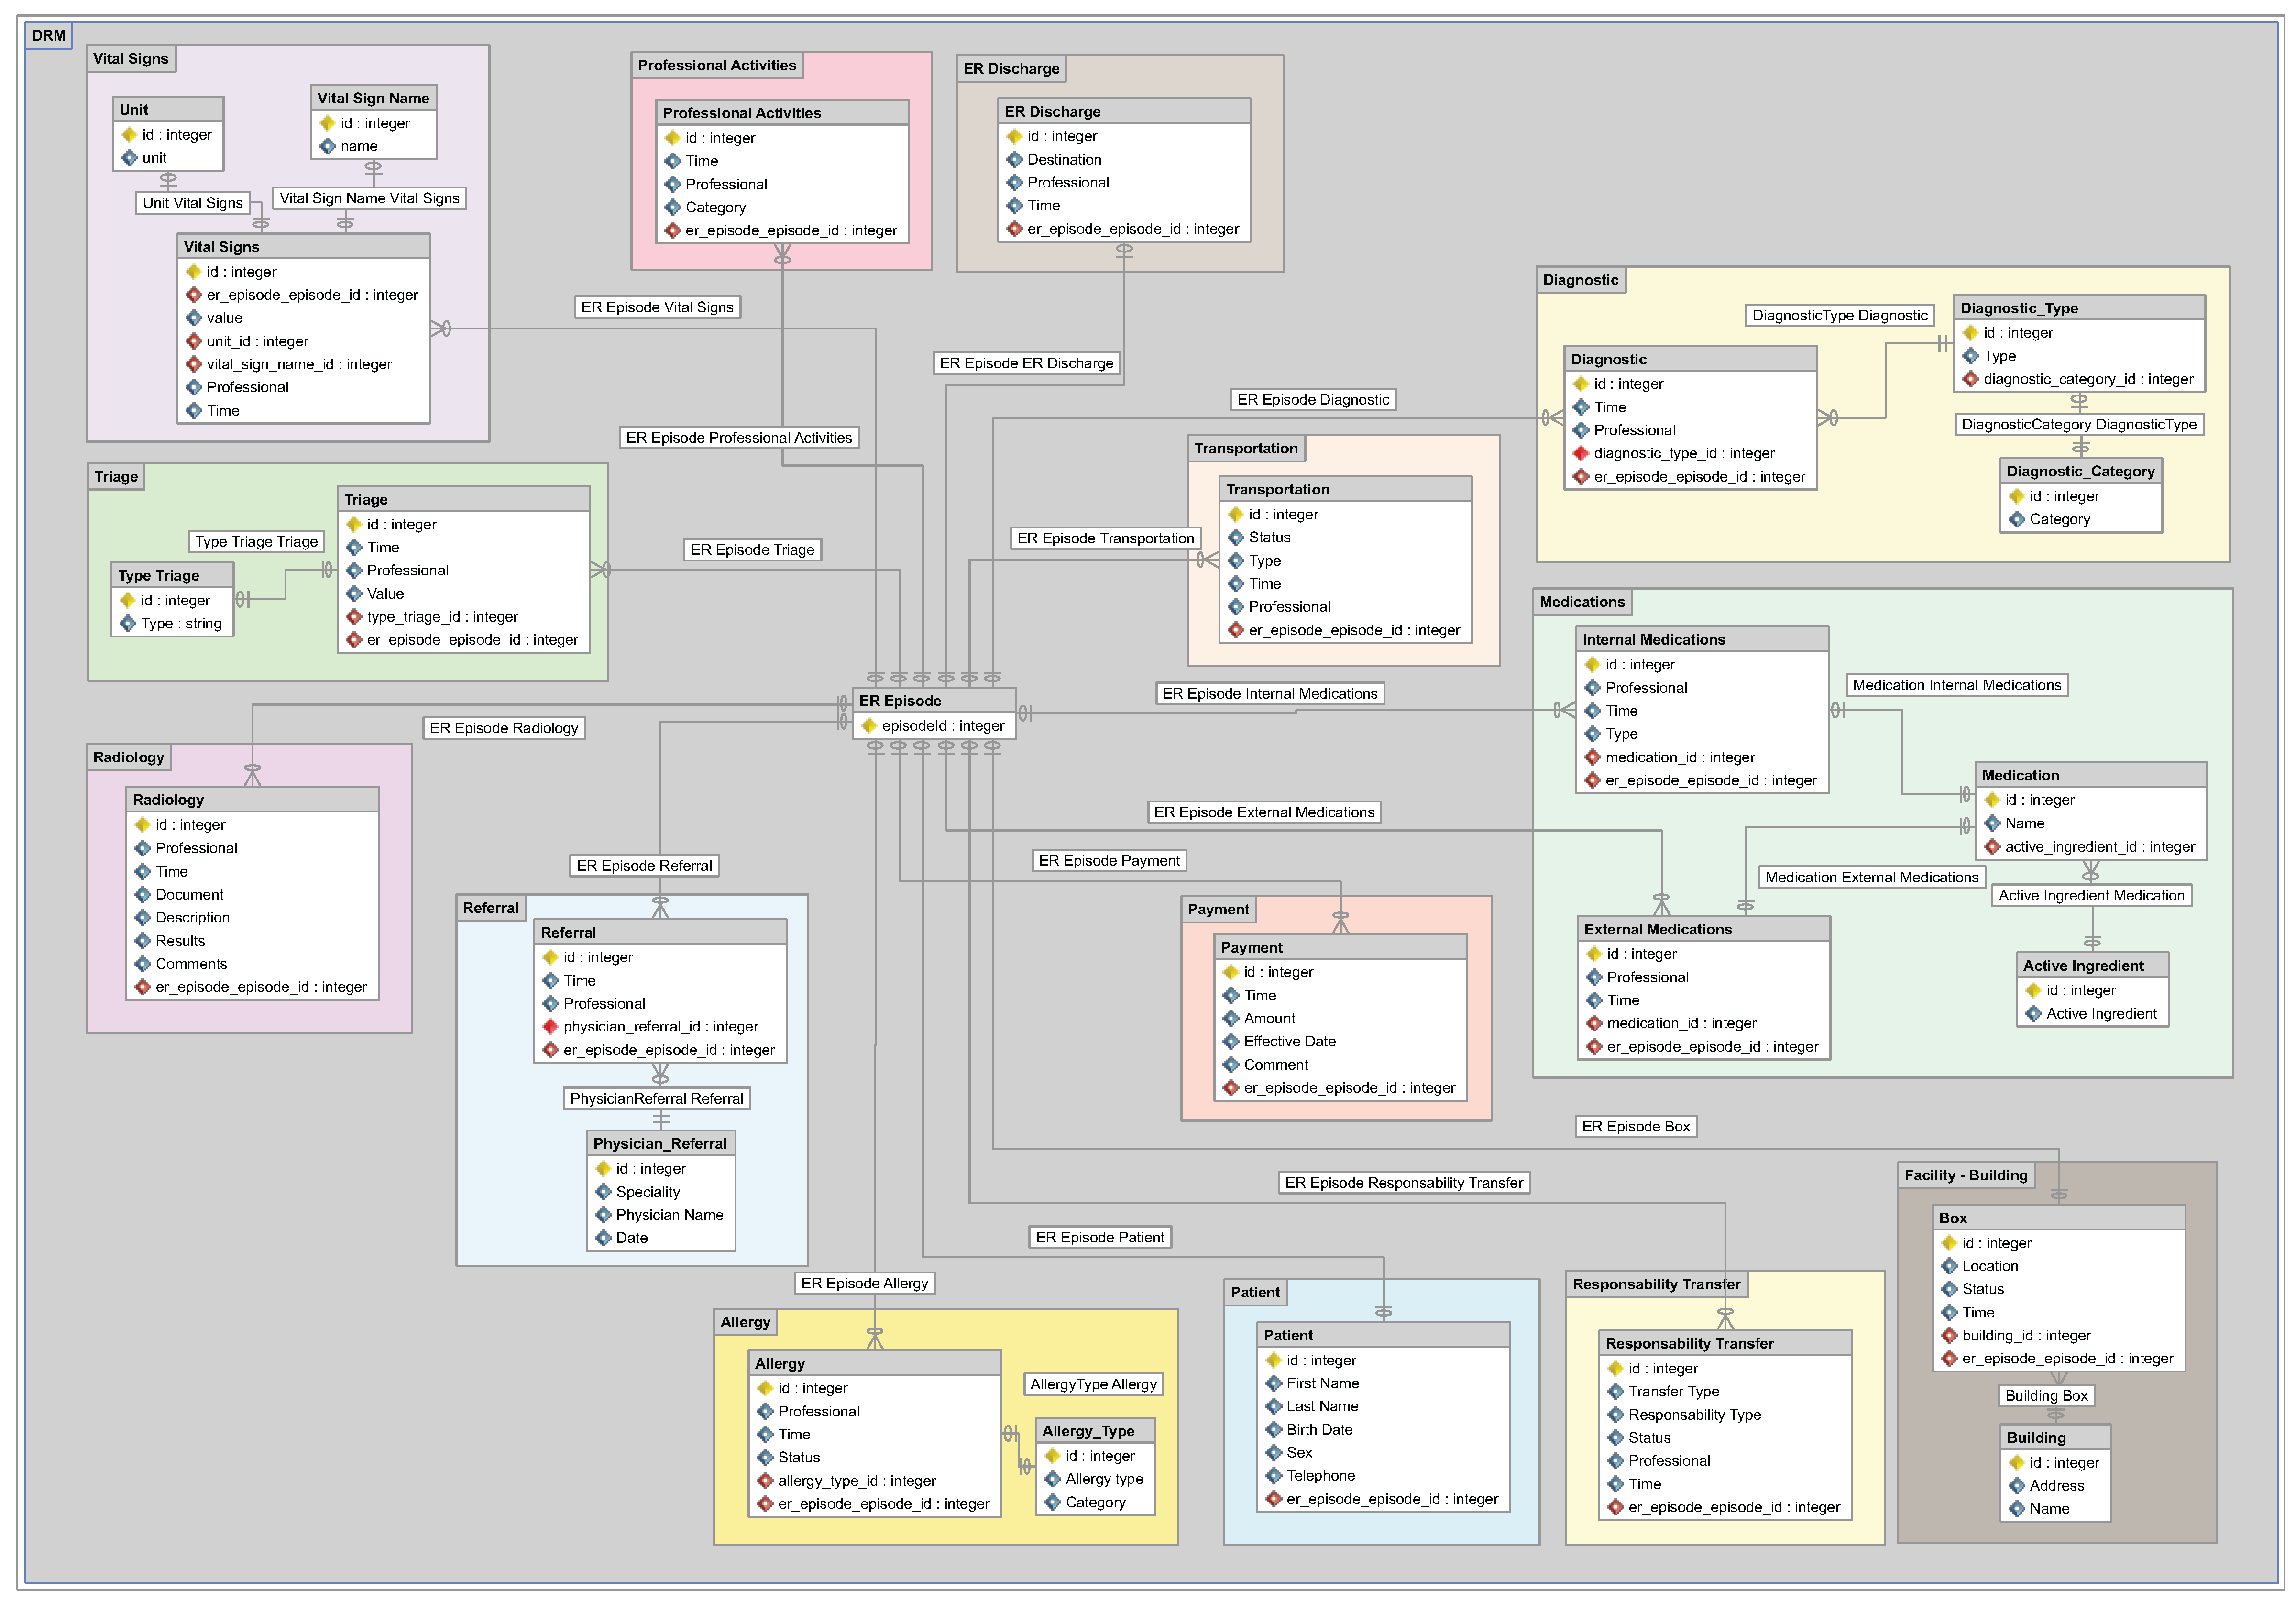
23], the authors propose a general model for HC. However, a model for ER has not yet been proposed. The ER model proposed in this section, as shown in Figure 2, extends the aforementioned HC model, including specific dimensions of ER, such as consultation rooms (boxes) or triage, obtained from the analysis of previous ER case studies and information provided by ER experts. The data model proposed for ER is a model that specifies the data structures and their relationships for representing ER episodes. The data types included in the proposed data reference model were defined or identified from the original HC model and from the HIS studied during the case study. The model does not aim to fit any specific system, but rather to provide a framework that represents, in a generic manner, the data extracted from any ER system.
The proposed data reference model is designed to contain all of the data required to answer any FPQs about ER processes using data mining and process mining techniques. However, not all data are necessary for all questions. In fact, having all data is unusual in real scenarios. Therefore, at the moment of creating the actual data model, we should try to include as much information available as possible, according to the reference data model, but we must be aware that not all data will be available. Then, at the moment of addressing one of the FPQs, we should check whether the available data are sufficient to answer the question.
The data reference model consists of 15 data types used in ER linked by an episode ID. The episode ID is an identification number unique for each episode, in which each episode may be linked to the following: only one patient, one or more payments and zero or more values in the remaining data types. It should be noted that this model can be extended with additional data, which is not included herein, according to the specific characteristics of each ER.
The proposed data reference model retains certain data structures, extends others and adds new ones that are specific to ER. It retains the data structures for payment, patient, referral and radiology, since they already relate to activities generally carried out in all medical centers. It extends the data structures for transportation, internal medication, external medication and facility or building, including additional information, such as the status of a particular transportation, the active ingredient for a medication or information about each consultation room (box) of the ER facility. Finally, the model includes new general structures for all hospital facilities, as well as ones specific to ER. The new structures relate to vital signs, responsibility transfer, detailed professional activity, allergy, diagnosis, triage and ER discharge. Of the included dimensions, those specific to ER are the following: data from the consultation room (box) that form part of the facilities or buildings, triage data and data from the final ER discharge.

3.2. New Methodology

This section proposes a methodology based on process mining to analyze ER processes. The methodology is based on the guidelines for process mining projects proposed in [19] and has adapted them to be question driven.
The proposed methodology deals with the flexible nature of ER processes as follows:
-
FPQs are established. For each of them, it is possible to identify from the beginning the data in which the analysis should be focused.
-
From these data, an event log is extracted that includes only the information required for the analysis of the selected FPQ.
-
A list of ad hoc methods is provided to address each FPQ.
-
The process can be decomposed into subprocesses, and episodes can be clustered in groups that can be analyzed independently, allowing more comprehensible models to be obtained.
-
Moreover, process mining provides a set of tools to deal with unstructured processes: trace clustering gathers episodes into similar groups; identifying more frequent variants of how the process can be performed; and the ability of process mining algorithms, such as fuzzy miner or the one used by Disco, to ignore less frequent behaviors [19].
The proposed methodology is intended to guide a team formed by a domain expert and a process mining expert, so that they have a clear roadmap of how to apply process mining to analysis ER processes. The domain expert contributes with his/her knowledge about and insights about how ER processes are performed. The process mining expert contributes with his/her understanding of how to use the process mining techniques and how to correctly interpret their results.
The methodology consists of six stages (as shown in Figure 3), as follows: (1) extracting data from HIS; (2) creating an event log (main input for process mining techniques) based on the FPQ; (3) filtering the log for any given clinical context; (4) applying data analysis; (5) applying process mining (PM) techniques; and (6) analyzing the results with the experts. Each of the stages is explained below:

Stage 1. Data extraction:

The first stage is to identify the data, extract it from the sources, build a data model, check the presence of timestamps, name the events or activities, create any specific fields and verify the quality of the extracted data. Table 1 sums up the main activities of this stage and provides a series of guidelines to be considered during this stage.

Activity 1.1. Identify available data in HIS and build the data model:

The data may be centralized in a single HIS or distributed across different information systems. A data model should be constructed, based on the reference model proposed in Section 3.1.2, while always identifying each episode with a unique episode ID. Storing data based on a data reference model facilitates data extraction and the use thereof when answering the questions of the experts. It is important at this point to bear in mind a number of challenges when constructing the data reference model, as the quality of the data is not usually optimal, and actions are required as a result.

Activity 1.2. Ensure the availability of a timestamp for each event:

The first challenge is to ensure that a timestamp is present for each event of an episode. Each timestamp shows the moment in which a relevant event takes place. In addition to verifying the presence of a timestamp, the granularity of the timestamp must also be checked, since some timestamps have a high degree of accuracy (e.g., with a precision up to seconds), whereas others have a low level of accuracy (e.g., with a precision up to hours). As a result, it is necessary to decide the desired level in order to conduct the analysis. Ideally, the timestamp with the highest level of accuracy will be used. If different levels of accuracy are present, the highest one present in all of the data is recommended, just to have the same level across all of the examined data. If some data do not have a timestamp, they cannot be used for the analysis. Check that for each event or activity included in the data model, a correct timestamp is included. This will allow the use of the event or activity in the desired analysis.

Activity 1.3. Name events:

The second challenge is to decide the explicit name used to identify each of the activities included in the event log. In the reference models, data structures are identified for each of the activities undertaken. However, at the precise moment of creating the event log, it is necessary to define a particular name for each of them, in case they do not have one already established. For example, if we decide to include the events outlined in the vital signs data structure, each event must have a particular name, such as “record vital signs” or “taking vital signs”. In case any activity or event does not have an appropriate name, one should be assigned to it. The name should be establish according to the knowledge of the domain and taking into consideration the ER expert.

Activity 1.4. Create specific-fields:

Create specific fields based on the required needs. According to the available data and their level of granularity, we can build specific fields to help us through the analysis. This may involve grouping activities into subprocesses or splitting activities into more specific ones, in order to obtain more details of the process. This can be done manually or automatically according to the information provided by the domain expert. Specific fields may be significant for a specific analysis, but not for another, so this task may not apply to all FPQ.

Activity 1.5. Verify data quality:

In addition to the explained challenges, further general issues have been identified from the literature review that must be tackled when generating an event log for process mining purposes in healthcare.
Some of the most significant ones that should be studied and considered are:
  • The definition of 11 patterns that describe the event log quality issues, such as incorrect inputs from UI forms, incorrect time stamps, incorrect format of the data, missing episode IDs related to the characteristics, missing events or activities, repeated events, and others. They should be considered when extracting, building a data reference model and generating an event log. More details can be found in [24].
  • The identification of 27 quality issues regarding the quality of the event log, classified into 4 categories, including process characteristics (amount of data, different types of traces and event granularity) and the quality of the event log (missing, imprecise, incorrect and irrelevant data). The details of the 27 quality issues are described in [20,25].
If the data contain incorrect or inaccurate values, they should be verified and checked with the HIS data owners to see if they are useful or not. If the data can be fixed by the experts to obtain the correct values, they still can be used. In case this is not reliable, the data should not be included in the analysis. It is important to overcome these challenges in the first stage, since it is in this stage that the data model is constructed. This model will facilitate data extraction and filtering processes for the subsequent stage of creating the event log.

Stage 2. Event log creation:

The event log creation stage considers the FPQ, establishes a specific data model and builds an event log to use in the following stages. Table 2 sums up the main activities of this stage and provides a series of guidelines to be considered during this stage.

Activity 2.1. Identify data required to perform the specific analysis:

Identify the FPQ to be answered and identify what data from the general data model will be used. These data must be extracted to a specific data model for the question, where all of the required data are stored and from where the event log will be built. This specific data model may be built in a database for the specific question or just extracted in a temporary way to build the event log. It is expected that this specific data model may be used for several similar questions, but in the long term will be changing according to questions that are addressed.

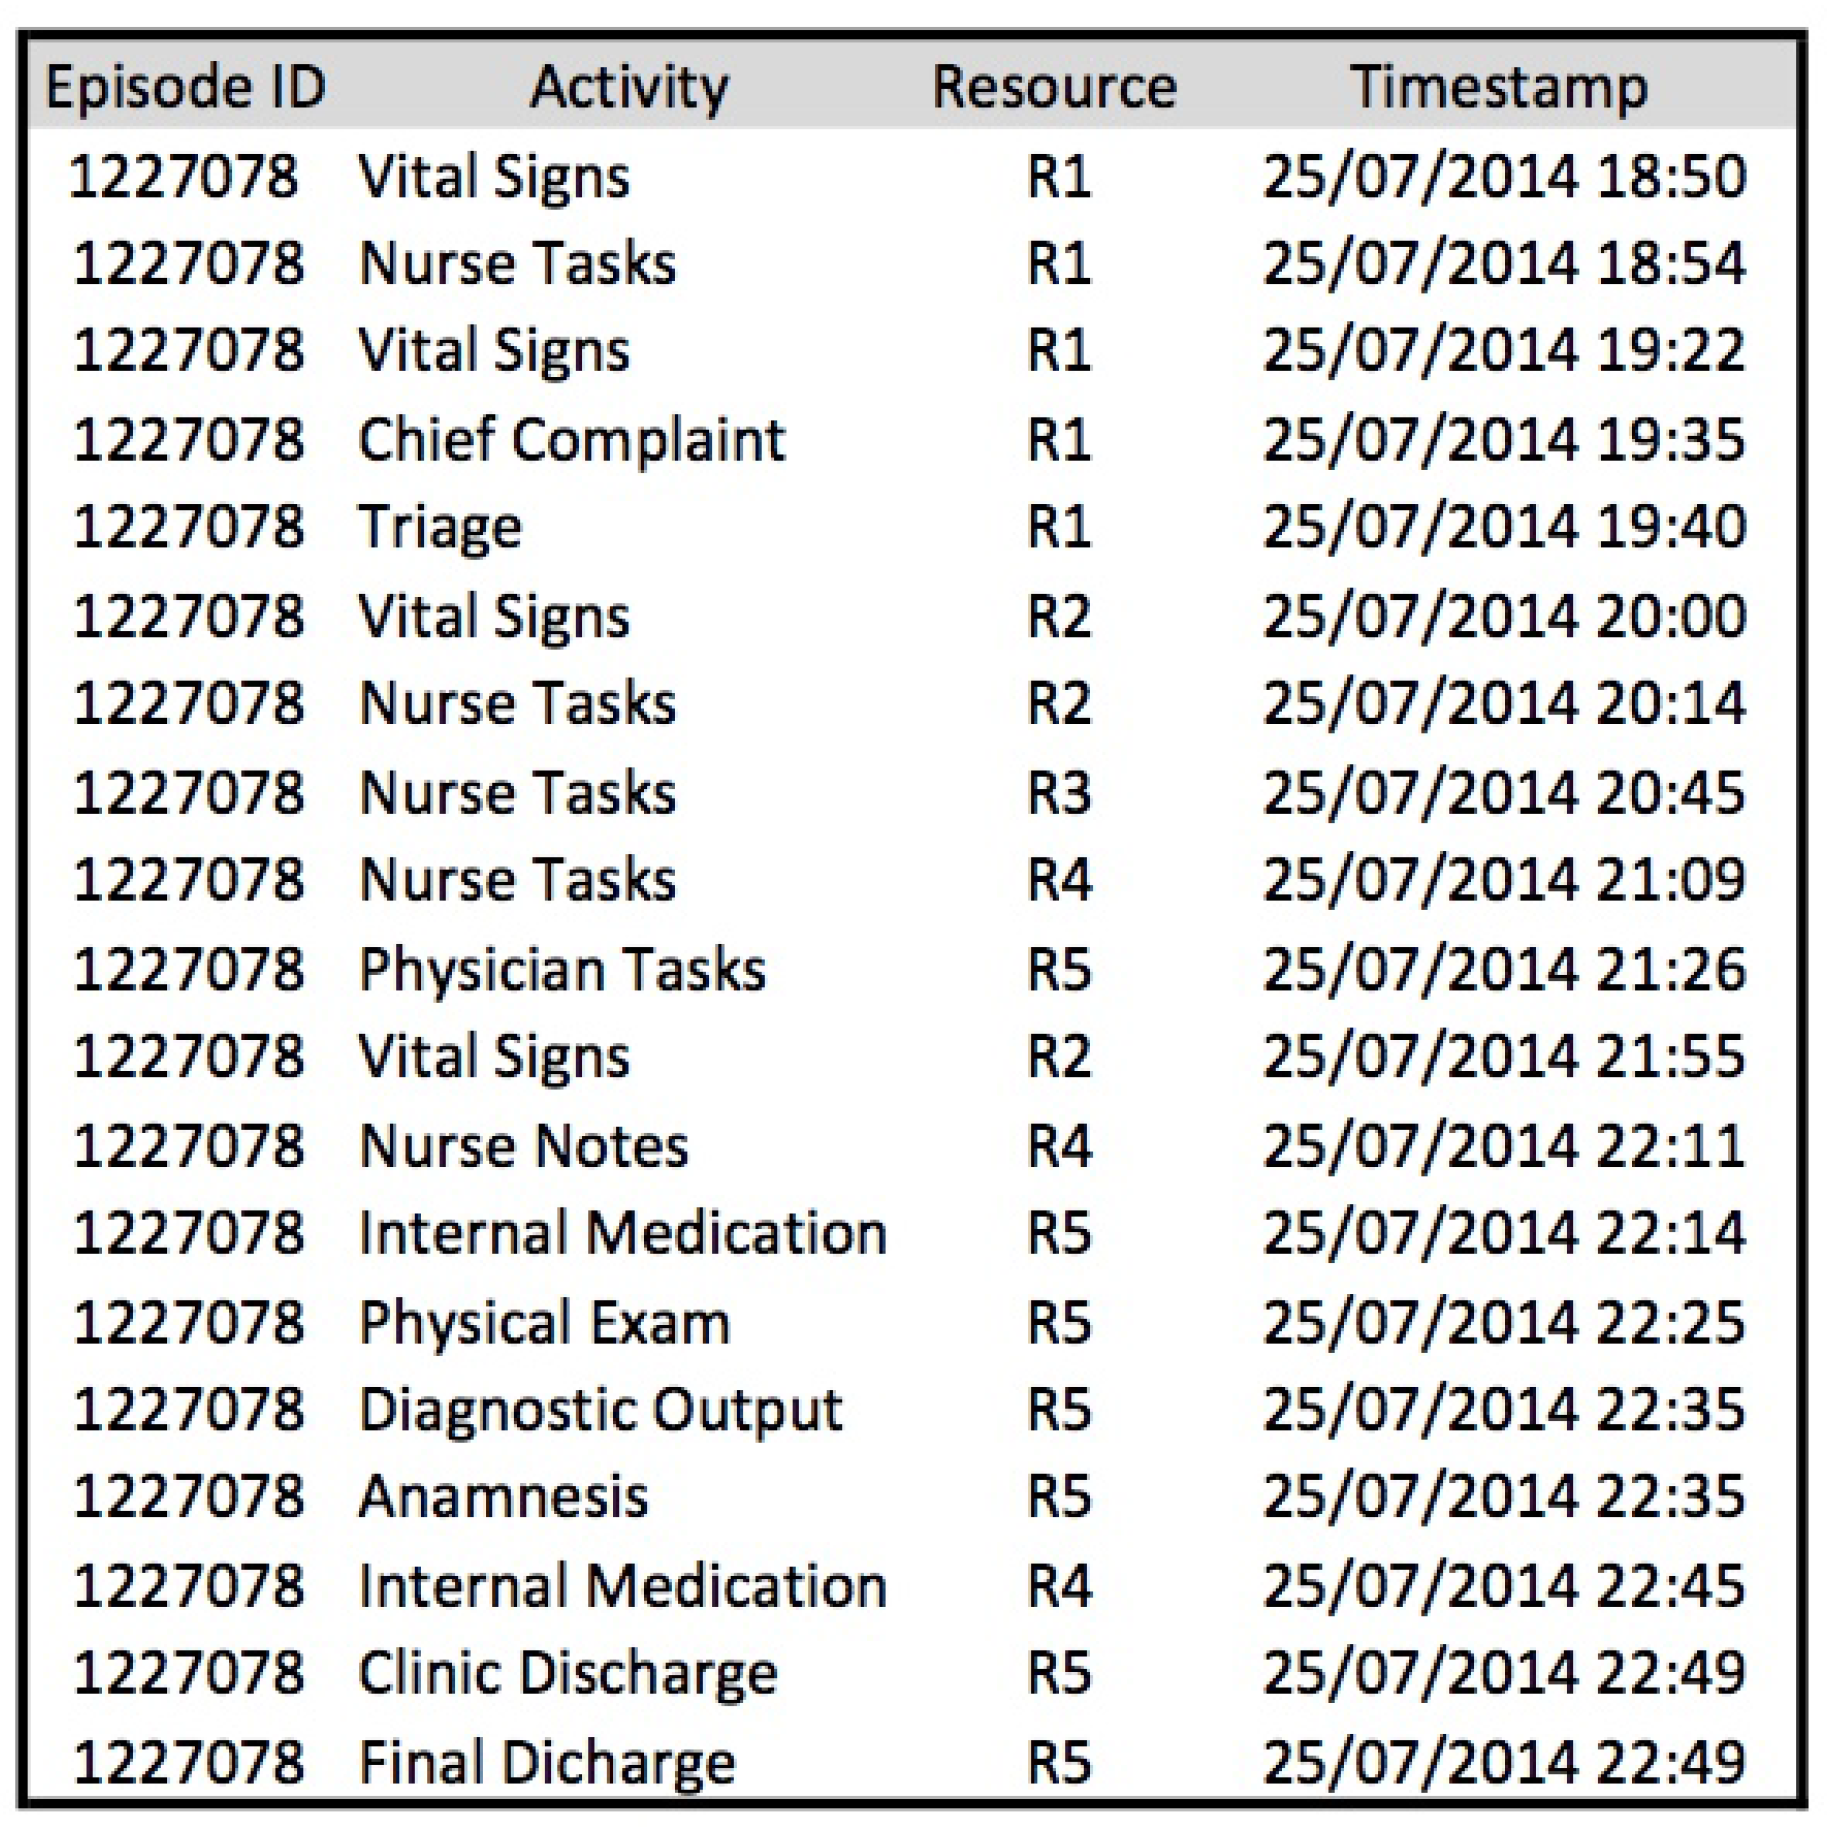
Activity 2.2. Create the event log:

Once the data stored in the specific data reference model are available, a specific event log must be created each time a question requires a response. Every event log is guided by the question that requires an answer. Event logs are the input for all process mining techniques and represent the actual execution of a process. An event log is composed of traces (i.e., process instances or episodes in this context), and each trace is represented by the ordered sequence of events that have occurred during the execution of that particular episode. Each event may contain additional information about its execution, such as its performer.

Activity 2.3. Include specific characteristics for each event or activity according to the specific analysis:

According to the characteristics of the data and the question that requires an answer, certain data types must be included in the event log for later use in the discovery or improvement of the process model. For example, in the case of wanting to discover the executed process, it is necessary to have the executed activities and their timestamps for each episode. In the case of wishing to conduct an organizational analysis, information about the health professionals that execute the activities must be included. In the case of wanting greater detail for certain activities, additional information to complement the activity must be included, for example when the requirement is to understand the characteristics of vital signs, including units of measurement and instruments used. Creating the event log is no trivial task, and it is necessary to undertake the process with due caution in order to include all required information. If such caution is lacking, results may be inaccurate and incorrect, meaning that this stage will have to be revisited at a later moment in order to include all missing data.

Stage 3. Filtering stage:

The filtering log stage consists of generating a specific event log for each question based on the filtering capacity of the different tools. It includes doing an analysis of the desired filters and the execution of them.
Once the event log has been created, data can be filtered according to the requirements of the question that requires an answer. This stage enables the event log to be refined in line with detailed characteristics in accordance with the analysis sought, for example establishing ranges of hours or days, clinical characteristics specific to the episodes or patient type. Undertaking this type of filtering is important since it reduces the quantity of episodes in the event log to those that are strictly necessary. This facilitates the application of the techniques and algorithms and the analysis of the data and models obtained. Normally, filters are included in the tools used to apply the process mining methods or techniques. These filter algorithms work by including/excluding episodes from the event log, based on the characteristics or values established in the filtering criteria options [26,27]. Three types of filtering are outlined: basic filtering, clinical domain filtering and question-driven filtering. Table 3 sums up the main activities of this stage and provides a series of guidelines to be considered during this stage.

Activity 3.1. Basic filtering:

Basic filtering relates to filters that can be applied to any data characteristic, for example filtering by date or time (e.g., data between June and August 2015), filtering by location, clinical facilities or buildings (e.g., only data from the main hospital and not from its branches) and filtering by specific resources (e.g., specialist data or those relating to a specific role), among others.

Activity 3.2. Clinical filtering:

Clinical filtering (based on expert knowledge) relates to filters that can be applied according to the clinical characteristics of the data and which help to specify the data used in an improved manner. Examples of this type of filtering are to filter by diagnostic type (e.g., episodes with a diagnosis of bronchitis or appendicitis) or by medication type (e.g., ibuprofen).

Activity 3.3. Question-driven filtering:

Question-driven filtering relates to the filtering of data according to the characteristics of the question requiring an answer. If a response is required to a question based on triage values, data must be filtered in line with these values. For example, if the question relates to yellow triaged cases, with a diagnosis of bronchitis and with a final discharge to hospital, data must be filtered according to those particular values.

Stage 4. Data analysis stage:

The data analysis stage includes the analysis of data about how the process has been performed, as stored in the different event logs. This stage includes the selection of the data analysis techniques and the corresponding tools and the application of statistical analysis and data mining. Table 4 sums up the main activities of this stage and provides a series of guidelines to be considered during this stage.

Activity 4.1. Select data analysis techniques:

The data analysis stage includes two possible types of analysis: statistical analysis and data mining analysis. These analyses are executed according to the relevant requirements for answering the specific question posed by the experts. There are types of analysis for specific questions in which only an exploratory statistical analysis is needed using tools, such as Excel (products.office.com/en-us/excel) or Disco (fluxicon.com/disco), and questions that require the use of both statistical analysis and data mining tools.
First, it is required to select the analysis techniques based on the expected outcomes. Outcomes may include a graphical model with data and information about the episodes, or an event log clustered into several sub-event logs. Second, it is required to identify the tools that allow one to perform the chosen techniques.

Activity 4.2. Statistical analysis:

Statistical analysis is used to characterize an event log, identifying the frequency of activities, the distribution of cases over time and variants of process execution, among others. It provides a holistic view of the process from a quantitative perspective and acts as a first step to answering any question. No specific algorithms are associated with this analysis; however, it can be performed using a variety of tools. For example, Disco is more process-oriented, while Excel is more data-oriented. Excel can be useful when the size and amount of data are manageable; but more complex big data solutions may be needed when the size grows, and this is not supported by Excel.

Activity 4.3. Data mining analysis:

Data mining analysis relates to the process of discovering different patterns and knowledge on datasets. There are multiple techniques taken from diverse domains that are applied in data mining in order to obtain the desired results, including, for example, visualization techniques, machine learning, classification algorithms and clustering, among others [28]. Data mining helps to ensure, by means of different techniques and algorithms, diverse types of analysis, including, among others: identifying associations between data; data classification; data clustering; prediction of patterns; and so on. Data mining techniques previously used with process mining include the use of decision mining algorithms in Petri nets and decisions trees to determine the routing of different cases [29], the use of clustering techniques and classification analyses to deconstruct different patient cohorts [30], the use of temporal data mining techniques to analyze clinical time series data and search for patterns in them [31] and the use of association rule mining and sequence mining techniques to discover associations between risk factors and specific outcomes [32]. A wide range of commercial and non-commercial tools are available in data mining that enable the application of the aforementioned analyses, including Rapid Miner (rapidminer.com/products/studio), GNUOctave (www.gnu.org/software/octave), Weka (www.cs.waikato.ac.nz/ml/weka), or R (www.r-project.org).

Stage 5. Process mining stage:

The process mining stage includes all of the steps related to the application of process mining techniques and algorithms, including selecting the appropriate tool and identifying and applying the adequate methods. Table 5 sums up the main activities of this stage and provides a series of guidelines to be considered during this stage.

Activity 5.1. Identifying the appropriate tool:

The aim of process mining is to discover, monitor and improve real processes by extracting knowledge from event logs obtained from information systems [19]. There is a wide range of process mining algorithms and techniques available, and both commercial and non-commercial tools with which to implement them, including Disco (fluxicon.com/disco), ProM (promtools.org), CoBeFra (processmining.be/cobefra), PALIA (www.sabien.upv.es/proyectos/investigacion/automatizacion-y-mineria-de-procesos), CELONIS (my.celonis.de) and LANA (lana-labs.com). Four types of process mining analyses are required to provide answers to the questions most frequently posed by ER experts: process discovery; conformance analysis; performance analysis; and organizational analysis.

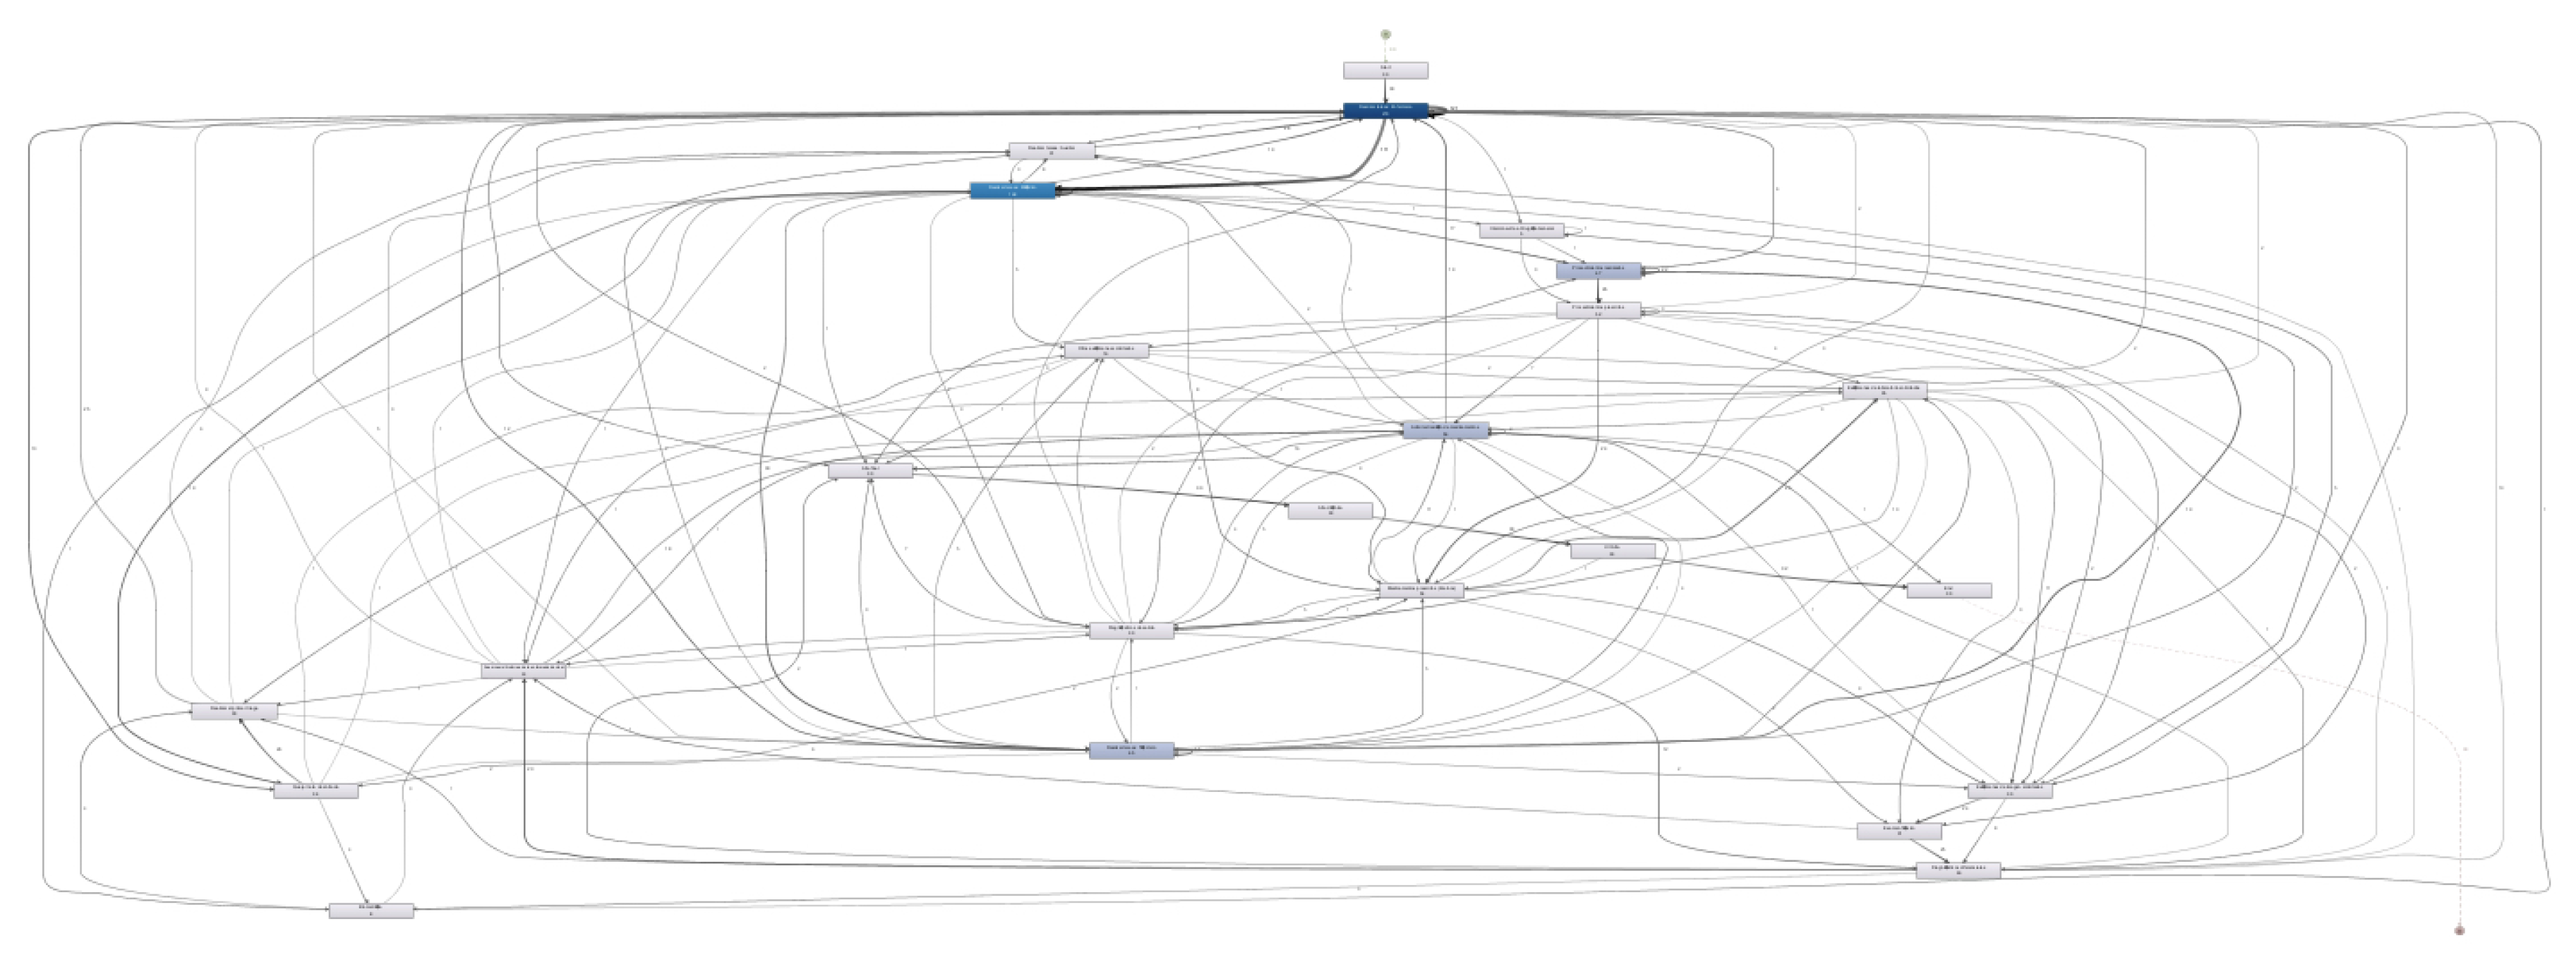
Activity 5.2. Process discovery:

Process discovery is aimed at discovering a process model based on an event log, in which the resulting model includes the activities and paths taken in different cases. Given the flexible nature of ER processes, in which two episodes are never the same, when dealing with questions related to control-flow analysis, we recommend the use of models with more flexible semantics, such as dependency graphs or fuzzy models, as well as the following discovery algorithms, heuristic miner [33] and fuzzy miner [34]. Alternatively, some questions may require models with a more formal semantic (e.g., Petri nets or process trees) and their associated algorithms (e.g., genetic miner [35] or inductive miner [36]) in order to verify conformance. Disco focuses on non-formal semantic models, while ProM includes models and algorithms with more formal semantics.

Activity 5.3. Conformance analysis:

Conformance analysis is aimed at verifying conformance between a given ideal model and the actual execution that is contained in the event log. It is significant because it is able to detect whether the process is being run as expected by the model. It is also possible to check whether or not there is compliance with internal or external guidelines. The authors recommend using algorithms based on conformance alignments in cases where optimal results are desired [37]. If only an exploratory conformance is desired, it is possible to choose conformance based on replay [38]. The algorithms are implemented in tools, such as ProM or CoBeFra.

Activity 5.4. Performance analysis:

Performance analysis is an analysis conducted from the time perspective, which takes into account the data regarding activity durations and waiting times between activities. This type of analysis is able to identify bottlenecks, activities that take longer than expected, excessive waiting times or slow synchronizations. The authors recommend the use of algorithms based on token replay over the model, which are able to obtain performance statistics and annotated Petri net models. The algorithms are implemented in tools, such as ProM.

Activity 5.5. Organizational analysis:

Finally, organizational analysis focuses on the resources perspective and how people behave during the execution of process activities. For example, it identifies who performs each task and how resources interact during a case execution. The authors recommend the use of the organizational metrics implemented in ProM (e.g., working together or handover of work) in order to obtain organizational models.

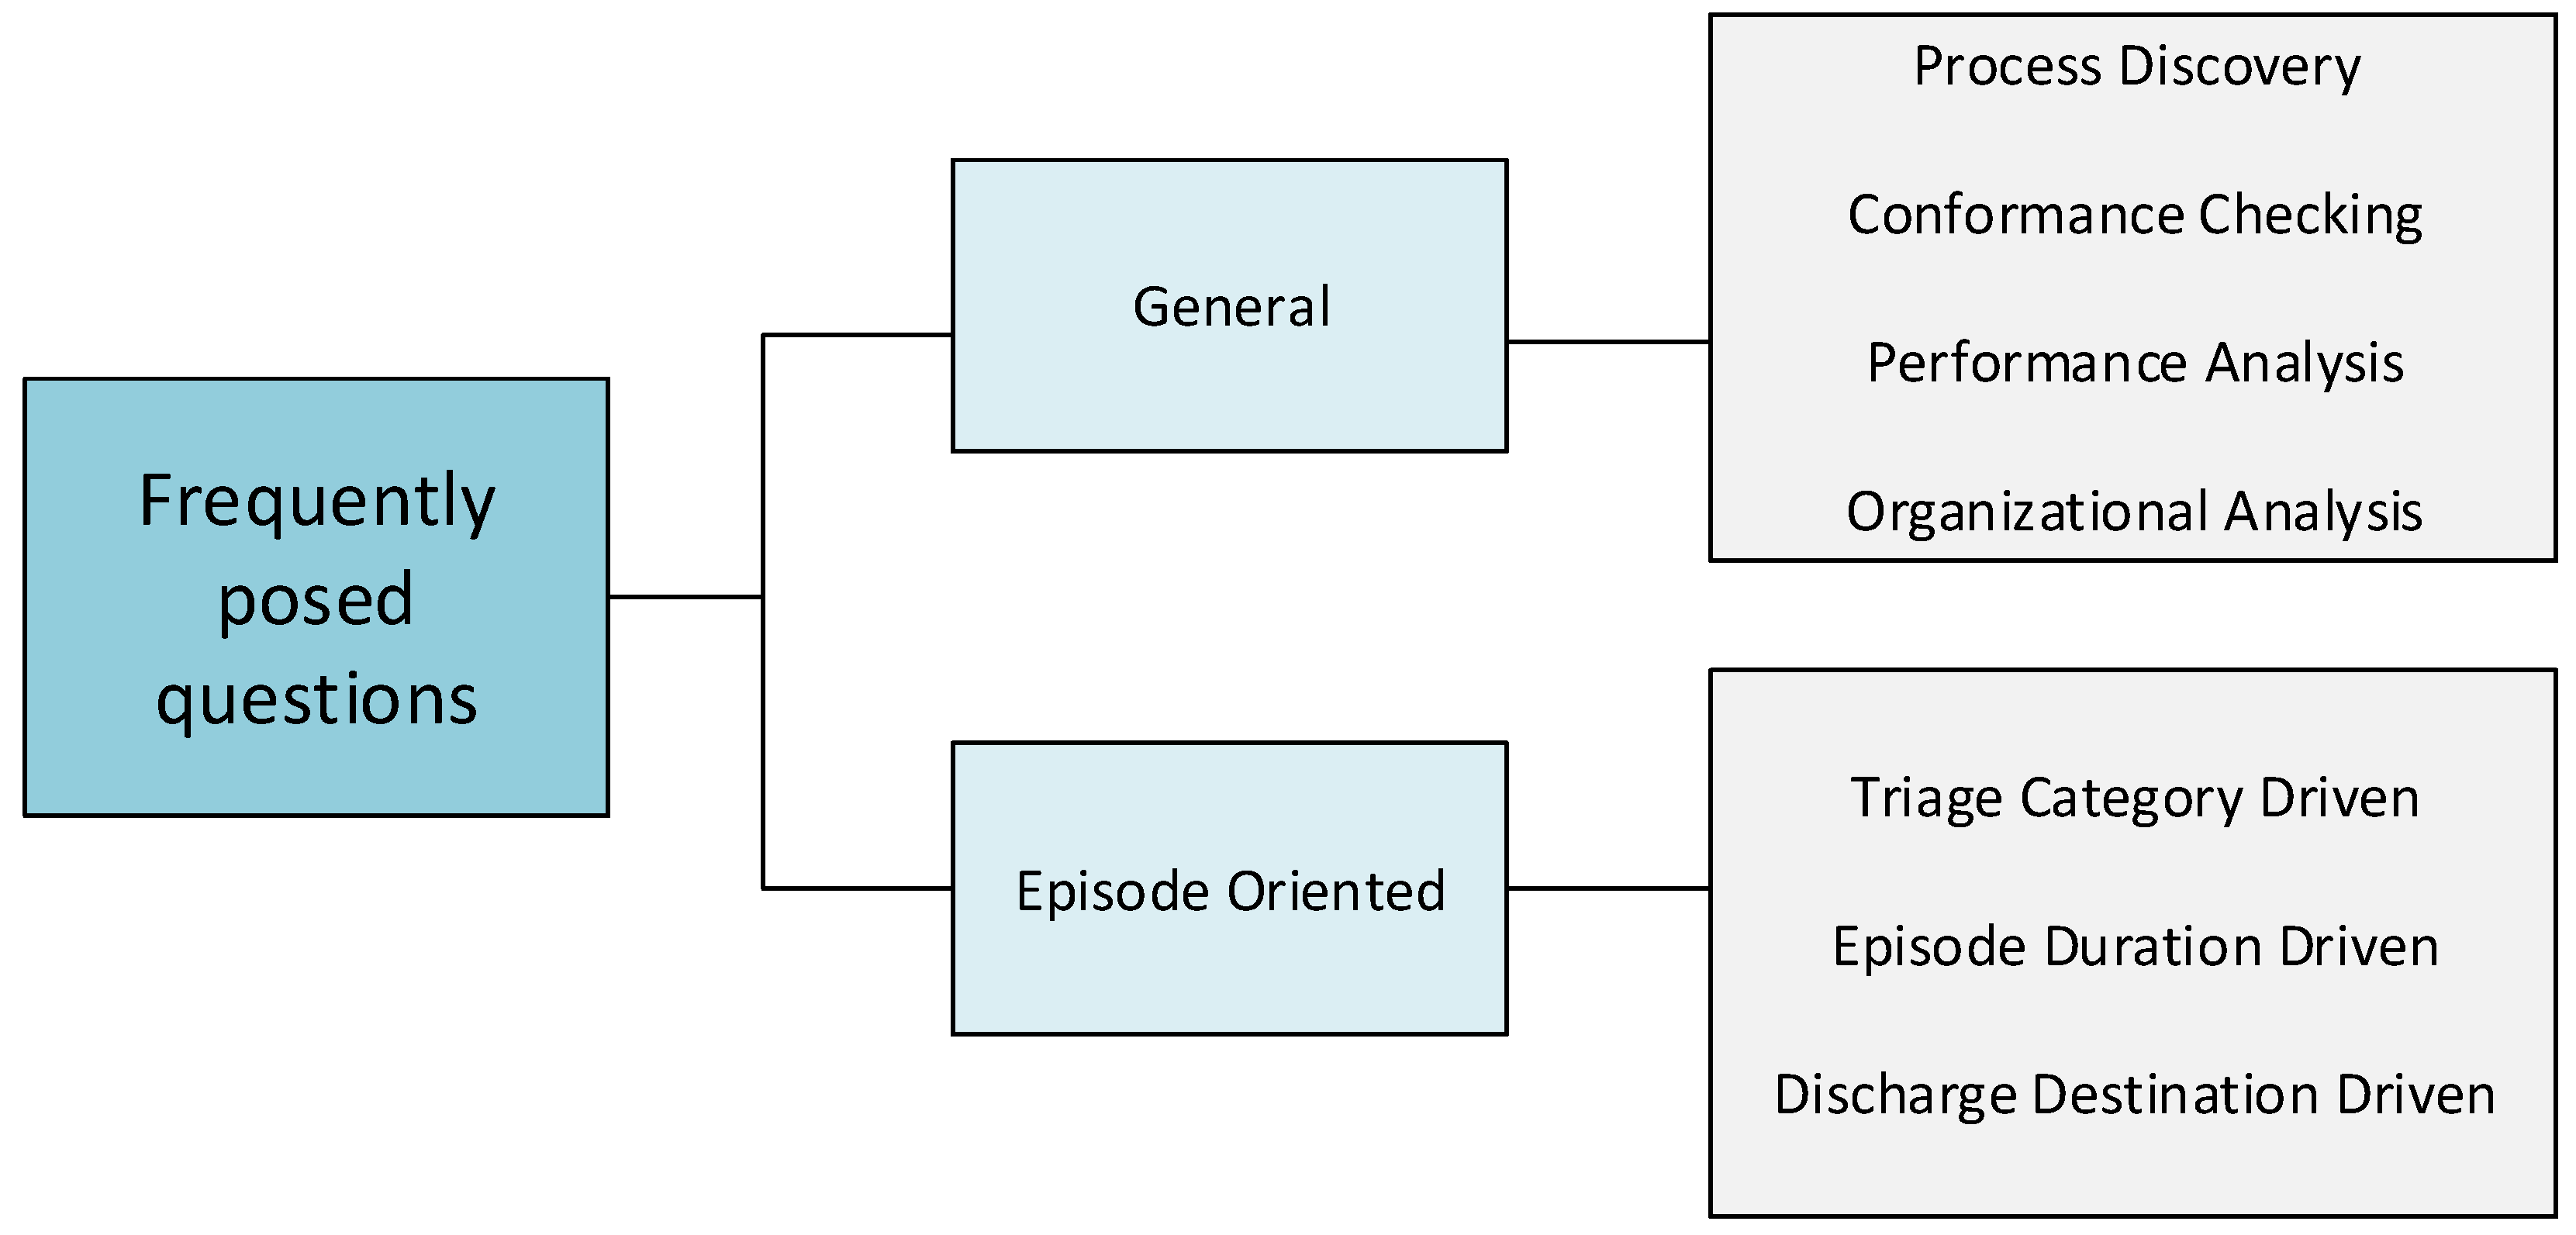
Activity 5.6. Analysis regarding each type of question:

Section 2 provides a classification of FPQ. For each of them, one or several types of techniques can be applied. For example, some FPQs may need to use discovery techniques to obtain process models, while others may need to use conformance checking techniques to verify conformance. Table 6 provides a general guide of what analysis techniques should be used for each FPQ.

Activity 5.7. Data analysis and process mining cycle:

Data analysis and process mining analysis stages are introduced as a cycle, since, in order to obtain the necessary results for responding to certain questions, a continuous iteration is required for refining the data and the results until the desired answers are obtained. For example, process mining discovery techniques are used at the beginning of an analysis to create a process model with a complete event log that includes all activities. These activities have characteristics (e.g., triage color or diagnosis), which help to undertake statistical analyses of the data and filter the event log, as required. The new event log includes only the desired episodes, and during the process mining stage, it helps to create a new model. By means of this series of iterations, it is possible to filter and analyze the dataset and reduce the spaghetti effect [19] in the process models discovered. In addition to analyzing the data in order to reduce or filter the event logs, the data analysis stage also enables the use of more advanced data mining techniques to identify trends, prediction rules and decision trees, among other more complex analyses.

Stage 6. Results evaluation stage:

Regardless of the technique used, it is extremely important to gather feedback from the ER experts, not only about the answers provided, but also about the clinical impact of the data and models obtained. In the results evaluation stage, the results are shown to the ER experts in order to know whether they provide the information, data and models to answer their FPQs. Table 7 sums up the main activities of this stage and provides a series of guidelines to be considered during this stage.

Activity 6.1. Identify ER experts:

The first step is to identify who are the relevant ER experts, those that have the knowledge about the complete process and are able to identify and explain each performed task.

Activity 6.2. Define feedback instruments:

Once the results from the analysis stages have been acquired, it is important to establish the instruments that will be used to verify the results in conjunction with the ER experts by analyzing the models and data obtained from each frequently-posed question. Examples of common instruments that might be considered include questionnaires, interviews and focus groups [41]. A questionnaire can be used to ask open or closed questions to identify whether the experts encounter the desired answers in the models and the data shown. This type of questionnaire should be used after the introduction and explanation of the obtained results. General questions may include: Do the data and models help to produce answers to the proposed questions? On the other hand, more specific questions might be used, for example: Is the sequence of activities present in the episodes of patients with appendicitis and a yellow triage as expected based on previous experience? Questionnaires do not have to be completed in person; rather, they can be undertaken digitally.
Feedback on the results of the application of process mining can also be obtained by means of interviews with ER experts. The advantage of interviews is that the answers can be broader than ones stemming from more closed questions in a questionnaire. The disadvantage is that they take longer to conduct. On the other hand, through focus groups, multiple experts from the particular field in question can be included simultaneously. In this instance, not only can the experts be asked specific questions, but also a general discussion can be generated regarding the results of the application of process mining in ER.

Activity 6.3. Obtain feedback:

Finally, the results should be shown to the ER experts in order to gather their feedback. It is not necessarily bad that the experts conclude that the outputs obtained are not enough, are not relevant or are not the expected ones. This is part of the process and will imply going back and checking the previous stages. It is usually required to verify whether the data were correct, the filters were made appropriately, the techniques applied were the proper ones and the results were interpreted correctly. This cycle should be repeated as many times as necessary in order to acquire the desired answers.

4. Results

The following section provides an example of the application of the proposed methodology and the search for answers to one specific question regarding a standard process followed in the ER.

Case Study

The case study relates to ER processes within a university hospital in Santiago, Chile. The data collected correspond to July 2014. Initially, several questions were posed according to the specific needs of an ER expert who works as a member of the ER team. For example: What activities are carried out, and what processes are followed in providing attention to ER patients diagnosed with appendicitis? How long do the activities carried out last in attending to ER patients diagnosed with bronchitis? What process is executed for treating patients who are triaged red? Are there certain diagnoses that are always triaged yellow and last more than ten hours? What are the activities carried out; what are the processes followed; and how long do the activities last in terms of providing attention to ER patients diagnosed with pneumonia? What are the most commonly-requested inter-consultations in cases of a long stay, and what are the main diagnoses?
The aim of the case study was to demonstrate the usefulness and applicability of the data reference model, the methodology and the use of process mining techniques to provide answers specifically to the following question: What activities are carried out, and what process is followed in providing attention to ER patients diagnosed with appendicitis? The decision to answer this question is because the episodes of appendicitis should normally follow a standard process, so we are interested in verifying, through the use of the proposed tools and methodology, whether that is effective in practice. Further research will include additional and more complex questions.
The stages defined in Section 3.2 were applied over a period of three months, during which data cleansing was the most time-consuming activity. The following is a description of the tasks undertaken.

Stage 1. Data extraction:

In order to answer the question, the tasks in the first stage of data extraction were executed. Data were extracted from HIS Alert ADWPhase I, which is the HIS used in the ER of the hospital in question. Subsequently, every data type was extracted by means of specific reports in CSV (comma separated value) format from the database (problems, vital signs, allergies, referrals, transportation, responsibility transfer, diagnosis, professional activities, medications, final discharge and triage). Each report comprehends detailed information about each activity or event considered in the analysis, including: a unique episode ID, the activity name, the resource who performed the activity, a timestamp with a high degree of accuracy and, optionally, a series of attributes about the activity or event. These attributes help to better understand how each episode was performed; for example, the dosage and effects of a drug applied to a patient in an internal medication event for a given episode. Demographic information about patients was not included among these attributes, since it was not required for the analysis.
Standardization tasks were performed on date formats, including: checking and establishing the desired format (e.g., dd/mm/yyyy or mm/dd/yyyy) and the spacer (e.g., - or /). In addition, simple activity columns (e.g., recording vital signs) and compound activity columns (e.g., professional task: medical doctor) may be defined and generated to improve the analysis. It is advisable to perform the data extraction with the help of the HIS owners, to make sure no data are left aside and the correct values are being extracted. Besides, it is important to validate the timestamps to check for any inconsistencies. Details, such as the date format or the spacer, can be seen as insignificant at the beginning, but they are relevant when the event log is created and uploaded into the process mining tools.

Stage 2. Event log creation:

During the second stage of the methodology, an event log was extracted taking into account the specific question we want to answer. In our case, the event log was created including all ER episodes during July 2014. The question specifically relates to the sequence of activities carried out in ER in attending to the patients, for example the activity of taking their vital signs, the medical imaging requested, the medication prescribed and the inter-consultations solicited. The minimum requirements for inclusion of each activity in this event log relate to the episode ID, the activity name and its corresponding timestamp. An example fragment of an event log can be seen in Figure 4.

Stage 3. Filtering:

The goal of the following stage is to filter the previously constructed event log in accordance with the specific characteristics of the question that requires an answer. This was done using Disco, which has techniques to enable filters to be applied to the complete event log. Figure 5 shows an example of a filter generated with the Disco tool, in which episodes triaged red were selected.
In general, the first filter used aims at selecting the completed episodes while excluding the episodes that either do not start or do not end during the desired period. In our case study, complete episodes from July 2014 were kept, excluding those that began prior to July 1 and those that finished after July 31.
Considering the question that needs to be answered, which refers to the analysis of the process followed to treat patients with appendicitis, it is necessary to apply a filter to select all of the episodes in which such a diagnosis has been made.
If additional conditions regarding characteristics relating to the episode or the patient are required, they must be specified by means of filtering during this stage. Once the completed episodes in conjunction with the specific characteristics relating to the relevant question have been obtained, the subsequent step is to analyze the event log with the available tools, exporting the event log itself in the desired event log format (XES, MXML, CSV, among others).

Stages 4 and 5. Data analysis and process mining analysis:

Following the filtering and the generation of event logs with the desired characteristics, data analysis of the included episodes takes place, prior to the subsequent analysis of the process itself, its model and its activities.
The first task undertaken at this stage is descriptive data analysis. At this point, 33 episodes with appendicitis were identified during July 2014. The 33 episodes included one or more of the following activities: nursing tasks, doctor tasks, procedure performance, technical staff tasks, medication prescription, medication administration, undertaking prescription procedures, differential diagnosis, laboratory orders, chief complaints, triage, requested imaging tests, history of present illness, discharge diagnosis, final ER discharge, clinical, biometry and general surgery consultation. The most commonly executed activities related to tasks undertaken by doctors and nurses, followed by activities relating to medication and those performed by the technical staff. The average episode length was 6:48 h, with the shortest lasting 3:24 h and the longest 10:26 h.
To broaden the analysis of the episode data, cases were classified using filters; specifically, according to duration (short and long stay) and triage (blue, green, yellow, orange and red). Table 8 shows the main characteristics of the cases. Of the 33 cases, 14 related to more than 4 h spent in ER (long stay), while 19 related to stays shorter than 4 h (short stay). Overall, 32 patients were hospitalized, and the remaining patient decided to return home. Furthermore, four patients were triaged green, while 28 were triaged yellow, and only one was triaged orange. No cases of either blue or red triage were obtained for this particular diagnosis. In general, and in regard to the data obtained, it is possible to conclude that for episodes in which patients are diagnosed with appendicitis, 100% are hospitalized in cases where the patient chooses not to leave the ER.
Following the data analysis, process model discovery took place for the 33 cases included in the event log. Initially, the Disco tool was used to generate a process model, which is shown in Figure 6. As can be seen, neither is sufficiently legible, nor can they be used to clearly identify the activities carried out or the transitions from one to another.
One way of resolving this problem is to identify the activities and classify them into subprocesses, in conjunction with the ER expert. Accordingly, three important subprocesses were identified. First is the subprocess that contains the triage and diagnosis activities corresponding to the tasks in which the seriousness of the condition of the patient is determined. Second is the subprocess that contains activities relating to treatment, which includes four subtypes grouped into their own subprocesses, as follows: the patient’s physical examination subprocess; the procedure execution subprocess; the subprocess of taking exams; and the medication administration subprocess. Third is the subprocess that includes the activities associated with clinical discharge. The subprocesses are shown in Figure 7 in a diagram constructed in BPMN, where it can be seen that the initial subprocess is the triage and diagnostics. Subsequently, the process continues with the physical examination, procedure execution, taking exams and medication, in a loop that can take place more than once, and finally, the discharge subprocess is undertaken. Before executing the discharge subprocess, the condition of the patient must be checked; if the patient is ready to be discharged, the episode continues with this subprocess; otherwise, more procedures and exams should be performed.
Owing to medical importance, analysis will only focus on diagnosis and treatment (including the four subprocesses therein). Regarding the activities of the triage and diagnostics subprocess, the activities were filtered and the process model generated in Disco, as shown in Figure 8. Two significant activities were identified in 31 of the cases (90%) and which have a very clear order at the beginning of each episode. First, the chief complaints/entry notes activity was undertaken, followed by the triage.
To analyze the subprocesses included in the treatment of the patient, distinct process models were generated in Disco. The first model relates to the activities of the physical examination subprocess (see Figure 9), which includes the activities performed by the doctors, nurses, technical staff and other health professionals, in order to identify the diagnosis of the episode and thereby taking exams, provide medication or execute procedures.
The remaining models relate to the subprocesses of performing medical procedures (see Figure 10a), taking exams (see Figure 10b) and medication (see Figure 10c), which can be undertaken simultaneously, according to the patient diagnosis. The treatment subprocesses (procedures, exams and medication) can be executed one or more times in a continuous manner, alternating between different subprocess activities. The models obtained with the Disco tool help to clarify the details of how activities are performed on each particular subprocess. Based on the obtained models, evaluation by the ER experts can then be performed.

Stage 6. Results evaluation:

Subsequent to obtaining the data, characteristics and models for the analyzed cases, an evaluation was conducted with an ER expert in the emergency room. This evaluation was undertaken by means of an interview with open questions in relation to the results obtained, including the following: Do you consider the model to accurately reflect the reality of the processes followed during the attention of patients with this diagnosis? Do you consider the discovered activities to be correct? In general, do the data and models provide an answer to the frequently-posed questions about this diagnosis? The respondent provided affirmative answers, with the expert confirming that the data and process models can be used to understand the process followed in attending to patients in ER diagnosed with appendicitis. The expert received additional information regarding the cases analyzed and confirmed that the present activities and subprocesses, as well as the behavior identified are correct. The main objective of the interview and the evaluation was to confirm that for a standard, known and understood process (patients diagnosed with appendicitis), process mining and data analysis may provide the details required to answer any questions related with it.
Accordingly, it is possible to confirm that the methodology, in conjunction with the analysis of the data and processes, provides the necessary steps to generate the data and models required in order to answer the questions posed. Additional experts may be required in order to analyze the resulting models and information, and to verify if the process is the best or how it can be improved. For the purpose of this initial phase of the research, the ER expert confirms that the tools and methodology provide the required outputs for further analysis.

5. Discusion

Section 4 outlined a case study in which the proposed methodology was applied. This section discusses the most important results obtained, from two different perspectives: the ER specialist perspective and the process mining specialist perspective.

5.1. The ER Perspective

The use of process mining and data mining techniques allowed answering a question frequently posed by ER experts. The most significant contributions of this research relate to the data model for linking data from ER and the methodology that demonstrates the necessary steps for obtaining data and process models in order to answer the frequently-posed questions.
The data extraction process is the most critical stage of the entire methodology, since in the absence of complete and accurate data in the correct format, the construction of the event logs and the subsequent stages will not produce the desired results. An analysis undertaken by a process mining expert is needed with regard to the minimum data required (timestamp and activity names), in addition to one by an ER expert in order to identify the clinical information relevant to the process analysis (critical activities, such as inter-consultations). The provision of a data model establishes the bases for obtaining the minimum data required to construct an event log for analysis purposes in ER, eliminating the dependency on the experts. It also provides a data structure for storing information stemming from the HIS or other existing data sources in the medical facility.
Furthermore, the methodology acts as a tool to guide an ER expert to use data and process mining analysis techniques in the absence of an expert in those particular fields, after the minimum required data are identified and stored in the data model.
The ER expert fulfills a crucial role in the data extraction process because he/she is able to identify the most important data within the process that, in turn, will help to guide him/her to answer the posed question. For example, if the question relates to a specific neurological diagnosis, the expert can emphasize the importance of the inter-consultation to neurology and the magnetic resonance imaging tests; knowledge that, in most cases, process mining experts lack.
In the stage of verification by the experts, the method includes certain tools for analyzing whether the answer obtained is correct. In case the ER expert is the one leading the analysis, some examples are provided in order to be able to verify the answers with other ER experts.
Regarding the results obtained through the process models and data, it is important to note that such findings do not only provide answers to the frequently posed questions, but they also help to acquire additional knowledge about the process. For example, they can help to do the following: identify the stages undertaken in response to different cases in ER; identify activities undertaken in a sequential or parallel manner or those performed specifically for certain patients; verify whether medical regulations and protocols are being adhered to; identify organizational aspects, such as the work of the team as a whole and individuals’ roles therein; and provide performance information relating to each case.

5.2. The PM Perspective

For a process mining specialist, analysis will take place from two distinct perspectives: from the data and from the methodology.
Regarding the data perspective, new and original aspects have been exposed. This article proposes the extraction and storage of data in a data reference model. Usually, with data sources that support ER processes, a challenge arises in terms of data being distributed and stored in multiple systems, making the extraction and use thereof particularly difficult. Accordingly, it is important to establish a unique identification number for each case or episode, which is uniform across all systems. Having a unique identification number means that although the activities or tasks executed for any given episode are not stored in the same place, they can all be identified. In addition to a unique identification number, this article proposes a data model in order to centralize the data within one single repository in a way that facilitates the construction of event logs.
The proposed data model is able to store data from all activities related to an episode. The model identifies the main activities of the ER process, from triage and vital signs to diagnosis and inter-consultations. In addition, a unified source of data enables the moment or timestamp in which an activity is executed, as well as the respective resource, to be stored more easily.
Providing the name of the activity, timestamp and resource and establishing a unique identification number for each episode help the architects to design an HIS that is process-oriented and that facilitates the application of process mining techniques and algorithms. In addition, the data model is used to capture information relating to the clinical context of each episode. This information enables the acquisition of simpler event logs with additional information to generate more detailed process models with increased clinical context. For example, it helps to identify the triaging of patients, considering the standard used and the color assigned and, therefore, adding more meaning to the activity.
Regarding the methodological perspective, the proposal introduces original aspects regarding the steps required for extracting and storing the data, constructing the event logs and complementing the use of process mining and data mining techniques; all in order to obtain answers to questions frequently posed by the experts. Furthermore, tools and examples are mentioned relating to the analysis of the resulting models and data in conjunction with the experts.
The data analysis stage helps to ensure that any analysis does not focus solely on the process. Rather, it enables the use of different techniques, which provide clarity in regard to the patterns, trends and characteristics of the dataset used. It is crucial to indicate that the importance does not revolve around the use of just one or more data mining techniques, but in using them in conjunction with the process mining techniques to ensure a more robust process and, as a consequence, to provide clearer and more accurate answers to the ER expert from the process perspective.
The advantages of data analysis, whether statistical or data mining, is that it provides information that complements the overall process, for example predicting trends or defining case clusters. In addition, it produces information shared between clinical cases and facilitates the identification of patterns to classify cases by trends, which can help to simplify the complexity of the models. There is a wide variety of tools available through which these types of analysis can be undertaken, both free and licensed, and therefore, this should pose no impediment to the application of such techniques.
Regarding the process mining stage, the authors recommend techniques, tools and methods to undertake four types of analysis that will help to generate the models, data and information required to answer the frequently-posed questions that arise. The main limitation of process mining tools is the absence of techniques or algorithms that allow one to handle complex spaghetti-type models, which can be reduced by analyzing event logs for specific questions and not the whole dataset or by identifying subprocesses that can be analyzed independently.
It should be noted that the ER experts must be present throughout the different stages of the process and not simply during the final evaluation. The experts are a key input to data collection, in terms of the definition of the questions that require answering, the establishment of the values for filtering the data and during the analysis stages. In fact, during the stage in which answers are evaluated, the larger the number of experts involved, the greater the levels of trust, accuracy and depth will be, regarding the analysis of the answer obtained.

6. Conclusions and Future Work

This article introduced a methodology that focuses on the application of process mining and data analysis techniques and algorithms in order to provide answers to questions about ER processes that are frequently posed by ER experts. The method used a data model that establishes a structure for the storage of ER data, which facilitates the extraction of data and the construction of event logs.
This methodology was tested in a case study undertaken in the emergency room of a university hospital in Santiago, Chile. It was shown that, with the help of a data reference model for ER, in conjunction with a detailed analysis using data and process mining techniques, answers to the questions frequently posed by ER experts regarding their processes can be given in a simpler and straightforward manner.
As part of our future work, we plan to include additional techniques of data analysis (e.g., prediction rules) to obtain improved results prior to the process mining analysis stage. The proposed methodology brings the basic required steps towards the analysis through data and process mining of ER processes. Further improvements to the methodology may be included to adapt it, more and more, to the flexible nature of these processes. Future work may include new stages, such as visual analytics, artificial intelligence, machine learning and behavioral analysis, among others. Additionally, the case study only was executed in order to validate the methodology, but further interesting and frequently-posed questions exposed by the experts will be analyzed in the future with more statistical and expert validation.

Acknowledgments

This project was partially funded by Fondecyt Grants 1150365 and 11130577 from the Chilean National Commission on Scientific and Technological Research (CONICYT), the Ph.D. Scholarship Program of CONICYT Chile (CONICYT-Doctorado Nacional/2014-63140180), the Ph.D. Scholarship Program of CONICIT Costa Rica and by Universidad de Costa Rica Professor Fellowships.

Author Contributions

All authors undertook writing and review tasks throughout this study. The process was coordinated by Eric Rojas.

Conflicts of Interest

No conflicts of interest are reported by the authors regarding this study.

References

  1. Institute of Medicine; Board on Health Care Services; Committee on the Future of Emergency Care in the United States Health System. Hospital-Based Emergency Care: At the Breaking Point; National Academy of Sciences: Washington, DC, USA, 2006. [Google Scholar]
  2. Welch, S.J.; Asplin, B.R.; Stone-Griffith, S.; Davidson, S.J.; Augustine, J.; Schuur, J.; Alliance, E.D.B. Emergency department operational metrics, measures and definitions: Results of the second performance measures and benchmarking summit. Ann. Emerg. Med. 2011, 58, 33–40. [Google Scholar] [CrossRef] [PubMed]
  3. Jansen-Vullers, M.; Reijers, H.A. Business Process Redesign in Healthcare: Towards a structured approach. Inf. Syst. Oper. Res. 2005, 43, 321–339. [Google Scholar] [CrossRef]
  4. Grol, R.; Grimshaw, J. Evidence-based implementation of evidence-based medicine. Jt. Comm. J. Qual. Improv. 1999, 25, 503–513. [Google Scholar] [CrossRef]
  5. Fernández-Llatas, C.; Meneu, T.; Traver, V.; Benedi, J.M. Applying evidence-based medicine in telehealth: An interactive pattern recognition approximation. Int. J. Environ. Res. Public Health 2013, 10, 5671–5682. [Google Scholar] [CrossRef] [PubMed]
  6. Radnor, Z.J.; Holweg, M.; Waring, J. Lean in healthcare: The unfilled promise? Soc. Sci. Med. 2012, 74, 364–371. [Google Scholar] [CrossRef] [PubMed] [Green Version]
  7. Rojas, E.; Munoz-Gama, J.; Sepúlveda, M.; Capurro, D. Process mining in healthcare: A literature review. J. Biomed. Inform. 2016, 61, 224–236. [Google Scholar] [CrossRef] [PubMed]
  8. Neumuth, T.; Jannin, P.; Schlomberg, J.; Meixensberger, J.; Wiedemann, P.; Burgert, O. Analysis of surgical intervention populations using generic surgical process models. Int. J. Comput. Assist. Radiol. Surg. 2011, 6, 59–71. [Google Scholar] [CrossRef] [PubMed] [Green Version]
  9. Fernandez-Llatas, C.; Lizondo, A.; Monton, E.; Benedi, J.M.; Traver, V. Process mining methodology for health process tracking using real-time indoor location systems. Sensors 2015, 15, 29821–29840. [Google Scholar] [CrossRef] [PubMed]
  10. Fernandez-Llatas, C.; Bayo, J.L.; Martinez-Romero, A.; Benedí, J.M.; Traver, V. Interactive pattern recognition in cardiovascular disease management: A process mining approach. In Proceedings of the 2016 IEEE-EMBS International Conference on Biomedical and Health Informatics (BHI), Las Vegas, NV, USA, 24–27 February 2016; pp. 348–351.
  11. Mans, R.S.; van der Aalst, W.M.; Vanwersch, R.J.; Moleman, A.J. Process mining in healthcare: Data challenges when answering frequently posed questions. In Process Support and Knowledge Representation in Health Care; Springer: Berlin/Heidelberg, Germany, 2013; pp. 140–153. [Google Scholar]
  12. Mans, R.; Schonenberg, M.; Song, M.; van der Aalst, W.M.; Bakker, P.J. Application of process mining in healthcare—A case study in a dutch hospital. In Proceedings of the International Joint Conference on Biomedical Engineering Systems and Technologies, Madeira, Portugal, 28–31 January 2008; pp. 425–438.
  13. Grando, M.; Schonenberg, M.; van der Aalst, W. Semantic-based conformance checking of computer interpretable medical guidelines. In Biomedical Engineering Systems and Technologies, Proceedings of the 4th International Joint Conference on Biomedical Engineering Systems and Technologies, Rome, Italy, 26–29 January 2011; Springer: Berlin, Germany, 2011; pp. 285–300. [Google Scholar]
  14. Rebuge, Á.; Ferreira, D.R. Business process analysis in healthcare environments: A methodology based on process mining. Inf. Syst. 2012, 37, 99–116. [Google Scholar] [CrossRef]
  15. Partington, A.; Wynn, M.; Suriadi, S.; Ouyang, C.; Karnon, J. Process mining for clinical processes: A comparative analysis of four Australian hospitals. ACM Trans. Manag. Inf. Syst. (TMIS) 2015, 5, 19. [Google Scholar] [CrossRef] [Green Version]
  16. Basole, R.C.; Braunstein, M.L.; Kumar, V.; Park, H.; Kahng, M.; Chau, D.H.P.; Tamersoy, A.; Hirsh, D.A.; Serban, N.; Bost, J.; et al. Understanding variations in pediatric asthma care processes in the emergency department using visual analytics. J. Am. Med. Inform. Assoc. 2015, 22, 318–323. [Google Scholar] [CrossRef] [PubMed]
  17. Mejri, A.; Ghannouchi, S.A.; Martinho, R.; Elhadj, F. Enhancing business process flexibility in an emergency care process. In Proceedings of the 2016 IEEE/ACIS 15th International Conference on Computer and Information Science (ICIS), Okayama, Japan, 26–29 June 2016; pp. 1–6.
  18. McGregor, C.; Catley, C.; James, A. A process mining driven framework for clinical guideline improvement in critical care. In Proceedings of the Learning from Medical Data Streams Workshop, Bled, Slovenia, 6 July 2011.
  19. Van der Aalst, W. Process Mining: Data Science in Action; Springer: Cham, Switzerland, 2016. [Google Scholar]
  20. Mans, R.; van der Aalst, W.M.P.; Vanwersch, R.J.B. Process Mining in Healthcare—Evaluating and Exploiting Operational Healthcare Processes; Springer Briefs in Business Process Management; Springer: Cham, Switzerland, 2015. [Google Scholar]
  21. Mackway-Jones, K.; Robertson, C. Emergency triage. BMJ Br. Med. J. Int. Ed. 1997, 314, 1056. [Google Scholar]
  22. Perimal-Lewis, L.; Qin, S.; Thompson, C.; Hakendorf, P. Gaining insight from patient journey data using a process-oriented analysis approach. In Proceedings of the Fifth Australasian Workshop on Health Informatics and Knowledge Management-Volume 129, Melbourne, Australia, 31 January–3 February 2012; Australian Computer Society, Inc.: Darlinghurst, Australia, 2012; pp. 59–66. [Google Scholar]
  23. Silverston, L. The Data Model Resource Book, Vol. 2: A Library of Data Models for Specific Industries; Wiley: Hoboken, NJ, USA, 2001. [Google Scholar]
  24. Suriadi, S.; Andrews, R.; ter Hofstede, A.H.; Wynn, M.T. Event log imperfection patterns for process mining: Towards a systematic approach to cleaning event logs. Inf. Syst. 2017, 64, 132–150. [Google Scholar] [CrossRef]
  25. Bose, R.J.C.; Mans, R.S.; van der Aalst, W.M. Wanna improve process mining results? In Proceedings of the 2013 IEEE Symposium on Computational Intelligence and Data Mining (CIDM), Singapore, 16–19 April 2013; pp. 127–134.
  26. Günther, C.W.; Rozinat, A. Disco: Discover Your Processes. Citeseer 2012, 940, 40–44. [Google Scholar]
  27. Claes, J.; Poels, G. Process Mining and the ProM Framework: An Exploratory Survey. In Business Process Management Workshops: BPM 2012 International Workshops, Tallinn, Estonia, 3 September 2012; Revised Papers; Springer: Berlin/Heidelberg, Germany, 2013; pp. 187–198. [Google Scholar]
  28. Han, J.; Kamber, M.; Pei, J. Data Mining: Concepts and Techniques; Elsevier: Amsterdam, The Netherlands, 2011. [Google Scholar]
  29. Rozinat, A.; van der Aalst, W.M. Decision mining in ProM. In International Conference on Business Process Management; Springer: Berlin/Heidelberg, Germany, 2006; pp. 420–425. [Google Scholar]
  30. Suriadi, S.; Mans, R.S.; Wynn, M.T.; Partington, A.; Karnon, J. Measuring patient flow variations: A cross-organisational process mining approach. In Proceedings of the Asia-Pacific Conference on Business Process Management, Brisbane, Australia, 3–4 July 2014; pp. 43–58.
  31. Dagliati, A.; Sacchi, L.; Cerra, C.; Leporati, P.; de Cata, P.; Chiovato, L.; Holmes, J.H.; Bellazzi, R. Temporal data mining and process mining techniques to identify cardiovascular risk-associated clinical pathways in Type 2 diabetes patients. In Proceedings of the 2014 IEEE-EMBS International Conference on Biomedical and Health Informatics (BHI), Piscataway, NJ, USA, 1–4 June 2014; pp. 240–243.
  32. Kumar, V.; Park, H.; Basole, R.C.; Braunstein, M.; Kahng, M.; Chau, D.H.; Tamersoy, A.; Hirsh, D.A.; Serban, N.; Bost, J.; et al. Exploring clinical care processes using visual and data analytics: Challenges and opportunities. In Proceedings of the 20th ACM SIGKDD Conference on Knowledge Discovery and Data Mining Workshop on Data Science for Social Good, New York, NY, USA, 24–27 August 2014.
  33. Weijters, A.; van der Aalst, W.M.; de Medeiros, A.A. Process mining with the heuristics miner-algorithm. Tech. Univ. Eindh. Tech. Rep. WP 2006, 166, 1–34. [Google Scholar]
  34. Günther, C.W.; van der Aalst, W.M. Fuzzy mining–adaptive process simplification based on multi-perspective metrics. In Business Process Management; Springer: Cham, Switzerland, 2007; pp. 328–343. [Google Scholar]
  35. De Medeiros, A.K.A.; Weijters, A.J.; van der Aalst, W.M. Genetic process mining: An experimental evaluation. Data Min. Knowl. Discov. 2007, 14, 245–304. [Google Scholar] [CrossRef]
  36. Leemans, S.J.; Fahland, D.; van der Aalst, W.M. Discovering block-structured process models from event logs containing infrequent behaviour. In Business Process Management Workshops; Springer: Cham, Switzerland, 2014; pp. 66–78. [Google Scholar]
  37. Van der Aalst, W.M.P. Business alignment: Using process mining as a tool for Delta analysis and conformance testing. Requir. Eng. 2005, 10, 198–211. [Google Scholar] [CrossRef]
  38. Van der Aalst, W.; Adriansyah, A.; van Dongen, B. Replaying history on process models for conformance checking and performance analysis. Wiley Interdiscip. Rev. Data Min. Knowl. Discov. 2012, 2, 182–192. [Google Scholar] [CrossRef]
  39. Munoz-Gama, J. Conformance Checking and Diagnosis in Process Mining: Comparing Observed and Modeled Processes; Springer: Cham, Switzerland, 2017. [Google Scholar]
  40. Song, M.; van der Aalst, W.M. Towards comprehensive support for organizational mining. Decis. Support Syst. 2008, 46, 300–317. [Google Scholar] [CrossRef]
  41. Sampieri, R.H.; Collado, C.F.; Lucio, P.B.; Pérez, M.D.L.L.C. Metodología de la Investigación; McGraw-Hill: New York, NY, USA, 1998. [Google Scholar]
Figure 1. Frequently-posed questions for ER (Emergency Rooms).
Applsci 07 00302 g001
Figure 2. Proposed data reference model for ER.
Applsci 07 00302 g002
Figure 3. Proposed methodology.
Applsci 07 00302 g003
Figure 4. Example of an event log fragment.
Applsci 07 00302 g004
Figure 5. Example of a filter generated using Disco.
Applsci 07 00302 g005
Figure 6. Process model for cases diagnosed with appendicitis (activities: <1%; Paths: <1%).
Applsci 07 00302 g006
Figure 7. ER process model in Business Process Management Notation.
Applsci 07 00302 g007
Figure 8. Process model for diagnosis activities activities: <1%; Paths: <1%).
Applsci 07 00302 g008
Figure 9. Process model for physical examination activities (activities: <1%; Paths: <1%).
Applsci 07 00302 g009
Figure 10. Process models for medical procedures, medication activities and taking exams (activities: <1%; Paths: <1%). (a) Process model for activities that relate to the execution of medical procedures; (b) process model for medication activities; (c) process model for activities that relate to taking exams.
Applsci 07 00302 g010aApplsci 07 00302 g010b
Table 1. Guidelines for the data extraction stage. HIS, Hospital Information System.
ActivityDescriptionGuidelines
1.1: Identify available data in HIS and build the data modelHave access to the correct data from the direct sources, them being HIS or legacy systems.
-
Make sure you have permissions and access granted to them directly or through the data owner.
-
Identify if data are missing in the data sources, and check if it is feasible to execute the analysis (e.g., timestamps are the minimum required data).
-
The available data model should contain as many dimensions and attributes of the data reference model as possible.
-
It should have as much detail granularity as possible.
1.2: Ensure availability of a timestamp for each eventCheck that for each event or activity included in the data model, a correct timestamp is included.
-
If different levels of accuracy are present, the highest one present in all of the data is recommended, just to have the same level across all of the examined data.
-
If some data do not have a timestamp, they cannot be used for the analysis.
1.3: Name eventsIn case any activity or event does not have an appropriate name, one should be assigned to it.
-
Use meaningful names for the ER experts, such as “record vital signs”.
1.4: Create specific-fieldsCreate specific-fields based on the required needs.
-
It is advisable to group activities into subprocesses (e.g., group the triage activities in one subprocess, when our focus is the rest of the process).
-
It might also be useful to split activities into sub-activities (e.g., the professional activities could be split according to the role, for example professional activities, such as “physician professional activities” or ”nurse professional activities”.
1.5: Verify data qualityFurther general issues have been identified from the literature review that must be tackled when generating an event log for process mining purposes in healthcare.
-
Check lack of data, incorrect data or the inaccuracy and irrelevance of data.
-
Check in more detail all of the significant challenges previously found in the literature [20,24,25].
Table 2. Guidelines for the event log creation stage. FPQ, Frequently-Posed Question.
ActivityDescriptionGuidelines
2.1: Identify data required to perform the specific analysisIdentify the FPQ to be answered and identify what data from the general data model will be used.
-
Have clarity and a good understanding of the FPQs that are desired to be answered.
-
Not all of the data included in the reference model may be required to answer a specific question.
2.2: Create the event logOnce the data stored in the data model are available, a specific event log must be created each time a question requires a response.
-
Establish the format in which the event log will be built.
-
Tools such as Excel with comma separated values files can be used, but more specific standards (such as XES) should also be considered.
2.3: Include specific characteristics for each event or activityAccording to the characteristics of the data and the question that requires an answer, certain data types must be included in the event log.
-
After the first version of the event log is built, an inspection should be made to assure that not only the minimum data are included, but also the desired characteristics of the episode with correct values.
Table 3. Guidelines for the filtering stage.
ActivityDescriptionGuidelines
3.1: Basic FilteringRelates to filters that can be applied to any data characteristic, for example time or location.
-
Define which tool is the correct one to execute the filtering. In our case, we propose Disco as a tool with filtering capacities, but additional tools may be considered.
-
Make sure to have knowledge of the different types of filters that the tools have available. These may include filtering the event log by ranges of dates, filtering by values of the different characteristics or filtering by the execution times of the episodes.
-
Establish dates, locations and resources or roles to limit the scope of the analysis.
3.2: Clinical FilteringRelates to filters that can be applied according to the clinical characteristics of the data.
-
For each clinical filter that will be done, the values must be known and verified with the ER experts.
3.3: Question-Driven FilteringRelates to the filtering of data according to the characteristics of the question requiring an answer.
-
To make sure that no value is forgotten on the question, split the question regarding the specific characteristics included. For example, if the question is “What is the process for female patients with green category triage and breast cancer as a diagnostic?”, a good analysis will identify that filters will be executed regarding the gender, the triage categories and the diagnostic.
Table 4. Guidelines for the data analysis stage.
ActivityDescriptionGuidelines
4.1: Select Data Analysis TechniquesSelect statistical analysis and data mining techniques and tools.
-
It is fundamental at this stage to have knowledge about the different types of analysis, to correctly apply them. Applying incorrect analysis to just obtain good visual models will not necessarily help with answering the frequently posed question correctly.
-
Not only complex models and techniques are required to provide answers to FPQ; exploratory analysis of the data must be executed first.
4.2: Statistical AnalysisUsed to characterize an event log, identifying the frequency of activities, the distribution of cases over time and variants of process execution, among others.
-
Have an understanding of the statistical and descriptive methods to be applied.
-
Verify access to the required tools.
4.3: Data Mining AnalysisDiscovering different patterns and knowledge on data contained in the event logs.
-
Identify the objective to achieve with the data mining techniques. Understanding the objective will provide guidance on which technique and tool to use.
-
Evaluate previous studies to check their results and see if they are applicable to replicate them.
-
Make sure to have access, license agreements and the computational resources needed to execute the tools and their included analysis.
-
Always check for additional libraries with newer techniques added to the tools. This may be an opportunity to apply a new technique to your analysis.
Table 5. Guidelines for the process mining stage.
ActivityDescriptionGuidelines
5.1: Identifying the appropriate toolSelect appropriate tools that include the methods and algorithms to execute the desired analysis.
-
Identify the available tools, including licensing issues, input and output capacities.
-
Identify the process mining methods each tool provides.
-
Each type of analysis may provide different types of data, information, models and results, so it is important to study the desired methods and algorithms to have a clear knowledge of the resulting outputs.
5.2: Process DiscoveryAimed at discovering a process model based on an event log.
-
Understand what is the meaning of each event or activity present in each episode.
-
Have knowledge about the applied algorithm, to understand the correct meaning of its inputs and outputs.
-
Create process models at different levels of granularity.
-
Consider analyzing different episode stages (sub-processes) independently.
5.3: Conformance AnalysisAimed at verifying conformance between a given ideal model and the actual execution as contained in the event log.
-
Conformance techniques are complex, so first have a high level of understanding of how the techniques work; this way, the results will be understood and explained accurately when answering the FPQ.
-
Carefully match the name of events in the ideal model and the event log.
-
If some events do not appear in the ideal model or the event log, it is better to remove them before applying the conformance techniques.
5.4: Performance AnalysisAimed at analyzing data regarding activity durations and waiting times between activities.
-
It is vital to have the highest level of granularity when executing this analysis. This way, more exact results will be obtained.
5.5: Organizational AnalysisFocuses on the resources’ perspective and how people interact during the execution of process activities.
-
According to the FPQ, the level of analysis should be defined. It could be at the level of resources, at the level of roles or even at the level of teams or work groups.
5.6: Analysis regarding each type of questionAccording to the type of FPQ, specific techniques may be applied.
-
It is not necessary to executed all of the analysis in the same tool. Different tools may be combined to obtain better models or a deeper analysis.
5.7: Data analysis and process mining cycleIn order to obtain the necessary results to certain questions, a continuous iteration is required for refining the data and the results.
-
Several iterations may be done in order to get the exact answer. New iterations may include filtering or modifying the event log, adding new data, applying new filters or incorporating new methods.
-
Remember that fewer iterations do not guarantee quality results.
Table 6. Analysis guide for each type of question.
QuestionAnalysis
General Discovery QuestionsHeuristics miner algorithm [33], genetic miner algorithm [35] and inductive miner algorithm [36].
General Conformance QuestionsConformance checking and replay [39].
General Performance QuestionsPerformance analysis technique [38].
General Organizational QuestionsOrganizational metrics, such as handover of work, doing similar tasks, working together and subcontracting [40].
Episode Triage Category QuestionsClassify and divide the episodes according to the triage categories. Discover a process model for each of the categories and execute the analysis according to the required characteristics of the episode.
Episode Duration Category QuestionsApply clustering techniques to classify the episodes according to their duration characteristics (time attributes), and afterwards, apply discovery or performance analysis techniques.
Episode Discharge Destination Category QuestionsClassify and divide the episodes according to the episode discharge destination categories. Discover a process model for each of the categories, and execute the analysis according to the required characteristics of the episode.
Table 7. Guidelines for the results evaluation stage.
ActivityDescriptionGuidelines
6.1: Identify ER ExpertsIdentify the experts responsible for the analysis of the resulting values and models for each question.
-
The greater the number of experts available, the more comprehensive the analysis will be.
6.2: Define Feedback InstrumentsEstablish the instruments that will be used to verify the results with the experts.
-
Prepare a presentation with the data, information, models and main conclusions obtained from the analysis.
-
Consider using questionnaires, interviews or focus groups.
6.3: Obtain feedbackGather feedback in a systematic way.
-
Prepare several questions that were triggered during the analysis and may help clarify the understanding of the data and the FPQ or impact future analysis.
-
Returning to previous stages is normal and usually allows obtaining more conclusive results.
-
The more information be provided by the experts, the greater the knowledge of the analyzed process will be, increasing the probability of obtaining better results in future iterations.
Table 8. Characteristics of cases diagnosed with appendicitis.
ColorShort StayLong Stay
Green31
Yellow1513
Orange1
Totals191433

