Effects of Radial Gap Ratio between Impeller and Vaned Diffuser on Performance of Centrifugal Compressors


Turbomachinery Laboratory, State Key Laboratory of Automotive Safety and Energy, Tsinghua University, Beijing 100084, China
*
Author to whom correspondence should be addressed.
Appl. Sci. 2017, 7(7), 728; https://0-doi-org.brum.beds.ac.uk/10.3390/app7070728
Submission received: 3 April 2017
/
Revised: 10 July 2017
/
Accepted: 11 July 2017
/
Published: 16 July 2017
Abstract
:A high-performance centrifugal compressor is needed for numerous industry applications nowadays. The radial gap ratio between the impeller and the diffuser vanes plays an important role in the improvement of the compressor performance. In this paper, the effects of the radial gap ratio on a high-pressure ratio centrifugal compressor are investigated using numerical simulations. The performance and the flow field are compared for six different radial gap ratios and five rotational speeds. The minimal radial gap ratio was 1.04 and the maximal was 1.14. Results showed that reducing the radial gap ratio decreases the choke mass flow rate. For the tip-speed Mach number (impeller inlet) with Mu < 1, the pressure recovery and the loss coefficients are not sensitive to the radial gap ratio. However, for Mu ≥ 1, the best radial gap ratio is 1.08 for the pressure recovery and the loss coefficients. Furthermore, the impeller pressure ratio and efficiency are reduced by increasing the radial gap ratio. Finally, the compressor efficiency was compared for different radial gap ratios. For Mu < 1, the radial gap ratio does not have noticeable effects. In comparison, the radial gap ratio of 1.08 has the best performance for Mu ≥ 1.
1. Introduction
Centrifugal compressors are widely used in industry [1] and small gas turbine engines. A high-pressure ratio will be the goal orientation for centrifugal compressors, as this leads to saving energy, reducing emission and raising power density [2]. With increasing applications of high-pressure ratio centrifugal compressors, several institutes, such as German Aerospace Center (Deutsches Zentrum für Luft- und Raumfahrt; DLR) [3] and Mitsubishi Heavy Industries (MHI) [4], have conducted many studies researching them. However, the high-pressure ratio centrifugal compressors suffer from narrow stable flow range [5] and low efficiency [6]. When the pressure ratio is high, a compact engine and low manufacturing costs are the goals for solving these problems [7]. Therefore, to improve the performance of high-pressure ratio centrifugal compressors, a considerable of researchers have conducted several surveys. Rodgers and Sapiro [8] discussed the considerations for selecting the appropriate geometries in designing a high pressure ratio centrifugal compressor. Ferrara et al. [9] experimentally studied the effects of diffuser geometry on stall inception. Ebrahimi et al. [10] and Zheng et al. [11] investigated on the improvement of stable flow range in high-pressure ratio centrifugal compressors. Lin et al. [12] realized that the volute’s asymmetry has a great impact on the performance of a high-pressure ratio turbocharger compressor, affecting stability and efficiency, which is correlated with pressure ratio.
The compressor performance strongly depends on the various design parameters. The design of a compressor is restrained by numerous aerodynamic remarks. Liu et al. [13] presented that aspect ratio, pitch-chord ratio and blade fillet with the slot configuration on the blade have a significant effect on the cascade performance. Another important design parameter, tip clearance, was studied by Klassen et al. [14]. They investigated the various value of the axial tip clearance (3.9% to 11.3% of the impeller exit height) of a centrifugal compressor with a pressure ratio of 6.0. They concluded that the pressure ratio and efficiency of the impeller, as well as the compressor stage for all flow rates, are reduced by increasing the tip clearance.
Impeller-diffuser interaction can play a major role in enlarging the improvement of the centrifugal compressor, as it is an important part of the compressor. Therefore, it is essential to create an acceptable design for this part. The impeller-diffuser interaction has a direct and considerable influence on the flow field in addition to the performance of the compressor stage and its components. The impeller-diffuser interaction refers to the area between impeller trailing edge and diffuser leading edge. The impeller-diffuser interaction excitation mechanism for a centrifugal compressor was studied by Gallier [15]. Filipenco et al. [16] and Bonaiuti et al. [17] found that for diffuser parts, using a vaned diffuser is a common way of obtaining high performance. Using different sizes for the radial gap between the impeller trailing edge and vane diffuser leading edge can support the impeller-diffuser interaction [18]. The radial gap ratio and its effects on the performance of low-pressure ratio centrifugal compressors has been investigated thoroughly. By investigating the influence of the blade row on the performance of centrifugal compressor, Sato et al. [19] came to the conclusion that by increasing the impeller and diffuser interaction, a loss is generated. Radial gap ratio also affects the impeller tip leakage. By increasing the radial gap ratio, slip and blockage diminish and loss increases [20]. Shum et al. also presented that the radial gap ratio has an optimal value and if the radial gap ratio is less than this value, the detriment of the increased loss will surpass the benefit of decreased slip and blockage. They also realized that the impeller performance is independent of the radial gap size. Furthermore, it was elucidated that pressure recovery (Cp) increases in a smaller radial gap ratio. Robinson et al. [21] reported that decreasing the radial gap ratio substantially increase the efficiency. However, when the diffuser is closer to the impeller compared with the optimum value, the impeller part most probably endures mechanical excitation. According to Ziegler et al. [18,22], reduction in the Mach number at the diffuser vane leading edge is a result of enlarging the radial gap size. The efficiency, pressure ratio and mechanical loading are some other factors that are affected by the radial gap ratio. The main conclusion is that by adjusting the radial gap ratio in each individual case, the flow configuration in the diffuser channel can be optimized. For determining the value of a radial gap ratio for an optimum diffusion, the loading of the vane pressure and suction side should be balanced. Krishnababu et al. [23] executed a numerical study to peruse the interaction between the impeller and diffuser in a high-pressure ratio centrifugal compressor, concluding that the compressor with the radial gap ratio of 1.1 has a higher pressure ratio and pressure rise in comparison with the compressor with the radial gap ratio of 1.05. Although so many researchers have investigated the effect of a radial gap ratio on the performance of centrifugal compressors, few works have examined to how to select a suitable radial gap ratio for a specific situation.
In this paper, the effect of the various design of a radial gap on the performance of the high pressure ratio centrifugal compressor and the flow phenomena inside the compressor components is investigated. For this purpose, vast numerical investigations using steady three-dimensional Reynolds-averaged Navier-Stokes simulations at six different radial gaps for five rotational speeds have been conducted. Different designs of the radial gap are studied thoroughly. Furthermore, as the flow behavior in the interaction between the impeller and diffuser may be critical, the steady simulation should predict it carefully. Therefore, in order to verify the reliability of results obtained by the steady simulation, unsteady simulations for two radial gap ratios at transonic tip-speed Mach numbers were executed and the results are compared with steady ones. At the end, although different investigations showed that choosing an optimal radial gap ratio is strongly depending on the geometry [24,25], optimum radial gap ratio for a specific range of tip-speed Mach number (Mu) for a high-pressure ratio centrifugal compressor are suggested according to the results of the survey in this paper.
2. Materials and Methods
2.1. Investigated Compressor
The compressor used in this paper is TTL-1, an in-house designed high-pressure ratio centrifugal compressor. The compressor can achieve a peak isentropic efficiency of 79.7% and peak pressure ratio of 8.12. A precise explanation of evaluating the TTL-1 compressor performance has been previously described by He et al. [26]. Some of the compressor geometry and the operating condition specifications are shown in Table 1.
To improve the performance of high-pressure ratio centrifugal compressors, investigation of the radial gap ratio, splitter blades, casing treatment, tandem blades, 3D features and some of the designs features of TTL compressors can be helpful. The radial gap between the impeller trailing edge and diffuser leading edge is studied in this paper as a design feature for developing the high pressure ratio centrifugal compressor.
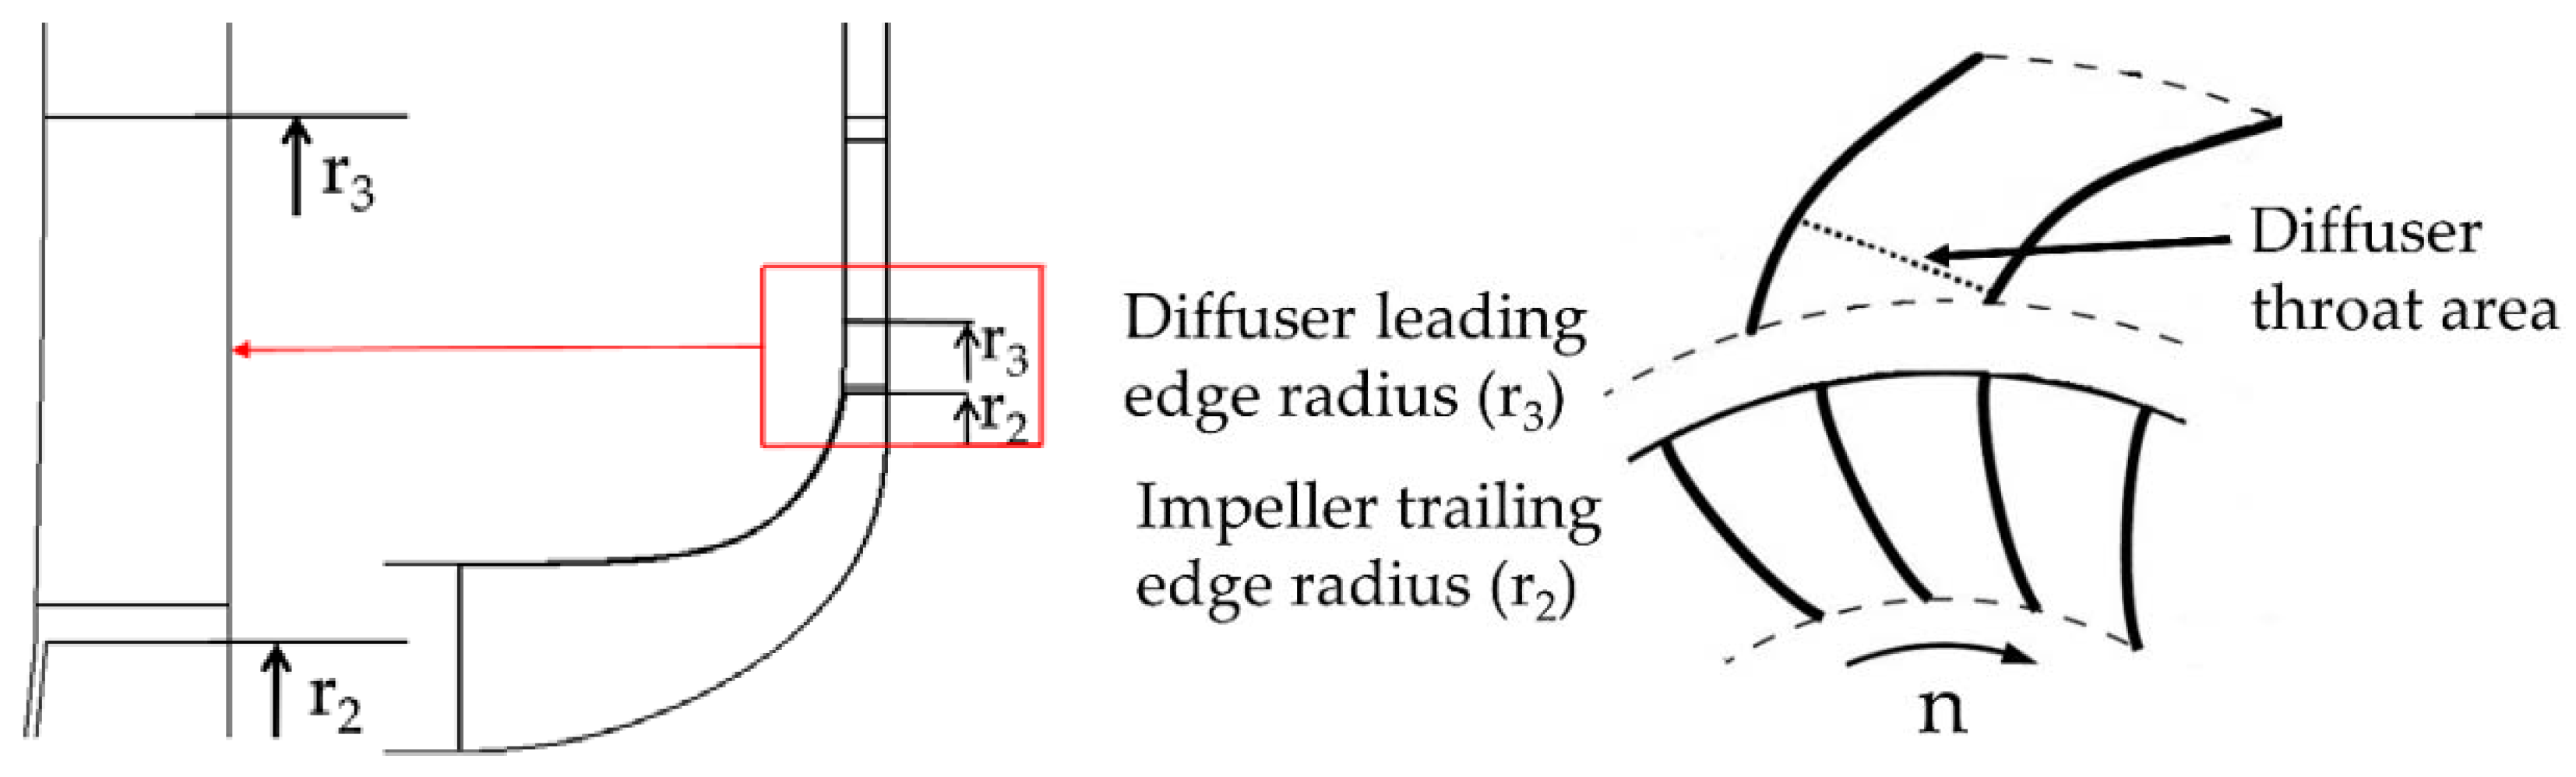
The schematic of radial gap ratio is represented by the radius ratio r3/r2 in Figure 1. As the impeller trailing edge radius (r2) is constant, varying the diffuser leading edge radius (r3) contributes to the various radial gap ratios. In this study, in order to investigate the effects of different radial gap sizes on the performance of the compressor, we varied the radial gap size from 1.04 to 1.14 by adding 0.02 to the size of the previous radial gap. Other geometry characteristics of the compressor are kept constant during this study.
2.2. Numerical Methods of Steady Simulations
Setting up a simulation model is the first significant step for the accurate study of the flow field inside the compressor. For this purpose, the Computational Fluid Dynamic (CFD) simulation was conducted based on a three-dimensional, steady-state, compressible and finite volume layout. EURANUS (NUMECA FINE/Turbo) [27] solver was used to solve the Reynolds-averaged Navier-Stokes equations. The central scheme and fourth-order Runge-Kutta scheme were utilized for spatial discretization and temporal discretization, respectively. We compared four various turbulence models (Spalart-Allamaras (SA) [28], SARC [29], k-ε with extended wall function [30] and SST [31]) for analyzing the same compressor prototype with the same numerical setup (Figure 2 and Table 2). We confirmed the reliability of the Spalart-Allamaras (SA) model in terms of performance as well as computational time and cost. Therefore, the one-equation model, Spalart-Allamaras (SA) is applied as the turbulence model in this investigation.
A real gas is utilized for representing the air characteristics as the working fluid in all simulations. The boundary conditions used in this research are summarized in Table 3. The absolute total temperature and absolute total pressure were imposed as the inlet boundary conditions. Depending on the operating condition, two types of outlet boundary condition are set. At the near surge condition, the averaged mass flow rate is imposed at the diffuser exit while an averaged static pressure with backflow control is set for other operating points. The impeller of the compressor is rotating and the vaned diffuser is set as stationary. The impeller hub wall is rotating with the impeller blade, while the diffuser hub stands stationary with the diffuser blade. The shroud of both the impeller and diffuser remains stationary. The thermal condition for the simulation is set as adiabatic. A non-slip condition is adjusted for the solid walls. A periodic matching boundary condition is applied between the adjacent compressor passages.
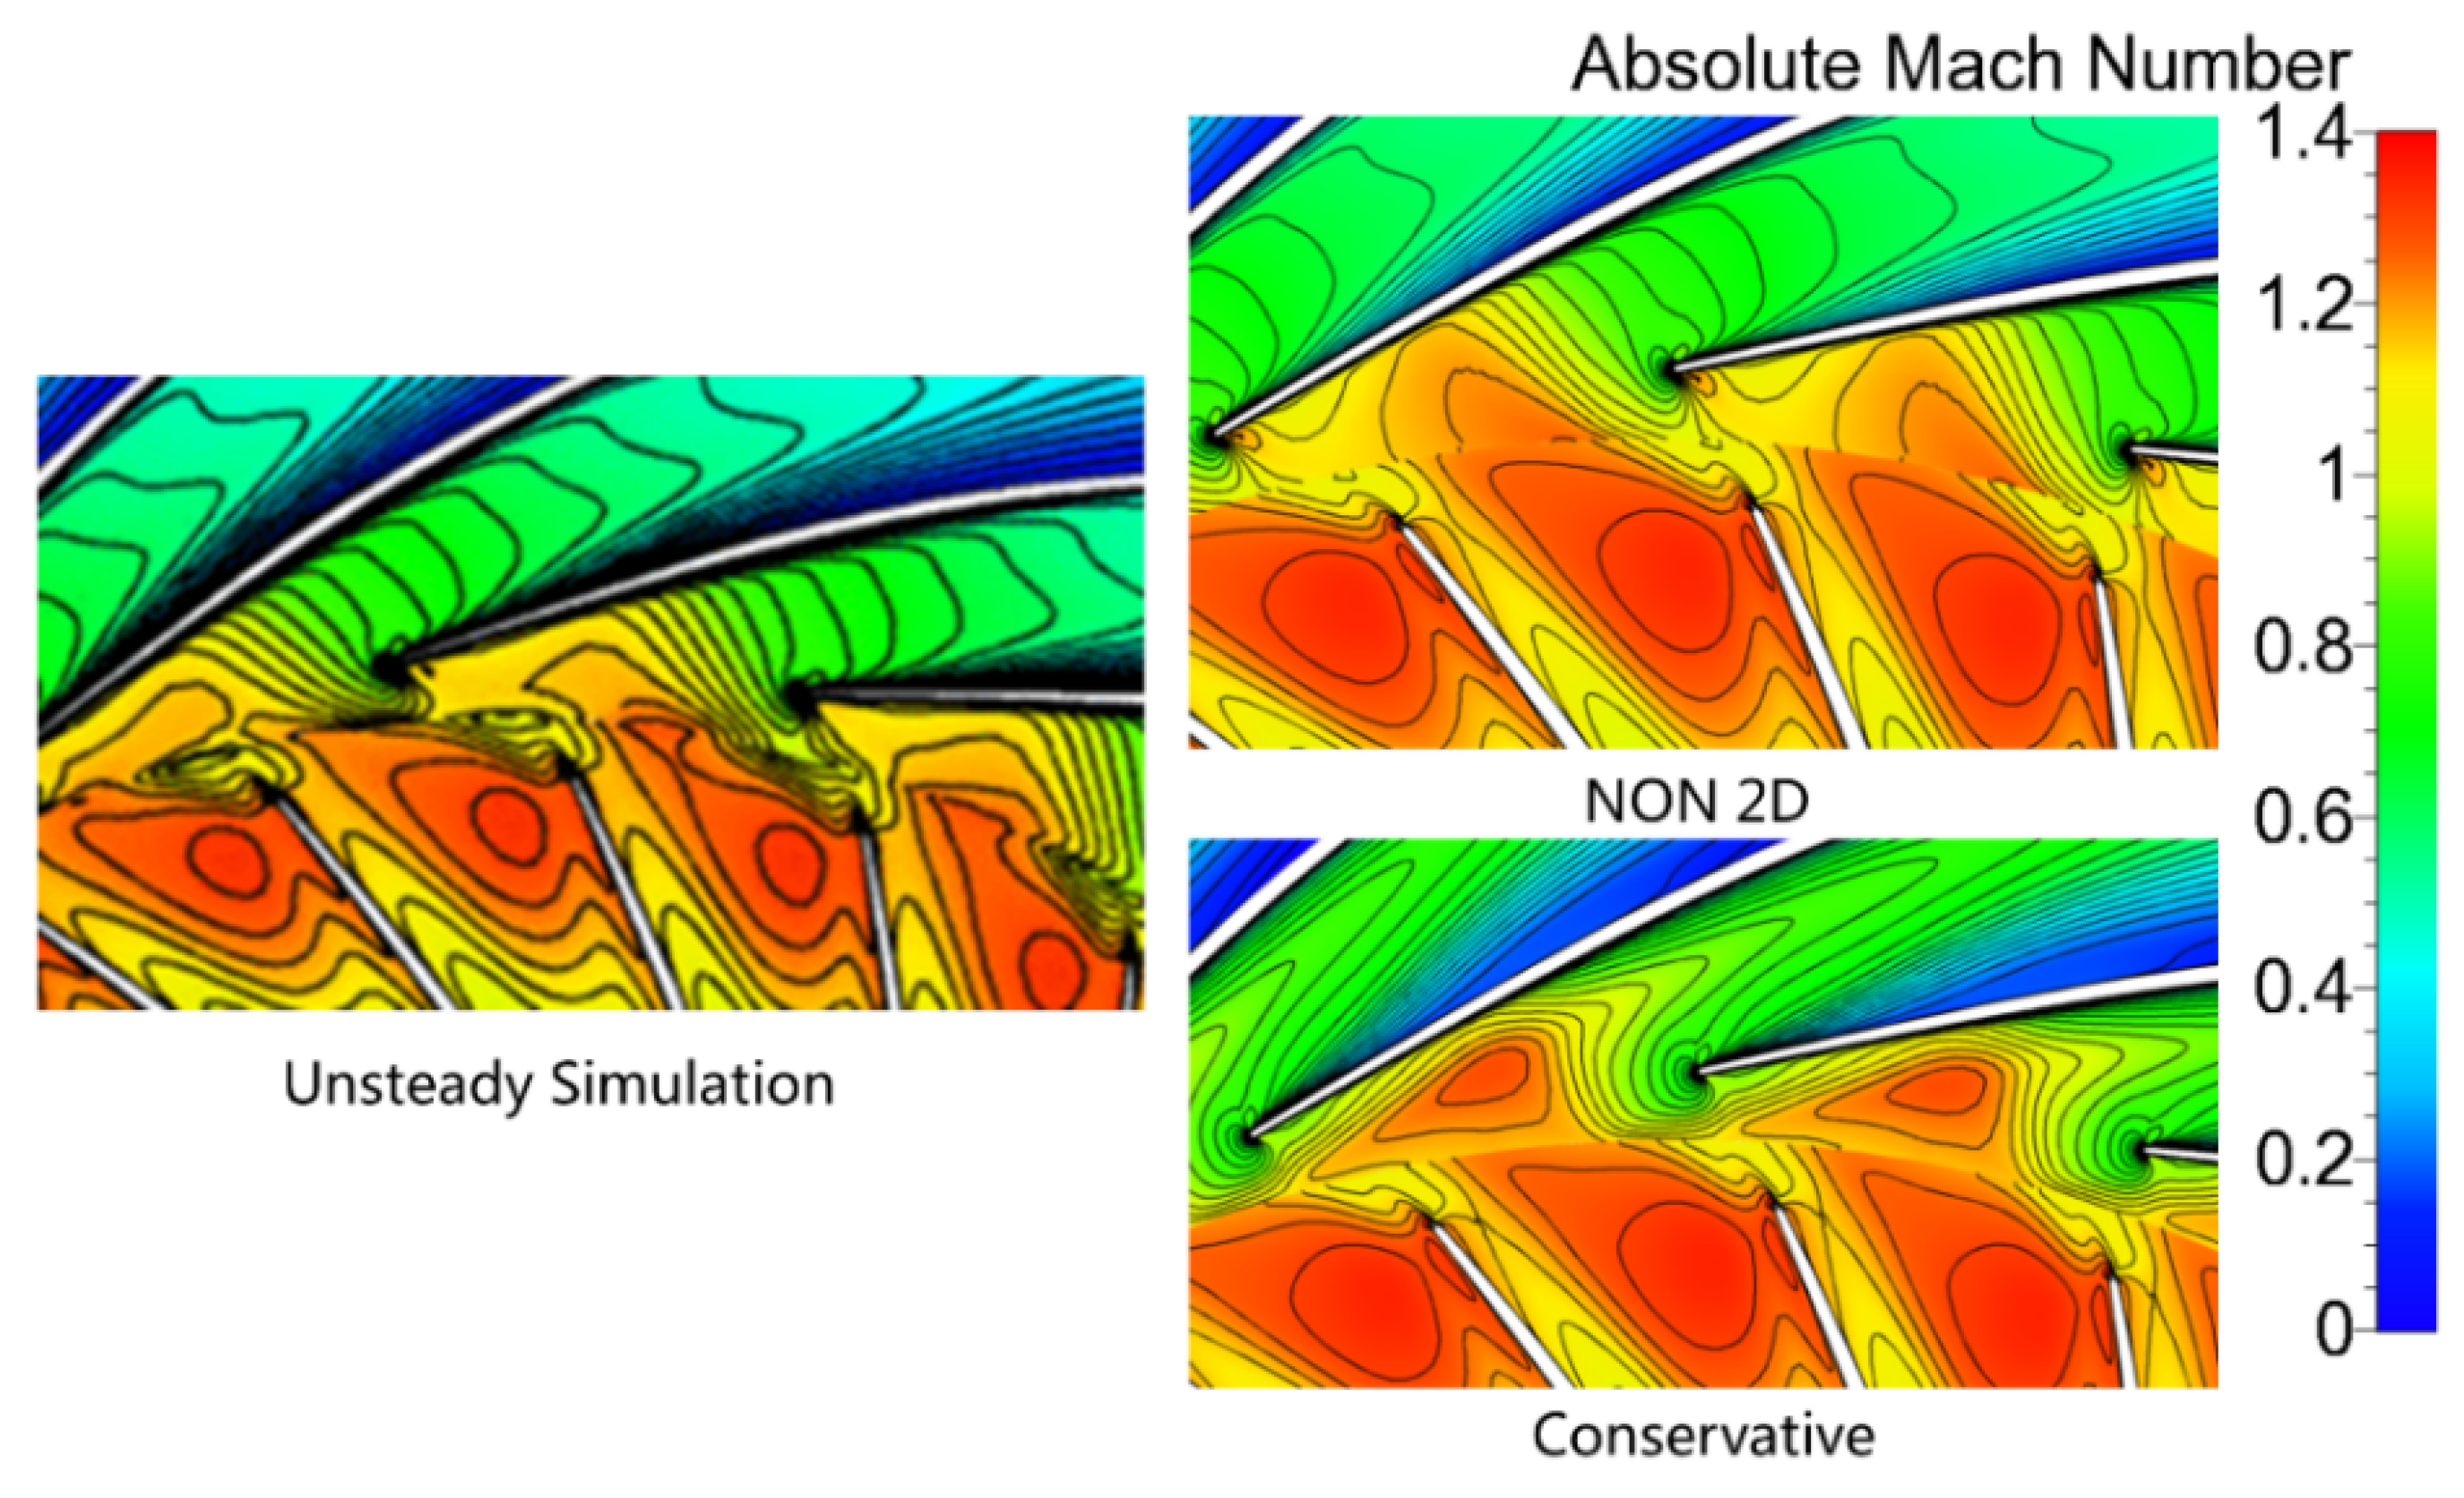
For choosing an appropriate interface model in this investigation, we compared the effects of different interface model on the compressor performance and flow field (Figure 3). We also compared the absolute Mach number in different interface model with unsteady simulation (Figure 4). Finally, in this study, the rotor/stator interface is achieved with the non-reflecting 2D model, which is a subset of the mixing-plane method because it has better performance and is consistent with unsteady simulation and can predict the flow behavior inside the compressor accurately.
A significant issue in this study is studying the effects of even small radial gap ratios (e.g., radial gap ratio of 1.04) on the high-pressure ratio centrifugal compressor performance. Thus, the physical model (except the radial gap ratio) for all cases should be kept constant. Therefore, the interface radius ratio, which is defined as rInterface/r2, is set as small value of 1.02. To confirm that the small interface radius ratio does not have a substantial influence on the compressor performance, the performance of a compressor with interface radius ratio of 1.02 and 1.05 are compared in Figure 5. The compressor prototype, physical model, turbulence model, boundary condition, and the simulation settings are all the same for this comparison. It can be seen from Figure 4 that the maximum pressure ratio and maximum efficiency for the compressor with interface radius ratio of 1.02 are 0.24% higher and 0.75% lower, respectively. Therefore, interface radius ratio of 1.02 applied in this study is acceptable.
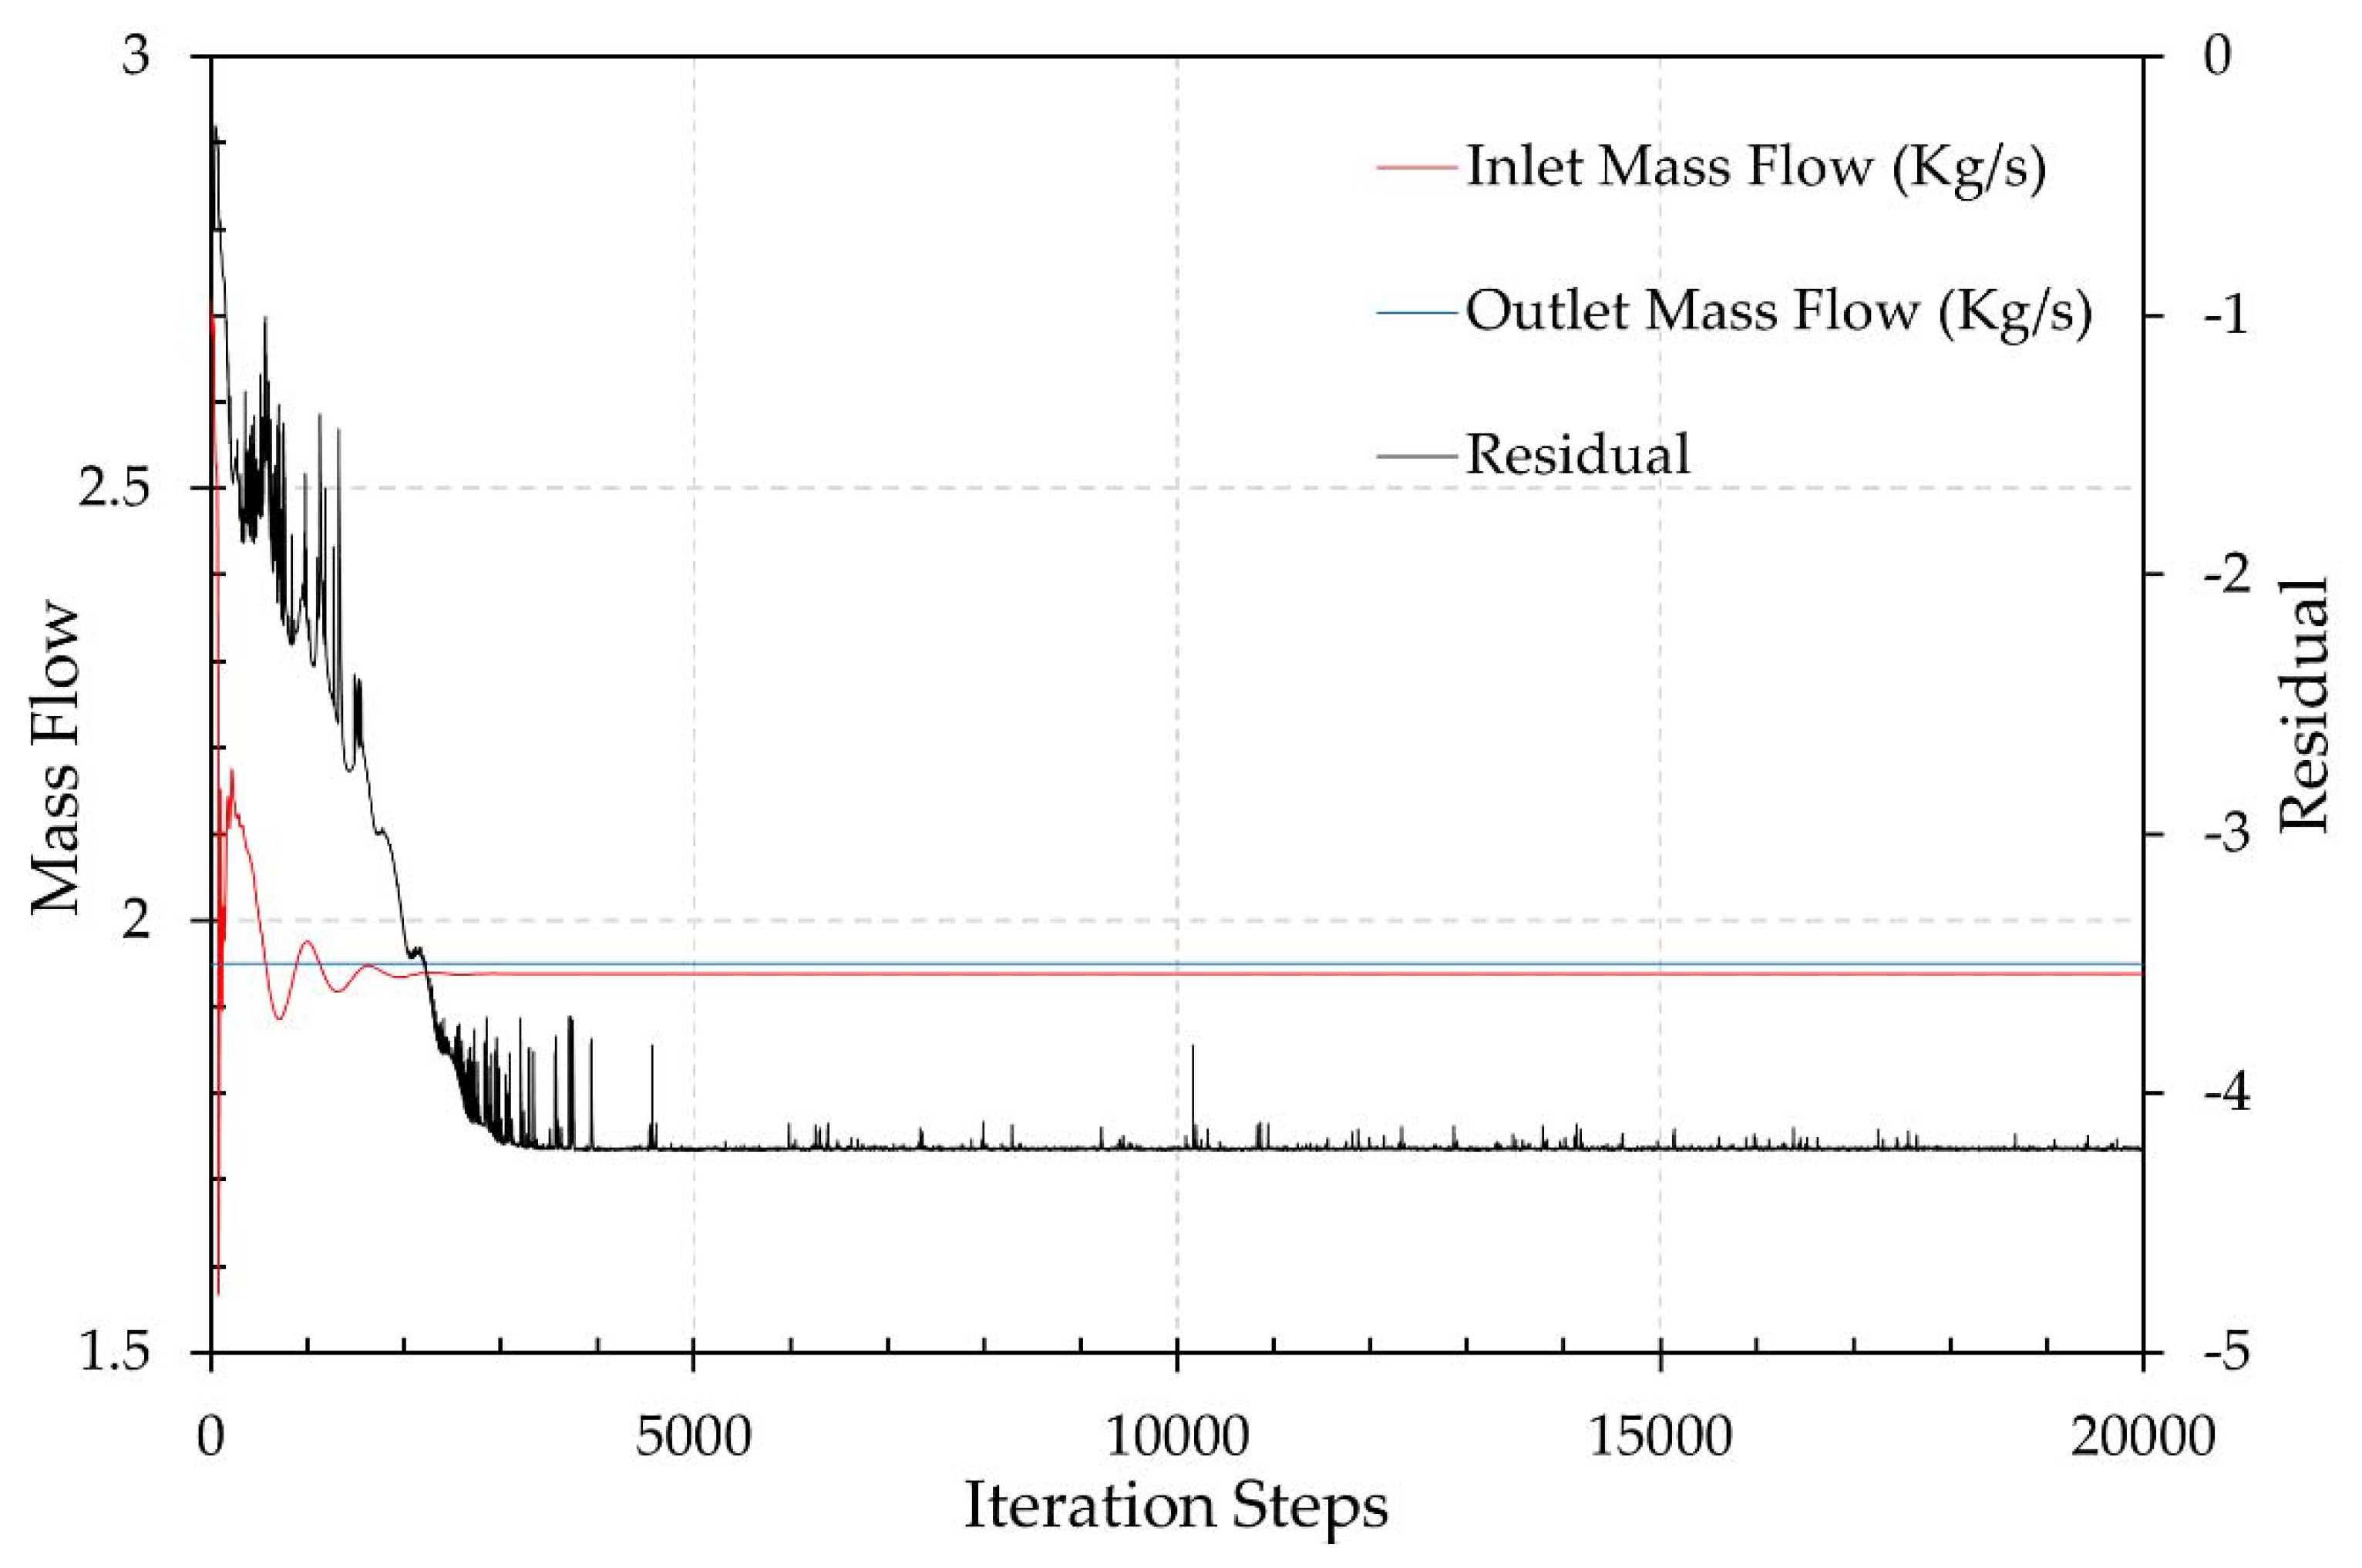
Normally, the simulation of each rotational speed line is started with a relatively small back pressure to simulate the chock condition. In order to save computational time, the previously converged result is utilized as the initial solution for each operating point. For the specific rotational speed, an oscillatory variation occurs for the residual point at the mass flow rates near the surge condition and the convergence rate decreases. However, for the mid-operating point away from the surge point, the oscillation of the residual does not occur and the convergence rate becomes higher [32]. Therefore, the operating points that exceed 20,000–25,000 iteration at near surge and 7000–8000 iteration at mid-operating points with no sign of numerical instabilities are considered to be converged. The convergence criteria for the computations are as follows:
- All quantities do not vary more than 0.1% over at least 500 consecutive iterations.
- Global residual with order of lower than −4.
- The inlet and outlet mass flow rates level off within 0.5% of each other.
Figure 6 illustrates the convergence history of an operating point near the surge condition at Mu = 1.05.
2.3. Numerical Methods of Unsteady Simulations
The expert mode of Numeca FINE/Turbo EURANUS solver was utilized for the computations to solve Reynolds-averaged Navier-Stokes equations. The Spalart-Allmaras one-equation model was selected as the turbulence model. As the periodicities of the computation domain are not equal, the phase lagged method was employed for the rotor-stator section. The same boundary conditions as the steady simulations were set for the unsteady simulations. For the outlet boundary condition, the same averaged static pressure with a steady simulation with backflow control is applied. The central scheme was used for spatial discretization. The dual time stepping approach proposed by Jameson was employed for temporal discretization. The number of angular positions and the number of time steps were set as 19 and 15,000, respectively. Furthermore, the maximum number of inner iteration was set to 30 for each physical time step. A proper initial solution is required for the unsteady simulation. The result of the same operating point in the steady simulation was used for the initial solution for each unsteady operating point.
2.4. Meshing
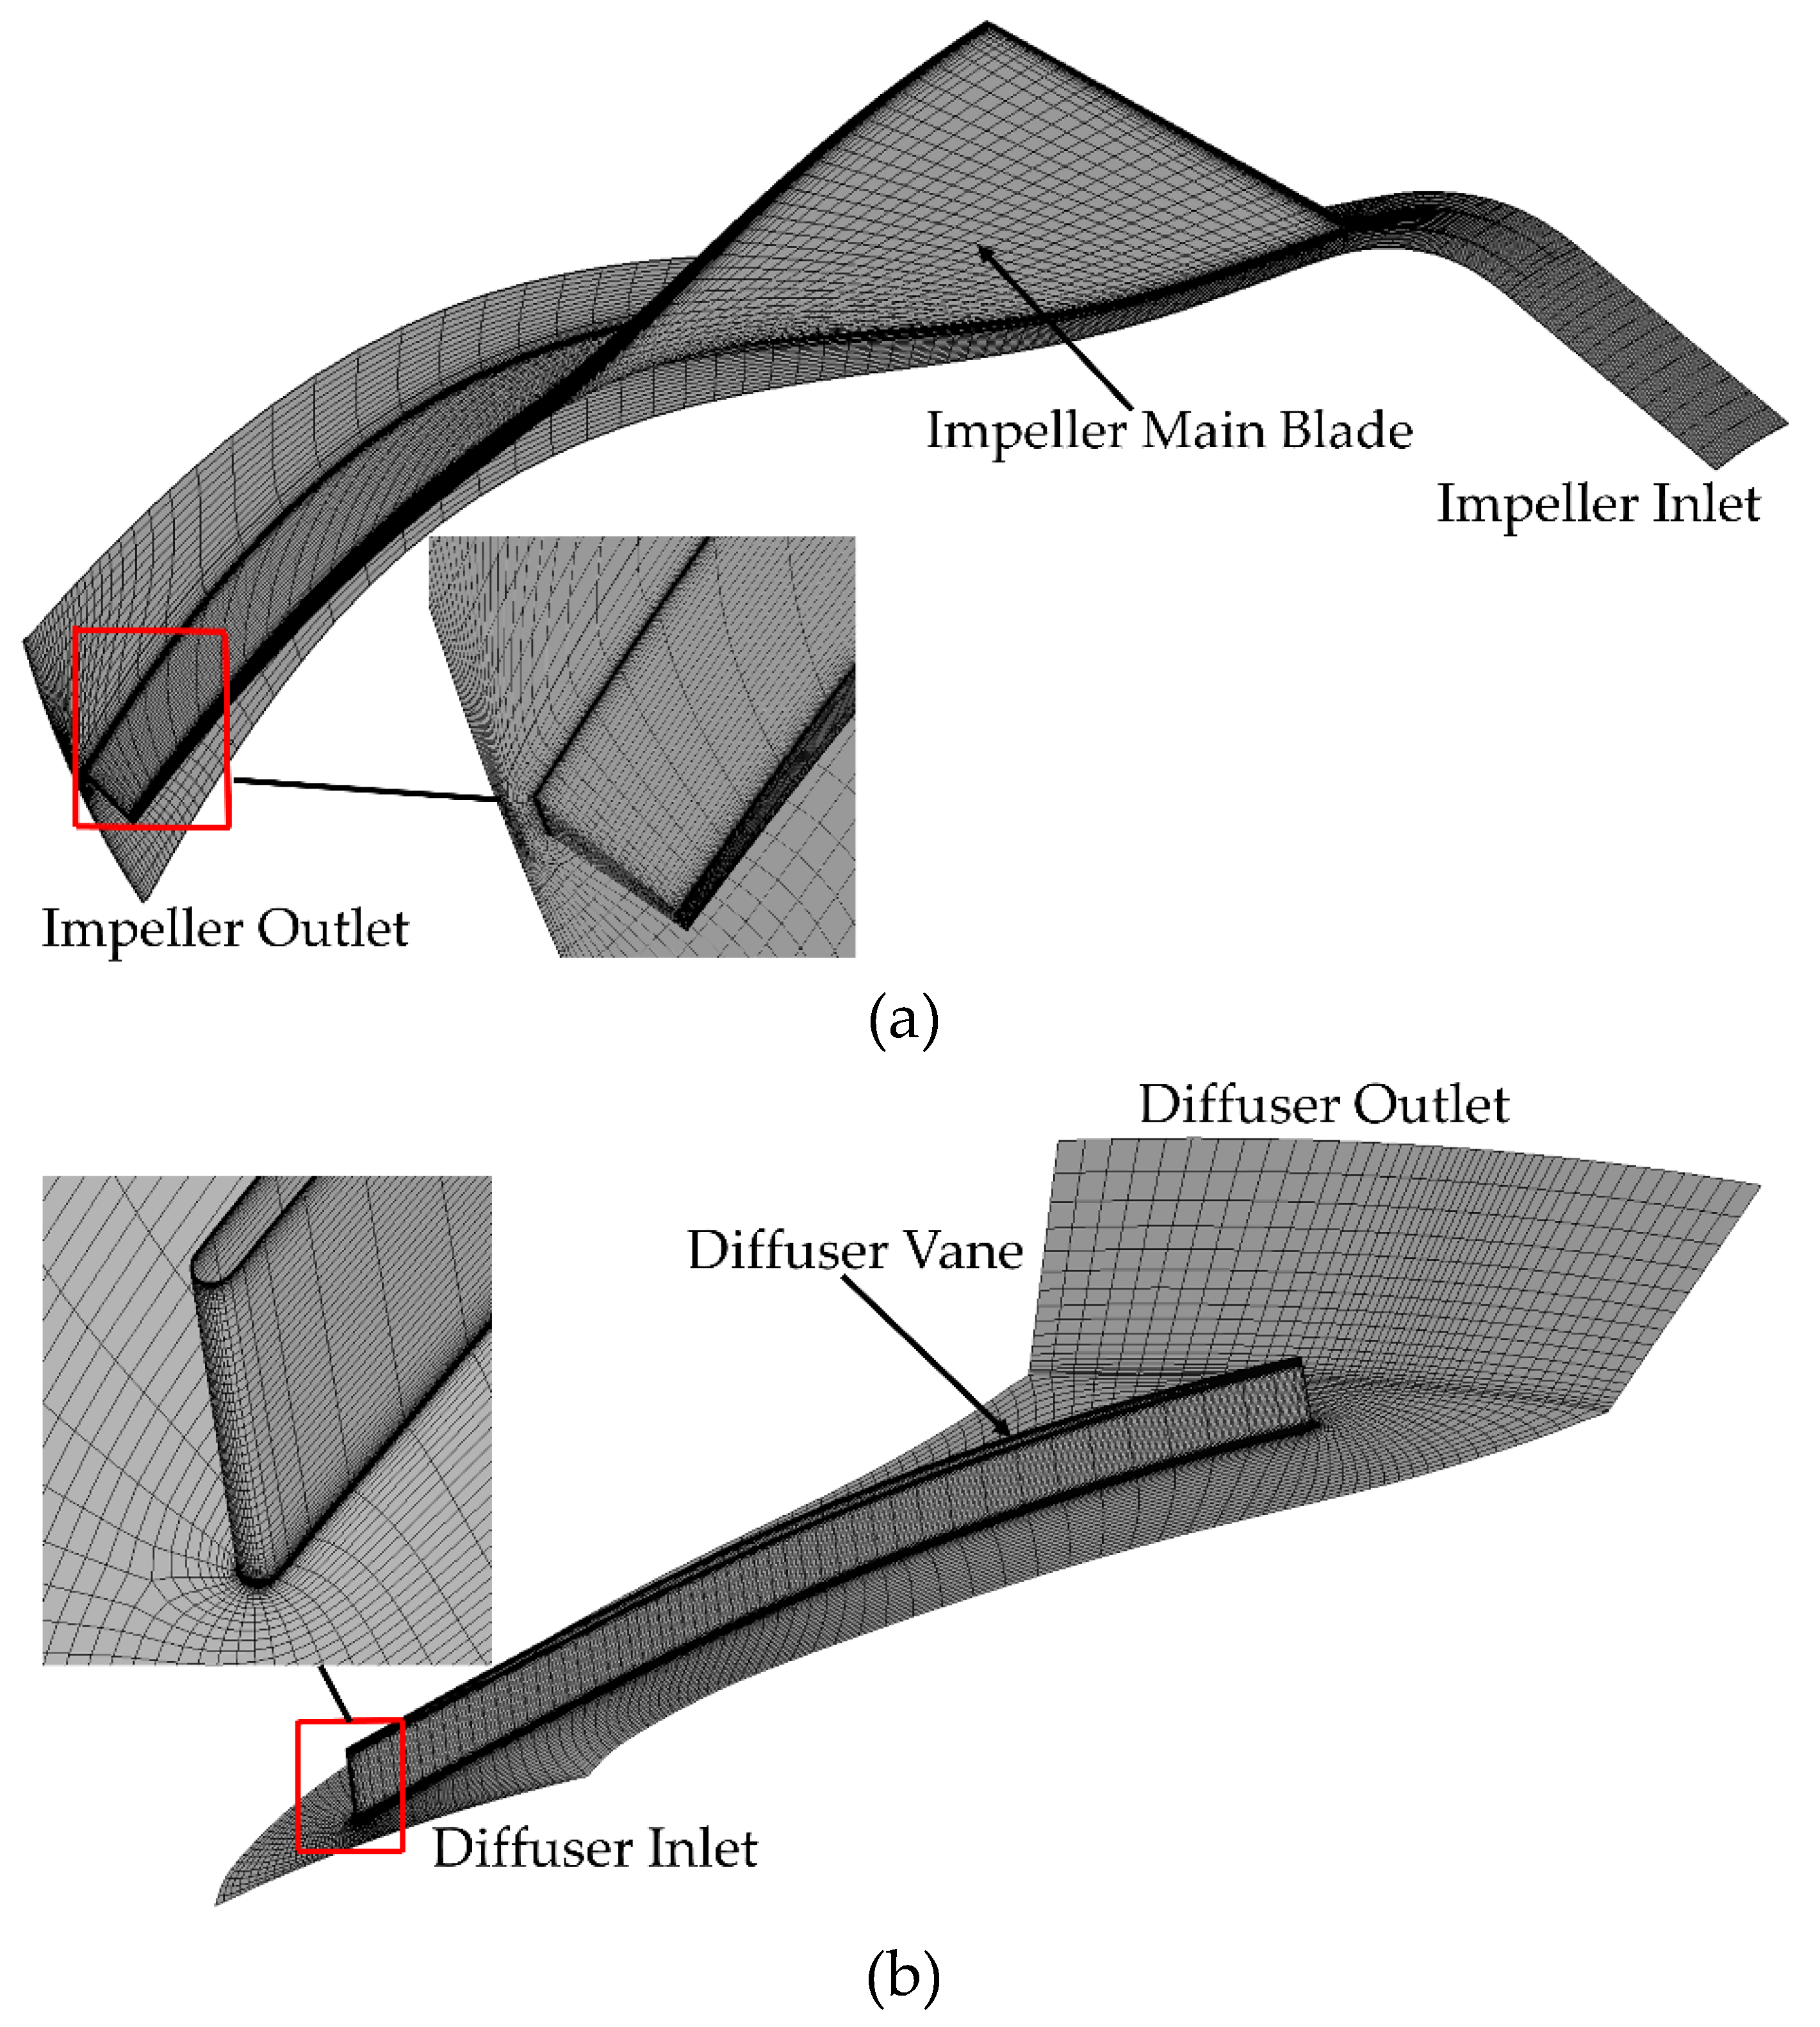
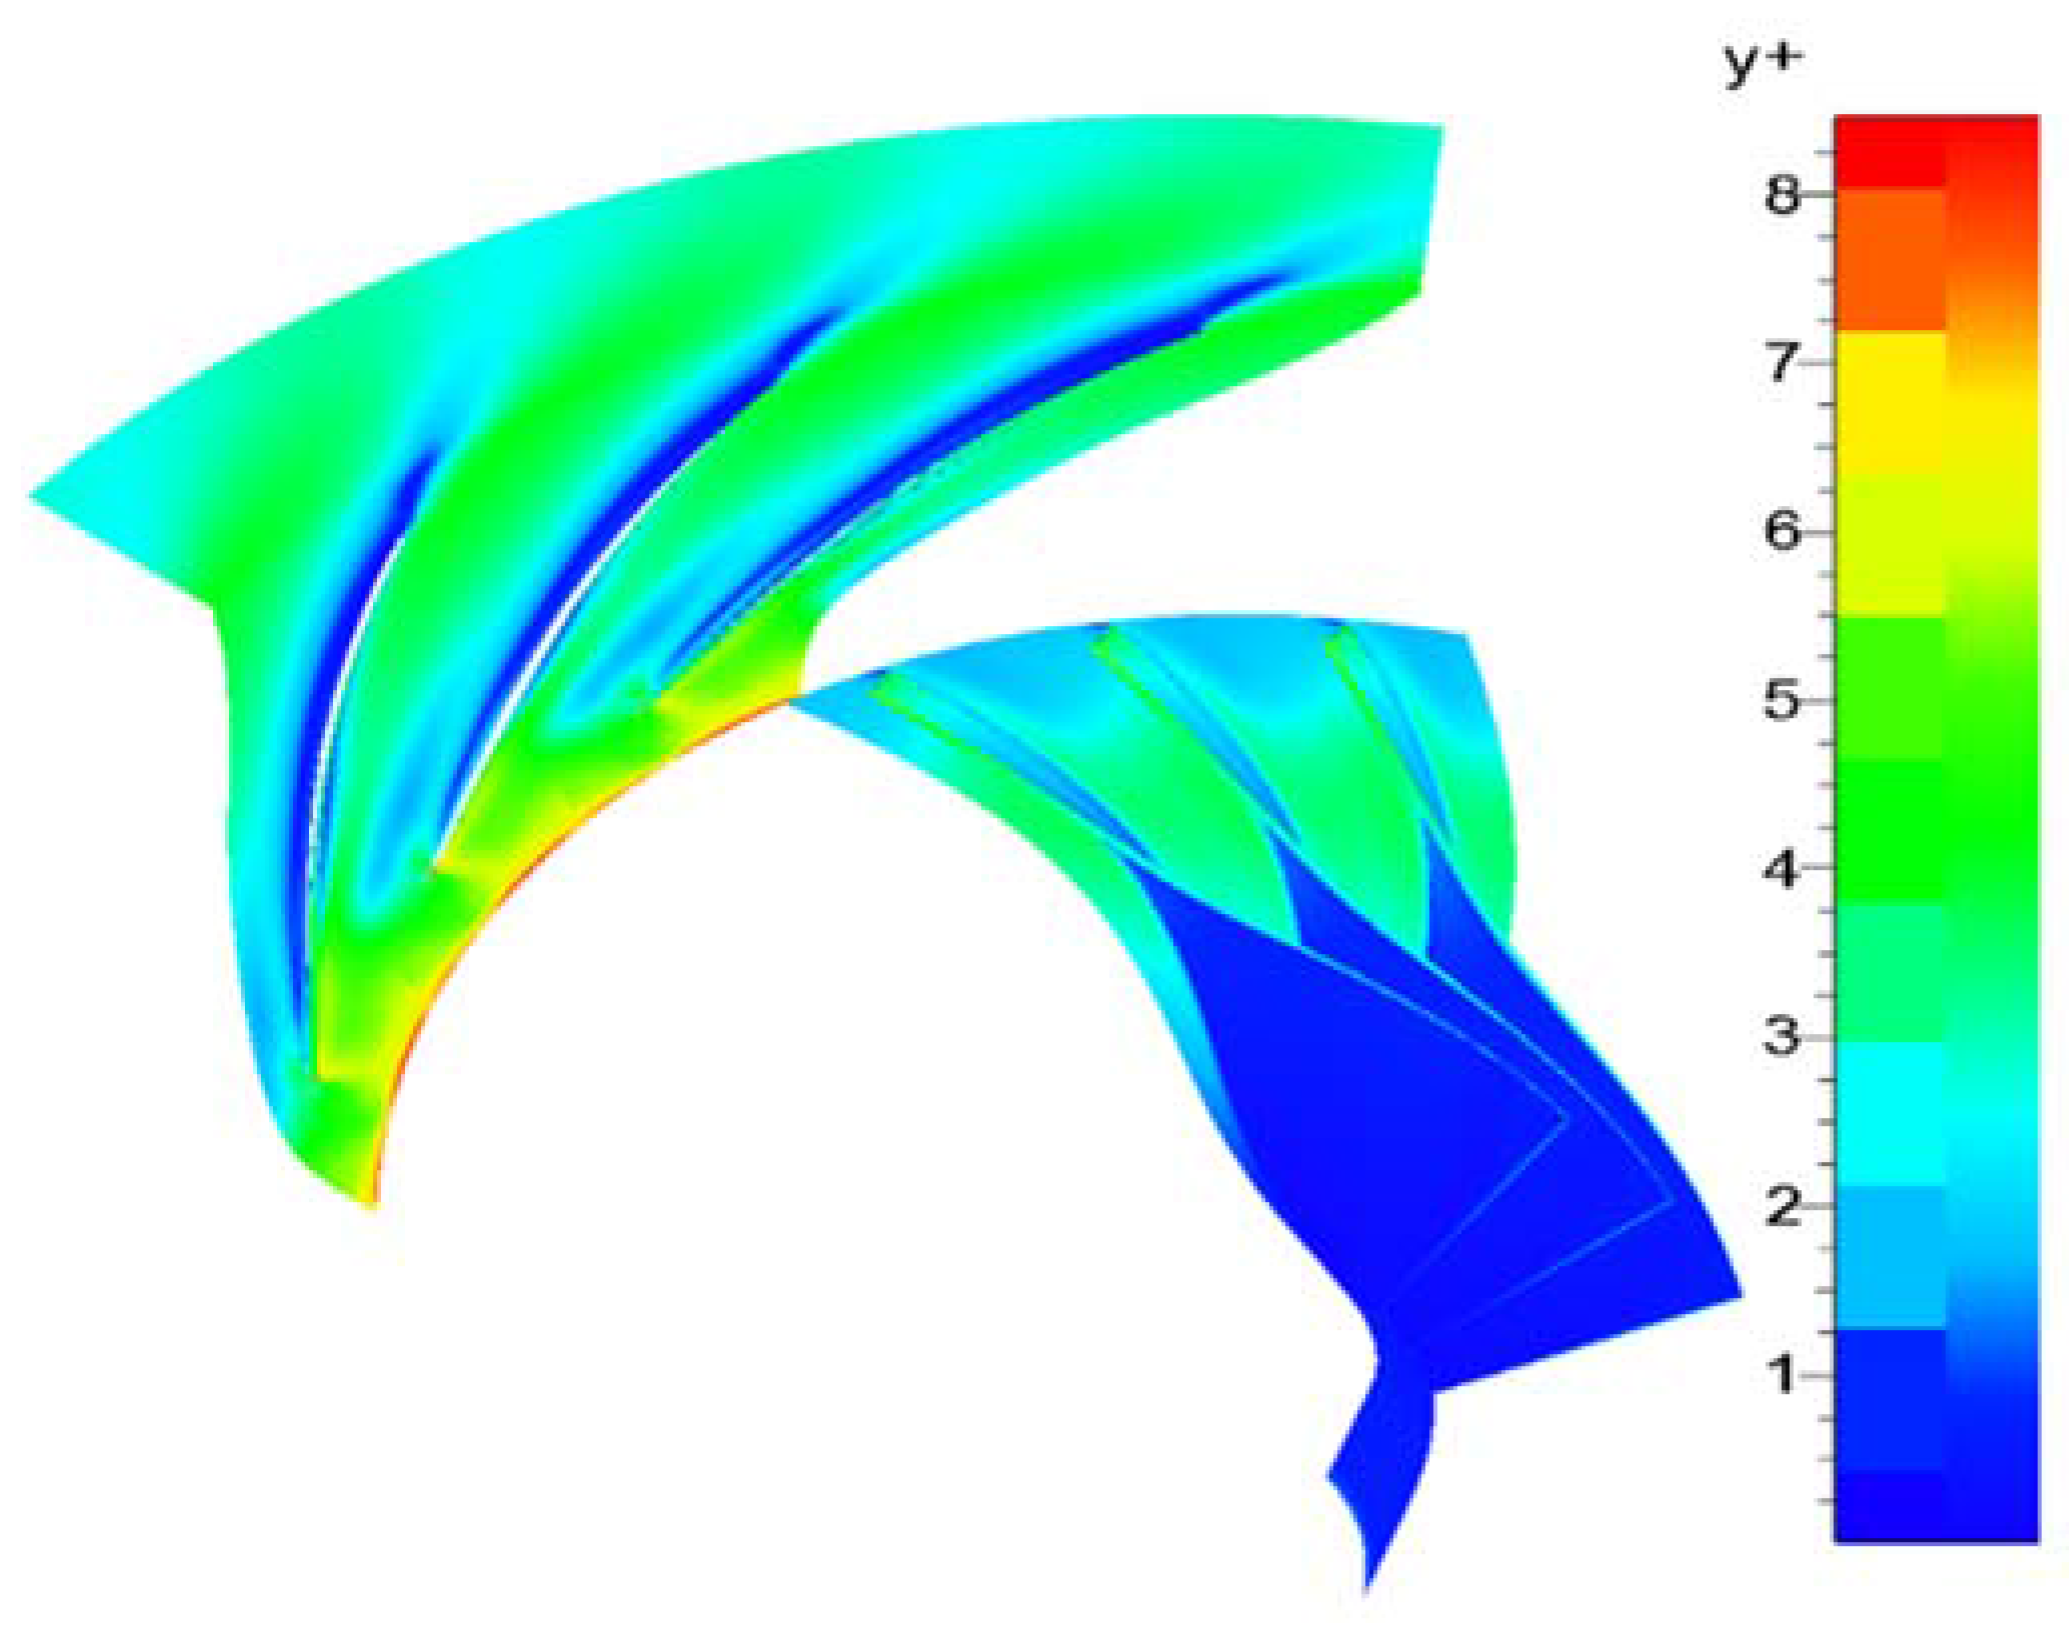
The impeller utilized in this study contains 24 blades and the vanned-diffuser consists of 19 vanes. Only one single passage of the impeller and the vanned-diffuser is meshed by a multi-block structured grid using conjunct blocks. We employed a multi-block structured mesh with an O4H topology scheme. The grid independency was examined by the co-authors in this present study [26]. The mesh with 998,994 nodes was built for a final grid of the compressor, which is represented in Figure 7. The impeller and the diffuser separately contain 559,680 and 439,314 nodes, respectively. The number of grid points in the streamwise, spanwise and pitchwise direction is 118, 73 and 43 nodes for the impeller as well as 74, 73, 74 nodes for the diffuser, respectively. The maximum expansion ratio in the impeller and diffuser is below 3, while the minimum skewness angles are 16.8° and 37.1°, respectively. All the tip clearance through the compressor passages is set as 5.6% of exit blade height. This value of the tip clearance leads to a small scalar averaged y+ for the whole compressor. The small scalar averaged y+ is set to have adequate boundary layer resolution for the Spalart-Allamaras (SA) model. Figure 8 shows that y+ is around 1.6, with the maximum value below 10 for all the solid walls at the design and off-design conditions. This is acceptable for the Spalart-Allamaras model to obtain valid conclusions. The mesh size and topology are all the same for all studied cases in this present work. The same meshing is used for unsteady simulations.
2.5. Validation with Experimental Data
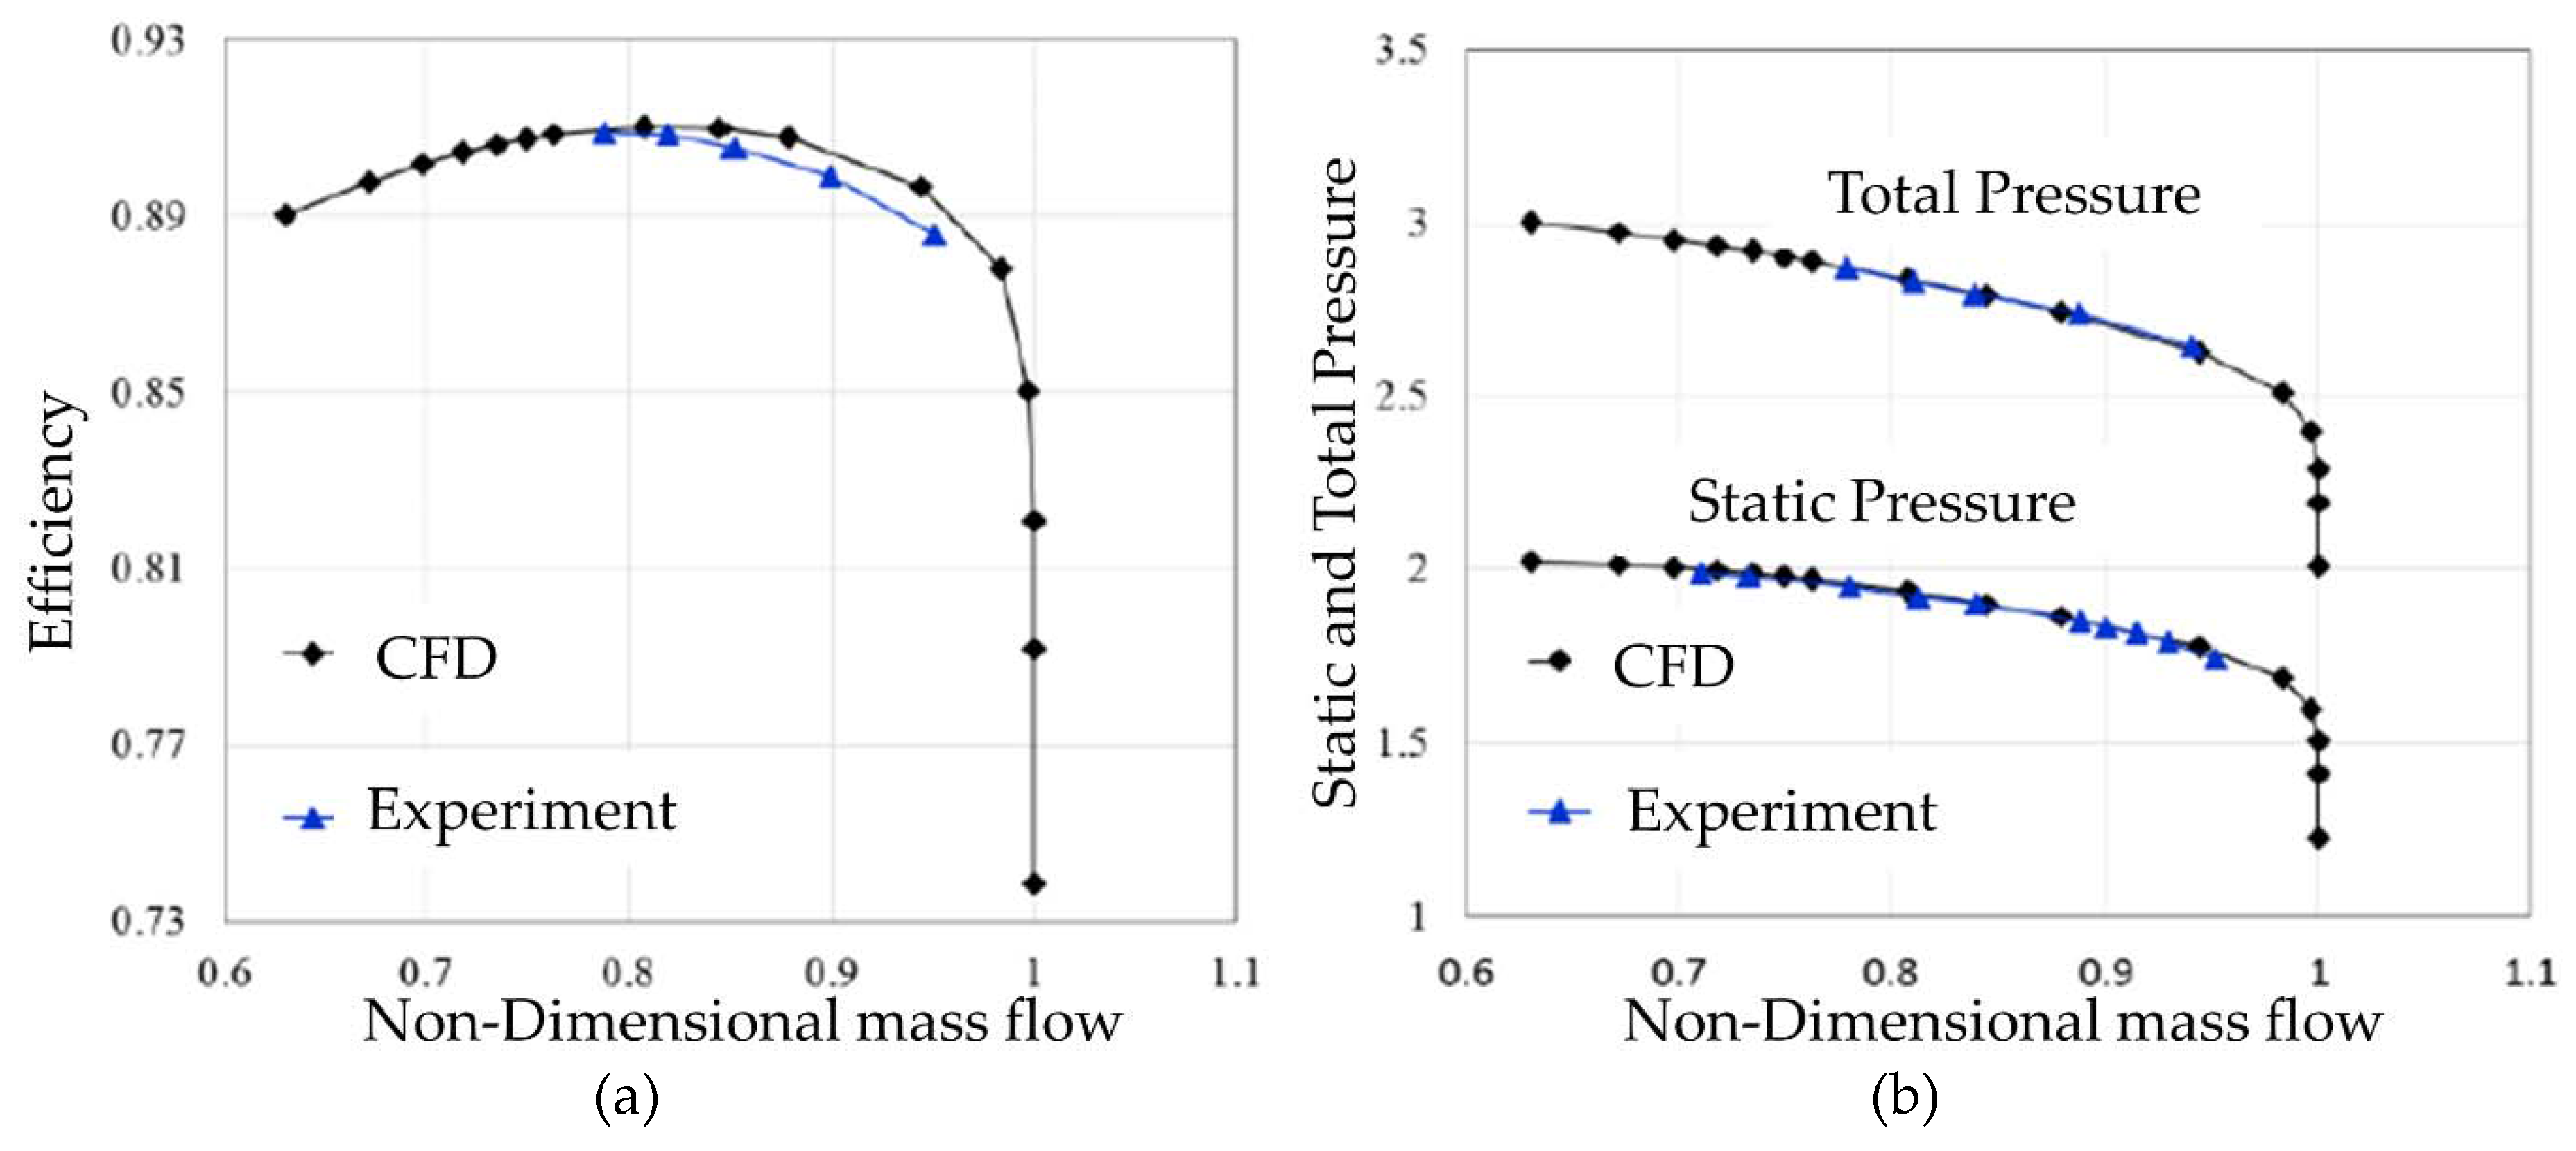
In order to corroborate that the CFD simulations have adequate accuracy, the results obtained by the simulations must be validated. For this purpose, the simulation results should be compared with the experimental results. As the current work is done and simulated by the same CFD software EURANUS (NUMECA), the same turbulence model (S-A) and the same boundary conditions as the work done by Mirzaee et al. [33], the validation reported in their research work is used for validating the numerical simulation in this study. They compared the overall performance of the CFD results and experimental results. The comparison of the isentropic efficiency and static as well as total pressure predicted by the CFD simulation and the experiment data are presented in Figure 9. The highest deviation between the CFD simulation result and the experimental results for the isentropic efficiency is 0.81%, which indicates that the CFD has adequate accuracy for simulating the flow. Furthermore, the comparison of the static and total pressure of the experiment data and CFD simulation shows that the results with CFD are consistent with the experimental data.
The meridional velocity and the relative velocity contours of CFD simulation were also compared with the experimental data in Figure 10.
The overall prediction of the meridional velocity and relative velocity are excellent. However, there is a small difference between the CFD and experimental data for the relative velocity contour. The regions with a low relative velocity which presents the wakes are mostly central in CFD when it is near the suction side for the experimental data. A too large tip clearance can be responsible for this small difference.
Therefore, it is confirmed that all the significant characteristics of the compressor, such as stage performance as well as the meridional velocity and relative velocity, obtained by the CFD simulation are in excellent agreement with the experimental data. Therefore, the CFD simulation utilized in this study and its results can provide strong evidence for this research.
3. Results and Discussion
The TTL-1 high-pressure ratio compressor with six different radial gap ratios from 1.04 to 1.14 (adding a gap ratio of 0.02 to the previous one) at five rotational speeds of 60%, 80%, 90%, 95% and 100% (Mu: 0.69, 0.93, 1.05, 1.11 and 1.16) were simulated by numerical methods in the steady-state. Furthermore, unsteady state simulations for two radial gap ratios of 1.08 and 1.14 at an 80% rotational speed (Mu = 0.93) were conducted to assess the reliability of the steady simulation. Characteristics of the flow and performance of the compressor are obtained and the following results are represented.
3.1. Comparison between Steady and Unsteady Results
Figure 11 represents the centrifugal compressor performance map, including adiabatic efficiency and total pressure ratio for radial gap ratios of 1.08 and 1.14 at Mu = 0.93. These were calculated by steady and unsteady simulations. The same operating points are shown in the figure.
It can be seen clearly that for the radial gap ratio of 1.08, the mass flow rate resulting from the unsteady simulation is smaller than that from the steady simulation at OPT-1 and OPT-2. The discrepancy decreases to its minimum value at OPT-3. Following this, at near peak efficiency (OPT-4), peak efficiency (OPT-5) and near surge condition (OPT-6), the mass flow rate resulting from the unsteady simulation is larger than that from the steady simulation. Moreover, steady simulations compared to unsteady simulations have a higher adiabatic efficiency of 0.1, 0.24 and 0.21 points at OPT-4, OPT-5 and OPT-6, respectively. The pressure ratio is almost the same for both the steady and unsteady simulation.
However, at a radial gap ratio of 1.14, the mass flow rate ensuing from the unsteady simulation is larger than that from the steady simulation for all operating points. This difference is about 1.63% and 1.95% at the peak efficiency point (OPT-4) and near surge condition (OPT-5), respectively. Furthermore, the steady simulation has a higher adiabatic efficiency of 0.32 points compared to the unsteady simulation at near peak efficiency condition (OPT-3). This discrepancy reduces to 0.18 at OPT-4 and 0.12 point at OPT-5. The discrepancy in the total pressure ratio is negligible. These differences between the steady and unsteady results are mainly because the wake recovery is accurately reproduced in unsteady simulations [34].
The results gained by the steady simulation in this are consistent with the unsteady simulation. Therefore, the results are reliable and can predict the compressor performance and flow behavior inside the compressor accurately.
3.2. Effects of Radial Gap Ratio on the Compressor Performance
Performance map is the most important characteristic of a compressor. Figure 12 shows the performance map of the centrifugal compressor for six various radial gap ratios at five tip-speed Mach numbers. As the curves on the map shows, the peak pressure ratio reaches 8.12 at the maximum rotational speed and the radial gap ratio of 1.10. The maximum corrected mass flow is 2.6982 kg/s.
Figure 12 also offers more information about how compressor performance is affected by the radial gap ratio. The discrepancy in total to total pressure ratio is 0.66% for Mu = 0.69 (radial gap ratio 1.10 is compared to the radial gap ratio of 1.14). As the rotational speed increases, the discrepancy is higher. This difference reaches 2.21% and 3.63% for Mu = 1.11 and 1.16, respectively.
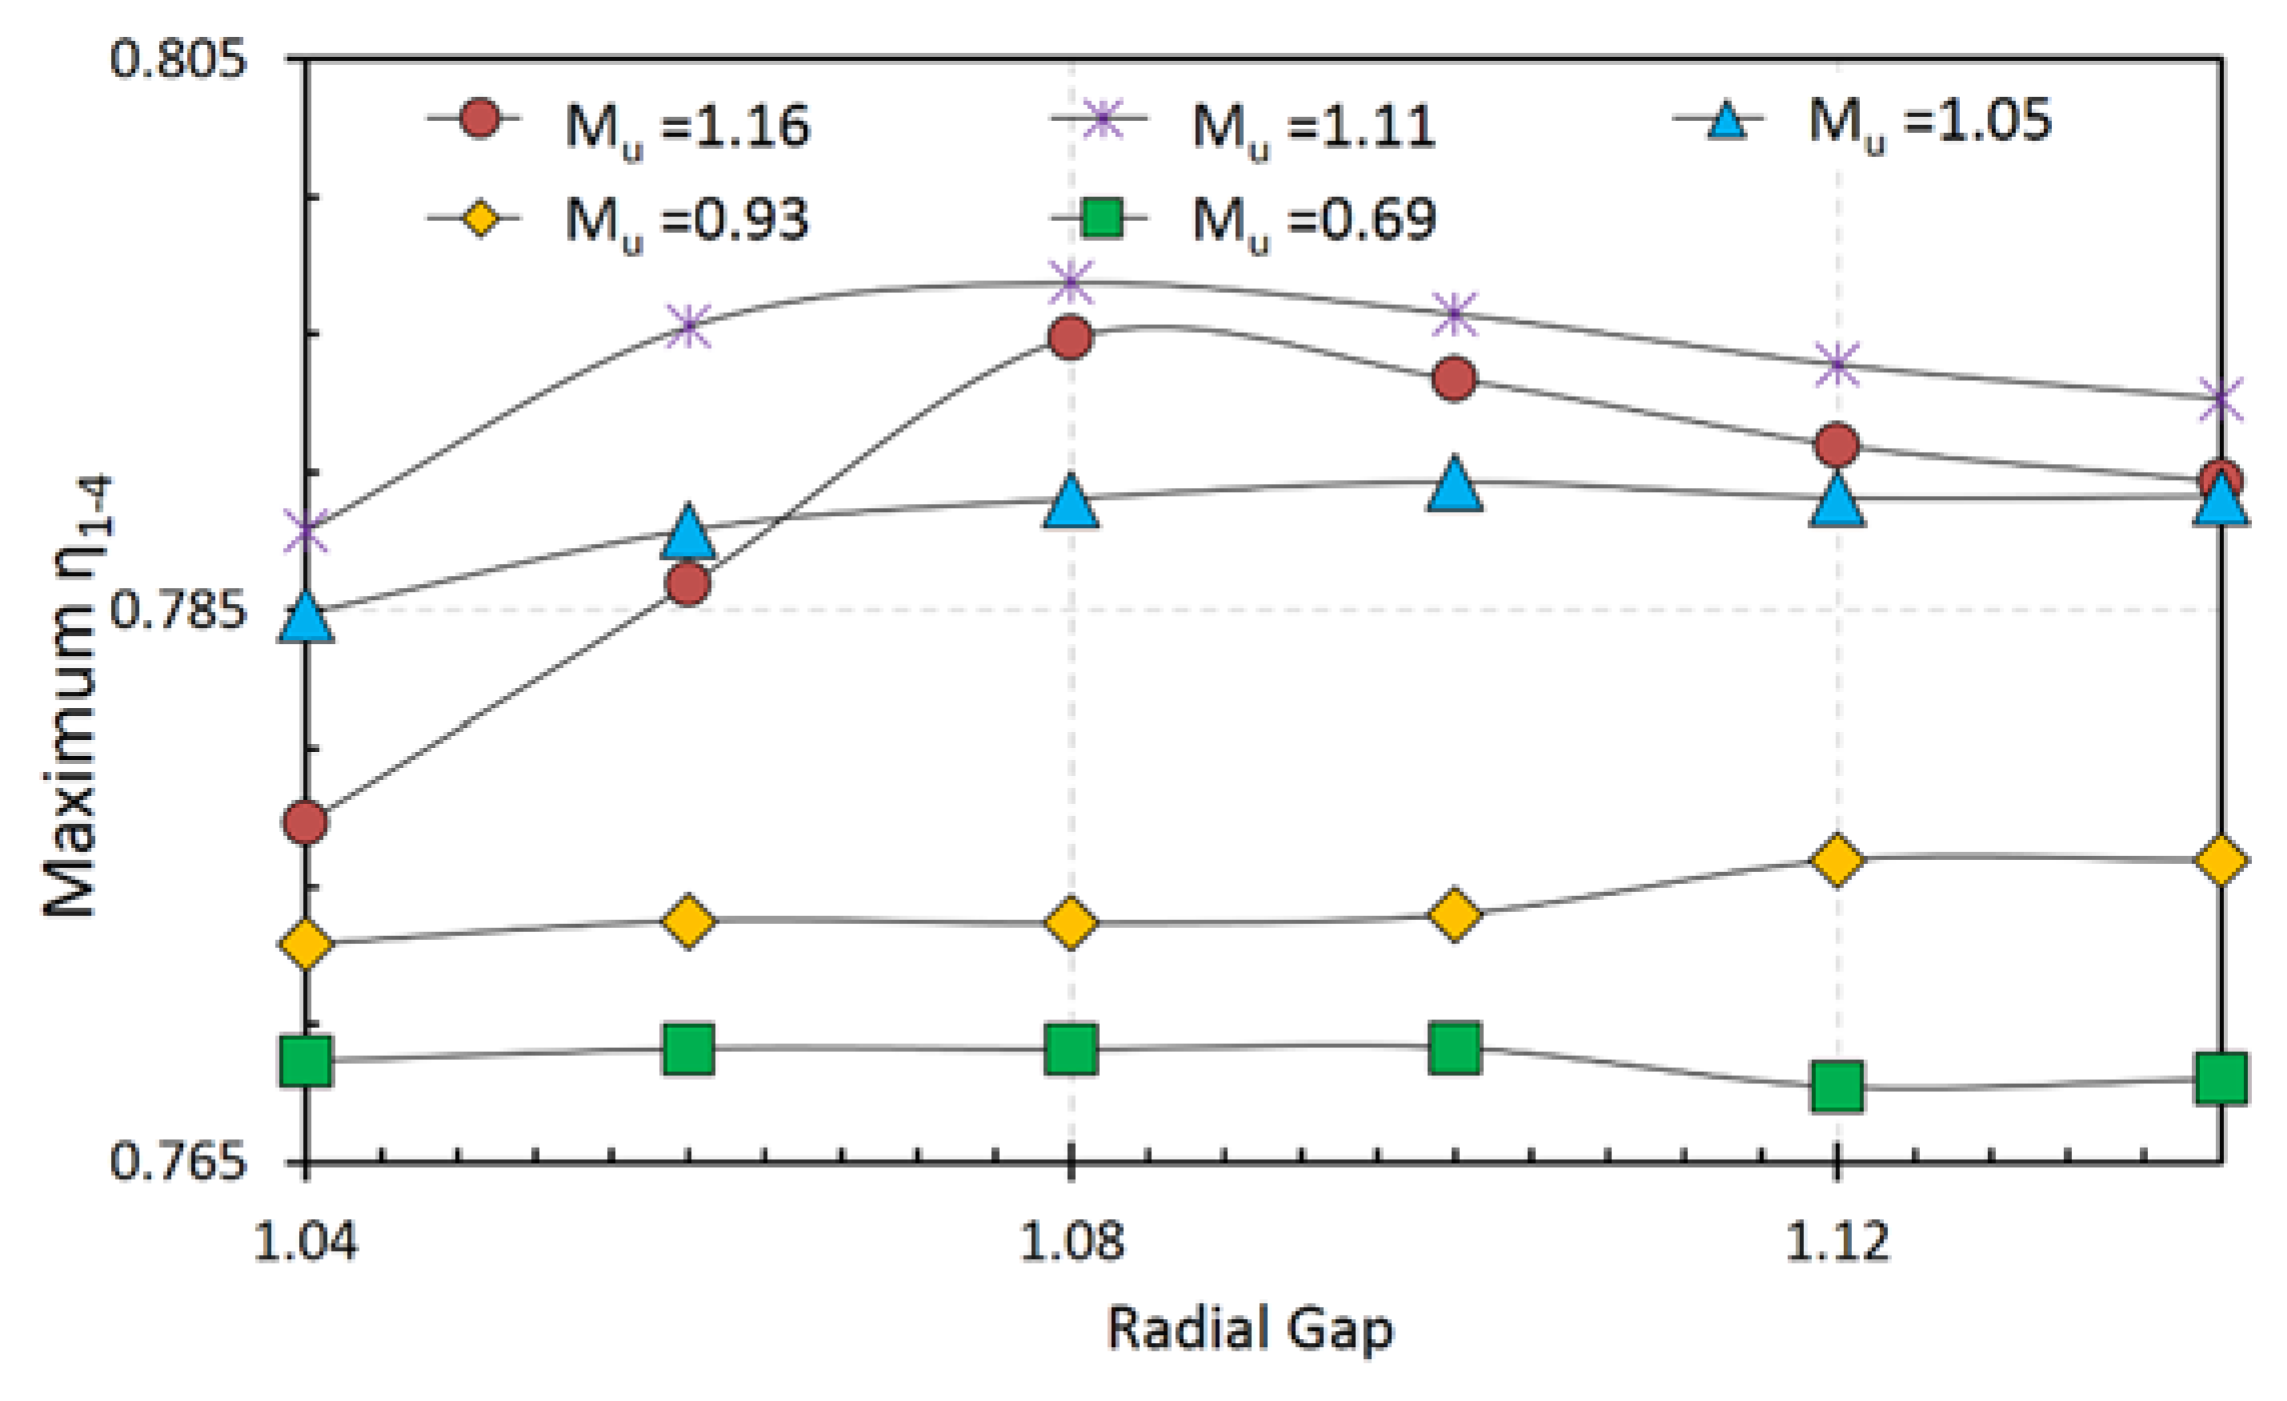
Efficiency can be affected by many factors. Figure 13 shows the compressor adiabatic efficiencies for different tip-speed Mach numbers and radial gap sizes. Adiabatic efficiency for the whole stage of the compressor is dependent on the radial gap size. The maximum efficiency for the tip-speed Mach number of 1.16 is achieved at the radial gap ratio of 1.08. Interestingly, maximum efficiency does not change considerably with the radial gap ratio when Mu is smaller than 1.0. The correlation between the peak efficiency of each tip-speed Mach number (refer to rotational speed) and the various radial gap ratios is shown clearly in Figure 14. At a high tip-speed Mach number (Mu ≥ 1), enlarging the distance between the impeller trailing edge and the diffuser leading edge has a significant effect on the compressor efficiency. However, this effect is not considerable for a low tip-speed Mach number (Mu < 1).
As discussed later, closing the distance between the impeller trailing edge and diffuser leading edge decreases the diffuser throat area. Thus, the Mach number at the diffuser leading edges increases. This is a significant and major cause for diminishing the value of the choke mass flow rate, which influences the matching of the impeller and diffuser [35]. At the smaller radial gap ratio, the Mach number exceeds unit value sooner. Therefore, the choke in the lower radial gap ratio occurs earlier (Figure 15). Comparing a radial gap ratio of 1.04 with a radial gap ratio of 1.14, the choke mass flows for Mu = 1.16, 1.11, 1.05, 0.93 and 0.69 are smaller by 1.15%, 5.66%, 7.25%, 8.55%, and 5.9%, respectively. However, for the cases with the radial gap ratios of 1.10, 1.12 and 1.14 at Mu = 1.16, the choke mass flow rate is constant. This is because the choke occurs in the impeller instead of the diffuser. The stable flow range (SFR) can also be obtained by Figure 12, which is defined by the following equation:
Varying the radial gap ratio also affects the SFR. A smaller radial gap size has a higher Mach number so that the choke happens earlier. Additionally, higher turbulence due to separation and recirculation leads to higher entropy and thus, an earlier surge/stall. Therefore, as the diffuser leading edge recedes from the impeller trailing edge, the SFR increases (Figure 15). When Mu = 0.93, the SFR for a radial gap ratio of 1.14 and 1.04 reaches 21.08% and 11.18%, respectively. For all investigated radial gap sizes, low tip-speed Mach numbers have higher values of stable flow range compared to the high tip-speed Mach numbers.
3.3. Effects of Radial Gap Ratio on Vaned Diffuser Performance
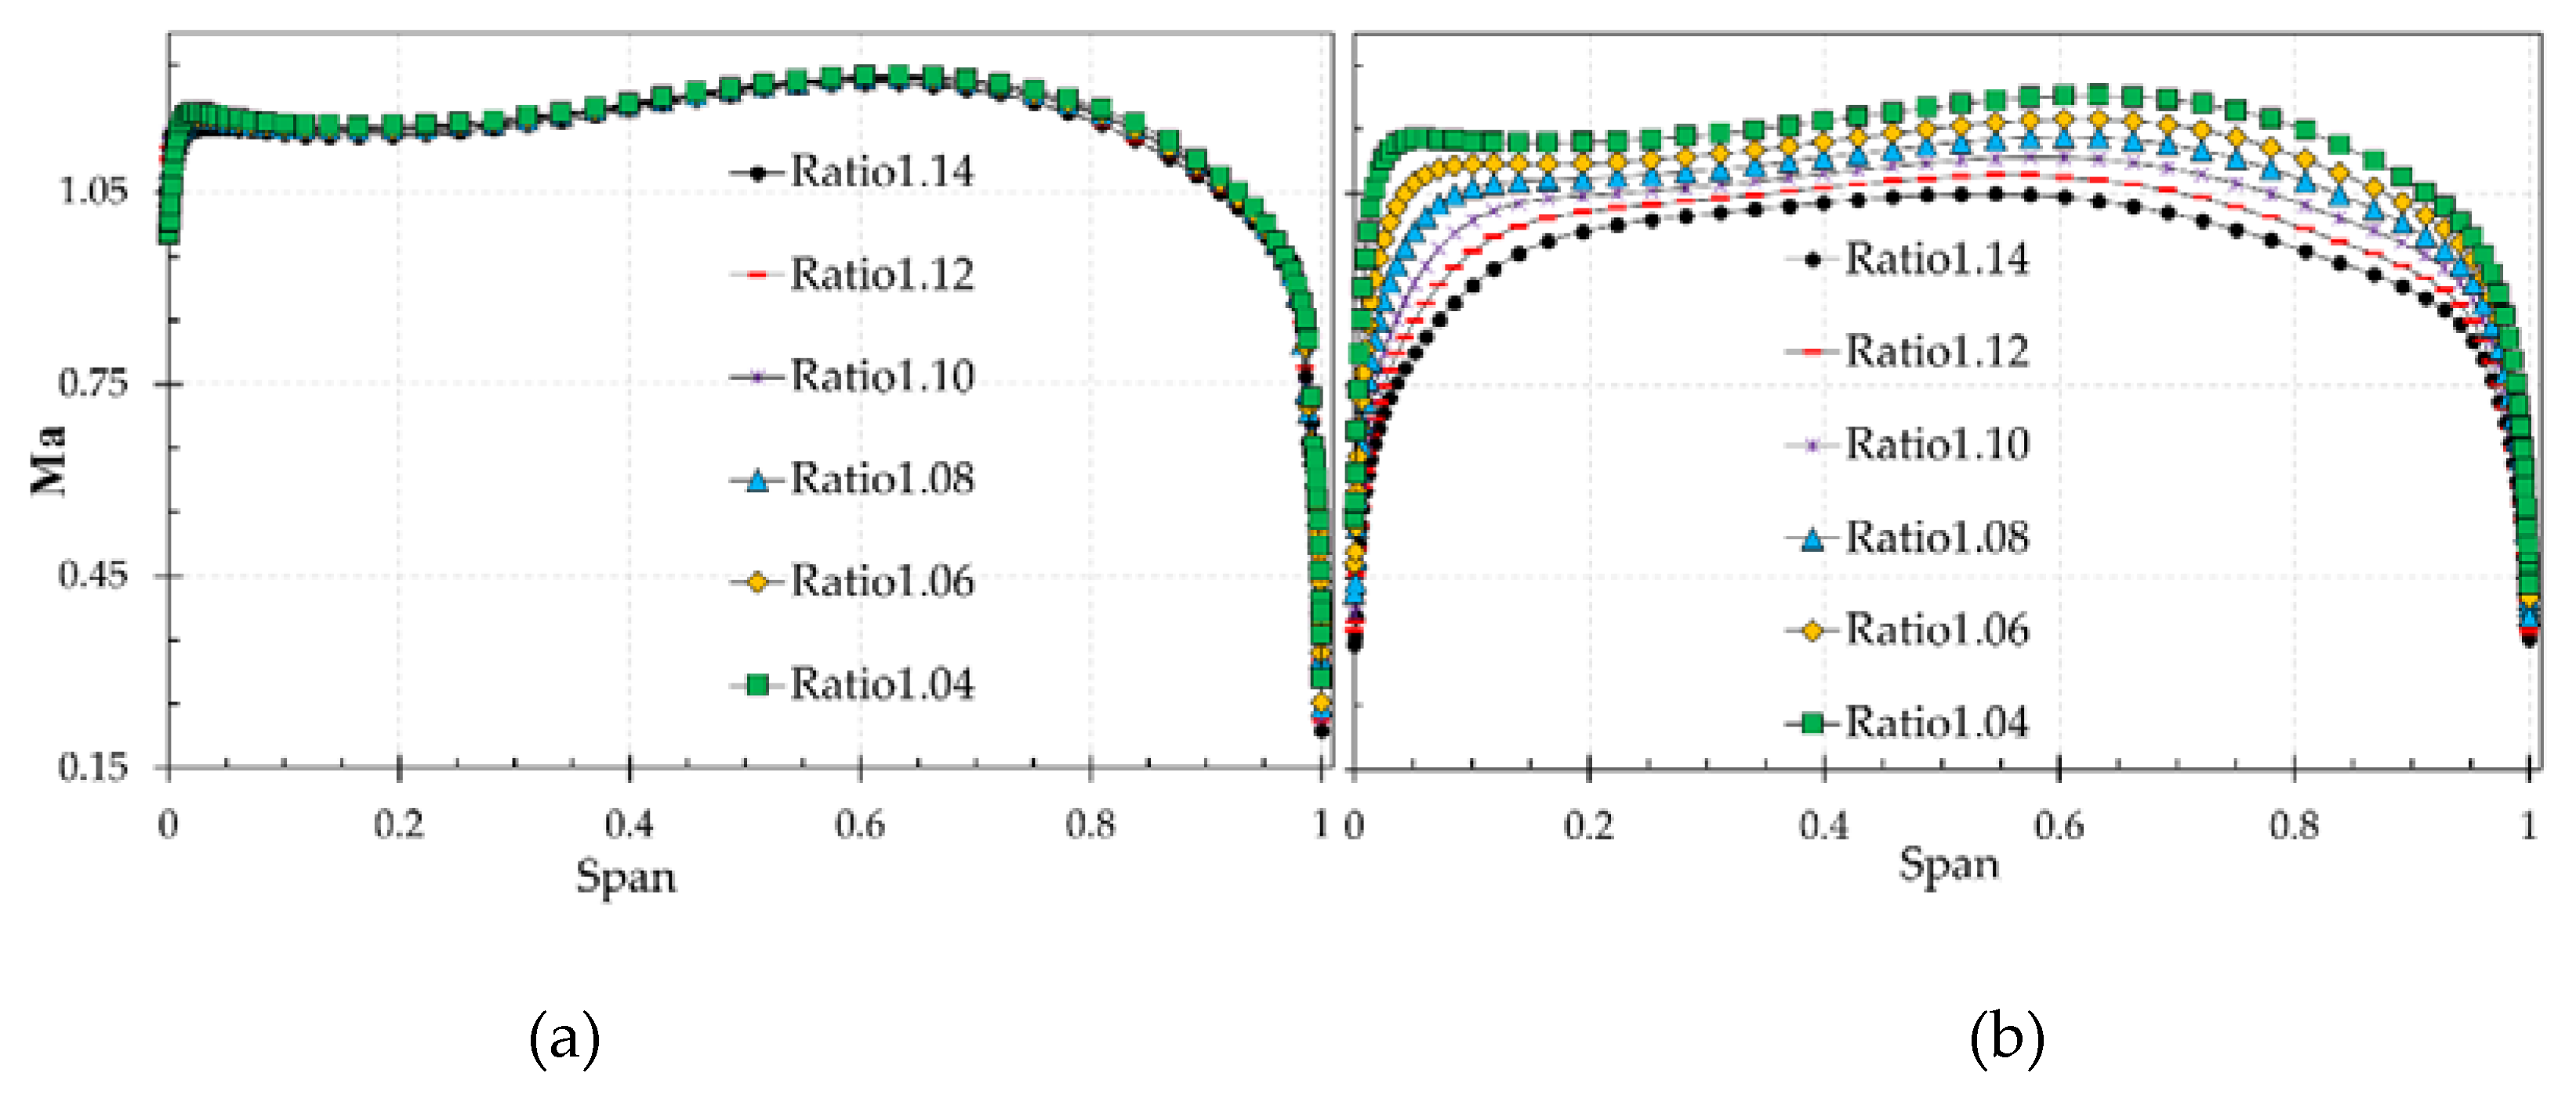
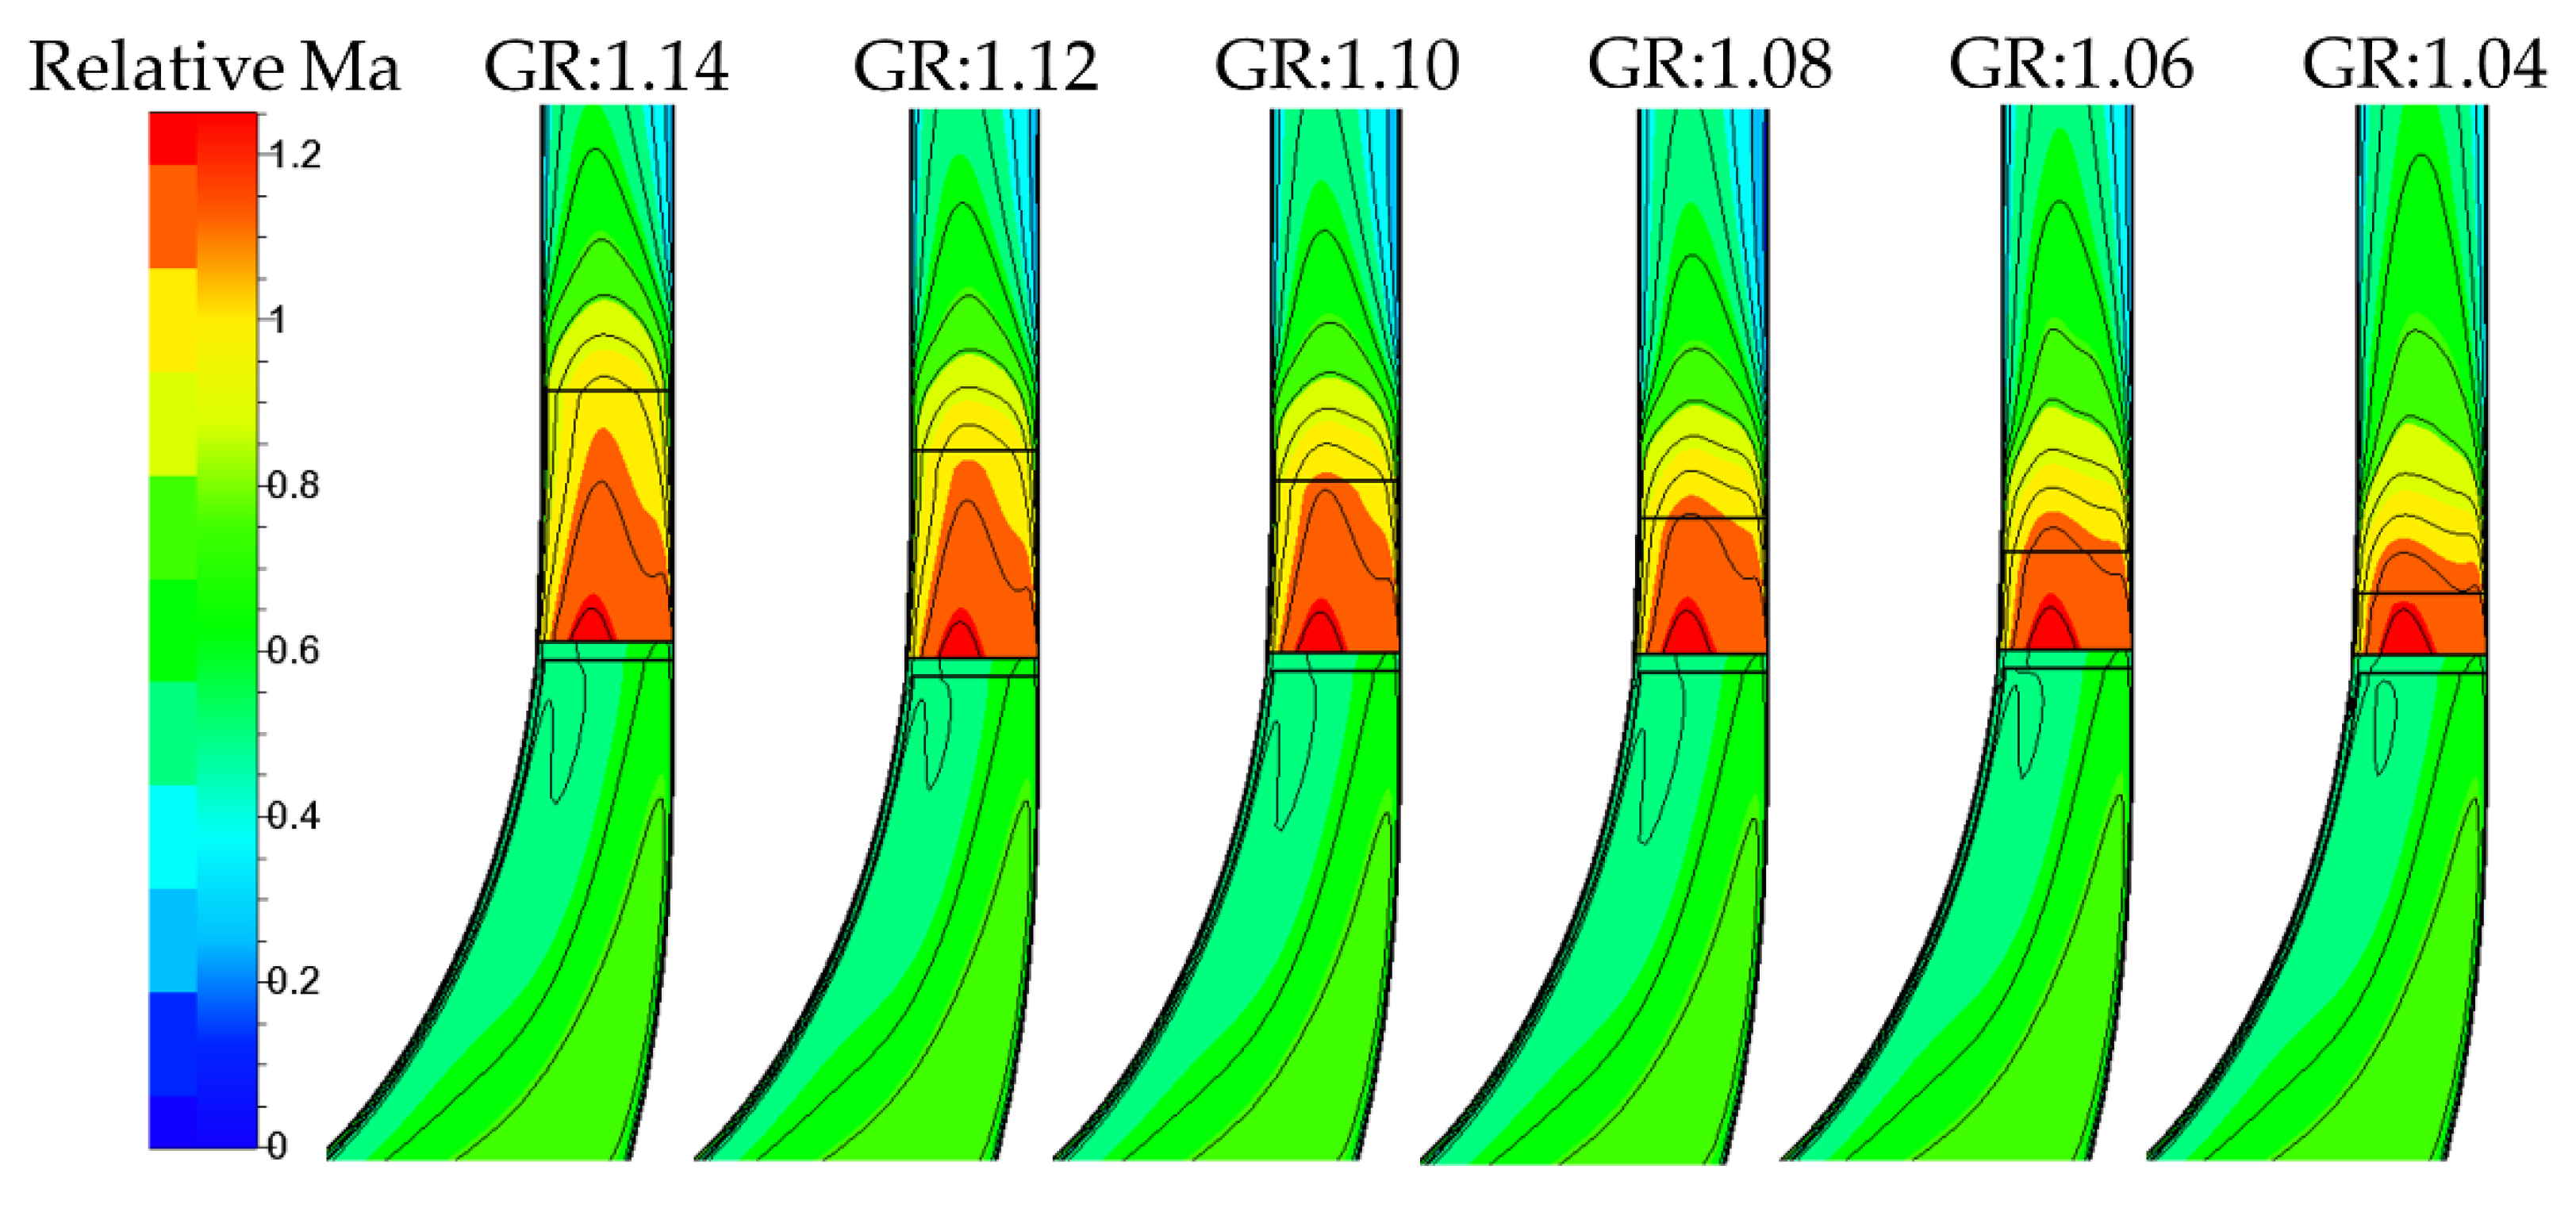
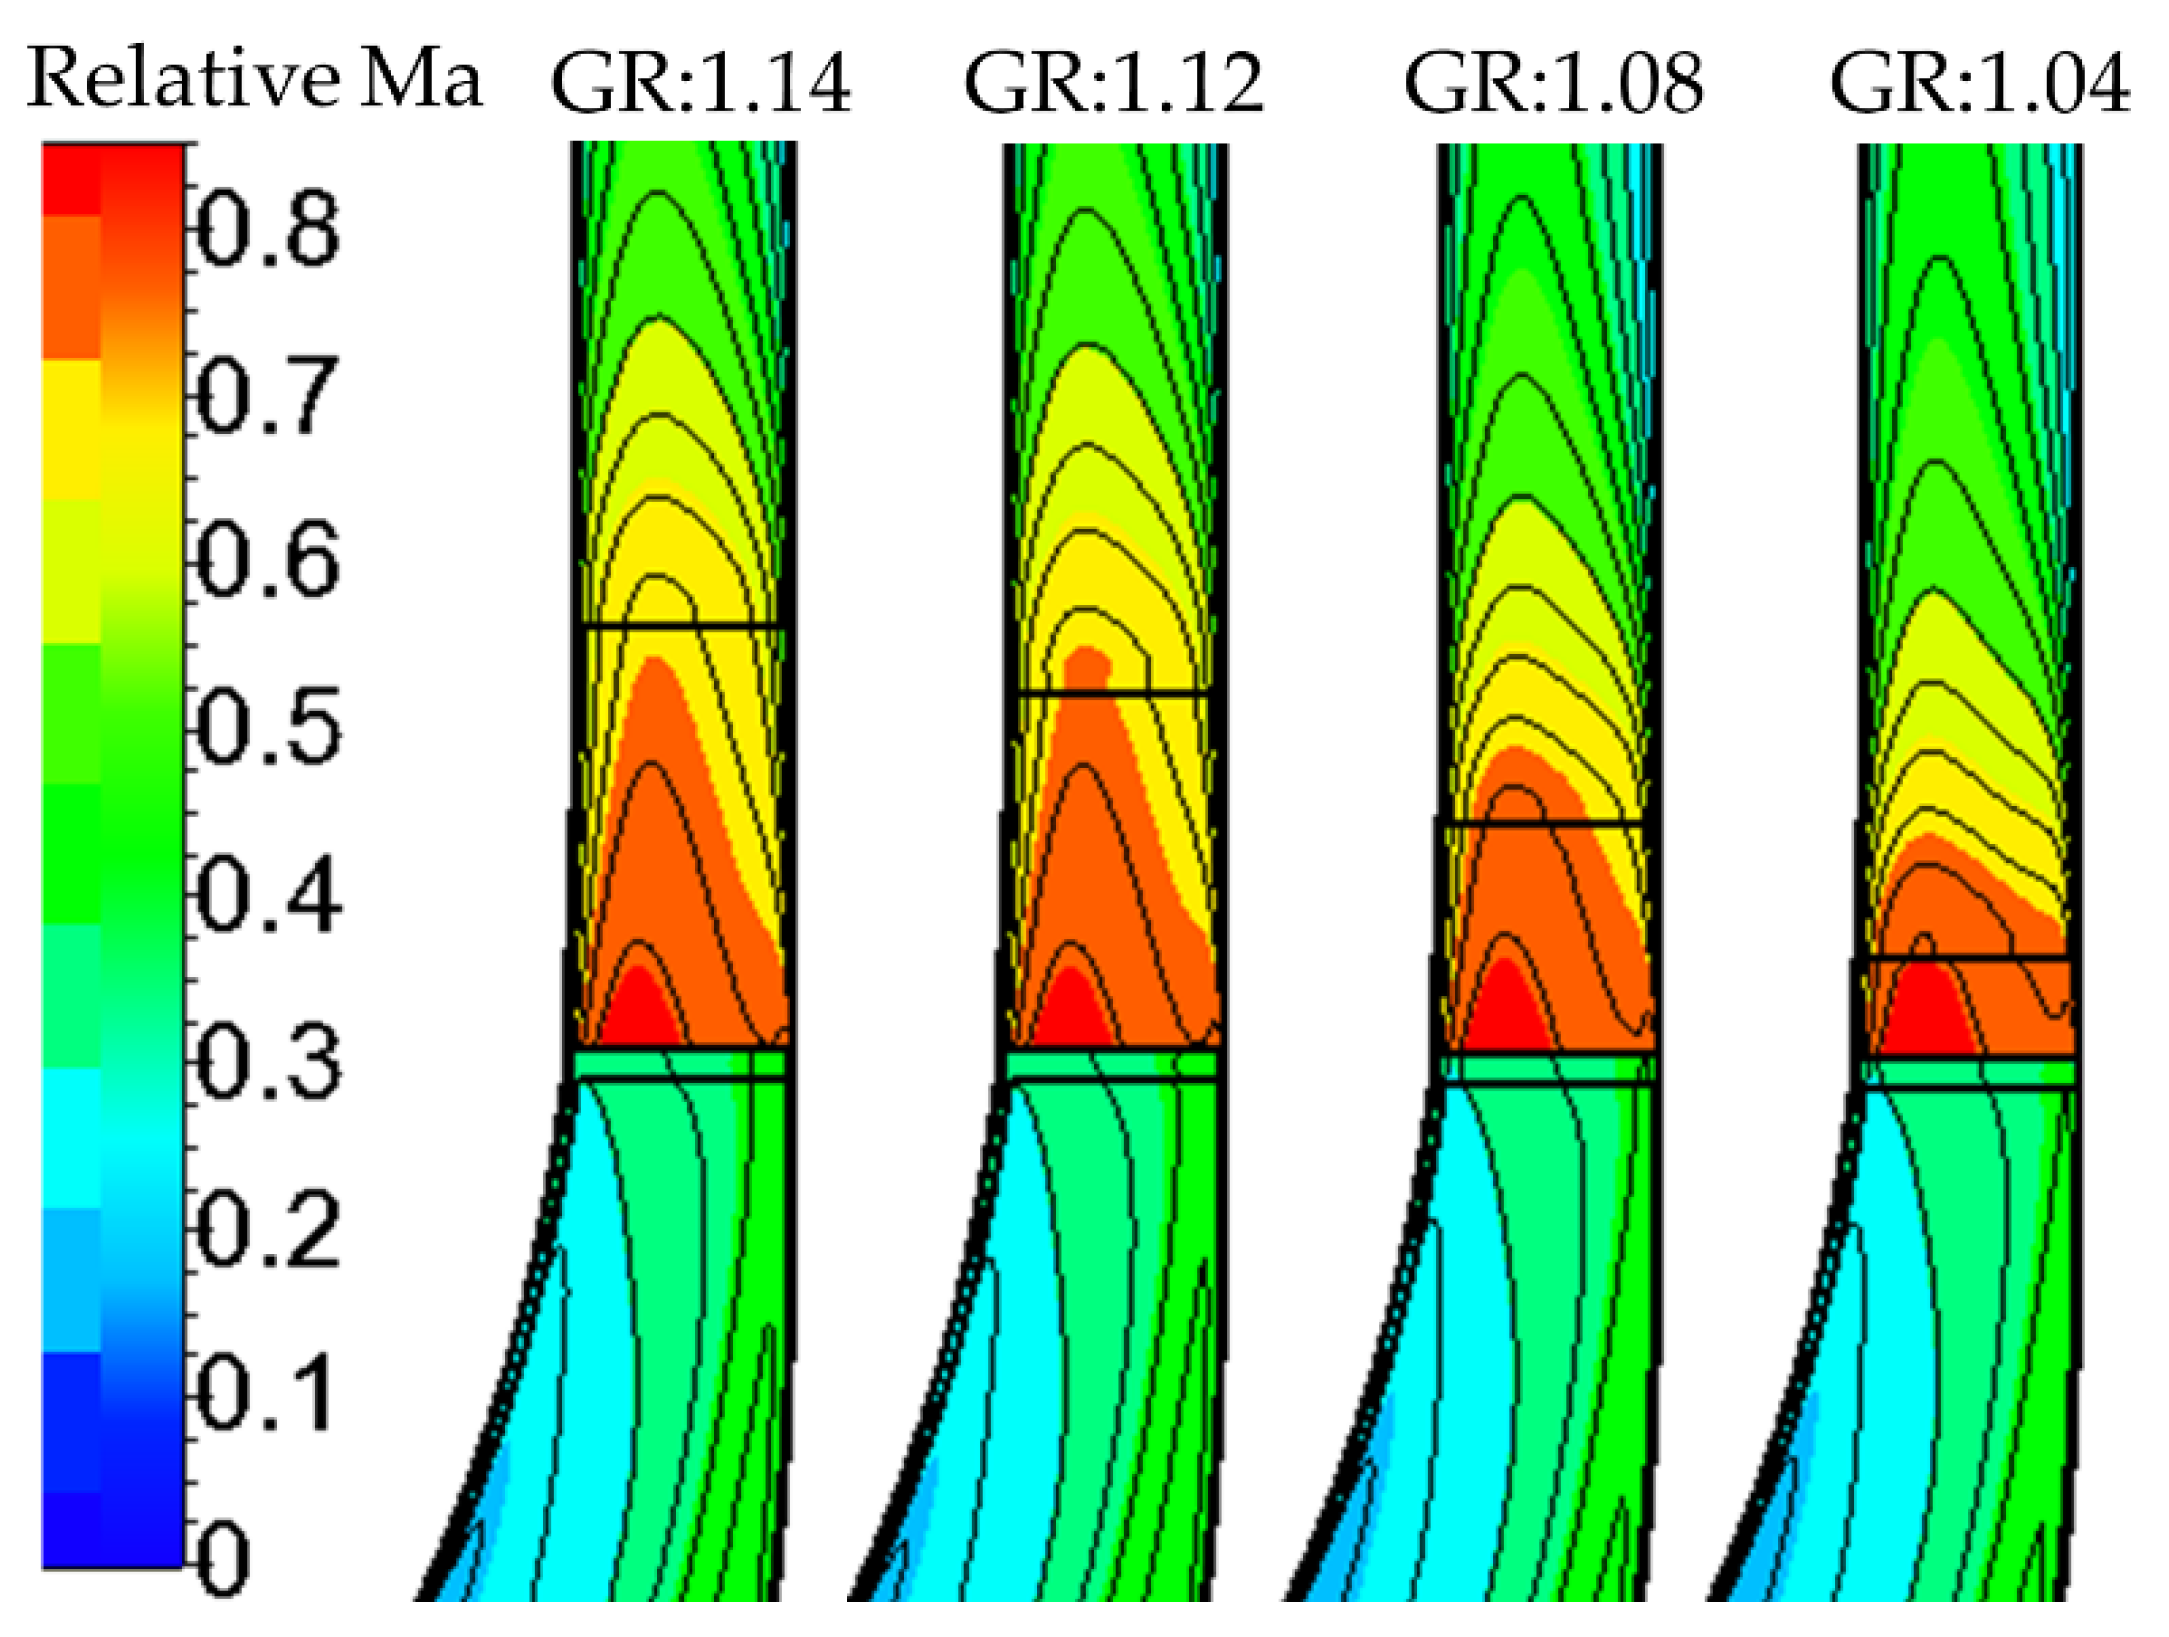
The Mach number value is one of the important properties of the flow which is a significant factor for the occurrence of shock waves. Figure 16a,b show the absolute Mach numbers of different radial gap ratios for Mu = 1.16 at the impeller trailing edge and the diffuser leading edge, respectively. Figure 17 and Figure 18 represent the pitch-averaged spanwise contour of the relative Mach number superimposed with isolines at 50% span for a peak efficiency point of Mu = 1.16 (design speed) and Mu = 0.69, respectively. Decreasing the radial gap size leads to a reduction in the diffuser throat area. As the Mach number is less than 1, a smaller diffuser throat area leads to an increase in the flow velocity value at the interface. Thus, it can be seen that the Mach number at the trailing edge of the impeller and leading edge of the diffuser increases by reducing the radial gap ratio for both Mu ≥ 1 and Mu < 1. It is important to note that the Mach number at trailing edge of the impeller changes slightly.
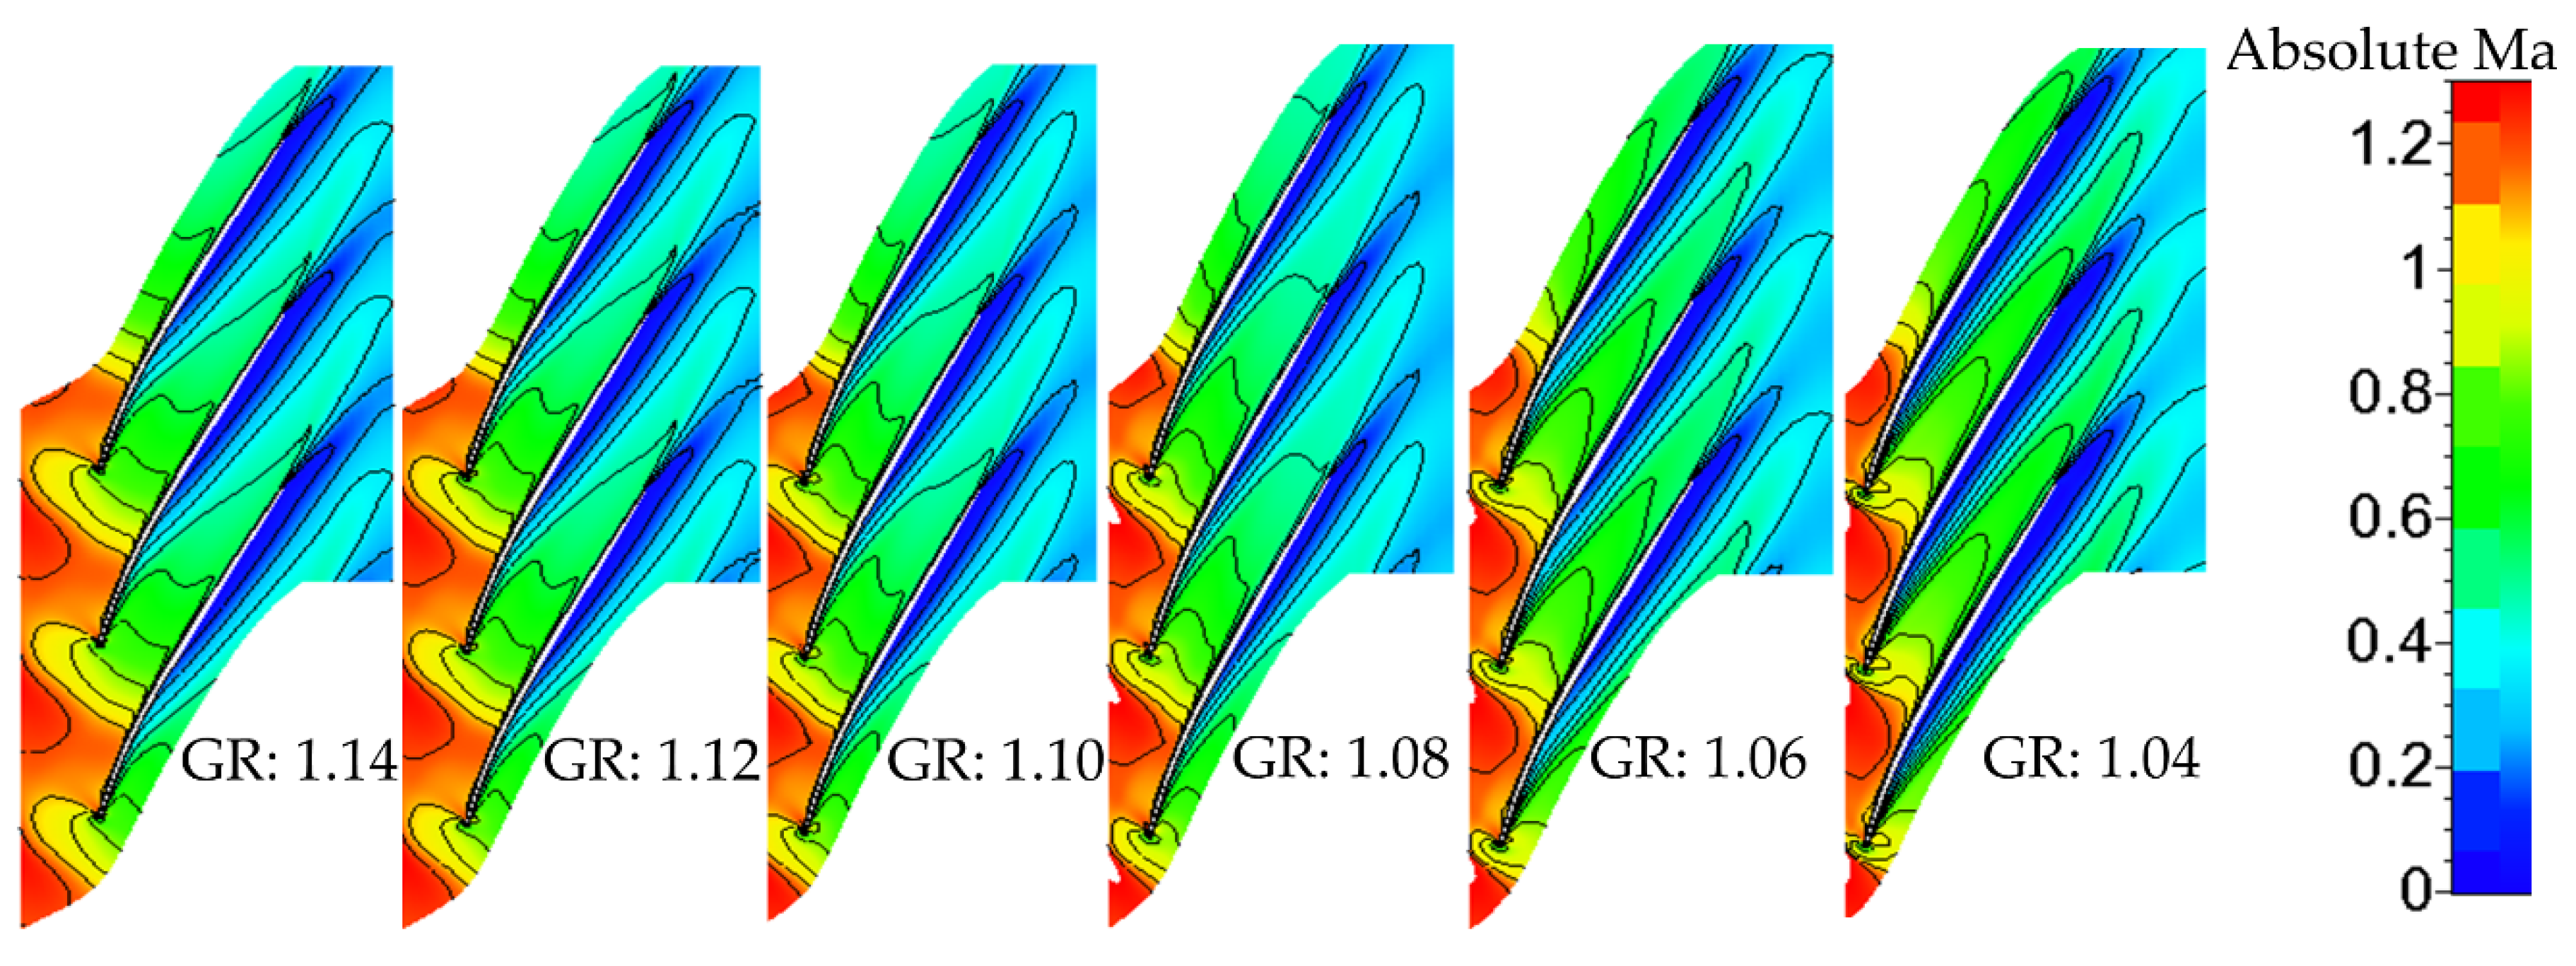
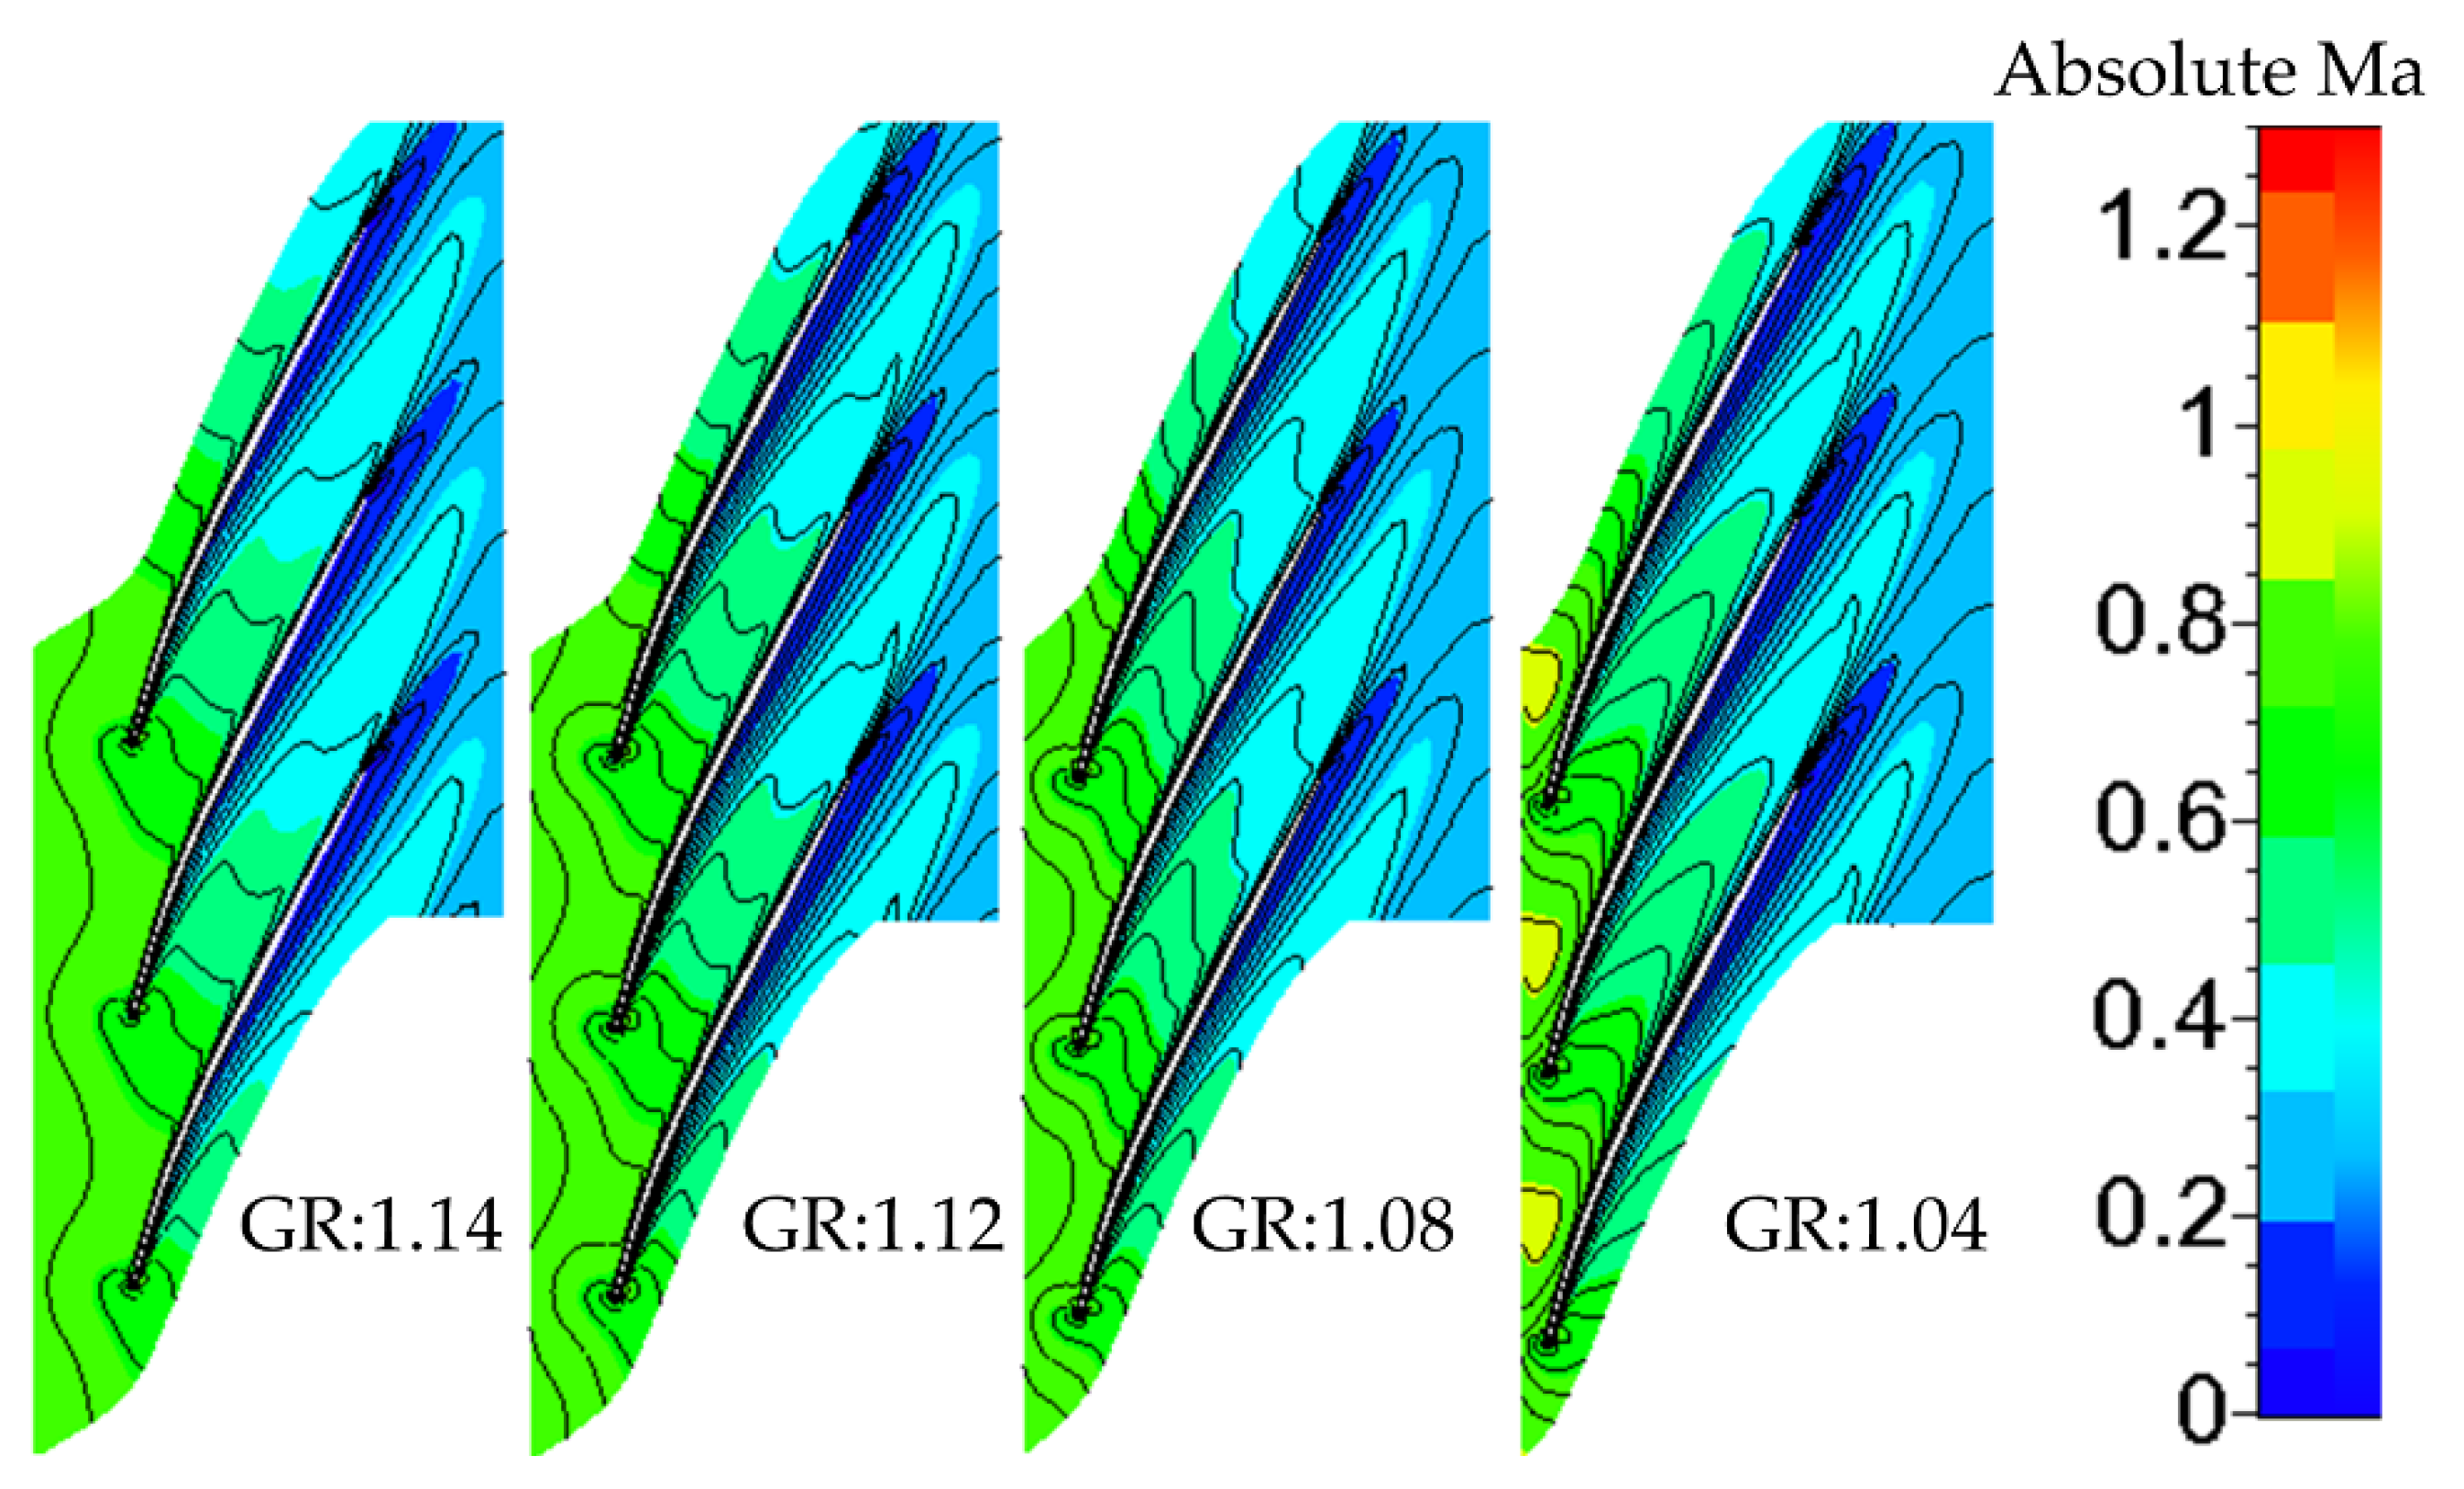
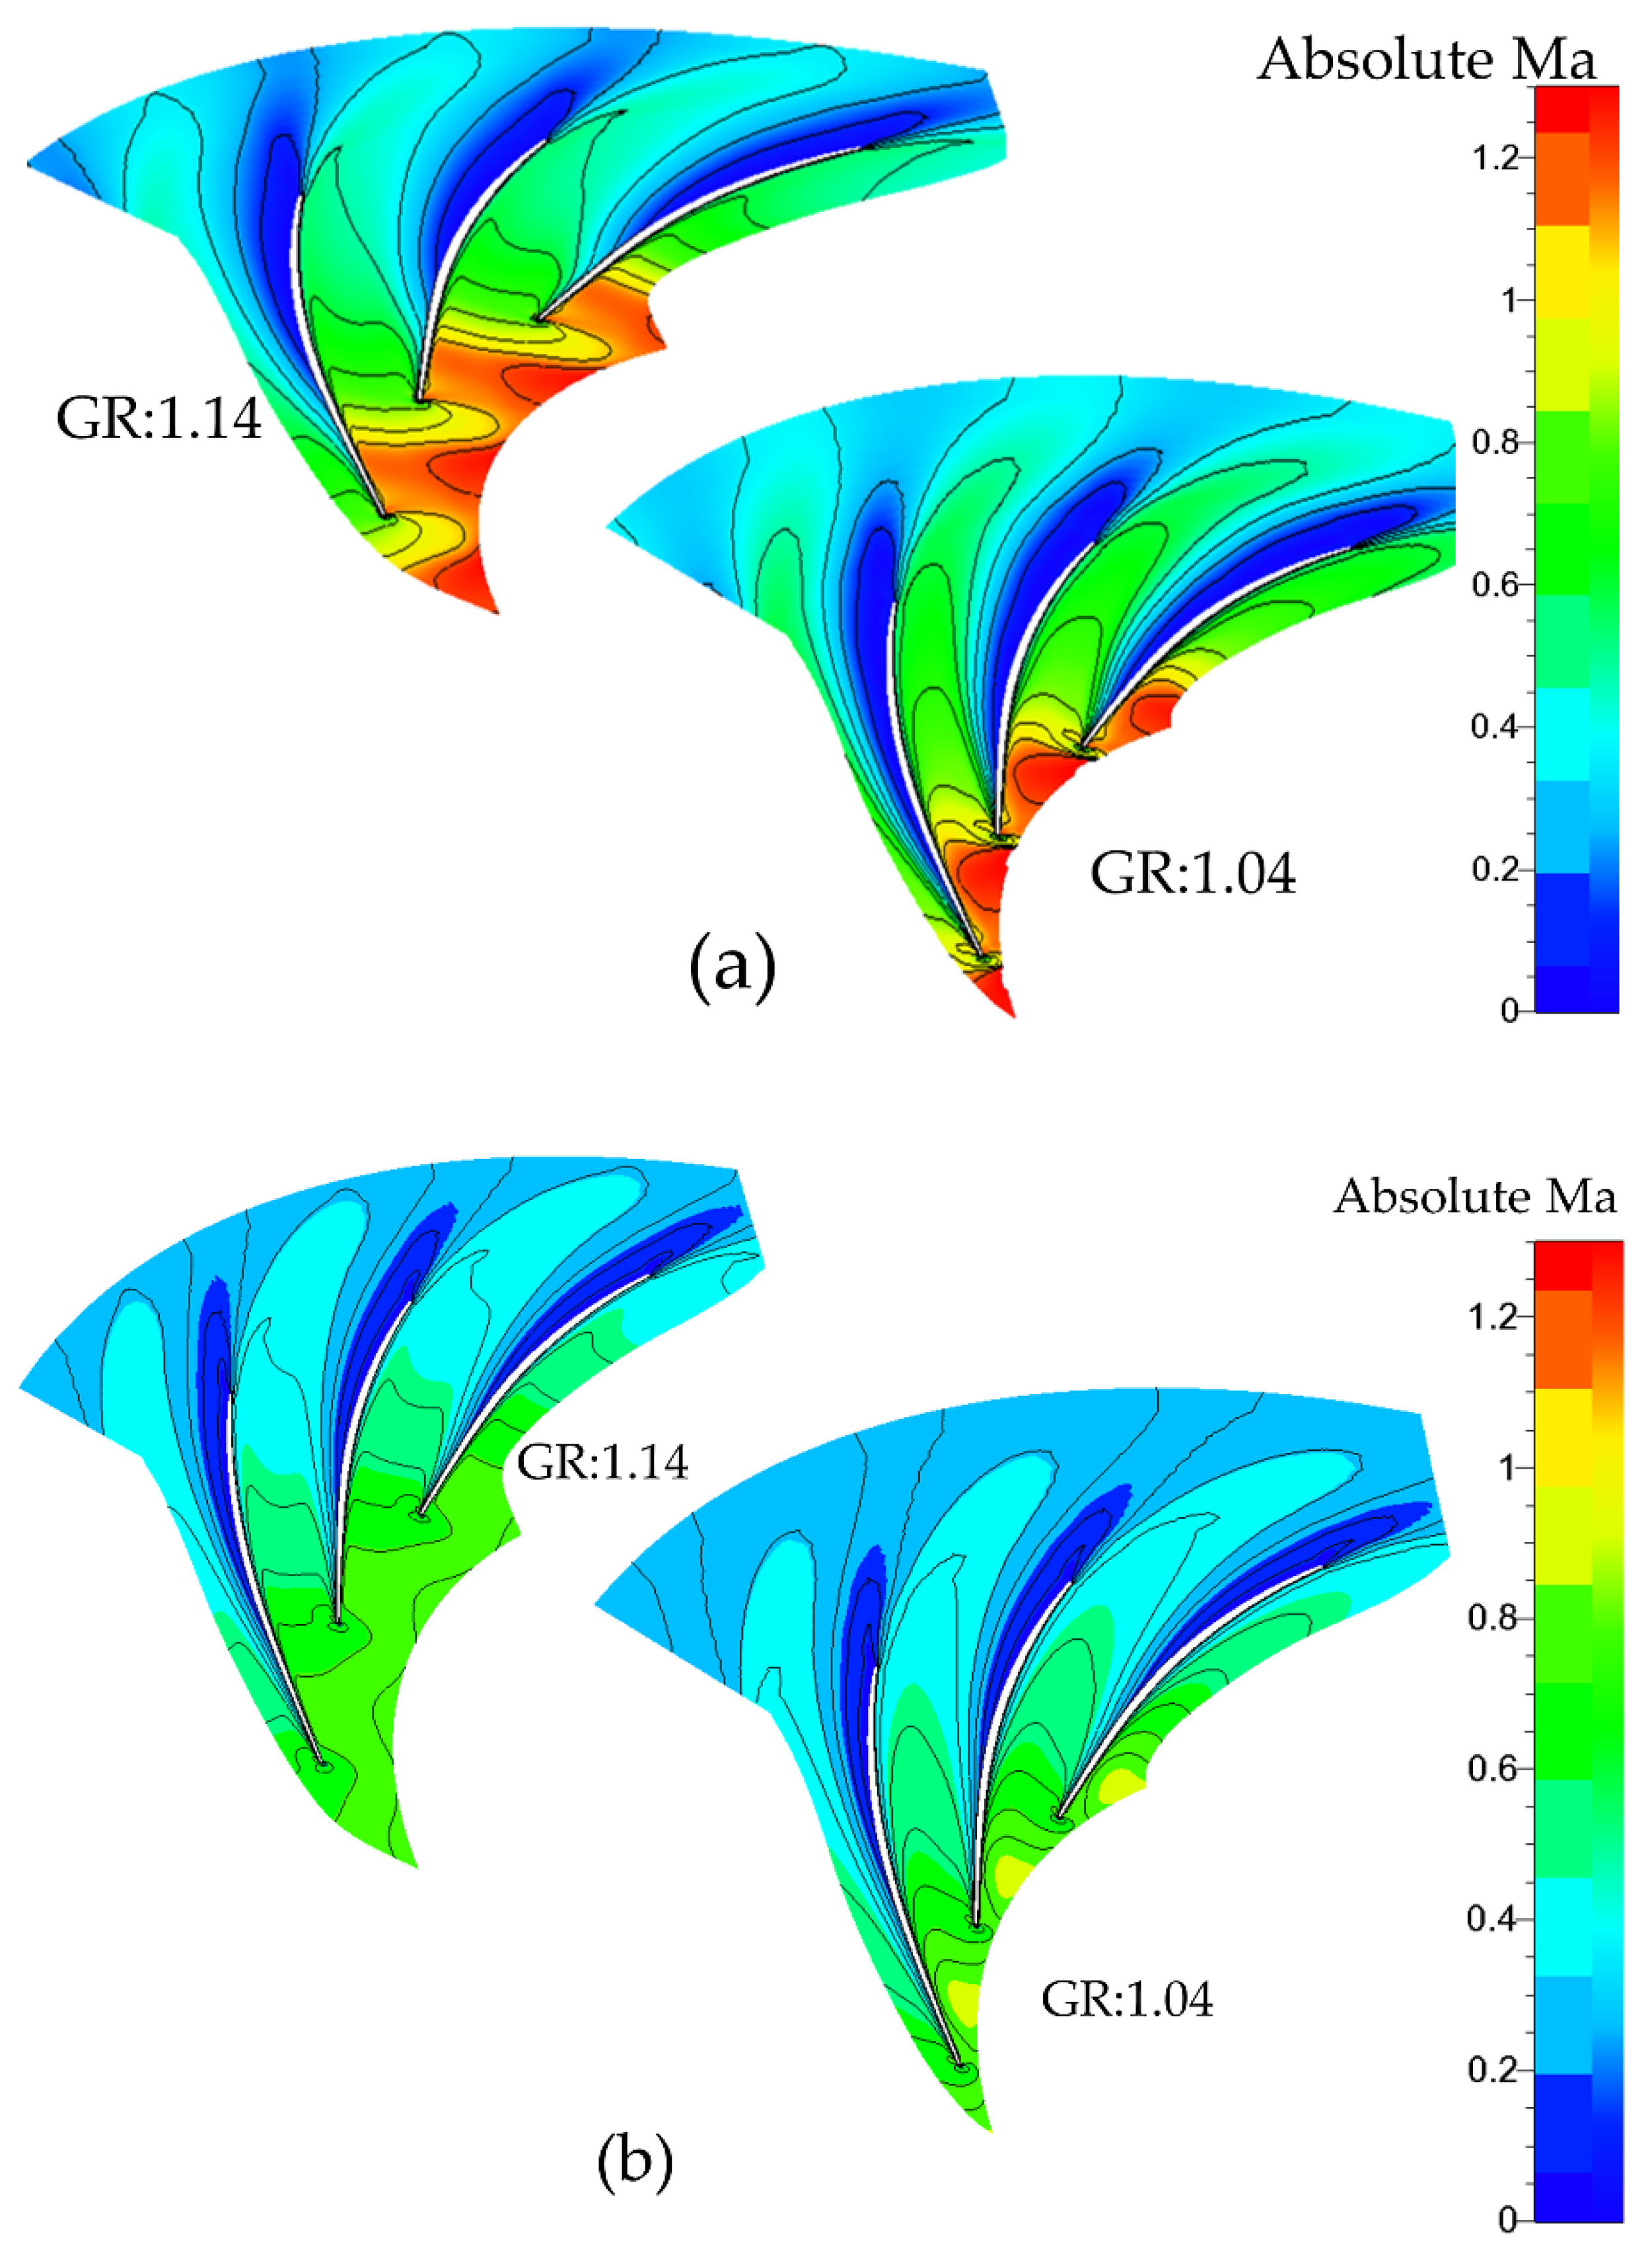
Figure 19 represents the effect of the radial gap ratio on the shock wave structure on the basis of absolute Mach number contours superimposed with isoclines at the mid-span of the vane diffuser at Mu = 1.16. As the flow enters the diffuser, it accelerates to a supersonic speed, which leads to shock waves. These shock waves’ structures are changed by varying the radial gap ratio. The shock wave starts occurring from the diffuser vane leading edge, trespassing on the suction side of the diffuser vane. By increasing the intensity of the shock wave, the pressure in the region of the suction side and the pressure side increases and decreases, respectively. Therefore, the flow becomes non-uniform and flow separation occurs. Hence, separation in smaller radial gap sizes happens earlier, and it is bigger than that of higher radial gap size (Figure 20). Liu et al. [36] also showed that the compressor performance deterioration is the result of this supersonic acceleration and notable shock waves interaction with boundary layers.
However, according to Figure 20, as the impeller inlet tip-speed Mach number is less than the unity value (Mu = 0.69), the flow does not accelerate substantially. Therefore, the absolute Mach number remains below 1 and the shock waves do not occur.
Figure 21 also represents the narrow distribution of the absolute Mach number at 50% span for a radial gap ratio of 1.04 compared to a radial gap ratio of 1.14 at Mu = 1.16 (design speed) and Mu = 0.69. At Mu = 1.16, by enlarging the radial gap size, the flow velocity increases and decreases in the region of the suction surface and the rear part of the pressure side, respectively. Regarding the fact that the flow momentum is directly related to the flow velocity in an equal mass flow rate, low momentum flow is weakened in the rear region of pressure side for the smaller radial gap size. The load on the rear part of the pressure surface reduces in a larger radial gap size. Therefore, the diffuser can have superior diffusion [18].
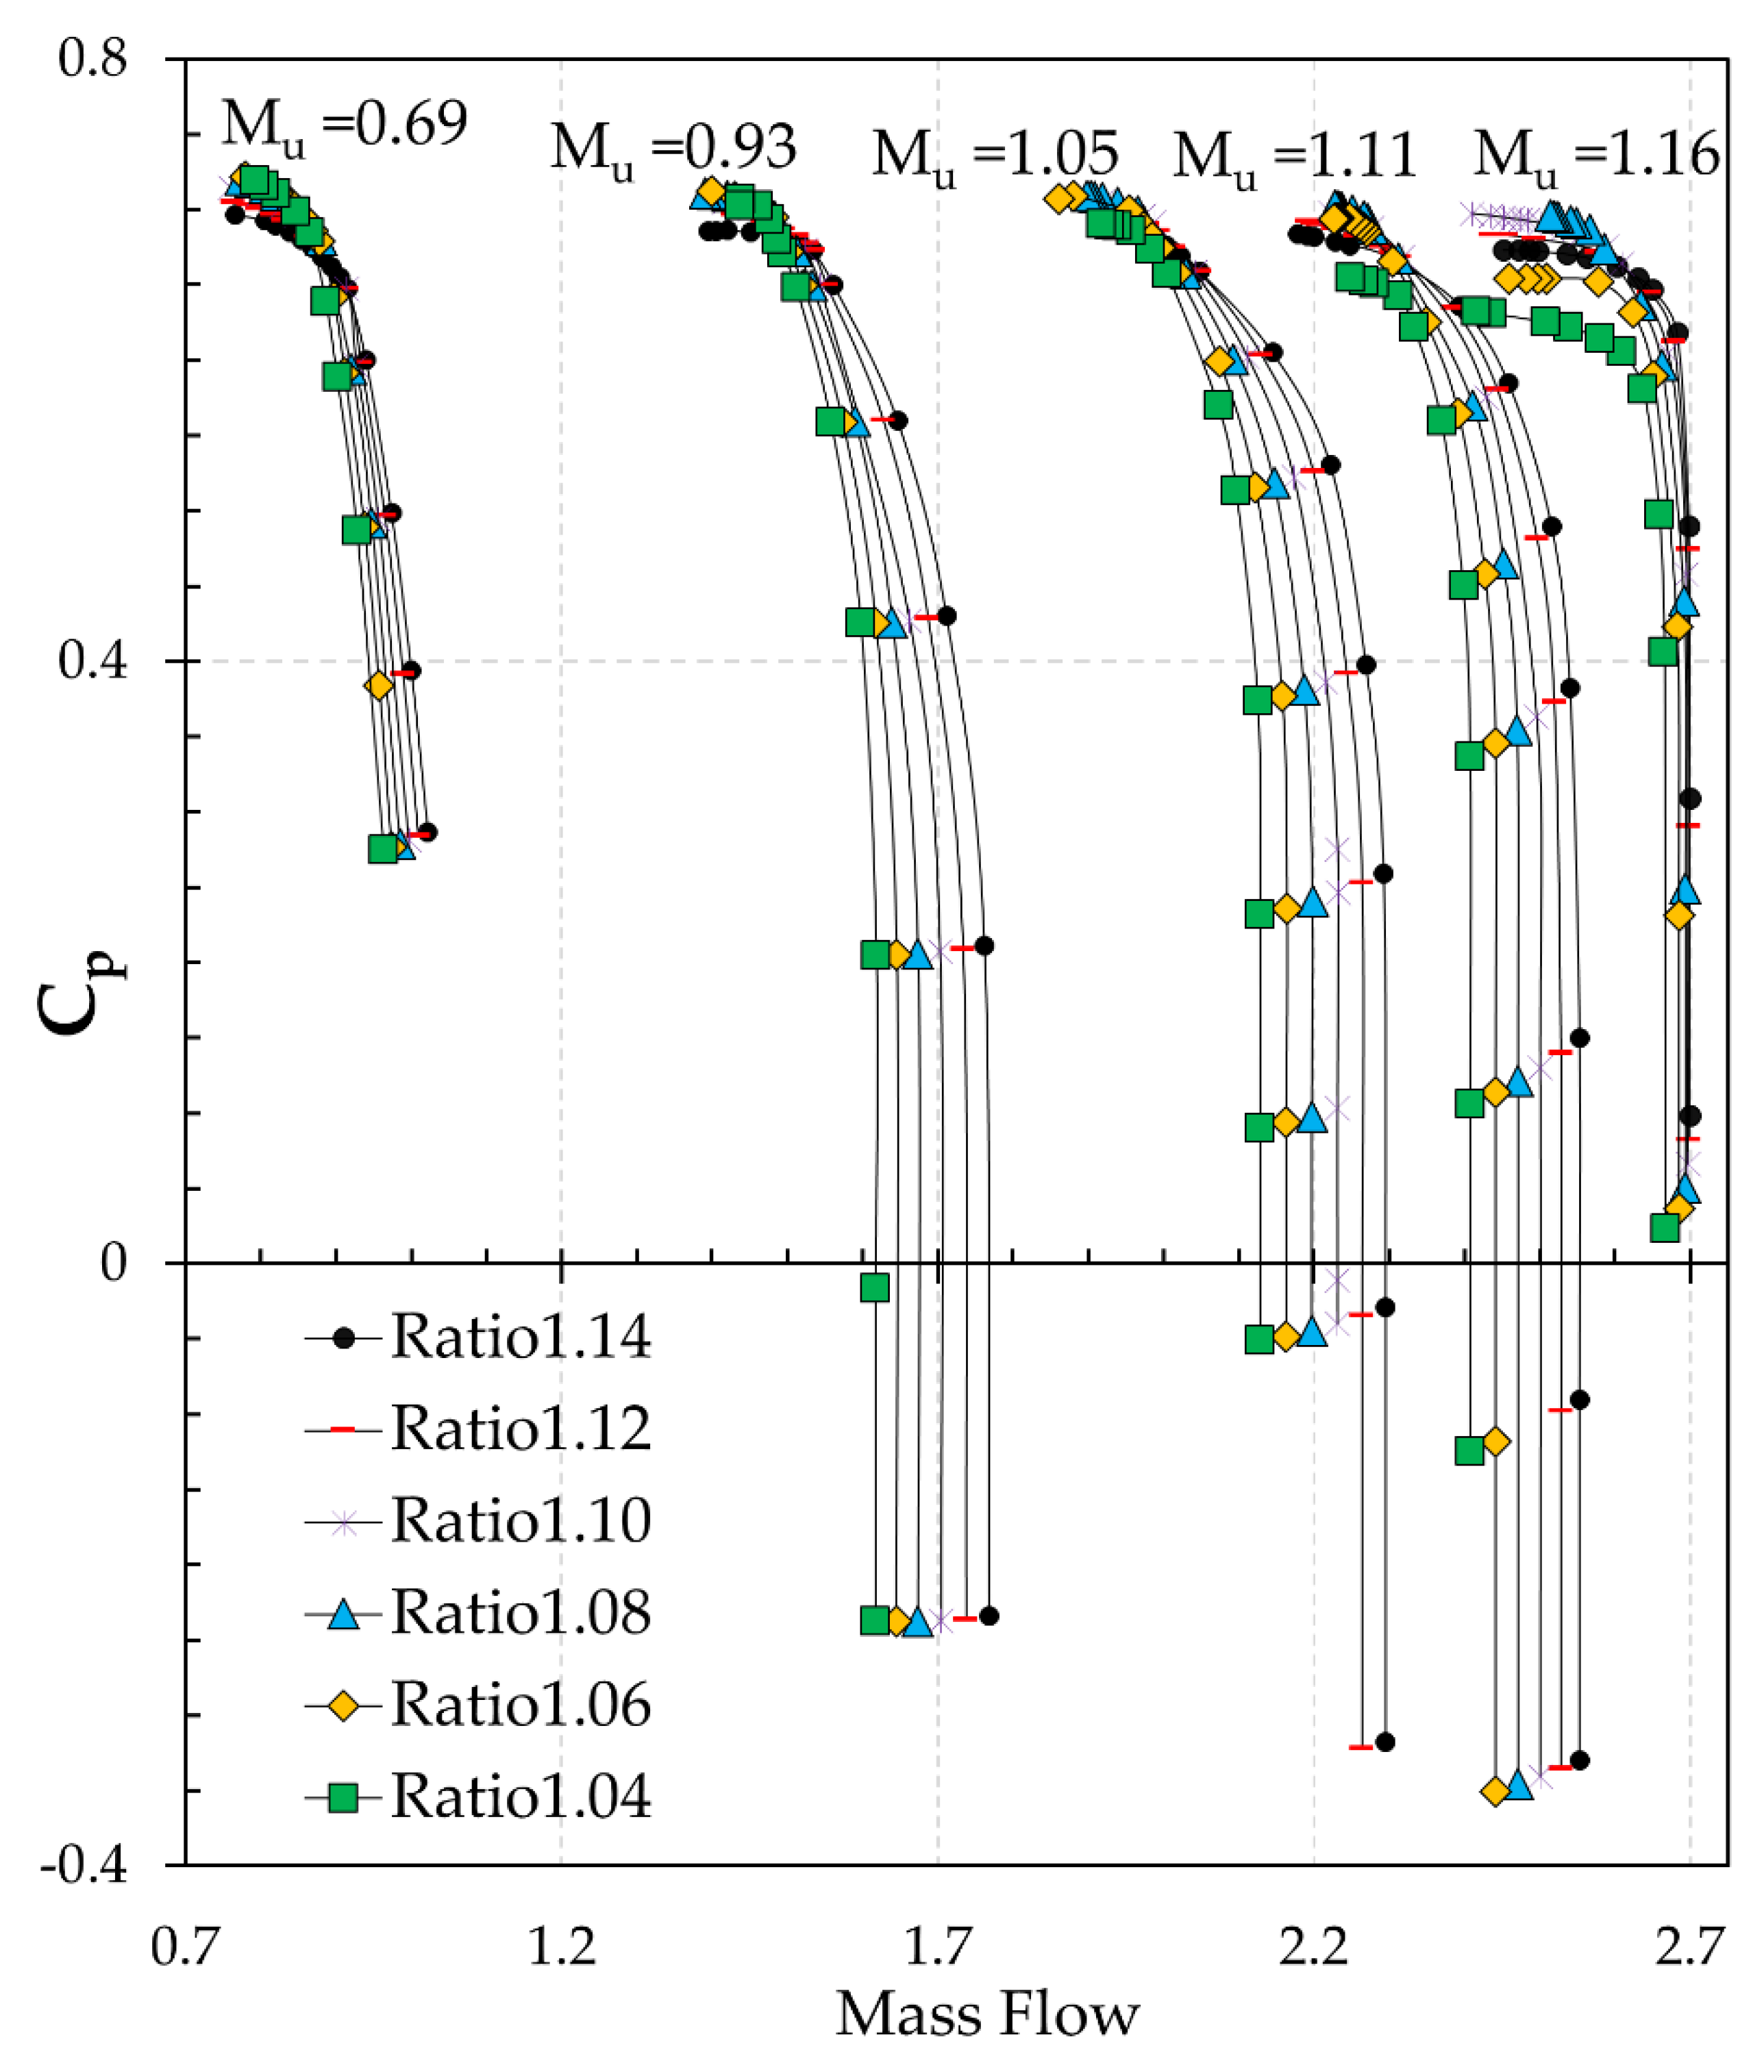
Diffuser pressure recovery (CP) is one of the most common factors for evaluating the diffuser performance [37], which is the capability of the diffuser to diffuse. As flow decelerates at the diffuser exit, the higher static pressure that can be gained is the higher pressure recovery for the diffuser. Figure 22 and Figure 23 present the pressure recovery for the various radial gap sizes and maximum pressure recovery for five tip-speed Mach numbers and six radial gap ratios. The maximum pressure recovery for Mu = 0.69 and 0.93 occurs at a radial gap ratio of 1.06. Following this, it has a descending trend by enhancing the gap ratio, but the deviation is small. However, for Mu = 1.05, 1.11 and 1.16, it has an ascending trend with an increase in the radial gap ratio, which reaches its highest value at a radial gap ratio of 1.08. After this, it is dropped out by enlarging the distance between the impeller trailing edge and diffuser leading edge.
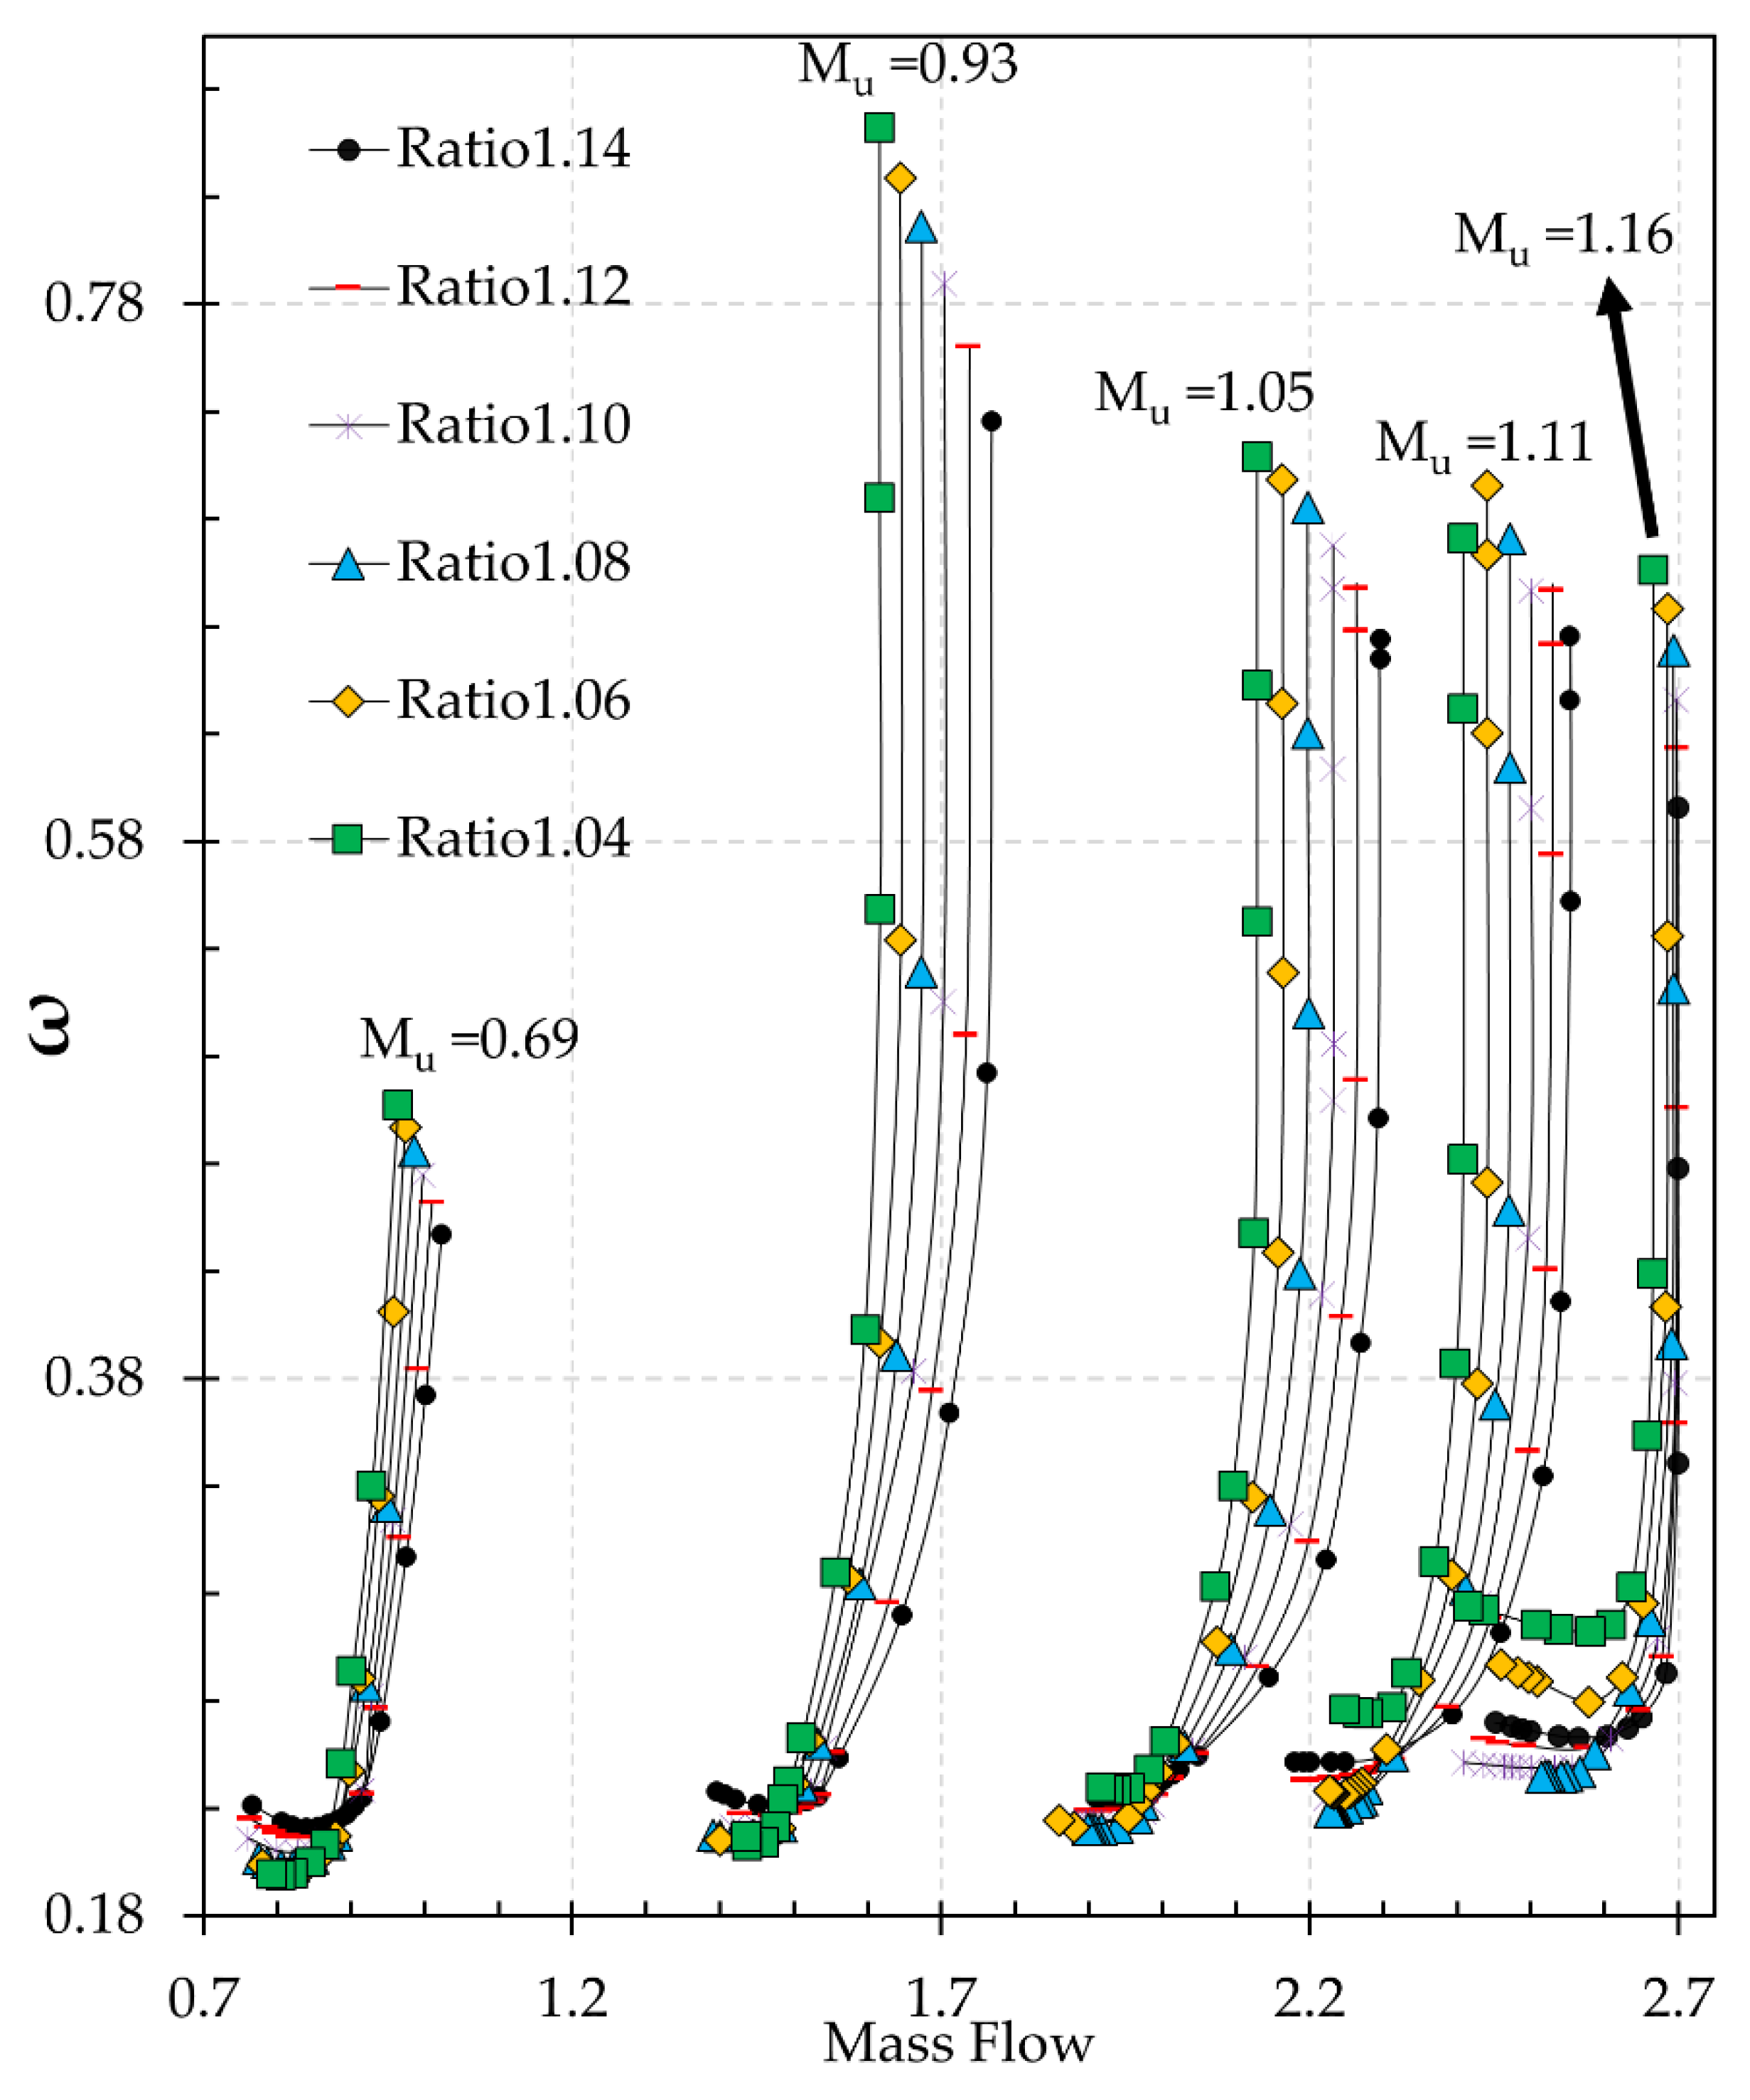
By increasing the radial gap ratio, the space in the region of the diffuser leading edge increases, thus, the mixing of non-uniform flow in diffuser leading edge increases. Therefore, a larger radial gap ratio should have a higher loss. However, as Figure 24 and Figure 25 demonstrate, when Mu ≥ 1, there is a turning when the diffuser leading edge and the impeller trailing edge are closer than radial gap ratio of 1.08 and a smaller radial gap ratio has a higher loss coefficient. The shock wave can be responsible for this phenomenon. As it is already mentioned, when Mu ≥ 1, the shock wave in the smaller radial gap ratio is stronger than that in the higher radial gap ratio. Therefore, a smaller radial gap ratio has a higher loss coefficient. Finally, from a radial gap ratio larger than 1.08, the effect of shock the wave decreases and a smaller radial gap ratio has a smaller loss coefficient.
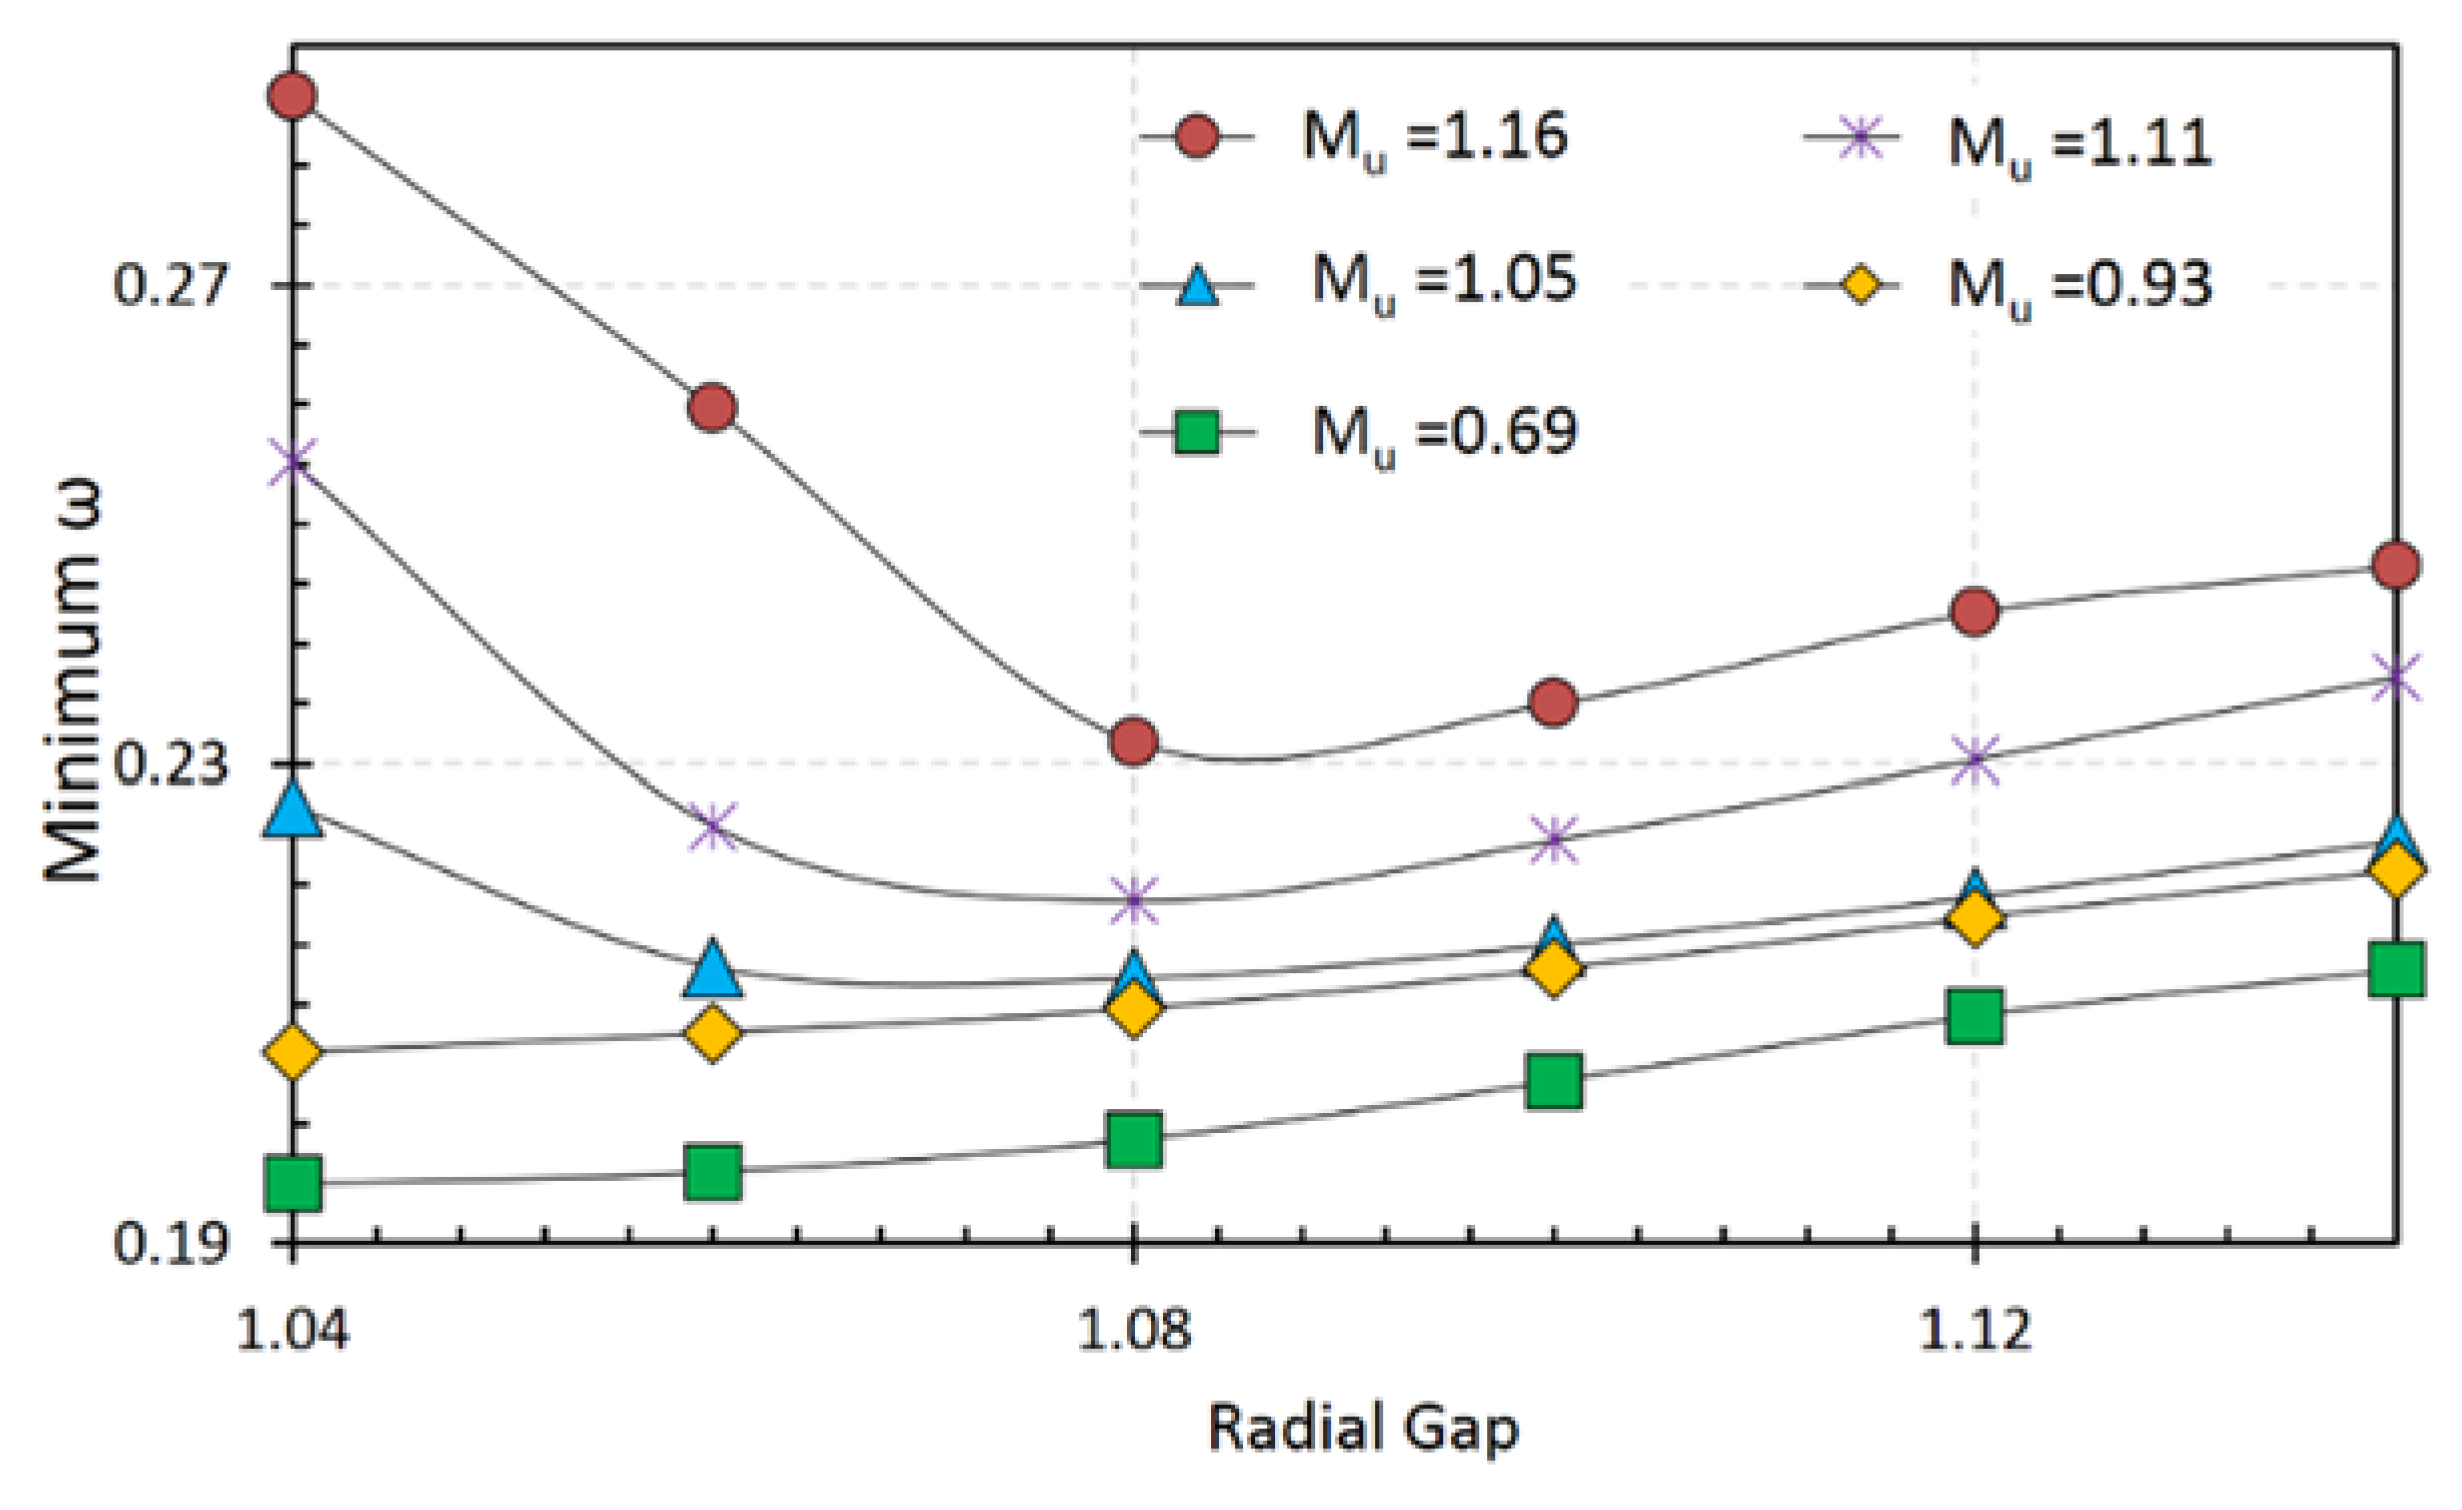
With regards to Figure 24 and Figure 25, at a low tip-speed Mach number (0.69 and 0.93), a smaller radial gap ratio compared to a larger radial gap ratio has less loss. The minimum value of the loss coefficient occurs at the radial gap ratio of 1.04, which then increases by raising the gap ratio. In comparison, at the high tip-speed Mach number (1.05, 1.11 and 1.16), the minimum value of the loss coefficient has the peak amount at a radial gap ratio of 1.04 before it drops to a minimum amount at the radial gap ratio of 1.08. Afterward, it increases with an increase in the radial gap ratio.
It can also been seen that for all radial gap sizes, a compressor with higher tip-speed Mach number has a higher loss. The total skin friction drag force equation (Equation (2)) can justify this phenomenon. An increase in fluid velocity leads to an increment in the friction drag force, resulting in an increase in pressure drop.
Therefore, the friction drag force increases and the pressure drop in diffuser grows. Therefore, a larger tip-speed Mach number have a higher loss coefficient.
where is the fluid density; is fluid velocity; is the total surface area that is in contact with the fluid and is the Schlichting empirical formula that states turbulent flow is driven by the following equation:
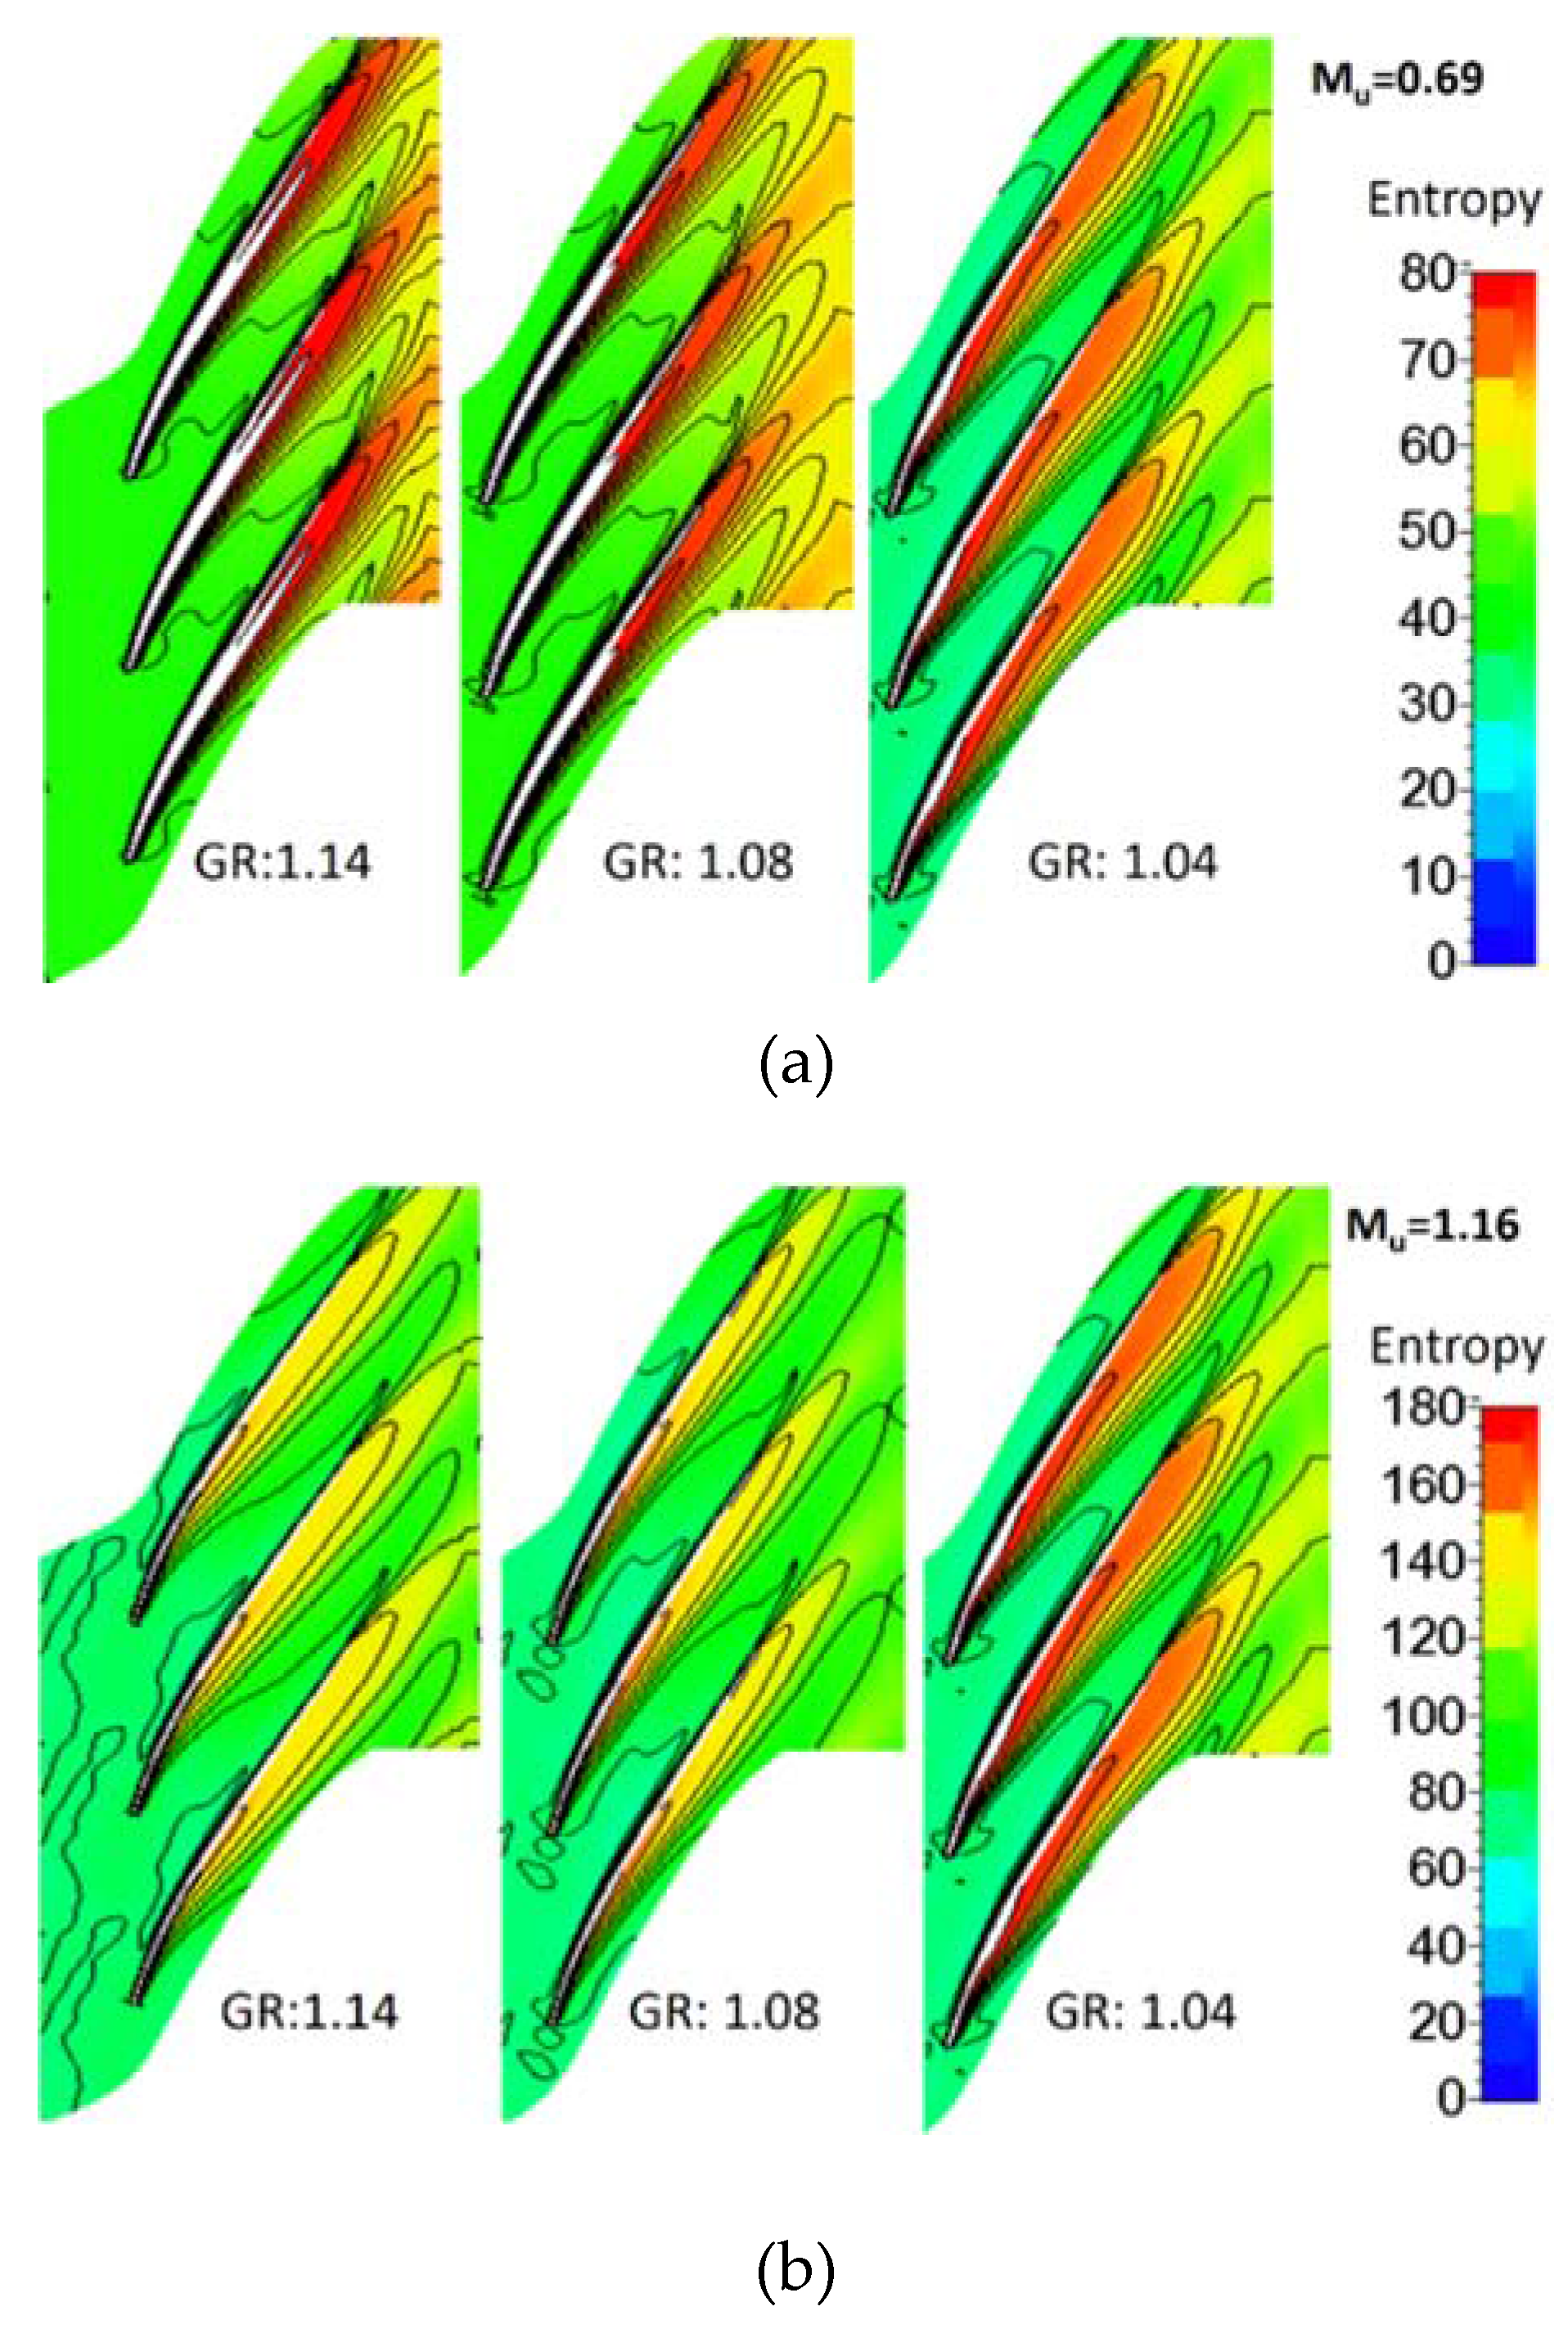
Entropy is a significant parameter for loss generation, which is primarily caused by recirculation and separation. The entropy contours superimposed with isolines at 50% span at the peak efficiency operating point for three different radial gap ratios are shown in Figure 26. When the tip-speed Mach number is 1.16 (design speed), the entropy for radial gap ratios of 1.04 and 1.14 are more than that for the radial gap ratio of 1.08. However, when the tip-speed Mach number is 0.69, the radial gap ratio of 1.14 has the most entropy.
The following equation derives the loss coefficient where ‘3’ refers to the diffuser inlet and ‘4’ refers to the diffuser outlet:
Regarding Equation (4), the ideal loss occurs when the diffuser generates the same total pressure at the diffuser inlet and outlet. However, this is impossible. Therefore, a smaller loss means a higher total pressure at the diffuser outlet. Therefore, a lower pressure loss coefficient leads to a higher pressure ratio for the compressor. This is illustrated in a comparison of Figure 25 with Table 4 which is the maximum pressure ratio for the whole stage of a compressor over different radial gap ratios.
3.4. Effects of Radial Gap Ratio on the Impeller Performance
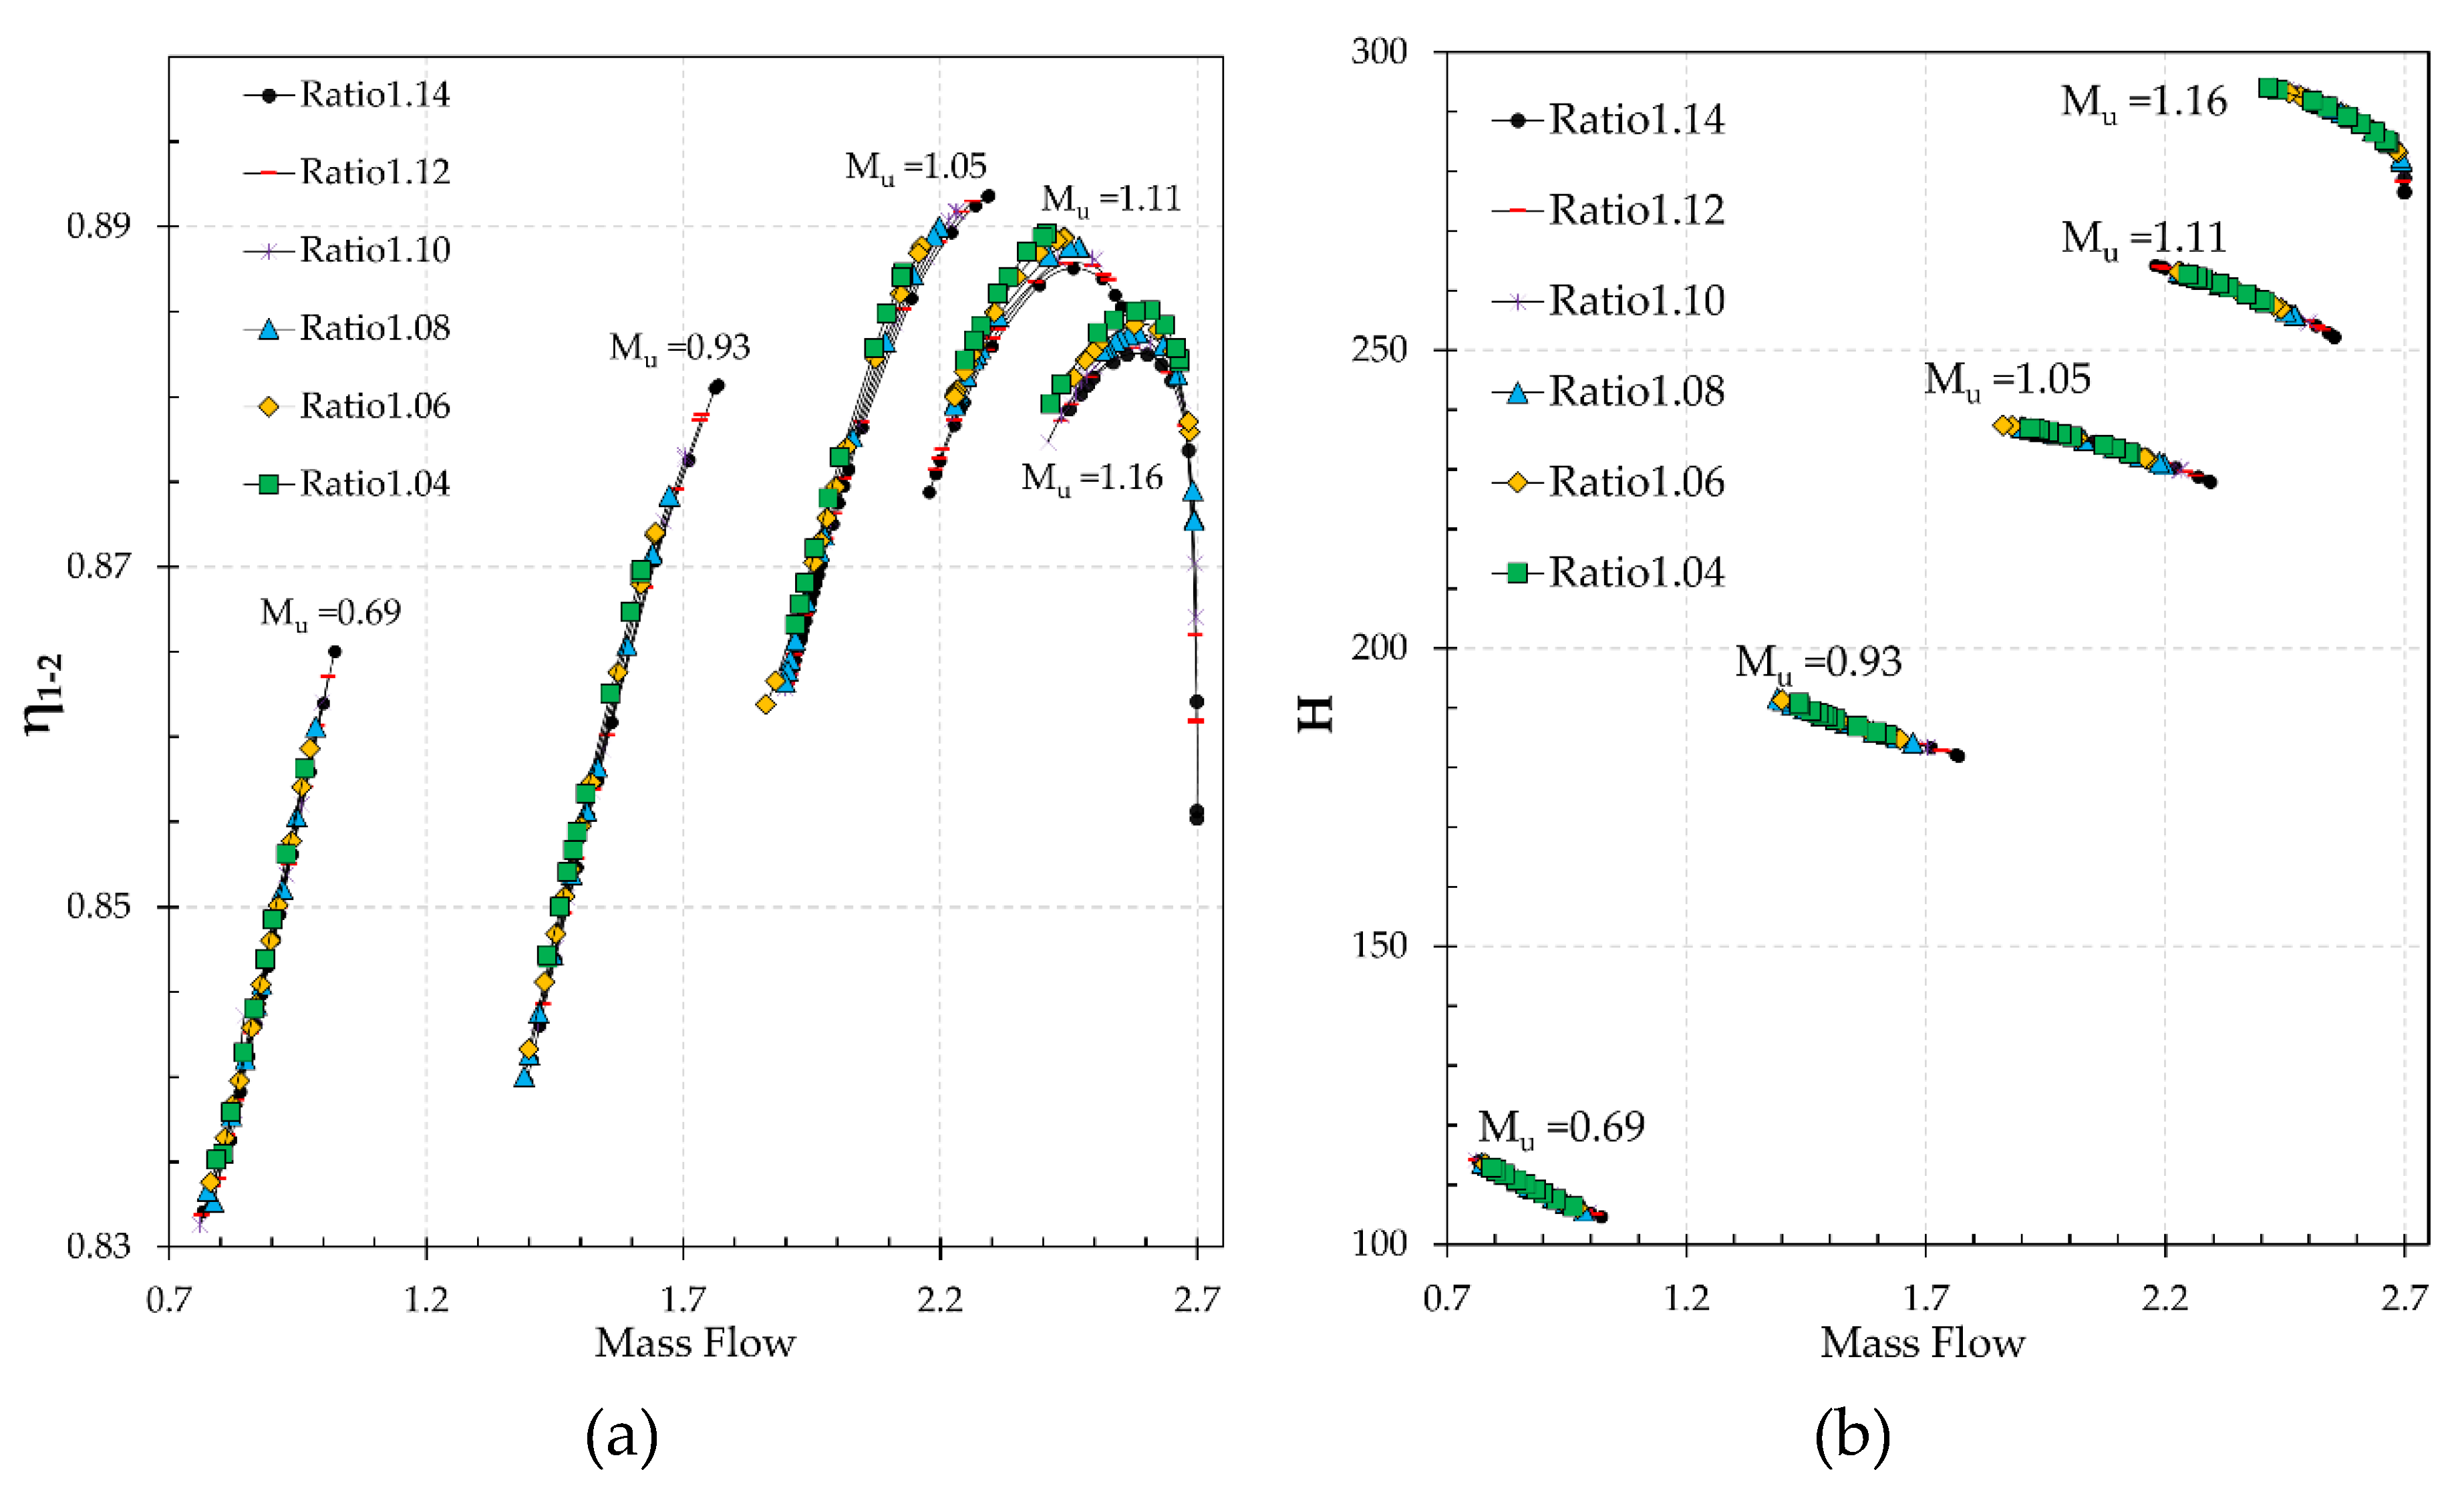
Figure 27 and Figure 28 illustrate the performance of the impeller according to various radial gap sizes. Changing the radial gap ratio varies the efficiency of the impeller. For the same mass flow rate, the impeller efficiency decreases with an increase in the radial gap ratio, resulting in a lower pressure ratio. However, the impeller enthalpy slightly changes. As the tip-speed Mach number increases, the improvement of the efficiency for various radial gap sizes also increases. The improvement of impeller efficiency is by 0.24%, 0.26%, 0.28% and 0.29% at Mu = 0.93, 1.05, 1.11 and 1.16, respectively.
When Mu = 1.16, the effects of varying the radial gap size on the impeller enthalpy are larger than other tip-speed Mach numbers, where the enthalpy increases by increasing the radial gap ratio. Therefore, the effect of a radial gap ratio on the impeller pressure ratio at Mu = 1.16 is negligible. The efficiency differences that are due to the differences in total temperature values creates a higher work input for the impeller as the radial gap ratio decreases from 1.14 to 1.04. Japikse [38] demonstrated that the impeller-diffuser interaction may affect the recirculation and slip. The difference in work input for the various radial gap ratio that is recognized by the enthalpy difference cannot be caused by slip as the relative flow angle is almost the same for the different radial gap ratios. Therefore, it can be realized that this discrepancy in work input value for different radial gap ratios is because of the recirculation that is a factor of work input generation in the impeller. As a result, the recirculation in impeller increases by reducing the radial gap ratio [18]. However, the impeller performance characteristics at Mu = 0.69 are not affected by changing the radial gap ratio.
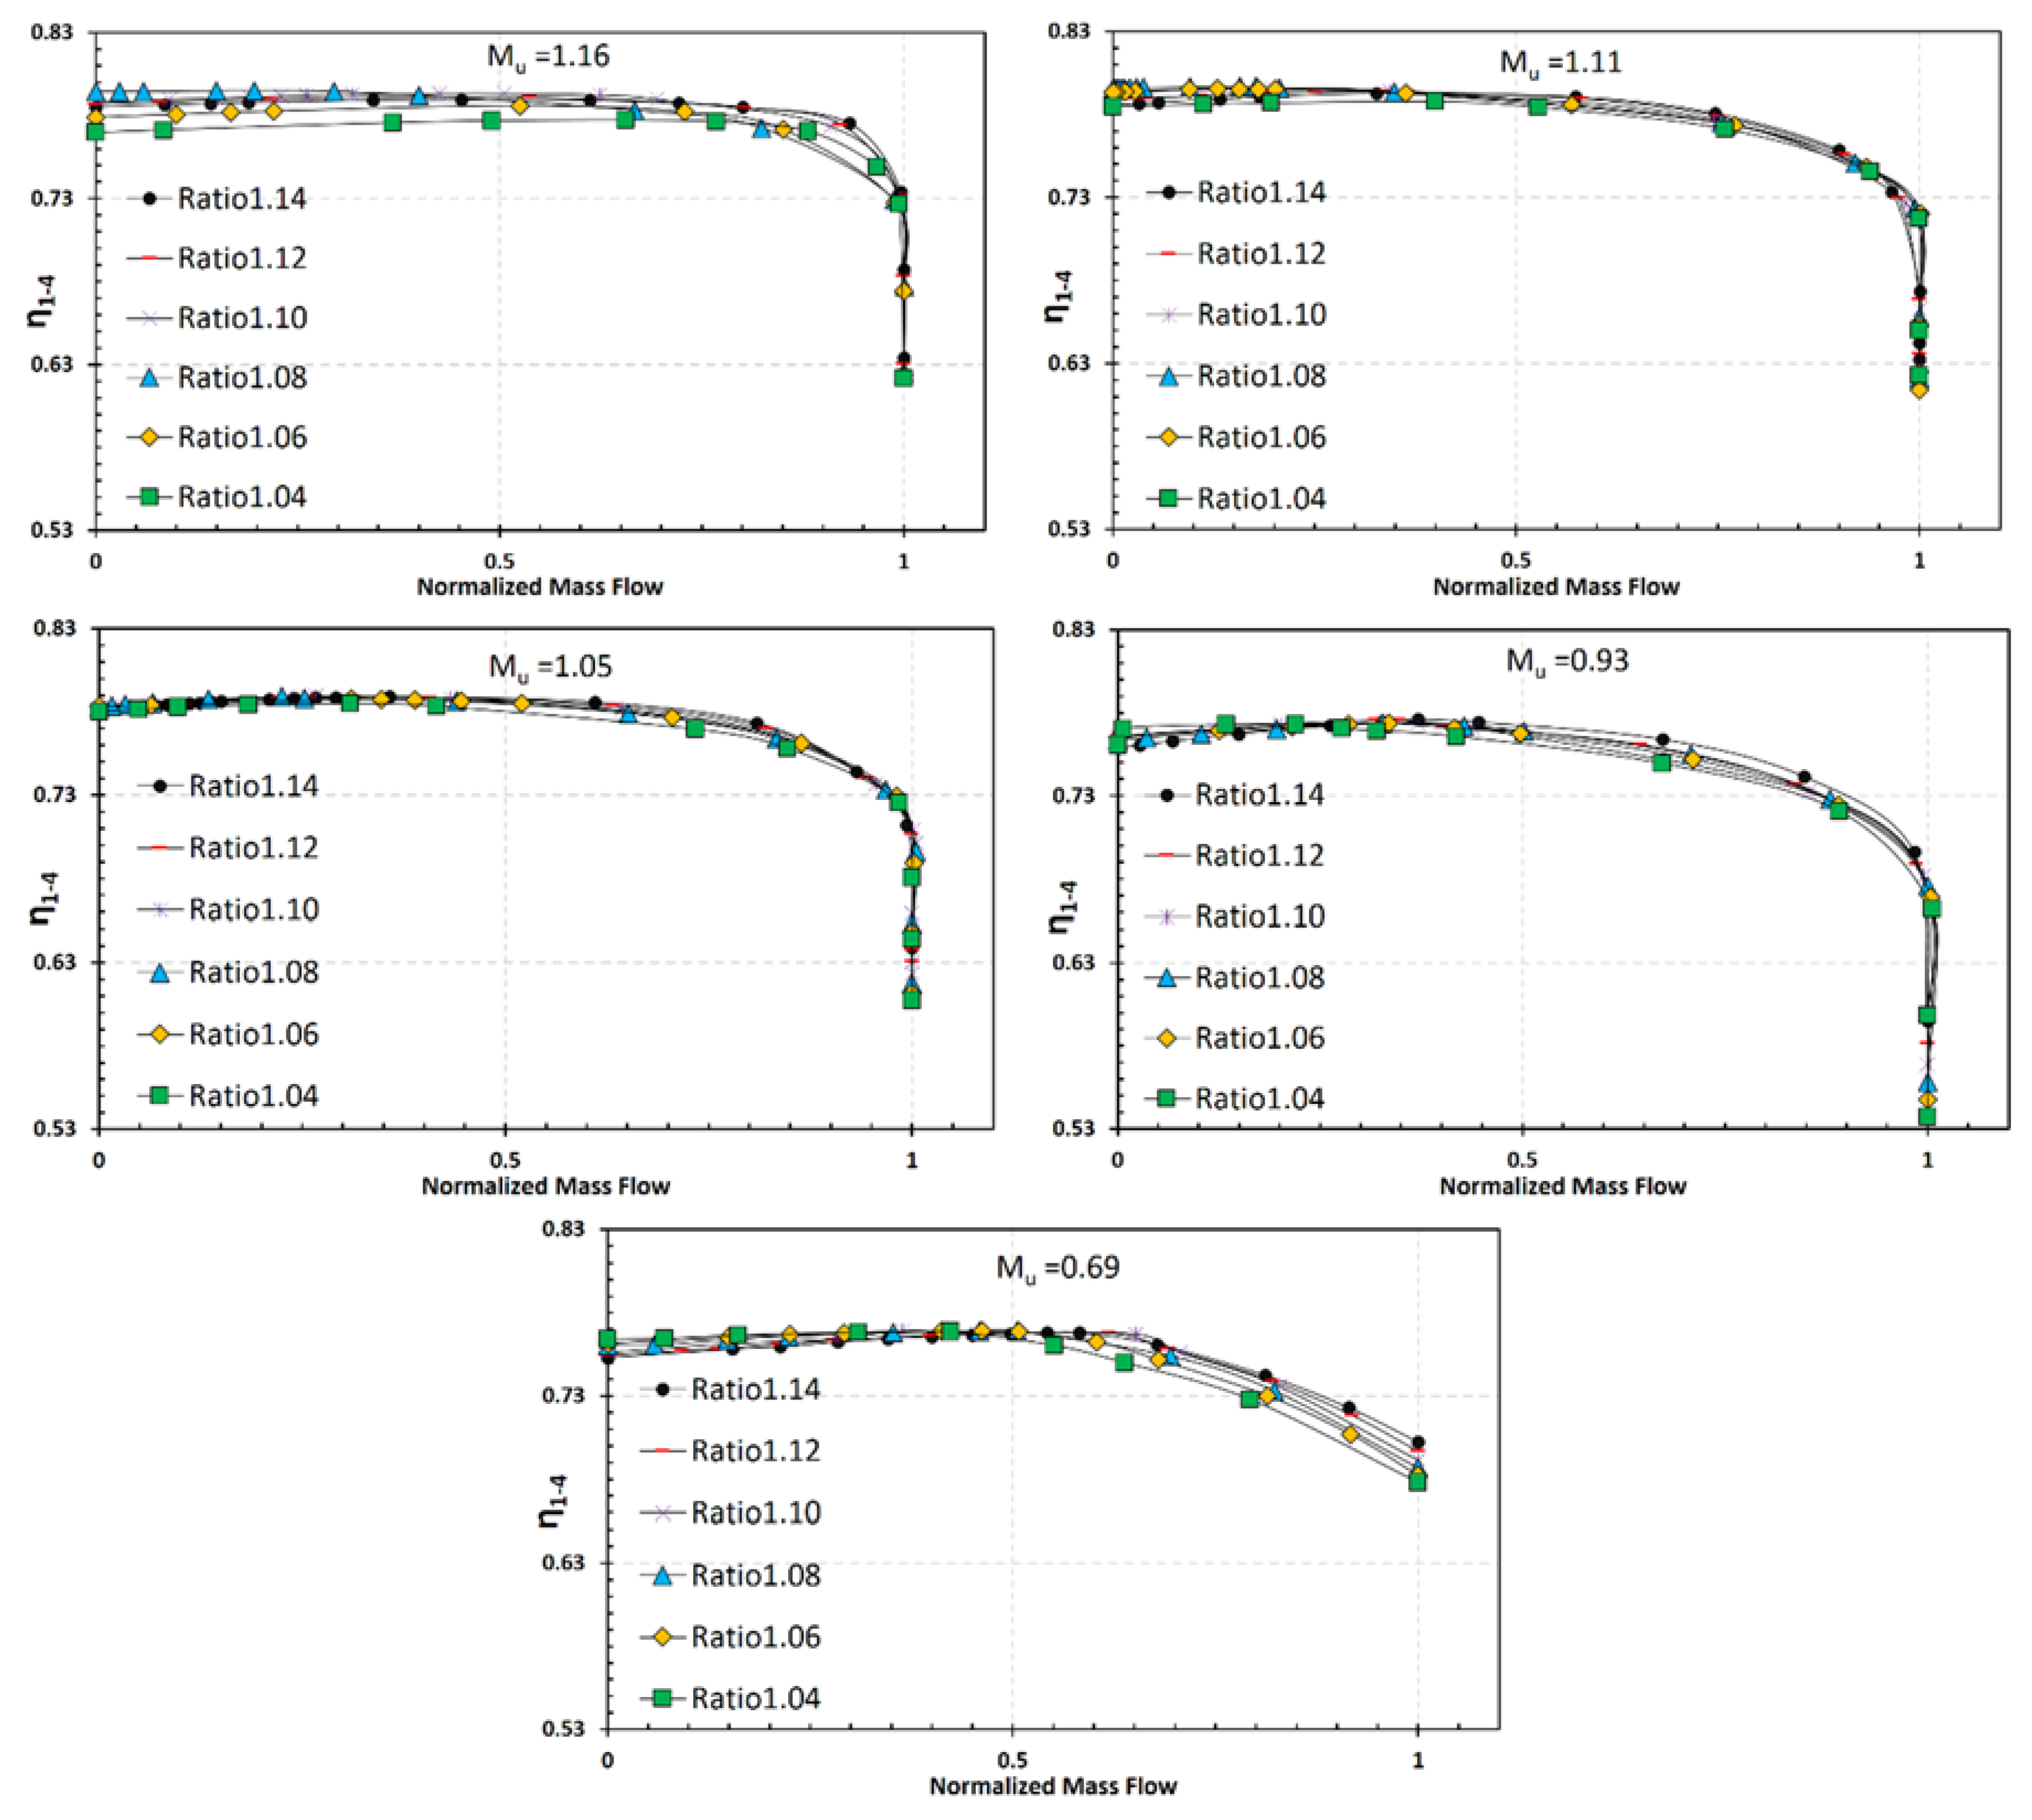
Figure 29 illustrates the efficiencies over normalized mass flow rate. As the choke mass flow and the surge are not the same for all radial gap ratios for particular rotational speeds, normalized mass flow is used here instead of the corrected mass flow rate. For all cases, 35% of the normalized mass flow occurs nearly at the peak efficiency point. The optimum radial gap ratio can be designated based on the maximum stage efficiency (Figure 14 and Figure 29) and the diffuser performance (Figure 23 and Figure 25).
According to Figure 14, Figure 23, Figure 25 and Figure 29, when the tip-speed Mach number is less than one, the change in the radial gap size has little influence on the maximum stage efficiency and the diffuser performance, indicating that the radial gap ratio could be within a wide range for a centrifugal compressor design. Nevertheless, when the tip-speed Mach number is larger than 1.0, both the maximum stage efficiency and the diffuser performance become very sensitive to the radial gap. In this case, a radial gap ratio close to 1.08 seems to be the optimal choice to obtain better stage efficiency and best diffuser performance.
4. Conclusions and Remarks
To investigate the effects of impeller-diffuser interaction on the performance of high-pressure ratio centrifugal compressors and establishing a design criteria of the radial gap ratio in a centrifugal compressor, an extensive numerical simulation series of centrifugal compressor stage with six various settings of a radial gap ratio for five rotational speeds have been conducted and some conclusion are as follows:
1. Effects of radial gap ratio on the stage performance:
Reducing the radial gap size between blade rows contributes to a considerable increase in the Mach number value (reaching to Ma = 1) at the diffuser leading edge. This is because of a reduction in diffuser throat area size when the diffuser vane gets closer to the impeller blades. Consequently, the choke mass flow rate reduces with a reduction in the radial gap ratio. However, there is an exception at Mu = 1.16, as the choke mass flow rate remains constant for a radial gap ratio of 1.10 or more. This is because the choke occurs in the impeller. Therefore, because the choke occurs earlier in smaller radial gaps, the stable flow range increases with an increase in the radial gap.
The effect of changing radial gap on the stage efficiency is noticeable at high rotational speeds, while this effect is not notable for a tip-speed Mach number of less than 1.0.
2. Effects of radial gap ratio on the impeller Performance:
Recirculation is expected to be responsible for a higher working input when the diffuser leading edge gets closer to the impeller trailing edge, contributing to a growth in the total pressure ratio. Furthermore, at the same mass flow rate, decreasing the radial gap ratio reduces the impeller enthalpy slightly. These lead to a reduction in impeller efficiency by increasing the radial gap ratio. The deviation in impeller efficiency is less than 0.3%. Unlike the stage efficiency, the maximum efficiency of an impeller for a pressure ratio of less than 6.7 increases significantly by increasing the radial gap ratio. However, for a pressure ratio of more than 6.7, the maximum efficiency decreases slightly.
3. Effects of radial gap ratio on the diffuser performance:
Due to a reduction of mixing of non-uniform flow at diffuser leading edge area in smaller radial gaps, the loss in a smaller radial gap ratio should be less than that in a larger radial gap size. This phenomenon truly occurs when the tip-speed Mach number is less than 1.0. However, when the tip-speed Mach number exceeds 1.0, the shock wave occurs in the diffuser leading edge of the small radial gaps. Therefore, at the tip-speed Mach number more than 1.0, the loss for small radial gap increases significantly.
Furthermore, for the tip-speed Mach number less than 1.0, the pressure recovery is larger and the diffuser performs better in smaller radial gaps. However, for the tip-speed Mach number more than 1.0, the diffuser with a larger radial gap have better performance than that with smaller radial gaps.
4. Considering the whole stage efficiency as well as the diffuser performance, when the tip-speed Mach is smaller than one, the radial gap could be within a wide range. When it is larger than 1.0, the radial gap should be about 1.08 to achieve a better compressor performance.
Acknowledgments
This research was supported by the National Natural Science Foundation of China (Grant No. 51176087).
Author Contributions
All authors contributed directly to write this paper. Mohammad Javad Hosseini did the numerical simulations, acquired the data, analyzed the data and wrote the paper. Zhenzhong Sun had collaboration in data analyzing. Xiao He revised the paper. Xinqian Zheng supervised the research work, proposed helpful comments to write the paper and did the final revision.
Conflicts of Interest
The authors declare no conflict of interest.
Nomenclature
The following nomenclature is used in this manuscript:
| A | Area |
| Cf | Schlichting empirical formula |
| Cp | Pressure recovery coefficient |
| F | Total skin friction drag force |
| GR | Gap Ratio (Radial gap) (r3/r2) |
| H | Total enthalpy (J/Kg) |
| Mass flow rate | |
| Ma | Absolute Mach number |
| Mu | Tip-speed Mach number (U/) |
| N | Rotational speed |
| P | Pressure |
| R | Gas Constant (J/KgK) |
| T, T0 | Static temperature, Total temperature |
| U | Tip speed (m/s) |
| u | Fluid velocity |
| Swetted | Fluid contacted area |
| Z | Number of blades |
| r2 | Impeller trailing edge radius |
| r3 | Diffuser leading edge radius |
| y+ | Dimensionless Wall Distance |
| Greek symbols | |
| η | Isentropic efficiency |
| π | Total pressure ratio |
| ⍵ | Pressure loss coefficient |
| Fluid density | |
| Subscriptions | |
| 1 | Impeller inlet |
| 2 | Impeller exit |
| 3 | Diffuser inlet |
| 4 | Diffuser exit |
References
- Wang, Y.; Shi, D.; Zhang, D.; Xie, Y. Investigation on Unsteady Flow Characteristics of a SCO2 Centrifugal Compressor. Appl. Sci. 2017, 7, 310. [Google Scholar] [CrossRef]
- Moosania, S.; Zheng, X. Comparison of Cooling Different Parts in a High Pressure Ratio Centrifugal Compressor. Appl. Sci. 2016, 7, 16. [Google Scholar] [CrossRef]
- Krain, H.; Hoffmann, B. Flow Study of a Redesigned High-Pressure-Ratio Centrifugal Compressor. J. Propuls. Power 2008, 24, 1117–1123. [Google Scholar] [CrossRef]
- Higashimori, H.; Hasagawa, K.; Sumida, K.; Suita, T. Detailed Flow Study of Mach Number 1.6 High Transonic Flow With a Shock Wave in a Pressure Ratio 11 Centrifugal Compressor Impeller. J. Turbomach. 2004, 126, 473–481. [Google Scholar] [CrossRef]
- Rodgers, C. Flow Ranges of 8.0:1 Pressure Ratio Centrifugal Compressors for Aviation Applications. In Proceedings of the ASME Turbo Expo 2005: Power for Land, Sea, and Air, Reno, NV, USA, 6–9 June 2005; Volume 6: Turbo Expo 2005, Parts A and B. ASME: New York, NY, USA; pp. 801–811. [Google Scholar]
- Rodgers, C. The Efficiencies of Single-Stage Centrifugal Compressors for Aircraft Applications. In Proceedings of the ASME 1991 International Gas Turbine and Aeroengine Congress and Exposition Conference, Orlando, FL, USA, 3–6 June 1991; Volume 1: Turbomachinery. ASME: New York, NY, USA; p. V001T01A025. [Google Scholar]
- Krain, H. Review of Centrifugal Compressor’s Application and Development. J. Turbomach. 2005, 127, 25. [Google Scholar] [CrossRef]
- Rodgers, C.; Sapiro, L. Design Considerations for High-Pressure-Ratio Centrifugal Compressors. In Proceedings of the ASME 1972 International Gas Turbine and Fluids Engineering Conference and Products Show, San Francisco, CA, USA, 26–30 March 1972; ASME: New York, NY, USA; p. V001T01A090. [Google Scholar]
- Ferrara, G.; Ferrari, L.; Mengoni, C.P.; De Lucia, M.; Baldassarre, L. Experimental Investigation and Characterization of the Rotating Stall in a High Pressure Centrifugal Compressor: Part I—Influence of Diffuser Geometry on Stall Inception. In Proceedings of the ASME Turbo Expo 2002: Power for Land, Sea, and Air, Amsterdam, The Netherlands, 3–6 June 2002; Volume 5: Turbo Expo 2002, Parts A and B. ASME: New York, NY, USA; pp. 613–620. [Google Scholar]
- Ebrahimi, M.; Huang, Q.; He, X.; Zheng, X. Effects of Variable Diffuser Vanes on Performance of a Centrifugal Compressor with Pressure Ratio of 8.0. Energies 2017, 10, 682. [Google Scholar] [CrossRef]
- Zheng, X.; Zhang, Y.; Yang, M.; Bamba, T.; Tamaki, H. Stability Improvement of High-Pressure-Ratio Turbocharger Centrifugal Compressor by Asymmetrical Flow Control-Part II: Non-Axisymmetrical Self-Recirculation Casing Treatment. J. Turbomach. 2013, 135, 0210061–0210069. [Google Scholar] [CrossRef] [PubMed]
- Lin, Y.; Zheng, X.; Jin, L.; Tamaki, H.; Kawakubo, T. A novel experimental method to evaluate the impact of volute’s asymmetry on the performance of a high pressure ratio turbocharger compressor. Sci. Chin. Technol. Sci. 2012, 55, 1695–1700. [Google Scholar] [CrossRef]
- Liu, Y.; Sun, J.; Tang, Y.; Lu, L. Effect of Slot at Blade Root on Compressor Cascade Performance under Different Aerodynamic Parameters. Appl. Sci. 2016, 6, 421. [Google Scholar] [CrossRef]
- Klassen, H.A.; Wood, J.R.; Schumann, F. Experimental Performance of a 13.65-Centimeter-Tip-Diameter Tandem-Bladed Sweptback Centrifugal Compressor Designed for a Pressure Ratio of 6; Technical Report; NASA: Washington, DC, USA, 1977.
- Gallier, K. Experimental Characterization of High Speed Centrifugal Compressor Aerodynamic Forcing Function. Ph.D. Thesis, Purdue University, West Lafayette, IN, USA, 2005. [Google Scholar]
- Filipenco, V.G.; Deniz, S.; Johnston, J.M.; Greitzer, E.M.; Cumpsty, N.A. Effects of Inlet Flow Field Conditions on the Performance of Centrifugal Compressor Diffuser. In Volume 1: Turbomachinery; ASME: New York, NY, USA, 1998; Volume 122, p. V001T01A111. [Google Scholar]
- Bonaiuti, D.; Arnone, A.; Hah, C.; Hayami, H. Development of Secondary Flow Field in a Low Solidity Diffuser in a Transonic Centrifugal Compressor Stage. In Proceedings of the ASME Turbo Expo 2002: Power for Land, Sea, and Air, Amsterdam, The Netherlands, 3–6 June 2002; Volume 5: Turbo Expo 2002, Parts A and B. ASME: New York, NY, USA; pp. 445–454. [Google Scholar]
- Ziegler, K.U.; Gallus, H.E.; Niehuis, R. A Study on Impeller-Diffuser Interaction—Part II: Detailed Flow Analysis. J. Turbomach. 2003, 125, 183. [Google Scholar] [CrossRef]
- Sato, K.; He, L. A Numerical Study on Performances of Centrifugal Compressor Stages With Different Radial Gaps. In Proceedings of the ASME Turbo Expo 2000: Power for Land, Sea, and Air, Munich, Germany, 8–11 May 2000; Volume 1: Aircraft Engine; Marine; Turbomachinery; Microturbines and Small Turbomachinery. ASME: New York, NY, USA; p. V001T03A036. [Google Scholar]
- Shum, Y.K.P.; Tan, C.S.; Cumpsty, N.A. Impeller—Diffuser Interaction in a Centrifugal Compressor. J. Turbomach. 2000, 122, 777–786. [Google Scholar] [CrossRef]
- Robinson, C.; Casey, M.; Hutchinson, B.; Steed, R. Impeller-Diffuser Interaction in Centrifugal Compressors. In Proceedings of the ASME Turbo Expo 2012: Turbine Technical Conference and Exposition, Copenhagen, Denmark, 11–15 June 2012; Volume 8: Turbomachinery, Parts A, B, and C. ASME: New York, NY, USA; pp. 767–777. [Google Scholar]
- Ziegler, K.U.; Gallus, H.E.; Niehuis, R. A Study on Impeller-Diffuser Interaction—Part I: Influence on the Performance. J. Turbomach. 2003, 125, 173–182. [Google Scholar] [CrossRef]
- Krishnababu, S.K.; Imregun, M.; Green, J.S.; Hoyniak, D. Aerodynamics and Aeroelasticity of Impeller Vane Interactions in a High Pressure Ratio Centrifugal Compressor. In Proceedings of the ASME Turbo Expo 2010: Power for Land, Sea, and Air, Glasgow, UK, 14–18 June 2010; Volume 6: Structures and Dynamics, Parts A and B. ASME: New York, NY, USA; pp. 1201–1208. [Google Scholar]
- Clements, W.W.; Artt, D.W. The Influence of Diffuser Vane Leading Edge Geometry on the Performance of a Centrifugal Compressor. In Proceedings of the ASME 1989 International Gas Turbine and Aeroengine Congress and Exposition, Toronto, ON, Canada, 4–8 June 1989; Volume 1: Turbomachinery. ASME: New York, NY, USA; p. V001T01A068. [Google Scholar]
- Rodgers, C. The Performance of Centrifugal Compressor Channel Diffusers. In Proceedings of the ASME 1982 International Gas Turbine Conference and Exhibit, London, England, 18–22 April 1982; Volume 1: Turbomachinery. ASME: New York, NY, USA; Volume 82-NaN-10, p. V001T01A003. [Google Scholar]
- He, X.; Zheng, X.; Wei, J.; Zeng, H. Investigation of Vaned Diffuser Splitters on the Performance and Flow Control of High Pressure Ratio Centrifugal Compressors. In Proceedings of the ASME Turbo Expo 2016: Turbomachinery Technical Conference and Exposition, Seoul, South Korea, 13–17 June 2016; Volume 2D: Turbomachinery. ASME: New York, NY, USA; p. V02DT42A008. [Google Scholar]
- NUMECA International NUMECA FINE/Turbo User Manual 10.1. Available online: http://www.numeca.com (accessed on 3 April 2017).
- Spalart, P.R.; Allmaras, S.R. A One-Equation Turbulence Model for Aerodynamic Flows. AIAA Meet. Pap. 1994, 1, 5–21. [Google Scholar]
- Spalart, P.R.; Shur, M. On the sensitization of turbulence models to rotation and curvature. Aerosp. Sci. Technol. 1997, 1, 297–302. [Google Scholar] [CrossRef]
- Hakimi, N. Preconditioning Methods for Time Dependent Navier-Stokes Equations. Ph.D. Thesis, Vrije Universiteit, Brussels, Belgium, 1997. [Google Scholar]
- Menter, F.R. Two-equation eddy-viscosity turbulence models for engineering applications. AIAA J. 1994, 32, 1598–1605. [Google Scholar] [CrossRef]
- Peyvan, A.; Benisi, A.H. Axial-Flow Compressor Performance Prediction in Design and Off-Design Conditions through 1-D and 3-D Modeling and Experimental Study. J. Appl. Fluid Mech. 2016, 9, 2149–2160. [Google Scholar]
- Mirzaee, S.; Zheng, X.; Lin, Y. Improvement in the stability of a turbocharger centrifugal compressor by tip leakage control. Proc. Inst. Mech. Eng. Part D J. Automob. Eng. 2017, 231, 700–714. [Google Scholar] [CrossRef]
- Liu, Y.; Liu, B.; Lu, L. Investigation of Unsteady Impeller-Diffuser Interaction in a Transonic Centrifugal Compressor Stage. In Proceedings of the ASME Turbo Expo 2010: Power for Land, Sea, and Air, Glasgow, UK, 14–18 June 2010; Volume 7: Turbomachinery, Parts A, B, and C. ASME: New York, NY, USA; pp. 1961–1971. [Google Scholar]
- Li, P.Y.; Gu, C.W.; Song, Y. A new optimization method for centrifugal compressors based on 1D calculations and analyses. Energies 2015, 8, 4317–4334. [Google Scholar] [CrossRef]
- Liu, B.; Fu, D.; Yu, X. Development of a Preliminary Design Method for Subsonic Splittered Blades in Highly Loaded Axial-Flow Compressors. Appl. Sci. 2017, 7, 283. [Google Scholar] [CrossRef]
- Cumpsty, N.A. Compressor Aerodynamics; Longman Scientific & Technical: London, UK, 1989; p. 509. [Google Scholar]
- Japikse, D. Centrifugal Compressor Design and Performance; Concepts ETI Inc.: Windsor County, VT, USA, 1996. [Google Scholar]
Figure 1.
Vaned diffuser geometry.

Figure 2.
Performance at design speed predicted by different turbulence models.

Figure 3.
Comparison of effects of different interface model on the compressor performance and flow field.
Figure 3.
Comparison of effects of different interface model on the compressor performance and flow field.

Figure 4.
Absolute Mach number contour: (right) different interface model for steady simulation and (left) unsteady simulation.
Figure 4.
Absolute Mach number contour: (right) different interface model for steady simulation and (left) unsteady simulation.

Figure 5.
Effect of different interface radius ratio on the compressor performance.

Figure 6.
Convergence history: Mu = 1.05 in the near surge condition.

Figure 7.
Single passage mesh: (a) Impeller part; (b) Diffuser part.

Figure 8.
The y+ distribution on solid walls.

Figure 9.
Overall performance comparison: (a) Efficiency; (b) Pressures, adapted with permission from [33], Copyright SAGE Publishing, 2016.
Figure 9.
Overall performance comparison: (a) Efficiency; (b) Pressures, adapted with permission from [33], Copyright SAGE Publishing, 2016.

Figure 10.
Comparison of the meridional velocity (Cm[m/s]) and the relative velocity (⍵[m/s]) contours: (a) Meridional velocity; (b) Relative velocity, [33]. Adapted with permission from [33], Copyright SAGE Publishing, 2016.

Figure 11.
Compressor performance with steady and unsteady simulation for radial gap ratios of 1.08 and 1.14; Mu = 0.93.
Figure 11.
Compressor performance with steady and unsteady simulation for radial gap ratios of 1.08 and 1.14; Mu = 0.93.

Figure 12.
Performance map for five tip-speed Mach numbers and six radial gap ratios.

Figure 13.
Compressor adiabatic efficiencies map.

Figure 14.
Maximum adiabatic efficiency map for five tip-speed Mach numbers and six radial gap ratios.
Figure 14.
Maximum adiabatic efficiency map for five tip-speed Mach numbers and six radial gap ratios.

Figure 15.
Stable flow ranges (SFR) for five tip-speed Mach numbers and six various radial gap ratios.
Figure 15.
Stable flow ranges (SFR) for five tip-speed Mach numbers and six various radial gap ratios.

Figure 16.
Absolute Mach number at: (a) impeller trailing edge; (b) diffuser leading edge at the peak efficiency point, Mu = 1.16 (design speed).
Figure 16.
Absolute Mach number at: (a) impeller trailing edge; (b) diffuser leading edge at the peak efficiency point, Mu = 1.16 (design speed).

Figure 17.
The pitch-averaged spanwise contour of the relative Mach number superimposed with isolines at 50% span at a peak efficiency point of Mu = 1.16 (design speed) for various radial gap ratios.
Figure 17.
The pitch-averaged spanwise contour of the relative Mach number superimposed with isolines at 50% span at a peak efficiency point of Mu = 1.16 (design speed) for various radial gap ratios.

Figure 18.
The pitch-averaged spanwise contour of the relative Mach number superimposed with isolines at 50% span at a peak efficiency point of Mu = 0.69 for various radial gap ratios.
Figure 18.
The pitch-averaged spanwise contour of the relative Mach number superimposed with isolines at 50% span at a peak efficiency point of Mu = 0.69 for various radial gap ratios.

Figure 19.
Absolute Mach number distribution superimposed with isolines at 50% span at the peak efficiency point of Mu = 1.16 (design speed) for various radial gap ratios.
Figure 19.
Absolute Mach number distribution superimposed with isolines at 50% span at the peak efficiency point of Mu = 1.16 (design speed) for various radial gap ratios.

Figure 20.
Absolute Mach number distribution superimposed with isolines at 50% span at the peak efficiency point of Mu = 0.69 for various radial gap ratios.
Figure 20.
Absolute Mach number distribution superimposed with isolines at 50% span at the peak efficiency point of Mu = 0.69 for various radial gap ratios.

Figure 21.
Absolute Mach number contour superimposed with isolines at 50% span for the lowest and highest radial gap when: (a) Mu = 1.16 (design speed); (b) Mu = 0.69.
Figure 21.
Absolute Mach number contour superimposed with isolines at 50% span for the lowest and highest radial gap when: (a) Mu = 1.16 (design speed); (b) Mu = 0.69.

Figure 22.
Diffuser pressure recovery coefficient.

Figure 23.
Maximum diffuser pressure recovery coefficients for five tip-speed Mach numbers and six various radial gap ratios.
Figure 23.
Maximum diffuser pressure recovery coefficients for five tip-speed Mach numbers and six various radial gap ratios.

Figure 24.
Diffuser loss coefficient for five tip-speed Mach numbers and six radial gap ratios.

Figure 25.
Minimum diffuser pressure loss coefficient for five tip-speed Mach numbers and various radial gap ratios.
Figure 25.
Minimum diffuser pressure loss coefficient for five tip-speed Mach numbers and various radial gap ratios.

Figure 26.
Entropy contour superimposed with isolines at 50% span at the peak efficiency point for three various radial gap ratios when: (a) Mu = 0.69; (b) Mu = 1.16
Figure 26.
Entropy contour superimposed with isolines at 50% span at the peak efficiency point for three various radial gap ratios when: (a) Mu = 0.69; (b) Mu = 1.16

Figure 27.
(a) Impeller efficiency; (b) Impeller enthalpy.

Figure 28.
The pressure ratio of the impeller at different Mu.

Figure 29.
Stage efficiency vs. normalized mass flow.


Table 1.
Compressor Specifications.
| Datum Compressor TTL-1 | ||
|---|---|---|
| Impeller | ||
| Number of blades | ZI | 24 |
| Maximum rotational speed | Nmax (rpm) | 52,440 |
| Normalized leading edge hub radius | r1h/r2 | 0.26 |
| Normalized leading edge tip radius | r1t/r2 | 0.65 |
| Diffuser | ||
| Number of Vanes | ZD | 19 |
| Area ratio | A4/AThroat | 2.0 |
| Blade turning | β4–β3 | 15° |
| Normalized leading edge radius | r3/r2 | 1.10 |
| Normalized trailing edge radius | r4/r2 | 1.48 |
| Stage performance | ||
| Peak total pressure ratio | max π1-4 | 8.12 |
| Maximum corrected mass flow | ṁ | 2.6982 |
| Peak isentropic efficiency | η1-4 | 79.7% |
Table 2.
Turbulence model overview.
| Models | Equation Numbers | Time (10,000 Iterations Per Core) | η1-4 | π1-4 |
|---|---|---|---|---|
| SST | 2 | 23.3 h | 0.8042 | 8.03 |
| k-ε | 2 | 19.5 h | 0.7871 | 7.83 |
| SA | 1 | 17.4 h | 0.7989 | 8.05 |
| SARC | 1 | 27.0 h | 0.7924 | 7.89 |
Table 3.
Imposed boundary conditions.
| Domain Boundary | Imposed Condition | Value |
|---|---|---|
| Inlet | Total Temperature | 288.15 K |
| Total Pressure | 101,300 Pa | |
| Tangential velocity angle | 0 rad | |
| Radial velocity angle | 0 rad | |
| Outlet (mid-operating points) | Averaged static pressure | Increased stepwise |
| Outlet (near surge) | Average mass flow rate | Decreased stepwise |
| Solid walls | Stationary or rotating adiabatic non-slip wall |
Table 4.
Compressor maximum pressure ratio for five tip-speed Mach numbers and six radial gap ratios.
Table 4.
Compressor maximum pressure ratio for five tip-speed Mach numbers and six radial gap ratios.
| Mu = 1.16 | Mu = 1.11 | Mu = 1.05 | Mu = 0.93 | Mu = 0.69 | |
|---|---|---|---|---|---|
| GR = 1.14 | 8.0297 | 6.8368 | 5.8013 | 4.2286 | 2.4961 |
| GR = 1.12 | 8.0701 | 6.8665 | 5.8184 | 4.2374 | 2.5032 |
| GR = 1.10 | 8.1229 | 6.9012 | 5.8322 | 4.2484 | 2.5104 |
| GR = 1.08 | 8.1039 | 6.9265 | 5.8384 | 4.2587 | 2.5121 |
| GR = 1.06 | 7.9239 | 6.9044 | 5.8373 | 4.2642 | 2.5127 |
| GR = 1.04 | 7.8279 | 6.7734 | 5.8074 | 4.2815 | 2.5079 |
© 2017 by the authors. Licensee MDPI, Basel, Switzerland. This article is an open access article distributed under the terms and conditions of the Creative Commons Attribution (CC BY) license (http://creativecommons.org/licenses/by/4.0/).
Share and Cite
MDPI and ACS Style
Hosseini, M.; Sun, Z.; He, X.; Zheng, X. Effects of Radial Gap Ratio between Impeller and Vaned Diffuser on Performance of Centrifugal Compressors. Appl. Sci. 2017, 7, 728. https://0-doi-org.brum.beds.ac.uk/10.3390/app7070728
AMA Style
Hosseini M, Sun Z, He X, Zheng X. Effects of Radial Gap Ratio between Impeller and Vaned Diffuser on Performance of Centrifugal Compressors. Applied Sciences. 2017; 7(7):728. https://0-doi-org.brum.beds.ac.uk/10.3390/app7070728
Chicago/Turabian StyleHosseini, Mohammadjavad, Zhenzhong Sun, Xiao He, and Xinqian Zheng. 2017. "Effects of Radial Gap Ratio between Impeller and Vaned Diffuser on Performance of Centrifugal Compressors" Applied Sciences 7, no. 7: 728. https://0-doi-org.brum.beds.ac.uk/10.3390/app7070728
Note that from the first issue of 2016, this journal uses article numbers instead of page numbers. See further details here.