Localization in Low Power Wide Area Networks Using Wi-Fi Fingerprints


IDLab–Faculty of Applied Engineering, University of Antwerp–imec, Groenenborgerlaan 171, 2020 Antwerpen, Belgium
*
Author to whom correspondence should be addressed.
Appl. Sci. 2017, 7(9), 936; https://0-doi-org.brum.beds.ac.uk/10.3390/app7090936
Submission received: 13 July 2017
/
Revised: 2 September 2017
/
Accepted: 7 September 2017
/
Published: 12 September 2017
(This article belongs to the Special Issue Advanced Internet of Things for Smart Infrastructure System)
Abstract
:Featured Application
Localization of a wireless track and trace device communicating over Sigfox and using nearby Wi-Fi access points as references.
Abstract
Supply chain management requires regular updates of the location of assets, which can be enabled by low power wide area networks, such as Sigfox. While it is useful to localize a device simply by its communication signals, this is very difficult to do with Sigfox because of wide area and ultra narrowband nature. On the other hand, installing a satellite localization element on the device greatly increases its power consumption. We investigated using information about nearby Wi-Fi access points as a way to localize the asset over the Sigfox network, so without connecting to those Wi-Fi networks. This paper reports the location error that can be achieved by this type of outdoor localization. By using a combination of two databases, we could localize the device on all 36 test locations with a median location error of 39 . This shows that the localization accuracy of this method is promising enough to warrant further study, most specifically the minimal power consumption.
1. Introduction
The location of an asset at a given time is an important piece of information in supply chain management [1,2,3]. Hillbrand and Schoech [4] divide tracking and tracing of assets into two categories: discrete and continuous. The discrete category relies on barcodes and Radio Frequency Identification (RFID) approaches to know when a specific asset is at a predefined location. The continuous category relies on a Global Navigation Satellite System (GNSS) such as the Global Positioning System (GPS) to establish the location of the asset and a cellular data connection to communicate this location with the management software. Kandel et al. [5] define a subcategory to continuous tracking, called the quasi-continuous tracking. In this subcategory, the management software continuously tracks a vehicle, while the vehicle has knowledge about the assets it carries through discrete tracking. Oliveira et al. [6] present and discuss a number of recent quasi-continuous tracking solutions.
In an Internet of Things scenario, assets would have a permanent connection to the internet themselves, rather than through a hub in the transportation vehicle. This allows the owner of the assets to be independent of the transporter. While this connection can in theory be a cellular data connection, in practice the energy requirements for such connections limit its applicability only to assets that are large enough to carry additional batteries for this connection. Low Power Wide Area Networks (LPWAN) propose to reduce the energy requirement of the mobile data connection, albeit at reduced data rates [7].
Sigfox [8] is one of the major players in the LPWAN market. It uses an ultra narrow band (UNB) channel of 100 with a Differential Binary Phase Shift Keying (BPSK) modulation operating on the 868 telecommunication frequency in Europe. This frequency does not require a license for operating Short Range Devices (SRD), defined as devices with a limited transmission power. To comply with these regulations, a Sigfox device can only transmit 140 messages of 12 B each on a single day at 100 . This stems from a 1% hourly duty cycle regulation, limiting Sigfox to 36 of signal transmission or six messages per hour. The transmission of a single Sigfox message takes 6 , during which the same information is transmitted three times for error prevention. The communication range is around 30 outside cities and 3 inside cities [7,9]. In this article, we present our idea of enabling localization of a device using the 12 B payload limit of Sigfox.
Localization based on wireless communication can be split into three categories: proximity; geometry, better known as trilateration or triangulation; and pattern recognition, also referred to as scene analysis or fingerprinting [10]. Proximity localization assumes that a mobile unit is at or near the location of the gateway with which it is connected. The proximity method’s accuracy depends on the range of the communication method. Proximity localization is often used in Radio Frequency Identification (RFID) scenarios, which have a limited range [11]. If the range increases, the mobile unit can be in communication with multiple gateways, which allows more sophisticated estimation of the mobile unit’s location. These types of estimation quickly approach the trilateration technique. Trilateration, a type of geometric localization, estimates the distance between the mobile unit and multiple gateways. These distance estimates can be based on the time of flight of the signal [12], or based on the attenuation of the signal when received by either the mobile unit or the gateways [13]. Triangulation, as opposed to trilateration, estimates the angle of arrival of the received signal through an antenna array. Pattern recognition, most commonly known in the localization community as fingerprinting, consists of comparing a snapshot of the current environment with a database of such snapshots linked to known locations [14].
Wi-Fi fingerprinting is excellently reviewed by He and Chan [15]. It consists of an offline and online phase. During the offline phase, a site survey is conducted that results in a fingerprint database. During the online phase a mobile unit is localized by comparing its fingerprint measurements with the database. A fingerprint, in the case of Wi-Fi, is a list of all nearby Wi-Fi access points, paired with their received signal strength at the mobile unit. One thing to consider in Wi-Fi fingerprinting is how to compare the fingerprint created by the mobile unit with the fingerprints in the database. Torres-Sospedra et al. [16] provide an overview of 51 distance metrics that could be used for this comparison. Another consideration in Wi-Fi fingerprinting is the challenge of constructing the fingerprint database. While the traditional approach is to collect the fingerprints during a labor intensive site survey, some researchers have looked into crowd sourcing the database construction [17].
Since Sigfox is an ultra-narrowband technology, localization based on its communication signal is very challenging. Gezici et al. [18] show that the Cramér-Rao Lower Bound (CRLB) for estimating the range between mobile device and base station through the time delay of the signal is reversely proportional to the bandwidth. They also indicate that the CRLB for estimating that range through the received signal strength is proportional to the distance between the mobile unit and the base station; since Sigfox is a wide area network, we can assume generally that the CRLB will be rather high. Sallouha et al. [19] demonstrate a classification or fingerprinting solution to Sigfox localization, employing GPS enabled devices to create the fingerprints. They achieve a classification accuracy of 78% in fingerprints with a radius of 150 , separated by 2.5 times this distance from other fingerprints.
In this article, we present our approach to Sigfox localization, based on sensing nearby Wi-Fi access points. Due to the limitations of Sigfox, we can transmit only two Basic Service Set Identifiers (BSSID), which are six bytes each. This leaves no payload space to transmit any received signal strength information. While Wi-Fi fingerprinting is well studied, we investigate for the first time the location error when reducing the available information to only two BSSIDs, when usually anywhere between ten to sixty BSteSIDs can be seen, including a Received Signal Strength Indicator (RSSI) value to indicate if it is nearby or far away. Although more information can be transmitted over Sigfox by using multiple messages, it still has a limit of six messages per hour. Thus, using two messages instead of one increases the update period from ten minutes to twenty minutes. This is why we are interested in using just a single Sigfox message. Additionally, we will use online crowd sourced Wi-Fi access point databases, which are inherently less accurate than the carefully constructed databases in common research. While crowd sourced services have obvious drawbacks, especially being noisy, Sapiezynski et al. [20] achieved a 15 median location error for 73% of their test scans. The aim of the research in this article is to establish the expected location error for our approach.
The article continues as follows. Section 2 outlines the localization approach, discusses the online Wi-Fi databases, and presents the measurement locations. Section 3 describes the localization results, and the frequency of missing an access point. Section 4 analyses and discusses those results. Finally, Section 5 draws the conclusion.
2. Methods and Materials
This section is split into the localization approach and a discussion of the online Wi-Fi access point databases. It also includes an overview of the test locations.
2.1. Localization Approach
The general approach of Wi-Fi fingerprinting localization can be divided into two steps: the training and operational step. Firstly, the training step is to discover networks or Wireless Access Points (WAP) and store their BSSID in a database, usually linked with the received signal strength at that location. There is no need to connect the Wi-Fi device with these access points. Secondly, the operational step is requesting from the database the location of newly discovered WAP during operation. The database will reply with the location of each WAP. We will not construct the database ourselves, but utilize databases that are available online; thus, we will only look into the operational step.
To discover nearby access points, a laptop or a smartphone with a Wi-Fi adapter is required. A Python script saves the BSSID and received signal strength of each discovered access point. In Windows, this can easily be done by running the following command: netsh wlan show networks mode=bssid. The Python script then saves the output to a file, together with the current location. The current location is determined by a GPS module. To be more accurate, all locations are chosen to be recognized on a map, so that a visual check of the GPS location can be performed. This procedure is executed on 36 locations in and around Antwerp, Belgium.
When the data is collected, a HTTP-request to a database will be performed for every BSSID. Afterwards, the database will respond with a message, which includes the coordinate of the access point. If the BSSID is not found in the database, an error message will be sent. Subsequently, all possible combinations of two BSSIDs are generated and the mean coordinate of every pair is calculated. If only one of the two BSSIDs was found in the database, the coordinate of that BSSID will be considered as the mean coordinate. Finally, the distance error can be calculated. This is the distance between the coordinate of the position where the measurement took place and the mean coordinate of the pair of BSSIDs. This distance is calculated using the Haversine function, which takes into account the curvature of the Earth [21].
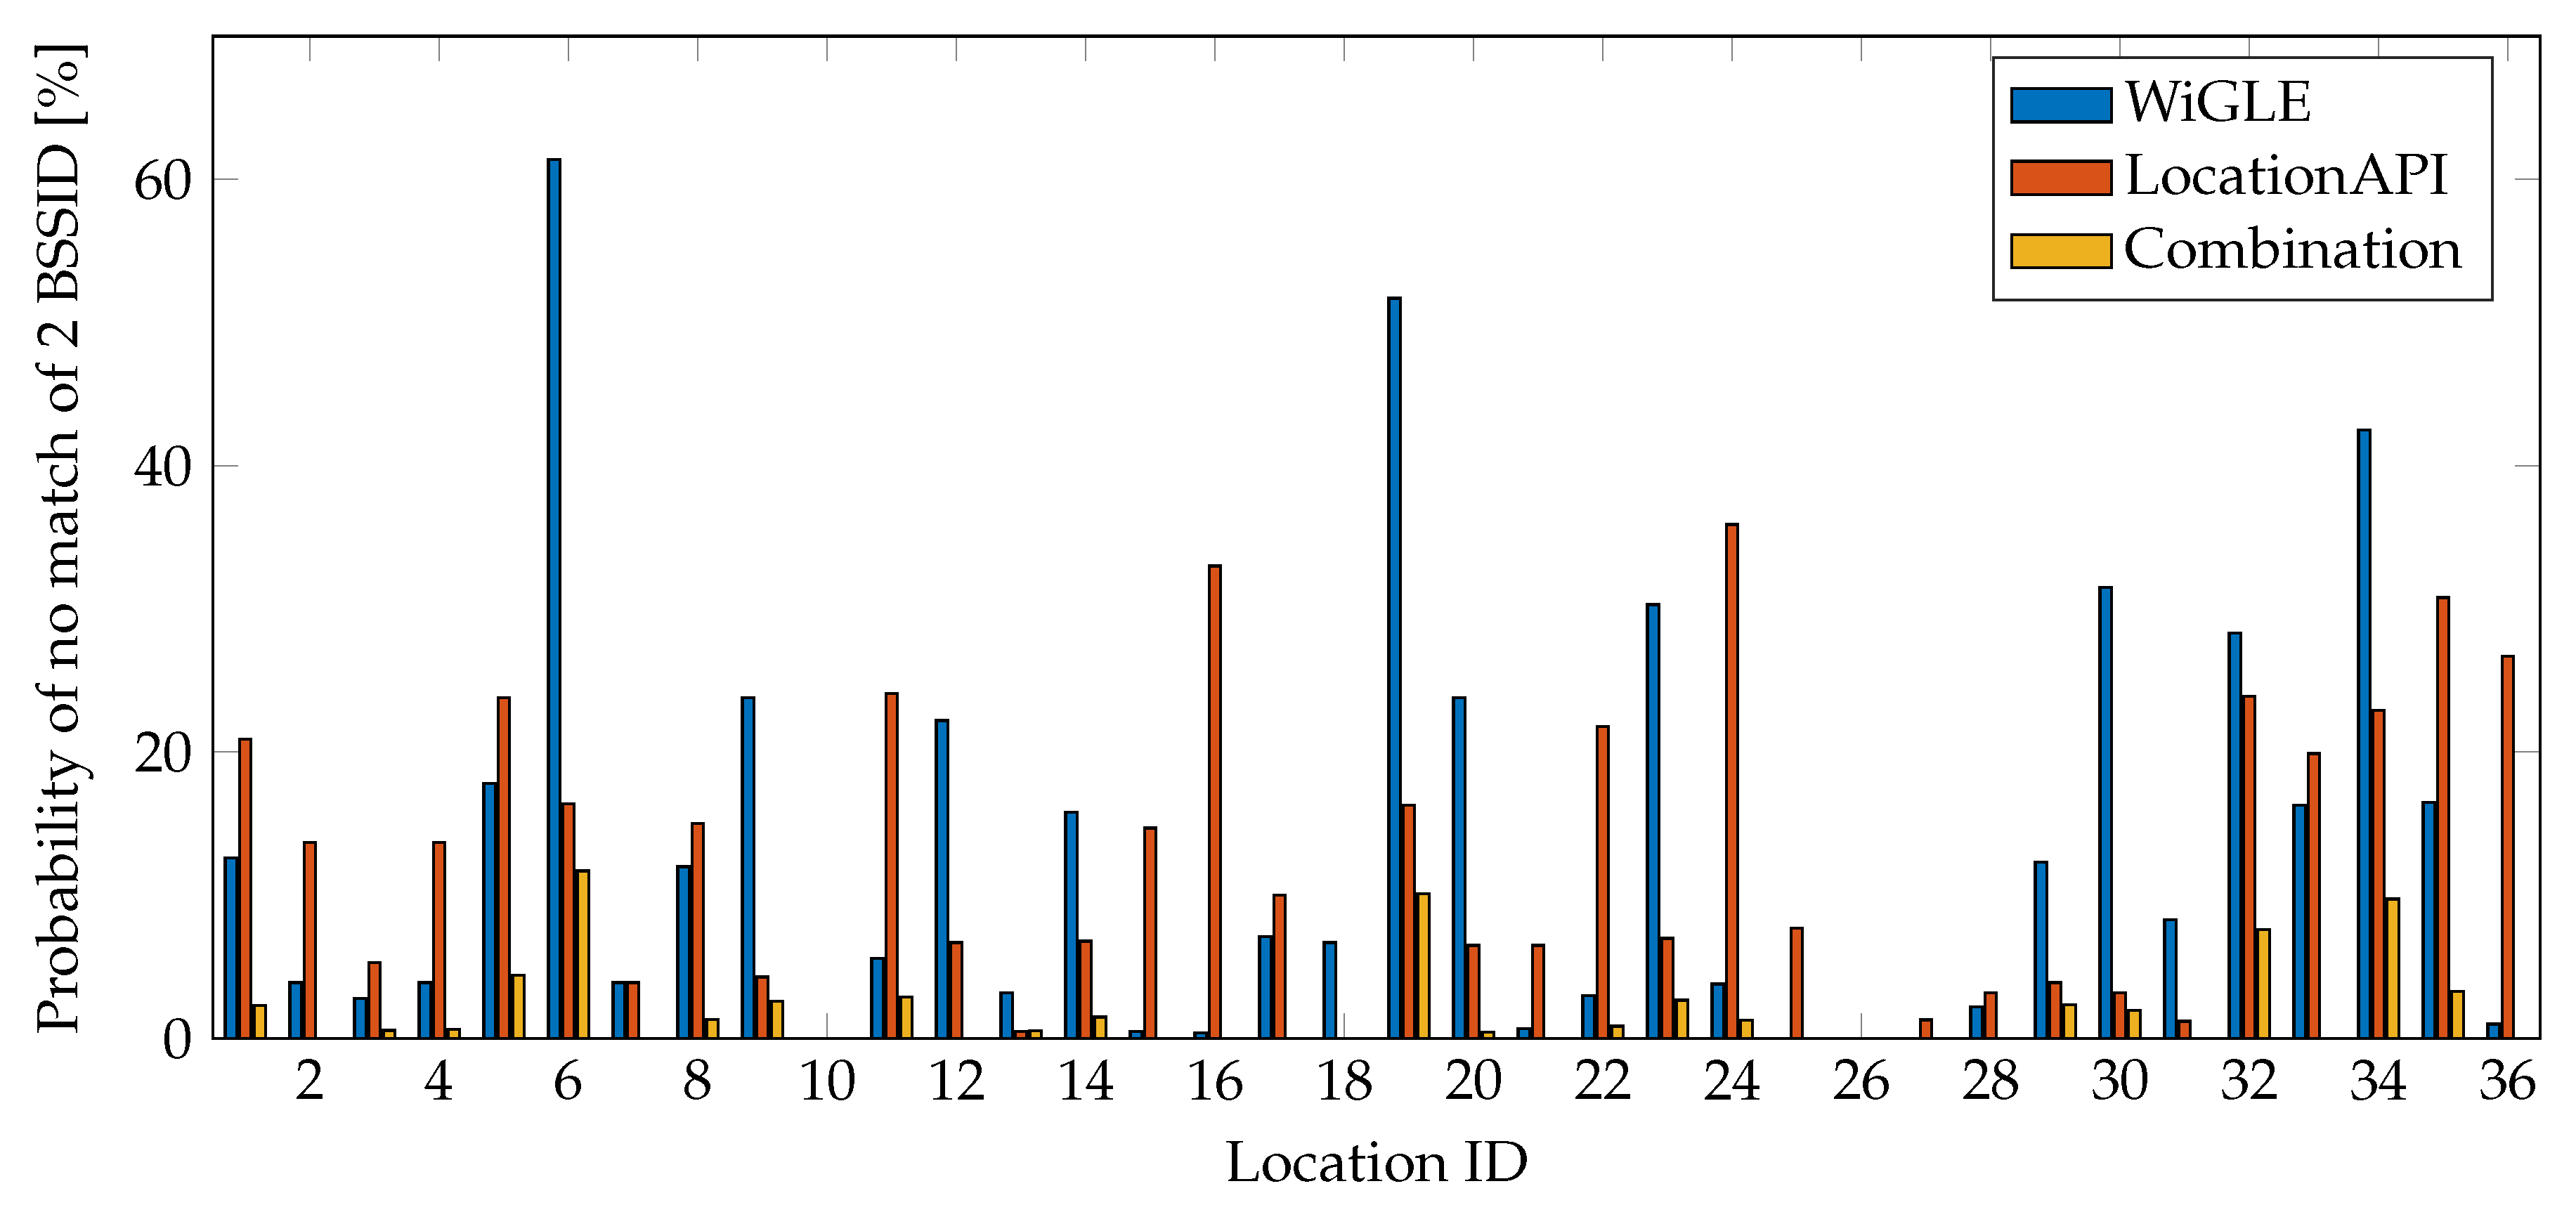
Additionally, we calculate the probability of having no match of the BSSID in the database:
where is the probability operator; W is the number of access point seen at a location; B are the BSSIDs in W that are found in the database, are the BSSIDs that are not found in the database; n is the number of BSSIDs that can be used for localization—in our case, this is maximum 2 because of the limitations of Sigfox communication; are the combinations of n BSSIDs that are not found in the database. This probability is interesting, because if no BSSIDs of the Wi-Fi access points that are seen at a location can be found in the database, the location of the device cannot be estimated.
In an attempt to improve the accuracy of the results, we develop an additional strategy: only sending the combination of BSSIDs that have the strongest signal strength. It is not possible to send the RSSI values together with the BSSIDs in one Sigfox message, but we can use it in the sending device to determine the right combination of BSSIDs. Although this strategy is likely to consume more energy from the device (to pick the right combination of BSSIDs), it may decrease the mean location errors.
Another improvement is attempted by combining the WiGLE and LocationAPI databases. The most straightforward combination is to take the average of the locations returned by each database. If a database does not return a location for one or both access points, these locations are simply disregarded in the calculation of the average. Since LocationAPI returns a single location for two BSSIDs, we account for that location twice, so that it receives an equal weight compared to the two results from the WiGLE database. In fact, we do not know if LocationAPI knows about only one of the two access points; in this case the weight of that location is erroneously doubled, which cannot be prevented.
This straightforward combination neglects the fact that the location error from the LocationAPI database is generally much better than that of the WiGLE database. Thus, another approach for combination is to choose the location provided by the LocationAPI database, unless the BSSIDs could not be found in that database; in which case the WiGLE database is consulted for a location estimate. While we will show the location error results of the first approach, this second combination approach will be analyzed further.
To summarize, we apply the following localization strategy and improvements when localizing a device with Wi-Fi access points using Sigfox as communication channel:
- Choose any combination of two BSSIDs for localization;
- Choose the two BSSIDs with the highest RSSI for localization;
- Combine the two databases through averaging; and
- Combine the two databases by preferring the LocationAPI database, using WiGLE only when the BSSIDs cannot be found in LocationAPI.
A single Sigfox message allows an update period of ten minutes. Using two messages would increase the period to twenty minutes, which is why we keep the focus on a single message of 12 B. Localization with this constraint has not been researched before.
2.2. Wi-Fi Databases
There is a variety of fingerprinting databases to work with. Some companies send their so called wardrivers all over the world to gather information about Wi-Fi access points. However, there is a trend to create more crowd-sourced databases [20]. People can create a free account and upload data of the access points in their neighborhood. The most popular and largest databases are summarized in Table 1.
Databases with information about Wi-Fi access points are growing at a significant rate. This can be stated by observing that, for example, the Navizon database is growing at a rate of 500,000 data points every day [27]. It is interesting to note that this database also keeps track of the amount of cell phone towers. One of the many reasons of this significant rate is the Internet of Things (IoT) and the world of ubiquitous computing we are living in today. Navizon even pays people [28] to contribute to the database. The one million registered users can just download the app, drive around in their car and earn a pay-out of $15 for every 10,000 access points.
One database used for this research is called WiGLE [26]. WiGLE is short for Wireless Geographic Logging Engine. The website is an open source platform; everyone can view registered BSSIDs around the world on a map. If a free account is created, requests can be made and data can be uploaded to the database. At this moment, WiGLE wardrivers have discovered over 4.5 billion Wi-Fi access points around the world. This database is chosen because it is easy to work with and has a decent amount of access points.
Another database used for this research is LocationAPI [23]. LocationAPI is a website hosted by UnwiredLabs (Hyderabad, India), an Indian corporation focusing on positioning systems. At this moment, LocationAPI wardrivers have discovered over 1.5 billion Wi-Fi access points worldwide. Its database contains a large number of wireless access points in Belgium.
To obtain an objective look at the error or accuracy of Wi-Fi localization through a Sigfox network, the characteristics of both databases are compared. WiGLE has a larger worldwide database. This does not mean that the WiGLE results are more accurate, because there are more access points discovered in the USA than in Belgium. WiGLE claims wardrivers have discovered 1.7 million WAPs in Belgium. On the other hand, while LocationAPI contains a smaller amount of access points, this database includes 11 million WAPs in Belgium.
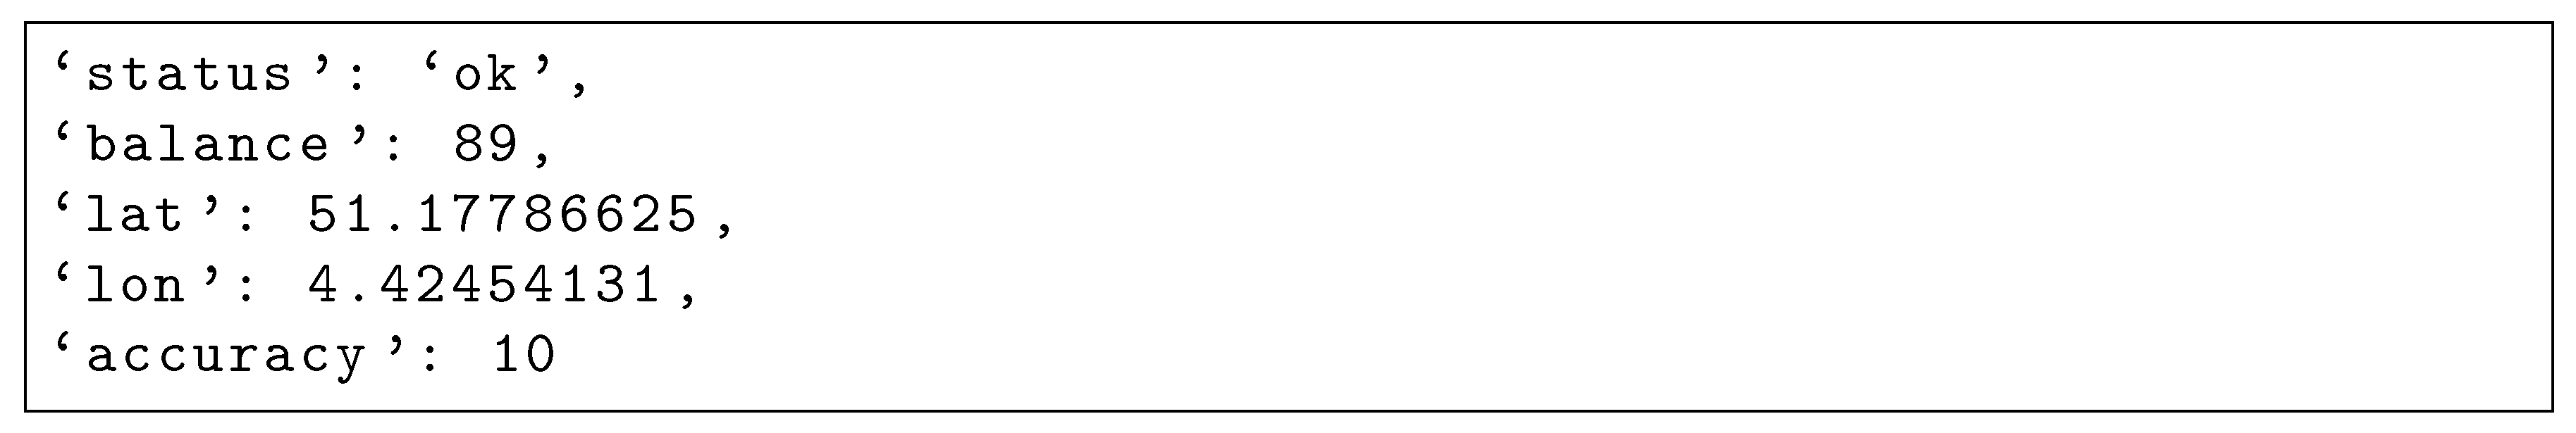
A request to the WiGLE database results in a string with a lot of information. It returns the latitude and longitude, but also data like security details and uptime indicators, see Figure 1. LocationAPI returns less information, but it is important to note that the data it does return is more useful: each result includes the mean coordinate of multiple BSSIDs, plus the estimated accuracy in meters. A nice extra feature is the ‘balance’ parameter. This informs us on how many successful requests we have left, see Figure 2. However, it is not possible to request the location of a Wi-Fi access point in LocationAPI.
The documentation of both services helps to get started with making requests. However, the documentation of WiGLE is harder to find and understand, since it is still under development. The LocationAPI documentation is very easy to find, easier to read and it contains examples. Table 2 presents a summary of all the properties and characteristics of the two databases.
2.3. Measurement Locations
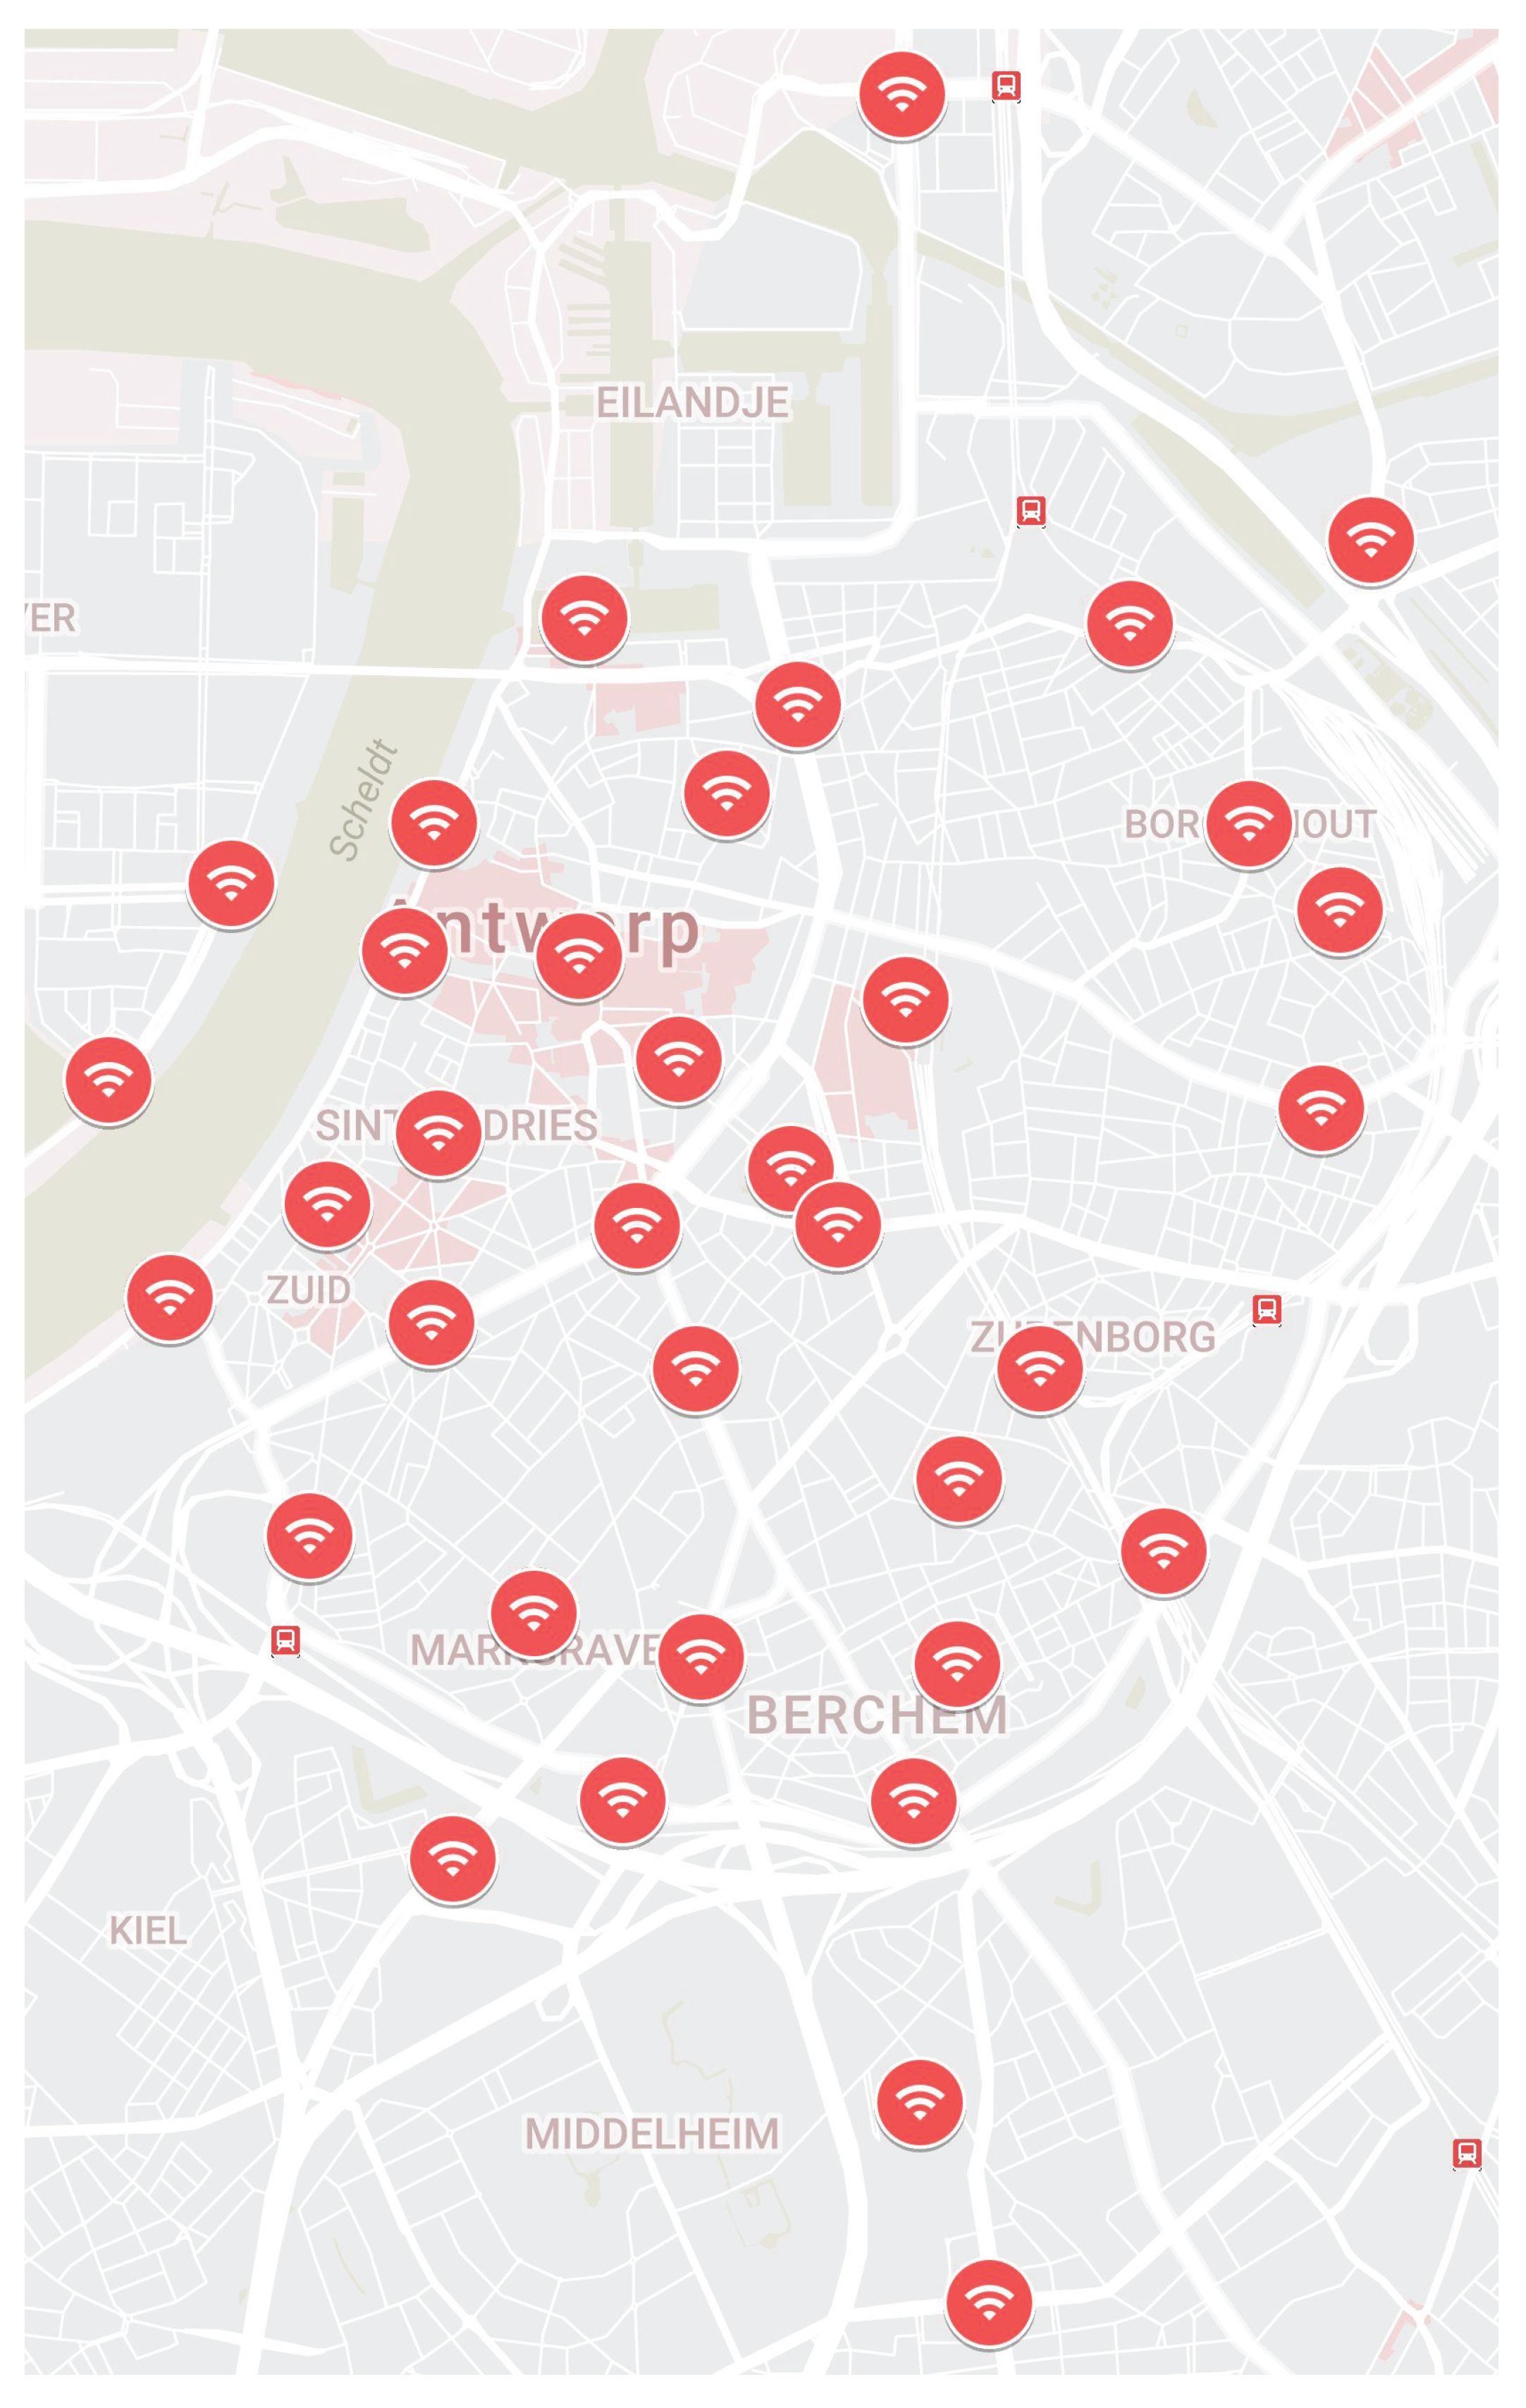
Measurements are executed at 36 different locations in and around Antwerp. The locations are chosen so that there is a variety of more and less densely populated areas. At every location, a script is run to save all BSSIDs and RSSI values of the access points in the vicinity, together with the exact coordinate of the measurement location. Figure 3 shows a map of the different measurement locations.
3. Results
This section summarizes the location estimate results by database. First the WiGLE database, then the LocationAPI database, and finally the combination of both databases. For each database, we discuss the overall location error, the probability of finding the BSSIDs, and the location error when transmitting only the two BSSIDs with the highest received signal strength.
3.1. WiGLE Results
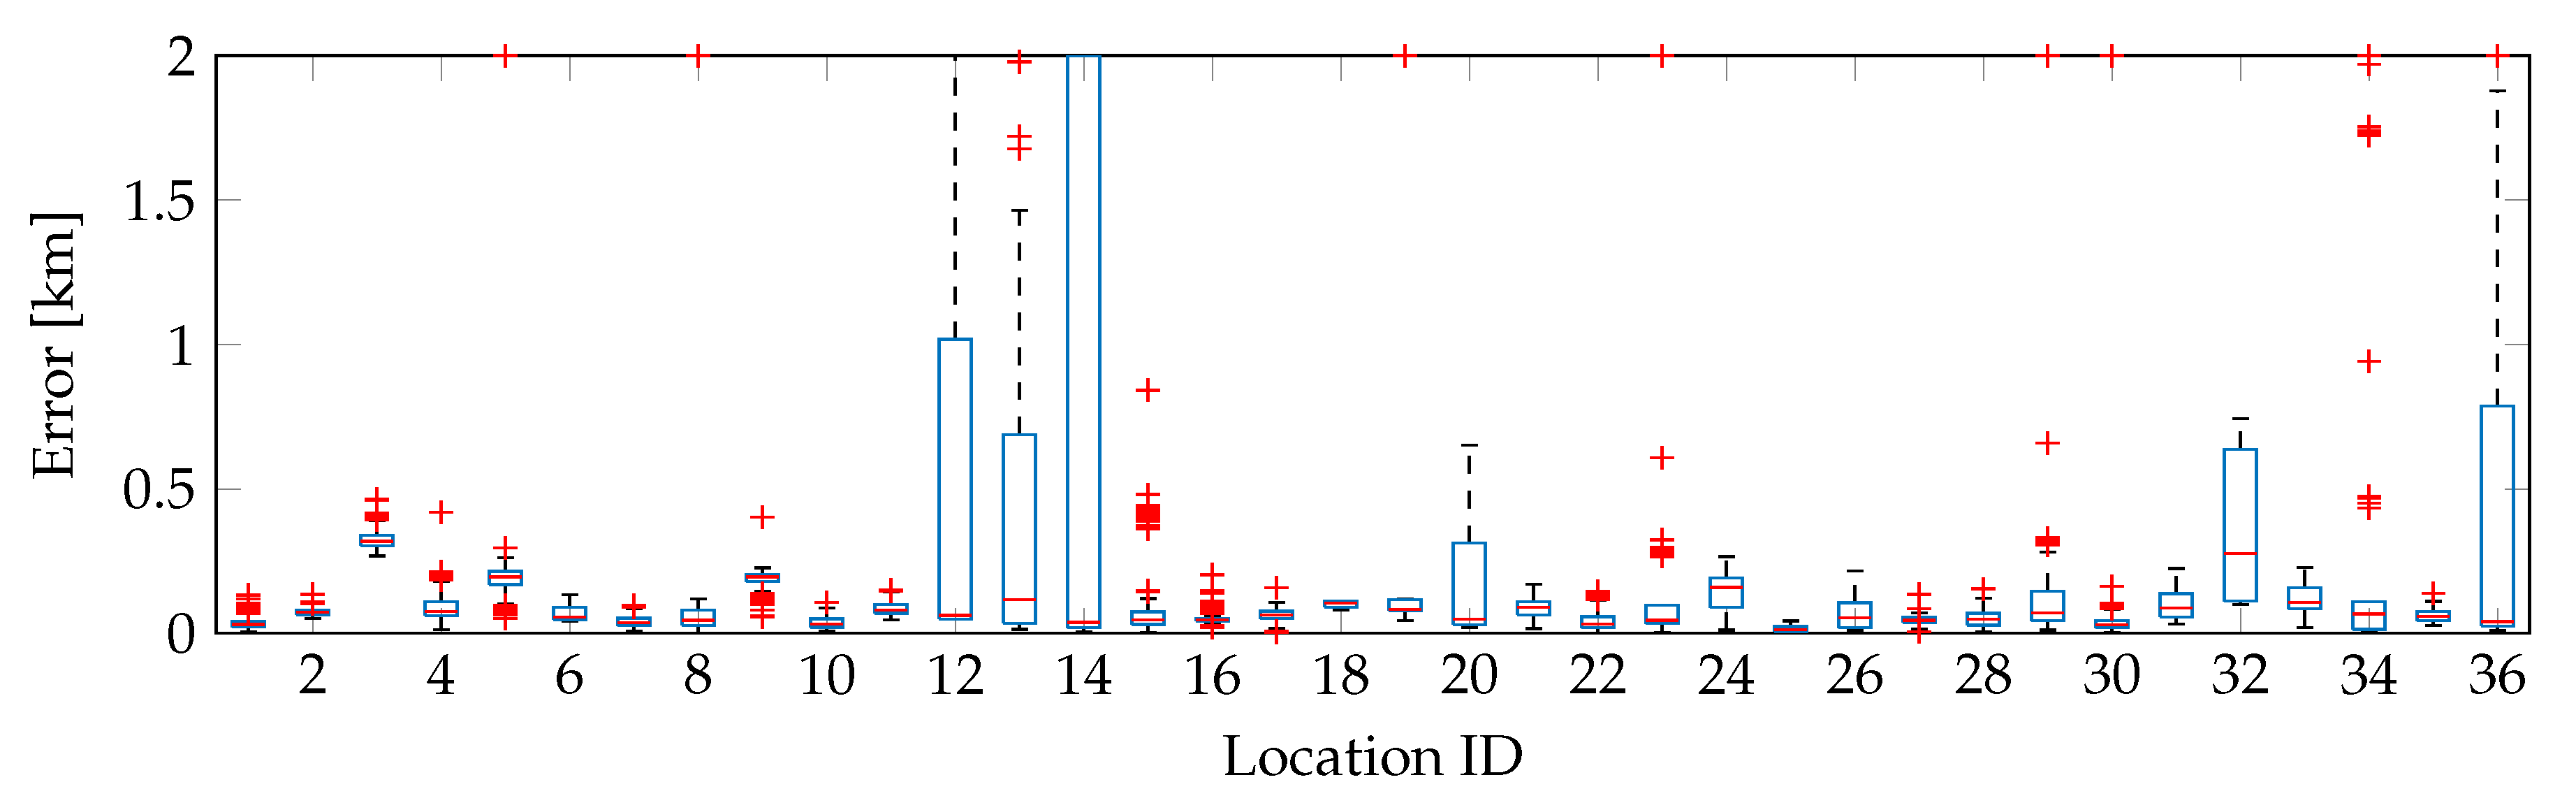
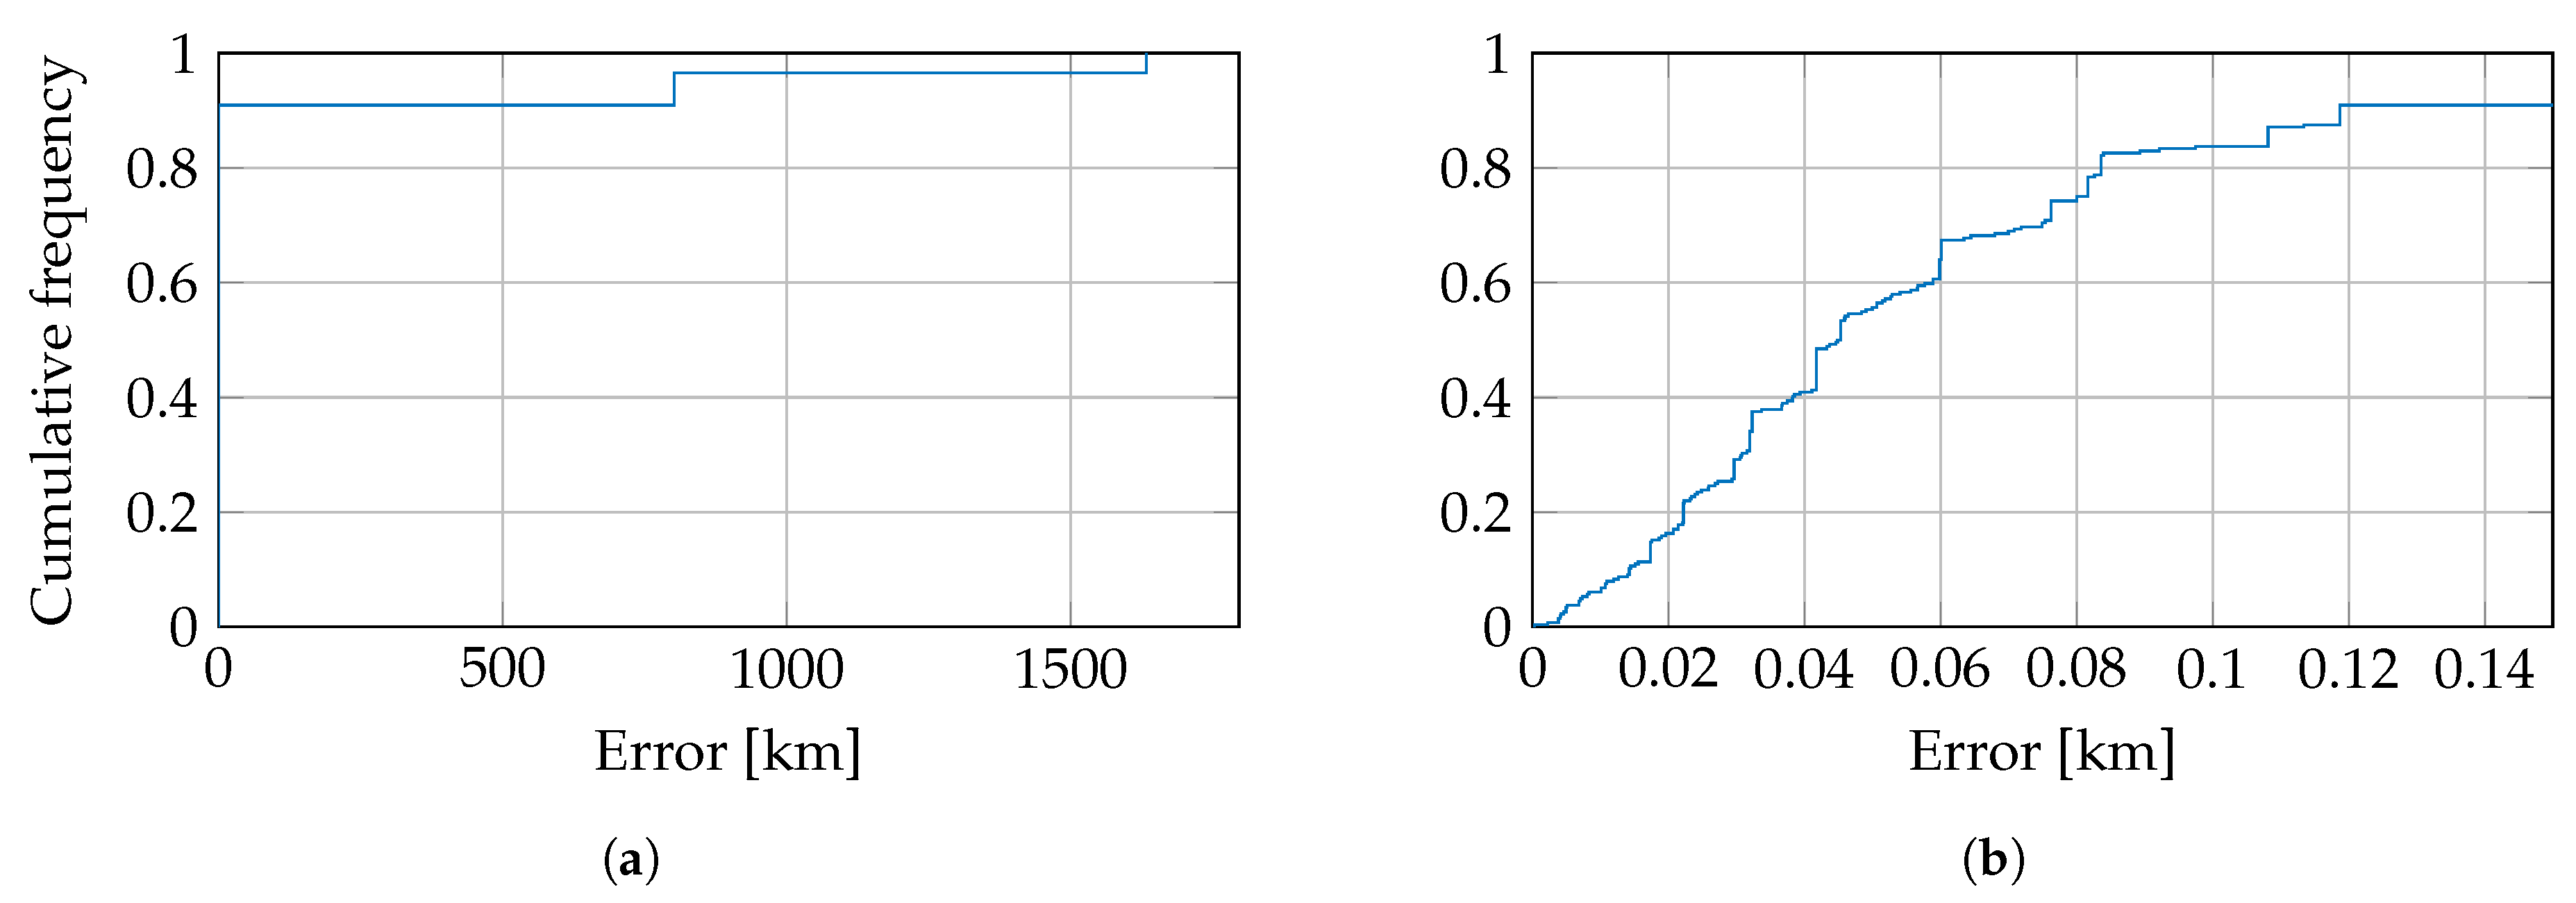
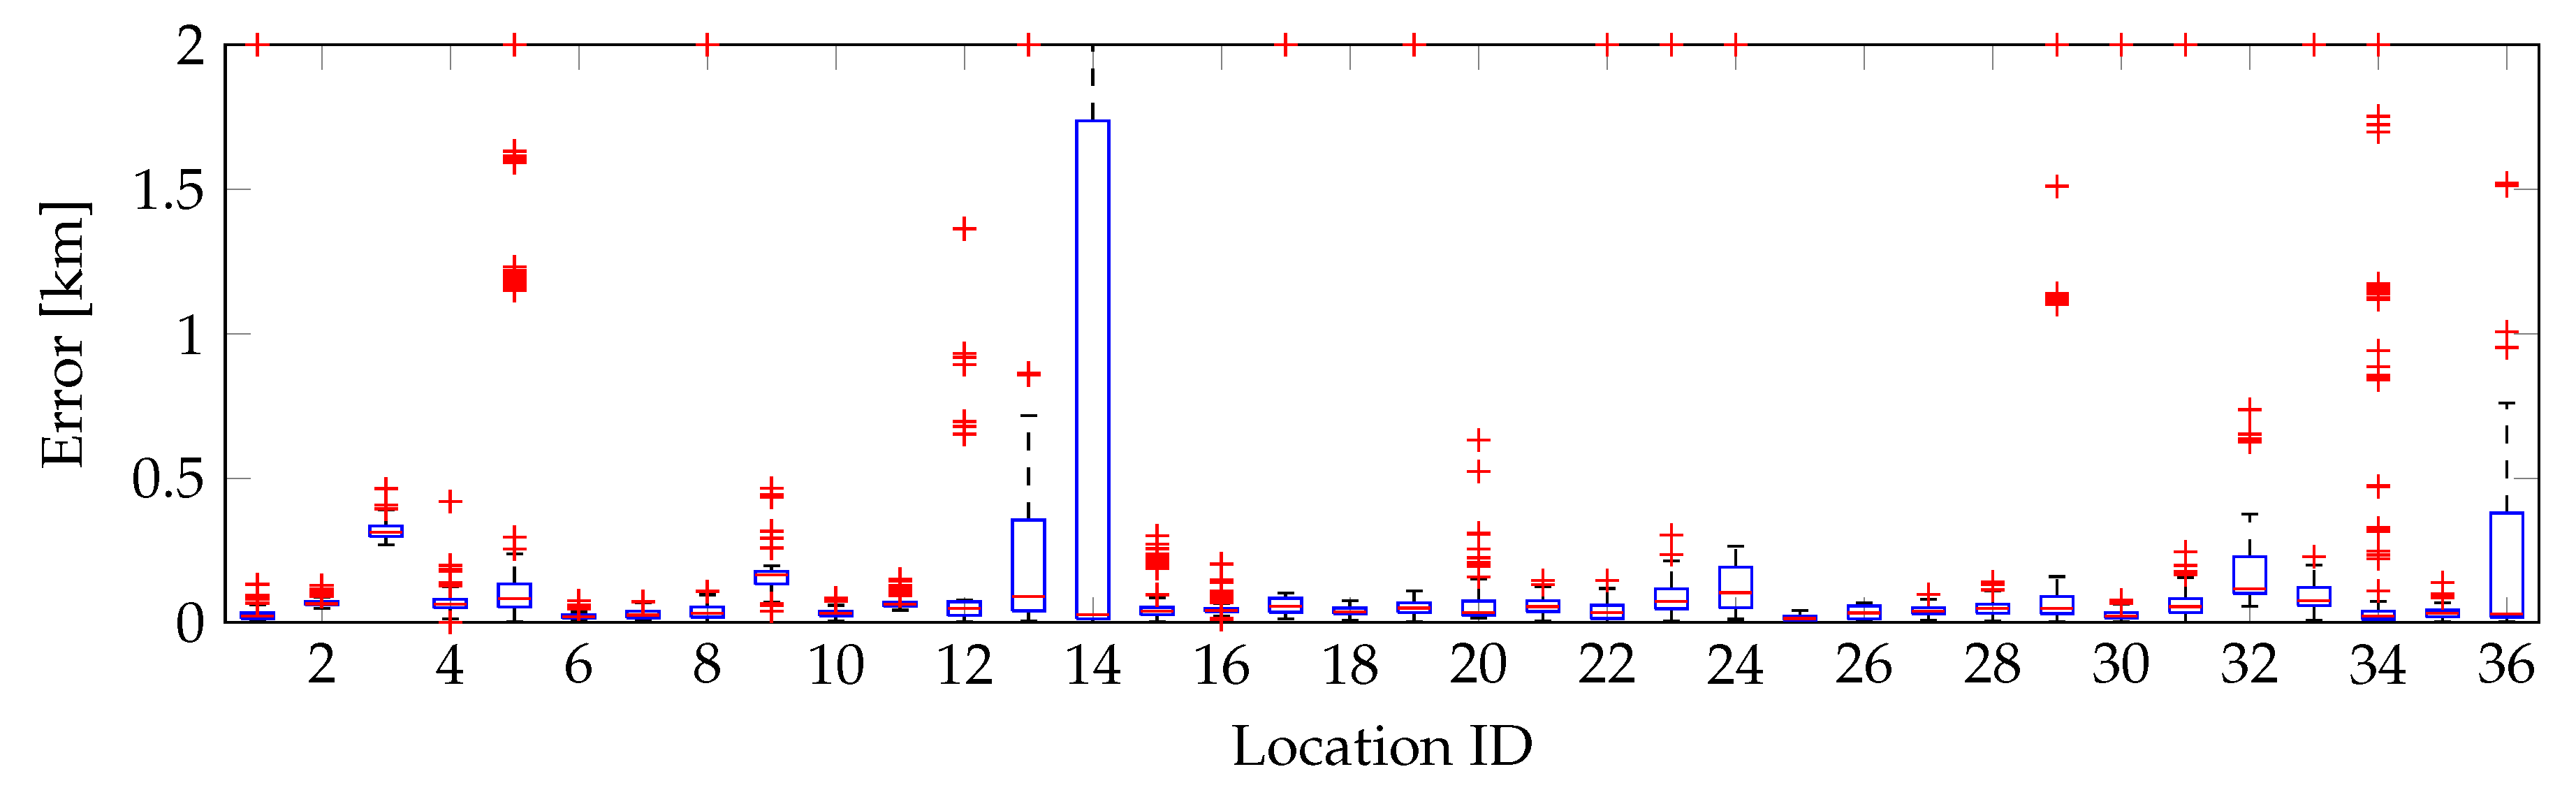
The location estimates when localizing using the WiGLE database are prone to large errors, see Figure 4. The overall mean location error is 6.24 , while the overall median location error is 77 . The 75th percentile location error is larger than 1 only at locations 12 and 14; at location 14, it is 5.12 . Ten locations have an error greater than 2 , which are clipped in Figure 4. One of those is location 8. The mean location error is 101 and the median location error is 45 . To represent the measurement, a cumulative distribution of the errors at this location is shown in Figure 5. There are some combinations of BSSIDs with a significant location error: 802 and 1633 . However, more than 90% of the BSSID combinations have an error smaller than 119 , see Figure 5b.
The average probability of finding the BSSIDs in the WiGLE database of a single WAP at one of the 36 locations is 32.6%. This is calculated using Equation (1) with .
The average probability of finding neither of two BSSIDs in the WiGLE database is 13.2%, which is calculated with or:
A graph of the probability of finding neither BSSIDs in the WiGLE database is shown in Figure 6.
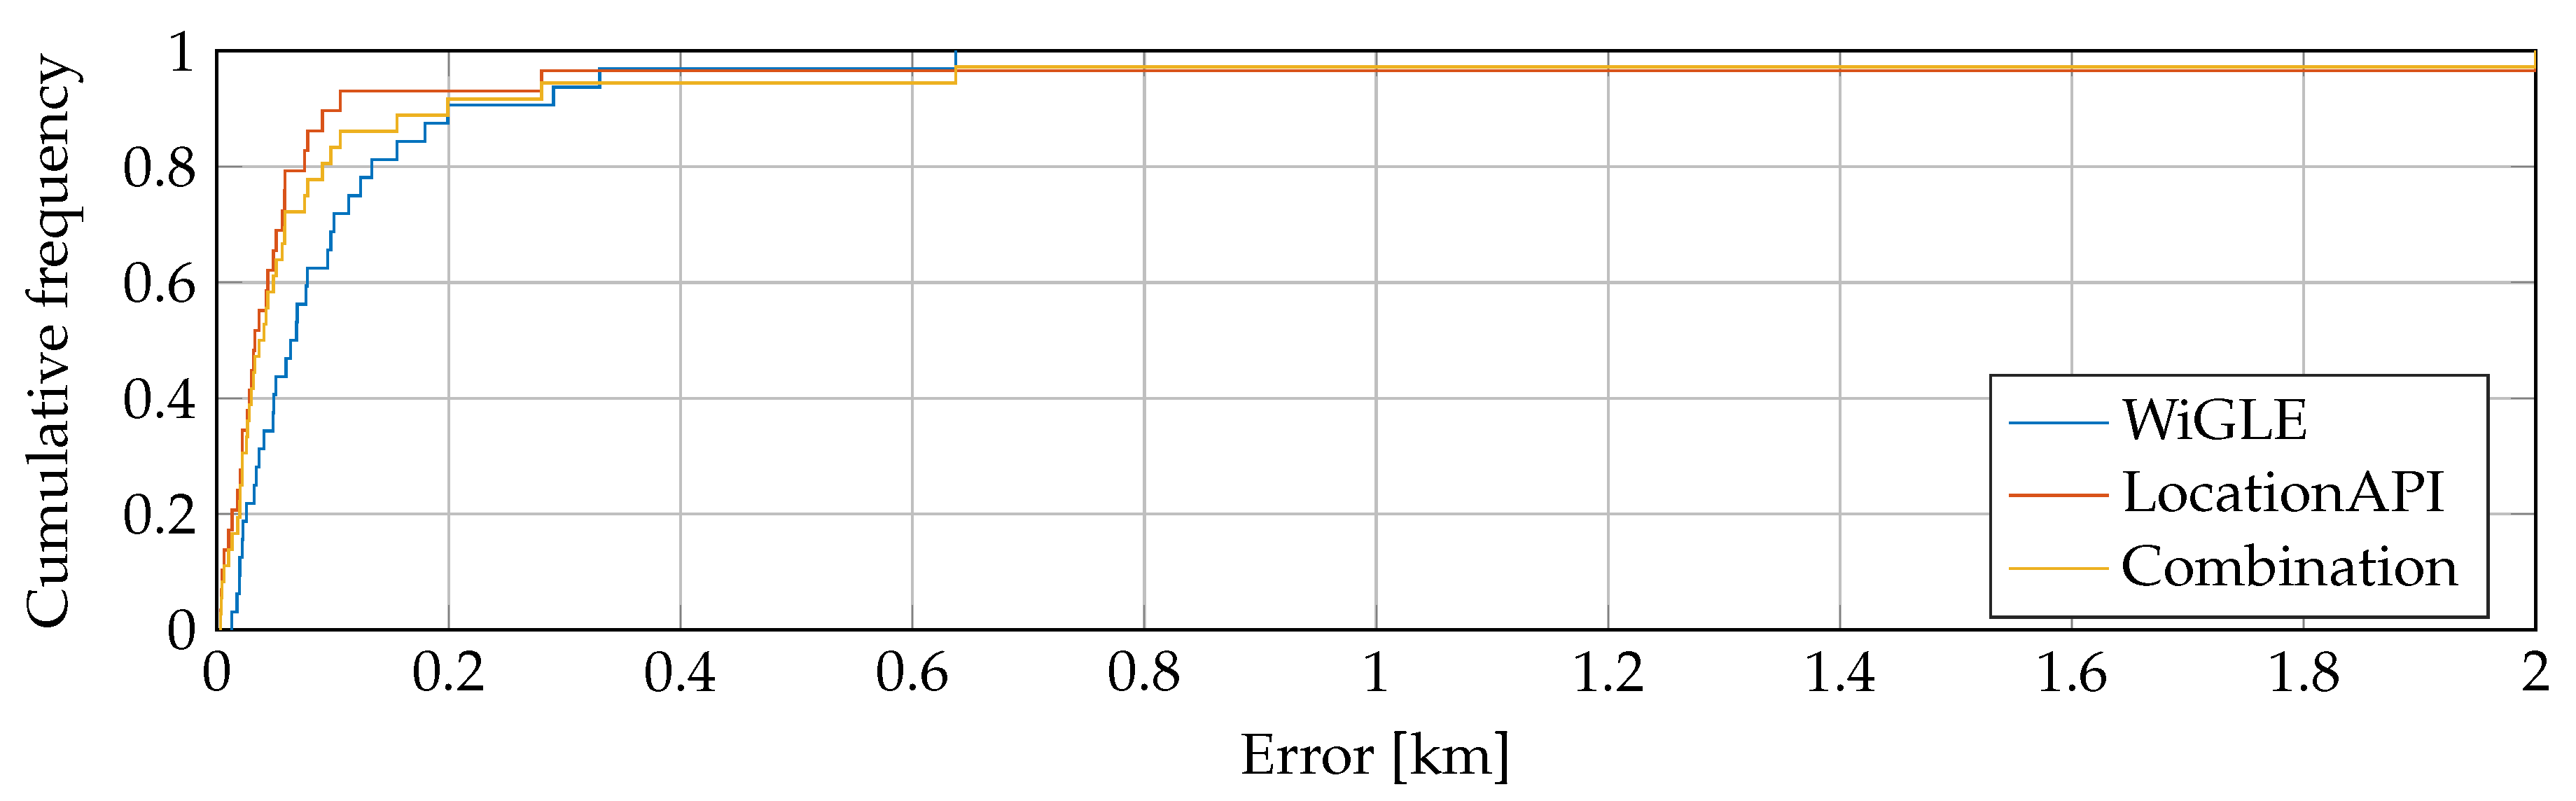
When sending the combination of BSSIDs with the highest RSSI values to the WiGLE database, the mean error of all measurement locations decreases from 6.24 to only 103 . The median error decreases from 77 to 66 . The probability that neither of those BSSIDs could be found, however, is 11.1%; no location can be estimated at those locations. Figure 7 shows the distribution of the error.
3.2. LocationAPI Results
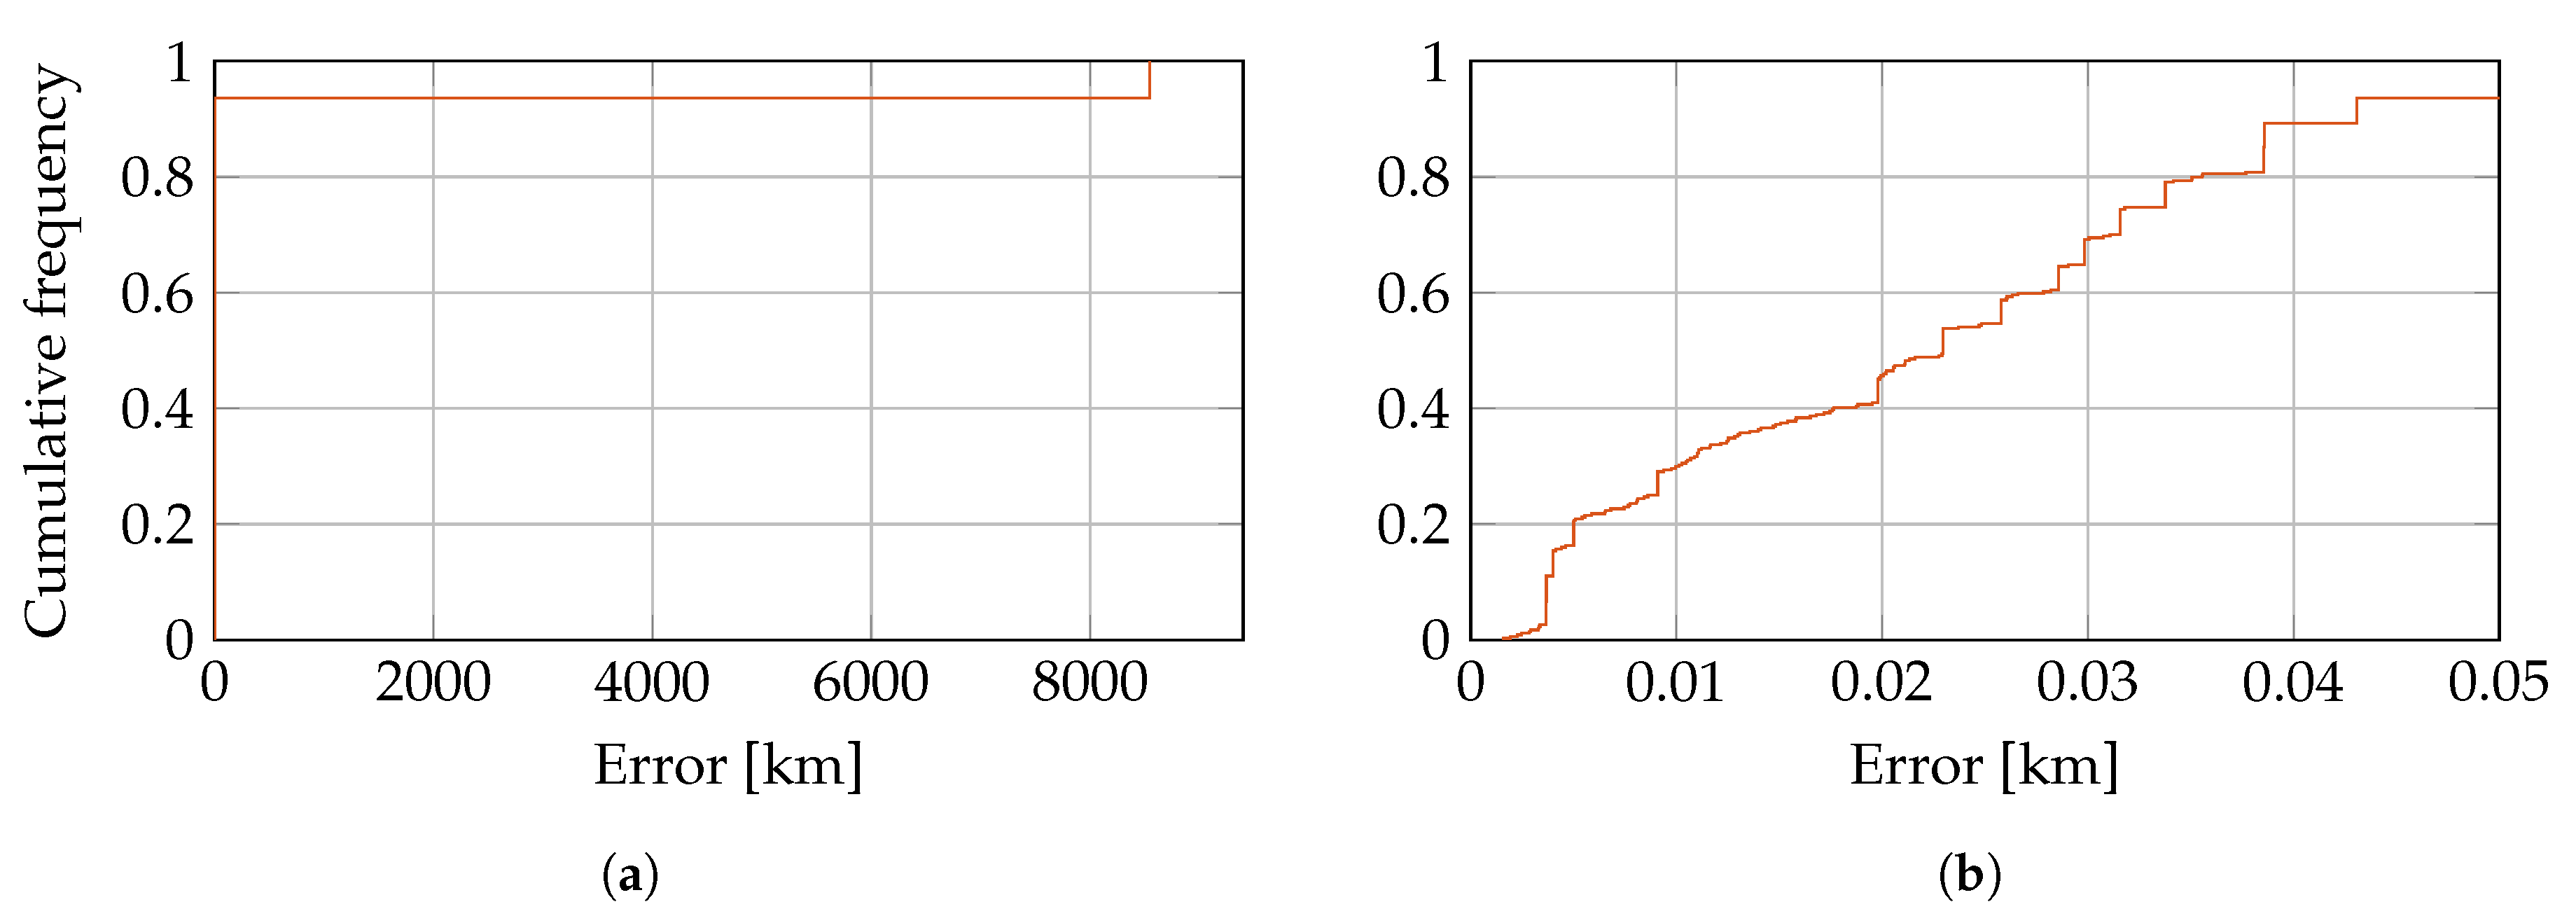
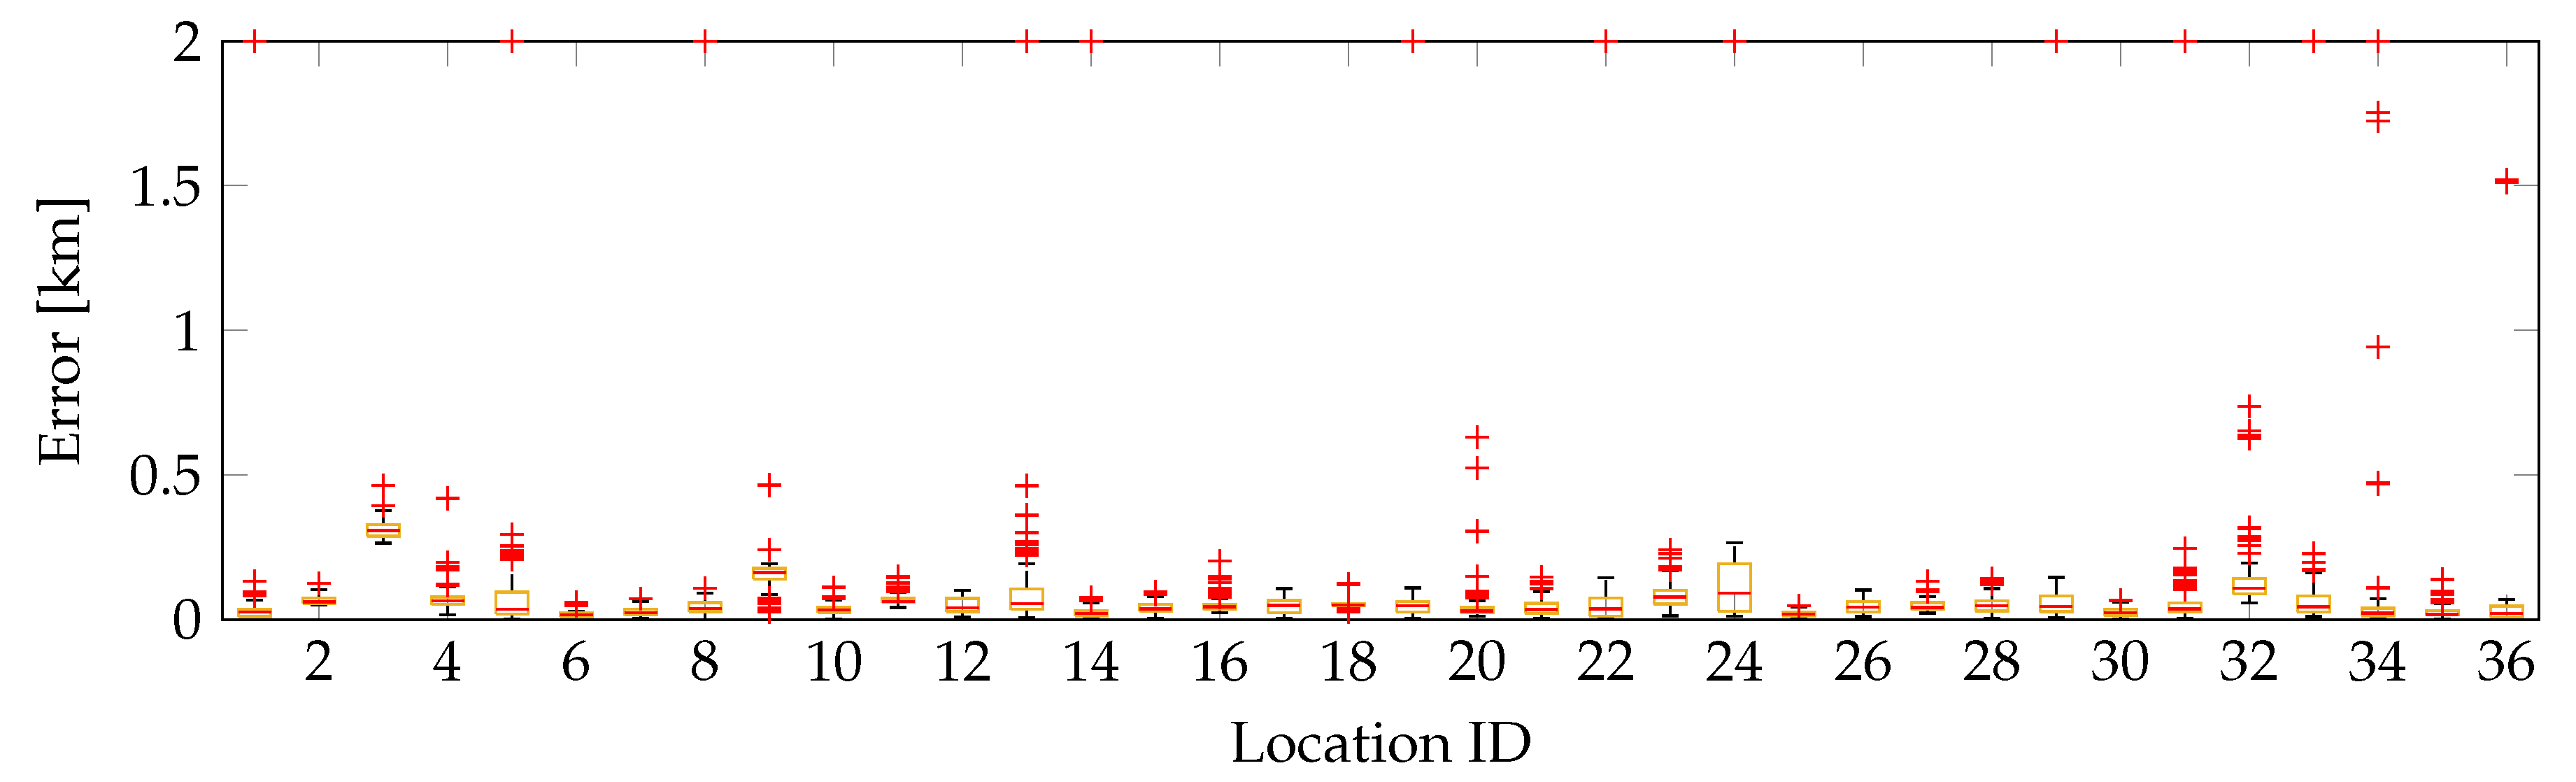
The location estimates when localizing using the LocationAPI database are much less prone to large errors than with the WiGLE database, see Figure 8. The overall mean location error is 21.06 , while the overall median location error is 37 . The 75th percentile location error is never larger than 0.5 . Seven locations have an error greater than 2 , which is clipped in Figure 8. One of those is location 1. The mean location error is 546 and the median location error is 23 . The cumulative distribution of the errors at this location is shown in Figure 9. There is one combination of BSSIDs with a significant location error: 8543 . However, more than 93.6% of the BSSID combinations have an error smaller than 43 , see Figure 9b.
The average probability of finding neither BSSIDs in the LocationAPI database of a combination of WAPs seen at one of the 36 location is 12.5%. This is calculated as in Equation (2). Since it is not possible to request a single BSSID to the LocationAPI database, the chance of match of a single BSSID cannot be calculated. A graph of the probability of finding neither BSSIDs in the LocationAPI database is shown in Figure 6.
When only sending the combination of BSSIDs with the highest RSSI values to the LocationAPI database, the mean error of all measurement locations decreases from 16 to only 114 . The median error decreases slightly, from 37 to 33 . The probability that neither of those BSSIDs can be found, however, is again 19.4%; no location can be estimated at those locations. Figure 7 shows the distribution of the error.
3.3. Combination of WiGLE and LocationAPI
A straightforward solution to improve the results is to combine the WiGLE and LocationAPI databases. As a first approach, we propose to combine the location estimates from both database by taking their average; this result can be seen in Figure 10. The overall mean location error is 31.79 , while the overall median location error is 53 . The 75th percentile location error is only once larger than 1 . Fifteen locations have an error greater than 2 , which is clipped in Figure 10.
The location error overview of the second approach, which favors the LocationAPI database since it generally has a lower location error, is shown in Figure 11. The overall mean location error is 24.17 , while the overall median location error is 40 . The 75th percentile location error is never larger than 0.5 . Twelve locations have an error greater than 2 , which is clipped in Figure 11.
The average probability of finding neither BSSIDs in the LocationAPI database, nor in the WiGLE database, of a combination of WAP seen at one of the 36 locations is 1.9%. This is calculated as in Equation (2). A graph of the probability of finding neither BSSIDs in the combination of databases is shown in Figure 6.
When only sending the combination of BSSIDs with the highest RSSI values to the combination of databases, the mean error of all measurement locations decreases from 24.17 to only 125 . The median error decreases slightly from 40 to 39 . Using this method, a location could be estimated at all 36 test locations. Figure 7 shows the distribution of the error.
4. Discussion
The WiGLE and LocationAPI Wi-Fi fingerprint databases both contain a lot of entries, worldwide as well as in Belgium. However, the results of the databases differ from each other at some locations.
4.1. Comparison of Databases
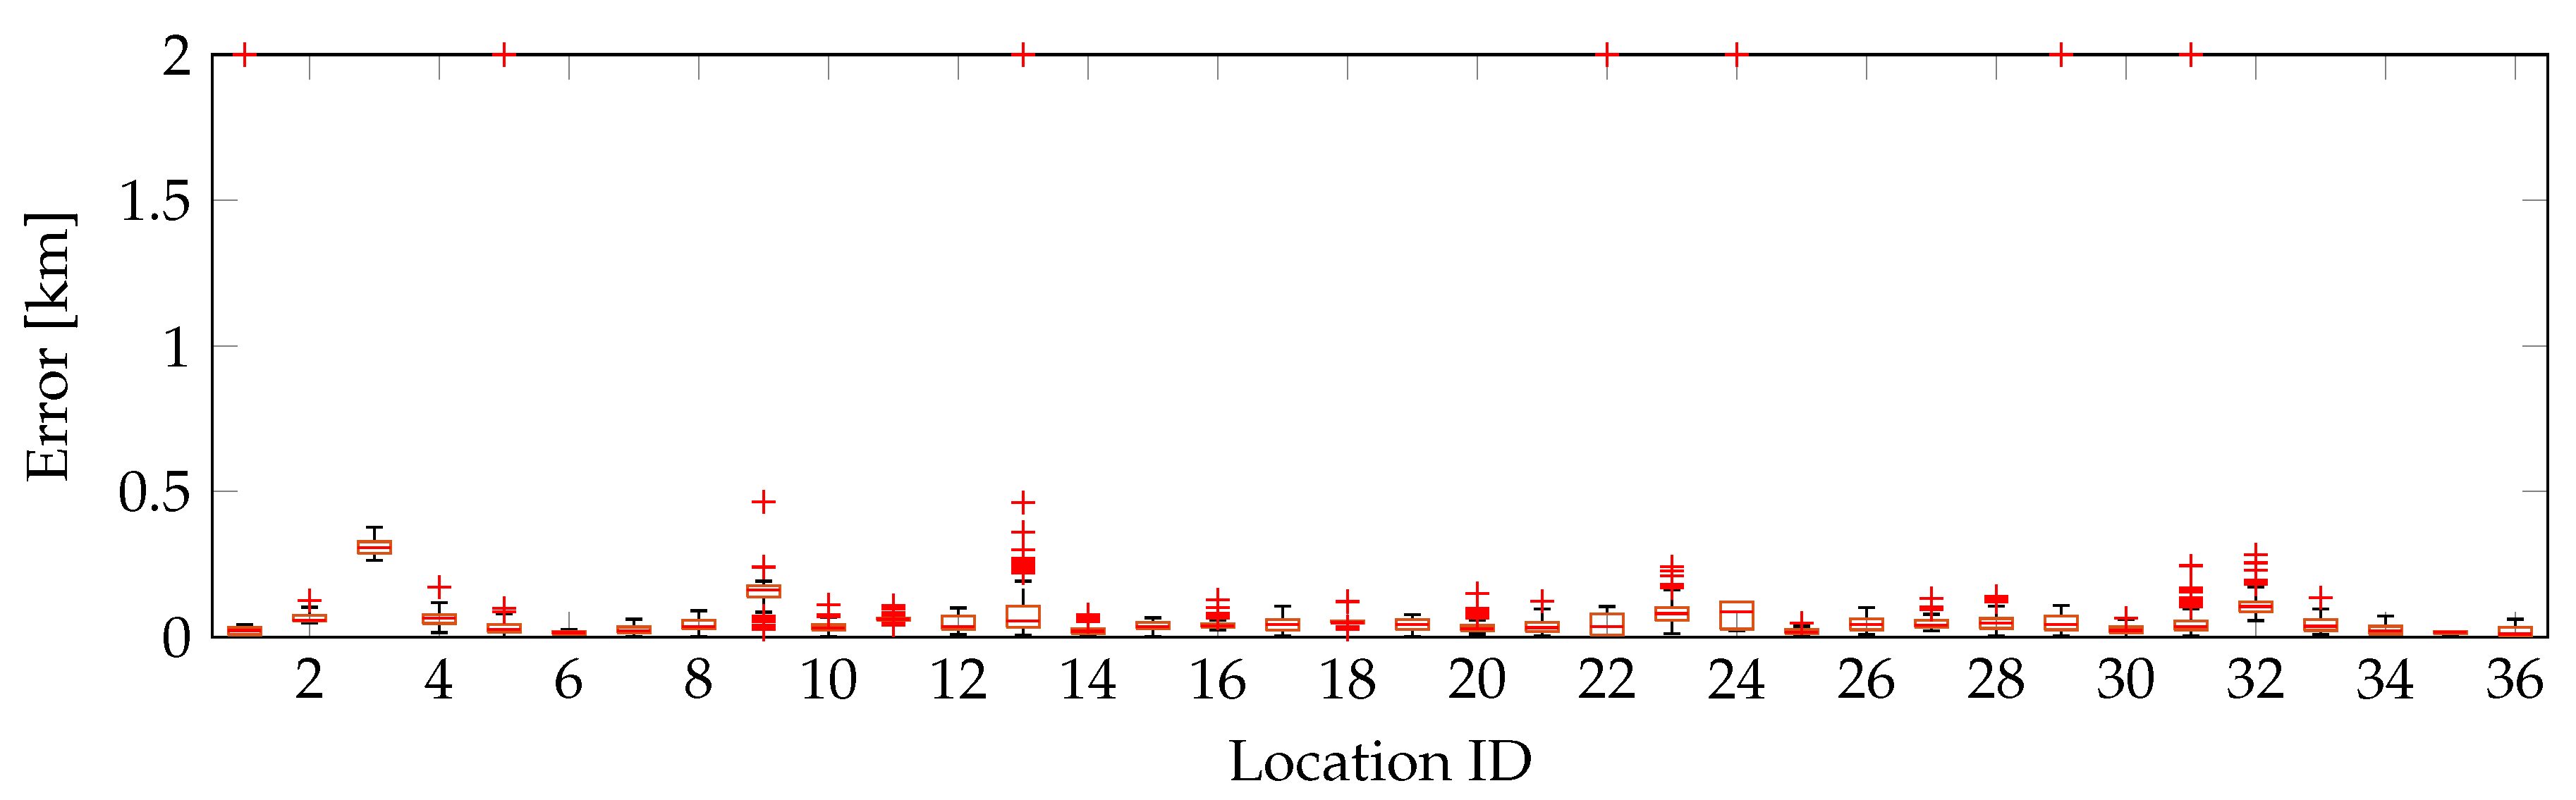
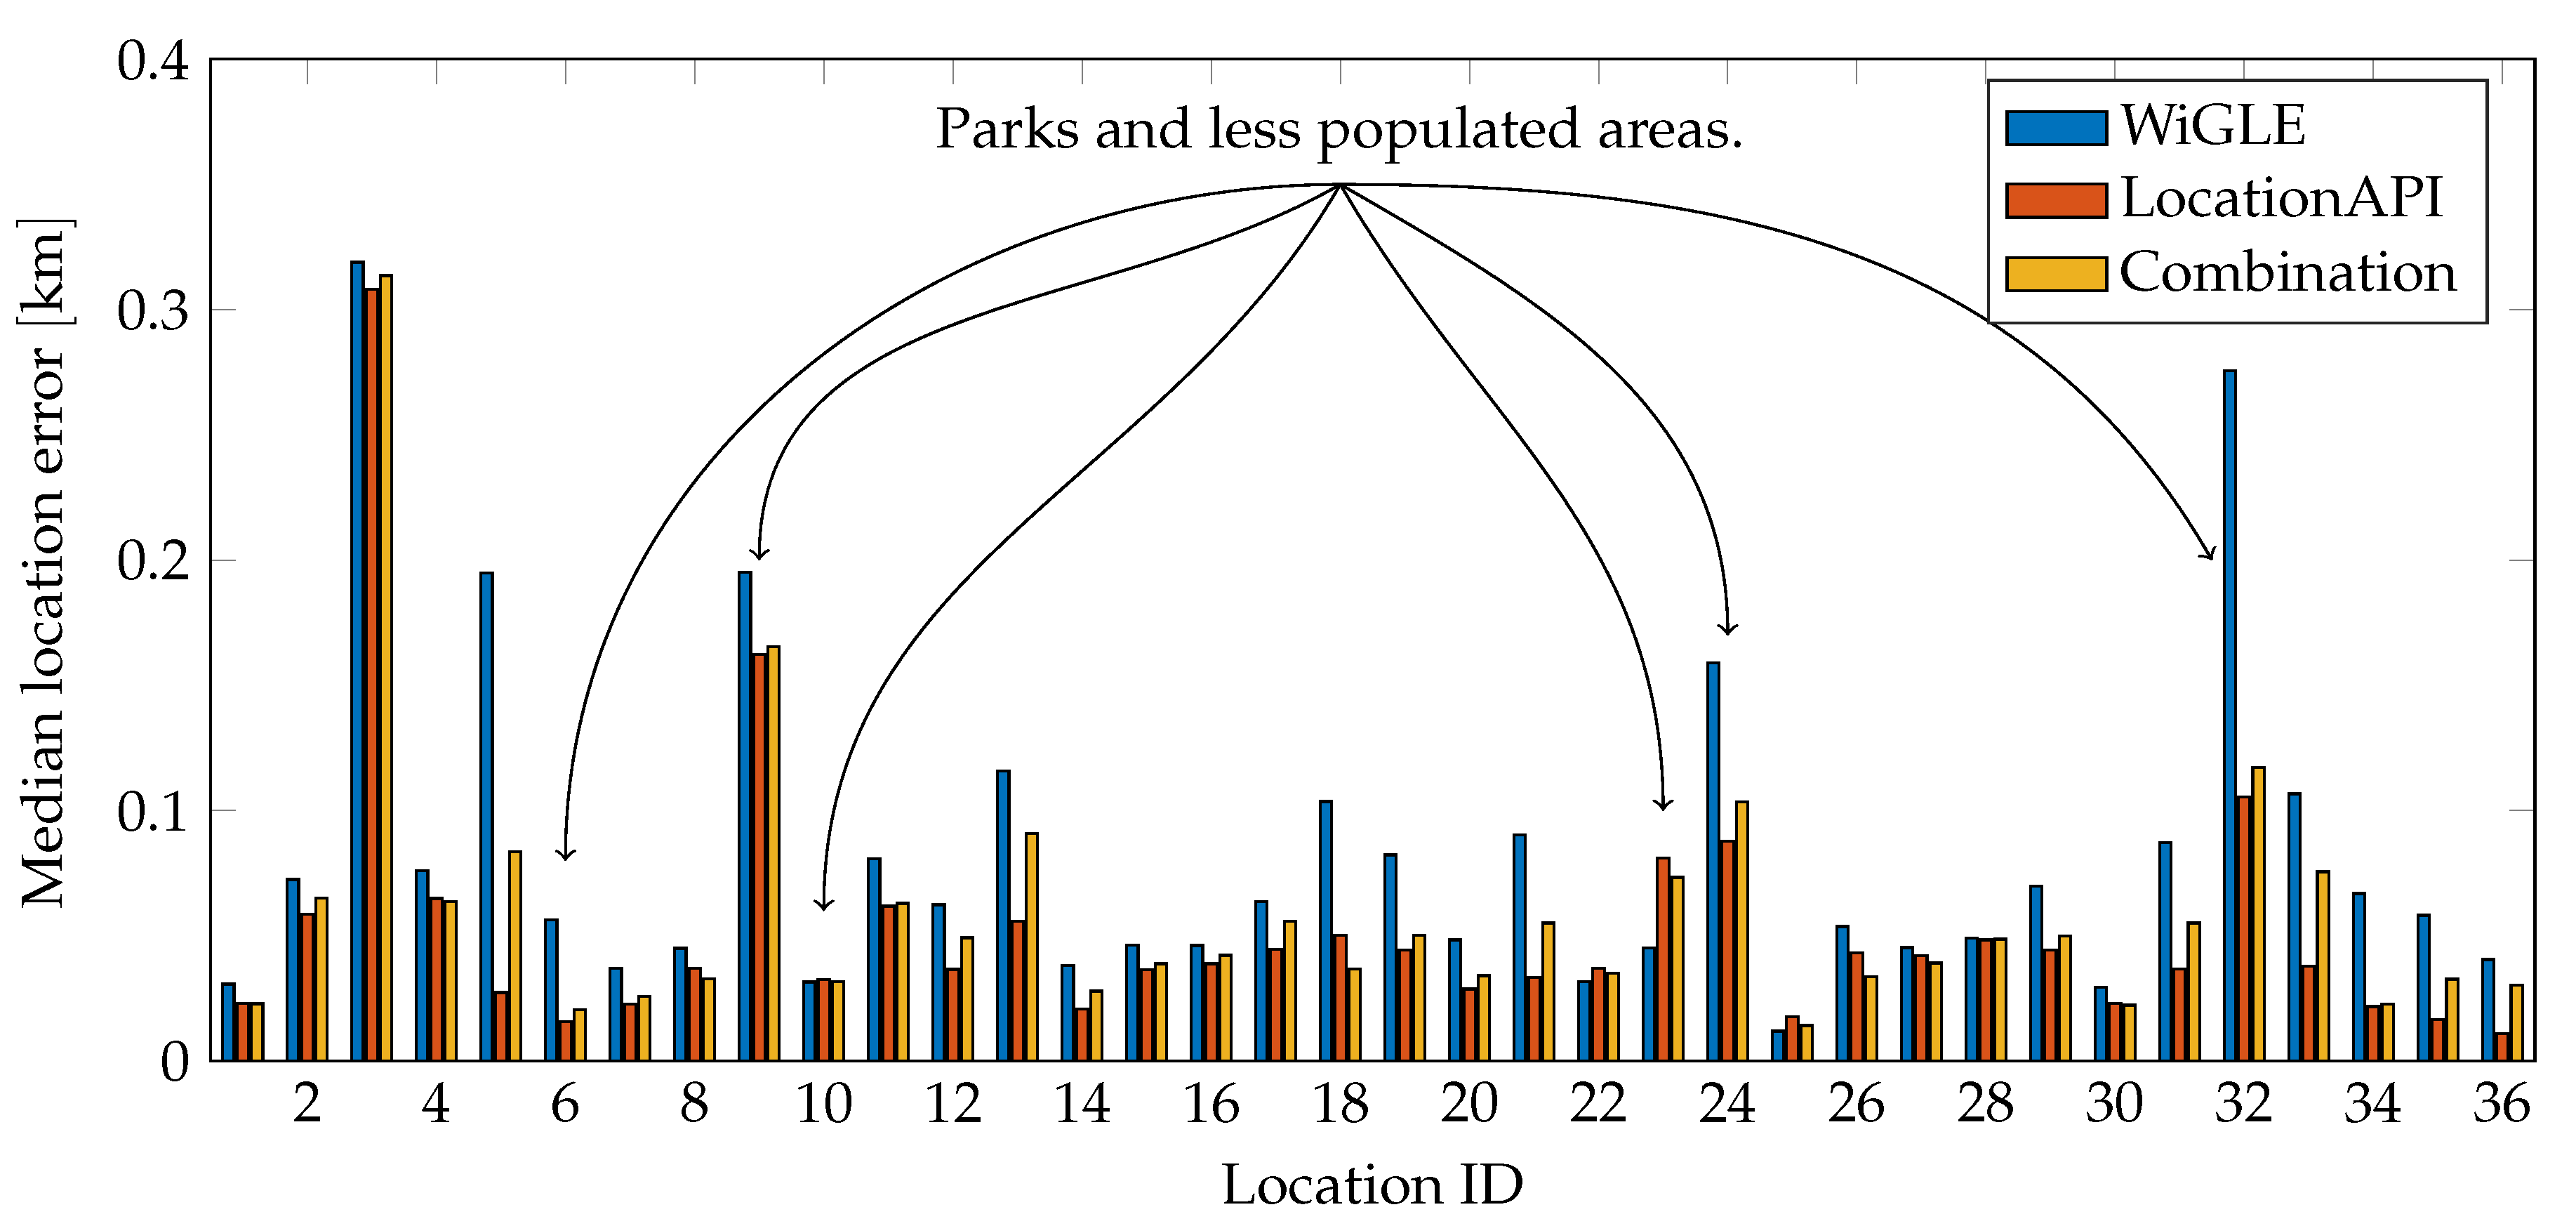
When considering the median errors, the LocationAPI results are usually better than the ones of WiGLE. At only four of the 36 measurement locations, the requests to WiGLE yield a smaller median location error, see Figure 12. The mean distance errors are in the range of 15 to 546 . This variety of mean errors is, as mentioned in the results, due to outliers in the location estimates.
The probability that a BSSID combination is sent that contains two BSSIDs that result in no match is for both databases around 13%. However, there are large differences in this probability at specific locations, see Figure 6. This is how the combination of the two databases reduces the probability to 1.9%.
4.2. Reasons for Flaws in the Results
When looking at the size of the location errors, we observe that a large error often occurs because a single BSSID leads to a wrong latitude and longitude pair. This causes a large error in every combination which contains that BSSID. When not considering that single ‘failed BSSID’, the errors will remain quite small and the distance error would decrease. Therefore, we always calculate the median location error, which is more resistant to such outliers.
There will definitely be a fault during the transformation of some BSSIDs to coordinates. Therefore, when localizing a device using Wi-Fi and the WiGLE or LocationAPI database, one should keep in mind that there could be a ‘corrupt’ BSSID in the databases. When requesting a BSSID, the servers might respond with a wrong coordinate of the wireless access point. The distance between the GPS coordinate and the mean coordinate can vary from a few meters to over several thousands of kilometers. Of course, this influenced the mean error of every measurement where such a flaw occurred.
For example, at location 1, when using the LocationAPI database, the errors of on ore more BSSIDs show a large deviation. Only 5% of all combinations result in an error that is equal to 8543 . The coordinates that are returned are located in Brazil. The remaining 95% of the errors are always below 44 . Therefore, the median error is only 23 , while the mean error is 546 . This outlier problem is much less apparent when selecting the two BSSIDs with the highest RSSI. The error at location 1 is then 3.7 . Location 29, however, still has an error of 2.01 . Overall, as shown in Figure 7, the mean location error in the WiGLE database is 103 , the median location error is 66 , and no location estimate can be found at 4 test locations. In the LocationAPI database, the mean location error is 114 , the median location error is 33 , and no location estimate can be found at 7 test locations. When combining the databases, the mean location error is 125 , the median location error is 39 , and an estimate can be found at all 36 test locations.
If we select the four BSSIDs with the highest RSSI, which requires us to use two Sigfox messages and increases the ten minutes update period to twenty minutes, the location error improves only slightly. In the WiGLE database, the mean location error becomes 56.11 , due to outliers. The median location error becomes 63 , which is an improvement of only 3 . However, no location estimate can be found at only 2 test locations. In the LocationAPI database, the mean location error is 71 , and the median location error is 31 . This is a larger improvement than in the case of WiGLE. A location estimate can be found at all 36 test locations. Because the best combination favored the LocationAPI estimate, the results for the combination are equal to those for LocationAPI. Thus, while faults in the results can be alleviated partly by sending two Sigfox messages rather than one, the improvement in location error is not so large as to make it an attractive option.
Additionally, the reliability of the databases can definitely be questioned. For example, anyone can anonymously upload data to the databases. Hopefully, there is a kind of check before the data is actually made available to other users. Otherwise users can enter wrong data into the database, for any number of reasons. The managers of the WiGLE and LocationAPI database admit that there could be geographical errors in their databases. However, an administrator of the LocationAPI website stated the following [29]:
“A lot of effort has gone into enabling our algorithms to auto-adapt based on the type of geography requested, correct for unclean data-sets (in case of crowd-sourced data) by intense cleansing of both contributor and customer data.”
Since it is not possible for companies like WiGLE of UnwiredLabs to verify each coordinate of every uploaded wireless access point, a localization application should have some built-in control mechanisms. Imagine, for example, a user uploading 100 coordinates of access points in a specific, relatively small region. If 99 of the coordinates are only a few meters away from each other, and there is one coordinate a few kilometers further, this could indicate that this single coordinate is the result of the bad resolving in the database. The information of this access point should be left out of the data, to avoid sending a combination with the coordinate of that ‘corrupt’ BSSID.
Another problem which must be tackled is that, even though Media Access Control (MAC) addresses are unique worldwide, there will always be MAC spoofers. MAC spoofers manipulate their MAC addresses for any number of reasons. Therefore, there should be a Duplicate Address Detection (DAD) mechanism in the localization application. Using DAD, it becomes possible to eliminate the entry with the ‘false location’ from the database if the ‘real’ location is already registered multiple times in the database.
Furthermore, it needs to be mentioned that there could be small distance errors, due to the limitations of the hardware. The GPS and the Wi-Fi adapter of the laptop have a certain refresh speed, so the user location or list of wireless access points is not instantly updated when moving.
4.3. Population Density
Usually, a lot of Wi-Fi networks can be discovered in the heart of a city like Antwerp. In the countryside or in open fields or parks, it is harder to detect a Wi-Fi network, because there are just less WAPs available in such areas. Therefore, it is interesting to investigate whether or not there is a relationship between the kind of area and the distance error. Of the 36 locations, there are six locations which can be categorized as less densely populated areas: locations 6, 9, 10, 23, 14, and 32. These locations are indicated in Figure 12.
There could be a relationship between the size of the median error and the kind of area where the measurement took place. Three out of the five biggest median errors were measured at a less densely populated location. However, the largest error was measured at a densely populated location and there are also errors in less densely populated areas that are smaller than the mean error. So, we cannot be sure if there is a relationship between the distance error and the kind of location. Despite the limitation of using only two BSSIDs, the amount of access points in the vicinity does play a role. The chance of having no match in the database increases in less populated areas from 13% to 20%.
5. Conclusions
We wanted to know how accurately we can localize a mobile device that communicates over Sigfox by observing nearby Wi-Fi access points. We used two online databases, WiGLE and LocationAPI, of Wi-Fi access points locations to search for the access points found by the mobile device. Because of the limitations in Sigfox communication, only two BSSIDs can be searched for in a single transmission, with a maximum of 140 transmissions per day.
Using the WiGLE database, we achieved a median location error of 45 , with a 86.8% chance of finding the combination of BSSIDs transmitted by the device. Using the LocationAPI database, we achieved a median location error of 23 , with a 87.5% chance of finding the combination transmitted by the device. Both databases have outliers well above 100 . However, only in the WiGLE database the 75th percentile location error is larger than 1 , and this only at two of the test locations.
To increase the chance of finding the combination of BSSIDs transmitted by the device, we combined the results of both databases. Since the LocationAPI database is more accurate than the WiGLE database, we chose to combine them by only using the WiGLE database when the combination of BSSIDs was not found in the LocationAPI database. With this method, we achieved a median location error of 40 , with a 98.1% chance of finding the combination transmitted by the device.
Since only 140 transmissions are allowed per day, with only 6 per hour, and only two BSSIDs can be sent in a single transmission, we additionally explored a strategy for selecting the combination of BSSIDs. The strategy consists of selecting the two BSSIDs with the highest received signal strength. Using our combination of both databases, the median location error is 39 , and this combination could be found on all 36 test locations. Moreover, we found that using two messages to transmit four BSSIDs does not decrease the location error significantly.
After this experiment with real data, we want to increase the reliability by building a device that can both sense the Wi-Fi access points and transmit two BSSIDs over Sigfox. This will not only enable us to confirm our results in a closed experiment, but also allow us to measure how much energy is exactly required for this type of localization, so that we know if it is a viable way to track and trace assets in an Internet of Things scenario.
Supplementary Materials
The following are available online at https://0-www-mdpi-com.brum.beds.ac.uk/2076-3417/7/9/936/s1, Figure S1: Dynamic map of test locations, Figure S2: Dynamic map of median error at the test locations. Results for WiGLE, LocationAPI, and the combination are colored as in the other figures: WiGLE is blue, LocationAPI is red, and the combination is yellow.
Acknowledgments
Part of this research was funded by the Flemish FWO SBO S004017N IDEAL-IoT (Intelligent DEnse And Longe range IoT networks) project, and by the ICON project MuSCLe-IoT. MuSCLe-IoT is a project realized in collaboration with imec, with project support from VLAIO (Flanders Innovation and Entrepreneurship). Project partners are imec, Flash Private Mobile Networks, Engie M2M, Sensolus and Aertssen.
Author Contributions
R.B. and M.W. conceived and designed the experiments; T.J. performed the experiments; T.J. and R.B. analyzed the data; T.J. and R.B. wrote the paper.
Conflicts of Interest
The authors declare no conflict of interest. The funding sponsors had no role in the design of the study; in the collection, analyses, or interpretation of data; in the writing of the manuscript, and in the decision to publish the results.
References
- Shamsuzzoha, A.; Ehrs, M.; Tenkorang, R.A.; Nguyen, D.; Helo, P.T. Performance evaluation of tracking and tracing for logistics operations. Int. J. Shipp. Transp. Logist. 2013, 5, 31–54. [Google Scholar] [CrossRef]
- Asioli, D.; Boecker, A.; Canavari, M. On the linkages between traceability levels and expected and actual traceability costs and benefits in the Italian fishery supply chain. Food Control 2014, 46, 10–17. [Google Scholar] [CrossRef]
- Stranieri, S.; Cavaliere, A.; Banterle, A. Voluntary traceability standards and the role of economic incentives. Br. Food J. 2016, 118, 1025–1040. [Google Scholar] [CrossRef]
- Hillbrand, C.; Schoech, R. Shipment Localization Kit: An Automated Approach for Tracking and Tracing General Cargo. In Proceedings of the International Conference on the Management of Mobile Business (ICMB 2007), Toronto, ON, Canada, 9–11 July 2007; pp. 1–7. [Google Scholar]
- Kandel, C.; Klumpp, M.; Keusgen, T. GPS based track and trace for transparent and sustainable global supply chains. In Proceedings of the 2011 17th International Conference on Concurrent Enterprising (ICE), Aachen, Germany, 20–22 June 2011; pp. 1–8. [Google Scholar]
- Oliveira, R.R.; Cardoso, I.M.; Barbosa, J.L.; da Costa, C.A.; Prado, M.P. An intelligent model for logistics management based on geofencing algorithms and RFID technology. Expert Syst. Appl. 2015, 42, 6082–6097. [Google Scholar] [CrossRef]
- Raza, U.; Kulkarni, P.; Sooriyabandara, M. Low Power Wide Area Networks: An Overview. IEEE Commun. Surv. Tutor. 2017, 19, 855–873. [Google Scholar] [CrossRef]
- Sigfox, S.A. Sigfox. 2017. Available online: https://www.sigfox.com/en (accessed on 10 June 2017).
- Centenaro, M.; Vangelista, L.; Zanella, A.; Zorzi, M. Long-range communications in unlicensed bands: The rising stars in the IoT and smart city scenarios. IEEE Wirel. Commun. 2016, 23, 60–67. [Google Scholar] [CrossRef]
- Berkvens, R. Uncertainty of Localization Using Electromagnetic Fingerprints. Ph.D. Thesis, Universiteit Antwerpen, Antwerpen, Belgium, 2017. [Google Scholar]
- Bolić, M.; Rostamian, M.; Djurić, P.M. Proximity Detection with RFID: A Step Toward the Internet of Things. IEEE Pervasive Comput. 2015, 14, 70–76. [Google Scholar] [CrossRef]
- Neirynck, D. An IEEE 802.15.4A Ultra-Wideband Transceiver for Real Time Localisation and Wireless Sensor Networks. In Frequency References, Power Management for SoC, and Smart Wireless Interfaces; Baschirotto, A., Makinwa, A.A.K., Harpe, P., Eds.; Springer: Cham, Switzerland, 2014; Chapter 17; pp. 297–310. [Google Scholar]
- Fang, S.H.; Hsu, Y.T.; Shiao, Y.; Sung, F.Y. An Enhanced Device Localization Approach Using Mutual Signal Strength in Cellular Networks. IEEE Internet Things J. 2015, 2, 596–603. [Google Scholar] [CrossRef]
- Bensky, A. Wireless Positioning Technologies and Applications, 2nd ed.; Artech House: Norwood, MA, USA, 2016; p. 424. [Google Scholar]
- He, S.; Chan, S.H.G. Wi-Fi Fingerprint-Based Indoor Positioning: Recent Advances and Comparisons. IEEE Commun. Surv. Tutor. 2016, 18, 466–490. [Google Scholar] [CrossRef]
- Torres-Sospedra, J.; Moreira, A.; Knauth, S.; Berkvens, R.; Montoliu, R.; Belmonte, O.; Trilles, S.; João Nicolau, M.; Meneses, F.; Costa, A.; et al. A realistic evaluation of indoor positioning systems based on Wi-Fi fingerprinting: The 2015 EvAAL–ETRI competition. J. Ambient Intell. Smart Environ. 2017, 9, 263–279. [Google Scholar] [CrossRef]
- Zhang, L.; Valaee, S.; Xu, Y.B.; Ma, L.; Vedadi, F. Graph-Based Semi-Supervised Learning for Indoor Localization Using Crowdsourced Data. Appl. Sci. 2017, 7, 467. [Google Scholar] [CrossRef]
- Gezici, S.; Tian, Z.; Giannakis, G.; Kobayashi, H.; Molisch, A.; Poor, H.; Sahinoglu, Z. Localization via ultra-wideband radios: A look at positioning aspects for future sensor networks. IEEE Signal Process. Mag. 2005, 22, 70–84. [Google Scholar] [CrossRef]
- Sallouha, H.; Chiumento, A.; Pollin, S. Localization in Long-range Ultra Narrow Band IoT Networks using RSSI. In Proceedings of the 2017 IEEE International Conference on Communications (ICC), Paris, France, 21–25 May 2017; p. 6. [Google Scholar]
- Sapiezynski, P.; Gatej, R.; Mislove, A.; Lehmann, S. Opportunities and Challenges in Crowdsourced Wardriving. In Proceedings of the 2015 ACM Conference on Internet Measurement Conference—IMC ’15, Tokyo, Japan, 28–30 October 2015; ACM Press: New York, NY, USA, 2015; pp. 267–273. [Google Scholar]
- Robusto, C.C. The Cosine-Haversine Formula. Am. Math. Mon. 1957, 64, 38. [Google Scholar] [CrossRef]
- Combain. Combain Positioning Solutions. 2017. Available online: https://combain.com/ (accessed on 3 July 2017).
- UnwiredLabs. LocationAPI: Reliable Mobile Mapping. 2017. Available online: http://locationapi.org/ (accessed on 3 July 2017).
- Mozilla. Mozilla Location Service. 2017. Available online: https://location.services.mozilla.com/ (accessed on 3 July 2017).
- Navizon. Navizon: WiFi and Cell-ID Location Database with Global Coverage. 2017. Available online: https://www.navizon.com/ (accessed on 3 July 2017).
- WiGLE. WiGLE: Wireless Network Mapping. 2017. Available online: https://wigle.net/ (accessed on 30 June 2017).
- Navizon. Navizon Technology: How It Works. 2017. Available online: https://www.navizon.com/navizon-how-it-works (accessed on 30 June 2017).
- Business Wire. Make Your Smart Phone Pay For Itself by Running Navizon. 2017. Available online: http://www.businesswire.com/news/home/20100128005942/en/Smart-Phone-Pay-Running-Navizon (accessed on 3 July 2017).
- UnwiredLabs. The Unwired Labs Blog: Going from “Accurate” to “Really Accurate”. 2015. Available online: http://locationapi.org/blog/ (accessed on 9 May 2017).
Figure 1.
WiGLE returns detailed information about an access point.

Figure 2.
LocationAPI returns only the average location of multiple BSSIDs, but also an estimated accuracy.
Figure 2.
LocationAPI returns only the average location of multiple BSSIDs, but also an estimated accuracy.

Figure 3.
Measurement locations in Antwerp, ©2017 Google. See Figure S1 for an interactive version.
Figure 3.
Measurement locations in Antwerp, ©2017 Google. See Figure S1 for an interactive version.

Figure 4.
Overview of the location error on all 36 locations using the WiGLE database. Errors larger than 2 are clipped.
Figure 4.
Overview of the location error on all 36 locations using the WiGLE database. Errors larger than 2 are clipped.

Figure 5.
Cumulative distribution of the location error at the eighth measurement location, using the WiGLE database. A detail of Figure (a) is shown in Figure (b). The mean location error is 101 , the median location error is 45 .
Figure 5.
Cumulative distribution of the location error at the eighth measurement location, using the WiGLE database. A detail of Figure (a) is shown in Figure (b). The mean location error is 101 , the median location error is 45 .

Figure 6.
Probability of finding no match for either of two BSSIDs in the WiGLE and LocationAPI database. The mean chance of finding no match over all locations is 13.2% for WiGLE, 12.5% for LocationAPI, and 1.9% for the combination.
Figure 6.
Probability of finding no match for either of two BSSIDs in the WiGLE and LocationAPI database. The mean chance of finding no match over all locations is 13.2% for WiGLE, 12.5% for LocationAPI, and 1.9% for the combination.

Figure 7.
Cumulative distribution of the location error when two BSSIDs with the highest Received Signal Strength Indicator (RSSI) are transmitted. One outlier of LocationAPI and the combination is at 2.01 .
Figure 7.
Cumulative distribution of the location error when two BSSIDs with the highest Received Signal Strength Indicator (RSSI) are transmitted. One outlier of LocationAPI and the combination is at 2.01 .

Figure 8.
Overview of the location error on all 36 locations using the LocationAPI database. Errors larger than 2 are clipped.
Figure 8.
Overview of the location error on all 36 locations using the LocationAPI database. Errors larger than 2 are clipped.

Figure 9.
Cumulative distribution of the location error at the first measurement location, using the LocationAPI database. A detail of Figure (a) is shown in Figure (b). The mean location error is 546 , the median location error is 23 .
Figure 9.
Cumulative distribution of the location error at the first measurement location, using the LocationAPI database. A detail of Figure (a) is shown in Figure (b). The mean location error is 546 , the median location error is 23 .

Figure 10.
Overview of the location error on all 36 locations using the combination of the two databases by averaging. Errors larger than 2 are clipped.
Figure 10.
Overview of the location error on all 36 locations using the combination of the two databases by averaging. Errors larger than 2 are clipped.

Figure 11.
Overview of the location error on all 36 locations using the combination of the two databases by first choosing LocationAPI and then WiGLE. Errors larger than 2 are clipped.
Figure 11.
Overview of the location error on all 36 locations using the combination of the two databases by first choosing LocationAPI and then WiGLE. Errors larger than 2 are clipped.

Figure 12.
Median location error at each test location for both the WiGLE and LocationAPI databases, and for their combination. The location error is not consequently larger in less populated areas. See Figure S2 for an interactive map; its color legend is the same as in this figure.
Figure 12.
Median location error at each test location for both the WiGLE and LocationAPI databases, and for their combination. The location error is not consequently larger in less populated areas. See Figure S2 for an interactive map; its color legend is the same as in this figure.


Table 1.
Summary of largest Wi-Fi fingerprinting databases.
| Database Name | Amount of Wi-Fi Access Points | Reference |
|---|---|---|
| Combain Positioning Service | 1,296,000,000 | [22] |
| LocationAPI by UnwiredLabs | 1,500,000,000 | [23] |
| Mozilla Location Service | 30,000,000,000 | [24] |
| Navizon | unknown | [25] |
| WiGLE | 4,750,076,107 | [26] |
Table 2.
Comparison of the properties and characteristics of the WiGLE and LocationAPI databases.
| Property | WiGLE | LocationAPI |
|---|---|---|
| Amount of access points worldwide | 4,750,076,107 | 1,500,000,000 |
| Amount of access points in Belgium | 1,700,000 | 11,000,000 |
| Accuracy given in request | No | Yes |
| Balance given in request | No | Yes |
| Number of BSSIDs in a request | 1 BSSID | At least 2 BSSIDs |
| Number of coordinates in a response | 1 coordinate per WAP | 1 mean coordinate |
| Documentation | More complex | More intuitive |
© 2017 by the authors. Licensee MDPI, Basel, Switzerland. This article is an open access article distributed under the terms and conditions of the Creative Commons Attribution (CC BY) license (http://creativecommons.org/licenses/by/4.0/).
Share and Cite
MDPI and ACS Style
Janssen, T.; Weyn, M.; Berkvens, R. Localization in Low Power Wide Area Networks Using Wi-Fi Fingerprints. Appl. Sci. 2017, 7, 936. https://0-doi-org.brum.beds.ac.uk/10.3390/app7090936
AMA Style
Janssen T, Weyn M, Berkvens R. Localization in Low Power Wide Area Networks Using Wi-Fi Fingerprints. Applied Sciences. 2017; 7(9):936. https://0-doi-org.brum.beds.ac.uk/10.3390/app7090936
Chicago/Turabian StyleJanssen, Thomas, Maarten Weyn, and Rafael Berkvens. 2017. "Localization in Low Power Wide Area Networks Using Wi-Fi Fingerprints" Applied Sciences 7, no. 9: 936. https://0-doi-org.brum.beds.ac.uk/10.3390/app7090936
Note that from the first issue of 2016, this journal uses article numbers instead of page numbers. See further details here.