Fracture Initiation of an Inhomogeneous Shale Rock under a Pressurized Supercritical CO2 Jet
by
 , ,
, ,
Yi Hu
1,2,3 ,
,
Yiwei Liu
1,2,4,*,
Can Cai
1,2,3,
Yong Kang
1,2,3,
Xiaochuan Wang
1,2,3,
Man Huang
1,2,3 and
Feng Chen
1,2,4 1
Key Laboratory of Hydraulic Machinery Transients, Ministry of Education, Wuhan University, Wuhan 430072, China
2
Hubei Key Laboratory of Waterjet Theory and New Technology, Wuhan University, Wuhan 430072, China
3
School of Power and Mechanical Engineering, Wuhan University, Wuhan 430072, China
4
School of Civil Engineering, Wuhan University, Wuhan 430072, China
*
Author to whom correspondence should be addressed.
Appl. Sci. 2017, 7(10), 1093; https://0-doi-org.brum.beds.ac.uk/10.3390/app7101093
Submission received: 24 September 2017
/
Revised: 13 October 2017
/
Accepted: 16 October 2017
/
Published: 23 October 2017
(This article belongs to the Section Chemical and Molecular Sciences)
Abstract
:Due to the advantages of good fracture performance and the application of carbon capture and storage (CCS), supercritical carbon dioxide (SC-CO2) is considered a promising alternative for hydraulic fracturing. However, the fracture initiation mechanism and its propagation under pressurized SC-CO2 jet are still unknown. To address these problems, a fluid–structure interaction (FSI)-based numerical simulation model along with a user-defined code was used to investigate the fracture initiation in an inhomogeneous shale rock. The mechanism of fracturing under the effect of SC-CO2 jet was explored, and the effects of various influencing factors were analyzed and discussed. The results indicated that higher velocity jets of SC-CO2 not only caused hydraulic-fracturing ring, but also resulted in the increase of stress in the shale rock. It was found that, with the increase of perforation pressure, more cracks initiated at the tip. In contrast, the length of cracks at the root decreased. The length-to-diameter ratio and the aperture ratio distinctly affected the pressurization of SC-CO2 jet, and contributed to the non-linear distribution and various maximum values of the stress in shale rock. The results proved that Weibull probability distribution was appropriate for analysis of the fracture initiation. The studied parameters explain the distribution of weak elements, and they affect the stress field in shale rock.
1. Introduction
Due to its clean nature, shale gas has become the focus of research and development in the field of energy sciences. Hydraulic fracture is an efficient method for commercial extraction of hydrocarbons in shale and tight reservoirs and has contributed to the boom of shale gas in the United States [1,2]. In order to reduce water consumption and CO2 emissions, SC-CO2 fracturing is regarded as a potential futuristic technology [3]. The SC-CO2 is a fluid state of carbon dioxide when it is held at or above its critical temperature (Tc = 31.10 °C) and critical pressure (Pc = 7.38 MPa). Compared to the conventional hydraulic fracturing technology, shale gas has several advantages, including low viscosity, small damage to the reservoir, outstanding permeability in fine pores and micro-cracks of shale. In particular, the SC-CO2 hydro-jet fracturing is regarded as a unique, cost-effective and efficient well-stimulation treatment owing to its capability to accomplish a multi-stage pin-point fracturing without the use of mechanical packers. The fracturing is accomplished due to the jet pressurization effect, while SC-CO2 jet is pressurized in the perforation tunnel. Therefore, the pressurization process of SC-CO2 jet and the crack initiation of shale rock have attracted significant research attention in recent years.
Firstly, the SC-CO2 jet was investigated for its structure, its expansion mechanism, and its application in industry. The rapid expansion of SC-CO2 jet has been studied for nearly 20 years and is used to fabricate nanoparticles and grow thin films, and is used as an interface in various instruments including mass spectrometers and gas chromatographs [4]. Previously, the structure and the flow field of an SC-CO2 free jet have been studied in different ambient environments [5,6,7]. Most of the previous studies on the simulations of rapid expansion of supercritical solutions (RESS) have employed a one-dimensional (1-D) method [8,9]. Some scholars have used two-dimensional (2-D) and three-dimensional (3-D) simulations of RESS [10,11]. To predict the fluid properties satisfactorily, even in the supercritical region, a series of studies have used cubic equations of state, such as the van der Waals and Peng–Robinson (PR) equations of state, to estimate some of the properties of the SC-CO2 jet [12]. Furthermore, several researchers have used the Span–Wagner equations and the Bender equation of state to calculate the density and thermal conductivity coefficient of SC-CO2 jets [13].
The rapid expansion of SC-CO2 jets makes it one of the most commonly used supercritical solvents in the fields of chemistry and chemical engineering. Due to its liquid-like density, and gas-like diffusivity and viscosity, SC-CO2 is used in a wide range of industrial applications. Due to its favorable properties, Richard and Liu reported that SC-CO2 can be effectively used to enhance the fracturing and production of shale gas [3]. It was reported that a high rate of penetration was obtained when SC-CO2 was used as the drilling fluid [14]. Moreover, rock breaking with SC-CO2 exhibits advantages of a lower threshold pressure, a fast drilling rate, and a high rate of penetration [15]. In order to study the dynamics of wellbore, the effects of major influencing factors such as the nozzle diameter, the standoff distance, and the jet pressure of SC-CO2 were investigated during well drilling [16]. In addition, many studies that focused on the rock-breaking performance of a high-pressure SC-CO2 jet explored the influence of various factors on its rock-breaking performance. It was found that, under the same working conditions, the SC-CO2 jet can efficiently erode rocks at a comparably low threshold pressure with a high rate of penetration [17]. Previously, researchers have investigated the structure of SC-CO2 jets and measured the impinging pressure [18]. The failure mechanism of rock and the changes in pore structure were also explored during the SC-CO2 jet impinging [19]. There is still some degree of uncertainty in understanding the process of SC-CO2 hydro-jet fracturing. Particularly, due to the absence of packers, the hydro-jet fracturing is regarded as a cost-effective technique, and since it isolates the annular from the reservoir, it is also considered not to damage the reservoir [20]. Obviously, it can offer the advantages of both the hydro-jet fracturing and the SC-CO2 fluid used in the exploration and production of shale gas. In addition, the SC-CO2 jet has significant mechanical effects and generates more extensive and complex fracture networks, which enhance the process of fracturing.
Previously, the SC-CO2 jet was investigated to comprehensively understand the process of SC-CO2 jet fracturing. Some studies considered the influence of rock on the process of hydro-jet fracturing. Additionally, some experiments and numerical simulations have been carried out to investigate the pressurization process of SC-CO2 hydro-jet fracturing in perforation tunnels. Various experimental setups and physical models have been proposed to determine the dynamic characteristics of high-pressure SC-CO2 jets [21]. The flow field of SC-CO2 jets was also studied to explore the properties of SC-CO2 and analyze the sensitivity parameters using numerical simulations [14]. However, there are concerns about whether the use of SC-CO2 produces the same pressurization effect in the perforation tunnel as that of the water jet [1,19]. To address this concern, the pressurization effect of SC-CO2 hydro-jet fracturing was investigated at higher temperatures and pressures. The results indicated that the hydro-jet fracturing parameters affected the pressurization in the perforation tunnel. However, due to the complicated interaction between the jet flow and the reservoir rock breaking, the studies focusing on SC-CO2 jet fracturing did not consider the rock crack initiation and propagation [22]. Though the fracture initiation and propagation were considered, most of the turbulent jet flows were treated as laminar flows [23,24]. In addition to the numerical simulation, for a given in situ stress condition and wellbore orientation parameters, a theoretical model was developed to predict the fracture initiation pressure and the orientation and location of fractures on the wellbore wall. The model has been applied in a series of in situ stress conditions to study the effect of wellbore orientation on the fracture initiation using non-dimensional parameters, which have enhanced the applicability of published results for any stress condition. Closed-form analytical solutions have also been obtained for the initiation of longitudinal, transversal, and complex multiple fractures from vertical and horizontal wellbores with/without perforation [25,26]. A number of assumptions were made to simplify the theoretical model for the ease of calculations. In 1972, a Perkins–Kern–Nordgren type model was proposed, in which the created fracture was pressurized using the original laminar fluid flow that was constrained by various boundary conditions [27].
The previous studies focusing on SC-CO2 hydro-jet fracture in perforation tunnels have two shortcomings. Firstly, most of the time, the study of CO2 fracturing has only focused on the initiation and propagation of rock fracture, and the turbulent characteristics of SC-CO2 jet flow were ignored [28,29]. However, comparisons between the results and the parameters for laminar and turbulent hydraulic fractures have clearly shown that different models were suitable for different hydraulic fracture lengths and wellbore pressures [30]. In particular, for SC-CO2 hydro-jets in perforation tunnels, strong mixing layers and a turbulent flow are observed, which significantly affects the initiation and propagation of shale cracks. Secondly, most numerical simulations of the hydraulic fracture used to investigate the initiation and propagation behaviors of hydro-fracturing cracks in shale rock have been based solely on homogeneous models [31,32].
In the present work, based on a turbulent FSI, a numerical simulation model, which considered the inhomogeneous characteristic of shale rock, was proposed to investigate the initiation of shale cracks. Through field observations and experiments, the FSI model of SC-CO2 hydro-jet fracturing was proposed using the method that consisted of a user-defined code and two-step simulations. The mechanism of SC-CO2 hydro-jet fracturing was explored, and the effects of various factors, such as the perforation pressure, in situ stress, and aperture ratio were discussed. The results help in understanding the process of SC-CO2 hydro-jet fracturing and contribute to the already existing literature in the field.
2. Field Observations and Experiments
2.1. Field Observations
Several SC-CO2 jet models were proposed in the past several decades. However, most of them were based on the free SC-CO2 jet and are not suitable for perforation tunnel of the hydraulic fractures in the oil and gas industry. As shown in Figure 1, during the fracturing process, the SC-CO2 jet will boost the pressure in the perforation tunnel. On the one hand, the boosting of the pressure will open the crack, which initiates on the inner surface of the perforation tunnel. On the other hand, compared with water, the SC-CO2 will easily invade the shale reserve due to its lower viscosity. The process of the SC-CO2 hydro-jet fracturing that results from the interaction between the shale rock and SC-CO2 is complex and lacks understanding among the scientific community. In practical engineering, the perforation happens underground, which makes it hard to investigate the FSI. For these reasons, there was an urgent need to further study the technology of SC-CO2 hydro-jet fracturing.
2.2. Experiments of Perforation Shape
Since the hydro-jet fracture is difficult to observe in practical engineering, numerical simulation becomes more direct and effective in studying hydraulic fractures. Firstly, the shape of the perforation needs to be studied clearly as it determines the accuracy of the numerical simulation. It is reported that the jet perforation tunnel has the shape of a spindle in the reservoir. In the past, the shape perforations were obtained, and the successful implementation of a technique offering a valid, low-cost alternative to conventional perforating in a highly deviated well was achieved. The spindle-shaped shale perforation tunnel in artificial rock samples was also studied experimentally, and the results were used to simulate the hydro-jet pressurization process. It is worth noticing that the perforation shape of the shale rock with inhomogeneous characteristics is not clear. The specimen used was made up after considering the influence of casing and cement. After being processed under an 80 MPa abrasive hydro-jet, the slender spindle shape was obtained through a CT scan (Figure 2). The shape significantly affects the performance of SC-CO2 hydro-jet fracturing. To guarantee the accuracy of numerical simulation, the FSI model was based on the spindle shape of the shale rock.
3. Methodology and the Model
3.1. Fluid–Structure Interaction (FSI) Model
Based on practical engineering (Figure 1) and the spindle shape of the perforation tunnel, the FSI model is proposed, as shown in Figure 3. The fluid model was used in the fluid domain with the FSI boundary and represented the SC-CO2 hydro-jet in the perforation tunnel. The model for structure was used in the structure domain, and was composed of the casing, cement, and shale rock. The FSI model was built using the ADINA (ADINA 9.2.2, ADINA R &D Inc., Watertown, MA, USA, 2016) software, which is regarded as one of the best numerical simulation programs to solve the FSI problem. In the model, the FSI boundary had the same profile, while the fluid and structure nodes on the FSI interface were coupled in ADINA. To avoid potential convergence problems, the following assumptions were made to simplify the FSI model.
- Before the initiation and propagation of fracture, both the fluid and the structure models have fixed boundary profiles, while the FSI boundary has limited deformation.
- In the shale model, due to the short residence time for SC-CO2 jet, the CO2 seepage and phase change did not need to be considered.
- In the SC-CO2 jet model, the temperature does not significantly affect the stress field of the shale rock.
Based on these assumptions, it was possible to simulate the stress and deformation of shale rock before and after the fracture initiation.
Though the FSI numerical model of SC-CO2 hydro-jet fracture was established, the one-way coupling method of FSI model should also be conducted in the software. The FSI process was divided into three parts, as shown in Figure 4. Part 1 represented the computational fluid dynamics (CFD) simulation process. The perforation pressure was applied on the boundary of the shale rock model, and the results were extracted during the simulation process. Part 2 represented the finite element method (FEM) simulation, and both the perforation pressure and the in situ stress were used in the model. In addition, considering the inhomogeneous characteristics of shale rock and material failure, the model was modified through user-defined code in ADINA. Part 3 represented the restart solution step, in which the function of elemental failure was activated due to the increase in boundary load. When the simulation was started, Step 1, including the CFD and FEM simulation was performed. After the solution was obtained, Step 2 was carried out. In this step, the user-defined material failure criterion was activated, and the element turned to failure in the model, provided that the element stress reached the threshold value of the failure settings.
3.2. SC-CO2 Jet Model
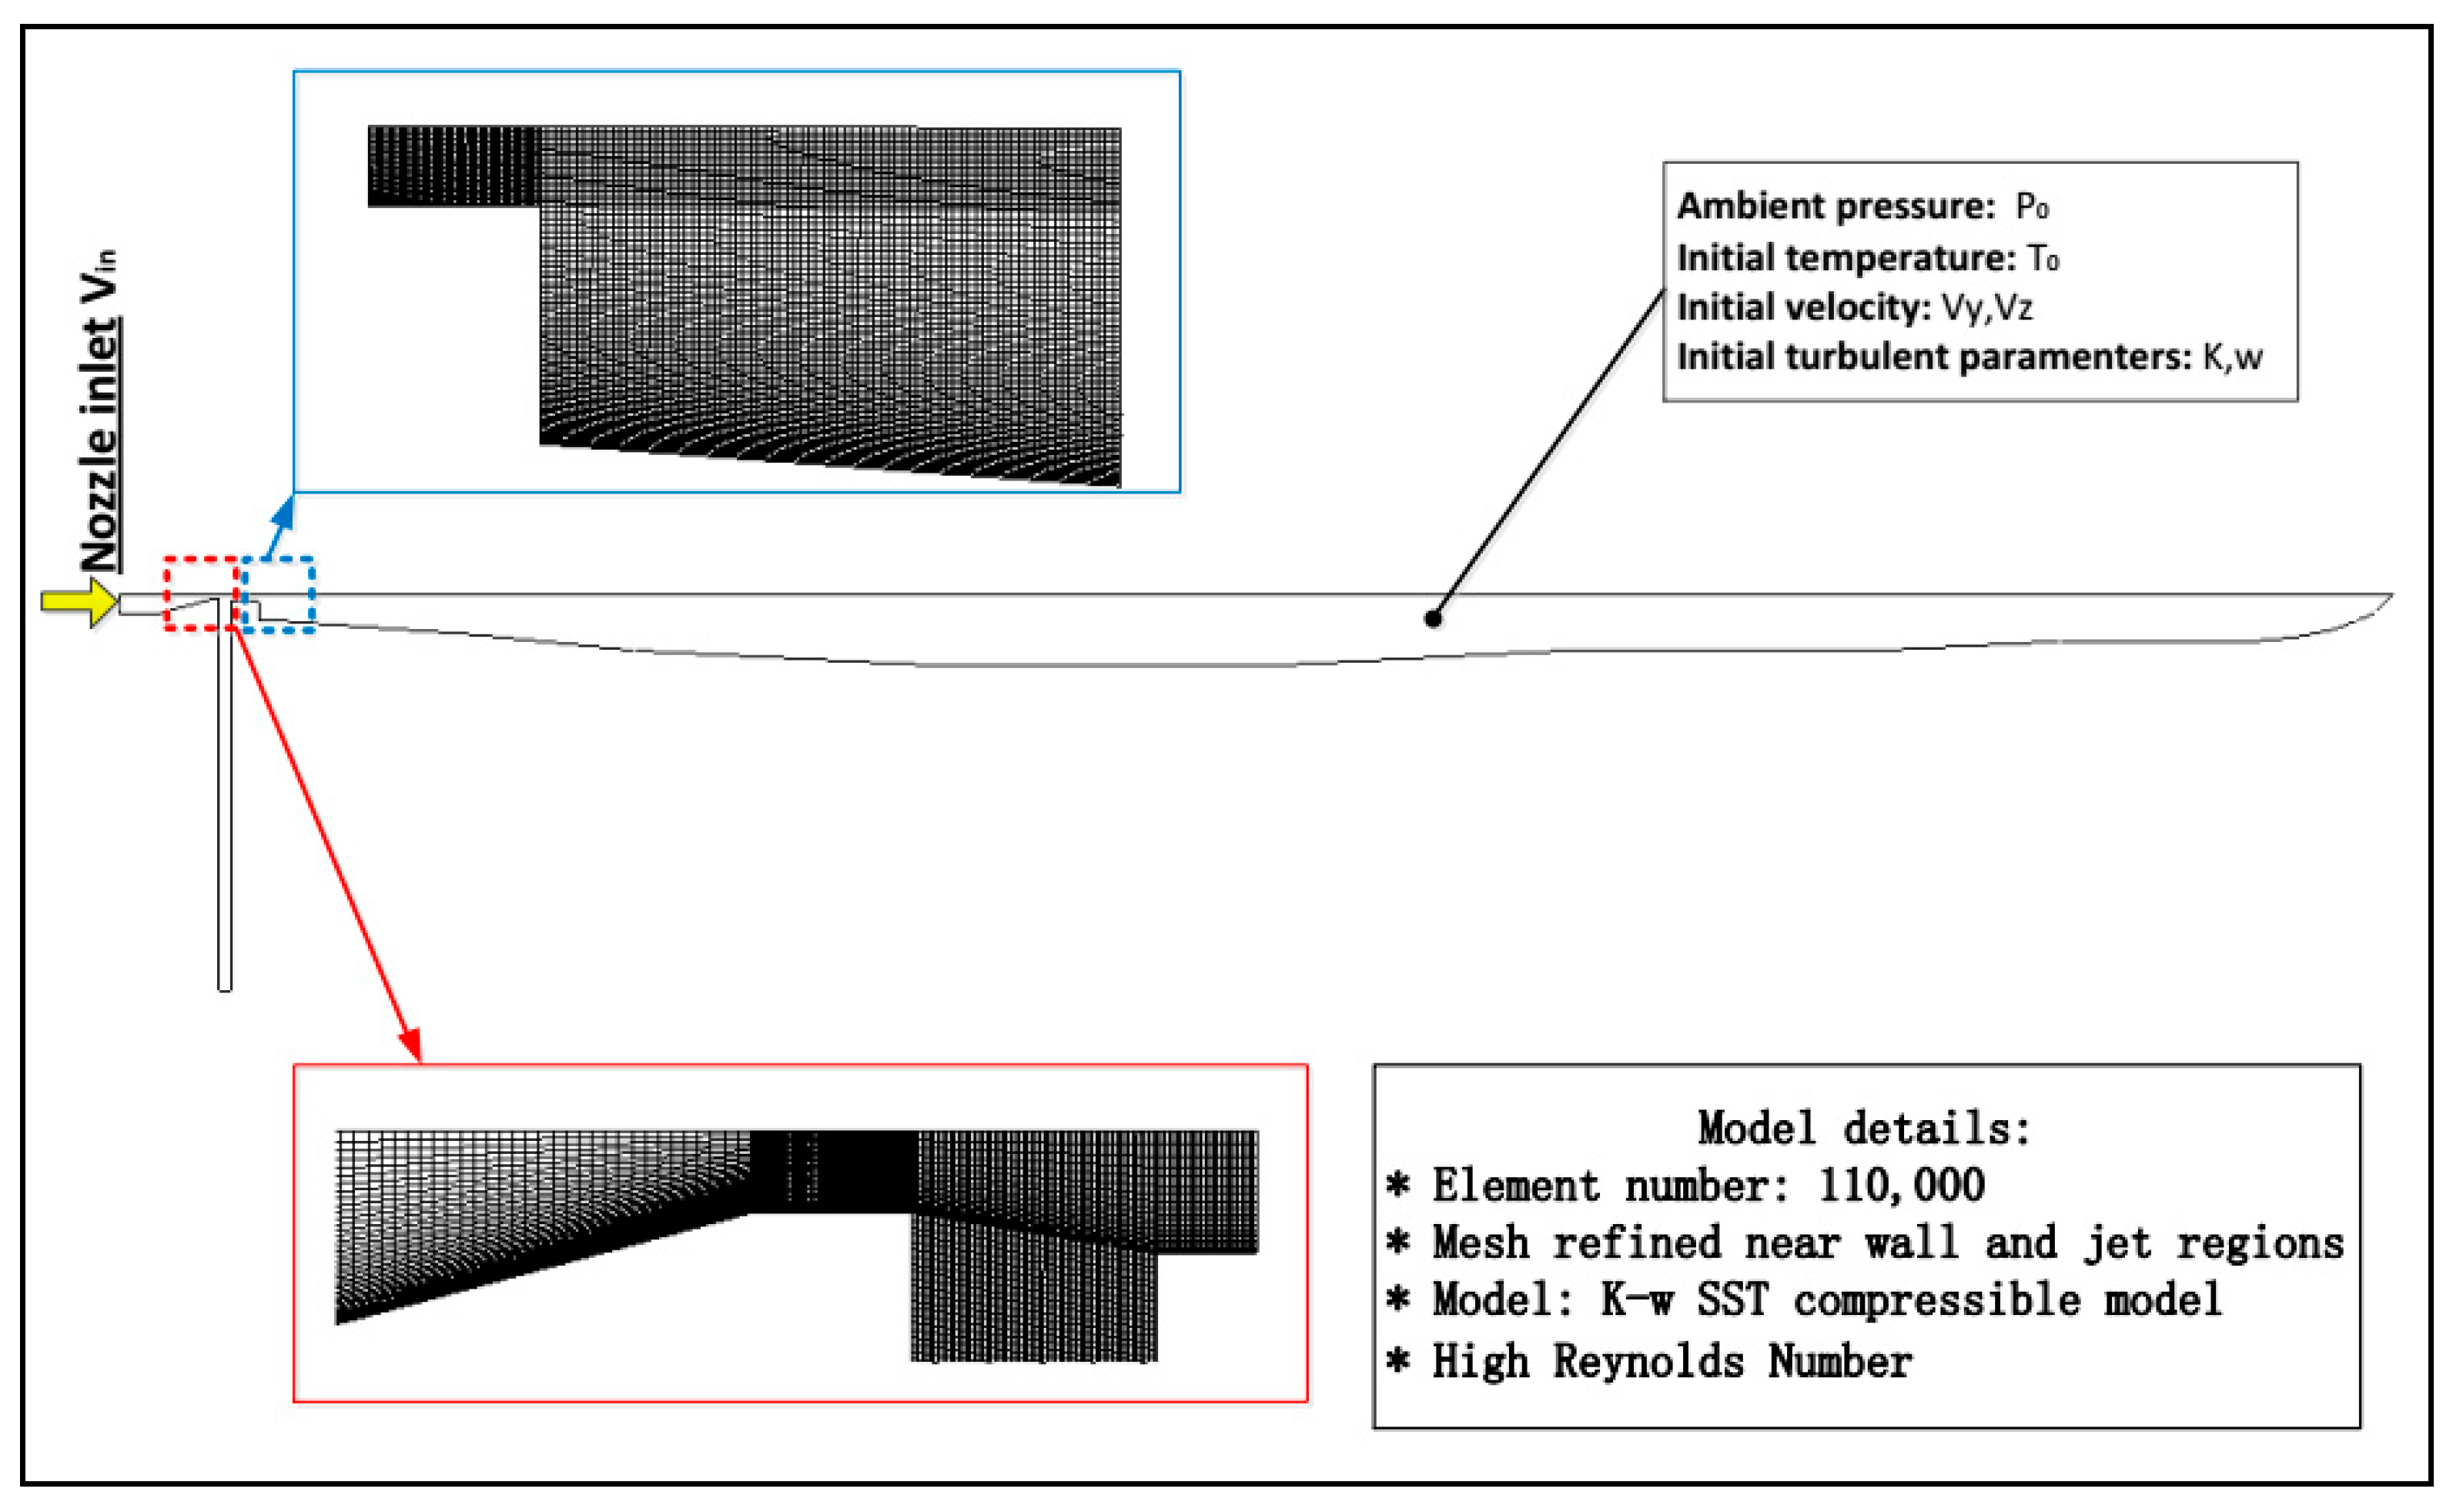
Hydro-jet fracturing is a complicated process, especially for SC-CO2 jet in a perforation tunnel. Before the initiation of fracture, the SC-CO2 was compressed in the closed perforation tunnel. For this reason, the compressible fluid (SC-CO2) boosted the pressure in the close perforation tunnel with large variations in pressure, density, temperature, and other turbulent parameters. To accurately simulate the pressure boosting process, several methods were applied. The mesh density was refined near the wall of the perforation tunnel (Figure 5). The shear stress transport (SST) model k-w turbulent model was used to obtain the turbulent changes in the perforation wall. The SC-CO2 jet penetrated the perforation tunnel and underwent significant changes in temperature, pressure, and velocity. The numerical model considered both the heat transfer and the fluid dynamics to solve the conservation of mass equations, the conservation of momentum equations, and the conservation of energy equations. The conservative, 2-D plane flow is represented by Equations (1) and (2).
Previous studies have shown that the SST k-ω model is more accurate and suitable for turbulent simulation, especially in the region close to the walls. Considering the shear layer in the jet mixed layer, the higher Reynolds k-ω turbulence model was selected. Both the parameters k and ω are defined using Equations (3) and (4), respectively.
The Peng Robison (PR) equation of state has widely and successfully been used in supercritical fluid simulations, especially the SC-CO2 jet simulations. The PR equation of state is expressed using Equation (5).
where and .
3.3. Inhomogeneous Shale Model and User-Defined Material Failure Criterion
3.3.1. Inhomogeneous Mechanism Parameters
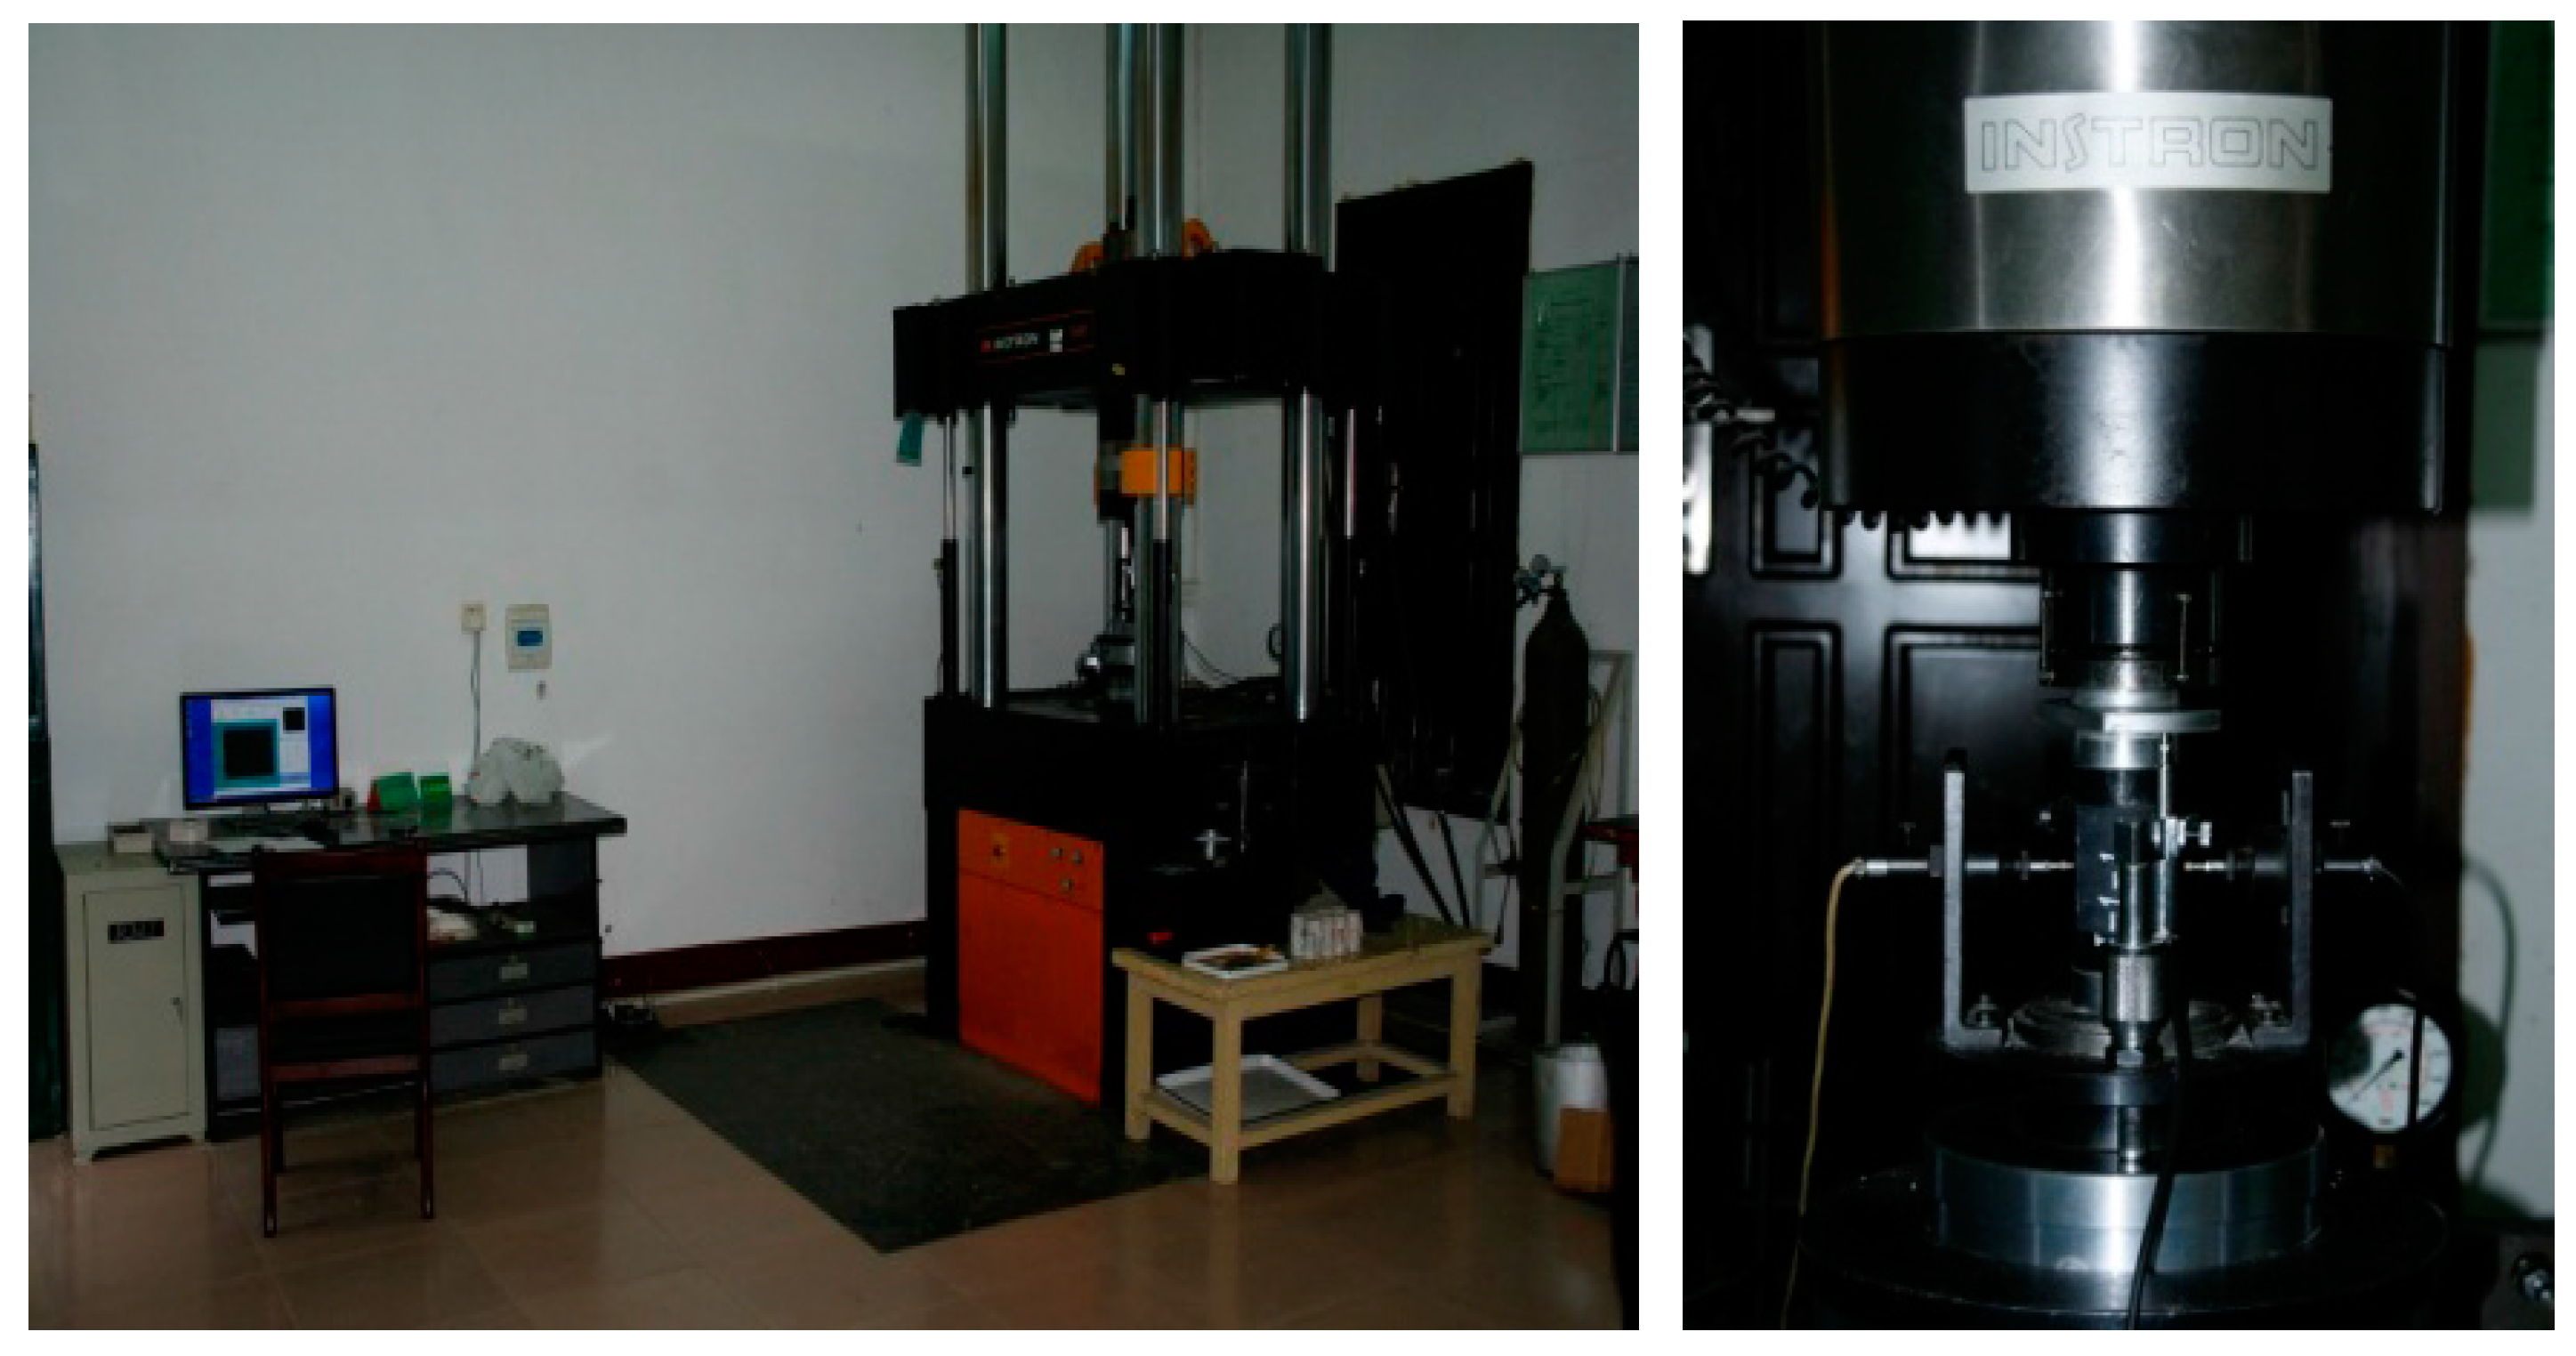
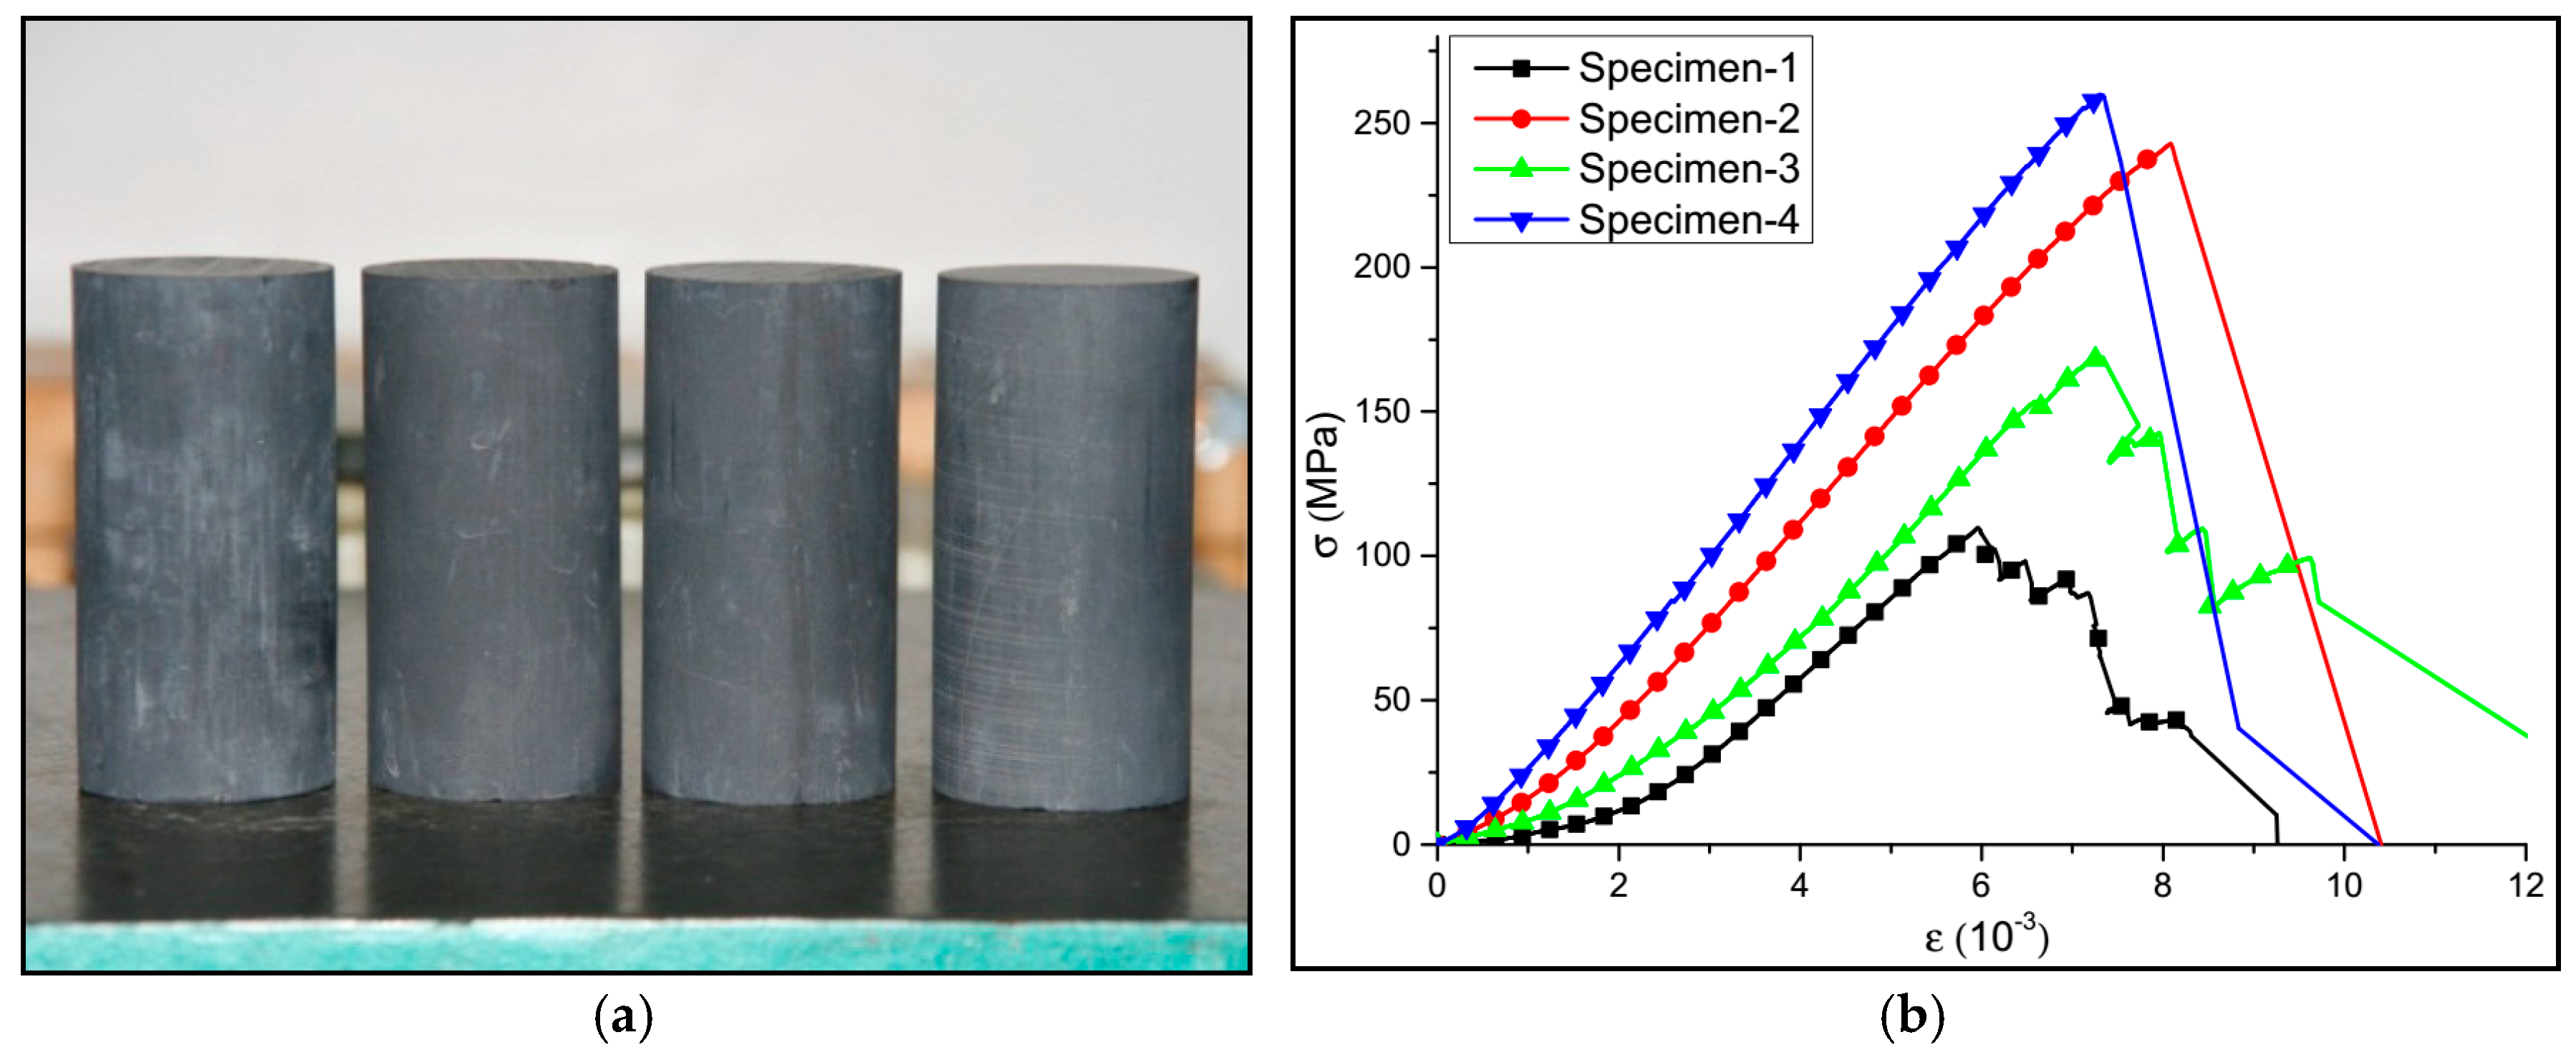
Unlike the homogeneous rock, shale rock exhibits distinct heterogeneity, especially in the form of elastic modulus, tangent modulus, and Poisson’s ratio. To investigate the inhomogeneous characteristic of shale rock, four specimens were used to conduct experiments using a rock mechanics servo-controlled testing system (Instron 1346 (Illinois Tool Works Inc., High Wycombe, United Kingdom) (Figure 6). The results showed that the specimens exhibited different stress–strain curves (Figure 7). This is due to the random probability distribution of solid skeleton and pore structure in a microcosmic scale.
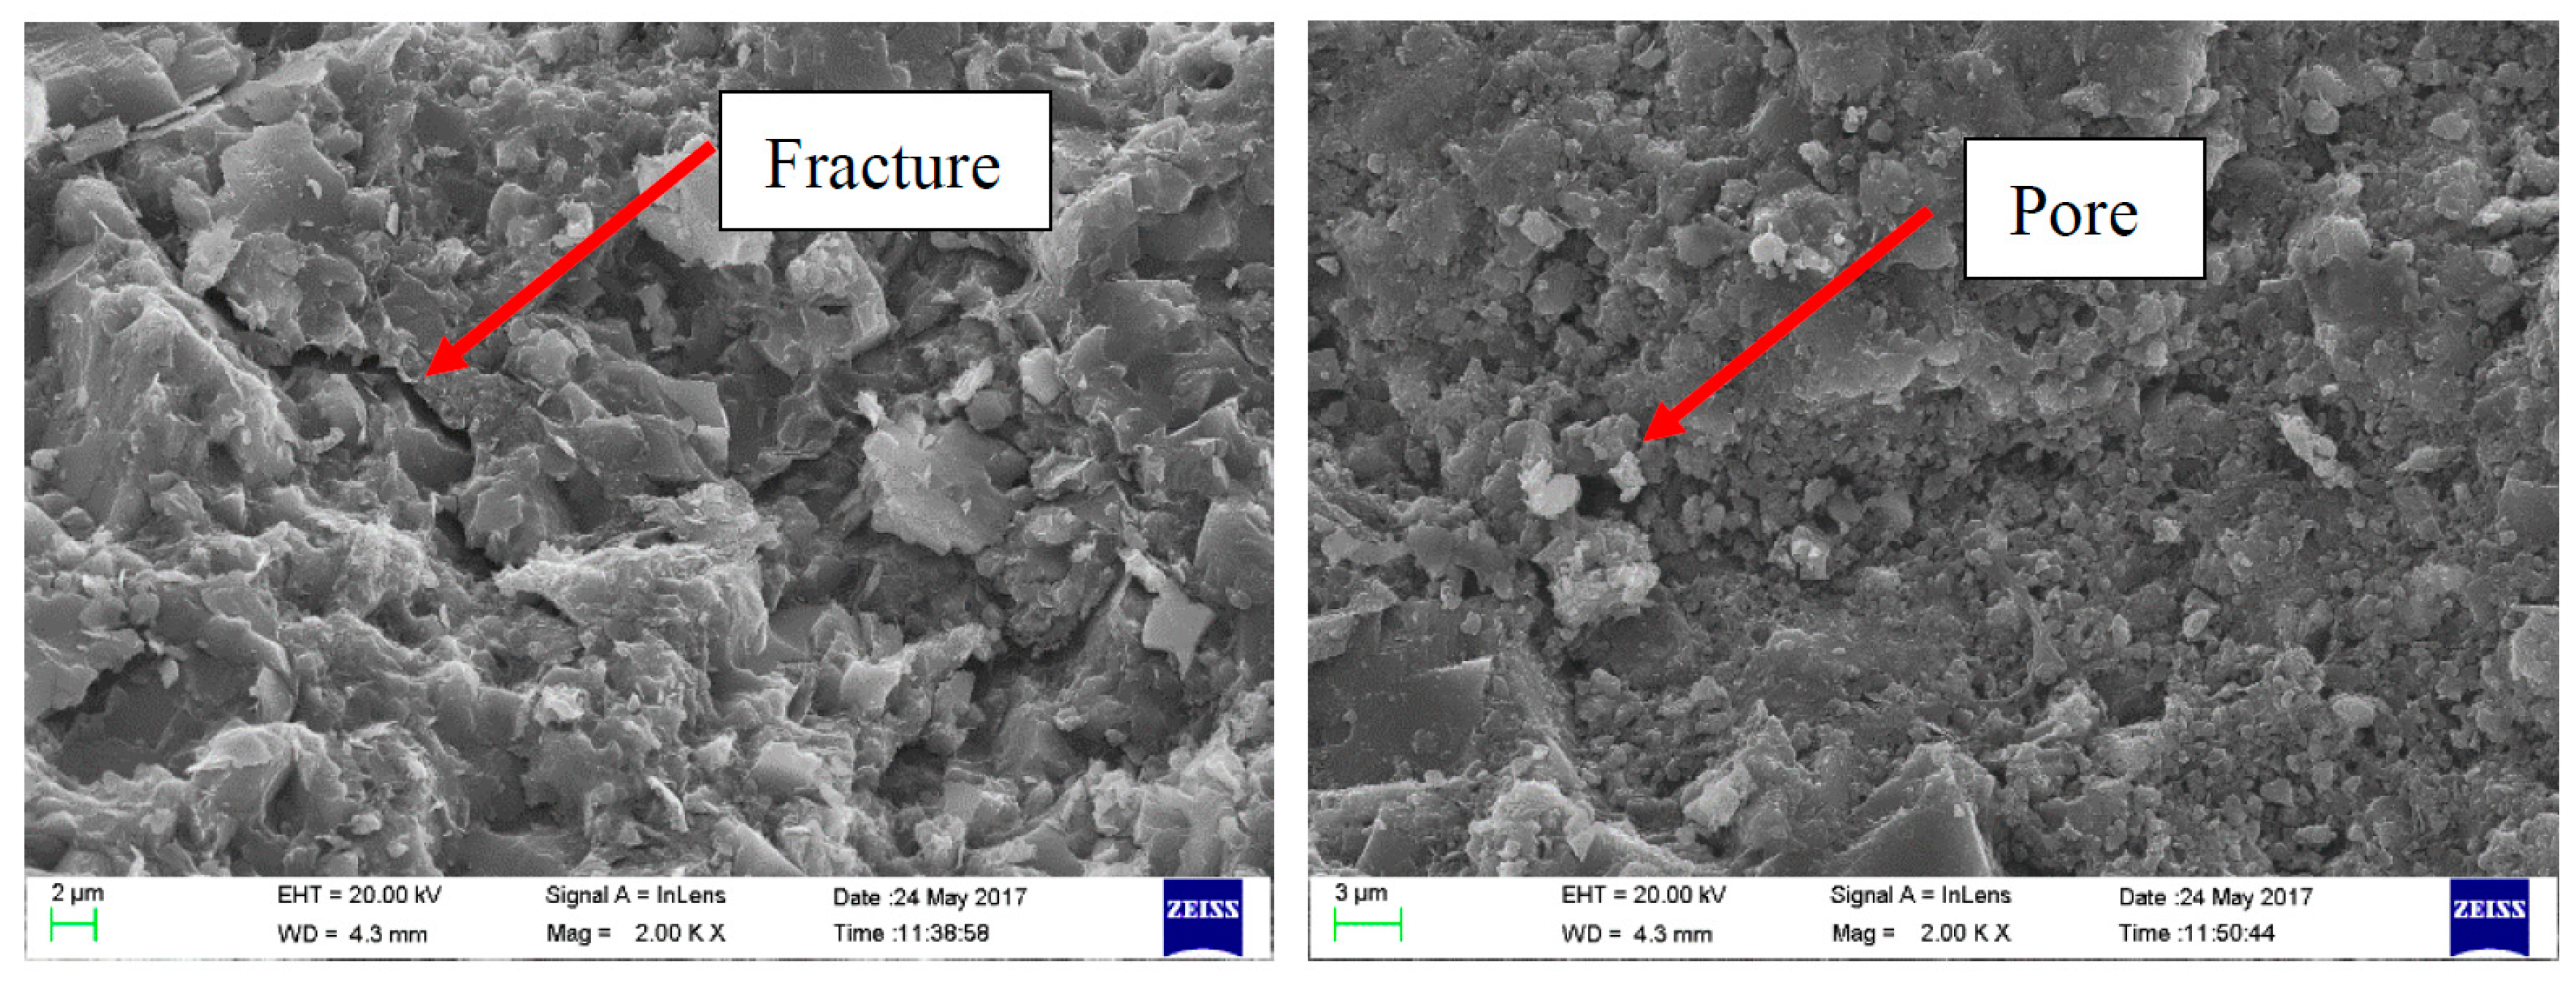
Table 1 presents a comparison of five different parameters. It can be seen that the material properties were different for different specimens. When the specimen was magnified 500 times using Scanning Electron Microscope (SEM) (Figure 8), many fractures and pores were observed. Due to different distributions of fractures and pores in the shale rock, the stress–strain curves obtained on the macroscopic scale were also different. This means that the characteristic of inhomogeneous mechanism should be considered while constructing the simulation model.
3.3.2. Shale Rock Model with User-Defined Constitutive
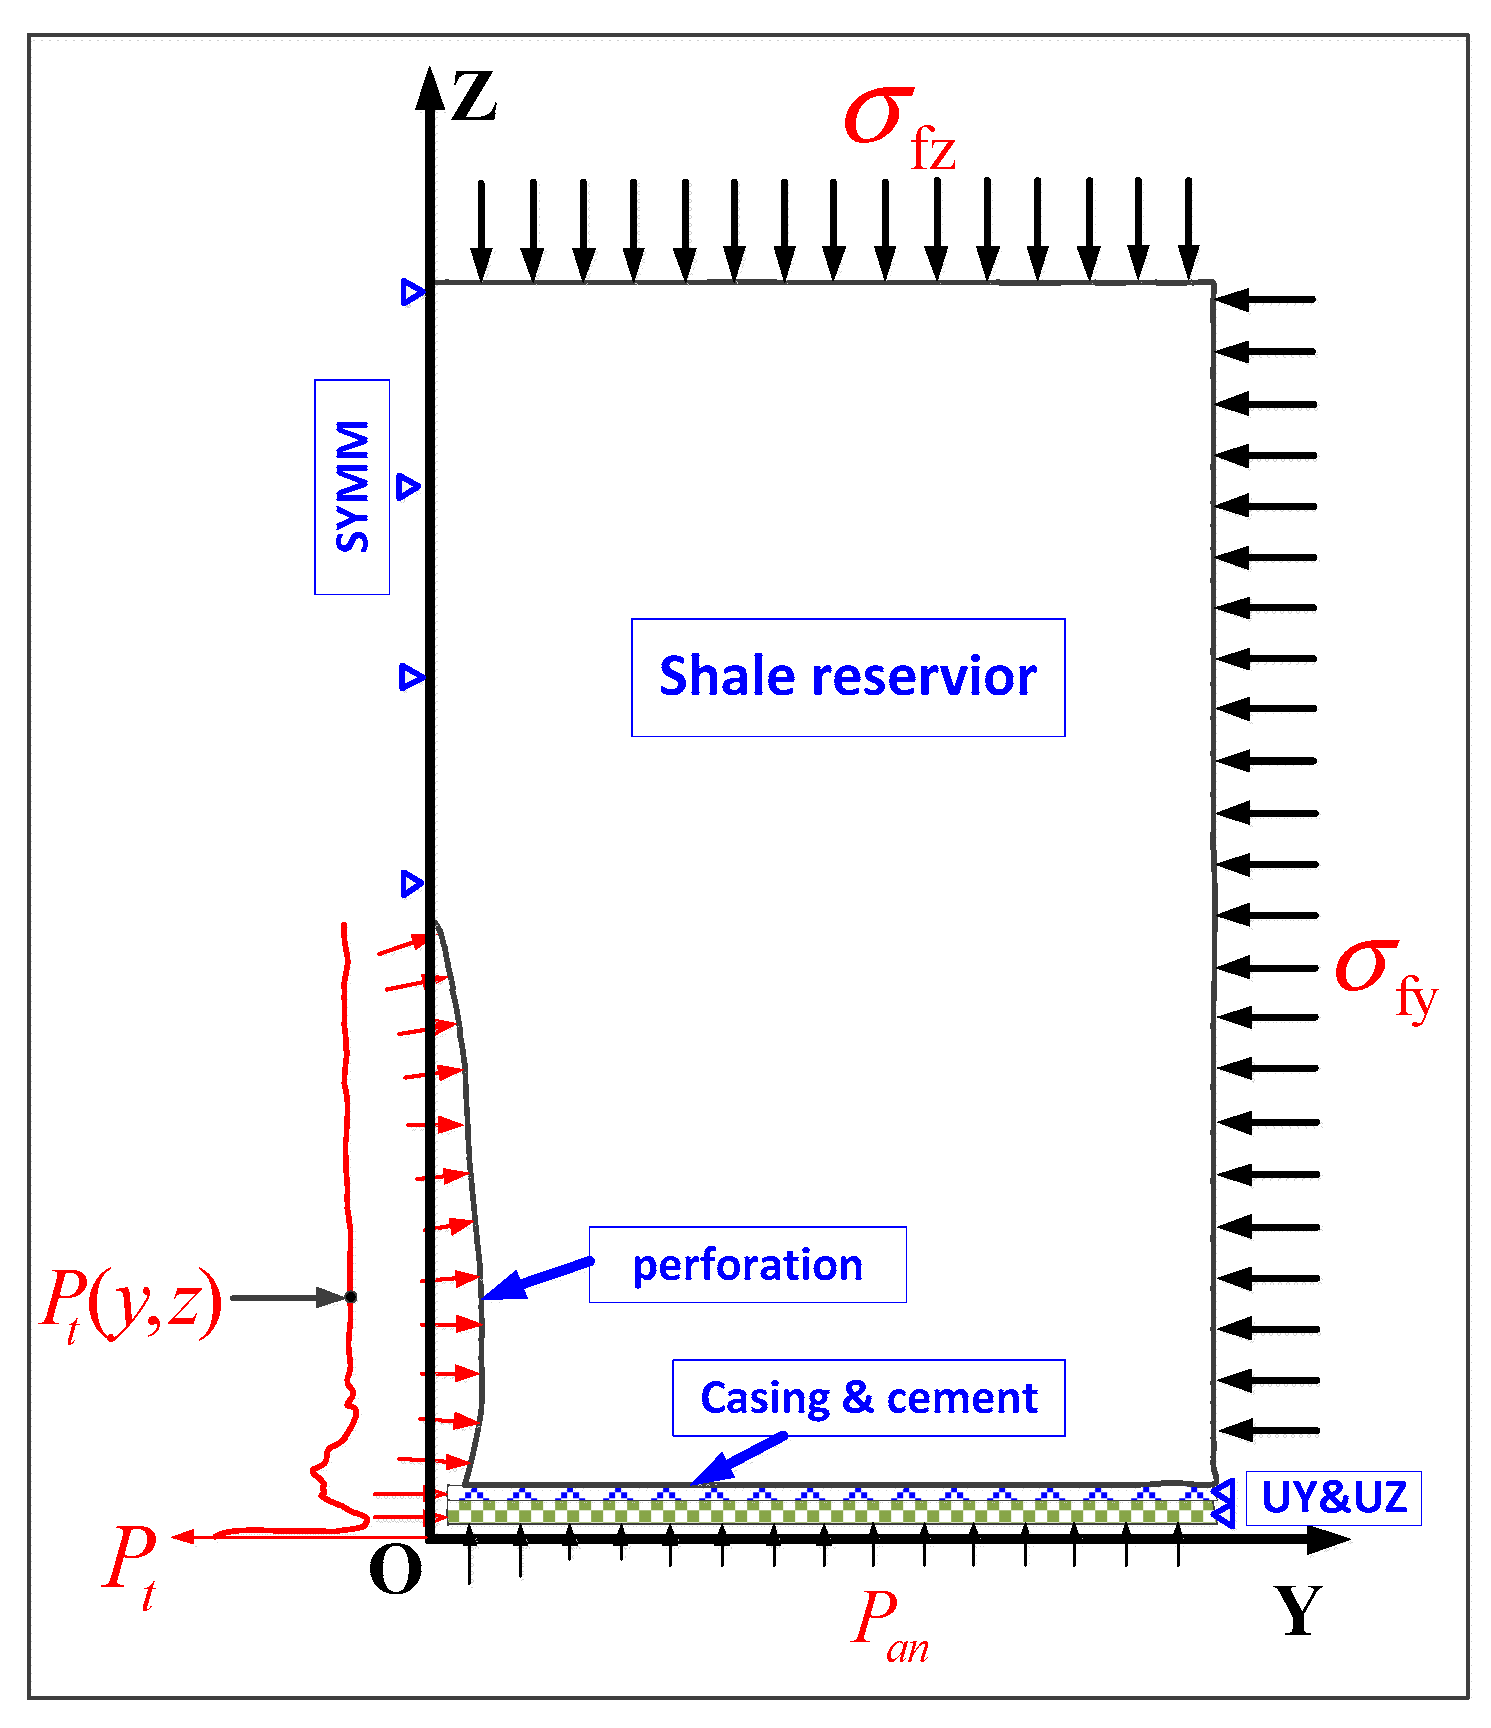
To accurately simulate the stress field and the crack initiation, 2-D finite element model of shale rock was established (Figure 9). There was in situ stress around the model, which was represented as and . Due to strong turbulence in the mixing layer, the total pressure on most of the FSI boundary was different at different positions. Therefore, in the perforation tunnel, the non-uniform pressure load was applied by the SC-CO2 jet. The total pressure on the perforation wall was loaded in two-step solutions. According to fluid mechanics, the total pressure is defined according to Equation (6).
In the perforation tunnel, there was a stagnation region, where the velocity of SC-CO2 was reduced to 0 m/s. In this paper, the perforation pressure on the FSI boundary in the stagnation region was denoted as , and was defined as the perforation pressure. The perforation pressure for an arbitrary point on the boundary was given by . The SC-CO2 jet core disappeared in the perforation, and the pressure was boosted.
The displacement constraints in the y and z directions were applied on the boundary of casing and cement. As the inhomogeneous properties were observed in the experiments, it is necessary to choose the material model that is similar to that of the real rock. It is believed that the probability distribution of rock properties was similar to that of the real rock. It was found that the Weibull probability distribution contributed to a better simulation of the mechanical properties of rock. Therefore, the tangent modulus of shale rock had the following Weibull probability distribution.
where is the tangent modulus of shale rock, is the average tangent modulus of shale rock, which prevents from becoming equal to 0, is a random number generated by the computer, is a non-uniform parameter that characterizes the magnitude of the random selection of sample values, and is the scaling parameter, which represents the average of the random numbers.
ADINA software provided an excellent secondary developed interface to explore the user-defined constitutive. Equation (7) was added to the constitutive code before the simulation started. Each element in the shale rock was assigned a random tangent modulus, which obeyed the Weibull probability distribution, as shown in Figure 10.
3.3.3. User-Coded Material Failure Criterion
Recent studies have indicated that most cracks were generated by the tensile stress in the hydraulic fracture. This means that the tensile stress failure criterion would be better suited for hydro-jet fracture simulation. Considering the anisotropic failure stress, several specimens were tested to obtain the tensile stress values in different bedding directions. Combined with the ADINA user-coded, a new material failure criterion for shale rock was proposed and is given by Equation (8).
where is the x-directional stress in the shale rock, is the failure tensile stress in the z-direction, is the y-directional stress in the shale rock, and is the failure tensile stress in the y-direction. In addition, RA is the control parameter of element failure in ADINA. It is noted that the represents the z-directional principal stress (z-directional stress) in ADINA, which is equivalent to . In the ADINA software, if R equals to 1, then the element will fail and be removed from the model. The fracture initiation will be found after the element failure in the simulation results.
3.4. Simulation Setup
The factors affecting the perforation tunnel pressurization and the fracture initiation were analyzed. Simulations were conducted based upon the values presented in Table 2 to discuss the influence of various factors. The basic case was defined as follows.
For the SC-CO2 jet model, the jet inlet pressure was 20 MPa, and the ambient pressure was 10 MPa. The nozzle outlet length was 2 mm. In addition, the nozzle outlet radius was 1 mm, and the nozzle-to-casing inlet radius ratio (aperture ratio) was 2/3. The fluid used was SC-CO2, and the PR equation of state was used for calculations.
For the shale rock model, the perforation pressure was 20 MPa, while the in situ stress values were 8 and 10 MPa, respectively. Additionally, α was 3, and β had the value of 1.6. The initial tangent modulus was 14 GPa, while the original elastic modulus () was 30 GPa. Furthermore, the average elastic modulus was 6 GPa, and the Poisson’s ratio was 0.22.
4. Results and Discussion
4.1. Flow Field and Stress Filed
4.1.1. Flow Field and Stress Filed before Fracture Initiation
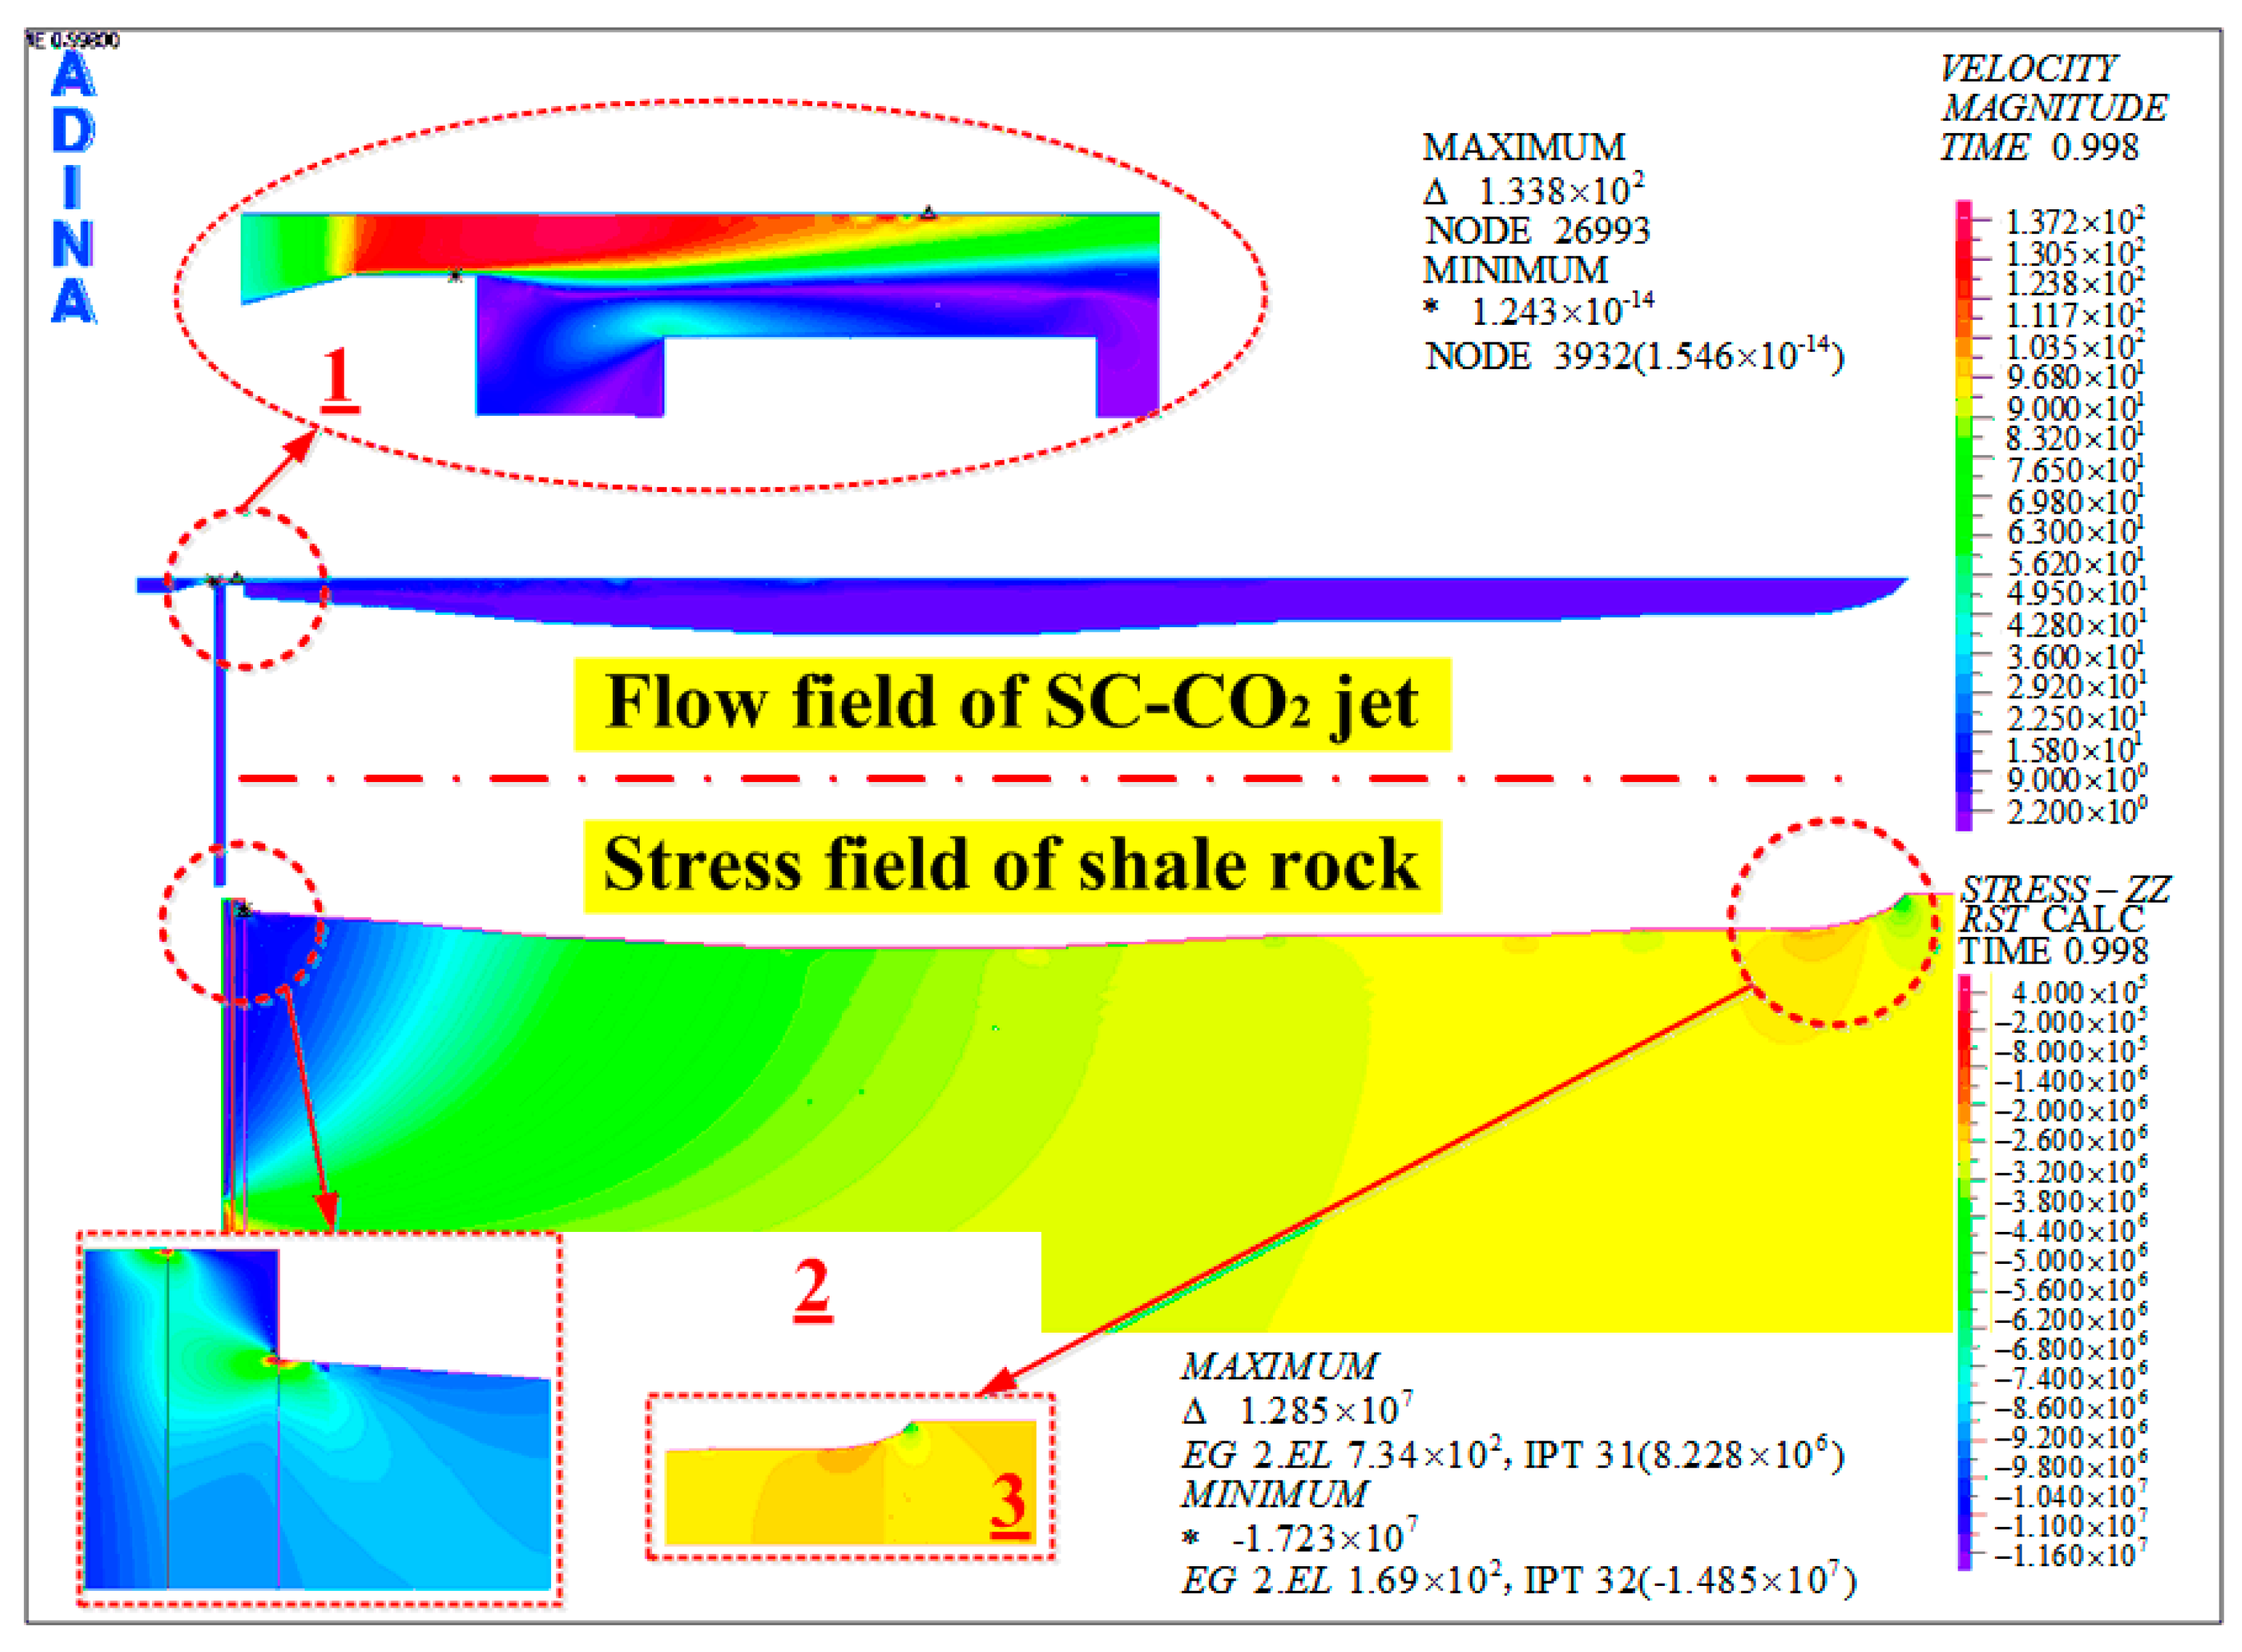
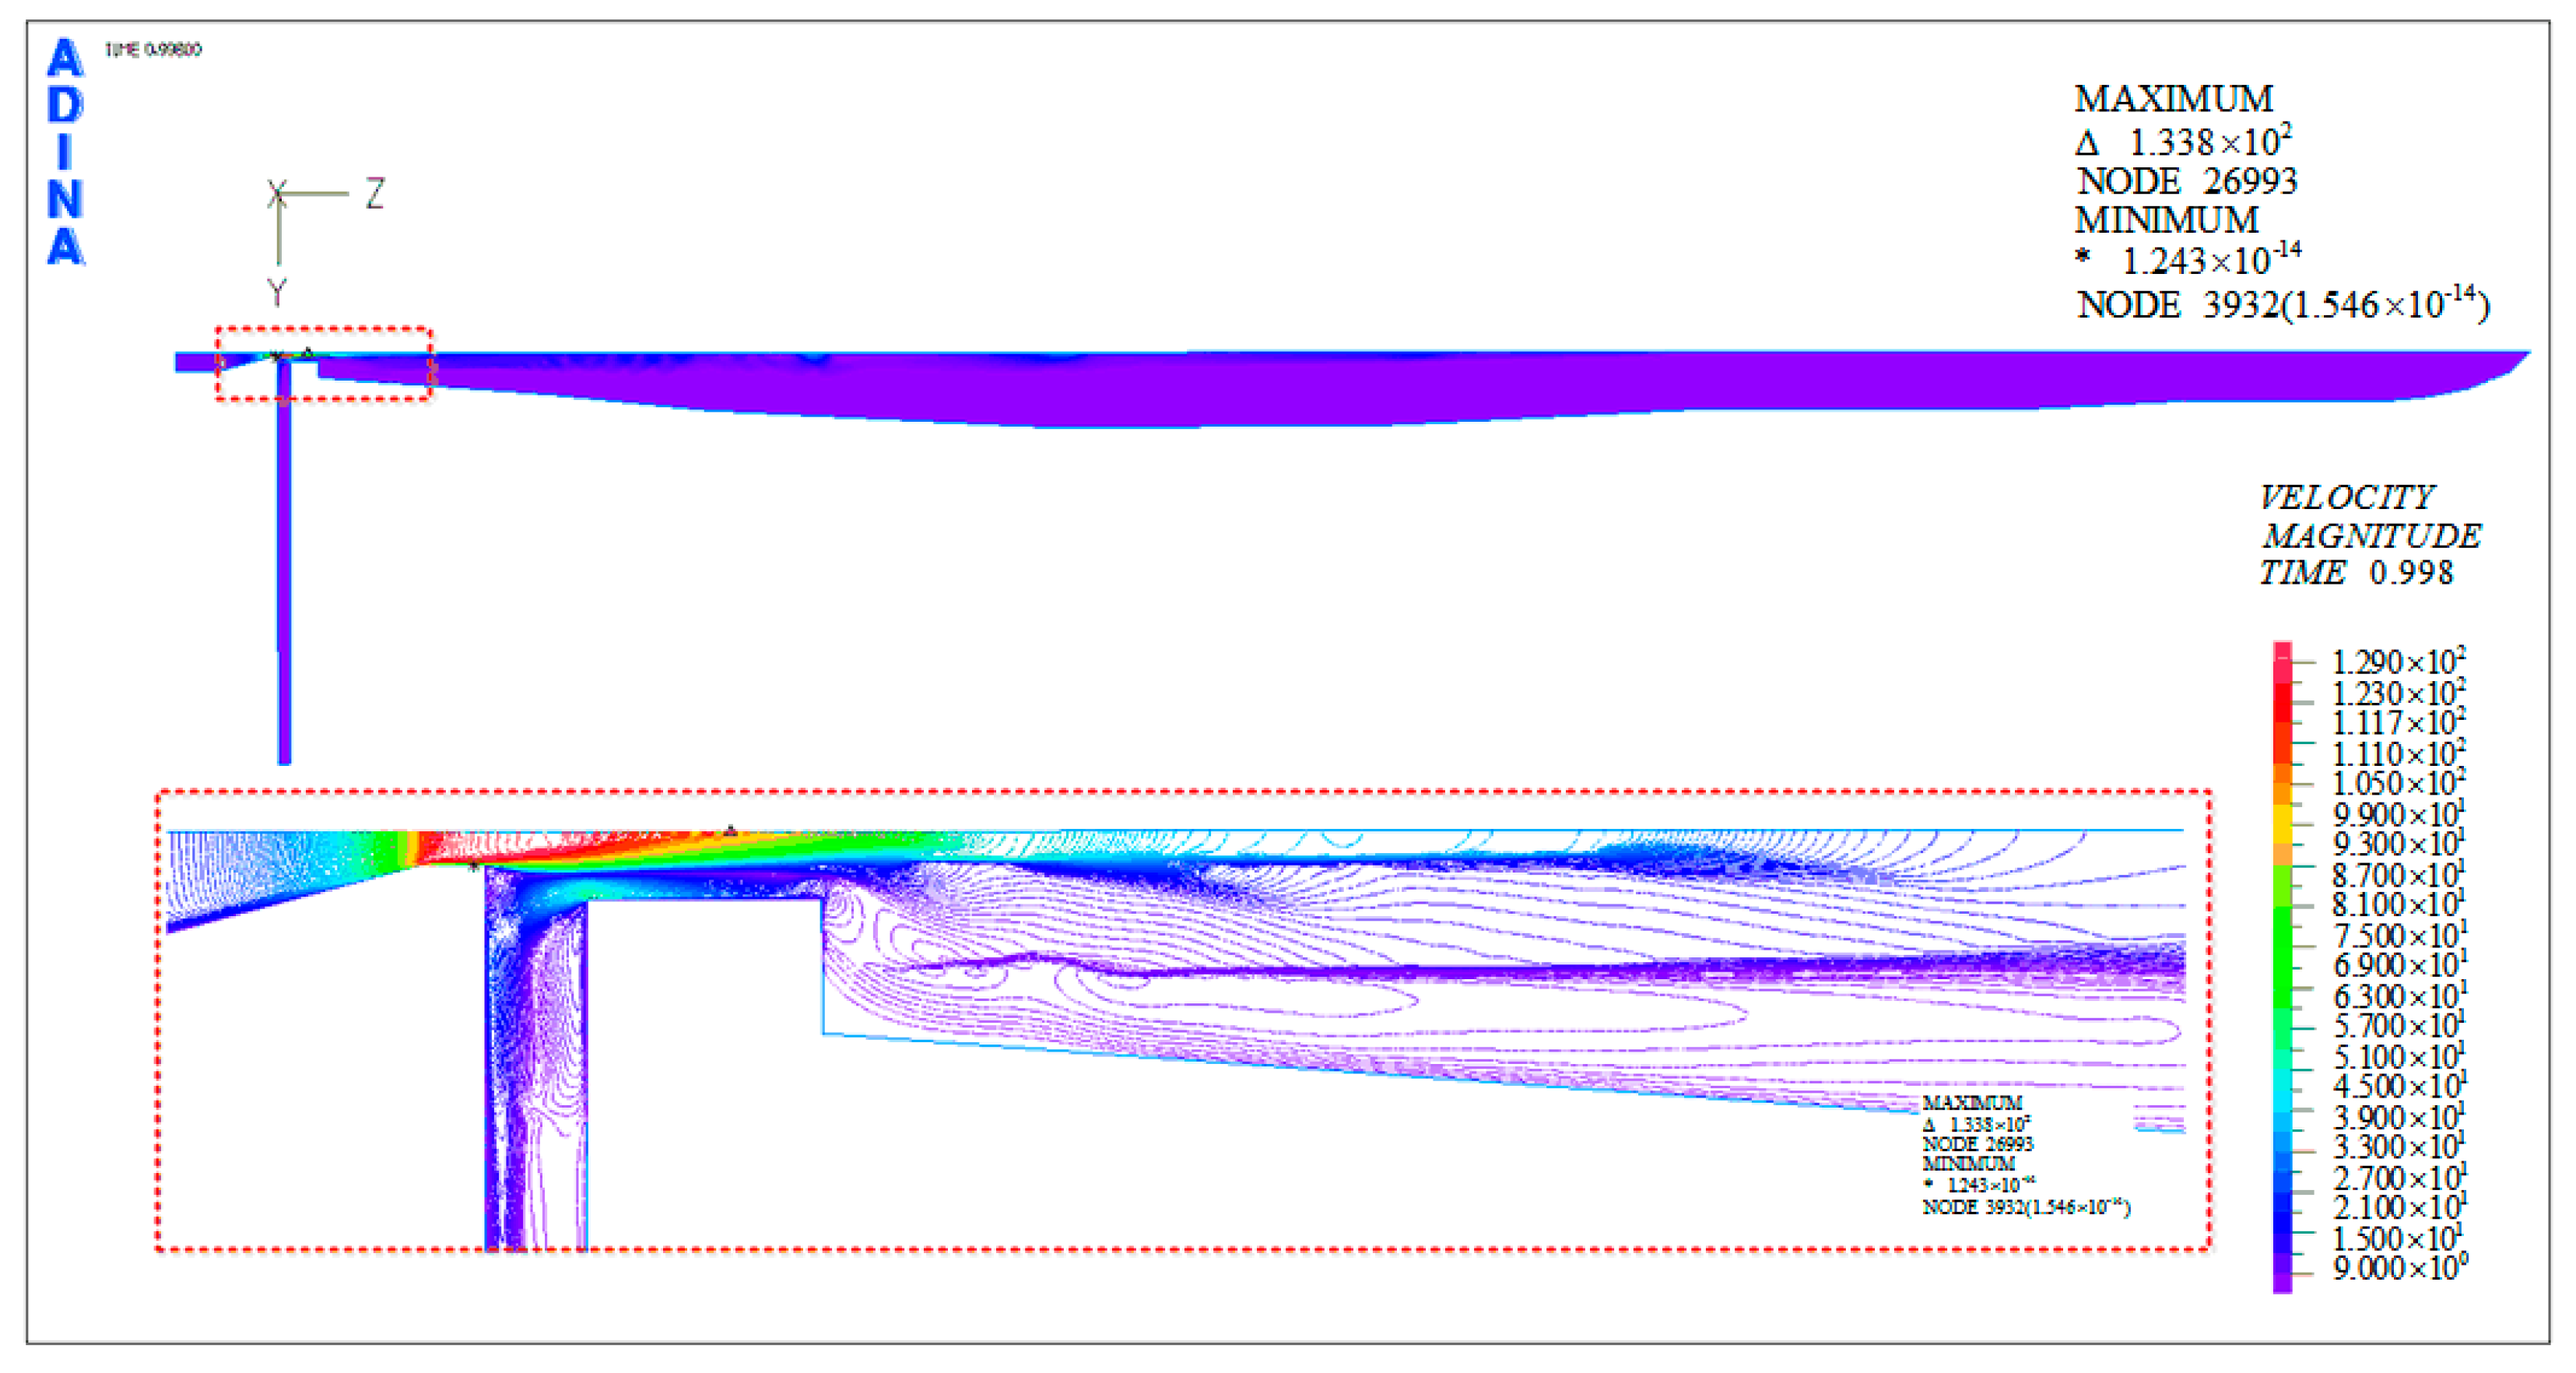
After the solution, the flow field and the stress field before the initiation of fracture were obtained, and are shown in Figure 11. Three distinct features can be observed in Figure 11. Firstly, the SC-CO2 jet velocity is shown, whereas the core of the jet velocity was at the end in the section of cement. At the end of the velocity core, discontinuity in the velocity occurred, which was due to the shock waves. Secondly, the extreme tensile stress appeared when the SC-CO2 jet was pressurized in the perforation tunnel. The discontinuity of the structure and the material resulted in extreme values of the tensile stress in the root of the perforation tunnel. Thirdly, the tensile stress concentration contributed to the fracture initiation and propagation. Many researchers have previously reported on the principle of tip fracture initiation.
However, even the inhomogeneous properties of shale rock played an important role in the fracture initiation, the SC-CO2 hydro-jet was the key in improving the inner pressure, which contributed to the rock’s tensile stress field. The pressurization process affected the stress field of the casing, cement, and shale rock. As shown in Figure 12, this was due to the strongly turbulent velocity of SC-CO2, which was different from that of the water jet. On the FSI boundary, pressure and velocity exhibited nonlinear changes. This nonlinear distribution on the FSI boundary influenced the stress field in shale rock, which led to fracture initiation at different positions.
Figure 9 also shows the phenomenon of the “hydraulic-fracturing ring”. Due to the high velocity of the SC-CO2 jet core, the fluid in the annular was carried into the perforation tunnel. Closed to the inlet of the perforation, higher velocity led to a zone of negative pressure, which was beneficial in securing the reservoir from damage. This would also be better for casing, which will not bear a larger pressure during hydro-jet fracturing. Inside the perforation tunnel, the SC-CO2 jet continuously expanded and boosted the perforation pressure. The strong turbulence occurred in the mixing layer of SC-CO2 jet and led to non-uniform distribution of the perforation pressure on the FSI boundary.
4.1.2. Stress Field after Fracture Initiation
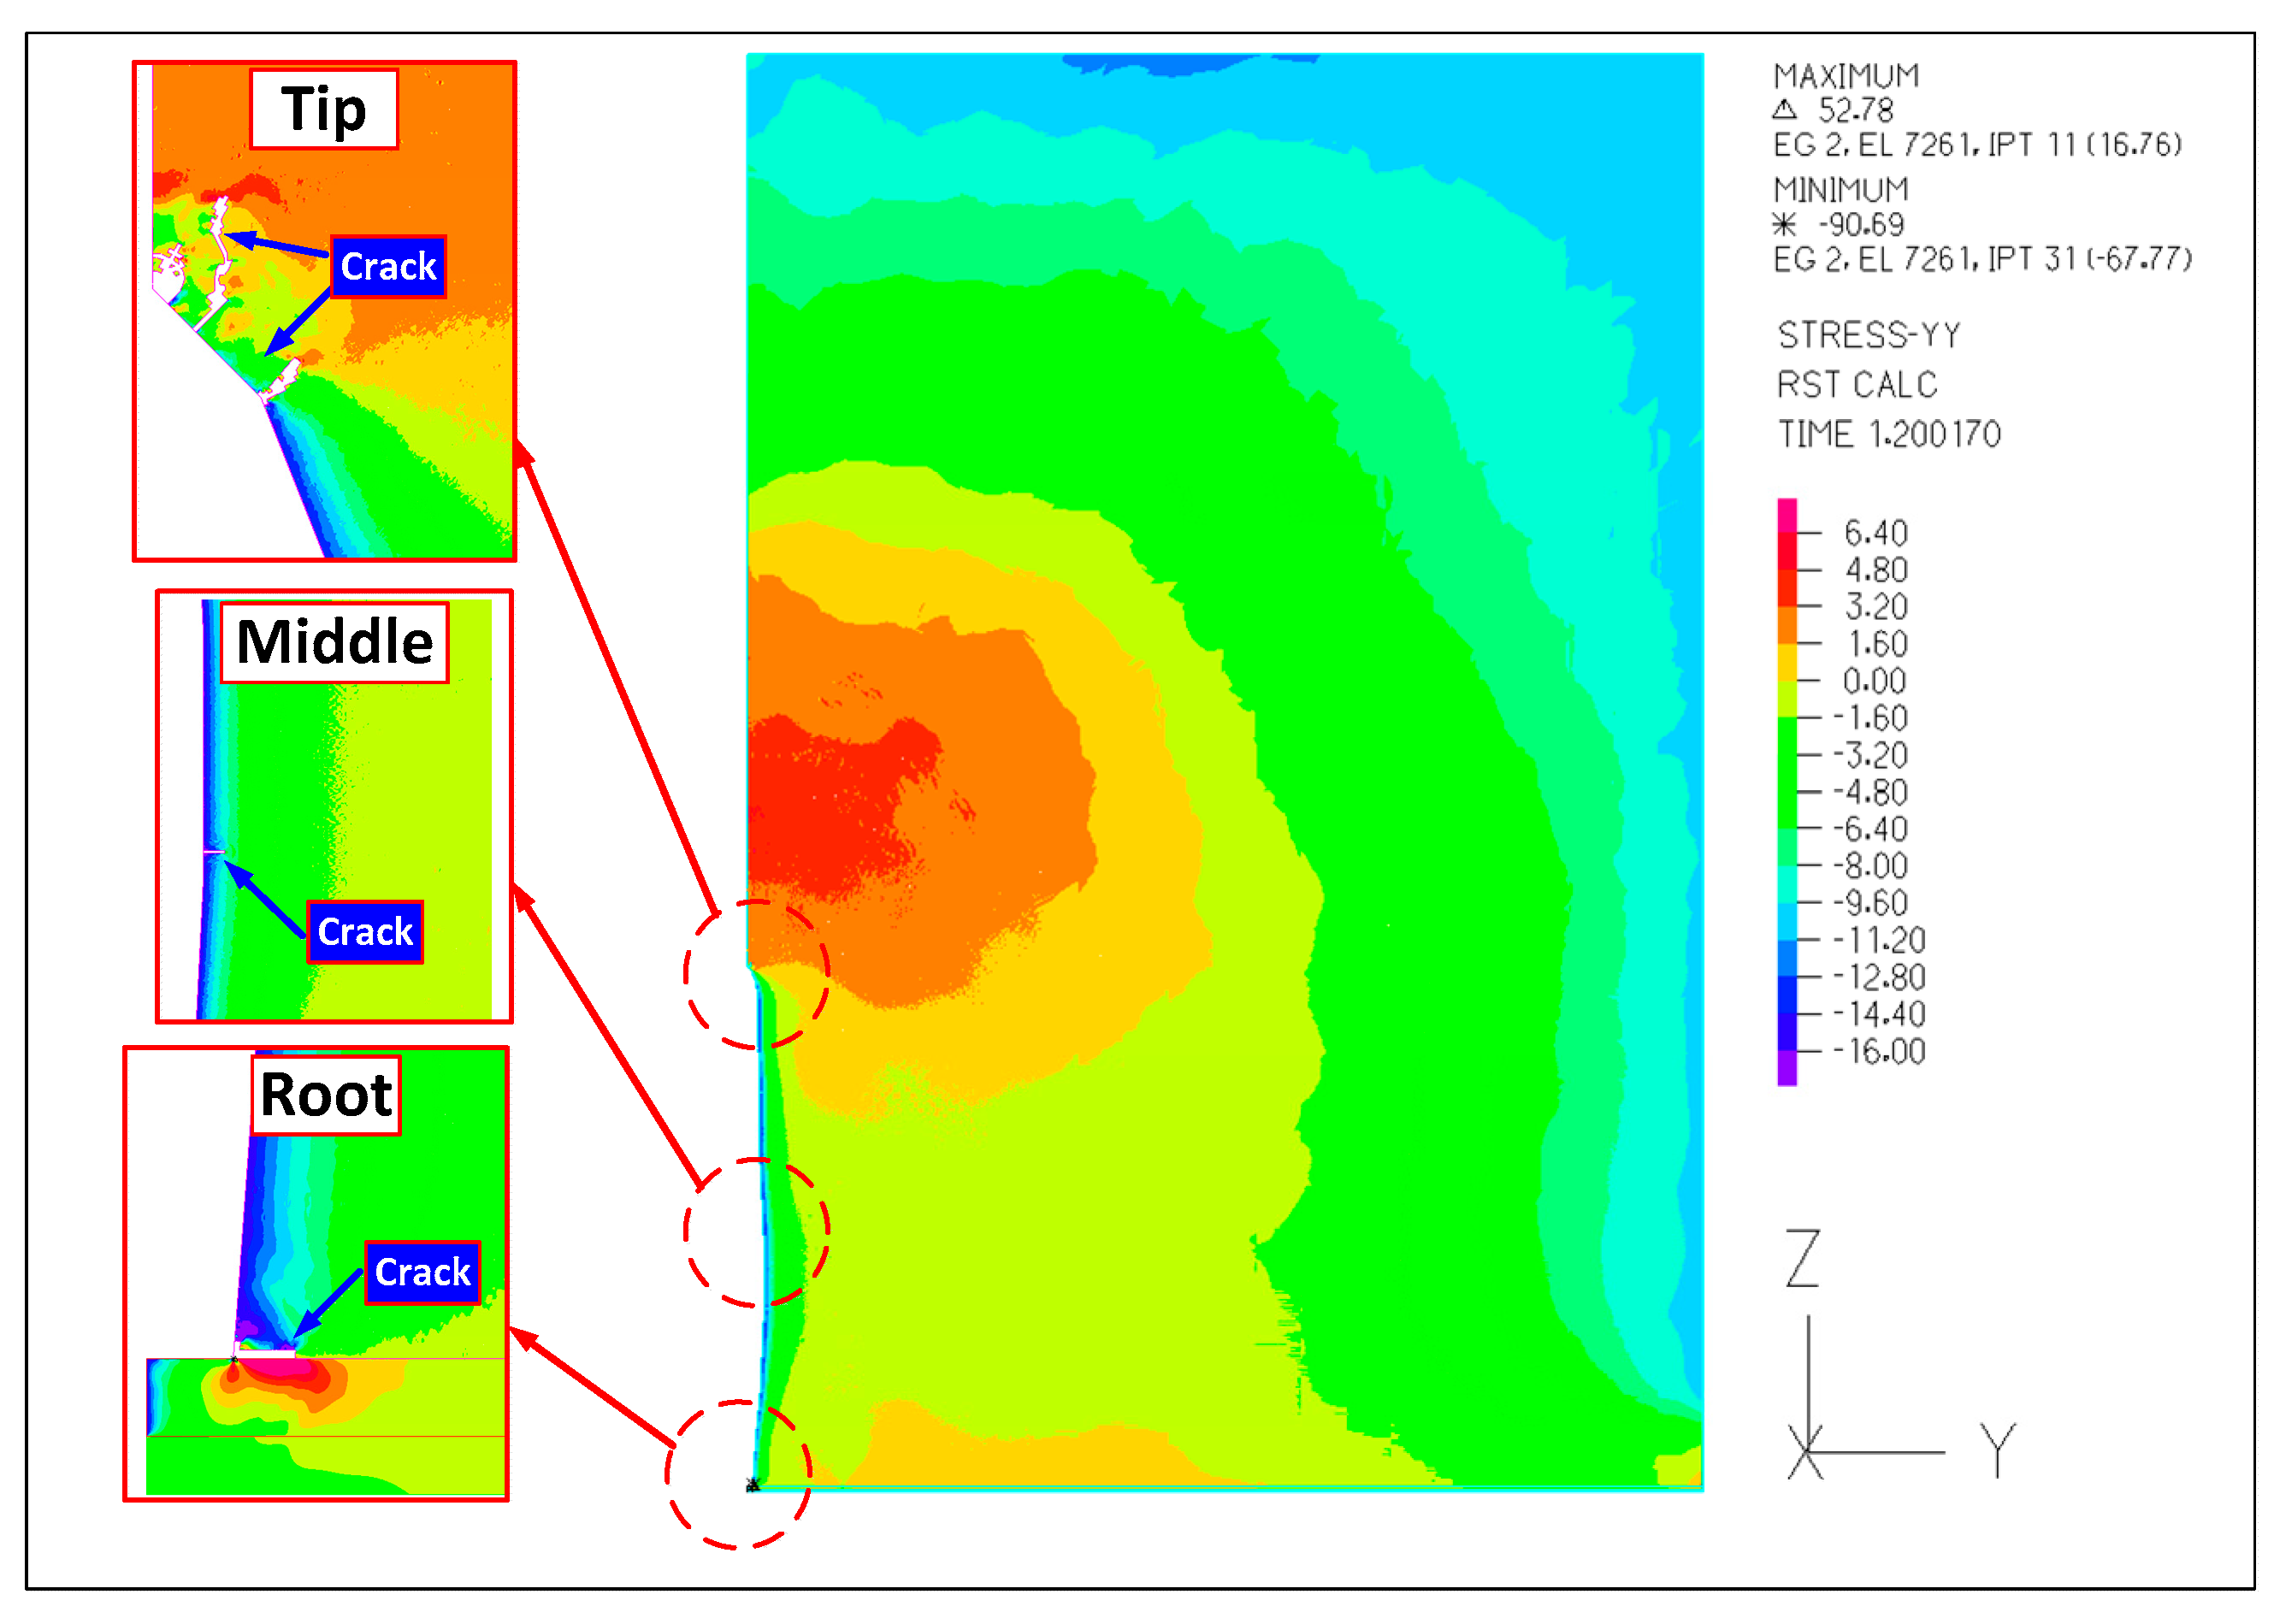
After the first step of simulation, the FSI code was executed, and the shale rock was studied using the restart solution. The element failure criterion was activated, and some elements were removed as the tensile stress reached the failure tensile stress. As shown in Figure 13, under the load of perforation pressure and in situ stress, the fracture can easily be generated at three locations. These locations are the root, the middle, and the tip of the perforation.
There are different mechanisms of crack initiation in the three different positions of the perforation. Cracks were observed in both the root and the tip, but only one crack was observed in the middle of the perforation. It was noted that the root of the perforation was different from the others because it was the interface between the shale rock and the cement. Additionally, the length of the crack in the root was greater than the others. This is due to the material discontinuity and structure discontinuity between the cement and the rock. While comparing the cracks at three locations, it was found that there were more cracks in the tip. In the previous results of other scholars, there are many methods and models to demonstrate the crack initiation, including fracture criterion [24], stress distribution [25,26], and so on.
The stress distribution dominated the crack initiation, led to different lengths and styles of crack. Even though the shale was compressed by both in-situ stress and internal pressure, there was tensile stress region in the shale. The tensile stress contributes to crack initiation. In Figure 14, the stress distribution in the y-direction is listed in the first row, while that in the z-direction is listed in the second row. In the tip, it was found that the tensile stress in the y-direction was distributed in front of the crack tip. This means that the stress in the y-direction controlled the crack initiation and propagation of the tip, while the SC-CO2 jet was in the perforation. However, in the middle and the root of the perforation, the maximum tensile stress in the z-direction was generated in front of the crack tip. Therefore, it was concluded that the stress in the z-direction controlled the crack initiation. On the surface of the perforation tunnel, the rock was compressed by internal pressure, so the extreme tensile stress was locally formed under the influence of both in situ stress and internal pressure. Furthermore, irregular perforation profiles and inhomogeneous rock properties also contributed to fracture initiation. At the end of the perforation, the stress concentration at the tip led to the occurrence of cracks.
4.1.3. Verification of the Flow Field
To verify the accuracy of the simulation results, the proposed model was used to simulate the experimental case. The jet inlet pressure was set at 15 MPa, and the ambient pressure was set to be 10 MPa, parameters also used for nozzle and perforation structures [13]. The length-to-nozzle diameter ratio was 2, while the contraction angle was 30.5°. As shown in Figure 15, when compressed SC-CO2 flowed through the nozzle section, the static pressure gradually decreased, while the fluid velocity increased significantly, indicating that the static pressure was converted to dynamic pressure. After SC-CO2 flowed through the annular and entered the perforation tunnel, static pressure increased from the minimum value in the perforation tunnel of the casing and cement section. Meanwhile, the velocity decreased sharply. These results were in accordance with those reported by He [13]. Comparing simulation results with experiments results, the tunnel pressure was 11.79 MPa by numerical simulation, and the measured tunnel pressure was 12.63 MPa. The small relative error indicated that the FSI model can accurately simulate SC-CO2 in a perforation tunnel.
4.2. Perforation Pressure
To study the influence of perforation pressure, the FSI model and the method were simulated with the same in situ stress and material properties. In some previous studies, the perforation hole was simplified to be of a cylindrical shape. Additionally, the fracture was easily initiated from the tip of the perforation. Here, the perforation hole was simplified to be of a spindle shape. Under a load of nonlinear pressure, the spindle shape exhibited a more complex stress distribution. If the stress along the z-axis exceeded 0 MPa, the stress was considered the tensile stress. Furthermore, when it increased beyond the value of failure stress, fracture initiated. It was found that the maximum tensile stress (22.8 MPa) appeared at the root of the perforation (Figure 16). The tensile stress appeared on the perforation wall at various locations. The results demonstrated that, with the increase in perforation pressure in the perforation hole, more fracture initiation became apparent. When the perforation pressure was 3 MPa, which was smaller than the in situ stress, the in situ stress determined the initiation position. When the perforation pressure exceeded the in situ stress, the region of the tensile stress shrank, and more independent initiation positions appeared.
It can be clearly seen that the tip and the root of the perforation were the most prone to fracture initiation during the SC-CO2 hydro-jet fracturing process. These results indicate that the y-directional stress contributed to the tip fracture initiation, while the z-directional stress contributed to the root fracture initiation. When the perforation pressure increased from 3 to 10 MPa, the y-directional stress increased from 1.28 to 15.19 MPa (Figure 17). This means that the perforation pressure is proportional to the tensile stress at the tip. Higher perforation pressure is conducive to easy fracture initiation at the tip. At the root of the perforation, the z-directional stress decreased sharply with the increase in the y-position (Figure 18). On the perforation’s inner wall, the z-directional stresses were 2.5, 10.81, 16.31, and 22.18 MPa for the perforation pressures of 3, 10, 15, and 20 MPa, respectively. The highest tensile stress was 10 times larger than the smallest tensile stress at the root of the perforation. However, with the increase in the y-position, the z-directional stress decreased below 0 MPa, which prevented fracture propagation and hence protected the oil well cement from getting damaged.
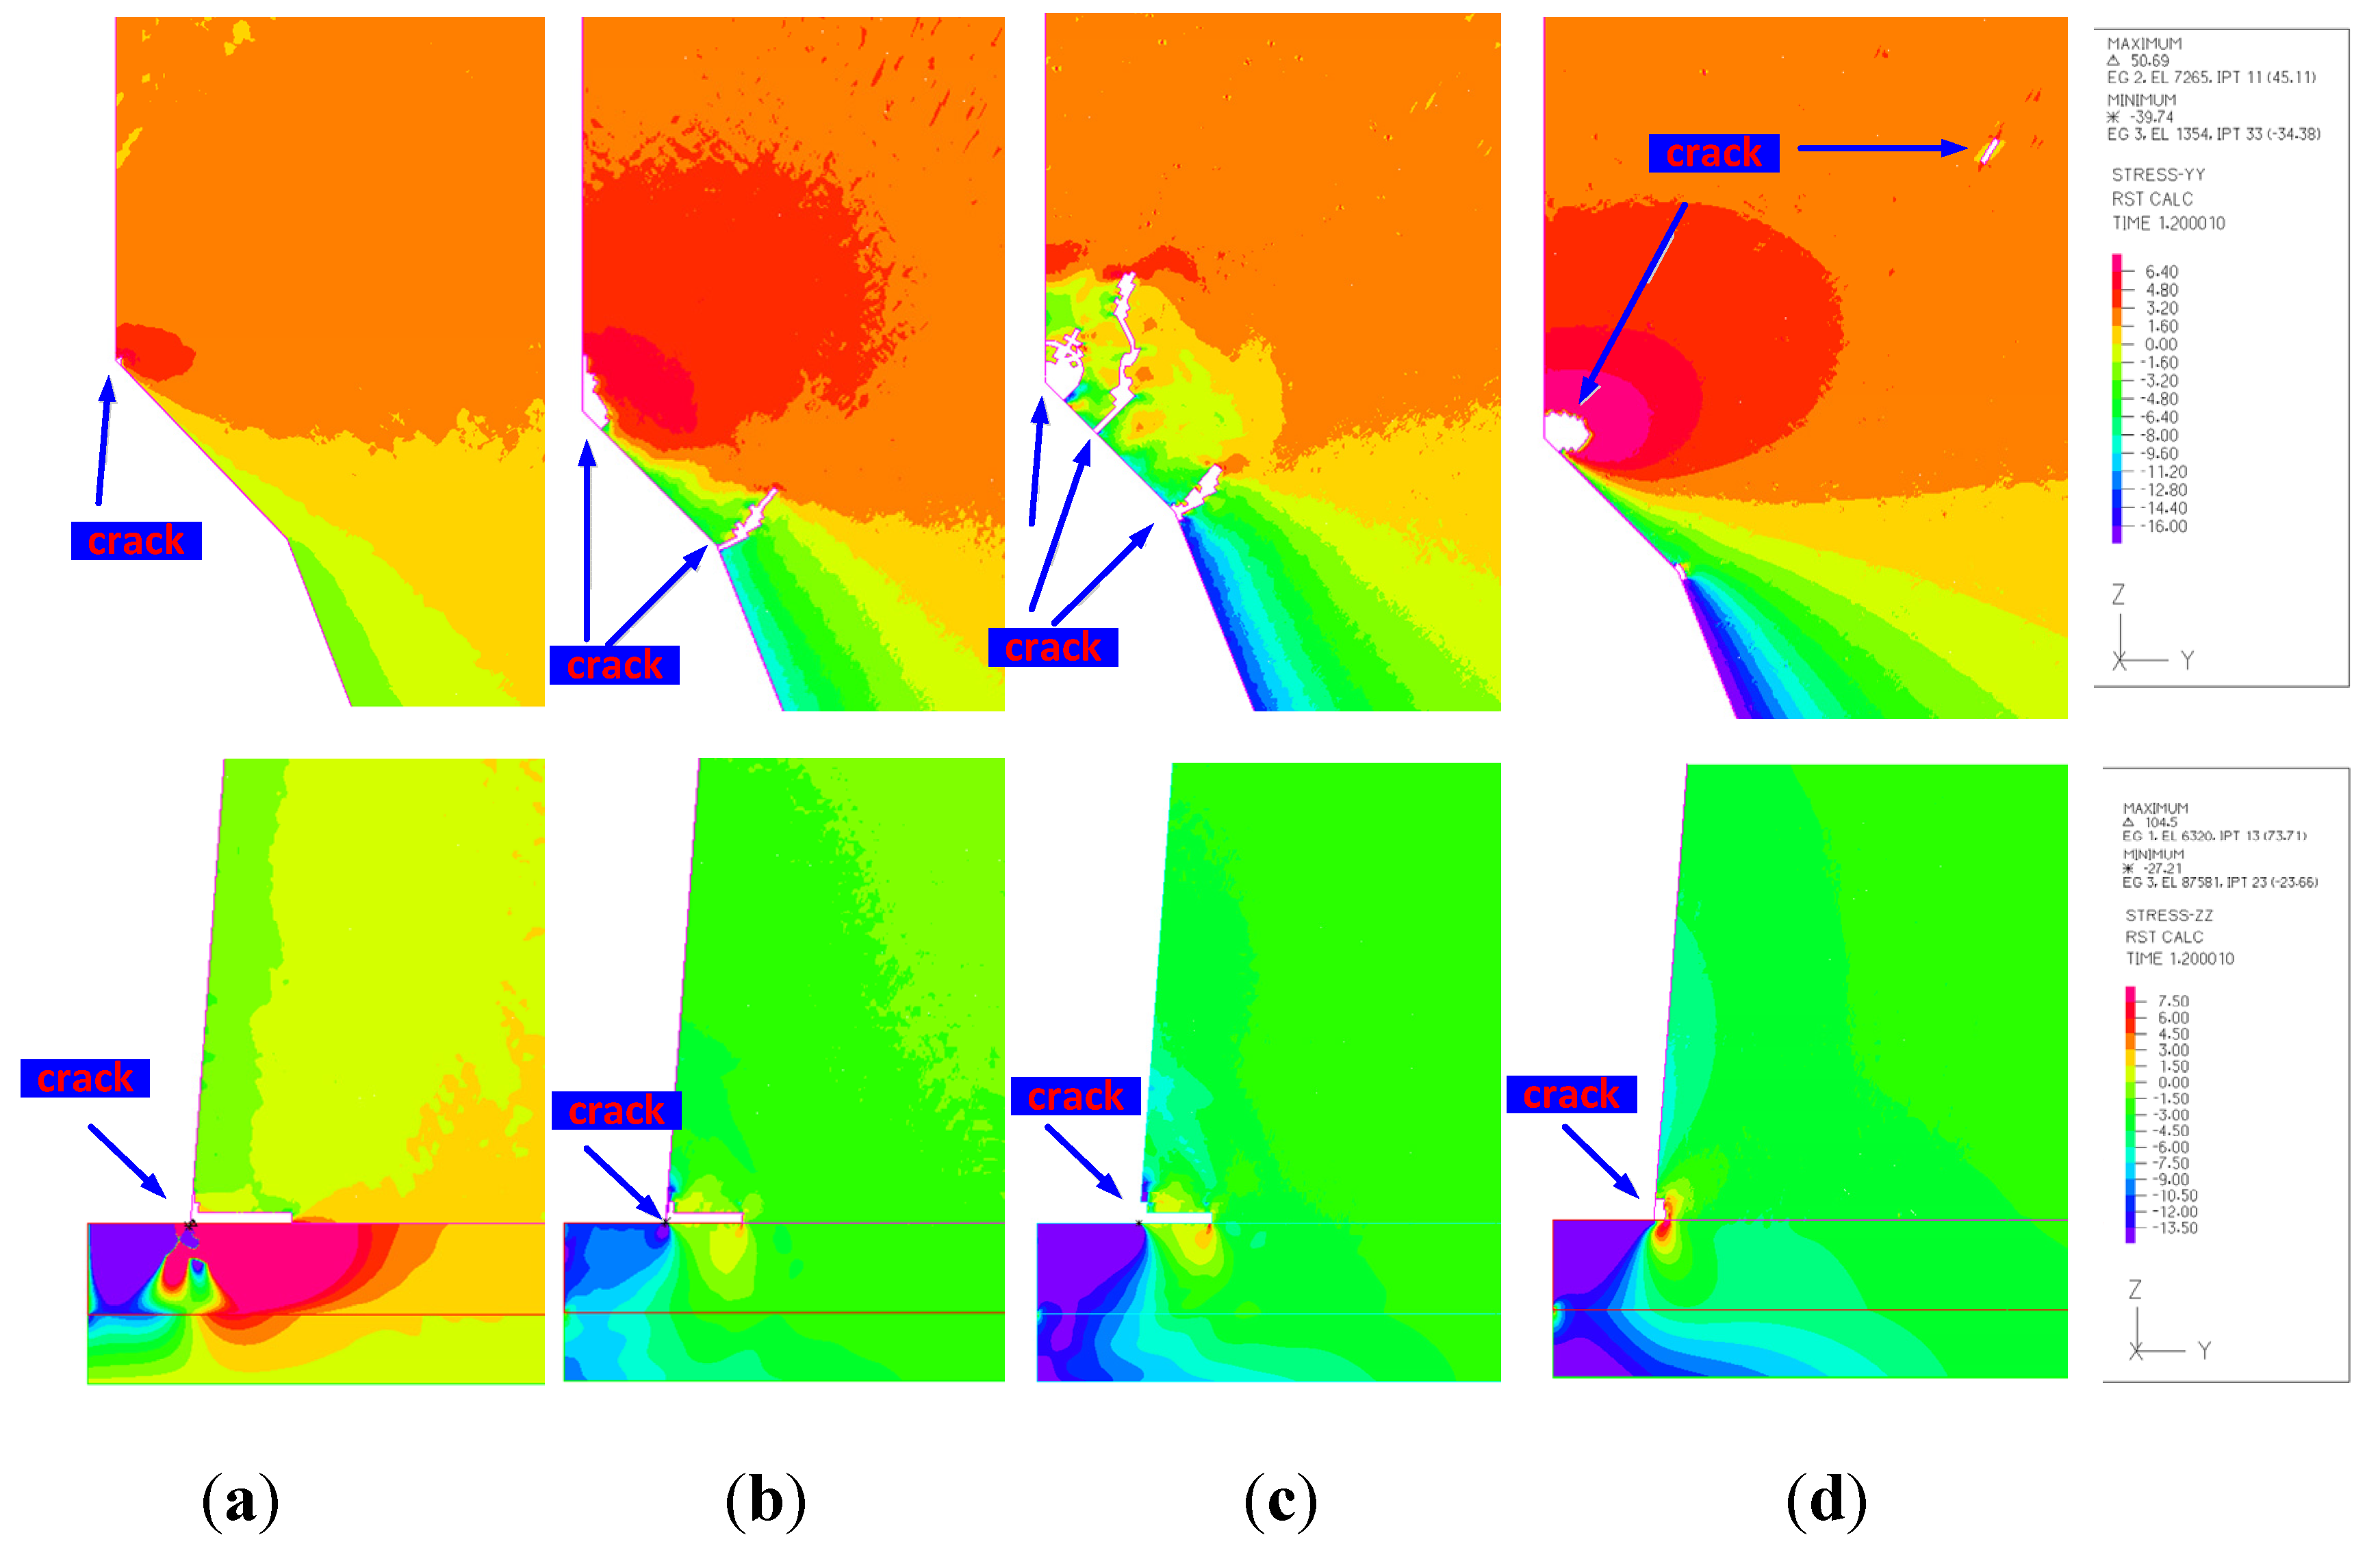
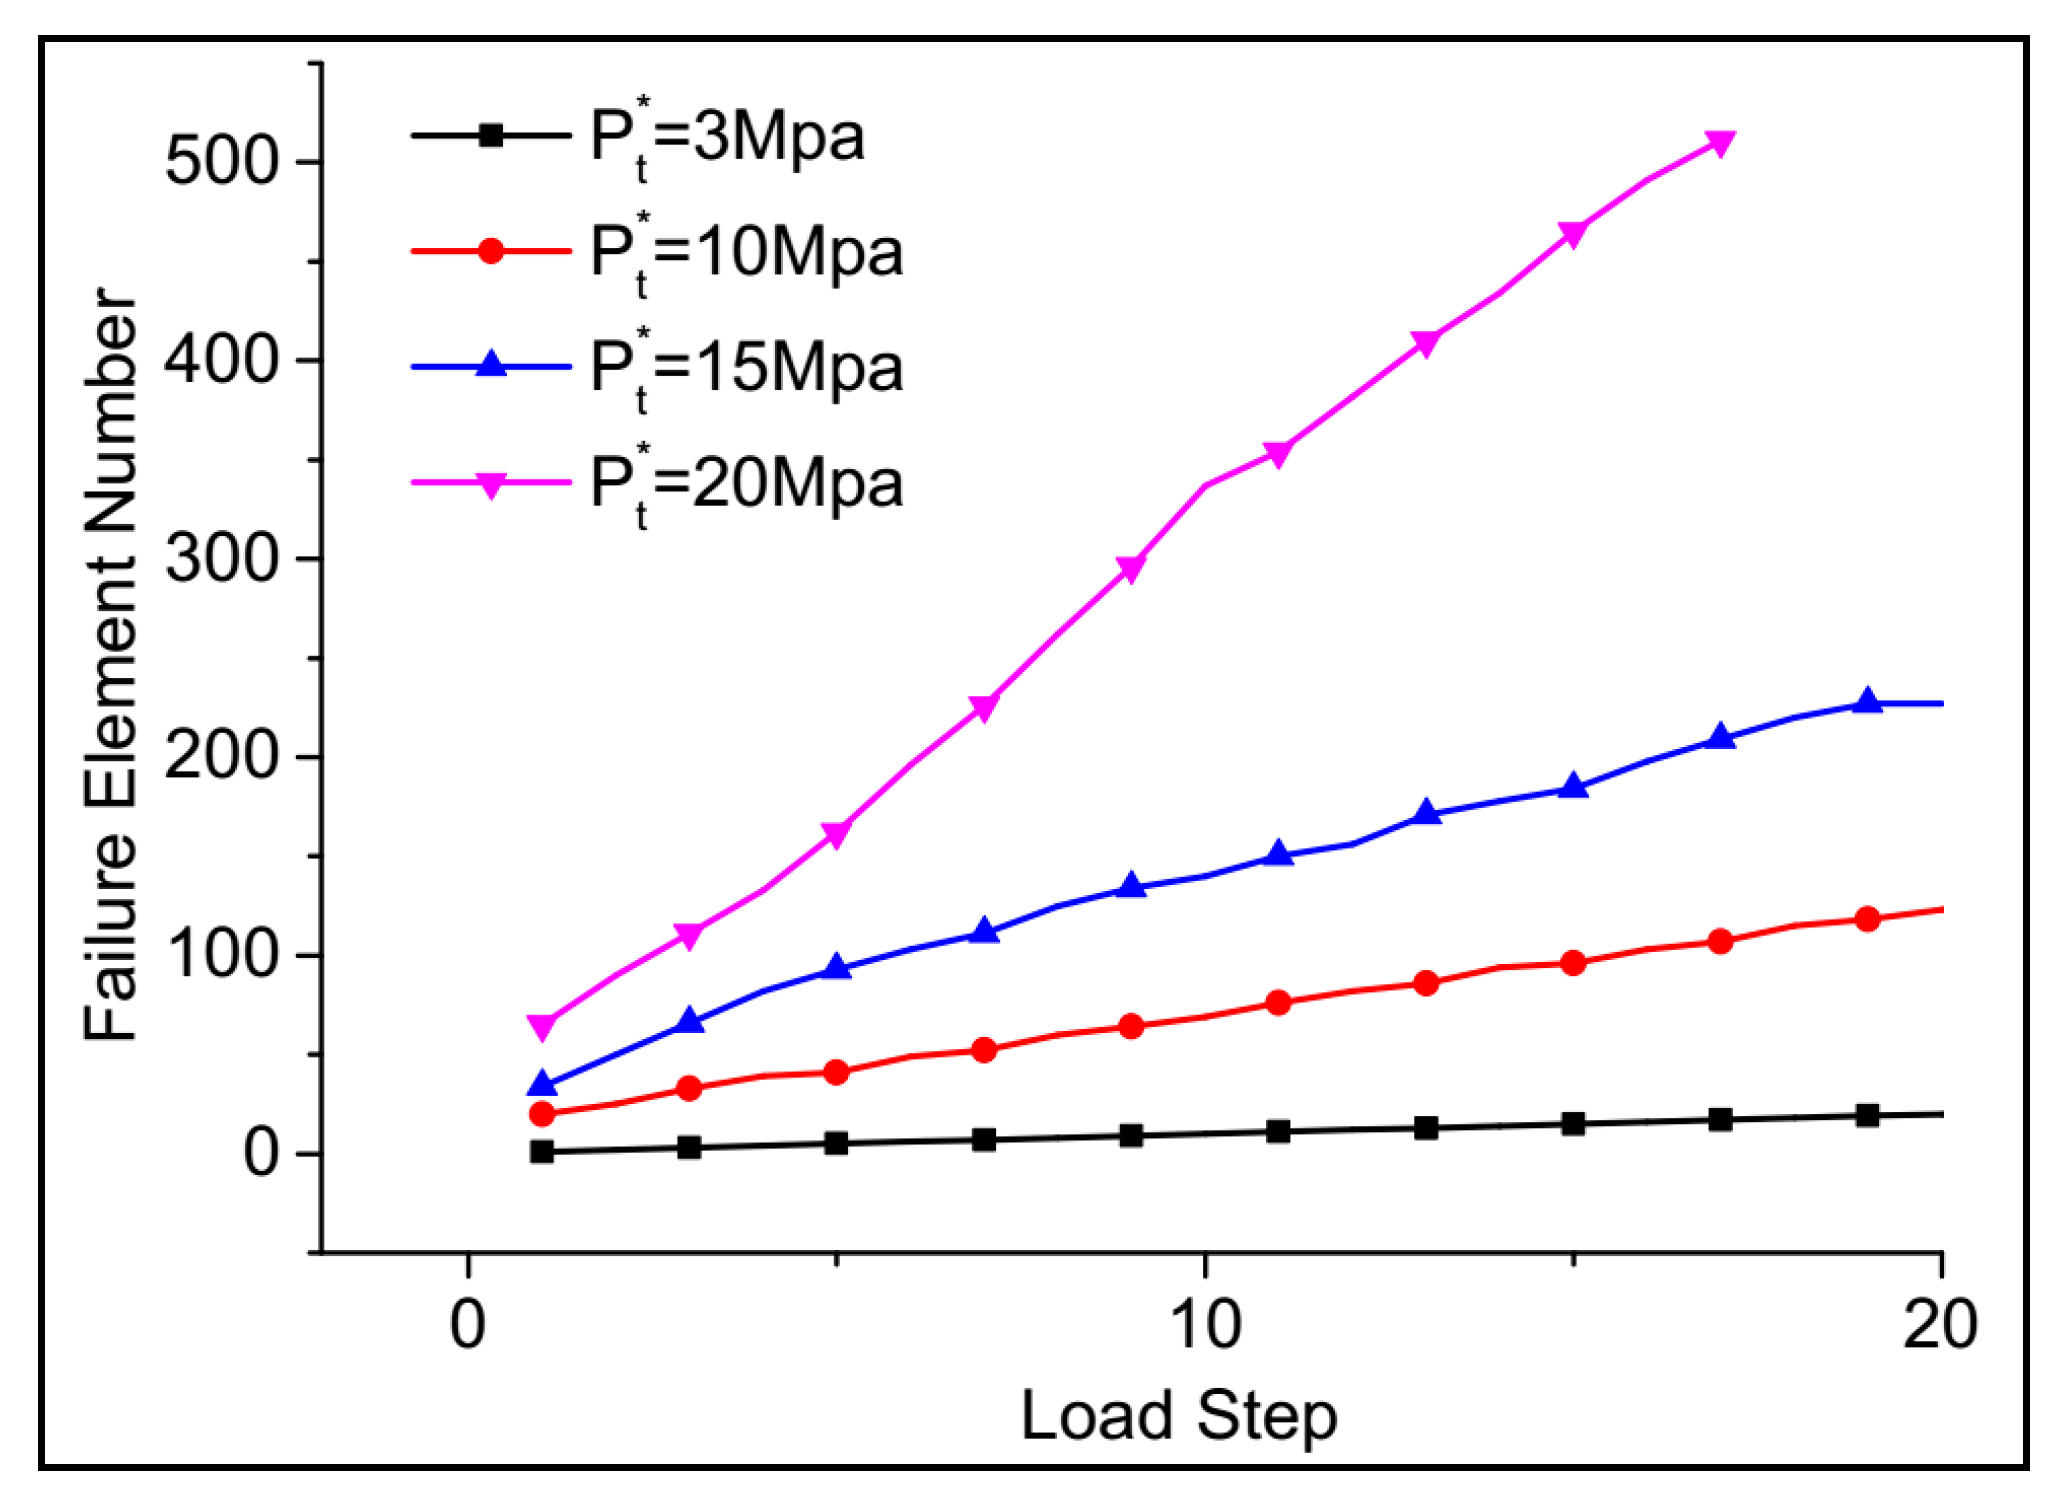
The stress contours were obtained after the cracks initiated under the influence of different perforation pressures (Figure 19). The results showed that, with the increase in perforation pressure, more cracks initiated at the tip. In contrast, the length of the cracks initiating at the root decreased. Figure 19 shows that the number of elements supported the above conclusion (Figure 20). The shape and the path of initiating cracks were distinctly different at the tip of the perforation. When the perforation pressure was smaller than the in situ stress, small cracks appeared at the tip, while the longest cracks were observed at the root. When the perforation pressure rose to more than 10 MPa, more than one initiating crack appeared at the tip. However, when the perforation pressure increased significantly beyond 10 MPa (such as 20 MPa), the crack evolved into larger holes, while some small cracks were generated inside the shale rock. This is because the tensile stress increased inside the shale rock, while the perforation grew larger than the in situ stress. On the other hand, some elements became weaker than others due to the Weibull probability distribution. The weaker elements inside the shale rock tended to break under the same stress field. When the four cases were compared, it was found that the perforation pressure of 15 MPa created more cracks and hence was beneficial to the SC-CO2 hydro-jet fracturing (Figure 19). Furthermore, three more main cracks initiated at the front of the tip. Additionally, the major crack changed in growth and then turned in the direction of the perforation. This means that selecting the optimal perforation pressure was extremely critical to hydro-fracturing. In short, higher perforation pressure does not mean better fracturing.
4.3. In-Situ Stress
Many previous studies have shown that the in situ stress shows important effect on the crack initiation process. The difference between the y-directional in situ stress and the z-directional in situ stress would obviously affect the initiation and propagation of major fractures. In this regard, four cases with the same perforation pressure and rock material properties were investigated to study the influence of difference values of in situ stress. The perforation pressure was 10 MPa, and in all cases the material properties were those of the shale rock. The z-directional stress curve indicated that, when the in situ stress in the z-direction was smaller than that in the y-direction, the tensile stress exceeded the failure value on the perforation wall (Figure 21). With the decrease in difference between the y-direction in situ stress and the z-direction in situ stress, the z-directional stress obviously decreased. This means that the difference in in situ stress is favorable for the creation of cracks in the middle of the perforation region.
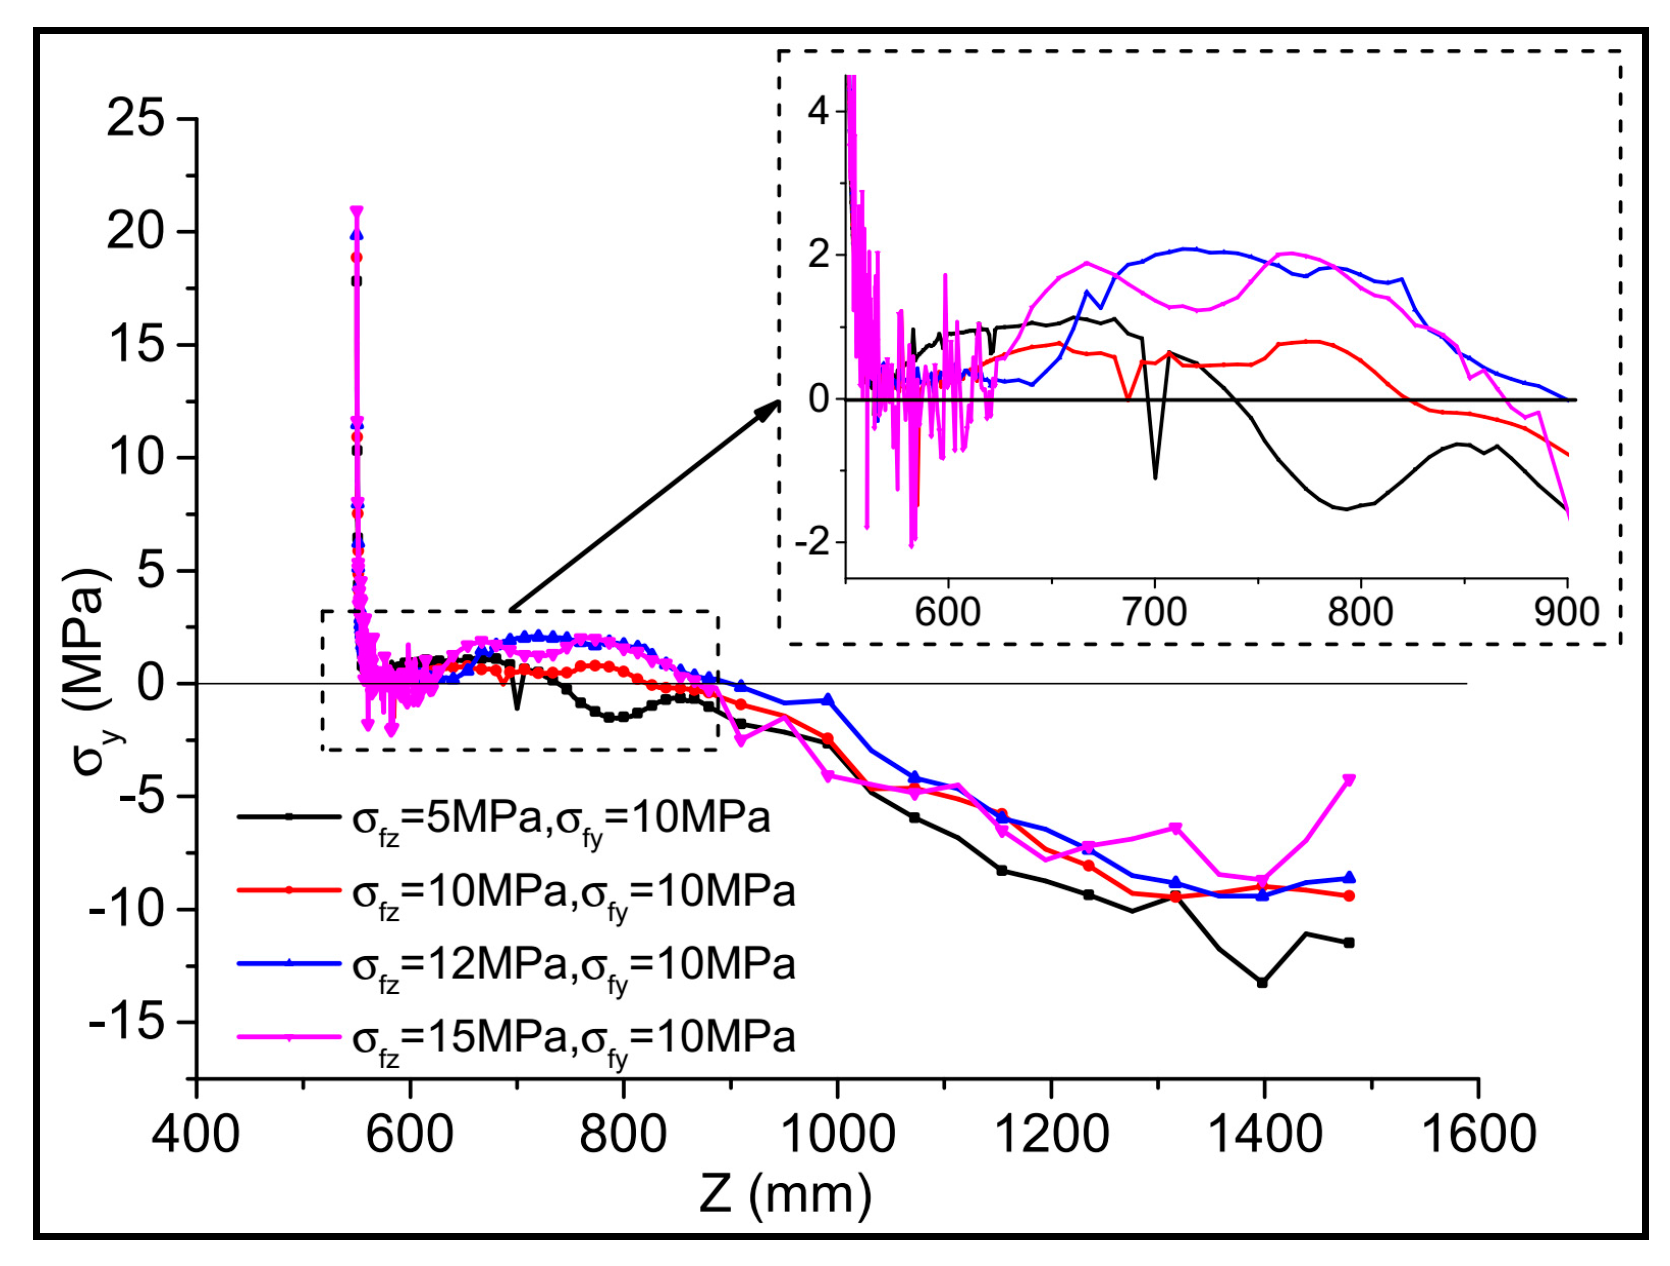
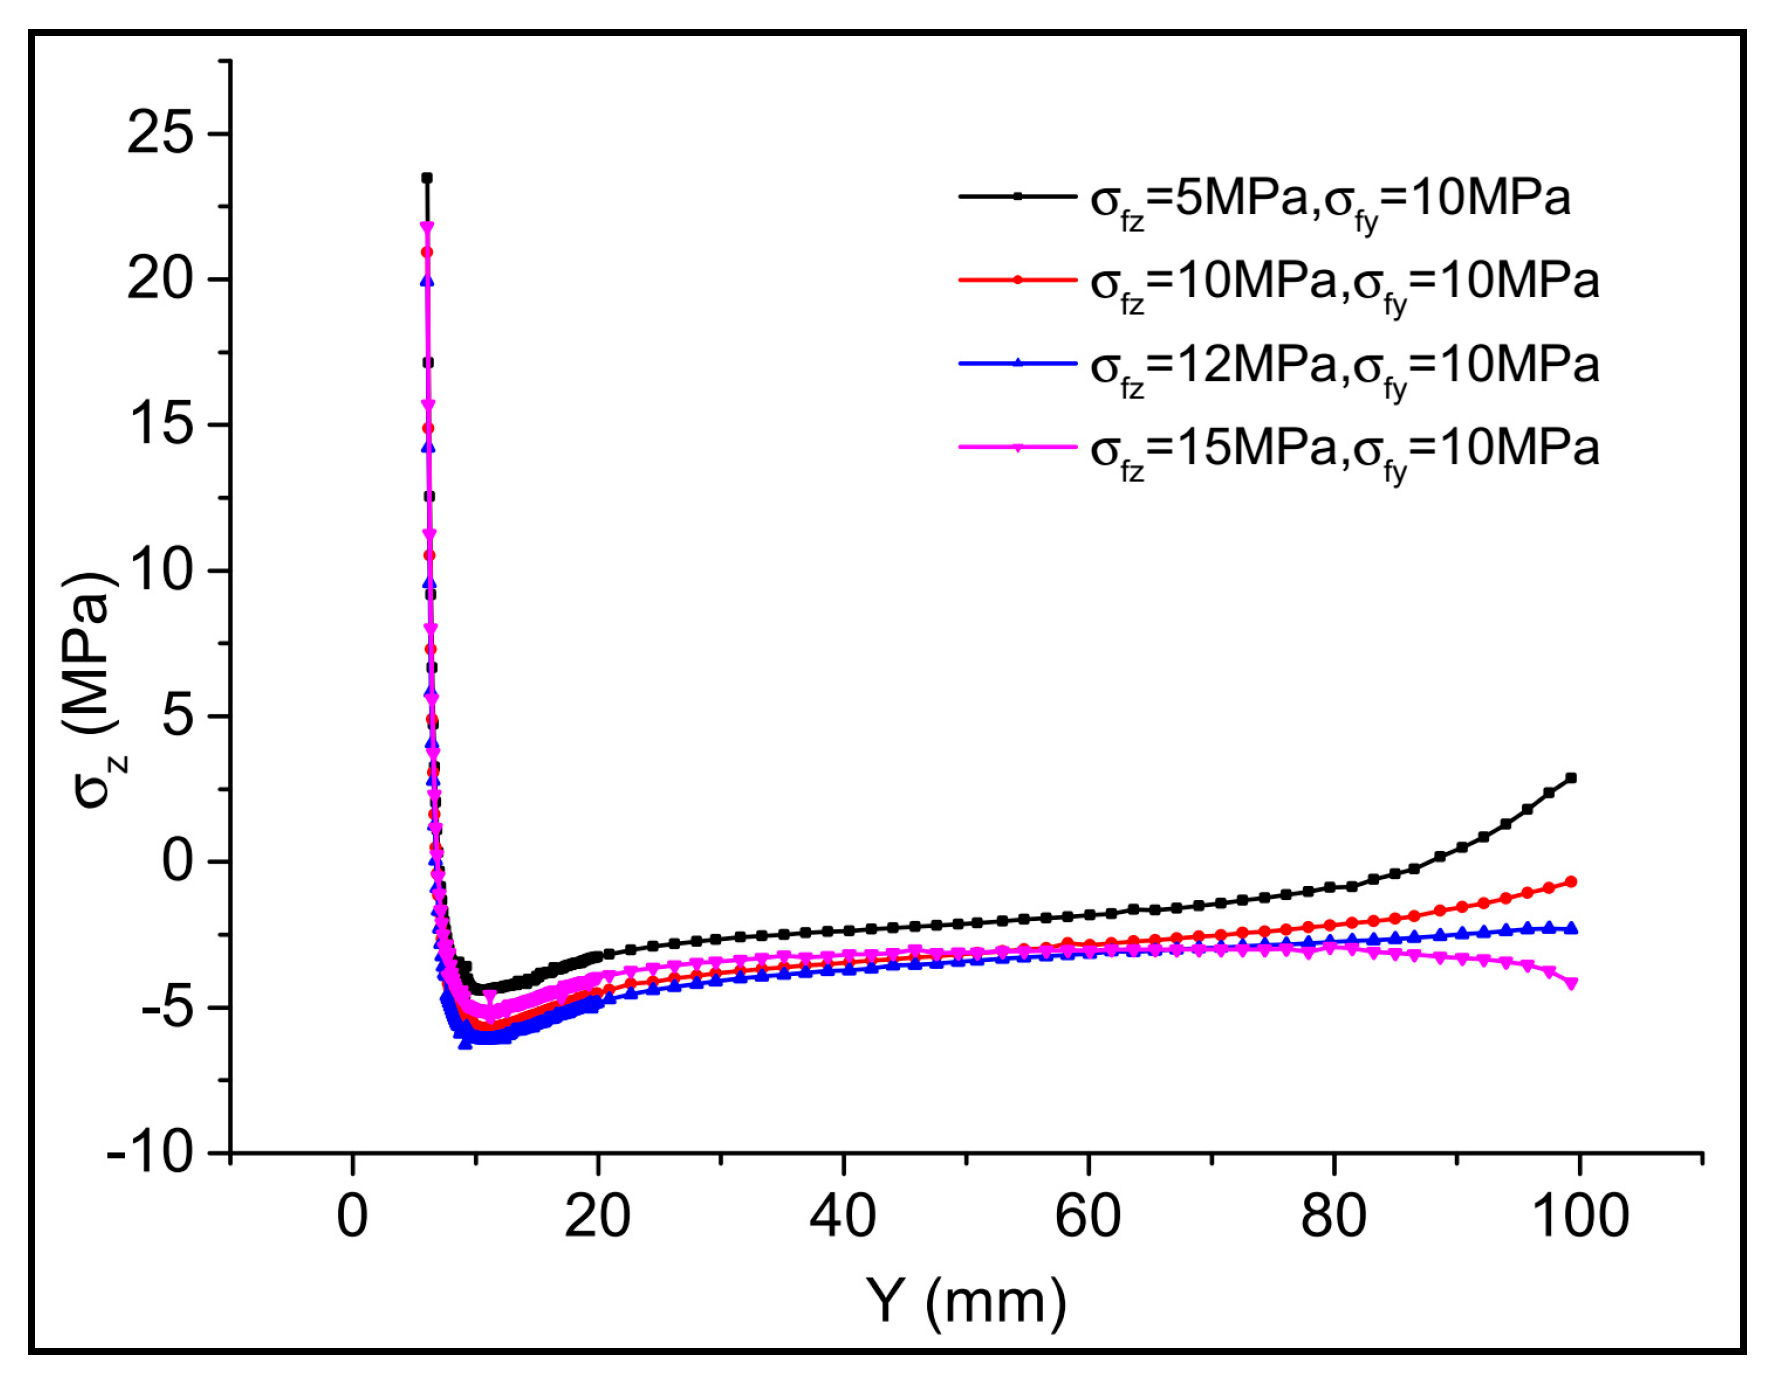
For the tip region of the perforation, when the value of z-directional in situ stress varied from 5 to 15 MPa, the maximum tensile stress values were found to be 17.81, 18.87, 19.86 and 20.93 MPa (Figure 22). It means that the higher z-directional in situ stress created the cracks more easily at the tip of the perforation. However, at the root of the perforation (Figure 23), the smallest z-directional in situ stress resulted in the largest tensile stress in the z-direction. Therefore, during the SC-CO2 hydro-jet fracturing, the in situ stress in the direction perpendicular to the perforation should be greater than that in the parallel direction, and will be favorable for the fracture initiation of the tip and prevention of the crack initiation at the root.
The results presented in Figure 24 showed that the value of z-directional stress, which contributed to the crack initiation at the middle and at the root of the perforation, were found to be in accordance with the ones obtained above. With the increase in z-directional stress, the region that was under the influence of tensile stress became relatively smaller. On the other hand, the values of tensile stress at the tip and at the root of the perforation became larger. To accurately evaluate the fracture initiation, the number of failure elements provided the best results. The results showed that larger difference in the in situ stress benefited the crack initiation (Figure 25). When the casing safety and the cracks’ initiation at the tip were considered, the better value of in situ stress in the z-direction became less than that in the y-direction. The results indicated that the perforation angle played an important role in the hydro-jet fracturing. Based upon the in situ stress distribution, the proposed method will effectively improve the fracture quality.
4.4. Nozzle Outlet Length-to-Diameter Ratio (L/r0)
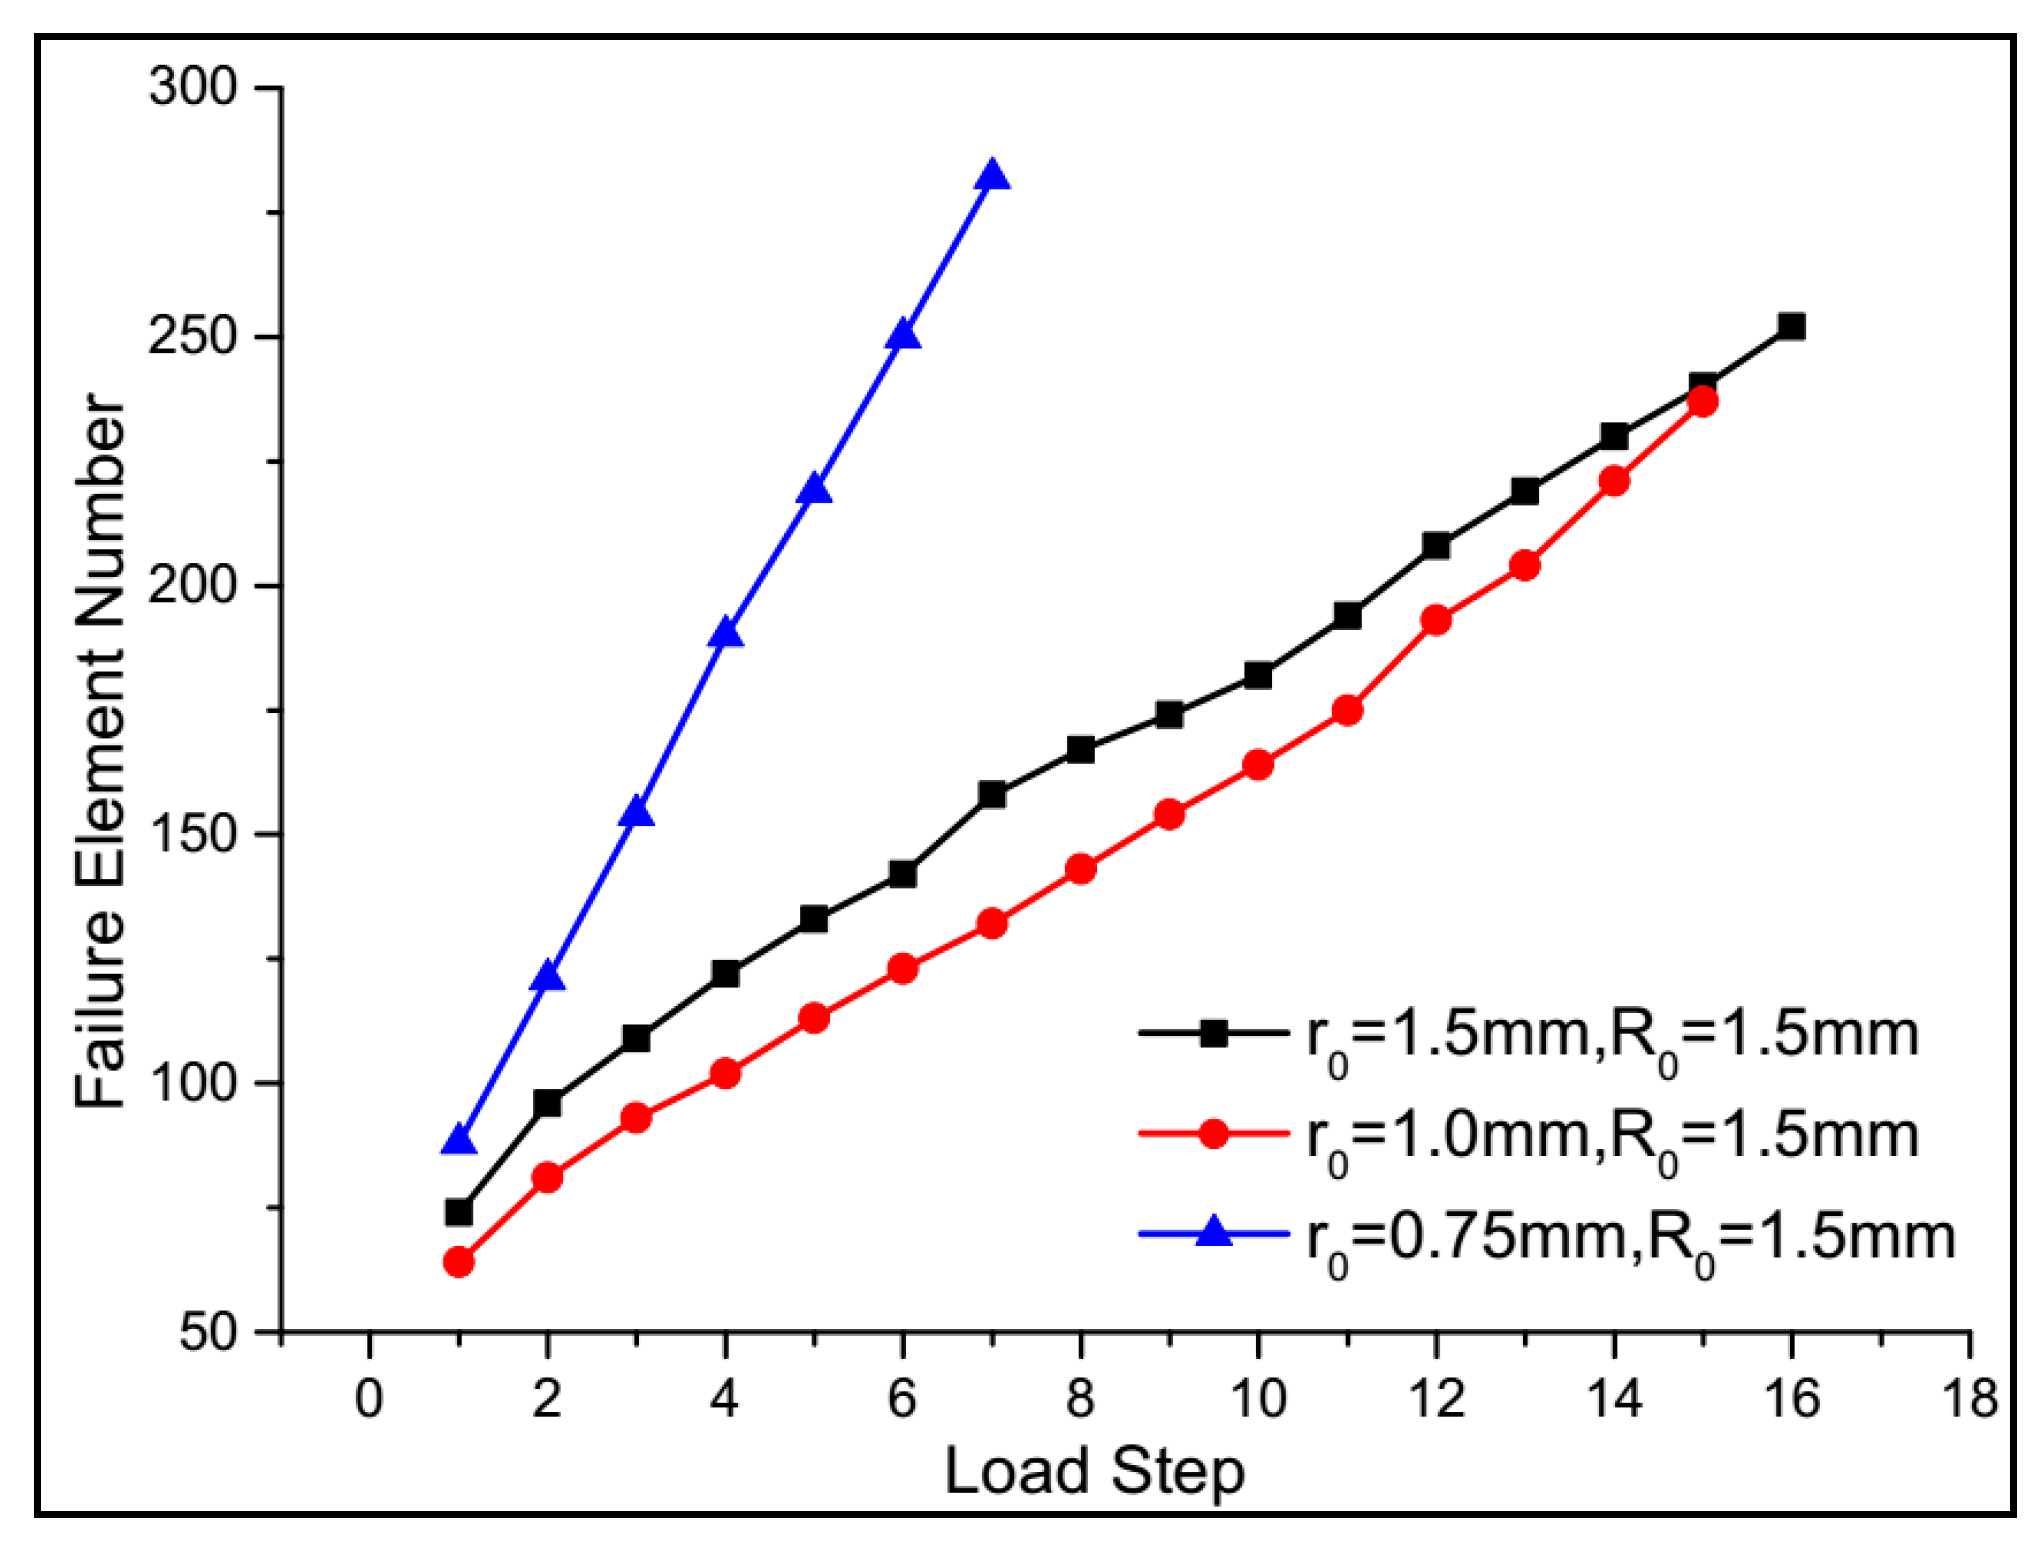
In order to estimate the influence of length-to-diameter ratio of the nozzle, three cases were simulated and their results compared. For SC-CO2 hydro-jet fracturing, the perforation pressure, which was boosted by the SC-CO2 jet, was the point of focus. As the radius of the nozzle outlet changed from 0.75 to 1.5 mm, the perforation pressure in the perforation tunnel sharply decreased with increases in z in the nozzle section, although the value remained steady throughout the annular (Figure 26). In the casing and cement section of the perforation, a significant difference among all cases was observed. When the radius was 1.5 mm, the total pressure sharply rose to its peak value (25.5 MPa) and remained steady in the casing and cement section. However, when the nozzle outlet was reduced to 1 mm, the total pressure gradually increased to its peak value (21.7 MPa) and then dropped a little to reach the value of its perforation pressure (21.5 MPa). In contrast to these two cases, when the radius was 0.75 mm, the total pressure first decreased slowly and then started to increase steadily after 7.4 mm. These results demonstrated that a larger nozzle outlet radius can reach a higher perforation pressure, while a smaller radius will contribute to generate the best “hydraulic-fracturing ring” in the perforation tunnel. On the other hand, a higher perforation pressure will contribute to crack initiation. Therefore, efforts should be made to decrease the value of the length-to-diameter ratio as much as possible, such that the energy loss remains within the acceptable range.
The influence of length-to-diameter ratio on the distribution of stress in the shale reservoir was also investigated. The results showed that the higher value of length-to-diameter ratio (L/r0) caused a higher stress at the root and at the tip of the perforation. Figure 27 shows the distribution of z-directional stress along the wall of the perforation. The results reveal that the length-to-diameter ratio (L/r0) changed slightly with the z-directional stress at the middle of the perforation. However, at the root (Figure 28), the case for which L0 = 2 and r0 = 0.75 obtained the highest stress (26.33 MPa), while the other two cases resulted in stress values of 20.88 and 21.92 MPa. For the tip position, the case for which L0 = 2 and r0 = 0.75 also obtained the largest value of y-directional stress (20.74 MPa).
It is observed again that the value of length-to-diameter ratio (L/r0) significantly affected the stress distribution (Figure 29). When the three cases were compared, it was found that, when r0 was equal to 1, the biggest region of maximum tensile stress obtained. However, the third case, for which r0 was 1.5, obtained the largest region of tensile stress and had higher potential for crack initiation during SC-CO2 hydro-jet fracturing. It was noticed that the calculated stress profiles exhibited a non-linear distribution and different maximum values, which was attributed to an SC-CO2 hydro-jet and inhomogeneous material properties. The failure elements were calculated by the software. Surprisingly, the trend of the curve indicated that a larger nozzle radius (r0 = 1.5) could result in a greater number of cracks (Figure 30).
4.5. Aperture Ratio (r0/R)
Unlike SC-CO2 free jet, the SC-CO2 will be affected by the casing and cement section of the tunnel. The results presented in previous sections have shown that the larger nozzle outlet radius will increase the number of failure elements. Therefore, the relationship between the nozzle outlet and the inlet of the perforation will affect the results of SC-CO2 jet fracturing. In previous SC-CO2 jet fracturing studies, this relationship was ignored. Therefore, in the present work, three cases with aperture ratios (r0/R) of 2/3, 1, and 4/3 were studied to explore the influence of this relationship. The “hydraulic isolating ring” will disappear provided the nozzle outlet diameter is larger than the inlet of casing tunnel (Figure 31), which is due to the reason that the static pressure of annular is larger than that in the casing section. When the aperture ratio was less than 1, the perforation pressure was obviously reduced (Figure 30). It is necessary to maximize the aperture ratio as much as possible to ensure as large a pressurization as possible. However, the value cannot exceed unity. In comparison, Figure 27 shows that, when the nozzle outlet radius was increased, the perforation pressure obviously increased. Additionally, a large nozzle outlet will cover the inlet of the perforation to make sure that the CO2 does not leak from the perforation. With the continuous SC-CO2 jet, CO2 was pressurized in the perforation, due to which a higher perforation pressure was obtained.
Further analysis of the stress distribution (Figure 32 and Figure 33) shows that the case for which r0/R was unity resulted in the highest stress in the z-direction at the root of the perforation, which had a value of 26.06 MPa. For the case for which r0/R was unity, the tensile strength exhibited a larger influencing region in the middle of the shale rock than the other two cases. At the tip, the three cases resulted in similar tensile stress values and had values of 19.58, 19.22, and 19.98 MPa. However, at the front of the tip, the case for which r0/R was 1.33 resulted in higher stress due to higher perforation pressure. This means that the aperture ratio affects the stress at the tip and leads to different crack initiation situations.
To accurately investigate the crack initiation at the tip, the stress distribution under different aperture ratios was compared. From Figure 34, it can be seen that, with the increase in aperture ratio, the number of cracks increased. Moreover, it was revealed that the cracks not only initiated at the front of the tip, but were also generated inside the shale rock. Interestingly, the region of maximum tensile stress extended as the nozzle radius increased. Significant differences in cracks were observed in the three studied cases. In the first case, there were only two short cracks initiated at the front of the tip. However, one longer crack grew in the middle of the shale rock (Figure 34a). It is clear that more cracks appeared in the second case than the first one, whereas the area influenced by the stress was the smallest (Figure 34b). The third case not only exhibited a large area influenced by the tensile stress, but also showed many cracks (Figure 34c). Additionally, the number of failure elements also increased significantly (Figure 35). These results were found to be in accordance with those obtained in previous sections.
4.6. Weibull Parameter
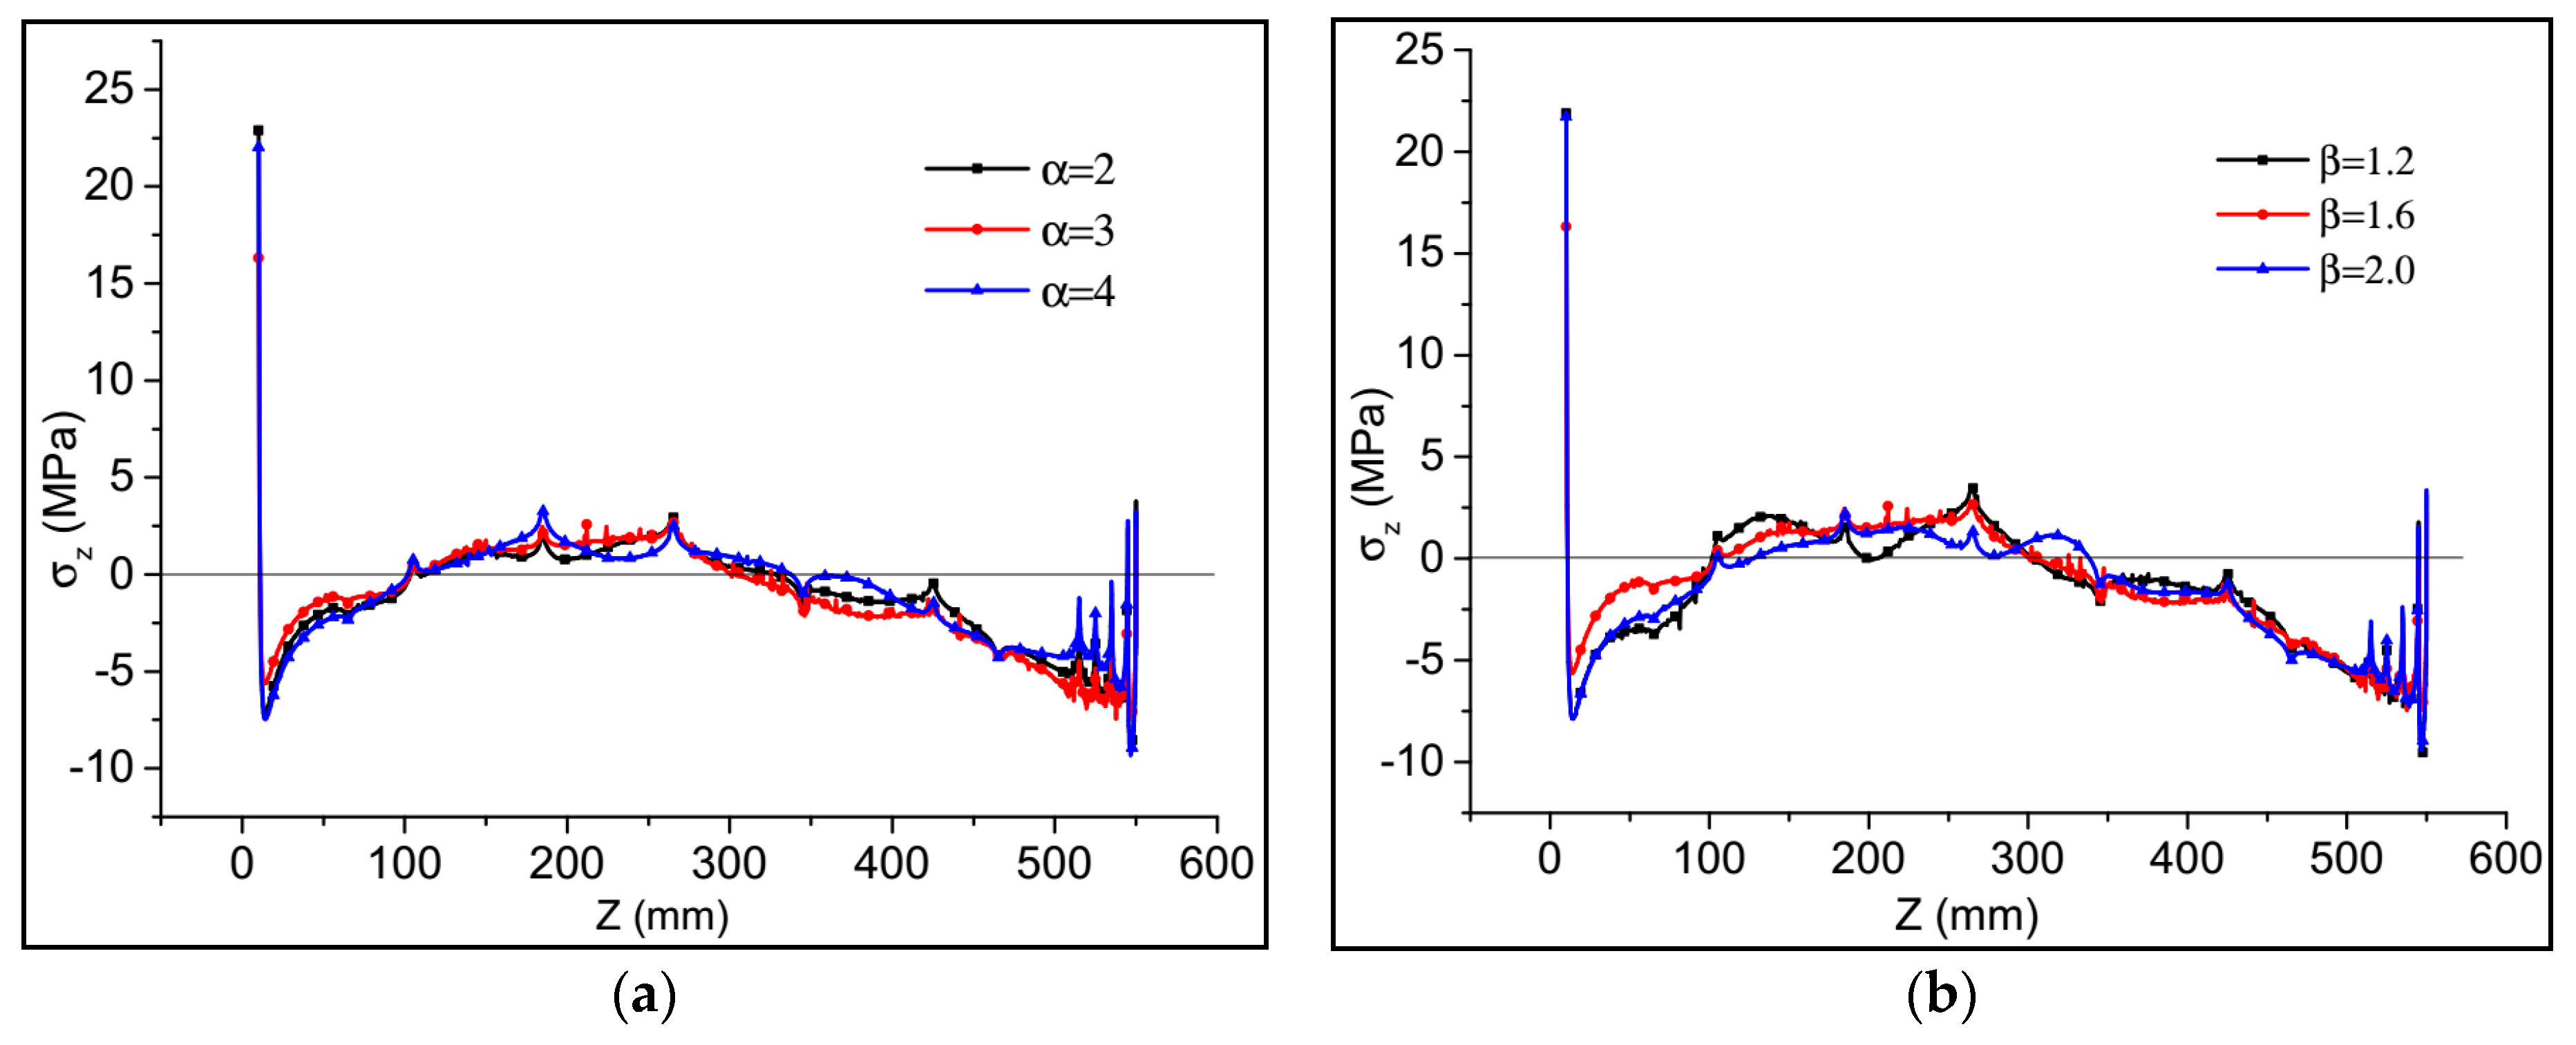
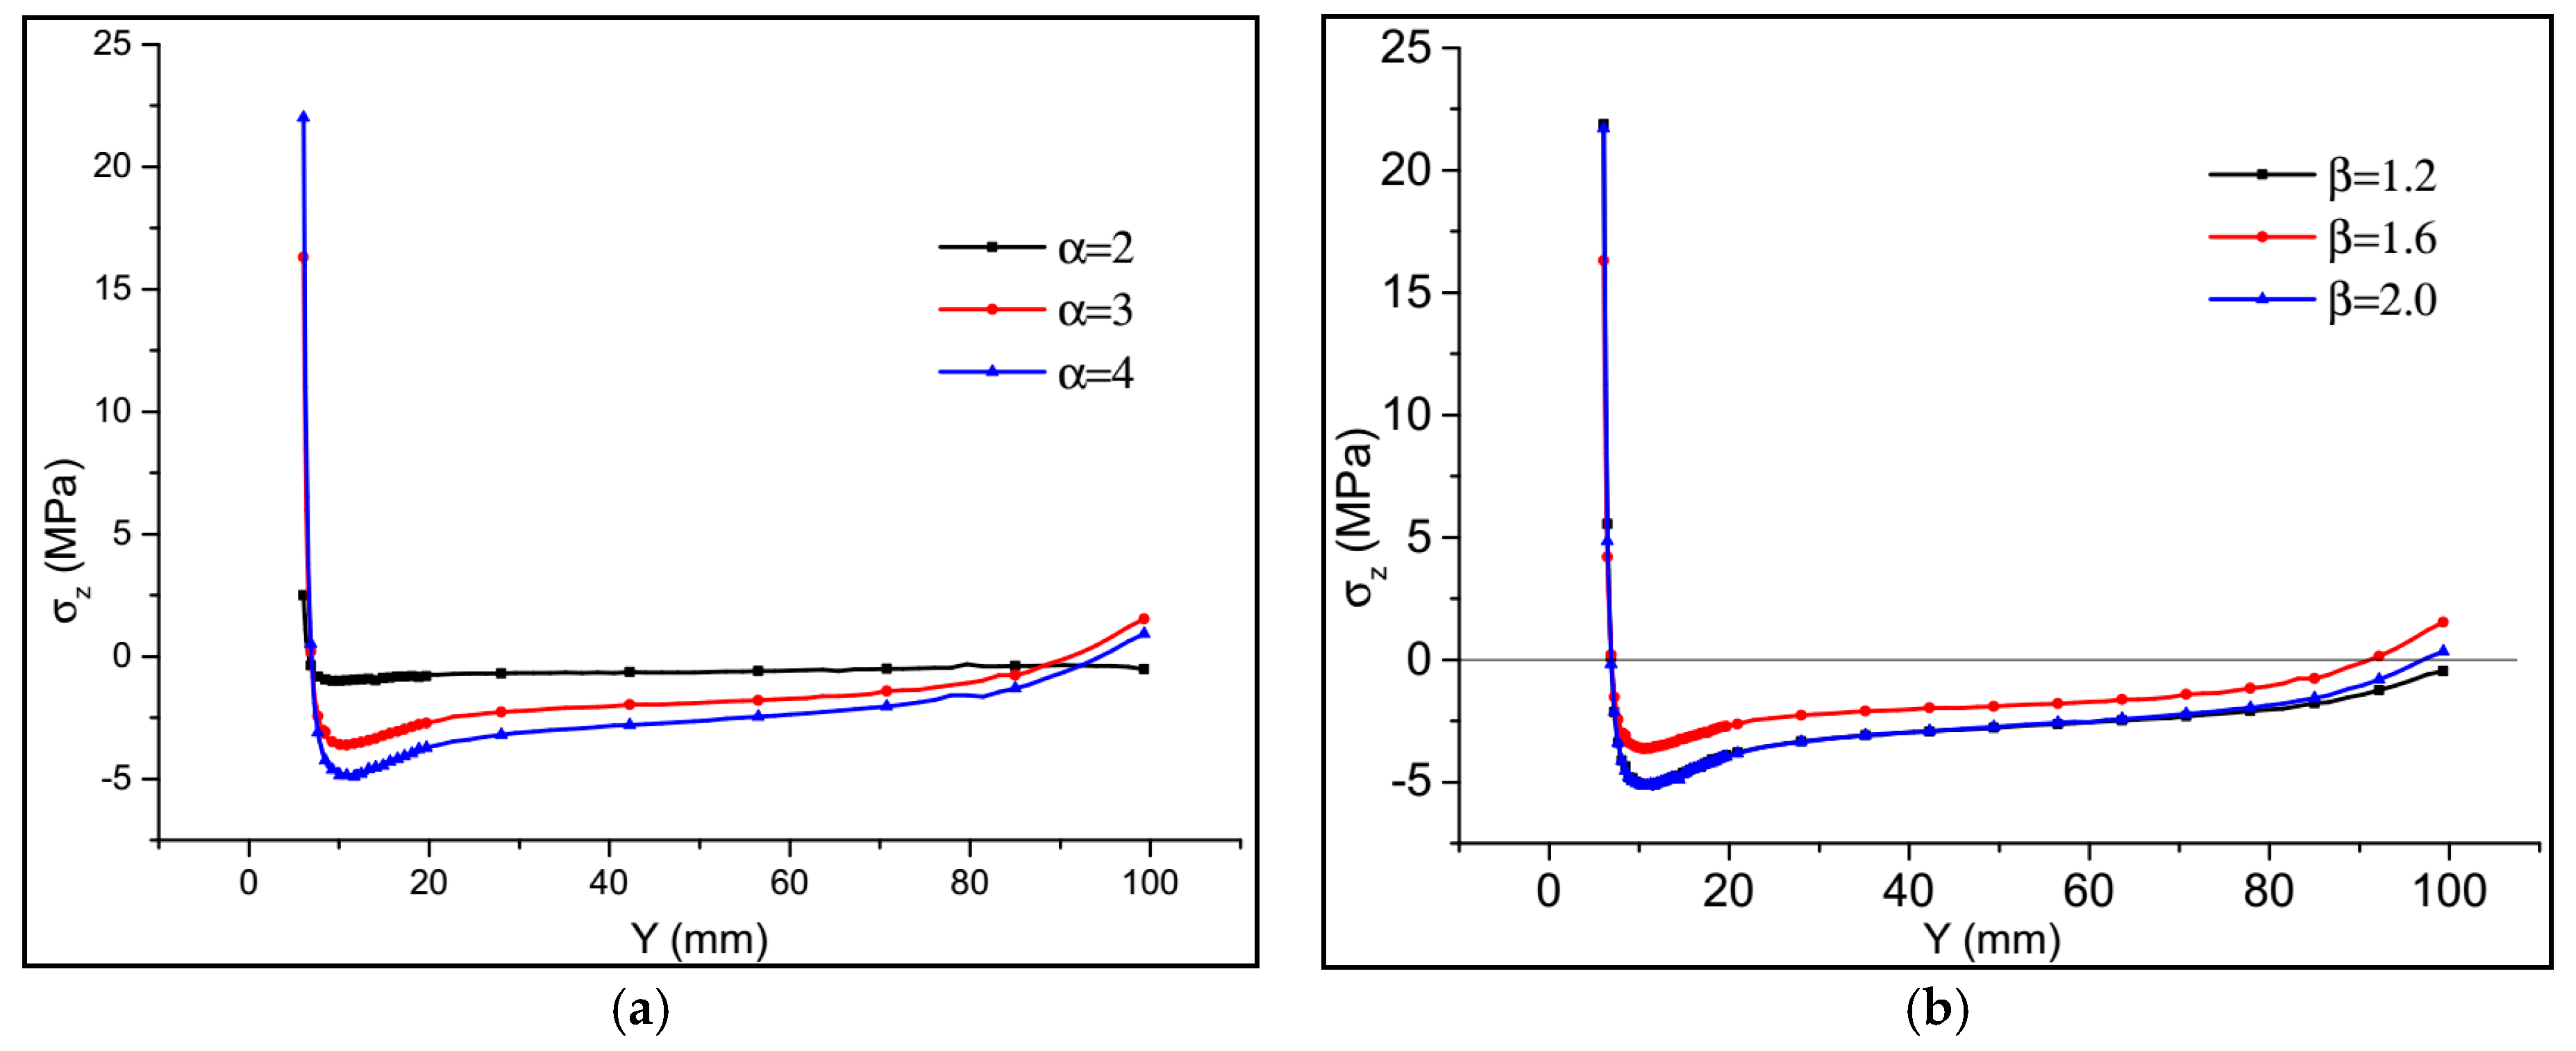
Due to the Weibull characteristic of material properties, the stress distribution played nonlinear and uniform changes when the perforation pressure affected the shale rock. Due to different geological sedimentary environments and the impact of different geological structures, the rock generated different priorities and compositions, which played different material properties on macro-level. The process occurred on the Weibull model for the shale rock with different Weibull parameters. Under both the perforation pressure and the in situ stress, the stress distributions exhibited obvious differences for different α and values, as shown in Figure 36. From Figure 36a, it can be seen that, at the root position (z = 0 mm), when α was 4, largest tensile stress was observed in the middle of the perforation wall. On the other hand, the maximum stress at the root was not very high as compared with that in the first case (when ) (Figure 37a). However, the best value for was found to be 1.2, because it resulted in the highest value of tensile stress, which varied from 100 to 300 mm at the middle of the perforation wall (Figure 36b). In addition, this case did not generate large stress at the root, which was beneficial to the cement’s safety (Figure 37b). The results reveal that the selection of Weibull parameters played an important role for the stress distribution. Before the simulation, the material parameters were obtained through experiments, and appropriate Weibull parameters were then selected for further analysis.
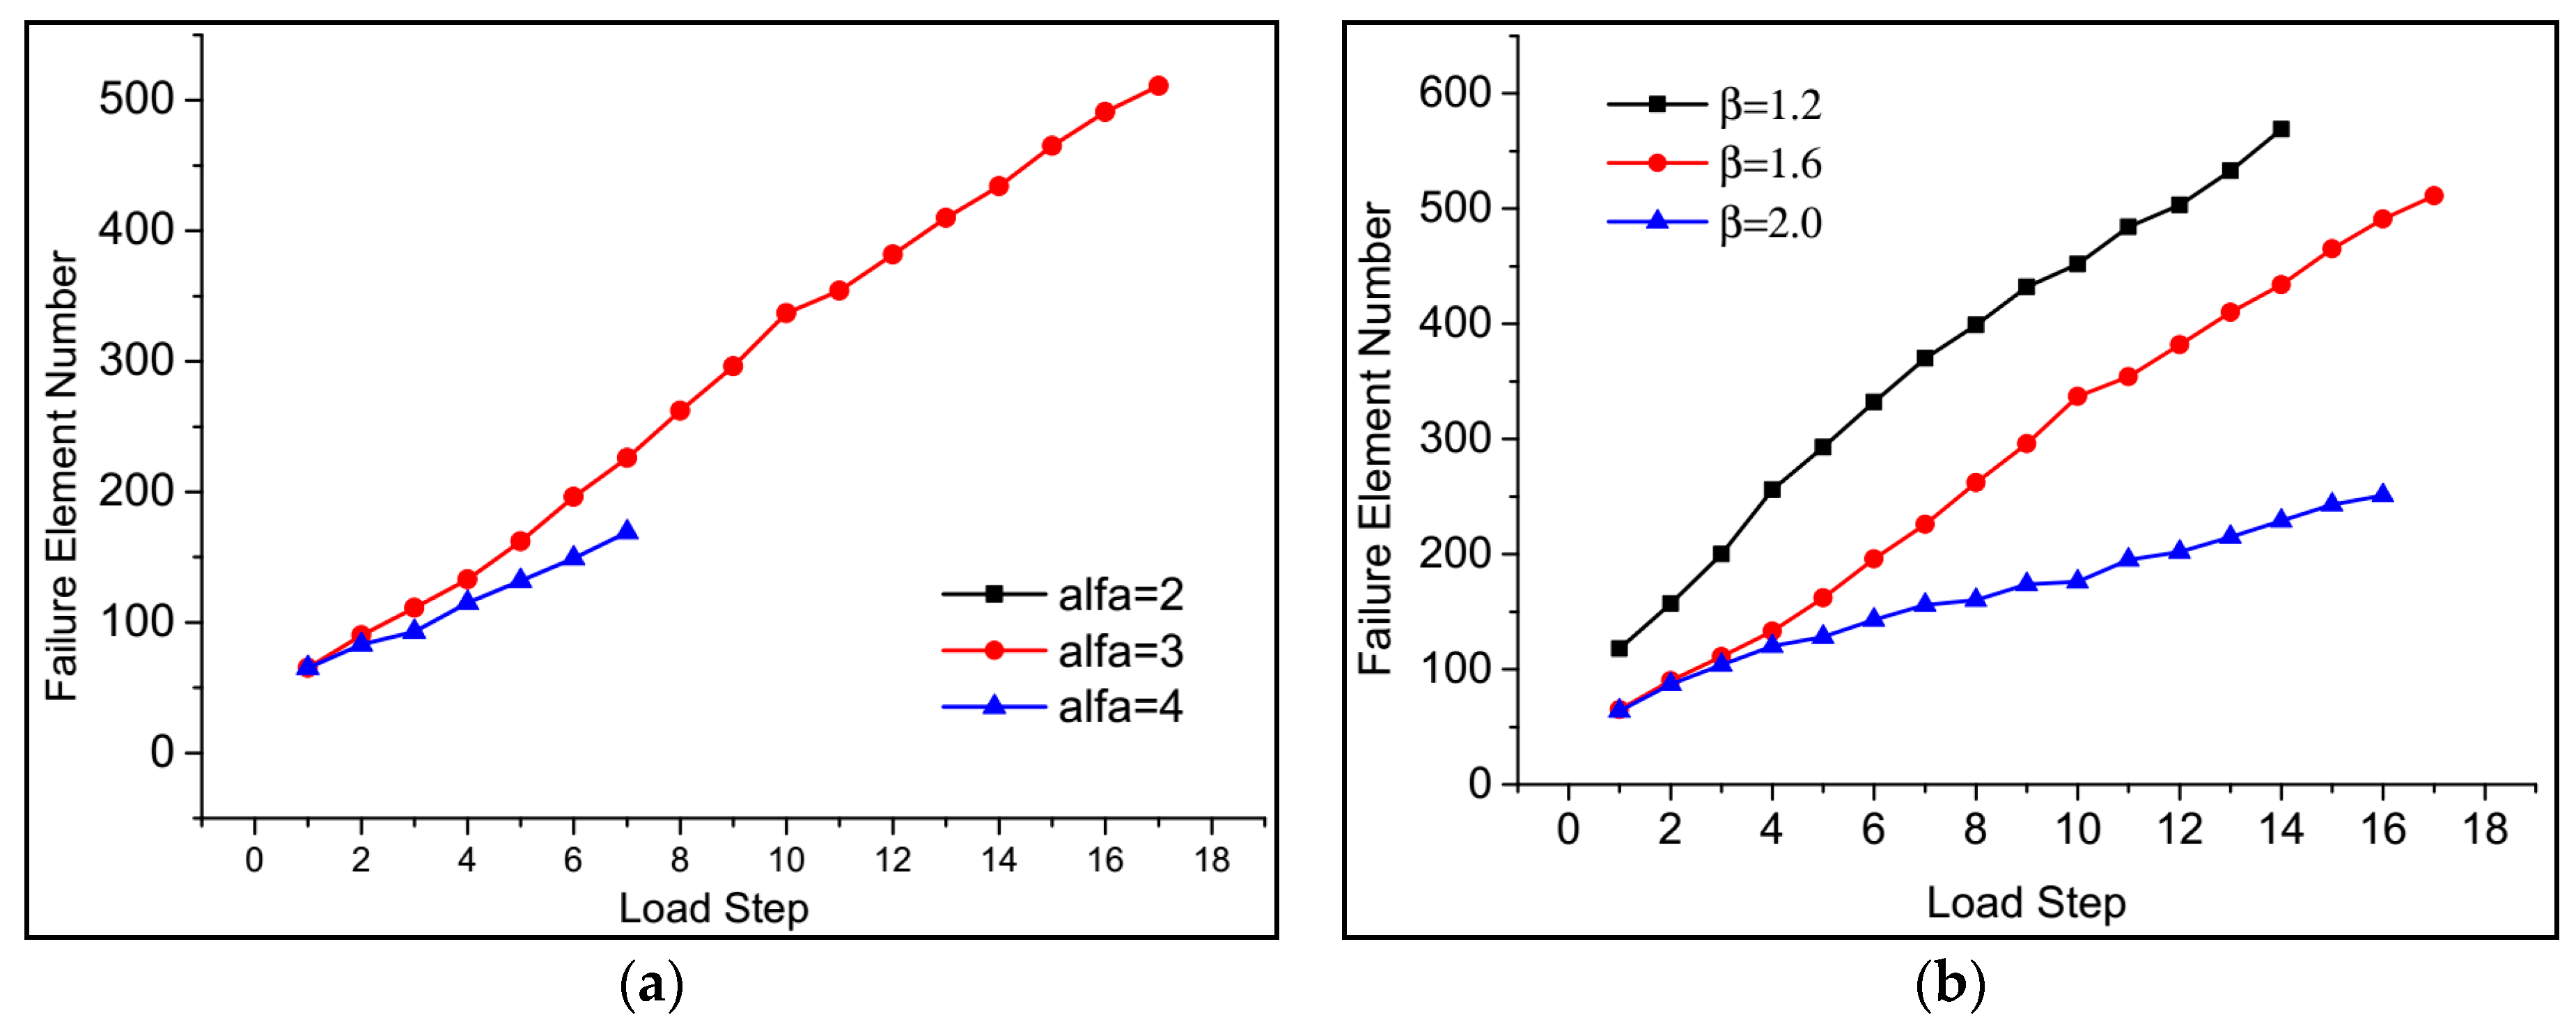
In order to further study the influence of Weibull parameters, the numbers of failure elements were compared. As shown in Figure 38a, the results indicated that, with the increase in Weibull parameters ( and ), the number of failure elements sharply decreased. In particular, when the value of was 2, there was no element of failure, even under the load of high perforation pressure. This means that determines the initial number of weak elements. Under the perforation pressure, the weak elements tended to fail easily, and cracks were thus initiated. The results also showed that the effect of α on the number of failure elements was stronger than that of (Figure 38b). Mostly, reflected the average number of weak elements. The results showed that the nature of properties of inhomogeneous rock was a key factor and affected crack initiation and propagation.
5. Conclusions
The present study investigated the initiation of inhomogeneous shale fracture under the boosted pressure of an SC-CO2 hydro-jet. Based on the field observations and experiments, the FSI model of SC-CO2 hydro-jet fracturing is proposed using the method of user-defined code and two-step simulations. The mechanism of SC-CO2 hydro-jet fracturing was explored, and the effects of various factors, such as the perforation pressure, the in situ stress, and the aperture ratio, were analyzed and discussed. Based on the results, the following conclusions were drawn.
- (1)
- From the experiments and SEM analysis, shale rock exhibited distinct heterogeneity, including elastic modulus, tangent modulus, and Poisson’s ratio. The numerical simulation results indicated that the Weibull probability distribution can be used to analyze fracture initiation. The parameters can explain the distribution of weak elements and can affect the stress field in the shale rock.
- (2)
- A high-velocity SC-CO2 jet not only caused a hydraulic-fracturing ring, but also led to the increase in stress in the shale rock. The tensile stress in the direction parallel to the perforation (z-direction) led to crack initiation at the root and at the middle of the perforation. The tensile stress in the direction vertical to the perforation (y-direction) resulted in crack initiation at the position of the tip of the perforation.
- (3)
- It was found that, with the increase in perforation pressure, more cracks initiated at the tip. In contrast, the length of the cracks initiated at the root decreased. In SC-CO2 hydro-jet fracturing, the in situ stress in the direction perpendicular to the perforation should be greater than that in the direction parallel to the perforation, which is favorable for fracture initiation at the tip and for the prevention of crack initiation at the root.
- (4)
- The structure of the nozzle outlet distinctly affected the pressurization of the SC-CO2 jet. When the diameter of the nozzle outlet was increased, the perforation pressure became higher. These effects were attributed to the non-linear distribution and different maximum values of the stress in shale rock.
- (5)
- The aperture ratio between the nozzle outlet and the casing’s perforation inlet significantly affected the SC-CO2 jet fracturing, which resulted in the disappearance of the “hydraulic isolation ring.” With the increase in aperture ratio, the initiation position of the cracks’ growth and the region of the maximum tensile stress extended, and the number of failure elements also significantly increased.
Acknowledgments
The authors express their appreciations to the National Key Basic Research Program of China (No. 2014CB239203), the National Natural Science Foundation of China (No. 51474158), the National Science Foundation of China (No. 51504166), the Fundamental Research Funds for the Central Universities (Grant No. 2042017 KF0227), Fund Project of Education Department of Sichuan (No. 17ZB0198) and Fund project of LeShan Science and Technology Department (No. 17GZD043) for the financial support of this work.
Author Contributions
Yi Hu and Yiwei Liu conceived and designed the schemes; Can Cai, Man Huang, and Chen Feng performed the experiments; Yong Kang and Yi Hu analyzed the data; Xiaochuan Wang contributed materials; Yi Hu and Yiwei Liu wrote the paper.
Conflicts of Interest
The authors declare no conflict of interest.
Nomenclatures
| x, y, z | third local coordinate, mm |
| r | radial direction coordinate, mm |
| T | temperature, K |
| Tc | critical temperature, K |
| t | time, s |
| velocity in the y-direction, velocity in the z-direction, m/s | |
| ρ, ρc | density and critical density, kg/m2 |
| Ρ, Ρc | pressure, critical pressure, MPa |
| Ρs, Ρd | static and dynamic pressure, MPa |
| Ρt | total pressure, MPa |
| Ρin | nozzle inlet pressure, MPa |
| Ρam | ambient pressure, MPa |
| perforation pressure, MPa | |
| Tam | ambient temperature, K |
| Vc | critical specific volume, m2/ kg |
| Rsp | specific gas constant, dimensionless |
| K | kinetic energy of turbulence, dimensionless |
| ω | specific dissipation rate of turbulence, dimensionless |
| vz | axial velocity, m/s |
| vmax | max axial velocity, m/s |
| b, a0 | constants of PR equation, dimensionless |
| w | acentric factor, dimensionless |
| V | specific volume, m2/ kg |
| n | constants of PR equation, dimensionless |
| tangent modulus of shale rock, GPa | |
| average tangent modulus of shale rock, GPa | |
| non-uniform parameter of Weibull probability distribution | |
| scale parameter of Weibull probability distribution | |
| y-directional stress, MPa | |
| z-directional stress, MPa | |
| failure tensile stress in the y-direction, MPa | |
| failure tensile stress in the z-direction, MPa | |
| in situ stress in the y-direction, MPa | |
| in situ stress in the z-direction, MPa | |
| d | nozzle outlet diameter, mm |
| l | nozzle outlet length, mm |
| r0 | nozzle outlet radius, mm |
| Dc | inlet diameter of casing, mm |
| R | radius of casing tunnel cross-section, mm |
| Re | Reynolds number, dimensionless |
| RA | control parameter of element failure in ADINA |
| ϕ | dimensionless axial velocity, dimensionless |
| η | dimensionless radius, dimensionless |
| γ | dimensionless radius, dimensionless |
References
- Middleton, R.S.; Carey, J.W.; Currier, R.P.; Hyman, J.D.; Kang, Q.; Karra, S.; Jiménez-Martínez, J.; Porter, M.L.; Viswanathan, H.S. Shale gas and non-aqueous fracturing fluids: Opportunities and challenges for supercritical CO2. Appl. Energy 2015, 147, 500–509. [Google Scholar]
- Middleton, R.; Viswanathan, H.; Currier, R.; Gupta, R. CO2 as a fracturing fluid: Potential for commercial-scale shale gas production and CO2 sequestration. Energy Procedia 2014, 63, 7780–7784. [Google Scholar]
- Liu, H.; Wang, F.; Zhang, J.; Meng, S.; Duan, Y. Fracturing with carbon dioxide: Application status and development trend. Pet. Explor. Dev. 2014, 41, 513–519. [Google Scholar] [CrossRef]
- Matson, D.W.; Petersen, R.C.; Smith, R.D. Production of powders and films by the rapid expansion of supercritical solutions. J. Mater. Sci. 1987, 22, 1919–1928. [Google Scholar]
- Seebald, P.J. Turbulence in Transcritical CO2 Jets. Ph.D. Thesis, Purdue University, West Lafayette, IN, USA, January 2014. [Google Scholar]
- Khalil, I.G.; Miller, D.R. The free-jet expansion of supercritical CO2 from a capillary source. In Proceedings of the 24th International Symposium on Rarefied Gas Dynamics, Monopli, Italy, 10–16 July 2004; pp. 343–348. [Google Scholar]
- Gregorio, F.D. Free compressible jet investigation. Exp. Fluid. 2014, 55, 1–21. [Google Scholar]
- Türk, M. Influence of thermodynamic behaviour and solute properties on homogeneous nucleation in supercritical solutions. J. Supercrit. Fluid. 2000, 18, 169–184. [Google Scholar]
- Helfgen, B.; Türk, M.; Schaber, K. Hydrodynamic and aerosol modelling of the rapid expansion of supercritical solutions (RESS-process). J. Supercrit. Fluid. 2003, 26, 225–242. [Google Scholar]
- Ksibi, H.; Tenaud, C.; Subra, P.; Garrabos, Y. Numerical simulation of the rapid expansion of supercritical fluid flow. Eur. J. Mech.B 1996, 15, 569–596. [Google Scholar]
- Yamamoto, S.; Furusawa, T.; Matsuzawa, R. Numerical simulation of supercritical carbon dioxide flows across critical point. Int. J. Heat Mass Transf. 2011, 54, 774–782. [Google Scholar]
- Liu, J.; Do-Quang, M.; Amberg, G. Numerical simulation of rapid expansion of supercritical carbon dioxide. Aiche J. 2015, 61, 317–332. [Google Scholar] [CrossRef]
- He, Z.; Tian, S.; Li, G.; Wang, H.; Shen, Z.; Xu, Z. The pressurization effect of jet fracturing using supercritical carbon dioxide. J. Nat. Gas Sci. Eng. 2015, 27, 842–851. [Google Scholar] [CrossRef]
- Wang, H.Z.; Li, G.S.; Tian, S.C.; Cheng, Y.X.; He, Z.G.; Yu, S.J. Flow field simulation of supercritical carbon dioxide jet: Comparison and sensitivity analysis. J. Hydrodyn. 2015, 27, 210–215. [Google Scholar] [CrossRef]
- Luo, X.; Wang, S.; Wang, Z.; Jing, Z.; Lv, M.; Zhai, Z.; Han, T. Experimental investigation on rheological properties and friction performance of thickened CO2 fracturing fluid. J. Pet. Sci. Eng. 2015, 133, 410–420. [Google Scholar] [CrossRef]
- Khanpour, R.; Sheikhi-Kouhsar, M.R.; Esmaeilzadeh, F.; Mowla, D. Removal of contaminants from polluted drilling mud using supercritical carbon dioxide extraction. J. Supercrit. Fluid. 2014, 88, 1–7. [Google Scholar] [CrossRef]
- Tian, S.; He, Z.; Li, G.; Wang, H.; Shen, Z.; Liu, Q. Influences of ambient pressure and nozzle-to-target distance on SC-CO2 jet impingement and perforation. J. Nat. Gas Sci. Eng. 2016, 29, 232–242. [Google Scholar] [CrossRef]
- Hu, Y.; Kang, Y.; Wang, X.; Li, X.; Huang, M.; Zhang, M. Experimental and theoretical analysis of a supercritical carbon dioxide jet on wellbore temperature and pressure. J. Nat. Gas Sci. Eng. 2016, 36, 108–116. [Google Scholar] [CrossRef]
- He, Z.; Li, G.; Tian, S.; Wang, H.; Shen, Z.; Li, J. SEM analysis on rock failure mechanism by supercritical CO2 jet impingement. J. Pet. Sci. Eng. 2016, 146, 111–120. [Google Scholar] [CrossRef]
- Sheng, M.; Li, G.; Huang, Z.; Tian, S.; Qu, H. Experimental study on hydraulic isolation mechanism during hydra-jet fracturing. Exp. Therm. Fluid Sci. 2013, 44, 722–726. [Google Scholar] [CrossRef]
- Du, Y.K.; Wang, R.H.; Ni, H.J.; Huang, Z.Y.; Li, M.K. Dynamical analysis of high-pressure supercritical carbon dioxide jet in well drilling. J. Hydrodyn. 2013, 25, 528–534. [Google Scholar] [CrossRef]
- Cheng, Y.; Li, G.; Wang, H.; Shen, Z.; Tian, S.; Fan, X. Pressure boosting effect in perforation cavity during supercritical carbon dioxide jet fracturing. At. Sprays 2013, 23, 463–474. [Google Scholar] [CrossRef]
- Biao, F.J.; Liu, H.; Zhang, S.C.; Zhang, J.; Wang, X.X. A numerical study of parameter influences on horizontal hydraulic fracture. Pet. Eng. 2011, 10, 228–235. [Google Scholar]
- Lian, Z.L.; Jing, Z.; Heng-An, W.U.; Wang, X.X.; Xue, B. A simulation study of hydraulic fracturing propagation with a solid-fluid coupling model. Rock Soil Mech. 2008, 11, 3021–3026. [Google Scholar]
- Li, H.; Zou, Y.S.; Liu, S.; Liu, G.Q.; Jing, Y.Z.; Ehlig-Economides, C.A. Prediction of fracture initiation pressure and fracture geometries in elastic isotropic and anisotropic formations. Rock Mech. Rock Eng. 2016, 50, 1–13. [Google Scholar] [CrossRef]
- Hossain, M.M.; Rahman, M.K.; Rahman, S.S. Hydraulic fracture initiation and propagation: Roles of wellbore trajectory, perforation and stress regimes. J. Pet. Sci. Eng. 2000, 27, 129–149. [Google Scholar] [CrossRef]
- Valkó, P.; Economides, M.J. Propagation of hydraulically induced fractures—A continuum damage mechanics approach. Int. J. Rock Mech. Min. Sci. Geomech. Abstr. 1994, 31, 221–229. [Google Scholar] [CrossRef]
- Fang, C.; Chen, W.; Amro, M. Simulation study of hydraulic fracturing using super critical CO2 in shale. In Proceedings of the Abu Dhabi International Petroleum Exhibition and Conference, Abu Dhabi, UAE, 10–13 November 2014. [Google Scholar]
- Ishida, T.; Aoyagi, K.; Niwa, T.; Chen, Y.; Murata, S.; Chen, Q.; Nakayama, Y. Acoustic emission monitoring of hydraulic fracturing laboratory experiment with supercritical and liquid CO2. Geophys. Res. Lett. 2012, 39, 16309. [Google Scholar] [CrossRef]
- Zolfaghari, N.; Meyer, C.R.; Bunger, A.P. Blade-shaped (PKN) Hydraulic Fracture Driven by a Turbulent Fluid in an Impermeable Rock. J. Eng. Mech. 2016, 143, 04017130. [Google Scholar] [CrossRef]
- Tang, G.; Shi, H.; Wu, Y.; Lu, J.; Li, Z.; Liu, Q.; Zhang, H. A variable turbulent Prandtl number model for simulating supercritical pressure CO2 heat transfer. Int. J. Heat Mass Transf. 2016, 102, 1082–1092. [Google Scholar] [CrossRef]
- Warpinski, N.R. Determining the minimum in situ stress from hydraulic fracturing through perforations. Int. J. Rock Mech. Min. Sci. Geomech. Abstr. 1989, 26, 523–531. [Google Scholar] [CrossRef]
Figure 1.
Schematic representation of the supercritical carbon dioxide (SC-CO2) hydro-jet fracturing.
Figure 1.
Schematic representation of the supercritical carbon dioxide (SC-CO2) hydro-jet fracturing.

Figure 2.
Shape of the shale rock perforation.

Figure 3.
Fluid–structure interaction (FSI) numerical model of SC-CO2 hydro-jet fracture.

Figure 4.
FSI code process.

Figure 5.
Numerical symmetric model of SC-CO2 jet in a closed perforation tunnel.

Figure 6.
Rock mechanics servo-controlled testing system (Instron 1346).

Figure 7.
Uniaxial compression experiment of four specimens. (a) Shale rock specimen; (b) The stress–strain curves of the specimen.
Figure 7.
Uniaxial compression experiment of four specimens. (a) Shale rock specimen; (b) The stress–strain curves of the specimen.

Figure 8.
Scanning Electron Microscope (SEM) images of the shale rock.

Figure 9.
2-D model of the shale rock.

Figure 10.
Tangent modulus distribution of elements in the shale rock model.

Figure 11.
Flow field and stress field before fracture initiation.

Figure 12.
Flow field and stress field before fracture initiation.

Figure 13.
Flow field and stress field before fracture initiation.

Figure 14.
Flow field and stress field before fracture initiation.

Figure 15.
Axial velocity and static pressure along the axial direction. (a) the results of this paper; (b) the results of He.
Figure 15.
Axial velocity and static pressure along the axial direction. (a) the results of this paper; (b) the results of He.

Figure 16.
z-directional stress distribution along the perforation wall.

Figure 17.
y-directional stress distribution at the tip.

Figure 18.
z-directional stress distribution at the root.

Figure 19.
Initiation of cracks under different perforation pressures. (a) 3 Mpa; (b) 10 Mpa; (c) 15 Mpa; (d) 20 Mpa.
Figure 19.
Initiation of cracks under different perforation pressures. (a) 3 Mpa; (b) 10 Mpa; (c) 15 Mpa; (d) 20 Mpa.

Figure 20.
Number of failure elements under different pressures.

Figure 21.
z-directional stress distribution along the perforation wall.

Figure 22.
y-directional stress distribution at the tip.

Figure 23.
z-directional stress distribution at the root.

Figure 24.
Stress distribution under different in situ stress situations.

Figure 25.
Number of failure elements under different pressure values.

Figure 26.
Distribution of the total pressure on the perforation tunnel wall.

Figure 27.
z-directional stress distribution along the wall.

Figure 28.
y-directional stress distribution at the tip.

Figure 29.
Stress distribution under various in situ stress conditions. (a) Case for which L0 = 2, r0 = 0.75. (b) Case for which L0 = 2, r0 = 1. (c) Case for which L0 = 2, r0 = 1.5.
Figure 29.
Stress distribution under various in situ stress conditions. (a) Case for which L0 = 2, r0 = 0.75. (b) Case for which L0 = 2, r0 = 1. (c) Case for which L0 = 2, r0 = 1.5.

Figure 30.
Number of failure elements under different pressure conditions.

Figure 31.
Distribution of the static pressure along the axial direction.

Figure 32.
z-directional stress distribution along the wall.

Figure 33.
y-directional stress distribution at the tip.

Figure 34.
Stress distribution under different aperture ratios. (a) Case for which r0/R = 0.66. (b) Case for which r0/R = 1. (c) Case for which r0/R = 1.33.
Figure 34.
Stress distribution under different aperture ratios. (a) Case for which r0/R = 0.66. (b) Case for which r0/R = 1. (c) Case for which r0/R = 1.33.

Figure 35.
Number of failure elements under different pressure conditions.

Figure 36.
z-directional stress distribution along the wall. (a) The influence of α; (b) The influence of β.
Figure 36.
z-directional stress distribution along the wall. (a) The influence of α; (b) The influence of β.

Figure 37.
z-directional stress distribution at the root of the perforation. (a) The influence of α; (b) The influence of β.
Figure 37.
z-directional stress distribution at the root of the perforation. (a) The influence of α; (b) The influence of β.

Figure 38.
Number of failure elements under different pressure conditions. (a) The influence of ; (b) The influence of .
Figure 38.
Number of failure elements under different pressure conditions. (a) The influence of ; (b) The influence of .


Table 1.
Various mechanical properties of the four specimens.
| Item | Specimen-1 | Specimen-2 | Specimen-3 | Specimen-4 |
|---|---|---|---|---|
| Maximum Stress (MPa) | 109.654 | 242.697 | 168.549 | 259.498 |
| Maximum Strain (E-3) | 5.959 | 8.084 | 7.331 | 7.306 |
| Elasticity Modulus (GPa) | 27.655 | 35.630 | 29.613 | 39.042 |
| Tangent Modulus (GPa) | 14.040 | 28.448 | 18.996 | 34.491 |
| Poisson’s Ratio | 0.244 | 0.220 | 0.159 | 0.173 |
Table 2.
Various parameters and their values used in the simulation.
| Item | Symbol | Value |
|---|---|---|
| pressure difference (MPa) | 10 | |
| jet inlet pressure (MPa) | 20 | |
| ambient pressure (MPa) | 10 | |
| nozzle outlet length (mm) | 2 | |
| perforation pressure (MPa) | 3/15/15/20 | |
| in situ stress (MPa) | (5, 10)/(10, 10)/(12, 10)/(15, 10) | |
| nozzle outlet radius (mm) | 0.75/1/1.5 | |
| nozzle-to-casing inlet radius ratio | ||
| Weibull parameter | 2, 3, 4 | |
| Weibull parameter | 1.2, 1.6, 2.0 |
© 2017 by the authors. Licensee MDPI, Basel, Switzerland. This article is an open access article distributed under the terms and conditions of the Creative Commons Attribution (CC BY) license (http://creativecommons.org/licenses/by/4.0/).
Share and Cite
MDPI and ACS Style
Hu, Y.; Liu, Y.; Cai, C.; Kang, Y.; Wang, X.; Huang, M.; Chen, F. Fracture Initiation of an Inhomogeneous Shale Rock under a Pressurized Supercritical CO2 Jet. Appl. Sci. 2017, 7, 1093. https://0-doi-org.brum.beds.ac.uk/10.3390/app7101093
AMA Style
Hu Y, Liu Y, Cai C, Kang Y, Wang X, Huang M, Chen F. Fracture Initiation of an Inhomogeneous Shale Rock under a Pressurized Supercritical CO2 Jet. Applied Sciences. 2017; 7(10):1093. https://0-doi-org.brum.beds.ac.uk/10.3390/app7101093
Chicago/Turabian StyleHu, Yi, Yiwei Liu, Can Cai, Yong Kang, Xiaochuan Wang, Man Huang, and Feng Chen. 2017. "Fracture Initiation of an Inhomogeneous Shale Rock under a Pressurized Supercritical CO2 Jet" Applied Sciences 7, no. 10: 1093. https://0-doi-org.brum.beds.ac.uk/10.3390/app7101093
Note that from the first issue of 2016, this journal uses article numbers instead of page numbers. See further details here.