ECG Identification Based on Non-Fiducial Feature Extraction Using Window Removal Method

1
Department of Media Engineering, The Catholic University of Korea, Bucheon-si 14992, Korea
2
Department of Media Technology and Contents, The Catholic University of Korea, Bucheon-si 14992, Korea
*
Author to whom correspondence should be addressed.
Appl. Sci. 2017, 7(11), 1205; https://0-doi-org.brum.beds.ac.uk/10.3390/app7111205
Submission received: 12 October 2017
/
Revised: 10 November 2017
/
Accepted: 20 November 2017
/
Published: 22 November 2017
(This article belongs to the Special Issue Smart Environment and Healthcare)
Abstract
:This study proposes electrocardiogram (ECG) identification based on non-fiducial feature extraction using window removal method, nearest neighbor (NN), support vector machine (SVM), and linear discriminant analysis (LDA). In the pre-processing stage, Daubechies 4 is used to remove the baseline wander and noise of the original signal. In the feature extraction and selection stage, windows are set at a time interval of 5 s in the preprocessed signal, while autocorrelation, scaling, and discrete cosine transform (DCT) are applied to extract and select features. Thereafter, the window removal method is applied to all of the generated windows to remove those that are unrecognizable. Lastly, in the classification stage, the NN, SVM, and LDA classifiers are used to perform individual identification. As a result, when the NN is used in the Normal Sinus Rhythm (NSR), PTB diagnostic, and QT database, the results indicate that the subject identification rates are 100%, 99.40% and 100%, while the window identification rates are 99.02%, 97.13% and 98.91%. When the SVM is used, all of the subject identification rates are 100%, while the window identification rates are 96.92%, 95.82% and 98.32%. When the LDA is used, all of the subject identification rates are 100%, while the window identification rates are 98.67%, 98.65% and 99.23%. The proposed method demonstrates good results with regard to data that not only includes normal signals, but also abnormal signals. In addition, the window removal method improves the individual identification accuracy by removing windows that cannot be recognized.
1. Introduction
Biometrics refers to the recognition of individuals based on physiological or behavioral characteristics [1]. Representative biometric traits include the face, fingerprints, retina, iris, and voice. Various methods use these information sources to recognize individuals [2,3,4]. These traditional identification technologies have limitations, such as a limited scope recognition, as well as vulnerability to loss and duplication. Therefore, for systems that require higher security, studies of the distinct biometric features of the principal subject to verification are actively being conducted. Electrocardiogram (ECG) involves information about the structural and functional cardiac muscle activities, and it is a simple and effective representative of a noninvasive diagnostic method. Every individual has characteristic ECG features, such as universality, uniqueness, and liveness detection. Such signals provide strong protection against forgery [5]. However, in biometric recognition using ECG, signal irregularities may exist due to the individual’s illness, and the procedure could be hampered by difficulties, such as a long waiting time for data collection [6,7,8]. Nevertheless, studies on ECG biometrics can be used in extensive fields, such as commercial environments, security, health management, and systems like smart cards [9]. Thus, it is necessary to enhance the accuracy of recognition.
As a biometric study using ECG, fiducial point-based studies were performed as follows: Israel et al. [10] suggested ECG-based recognition system using temporal features. After removing the noise in an ECG signal, P wave, QRS complex, and the T wave were detected and by extracting 15 fiducial point features, linear discriminant analysis (LDA) was used for classification. As a result of experimenting with 29 subjects, the results indicated a 100% subject identification rate and an 82% ECG beat identification rate. Biel et al. [11] extracted 30 fiducial point features of ECG signals and then used soft independent modeling of a class analogy (SIMCA) classifier to compare the unlabeled data with the data of a trained group, and suggested a method of classification into the most well-matched class. A test experiment was conducted on 20 subjects in total, which demonstrated a 100% recognition rate. Wang et al. [12] suggested a method of combining the time between ECG beats, amplitude features, and R wave features. Fiducial point detection was performed to measure the time and waveform distance in the pre-processed ECG signal and principal component analysis (PCA), or LDA was used to extract the morphological features. In case that the two types of features were combined for performance, there was a 100% subject identification rate and a beat identification rate of 99.43%; 98.90% were identified with regard to the 13 subjects of the NSR and PTB database (DB), respectively. However, the problem with the fiducial-based algorithm is that it misses the morphological features of ECG signals. In addition, these features may increase the overall complexity of a biometric system due to the lack of universally accepted rules for the precise detection of the fiducial points for ECG waveforms [13,14]. In the detection of R peaks among various ECG waveforms, the detection criteria for waveforms other than those of R peaks are not clearly defined [15,16].
Non-fiducial point-based studies have been conducted in order to overcome the disadvantages of the fiducial point method. Unlike the fiducial point-based method, the non-fiducial approach-based method does not require precise boundaries of the waveforms. It extracts differential data among ECG waveforms without obvious fiducial points. As a non-fiducial point-based study, several studies were performed as follows: Coutinho et al. [17] proposed a non-fiducial method of ECG recognition using a band pass filter with a 1–30 Hz frequency for the ECG signal to remove the noise, applying an n-bit uniform quantization and using a string similarity measure. As a result of using the data acquired from 26 subjects and the PTB DB from 51 people, 99.94% was identified in the data acquired and 99.39% was identified in the PTB DB. Agrafioti et al. [18] acquired data from 56 subjects from the NSR, MIT-BIH arrhythmia database, and PTB DB, and selected the features using LDA in order to perform human recognition using ECG signals. Thereafter, nearest neighbor (NN) was used to classify the features. As a result, the beat identification rate was 96.2% and the subject identification rate was 96.42%, indicating a relatively high accuracy. Chan et al. [19] suggested a non-fiducial feature extraction framework using a distance measuring set that includes the wavelet transform distance. Data was collected from 50 subjects by using a button electrode between the thumb and index finger. The result of 89% accuracy was shown by applying the wavelet transform distance method. Chiu et al. [20] suggested an individual identification method by using a Euclidean classifier and a 512 point feature extraction by applying a wavelet transform. The suggested method demonstrated a 100% recognition rate on 35 subjects, with a normal signal and an 81% recognition rate on 10 subjects with arrhythmia. Loong et al. [21] proposed a biometric recognition system using a spectrum coefficient obtained through linear predictive coding (LPC). Data was acquired from 15 subjects by using one electrode. In the acquired data, features were extracted by using an LPC spectrum. The beat identification rate was 99.52% and the subject identification rate was 100% by using the neural network classifier.
The non-fiducial approach-based method extracts features based on the time interval of the window. Other unnecessary types of signals may have been included other than those of the normal ECG in the window leading to decreased overall recognition rates. Thus, most of the previous studies including those mentioned above, performed with or without using data containing abnormal signals, showed poor results during ECG identification. In particular, non-fiducial-based studies, such as those of Wang et al. [12], Plataniotis et al. [14], and Afrafioti et al. [18] can extract features using a window of time intervals. In the identification process using a window, a window is set at specific time intervals in the ECG signal, and classification is performed on all of the windows. Based on the results of the window identification rate, the subject class is finally determined by window majority voting. When setting the window of the time interval, a window may be generated, which interferes with the identification performance because a disease signal or a distorted signal may be present. As a result, this can lead to a decrease in the overall identification rate as well as a decrease in the window identification rate. This problem can be solved by examining all of the generated windows and removing the ones that are not recognizable or those that contain other unnecessary signals. In applying discrete cosine transform (DCT) to the windows that are generated at specific time intervals, spectrum differences may have occurred between the windows that contained the normal ECG and those with the distorted signals, causing differences in the energy distribution of the signals [18]. Therefore, in this study, it is possible to increase the overall identification rate by applying DCT to all of the generated windows and then removing the unnecessary windows that do not fit the condition, by applying the window removal method using the threshold setting.
In addition to the above-mentioned problem, most of the previous studies performed identification on small sample sizes. Experiments with small sample sizes may be insufficient to evaluate an algorithm’s effectiveness. In addition, individual identification has effects on the resulting classification, such as signal processing and pattern recognition. The performance of the entire algorithm could be influenced depending on how the features of the original signal were extracted or how many features were selected [21]. Therefore, it is possible to improve the reliability of the algorithms by performing an analysis according to the feature numbers and classifiers, as well as demonstrating a high accuracy by performing experiments with diverse sample DBs.
This study proposes a new method of increasing the individual identification rate by extracting features based on a non-fiducial technique and applying window removal method in order to remove windows that are difficult to identify. The main consideration of this study is to evaluate whether the proposed window removal method is efficient for improving the identification rate according to the NSR, PTB, and QT DB, to analyze the recognition performance according to the NN, SVM, and LDA classifiers, and to evaluate whether it is robust in environments containing normal, as well as abnormal, signals.
2. Methods
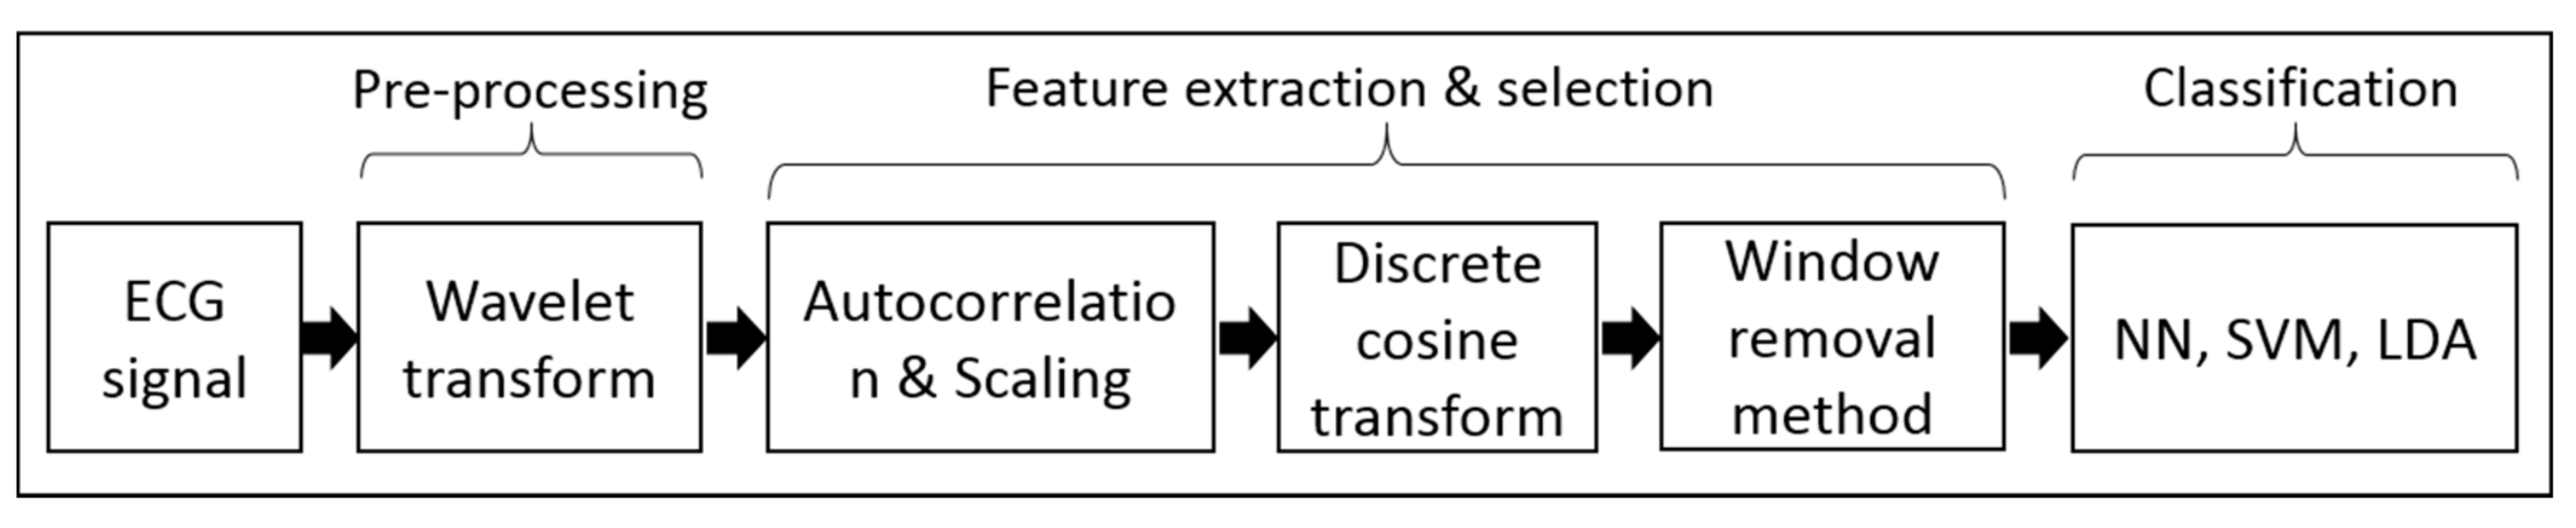
The experimental method of this study is shown Figure 1. A wavelet is used to pre-process the ECG signal and autocorrelation, scaling, and DCT are applied to the pre-processed signal. Thereafter, the window removal method is applied to remove the unnecessary window and the NN, SVM, and LDA classifiers are used to perform the individual identification.
2.1. Database
The Normal Sinus Rhythm Database [22], PTB Diagnostic Database [23], and QT Database [24] are used in this paper. To verify the robustness and efficiency of the proposed algorithm, we use three well-known DBs. The three DBs are described below.
2.1.1. Normal Sinus Rhythm Database (NSR DB)
The Normal Sinus Rhythm Database was collected at the Arrhythmia Laboratory at Beth Israel Hospital in Boston. The NSR DB contains 18 ECG records, sampled at 128 Hz, and includes five males aged 26 to 45 years and 13 females aged 20 to 50 years.
2.1.2. PTB Diagnostic Database (PTB DB)
The PTB DB contains 549 records from 290 subjects (aged 17 to 87, 209 men, and 81 women; ages were not recorded for one female and 14 male subjects). It is provided by the National Metrology Institute of Germany. The signal was sampled at 1000 Hz with a 16 bit resolution with 0.5 μV, 16 input channel, and 0–1 kHz bandwidth. It was collected from Benjamin Franklin University Hospital, Cardiology Department of Cardiology, Berlin, and contains the ECG data of various healthy and diseased patients.
2.1.3. QT Database (QT DB)
The QT DB contains a selection of ECG signals to represent various QRS and ST-T morphologies. This record was primarily selected from existing ECG databases, including the MIT-BIH arrhythmia DB, the European Heart Association ST-T DB, and several other ECG databases that were collected at Boston’s Beth Israel Deaconess Medical Center. The QT DB contains a total of 105 fifteen-minute excerpts of two channel ECGs, sampled at 250 Hz, and a total of 3622 beats are summarized by a cardiologist.
2.2. Pre-Processing
In order to remove the baseline wander and power line of the ECG signal, daubechies 4 is used. Daubechies 4 is similar to ECG signal and is able to remove efficiently [25]. After decomposing level 7 using daubechies 4, the lowest Level 7 high frequency components are set as 0 then inverse wavelet with Level 7 low frequency components is performed to create the components of (inverse wavelet of ). Inverse wavelet is performed repeated until the upper level 2 to create the components of . Then, components are removed in the level 1 low frequency components . Finally, level 1 high frequency components are set as 0 and by performing inverse wavelet of , the signal with removed noise is reconstructed.
where IW is inverse wavelet, is low frequency of nth level, and is high frequency of nth level.
2.3. Feature Extraction and Selection Based on the Non-Fiducial Approach
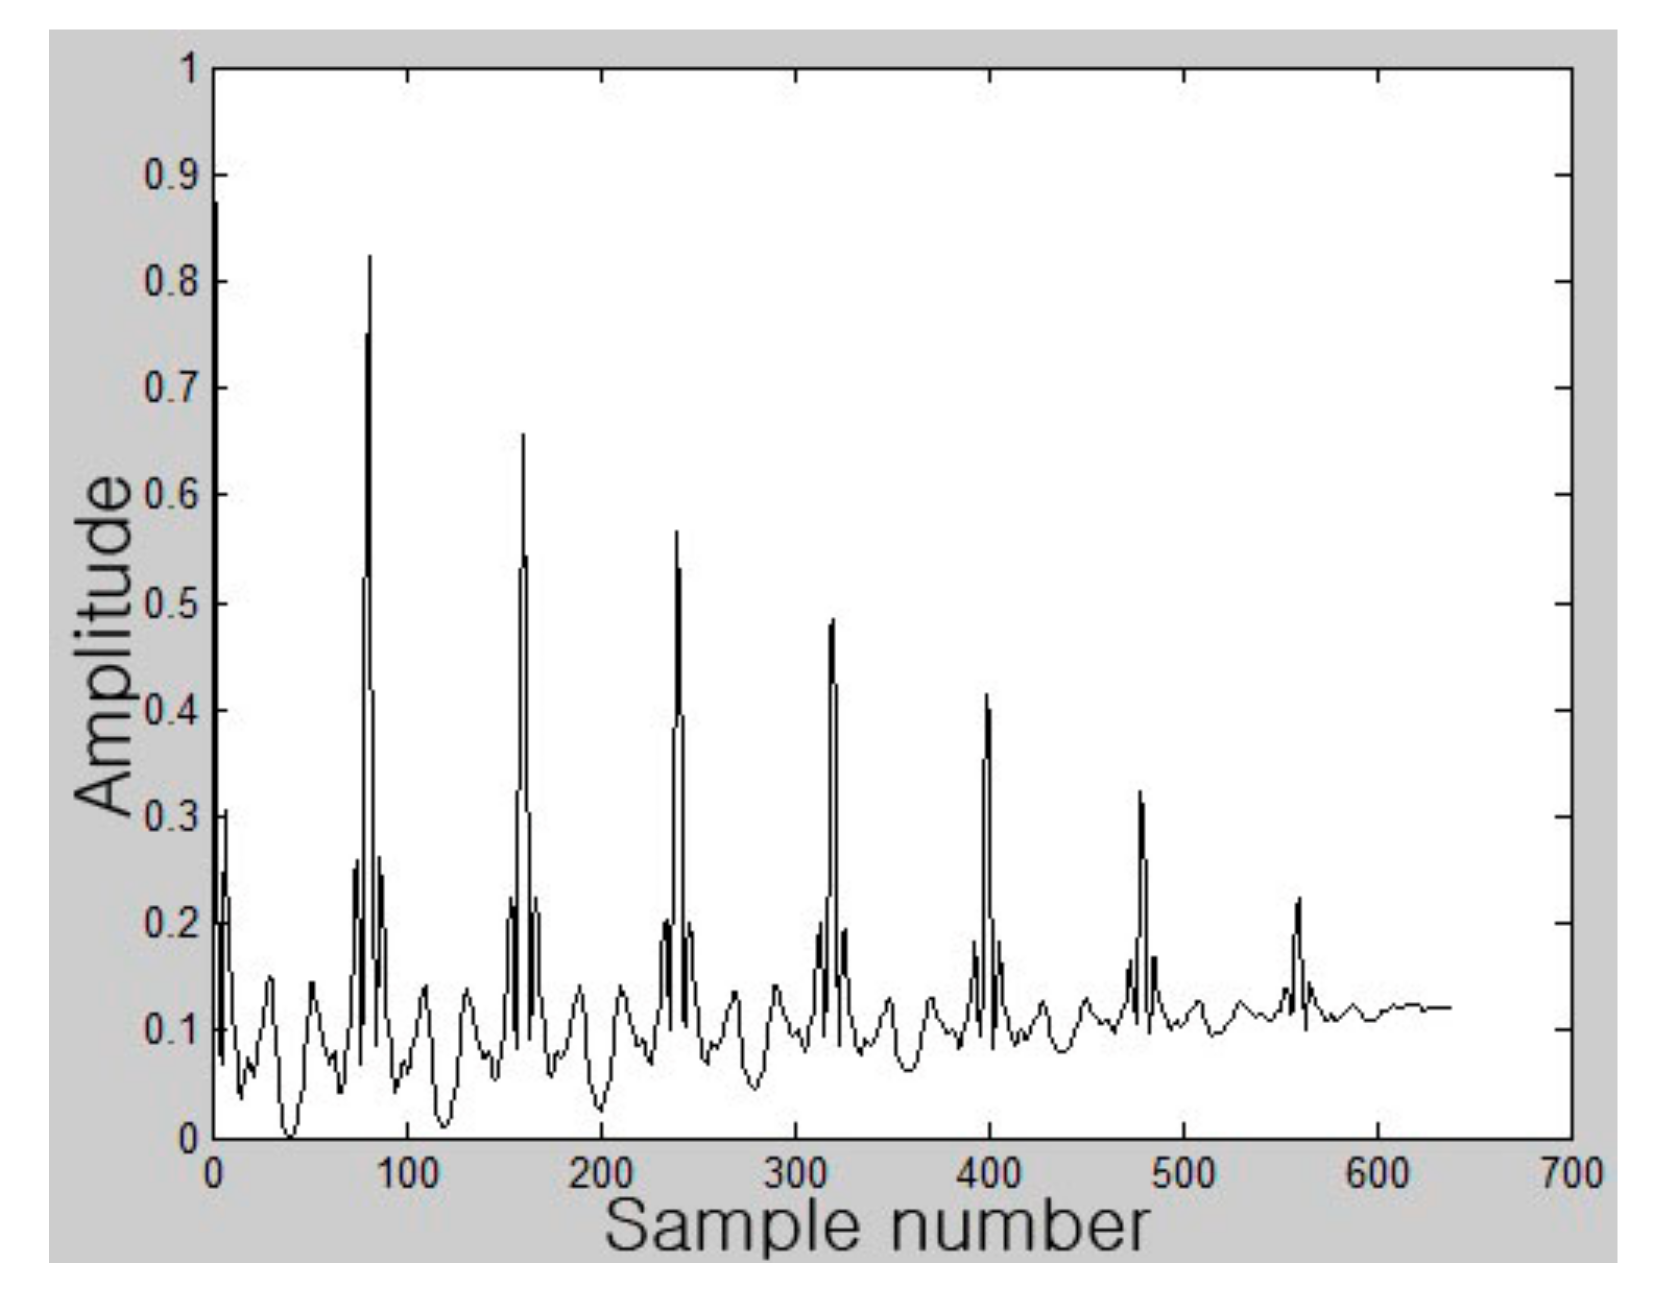
In the extraction and selection stage, windows are generated by setting intervals of 5 s in the ECG signal. Autocorrelation represents the correlation value of the time difference, and it utilizes the time difference value of the ECG signal. In this study, autocorrelation is defined as Equation (2), and is applied to the 5 s window. Thereafter, to reduce the difference between the signals and to balance them, a scaling between 0 to 1, defined as Equation (3), is performed, and the DCT, defined as Equation (4), is used to extract the coefficient.
where represents an window, and represents time shift of window.
where Y indicates the scaled data matrix and indicates the sth sample vector.
where N indicates the total length of the signal and is defined as Equation (5).
2.4. Window Removal and Identification Method
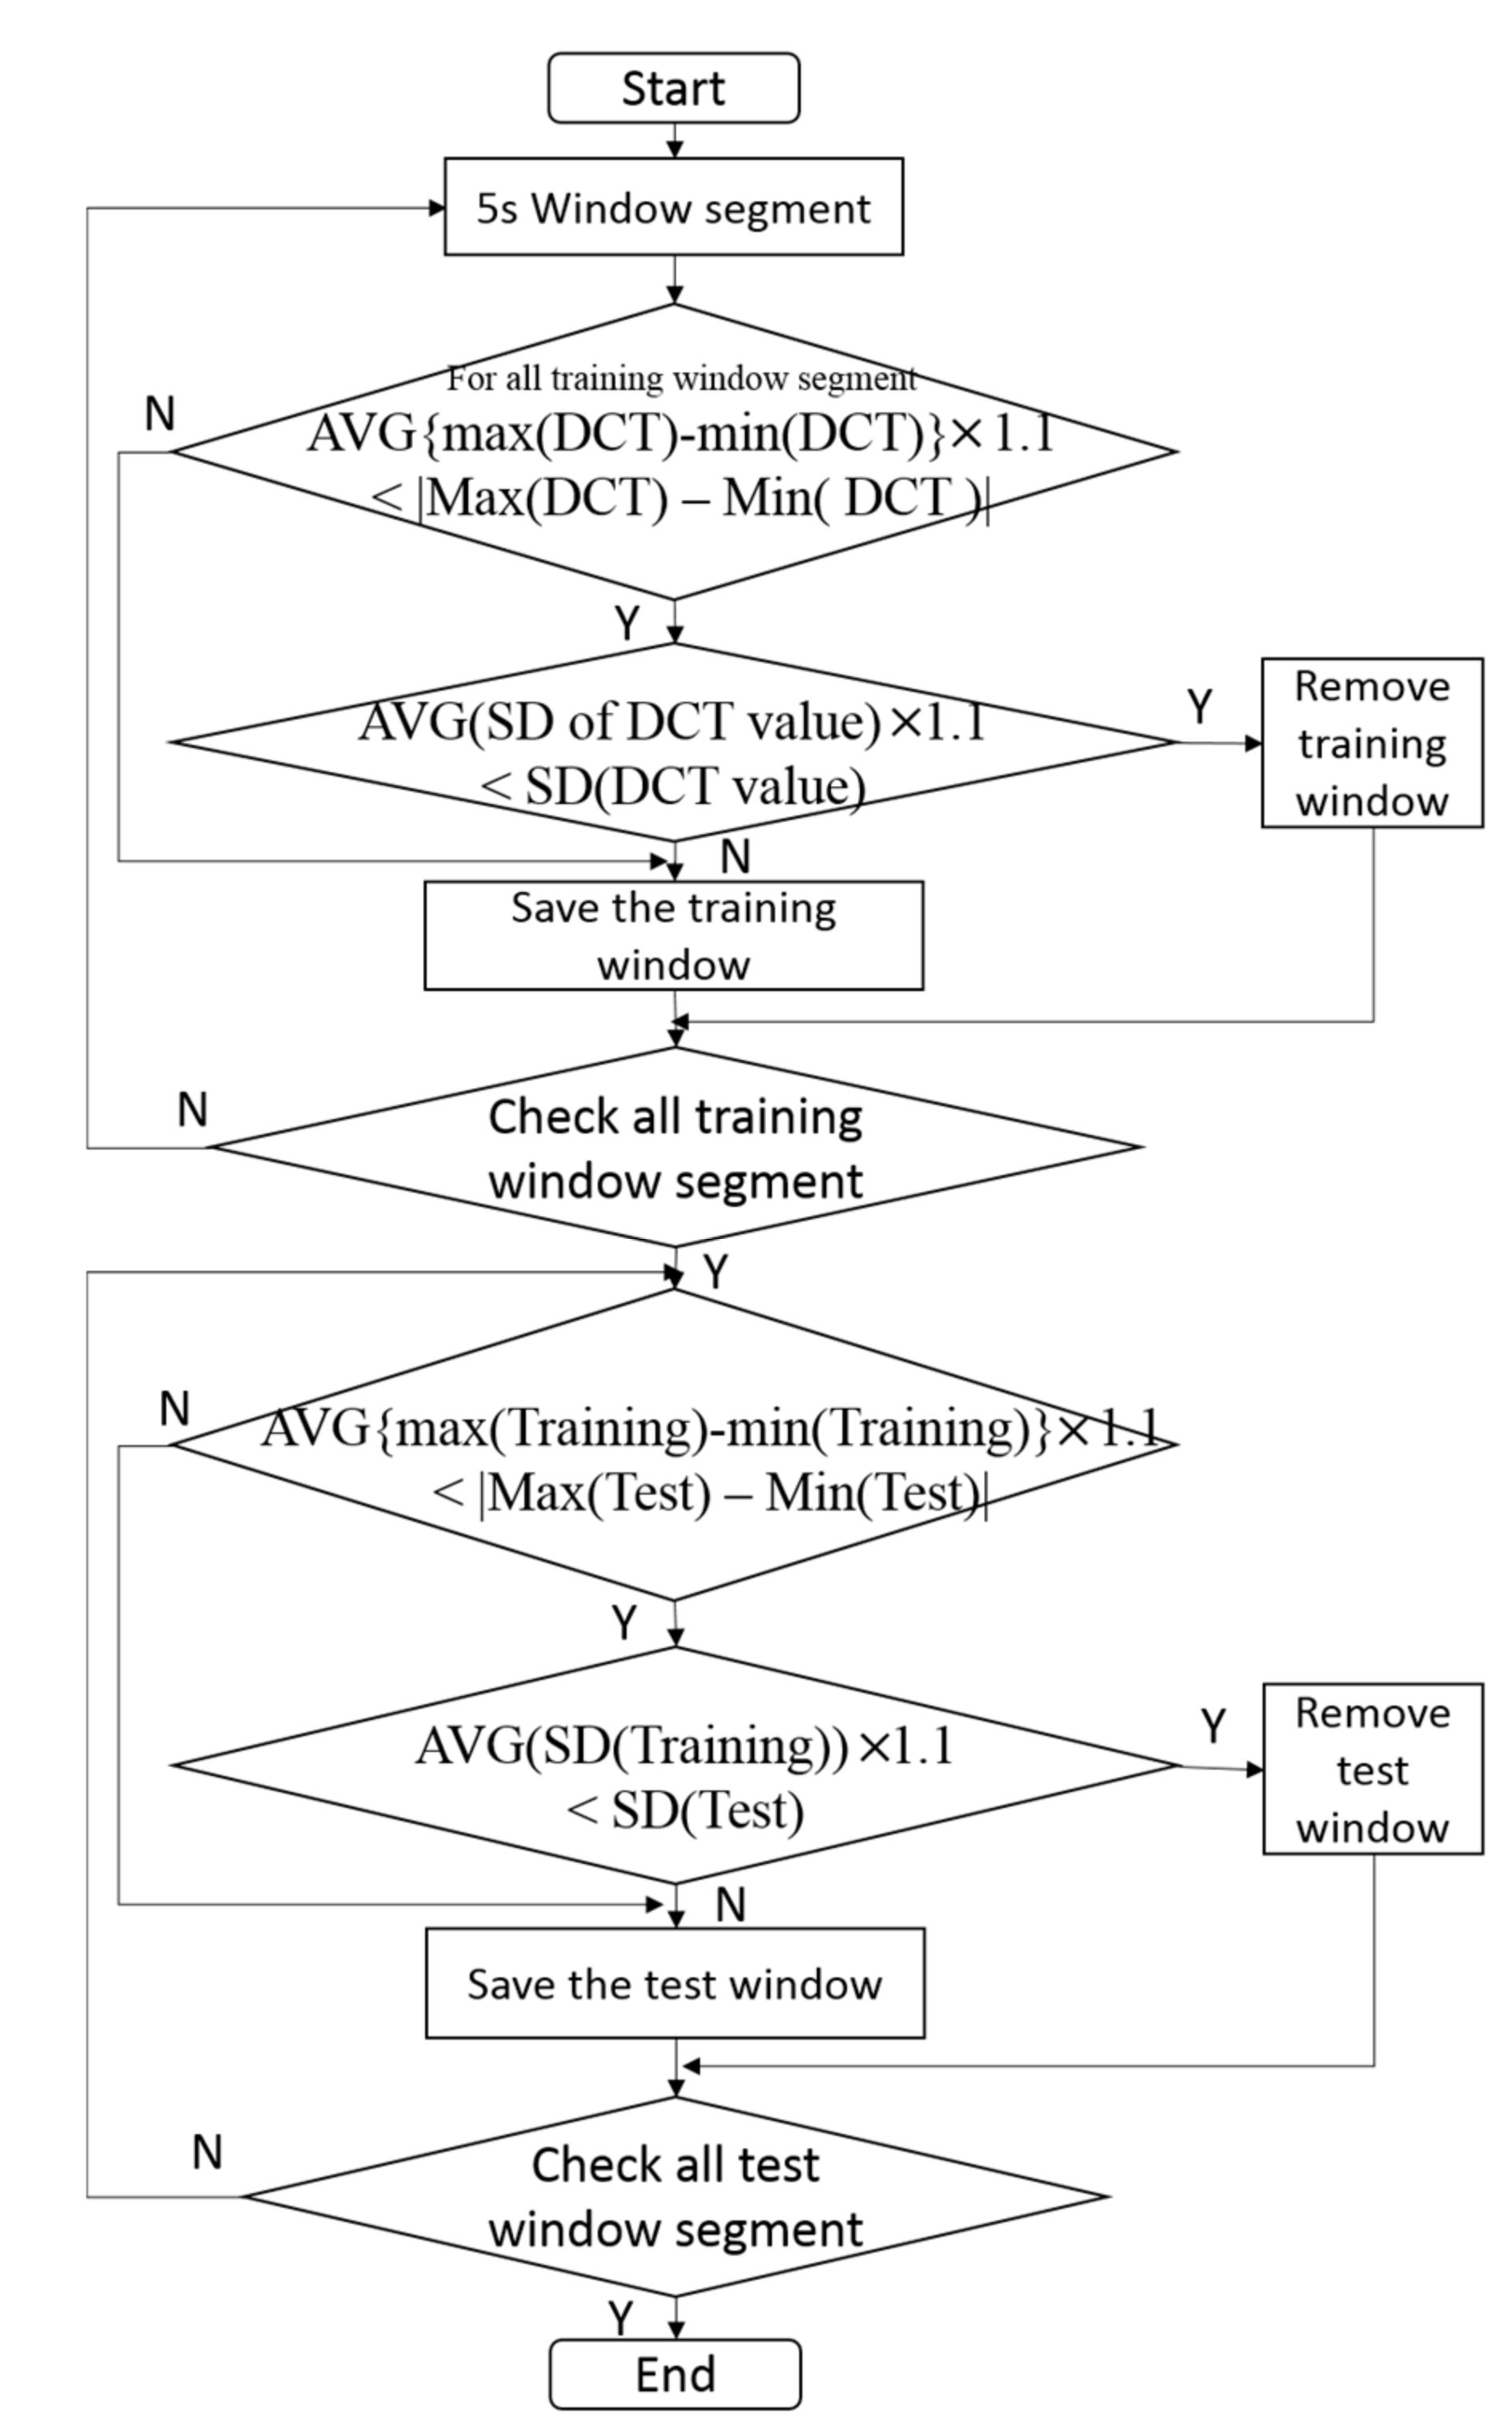
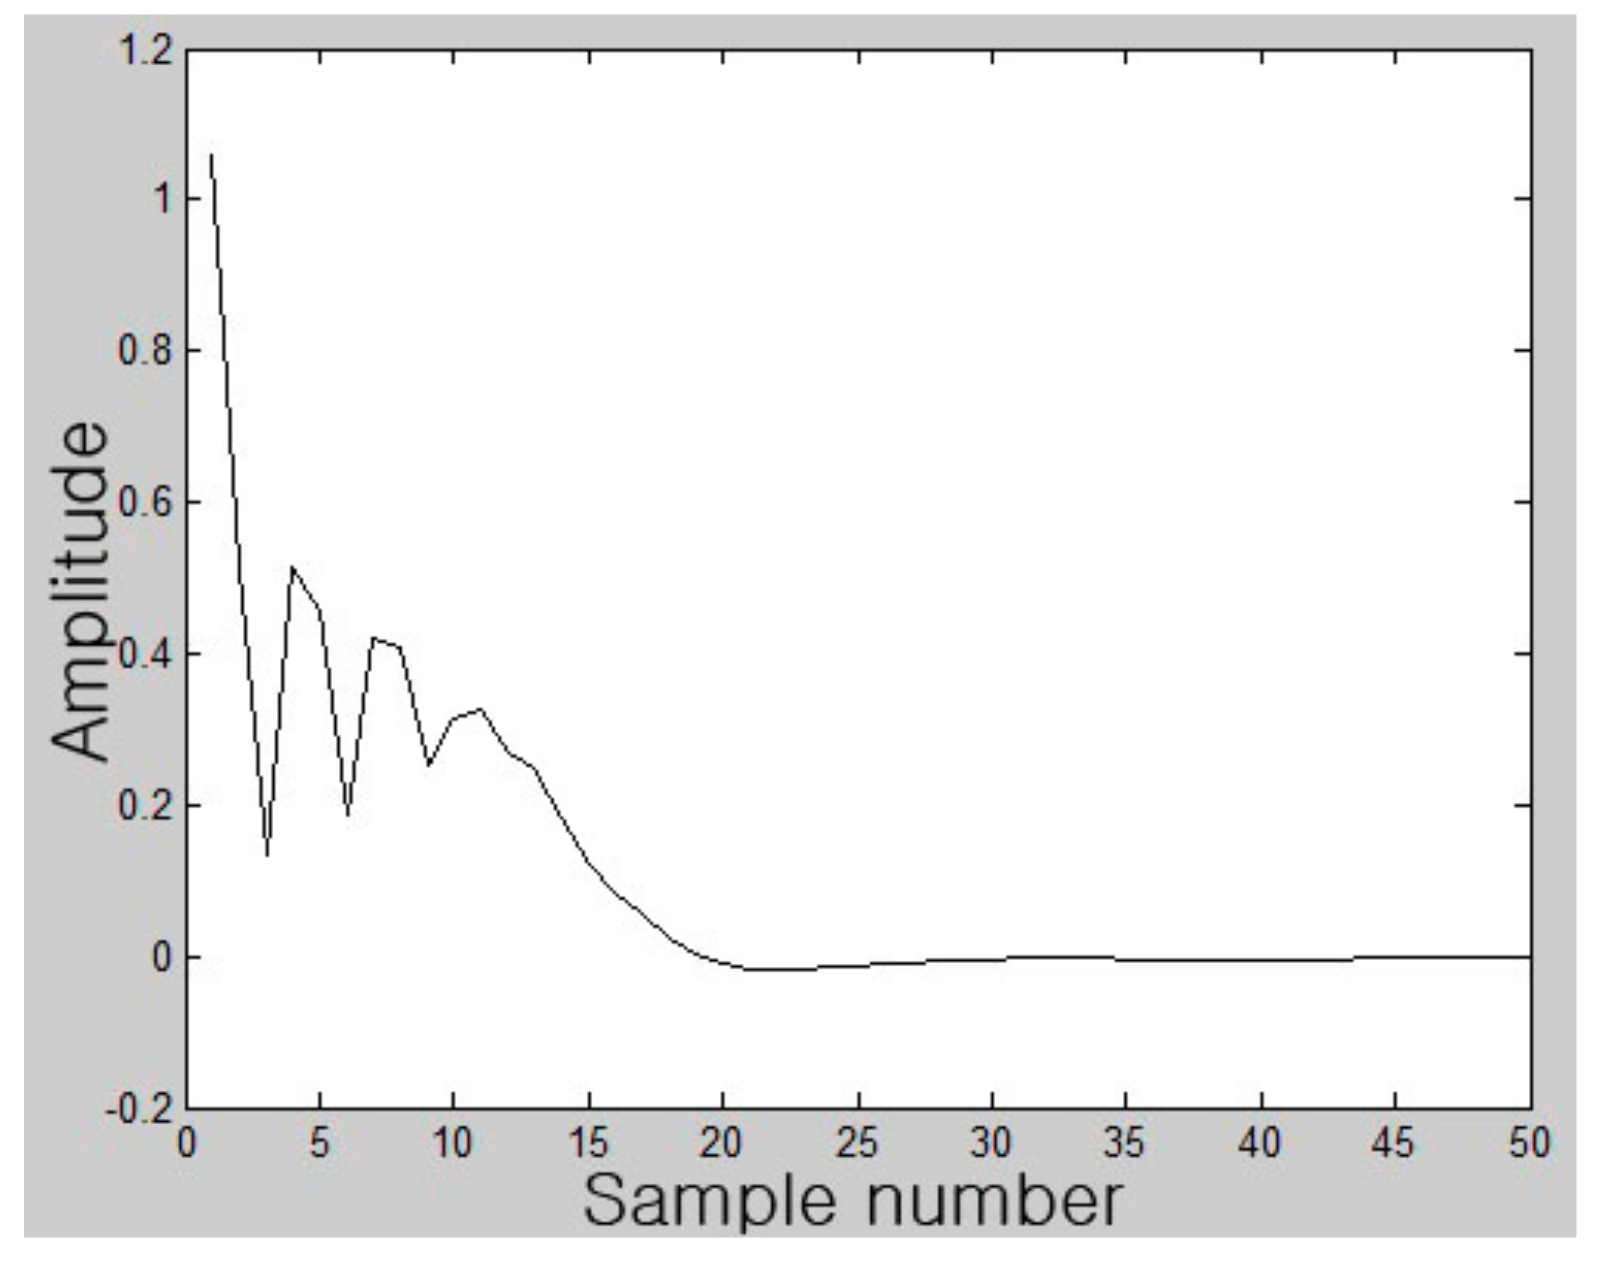
Unlike windows, which only contain a normal signal, windows containing noise or distorted signals may have a different DCT value [18]. Due to the repetitive feature of ECG signals, the DCT energy of normal signals is reflected to a certain extent, but the DCT energy for signals other than normal ones tends to reduce rapidly. Such energy changes can be used to remove unnecessary signals. Therefore, in this study, DCT coefficients are used to remove windows that are difficult to be identified due to the noise or distorted signals. Window removal is defined as Equation (6), and the threshold is determined as the value that can obtain the best result through the experiment. First, the unnecessary windows are removed by applying Equation (6) in training windows. Thereafter, all of the test windows are checked by applying Equation (6) with the remaining training windows. The absolute value of the difference between the DCT coefficient’s maximum and minimum value of the test window is more than 1.1 times the average value of the difference between the maximum and minimum value of the training windows. Additionally, the standard deviation of a test window is more than 1.1 times the average standard deviation of training windows. A test window that meets the above conditions is removed. The flow chart of the window removal method is shown in Figure 2.
It is possible to derive various identification results based on the classifier. NN, SVM, and LDA classifiers are used in various fields, not only the ECG field, but also mechanical systems, EEG and vision. These classifiers are performed simply and quickly [26,27,28]. In this study, Euclidean-based NN, SVM, and LDA classifiers are applied to analyze the individual identification result according to the classifier. In order to perform classification, half of each of the subjects of the NSR, PTB, and QT DB are set as the training data, and the remaining data is set as test. Euclidean distance, as a method of obtaining the distance between two points, is defined as Equation (7) and SVM, as a method of determining the optimal classification plane with minimum error, is defined as Equation (8). Furthermore, LDA, which involves determining the W that maximizes the rate between classes and minimizes the rate within each class is defined as Equations (10)–(12).
With regards to the hyper plane of Equation (8), the random feature vector, satisfies Equation (9).
where indicates the average of class and indicates the global average. indicates the number of data within class .
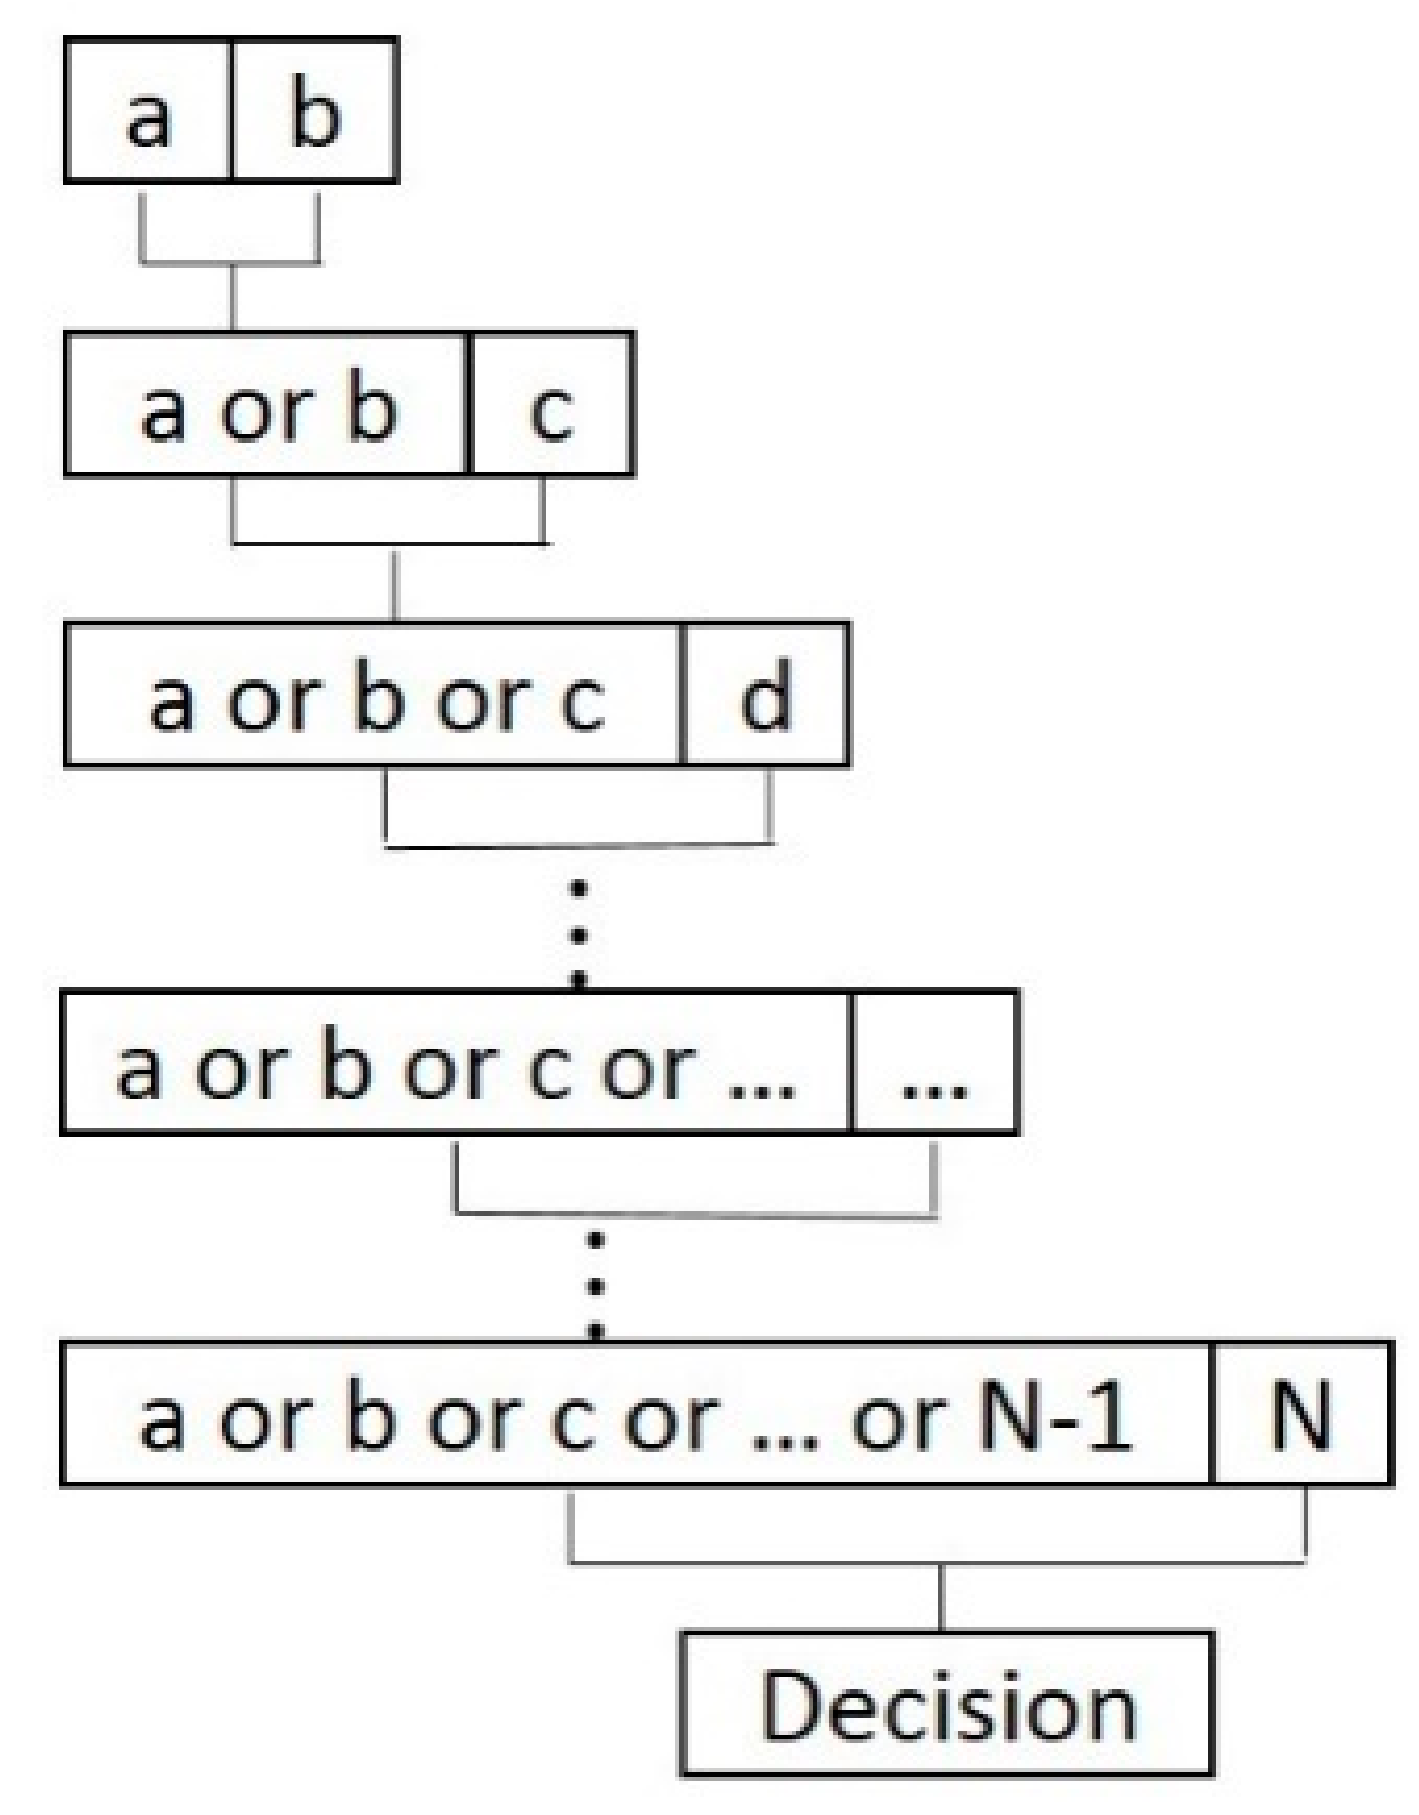
Generally, in the case of multiple classes, one vs all (OAA) is used a lot but if the training set is unbalanced, classification is difficult in OAA. Therefore, this study uses the one vs one (OAO) method. OAO, as a method of inspecting two classes by creating the classifier of , uses a hierarchical method of OAO to be used in individual identification. Hierarchical OAA is shown in Figure 3.
3. Results and Discussion
NSR, PTB, and the QT DB are used to perform the method proposed in this study. 18 subjects in the NSR DB, 50 subjects in the PTB DB, and 36 subjects in the QT DB are used. The total number of windows in each DB is 184 (Unmeasured portions were excluded), 600 and 432. At random for each subject, half of the window is set to training data, and the rest is set to testing data to perform the window recognition. Thereafter, the subject class is determined using a majority voting. The experimental setting is shown in Table 1.
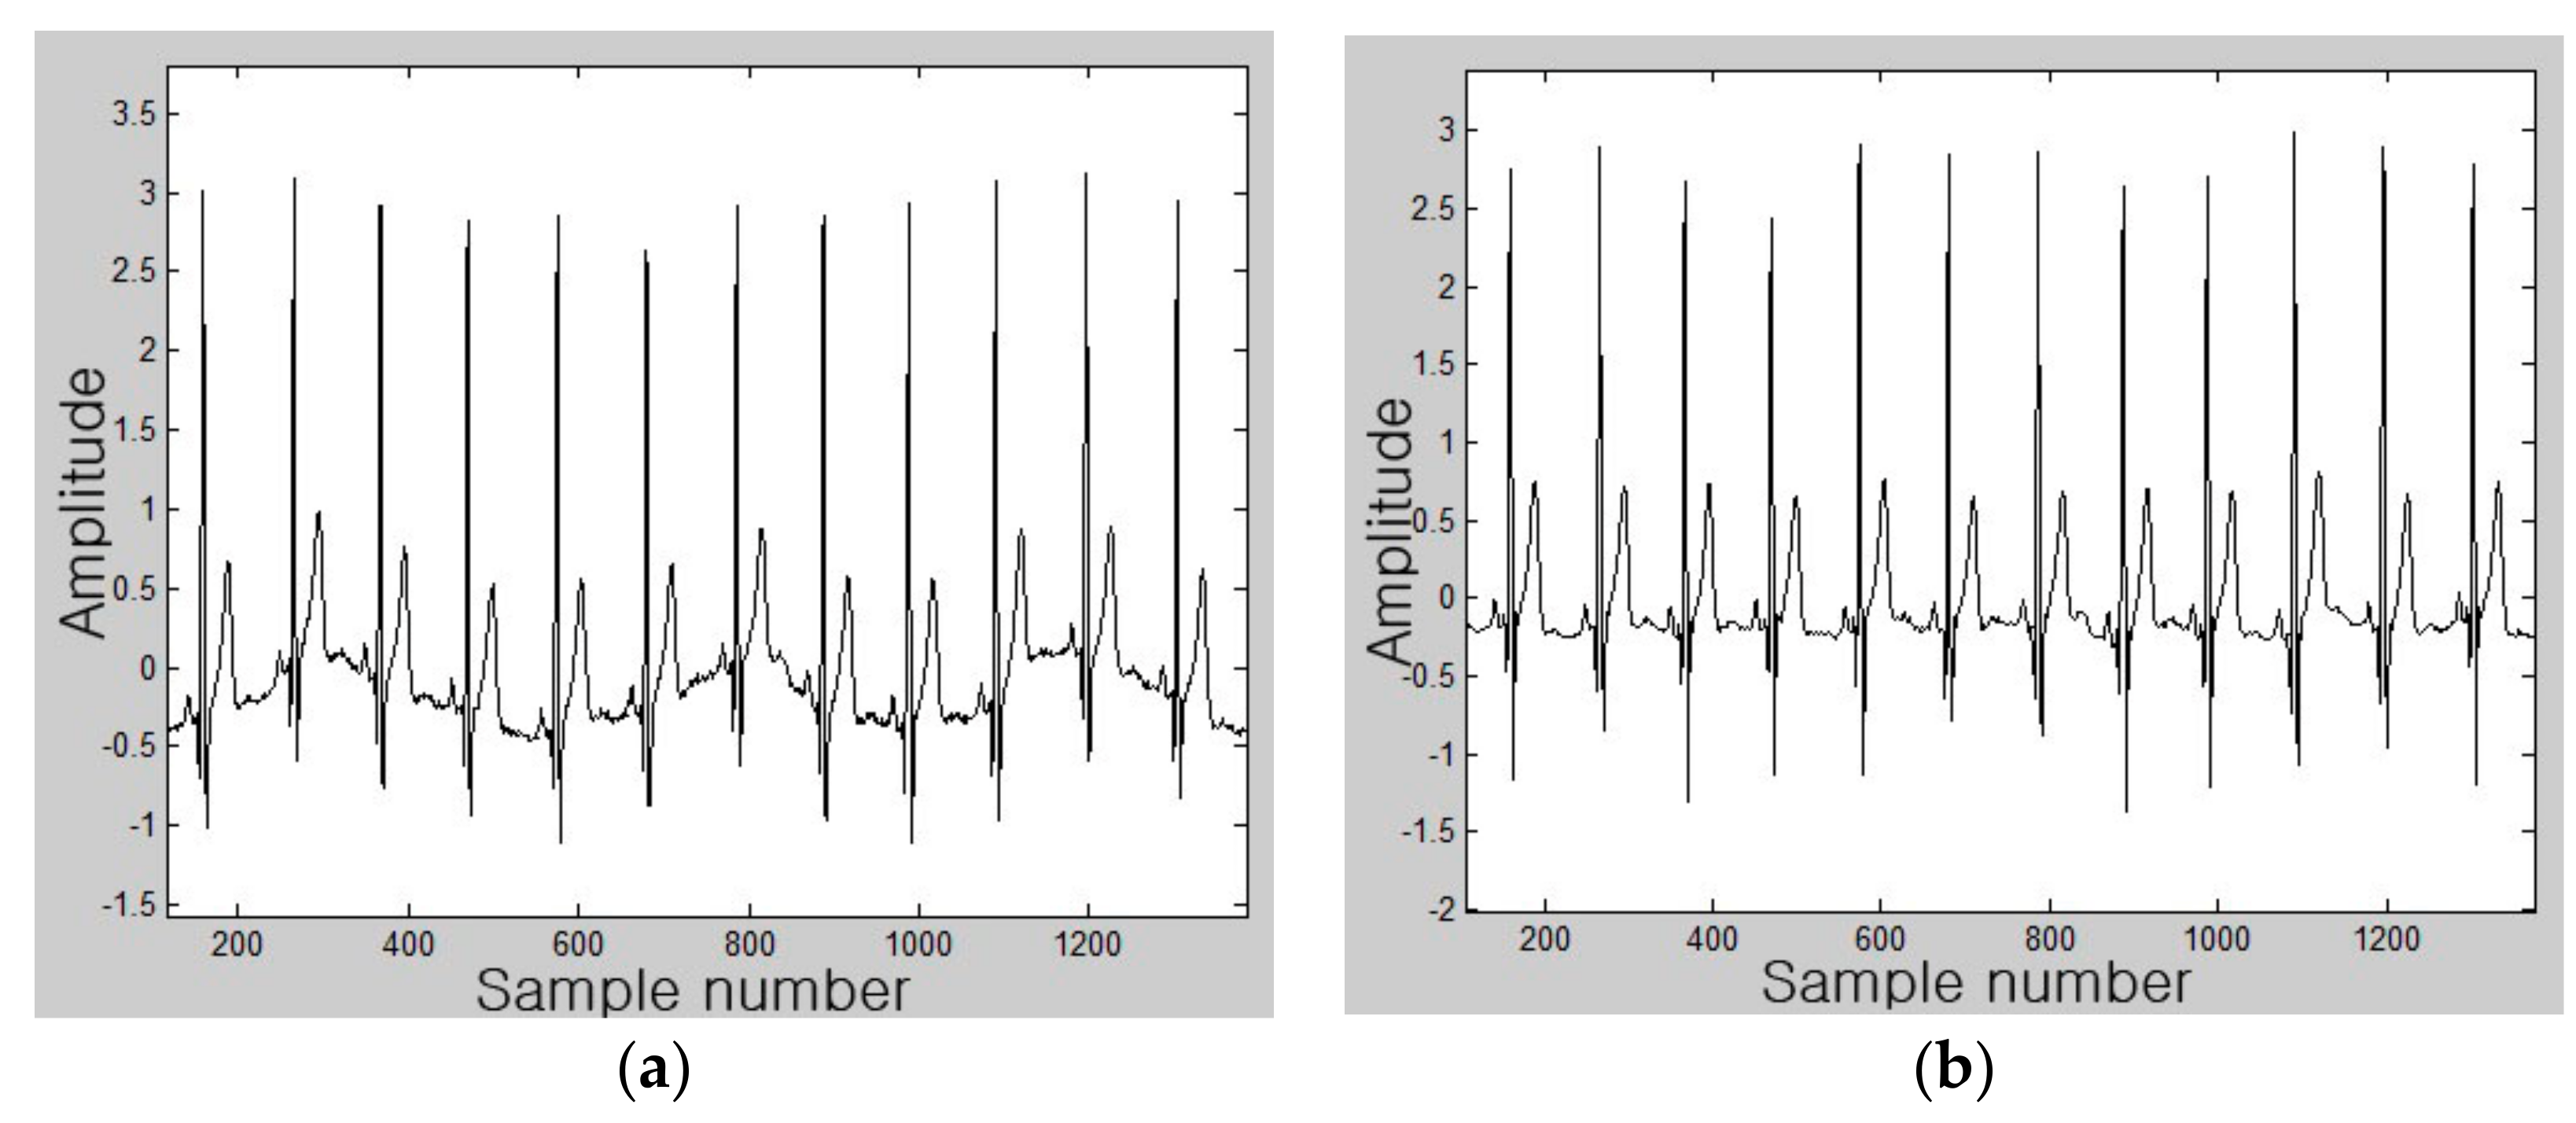
Figure 4 demonstrates the results of pre-processing. Figure 4a shows the original signal and Figure 4b shows the result of the noise removal by applying Daubechies 4. Figure 5 shows the result of applying autocorrelation and scaling in the pre-processed signal, and Figure 6 shows the result of the DCT application.
The result of this study’s experiment is indicated by the window and subject identification rate. The window identification rate refers to the ratio of windows with correct recognition out of all the windows of the respective subject. The subject identification rate refers to the ratio of the number of correctly identified subjects among the total subjects after the subjects are determined using a majority vote by examining the generated windows.
Table 2 shows the test results of the method proposed in this study. As shown in Table 2, when the NN classifier is used in the NSR, PTB and QT DB, the subject identification rates are 100%, 99.40% and 100%, while the window identification rates are 99.02%, 97.13% and 98.91%. When the SVM classifier is used, the subject identification rates are 100% in all of the DBs, while the window identification rates are 96.92%, 95.82% and 98.32%, respectively. When the LDA classifier is used, the subject identification rates are 100% in all of the DBs, while the window identification rates are 98.67%, 98.65% and 99.23%, respectively.
Each NSR, PTB, and QT DB are derived from a different acquisition environment and sampling frequency; thus, the results would vary depending on the number of features. Additionally, it is possible to derive various identification results that are based on the classifier selection in the personal identification, such as signal processing and pattern recognition. Therefore, this study also compares the results by applying various feature numbers according to the classifiers in the NSR, PTB, and QT DB. As shown in Table 3, Table 4 and Table 5, the window recognition rate slightly varies according to the classifiers of NN, SVM, and LDA, as well as the number of extracted features. Further, it can be confirmed that the highest recognition rate is shown, when the optimum number of features is found for each piece of data, and the recognition rate is lowered, when the number is smaller or larger than the optimum number. It is difficult to determine the classifier and the optimal number of features for each DB. However, experimental results show that the best results are obtained when the LDA classifier is used on the average in NSR, PTB, and QT DB, and the optimal number of features are 40, 300 and 110, respectively. In particular, when comparing the average result with regards to the window identification rate, the LDA classifier shows about a 0.50% and 1.83% higher recognition rate than the NN and SVM classifier on average.
In order to demonstrate the efficiency of the proposed window removal method, the experiment results are compared before and after the application. As shown in Table 6, there is no significant difference between the results before and after applying the window removal method, because the subject recognition rate is already high in all of the data and classifiers. However, it confirms that the results of the window recognition rate after applying the window removal method are better than those before applying the window removal method in all data. It also confirms that the results of all classifiers used in the experiment have improved. Therefore, the window removal method proposed in this study can improve the ECG identification rate by efficiently removing unnecessary windows.
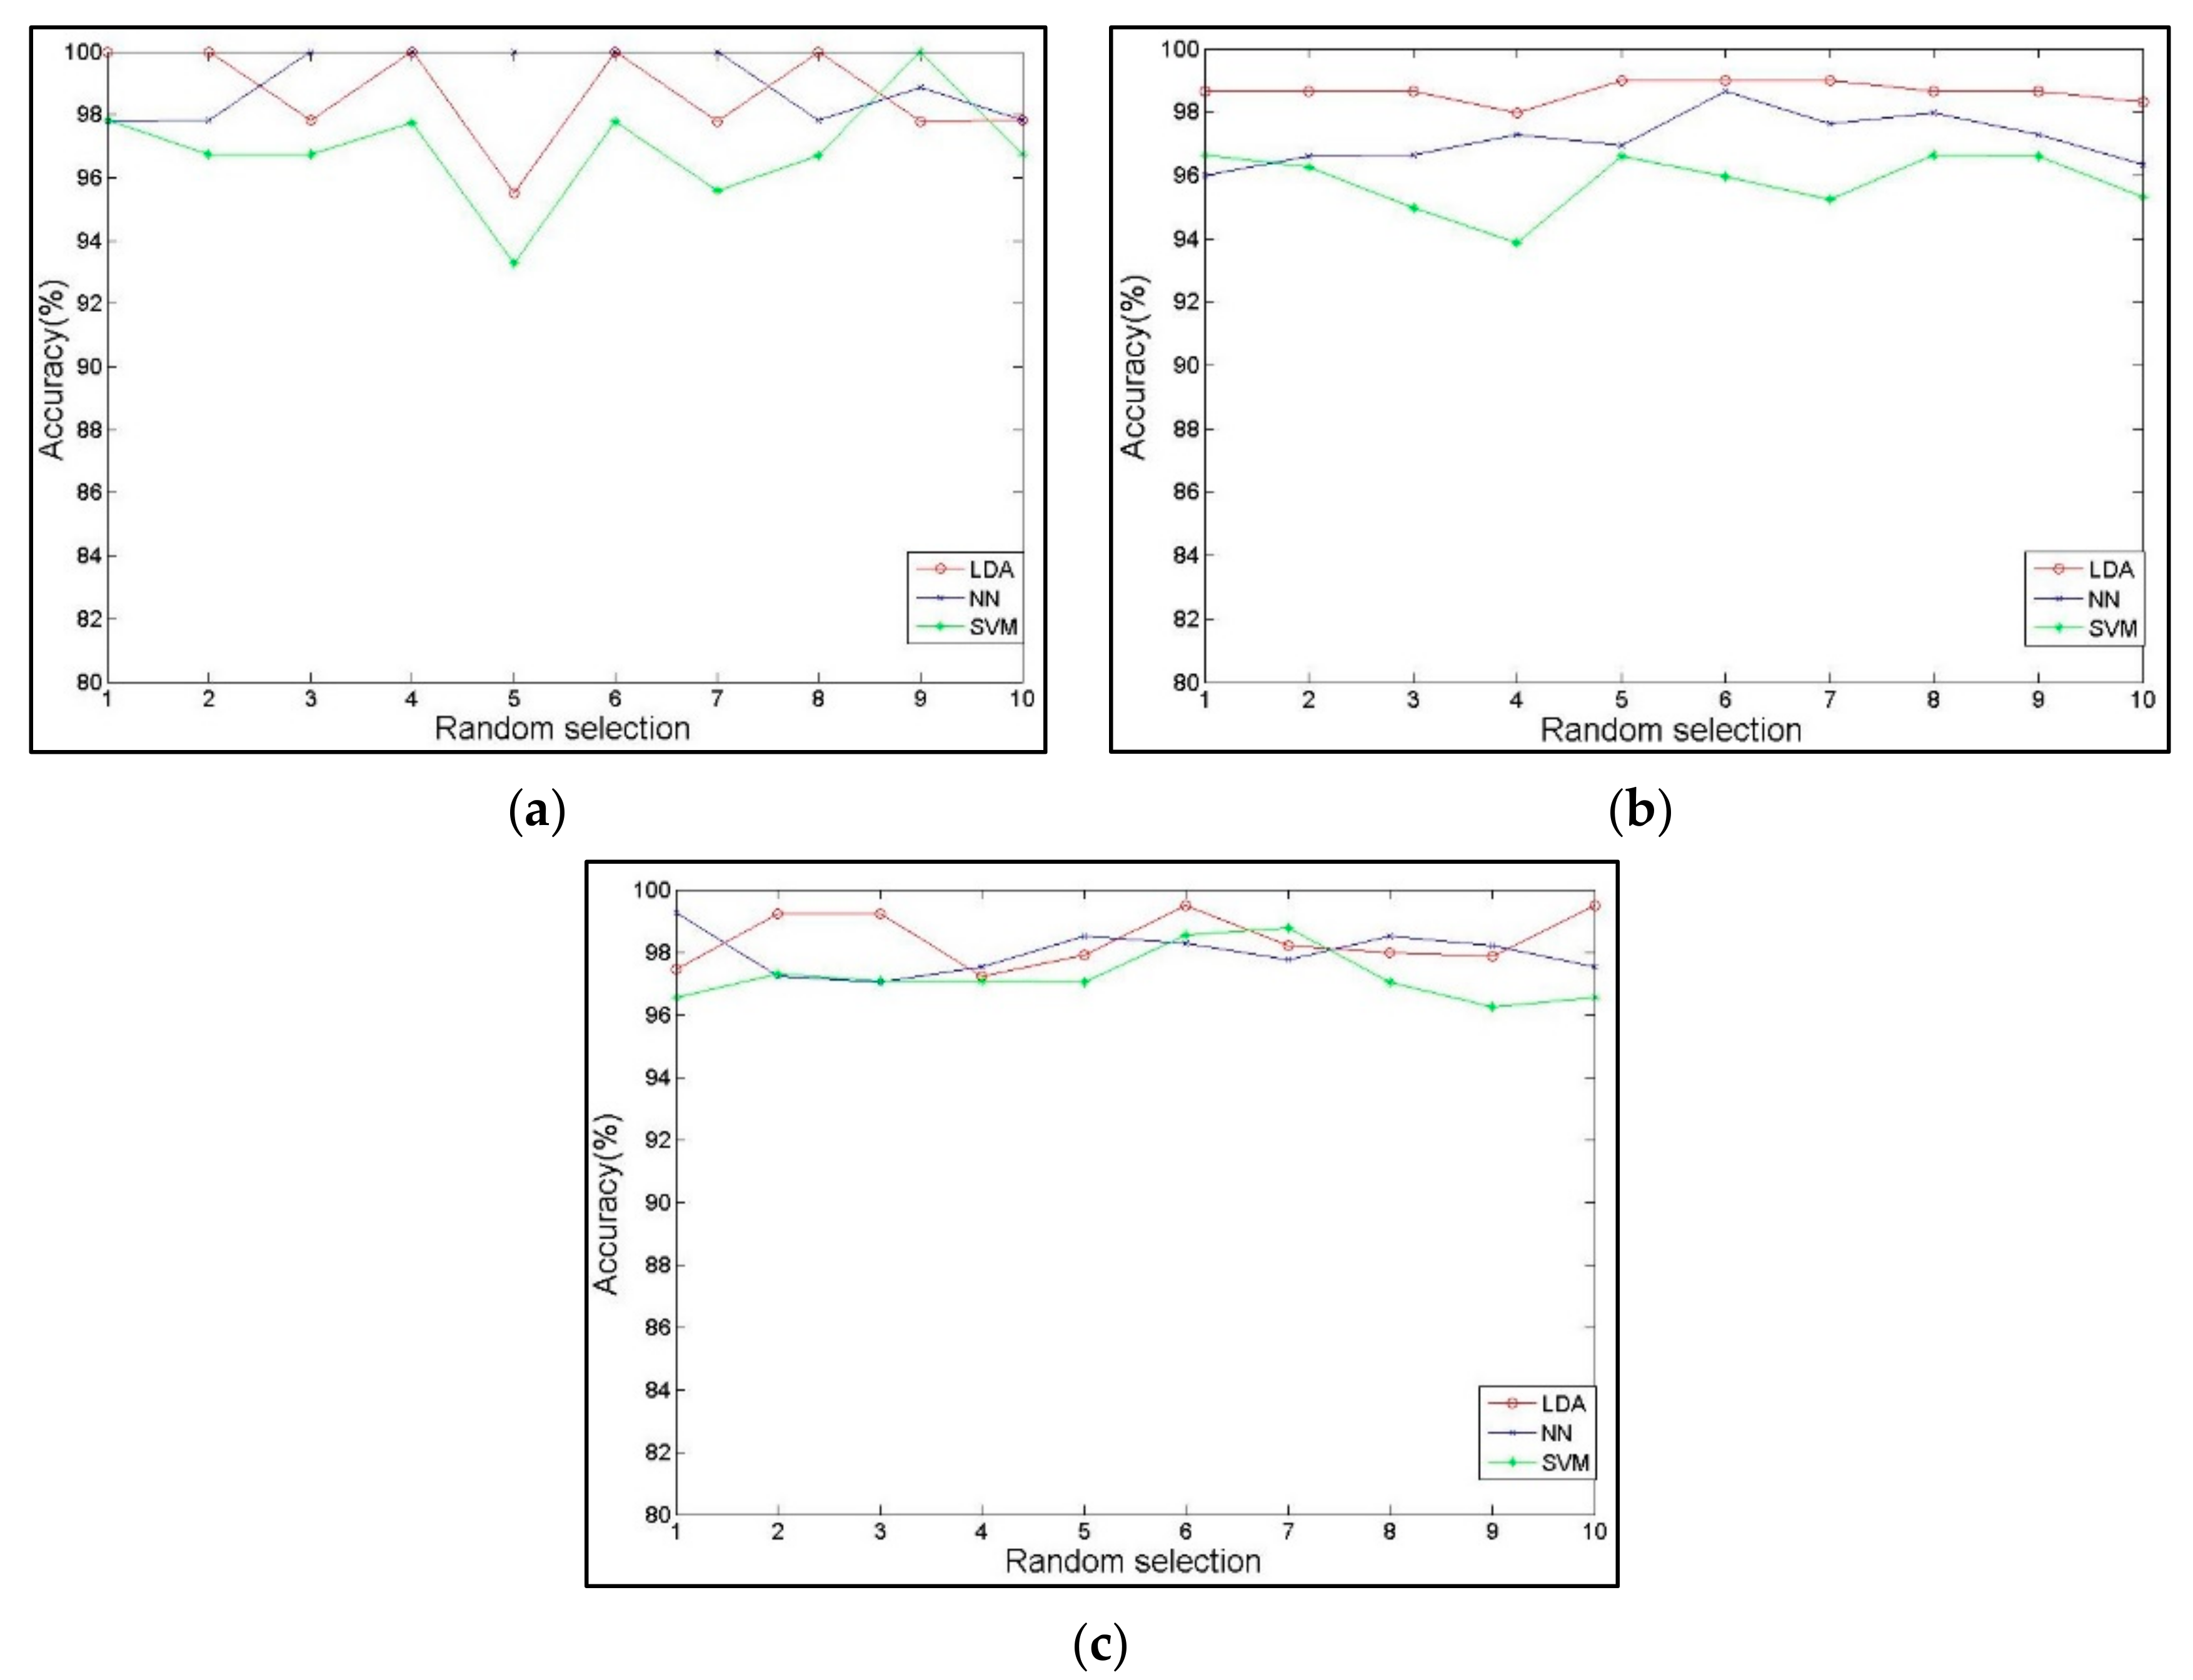
Lastly, random selection is performed and it is compared to the results of other algorithms in order to evaluate the performance of the proposed method. NSR, PTB, and the QT DB are short data recorded within 60 s. A small number of training and test windows are generated because the window is set at 5 s time intervals. Therefore, it is difficult to apply 10 fold cross-validation. The performance of the proposed algorithm is verified by averaging random selection 10 times. The random selection is performed by selecting the training window at random and selecting the rest as the testing window. Table 7 shows the accuracy for each trial after performing it 10 times, as well as the number of correctly recognized windows and the total number of windows. For each trial, it can be shown that the number of test windows is slightly different due to the application of the window removal method. As shown in Figure 7 and Table 7, LDA, SVM, and NN classifiers show high results, but LDA shows higher overall results than NN and SVM, except for the NSR DB. In Table 8, when compared to the results of the other studies, the proposed method shows high results in both the subject and window identification rates, except for the study by Wang et al. [12] and Loong et al. [21]. However, in the study by Wang et al. [12] and Loong et al. [21], experiments were formed with a small sample size. On the other hand, this study is performed with a larger sample size when compared to the two studies, and shows significantly higher results. In addition, the PTB DB includes abnormal signals, such as myocardial infarction and cardiomyopathy. Such abnormal signals may cause a reduction in recognition rate. When compared to the results containing abnormal signals by Wang et al. [12], Coutinho et al. [17], and Agrafioti et al. [18] using PTB in Table 8, the proposed method shows relatively high results in not only the subject identification rate, but also in the window identification rate with regards to the various DBs.
The results of this study and the other studies may be difficult to objectively evaluate due to the various differences in the data measurement environment, method, and DBs. However, this study is able to enhance the reliability of the algorithm by considering the data that contain normal, as well as abnormal, signals, and using multiple DBs instead of a single DB. As shown by these results, the proposed method performs experiments with regards to three types of DBs and demonstrates high results even in DBs containing abnormal signals. Consequently, the non-fiducial technique-based features proposed in this study are not influenced by obvious fiducial point detection, unlike the fiducial technique-based method. In addition, the proposed algorithm can be executed simply and the window removal method can be applied to remove windows that are difficult to recognize. Thus, our method can enhance the overall identification rate.
The threshold value settings for the window removal method demonstrate excellent results with regards to the various DBs, but this may not have been appropriate for all situations of ECG signals with non-stationary characteristics. In addition, data including other diseases, such as commonly occurring supraventricular tachycardia or atrial fibrillation, accompanied by irregularities other than the diseases included in the PTB DB, may differ from the signals that are used in this experiment, thus, degrading the performance of the proposed algorithm.
4. Conclusions
This study proposed ECG identification based on non-fiducial feature extraction using a window removal method, NN, SVM, and LDA. Daubechies 4 was used to remove the baseline wander and noise, and autocorrelation, scaling, and DCT were used for feature extraction and selection. In addition, a window removal method was applied to remove windows that were difficult to recognize. Lastly, NN, SVM, and LDA classifiers were used to perform individual identification. The proposed method demonstrated high accuracy with regard to the NSR, PTB, and QT DB. Additionally, relatively good results were shown even for the PTB DB, which contained abnormal signals. In addition, the ECG identification rate could be improved by removing windows that could not be recognized due to signal distortion or noise in the window by applying the window removal method using the threshold setting. In the future, research using various test data other than the DBs that were used in this study needs to be performed. Experiments on the data extracted from a real environment will also be necessary. Furthermore, the development of an optimized algorithm for robustness and high accuracy in various situations will be required.
Author Contributions
Woo-Hyuk Jung designed the algorithm, experiments, wrote the manuscript; Sang-Goog Lee contributed to the revision of algorithm and manuscript. All authors read and approved the final manuscript.
Conflicts of Interest
The authors declare no conflict of interest.
References
- Jain, K.; Ross, A.; Prabhakar, S. An introduction to biometric recognition. IEEE Trans. Circuits Syst. Video Technol. 2004, 14, 4–20. [Google Scholar] [CrossRef]
- Liau, H.F.; Isa, D. Feature selection for support vector machine-based face-iris multimodal biometric system. Expert Syst. Appl. 2011, 38, 11105–11111. [Google Scholar] [CrossRef]
- Kirzrak, A.M.; Ozen, F. A new median filter based fingerprint recognition algorithm. Procedia Comput. Sci. 2011, 3, 859–865. [Google Scholar] [CrossRef]
- Yang, L.; Yang, G.; Yin, Y.; Xi, X. Exploring soft biometric trait with finger vein recognition. Neurocomputing 2014, 135, 218–228. [Google Scholar] [CrossRef]
- Wang, Y.; Plataniotis, K.N.; Hatzinakos, D. Integrating analytic and appearance attributes for human identification from ECG signal. In Proceedings of the 2006 Biometrics Symposium: Special Session on Research at the Biometric Consortium Conference, Baltimore, MD, USA, 21 August–19 September 2006; pp. 1–6. [Google Scholar]
- Agrafioti, F.; Gao, J.; Hatzinakos, D. Heart biometrics: Theory, methods and applications. In Biometrics; Yang, J., Ed.; InTech: Rijeka, Croatia, 2011; pp. 199–216. [Google Scholar]
- Agrafioti, F.; Bui, F.M.; Hatzinakos, D. Medical biometrics in mobile health monitoring. Secur. Commun. Netw. 2010, 4, 525–539. [Google Scholar] [CrossRef]
- Labati, R.D.; Piuri, V.; Sassi, R.; Scotti, F.; Sforza, G. Adaptive ECG biometric recognition: A study on re-enrollment methods for QRS signals. In Proceedings of the 2014 IEEE Symposium on Computational Intelligence in Biometrics and Identity Management (CIBIM), Orlando, FL, USA, 9–12 December 2014; pp. 30–37. [Google Scholar]
- Odinaka, I.; Lai, P.; Kaplan, A.D.; O’Sullivan, J.A.; Sirevaag, E.J.; Rohrbaugh, J.W. ECG biometric recognition: A comparative analysis. IEEE Trans. Inf. Forensics Secur. 2012, 7, 1812–1824. [Google Scholar] [CrossRef]
- Israel, S.A.; Irvine, J.M.; Cheng, A.; Wiederhold, M.D.; Wiederhold, D.K. ECG to identify individuals. Pattern Recognit. 2005, 38, 133–142. [Google Scholar] [CrossRef]
- Biel, L.; Pettersson, O.; Philipson, L.; Wide, P. ECG analysis: A new approach in human identification. IEEE Trans. Instrum. Meas. 2001, 50, 808–812. [Google Scholar] [CrossRef]
- Wang, Y.; Agrafioti, F.; Hatzinakos, D.; Plataniotis, K.N. Analysis of human electrocardiogram ECG for biometric recognition. EURASIP J. Adv. Signal Process. 2008, 1–11. [Google Scholar] [CrossRef]
- Martinez, J.; Almeida, R.; Olmos, S.; Rocha, A.; Laguna, P. A wavelet-based ECG delineator: Evaluation on standard databases. IEEE Trans Biomed. Eng. 2004, 51, 570–581. [Google Scholar] [CrossRef] [PubMed]
- Plataniotis, K.N.; Hatzinakos, D.; Lee, J.K.M. ECG biometric recognition without fiducial detection. In Proceedings of the 2006 Biometrics Symposium: Special Session on Research at the Biometric Consortium Conference, Baltimore, MD, USA, 21 August–19 September 2006; pp. 1–6. [Google Scholar]
- Jung, W.H.; Lee, S.G. An R-peak detection method that uses an SVD filter and a search back system. Comput. Methods Programs Biomed. 2012, 108, 1121–1132. [Google Scholar] [CrossRef] [PubMed]
- Choi, S.J.; Adnane, M.; Lee, G.J.; Jang, H.; Jiang, Z.; Park, H.K. Development of ECG beat segmentation method by combining low pass filter and irregular R–R interval checkup strategy. Expert Syst. Appl. 2010, 37, 5208–5218. [Google Scholar] [CrossRef]
- Coutinho, D.P.; Silva, H.; Gamboa, H.; Fred, A.; Figueiredo, M. Novel fiducial and non-fiducial approaches to electrocardiogram-based biometric systems. IET Biom. 2013, 2, 64–75. [Google Scholar] [CrossRef]
- Agrafioti, F.; Hatzinakos, D. ECG biometric analysis in cardiac irregularity conditions. Signal Image Video Process. 2008, 3, 1683–1706. [Google Scholar] [CrossRef]
- Chan, A.D.C.; Hamdy, M.; Badre, A.; Badee, V. Wavelet distance measure for person identification using electrocardiograms. IEEE Trans. Instrum. Meas. 2008, 57, 248–253. [Google Scholar] [CrossRef]
- Chiu, C.; Chuang, C.; Hsu, C. A novel personal identity verification approach using a discrete wavelet transform of the ECG signal. In Proceedings of the International Conference on Multimedia and Ubiquitous Engineering (MUE 2008), Busan, Korea, 24–26 April 2008; pp. 201–206. [Google Scholar]
- Loong, J.L.C.; Subari, K.S.; Besar, R.M.K. Abdullah, K. A New Approach to ECG Biometric Systems: A Comparitive Study between LPC and WPD Systems. World Acad. Sci. Eng. Technol. 2010, 4, 2077–2082. [Google Scholar]
- The MIT-BIH Normal Sinus Rhythm Database. Available online: https://www.physionet.org/physiobank/database/nsrdb (accessed on 10 October 2017).
- The PTB Diagnostic ECG Database. Available online: https://www.physionet.org/physiobank/database/ptbdb (accessed on 10 October 2017).
- The QT Database. Available online: https://www.physionet.org/physiobank/database/qtdb (accessed on 10 October 2017).
- Mohamed, M.A.; Deriche, M.A. An Approach for ECG Feature Extraction using Daubechies 4 (DB4) Wavelet. Int. J. Comput. Appl. 2014, 96, 36–41. [Google Scholar]
- Wang, D. K-nearest neighbors based methods for identification of different gear crack levels under different motor speeds and loads: Revisited. Mech. Syst. Signal Process. 2016, 70, 201–208. [Google Scholar] [CrossRef]
- Li, S.; Zhou, W.; Yuan, Q.; Geng, S.; Cai, D. Feature extraction and recognition of ictal EEG using EMD and SVM. Comput. Biol. Med. 2013, 43, 807–816. [Google Scholar] [CrossRef] [PubMed]
- Zhou, D.; Yang, X.; Peng, N.; Wang, Y. Improved-LDA based face recognition using both facial global and local information. Pattern Recognit. Lett. 2006, 27, 536–543. [Google Scholar] [CrossRef]
Figure 1.
Block diagram of proposed method. EGG: electrocardiogram; NN: nearest neighbor; SVM: support vector machine ; LDA: linear discriminant analysis.
Figure 1.
Block diagram of proposed method. EGG: electrocardiogram; NN: nearest neighbor; SVM: support vector machine ; LDA: linear discriminant analysis.

Figure 2.
Flow chart of window removal method. SD: standard deviation; DCT: discrete cosine transform.
Figure 2.
Flow chart of window removal method. SD: standard deviation; DCT: discrete cosine transform.

Figure 3.
Hierarchical one vs. one (OAO).

Figure 4.
Pre-processing result: (a) Original signal; (b) Signal with daubechies used.

Figure 5.
Signal with autocorrelation and scaling used.

Figure 6.
Signal with discrete cosine transform (DCT) used.

Figure 7.
Random selection results: (a) NSR random selection result; (b) PTB random selection result; and (c) QT random selection result.
Figure 7.
Random selection results: (a) NSR random selection result; (b) PTB random selection result; and (c) QT random selection result.


Table 1.
Experimental setting. DB: database; NSR: normal sinus rhythm; PTB: ptb diagnostic; QT: qt database.
Table 1.
Experimental setting. DB: database; NSR: normal sinus rhythm; PTB: ptb diagnostic; QT: qt database.
| DB | Record | Number of Subjects | Number of Windows |
|---|---|---|---|
| NSR | 16265, 16272, 16273, 16420, 16483, 16539, 16773, 16786, 16795, 17052, 17453, 18177, 18184, 19088, 19090, 19093, 19140, 19830 | 18 | 184 |
| PTB | 15, 17, 20, 21, 22, 26, 28, 36, 39, 43, 45, 46, 47, 52, 53, 54, 58, 62, 65, 66, 80, 83, 87, 88, 89, 90, 92, 99, 100, 102, 105, 109, 110, 111, 112, 125, 129, 132, 135, 141, 142, 147, 420 ,425, 441, 488, 489, 546, 548, 549 | 50 | 600 |
| QT | sel34, sel100, sel103, sel116, sel123, sel213, sel230, sel231, sel301, sel302, sel306, sel307, sel310, sel803, sel808, sel811, sel820, sel840, sel847, sel853, sel872, sel873, sel883, sel891, sel14157, sel16265, sel16272, sel16273, sel16420, sel16483, sel16539, sel16773, sel16786, 16795, sel17152, sel17453 | 36 | 432 |
Table 2.
Results of proposed method. NN: nearest neighbor; SVM: support vector machine; LDA: linear discriminant analysis.
Table 2.
Results of proposed method. NN: nearest neighbor; SVM: support vector machine; LDA: linear discriminant analysis.
| Classifier | Subject Number | Subject Identification Rate (%) | Window Identification Rate (%) | ||||
|---|---|---|---|---|---|---|---|
| NSR | PTB | QT | NSR | PTB | QT | ||
| NN | NSR: 18 PTB: 50 QT: 36 | 100 | 99.40 | 100 | 99.02 | 97.13 | 98.91 |
| SVM | 100 | 100 | 100 | 96.92 | 95.82 | 98.32 | |
| LDA | 100 | 100 | 100 | 98.67 | 98.65 | 99.23 | |
Table 3.
Comparison of results according to the number of features with nearest neighbor (NN).
| DB | Subject Identification Rate (%) | Window Identification Rate (%) | Number of Features (%) |
|---|---|---|---|
| NSR | 100 | 98.14 | 30 |
| 100 | 99.02 | 50 | |
| 99.44 | 96.20 | 70 | |
| PTB | 99.20 | 95.57 | 200 |
| 99.40 | 97.13 | 300 | |
| 99.40 | 96.78 | 400 | |
| QT | 100 | 97.56 | 50 |
| 100 | 98.91 | 70 | |
| 100 | 98.75 | 90 |
Table 4.
Comparison of results according to the number of features with support vector machine (SVM).
Table 4.
Comparison of results according to the number of features with support vector machine (SVM).
| DB | Subject Identification Rate (%) | Window Identification Rate (%) | Number of Features (%) |
|---|---|---|---|
| NSR | 100 | 95.05 | 20 |
| 100 | 96.92 | 40 | |
| 100 | 95.04 | 60 | |
| PTB | 99.60 | 95.57 | 200 |
| 100 | 95.82 | 300 | |
| 98.80 | 94.15 | 400 | |
| QT | 100 | 97.57 | 30 |
| 100 | 98.32 | 50 | |
| 100 | 97.91 | 70 |
Table 5.
Comparison of results according to the number of features with linear discriminant analysis (LDA).
Table 5.
Comparison of results according to the number of features with linear discriminant analysis (LDA).
| DB | Subject Identification Rate (%) | Window Identification Rate (%) | Number of Features (%) |
|---|---|---|---|
| NSR | 97.22 | 85.17 | 20 |
| 100 | 98.67 | 40 | |
| 94.44 | 97.41 | 60 | |
| PTB | 99.80 | 98.44 | 200 |
| 100 | 98.65 | 300 | |
| 99.80 | 98.40 | 400 | |
| QT | 100 | 98.89 | 90 |
| 100 | 99.23 | 110 | |
| 100 | 98.54 | 130 |
Table 6.
Comparison of the results with and without the window removal method.
| Method | Without Window Removal Method | With Window Removal Method | ||||||||||
|---|---|---|---|---|---|---|---|---|---|---|---|---|
| Subject Identification Rate (%) | Window Identification Rate (%) | Subject Identification Rate (%) | Window Identification Rate (%) | |||||||||
| NSR | PTB | QT | NSR | PTB | QT | NSR | PTB | QT | NSR | PTB | QT | |
| NN | 100 | 99.40 | 100 | 95.85 | 96.80 | 97.18 | 100 | 99.40 | 100 | 99.02 | 97.13 | 98.91 |
| SVM | 100 | 100 | 100 | 95.11 | 95.76 | 96.32 | 100 | 100 | 100 | 96.92 | 95.82 | 98.32 |
| LDA | 100 | 100 | 100 | 97.13 | 98.40 | 97.87 | 100 | 100 | 100 | 98.67 | 98.65 | 99.23 |
Table 7.
Random selection results.
| DB | Classifier | 1 | 2 | 3 | 4 | 5 | 6 | 7 | 8 | 9 | 10 |
|---|---|---|---|---|---|---|---|---|---|---|---|
| Accuracy (%) (Number of Correctly Recognized Windows/Total Number of Windows) | |||||||||||
| NSR | NN | 97.80 (89/91) | 97.83 (90/92) | 100 (89/89) | 100 (89/89) | 100 (89/89) | 100 (91/91) | 100 (91/91) | 97.83 (90/92) | 98.88 (88/89) | 97.83 (90/92) |
| SVM | 97.83 (90/92) | 96.74 (89/92) | 96.74 (89/92) | 97.75 (87/89) | 93.26 (83/89) | 97.80 (89/91) | 95.60 (87/91) | 96.70 (88/91) | 100 (91/91) | 96.74 (89/92) | |
| LDA | 100 (92/92) | 100 (92/92) | 97.83 (90/92) | 100 (89/89) | 95.51 (85/89) | 100 (91/91) | 97.80 (89/91) | 100 (91/91) | 97.80 (89/91) | 97.83 (90/92) | |
| PTB | NN | 95.99 (287/299) | 96.60 (284/294) | 96.66 (289/299) | 97.28 (286/294) | 96.95 (286/295) | 98.66 (294/298) | 97.62 (287/294) | 97.98 (291/297) | 97.29 (287/295) | 96.32 (288/299) |
| SVM | 96.66 (289/299) | 96.26 (283/294) | 94.98 (284/299) | 93.88 (276/294) | 96.61 (285/295) | 95.97 (286/298) | 95.24 (280/294) | 96.63 (287/297) | 96.61 (285/295) | 95.32 (285/299) | |
| LDA | 98.66 (295/299) | 98.64 (295/299) | 98.66 (295/299) | 97.96 (288/294) | 98.98 (292/295) | 98.99 (295/298) | 98.98 (291/294) | 98.65 (293/295) | 98.64 (291/295) | 98.33 (294/299) | |
| QT | NN | 98.56 (205/208) | 98.11 (208/212) | 98.13 (210/214) | 98.14 (211/215) | 98.56 (206/209) | 98.59 (210/213) | 100 (211/211) | 100 (209/209) | 100 (209/209) | 99.05 (209/211) |
| SVM | 98.53 (201/204) | 98.10 (207/211) | 98.09 (206/210) | 98.10 (207/211) | 100 (209/209) | 98.10 (207/211) | 100 (209/209) | 97.60 (203/208) | 97.58 (202/207) | 97.13 (203/209) | |
| LDA | 98.52 (200/203) | 100 (207/207) | 98.10 (206/210) | 98.57 (207/210) | 100 (208/208) | 99.51 (205/206) | 100 (206/206) | 99.03 (205/207) | 98.55 (204/207) | 100 (207/207) | |
Table 8.
Comparison of results with other studies.
| Methods | Subject Number | DB Type | Subject Identification Rate (%) | Window/Heart Beat Identification Rate (%) | |
|---|---|---|---|---|---|
| Proposed method | Non-fiducial /NN, SVM, LDA | NSR: 18 PTB: 50 QT: 36 | NSR, PTB, QT | NSR:100 PTB:100 QT: 100 | NSR: 98.67 PTB: 98.65 QT: 99.23 |
| Israel et al. [10] | Fiducial/LDA | 29 | Acquisition from lab. | 100 | 82 |
| Biel et al. [11] | Fiducial/SIMCA model | 20 | SIEMENS equipment | 100 | - |
| Wang et al. [12] | Fiducial/NN, LDA | NSR: 13 PTB: 13 | NSR, PTB | NSR:100 PTB:100 | NSR: 99.43 PTB: 98.90 |
| Coutinho et al. [17] | Fiducial & non fiducial/string matching, NN | 51 | PTB | Fiducial: 99.85 Non-fiducial: 99.39 | - |
| Agrafioti et al. [18] | Non-fiducial/NN | 56 | NSR, PTB, MIT | 96.42 | 96.20 |
| Chan et al. [19] | Non-fiducial/wavelet | 50 | Acquisition from lab. | 89 | - |
| Chiu et al. [20] | Non-fiducial/NN | 35 | QT | 100 | - |
| Loong et al. [21] | Non-fiducial/ neural net | 15 | Acquisition from lab. | 100 | 99.52 |
© 2017 by the authors. Licensee MDPI, Basel, Switzerland. This article is an open access article distributed under the terms and conditions of the Creative Commons Attribution (CC BY) license (http://creativecommons.org/licenses/by/4.0/).
Share and Cite
MDPI and ACS Style
Jung, W.-H.; Lee, S.-G. ECG Identification Based on Non-Fiducial Feature Extraction Using Window Removal Method. Appl. Sci. 2017, 7, 1205. https://0-doi-org.brum.beds.ac.uk/10.3390/app7111205
AMA Style
Jung W-H, Lee S-G. ECG Identification Based on Non-Fiducial Feature Extraction Using Window Removal Method. Applied Sciences. 2017; 7(11):1205. https://0-doi-org.brum.beds.ac.uk/10.3390/app7111205
Chicago/Turabian StyleJung, Woo-Hyuk, and Sang-Goog Lee. 2017. "ECG Identification Based on Non-Fiducial Feature Extraction Using Window Removal Method" Applied Sciences 7, no. 11: 1205. https://0-doi-org.brum.beds.ac.uk/10.3390/app7111205
Note that from the first issue of 2016, this journal uses article numbers instead of page numbers. See further details here.