Article

Effect of Aggregate Mineralogy and Concrete Microstructure on Thermal Expansion and Strength Properties of Concrete

1
Department of Civil, Environmental, and Construction Engineering, University of Central Florida, Orlando, FL 32816, USA
2
Department of Civil Engineering, University of Georgia, 208 Driftmier Engineering Center (Annex), Athens, GA 30602, USA
*
Authors to whom correspondence should be addressed.
Submission received: 17 November 2017 / Revised: 4 December 2017 / Accepted: 13 December 2017 / Published: 18 December 2017
(This article belongs to the Section Materials Science and Engineering)

Abstract

:
Aggregate type and mineralogy are critical factors that influence the engineering properties of concrete. Temperature variations result in internal volume changes could potentially cause a network of micro-cracks leading to a reduction in the concrete’s compressive strength. The study specifically studied the effect of the type and mineralogy of fine and coarse aggregates in the normal strength concrete properties. As performance measures, the coefficient of thermal expansion (CTE) and compressive strength were tested with concrete specimens containing different types of fine aggregates (manufactured and natural sands) and coarse aggregates (dolomite and granite). Petrographic examinations were then performed to determine the mineralogical characteristics of the aggregate and to examine the aggregate and concrete microstructure. The test results indicate the concrete CTE increases with the silicon (Si) volume content in the aggregate. For the concrete specimens with higher CTE, the micro-crack density in the interfacial transition zone (ITZ) tended to be higher. The width of ITZ in one of the concrete specimens with a high CTE displayed the widest core ITZ (approx. 11 µm) while the concrete specimens with a low CTE showed the narrowest core ITZ (approx. 3.5 µm). This was attributed to early-age thermal cracking. Specimens with higher CTE are more susceptible to thermal stress.

1. Introduction

The coefficient of thermal expansion (CTE) is a critical parameter that influences the overall service life of concrete pavements. Concrete properties are closely related to the CTE as the CTE reflects concrete’s response to internal temperature variations, cracking, and ultimately deterioration. An increased CTE can cause temperature-related distress and thermal cracks in concrete after hardening and during early strength gain. Longitudinal, transverse, and corner cracks during curing are closely related to the development of distress in concrete caused by thermal deformation [1,2,3,4]. In addition, the CTE has a significant influence on the temperature-related damage to concrete structures. Examples include joint openings and the reduction of sealant performance in jointed concrete pavement, crack development and propagation in continuously reinforced concrete pavements, and spalling [1,5,6,7].
Research efforts have been made to evaluate the CTE of concrete as an input parameter in the recent AASHTO (American Association of State Highway and Transportation Officials) design guide [8,9,10]. The CTE is directly influenced by the aggregate type and aggregate volume [6,11,12,13], as well as internal moisture conditions [14,15,16] and cement paste [17]. The CTE has shown not to be significantly impacted by water-to-cement ratio [17] and concrete age [14,18].
Crushed stone results in higher strength than rounded gravel [19] because angular particles provide better interlocking and the rough surface texture develops a greater mechanical bond with the cement paste. The mineralogy of the aggregate can affect the chemical bonding during cement hydration. The weakest component of the cement paste matrix is widely considered to be interfacial transition zone (ITZ) for the normal strength concrete [20]. Aitcin et al. [21] reported that the intrinsic strength of the coarse aggregate is not an important factor when the water-to-cement ratio is in the range of 0.5–0.7. Others suggested that rather than the strength of the aggregate, the strength of the cement-aggregate bond is usually the limiting factor in high-strength concrete [22].
Only a few studies have examined the effect of fine aggregate in concrete. Aitcin and Mindess [23] studied the effect of different types of crushed sand. The codes only include brief requirements for fine aggregate [24]. Goble and Cohen [25] reported that the sand fineness modulus has a significant influence on the mechanical properties of concrete. Several studies reported that the presence of fine particles from stone dust with increased surface area contributes to cement hydration and ultimately affects the concrete strength [26,27].
In general, aggregates are approximately 60% to 75% of the concrete volume, therefore the types of aggregates play a critical role in determining the CTE of concrete since a variety of aggregates have different values of CTE. In addition, it would be obvious that the mechanical strength of a concrete structure can be affected by the thermal behavior and microstructure of the concrete [28]. Thus, it is essential to evaluate the effect of aggregate type and volume on the CTE and microstructure, especially ITZ region, of concrete. The objectives of this study are: (1) to investigate the correlation between different types of aggregate mineralogy (coarse aggregates (granite and dolomite) and fine aggregates (manufactured and natural sands)) and the performance of concrete specimens in association with the thermal expansion behavior (CTE) and compressive strength, (2) to evaluate the aggregates (surface texts and chemical compositions) and microstructure (micro-pores, micro-cracks and interfaces) of concrete specimens through petrographic examinations including scanning electron microscopy (SEM) and energy dispersive X-ray (EDX) analyses, and (3) to characterize the ITZ region between aggregate and paste matrix by performing the line scanning analyses (SEM and EDX).

2. Materials and Design Methods

2.1. Materials

2.1.1. Aggregate Material Properties

Granite–gneiss manufactured sand (MS) and alluvial marine siliceous natural sand (NS) were used as fine aggregate in this study. Additionally, the two types of coarse aggregates were dolomite and granite. Figure 1 and Figure 2 respectively show the detailed particle size distributions of the fine and coarse aggregates obtained by sieving with corresponding the American Society for Testing and Materials (ASTM) C33 grading limits [29]. The gradation curves show that all aggregates comply with the standard grading requirements. The coarse aggregate is an ASTM C33 size number 57. In addition, a series of tests was conducted for the coarse aggregates to evaluate the basic physical properties. The results tested in accordance to ASTM C127 and C535 [30,31] are listed in Table 1. Dolomite was shown to exhibit a higher specific gravity (SG) and toughness than granite, while similar absorption values were obtained from both types of coarse aggregates.

2.1.2. Cementitious Materials

A Class C Fly Ash was used in this study as a partial cementitious replacement. In addition to the Fly ash, a Type I–II Portland cement was used in this study. The SG of Portland cement used in the mixture design was 3.15.

2.2. Mixture Design

Ultimately, eight mixtures were developed and tested during this research study (see Table 2). A primary objective was to evaluate the effect of mineralogy of the coarse and fine aggregates on the physical and mechanical properties of concrete. This was accomplished by maintaining a constant water-to-cementitious ratio (w/c), cementitious content of the mixtures, and percent of pozzolan replacement. The mixture design variables were the coarse aggregate type, the fine aggregate type, and the volume of coarse aggregate. The mixture design was prepared with the following process: (1) the water-to-cementitious materials ratio was kept constant at 0.5 for all mixtures, (2) Class C Fly Ash was used to replace 35% of the cement by weight, (3) the target air content was 3%, (4) the total aggregate content added was 67% by volume of the mixture, and (5) regardless of the type, coarse aggregate volumes of 1245 kg/m3 and 682 kg/m3 were used for specimens representing high and low coarse aggregate content, respectively. The fine aggregate contents were adjusted to have a total aggregate content of 67% by volume of the mixture. A mixture identification scheme was created to categorize the mixtures. The mixture identification included (Coarse Aggregate Type—Fine Aggregate Type—High Coarse Aggregate Content (1)/High Fine Aggregate Content (2)). For example, mixture D-Ms-1 is a mixture containing a high volume of dolomite with a low volume of manufactured sand whereas mixture G-Ns-2 is a mixture containing a low volume of granite with a high volume of natural sand.

2.3. Concrete Batching and Testing Methods

Concrete mixtures were batched following the practice described in ASTM C192 Standard Practice for Making and Curing Concrete Test Specimens in the Laboratory. For each of the eight concrete mixtures, five cylindrical specimens with dimensions of 100 × 200 mm and three with 150 × 300 mm were prepared for CTE and compressive strength testing as well as petrographic examination.

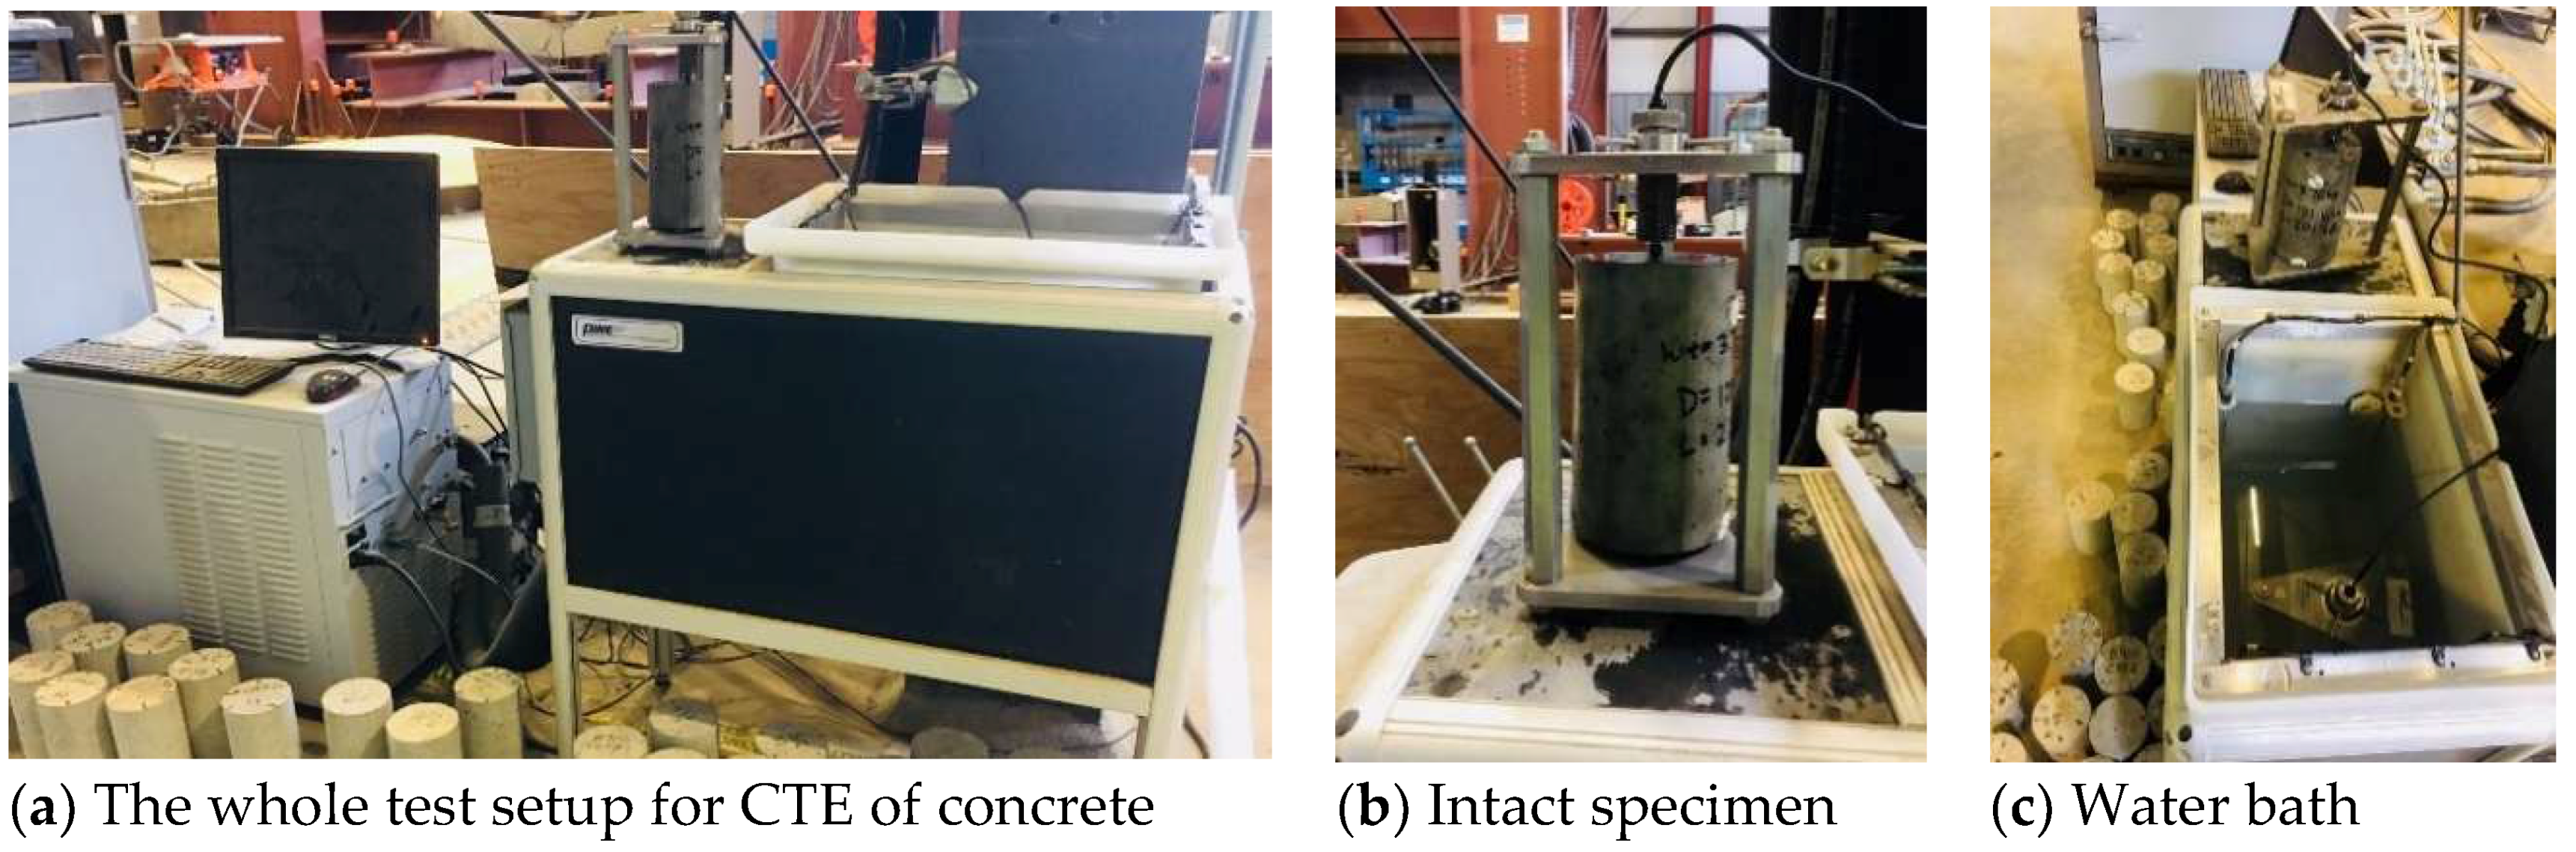
2.3.1. Coefficient of Thermal Expansion

To determine the CTE of the concrete mixtures listed in Table 2, five cylindrical specimens (100-mm diameter and 200-mm height) were prepared for each mixture according to AASHTO T336 [32]. All specimens were then sawn to approximately 180 mm in height using a concrete saw to ensure a plane surface was formed perpendicular to the longitudinal portion of the cylinder. CTE measurements were conducted utilizing a computer controlled CTE measuring system with capabilities of controlling the testing sequence and cycling of temperature while continuously recording temperature and displacement readings throughout the test duration. Figure 3 shows the whole test setup to determine CTE of the cylindrical concrete specimens.

2.3.2. Compressive Strength

Three concrete specimens of 150-mm diameter and 300-mm height were prepared to determine the average 28 days concrete compressive strength in accordance with ASTM C39 [33].

2.3.3. Petrographic Examination

Petrographic examination of hardened concrete specimens was performed according to ASTM C856 [34]. For SEM and EDX tests, the specimens were “cut” and placed in an oven for one week at 50 °C to remove moisture. Free water was assumed evaporated upon the specimens’ weight becoming constant after the 7-day drying period. After drying, the specimens were placed in plastic molds and vacuum saturated with low-viscosity epoxy for 4 h before being placed in an oven at 70 °C to cure the epoxy. The exposed face of the sample was ground and polished by fabric impregnated with diamond paste of successively finer size.
Petrographic image analyses by SEM and EDX were then carried out to characterize the aggregate and concrete. The morphology and chemical compositions of four types of aggregates were determined. In addition, images were taken to characterize ITZ and analyze the associated micro-crack density. SEM and EDX analyses were performed using a Zeiss Ultra-55 SEM equipped with a Thermo Scientific Noran System 7 spectral imaging X-ray microanalysis system and Ultra Dry silicon drift X-ray detector. Working distance of SEM was set as 12 mm for imaging and determination. Several magnifications such as 300 X, 4000 X and 5000 X were made for the observation. The working distance of EDX was reset 10 mm.

3. Experimental Results
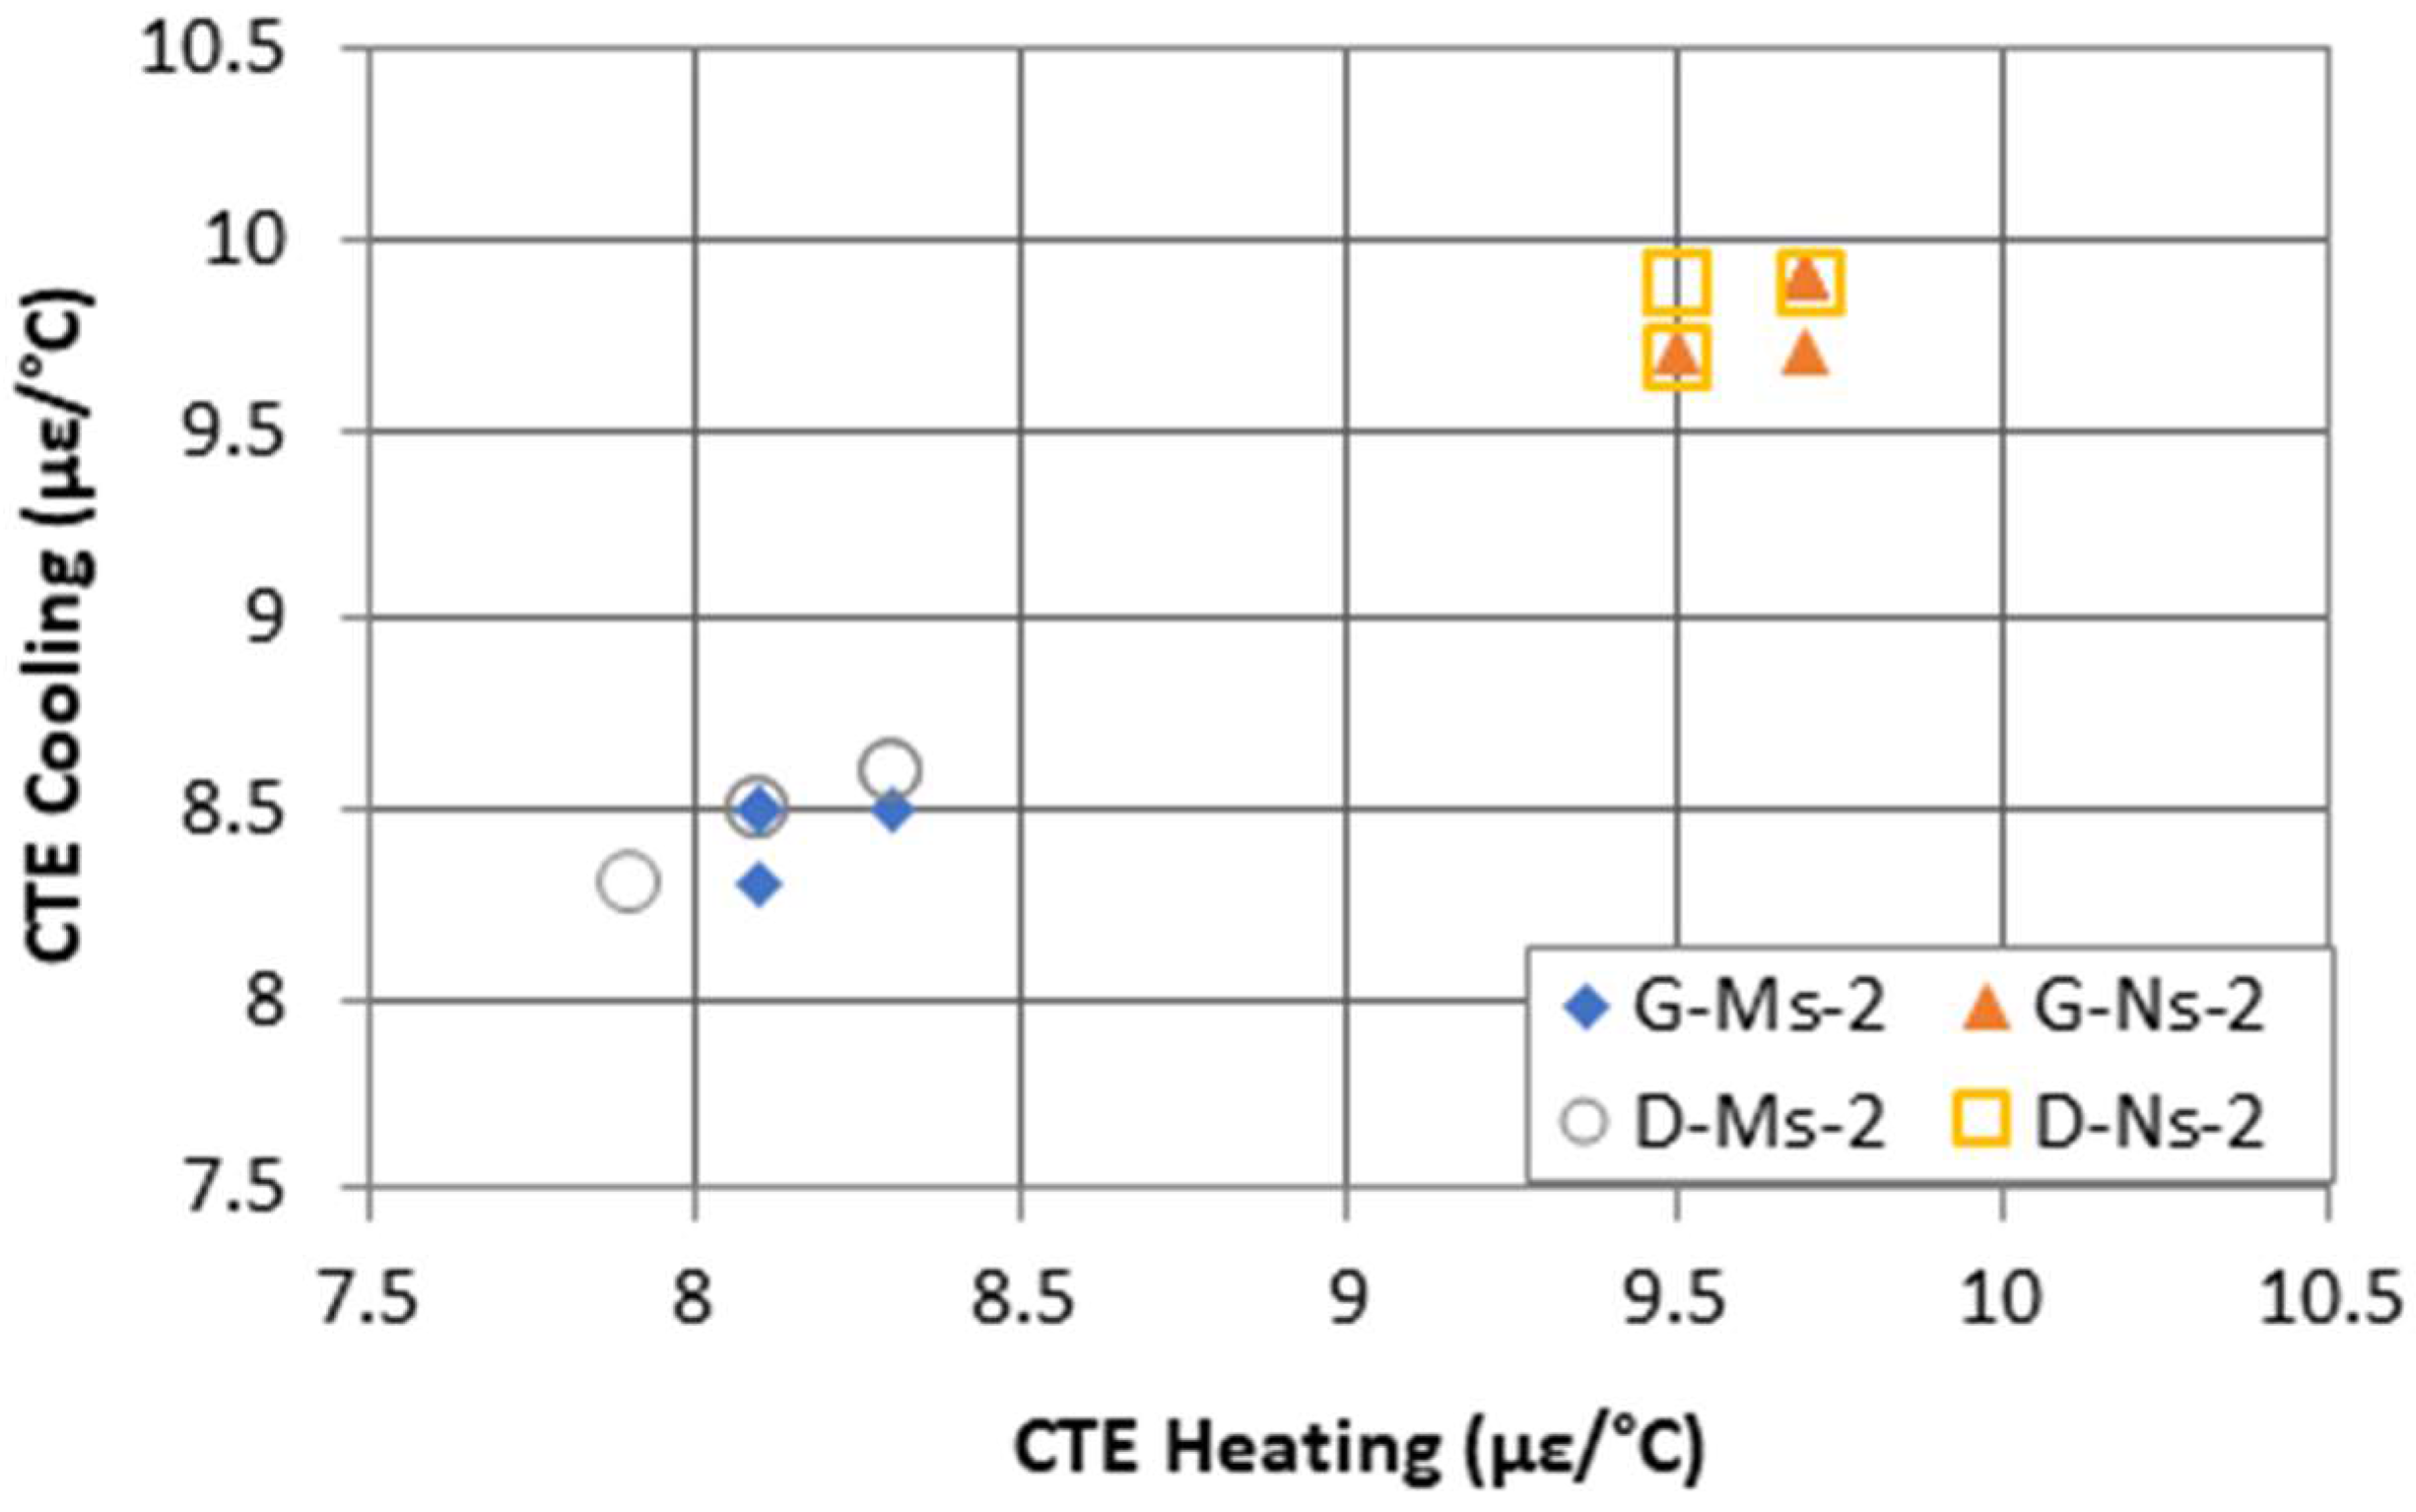
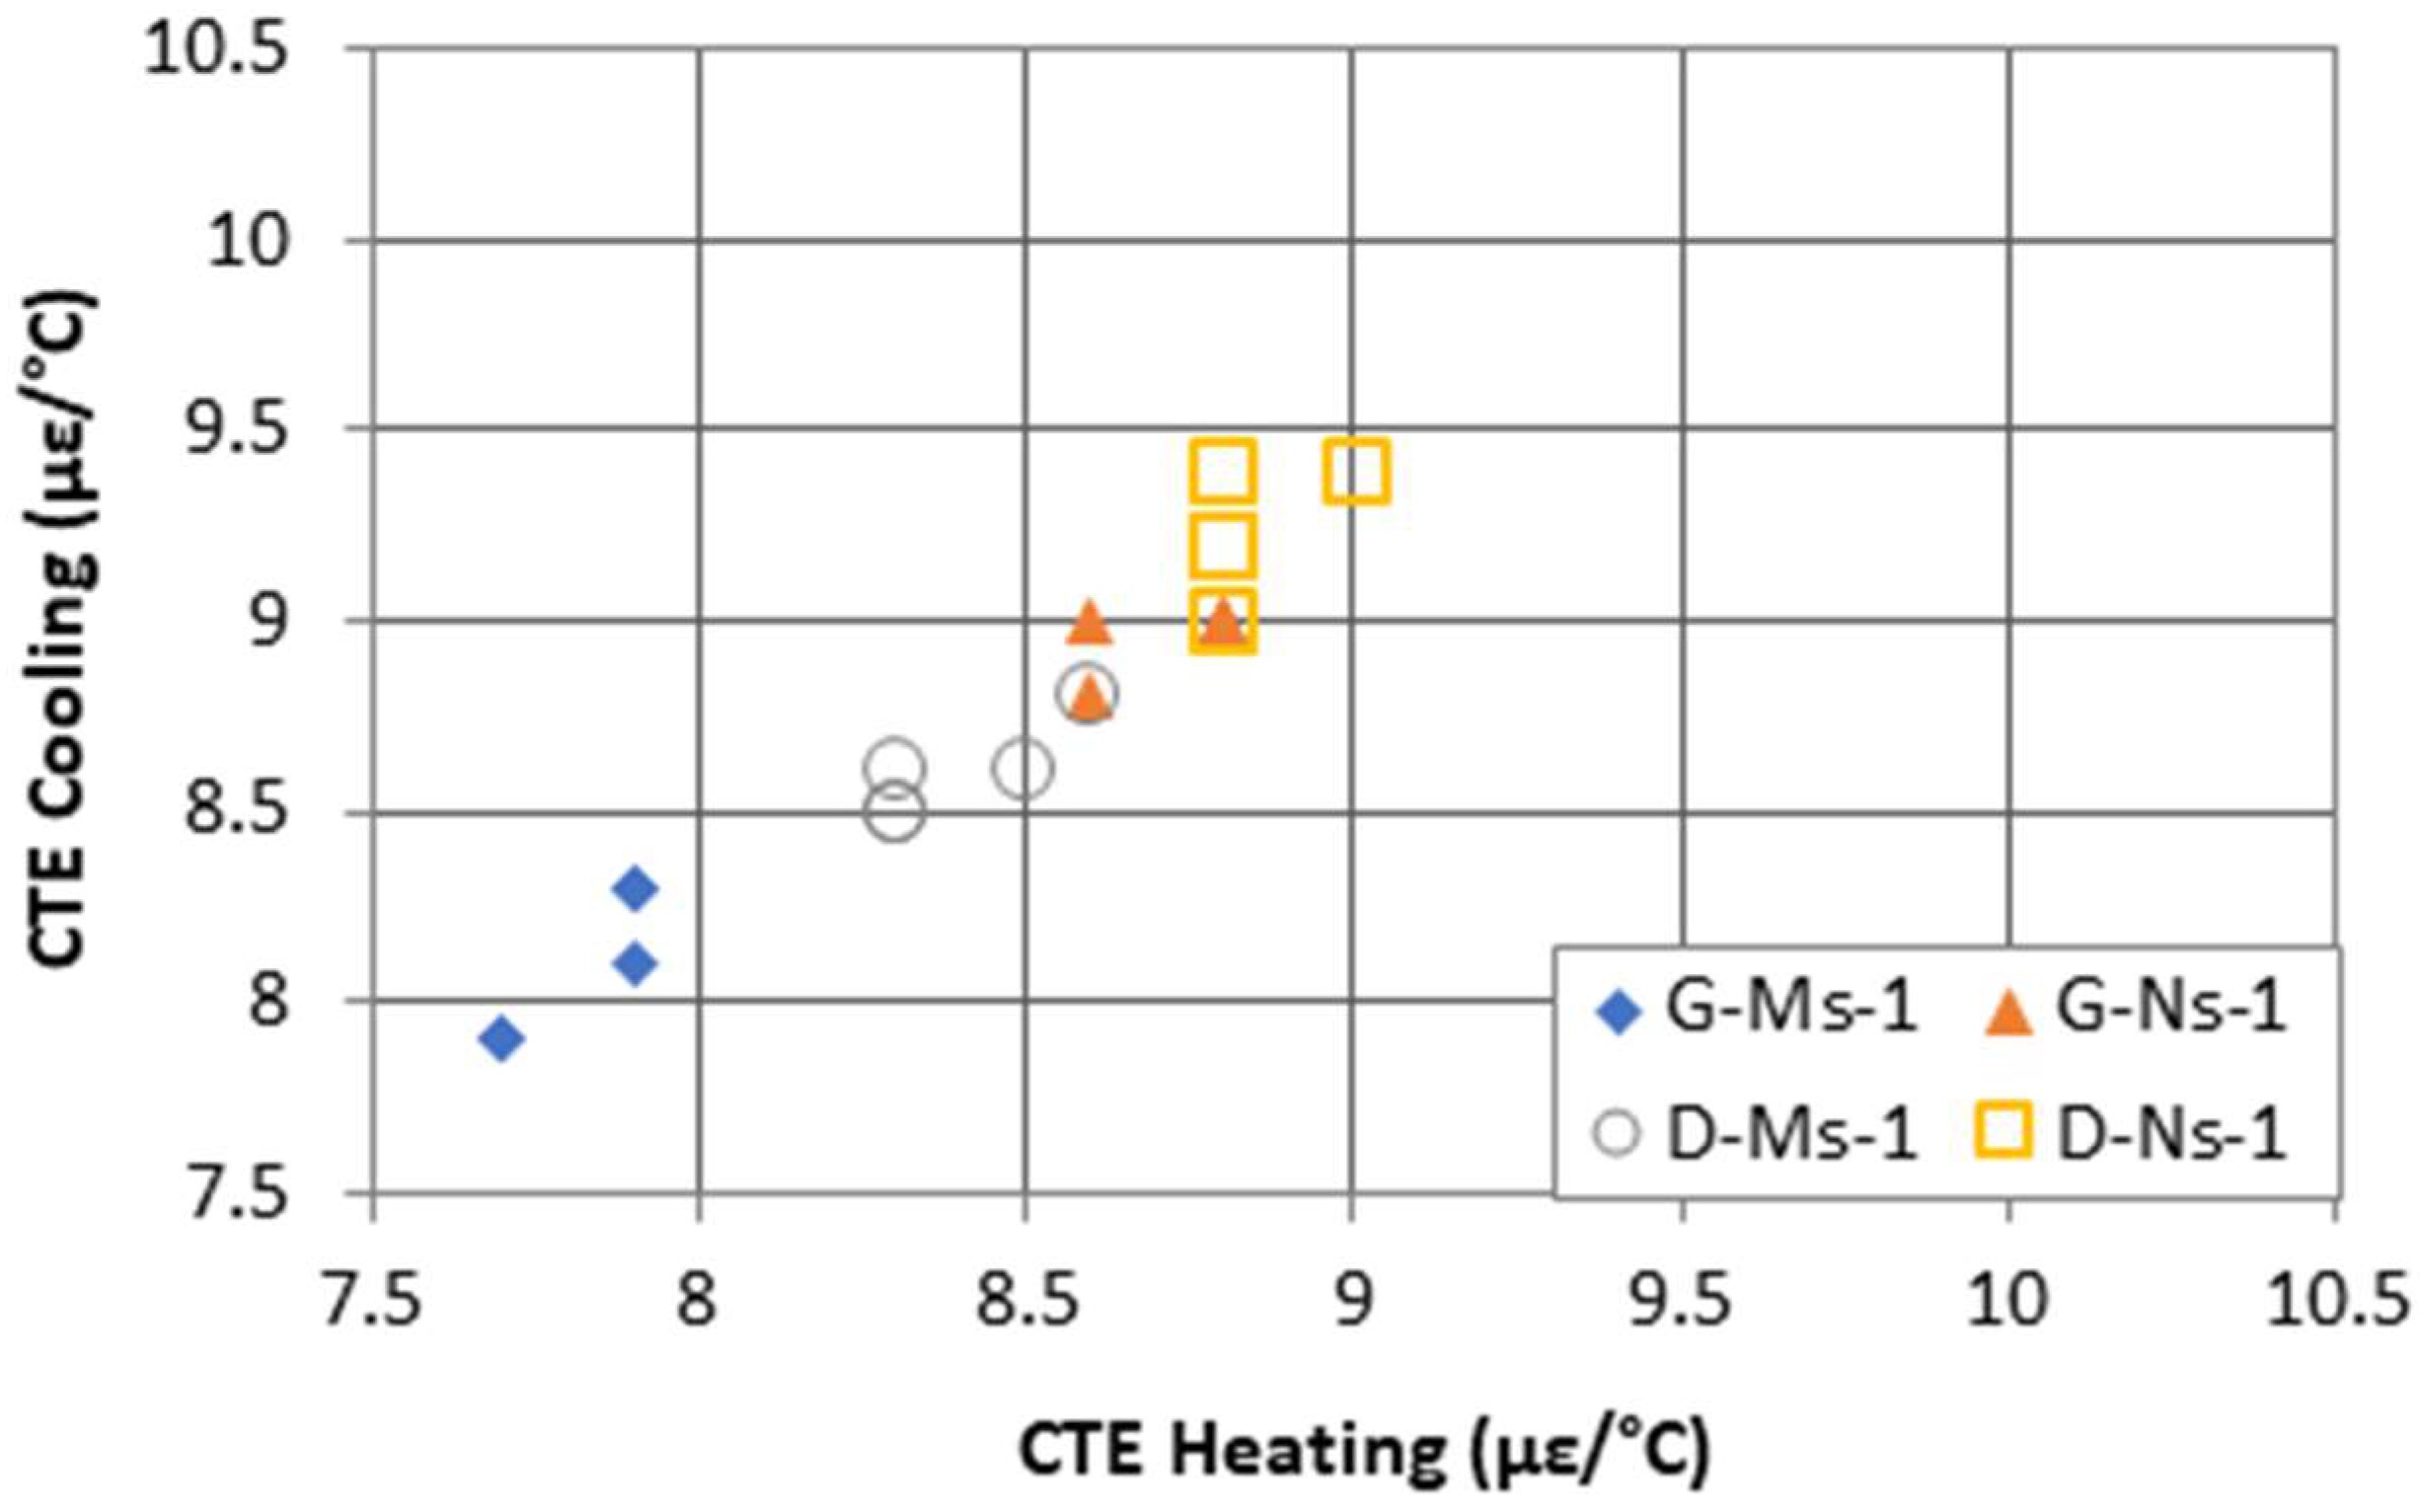
3.1. CTE Tests

The measured CTE values for the 40 specimens across the eight concrete mixtures are presented in Table 3. The effect of aggregate volume on CTE is visualized in Figure 4 where mixtures were prepared with a low volume of coarse aggregate and high volume of fine aggregate and Figure 5 with mixtures containing a high volume of coarse aggregate and low volume of fine aggregate.
In Figure 4, the average CTE of specimen D-Ns-2 is similar to that of specimen G-Ns-2, with specimen D-Ms-2 similar to specimen G-Ms-2. The concrete specimens with natural sand produced higher CTEs than those with manufactured sand. For concretes with a low volume of coarse aggregate, the influence of the coarse aggregate type on the CTE appears to be insignificant, which is in agreement with a previous study [10]. However, the type of fine aggregate has a greater influence on the concrete’s CTE. For the dolomite specimens, the range of the average CTE was 8.3 to 8.5 με/°C for concrete mixtures with manufactured sand and 9.0 to 9.7 με/°C with natural sand (see Table 3). Similarly, for concrete mixtures containing granite as the coarse aggregate, the average CTE ranges from 7.9 to 8.3 and 8.8 to 9.7 με/°C for of the manufactured and natural sand, respectively.
The increase in the CTE for mixtures containing natural sand is a result of the siliceous aggregate generally having a higher CTE than granite-based fine aggregates. Mindess et al., reported a CTE study using mortar specimens with different types and varying amounts of fine aggregates that found the CTE increases with increasing volume of siliceous sand and decreasing volume of limestone sand [7]. Similar findings reported that quartz (SiO2) has the highest CTE among common minerals (11.5–12.0 με/°C), while calcite has the lowest (4.5–5.0 με/°C) [26].
The EDX results, as will be discussed in a later section, confirm the natural sand had a much higher Si content than the manufactured sand. For concrete mixtures containing the high-volume of coarse aggregate, as shown in Figure 5, mixtures containing natural sand had higher CTE values than those with manufactured, regardless of the type of coarse aggregate. When dolomite and granite were compared with the same fine aggregate type, dolomite had a higher CTE than granite.
This study indicates that it is not only the coarse aggregate, but also the fine aggregate that can contribute substantially to the CTE of the concrete. This is significant when utilizing siliceous fine aggregates with higher CTE values particularly for concrete pavements that are placed during the summer construction period when high ambient temperatures correspond with the cement paste’s peak heat of hydration. This would occur for concrete placements in the early morning hours producing conditions that could potentially lead to early-age concrete cracking.

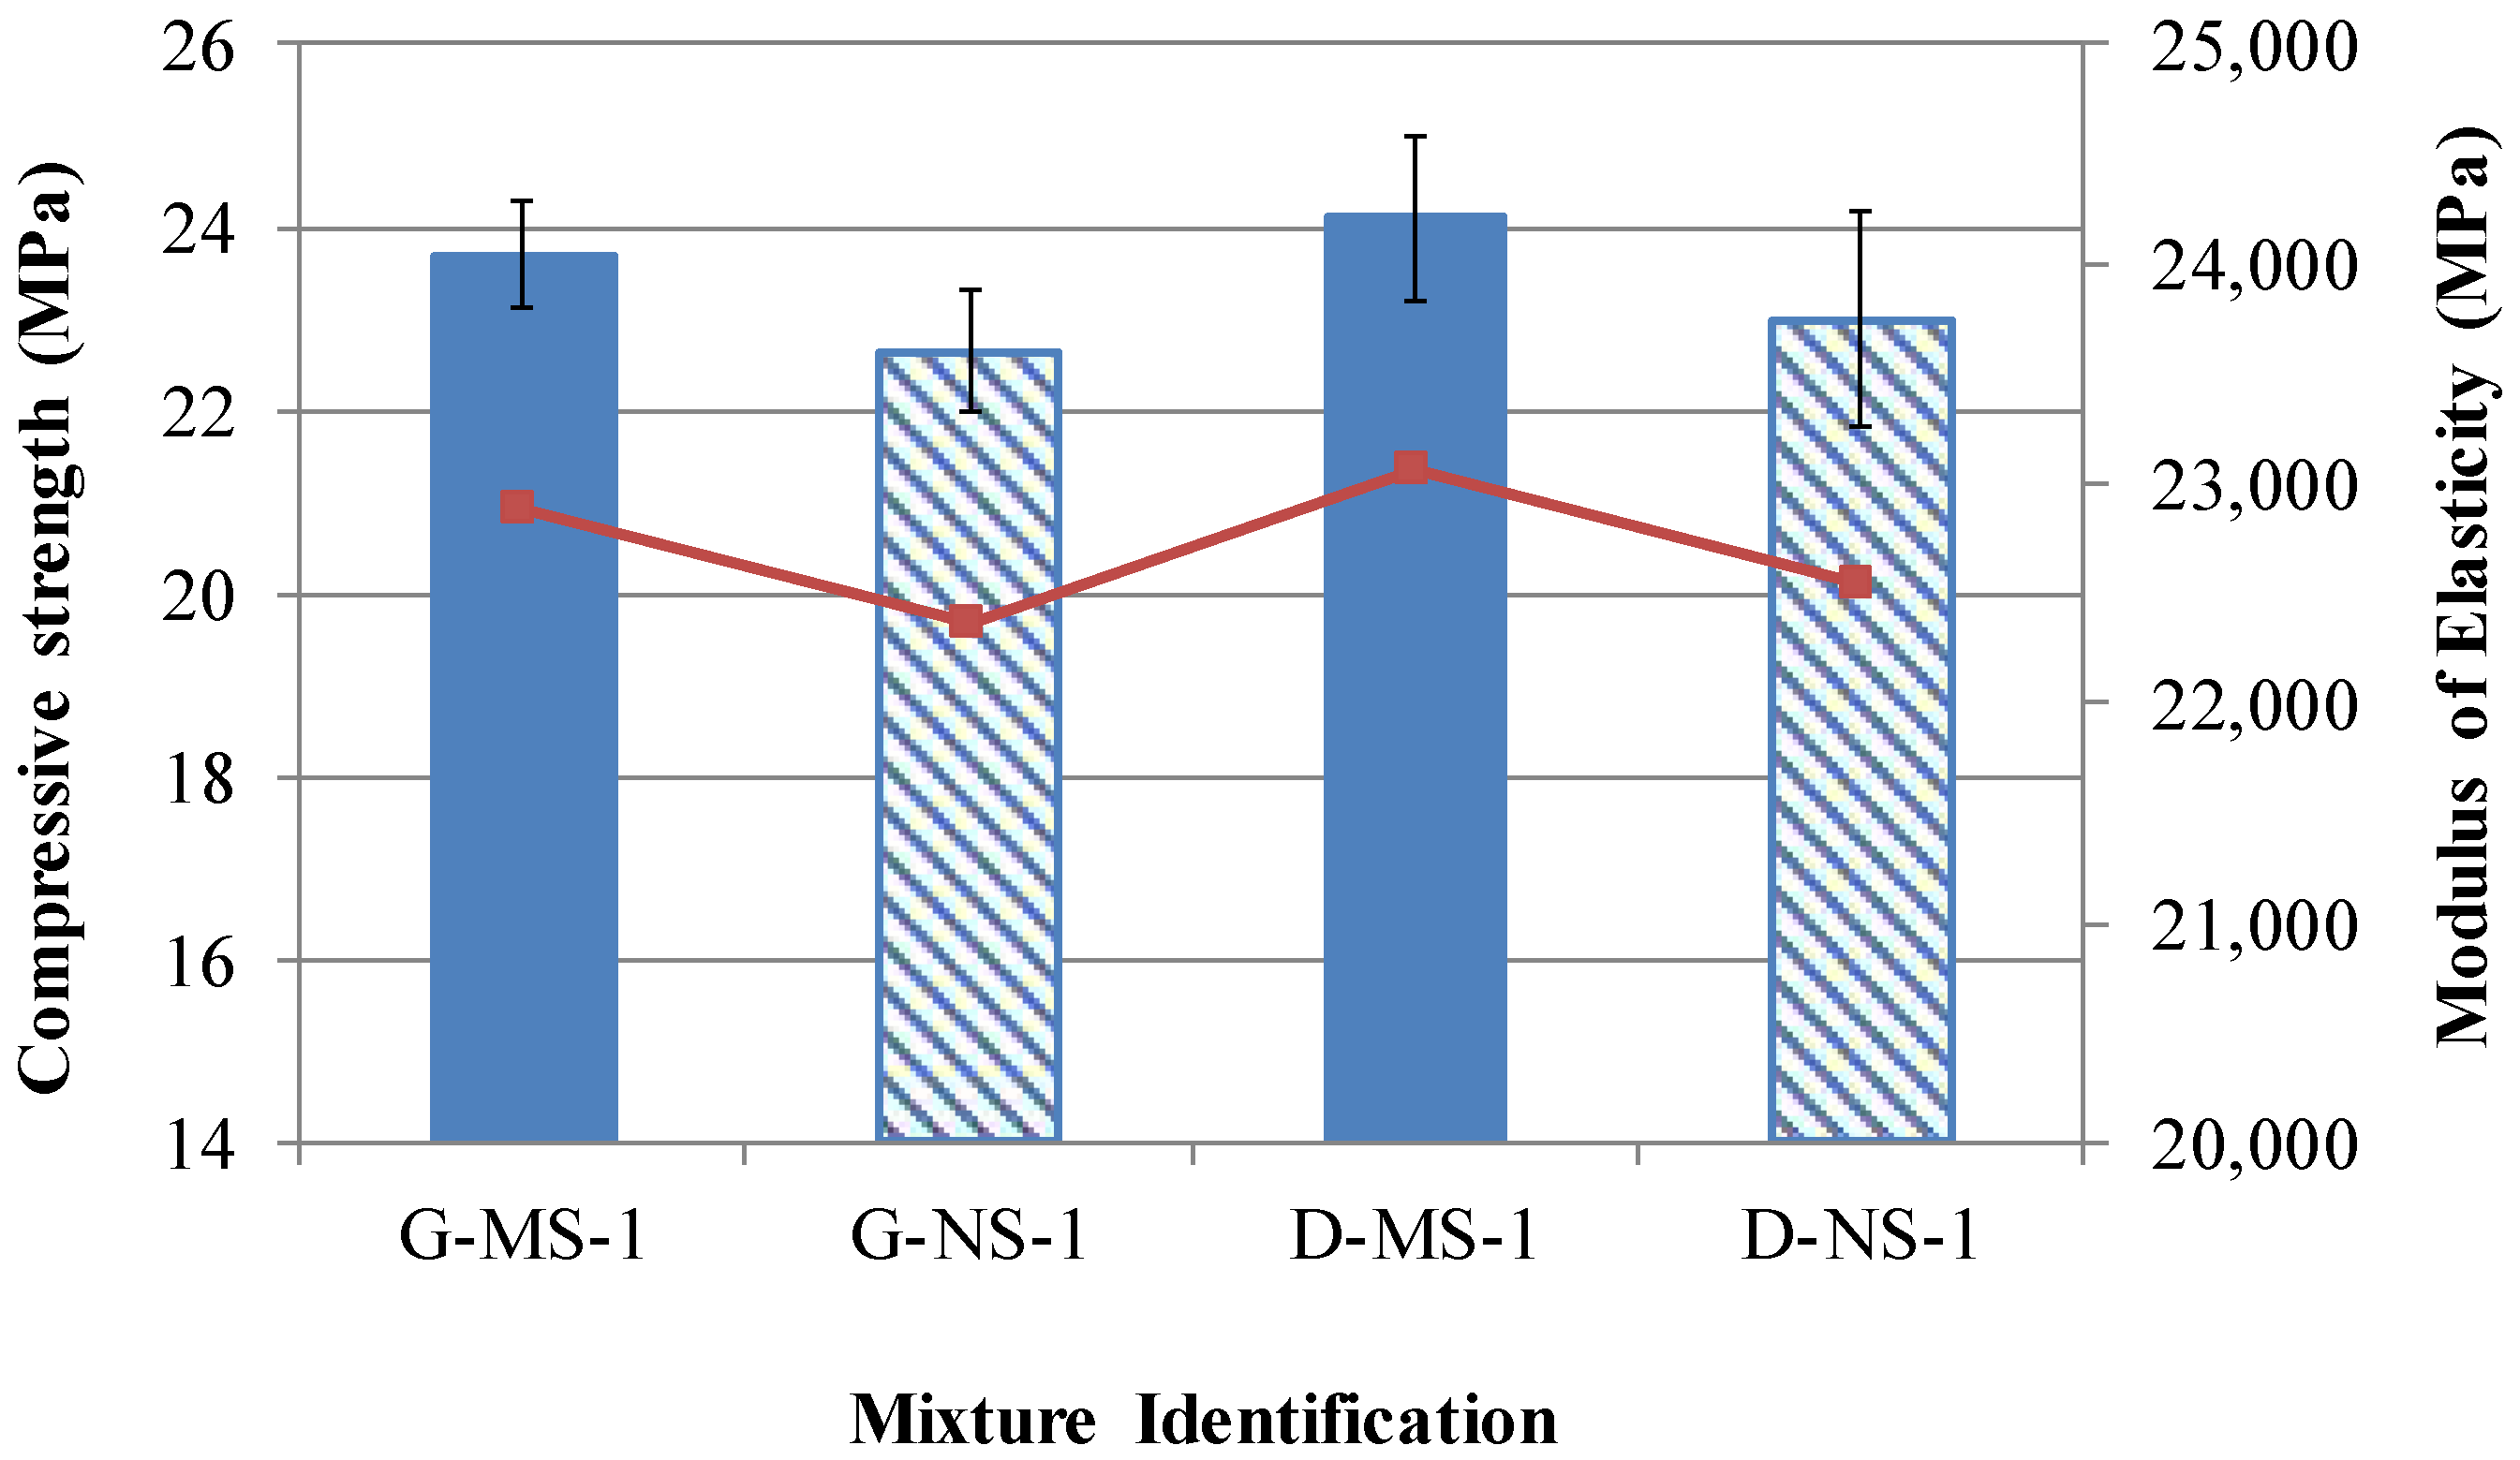
3.2. Compressive Strength Tests

In general, using a high volume of fine aggregate is not practical for the normal strength concrete (but not limited to the high-performance concrete). As such, only concrete specimens with a large volume of coarse aggregate were tested (G-MS-1, D-MS-1, G-NS-1, D-NS-1) for compressive strength. The average compressive strength of three cylinder specimens is presented in Figure 6. Specimen D-Ms-1 had the highest compressive strength of 24.1 MPa, while specimen G-Ns-1 had the lowest value of 22.6 MPa. The compressive strength of the specimens with manufactured sand was higher than those with natural sand. The data indicates that the different types of fine aggregate affect the results of compressive strength of concrete. One of the reasons is the CTE of fine aggregate. Since the CTE range of siliceous natural sand is around 12 × 10−6/°C which is higher than the CTE range of granite–gneiss manufactured sand (8 × 10⁻⁶/°C ), during hardening process siliceous natural sand might cause a network of micro-cracks around it. The other reason is the shape and texture of aggregate. The angular shape and rough texture produce better bonding between the aggregate particles and cement paste [35]. The specimens with dolomite produced slightly higher compressive strength than those with granite. In addition, the modulus of elasticity was calculated according to the equation of ACI code (4700 f ) [35] in Figure 6. The results show the same trend as the results of compressive strength. Concrete specimens which have higher compressive strength displayed higher modulus of the elasticity.

3.3. Mineral Characterization

The chemical compositions of the aggregates were determined by EDX. In conjunction with the aggregate particles’ examination with the SEM, the particles were subjected to an electron beam used to characterize the elemental composition of the samples. Table 4 provides the complete chemical composition of each aggregate used in the study with the total percent composition summing to 100% for each.

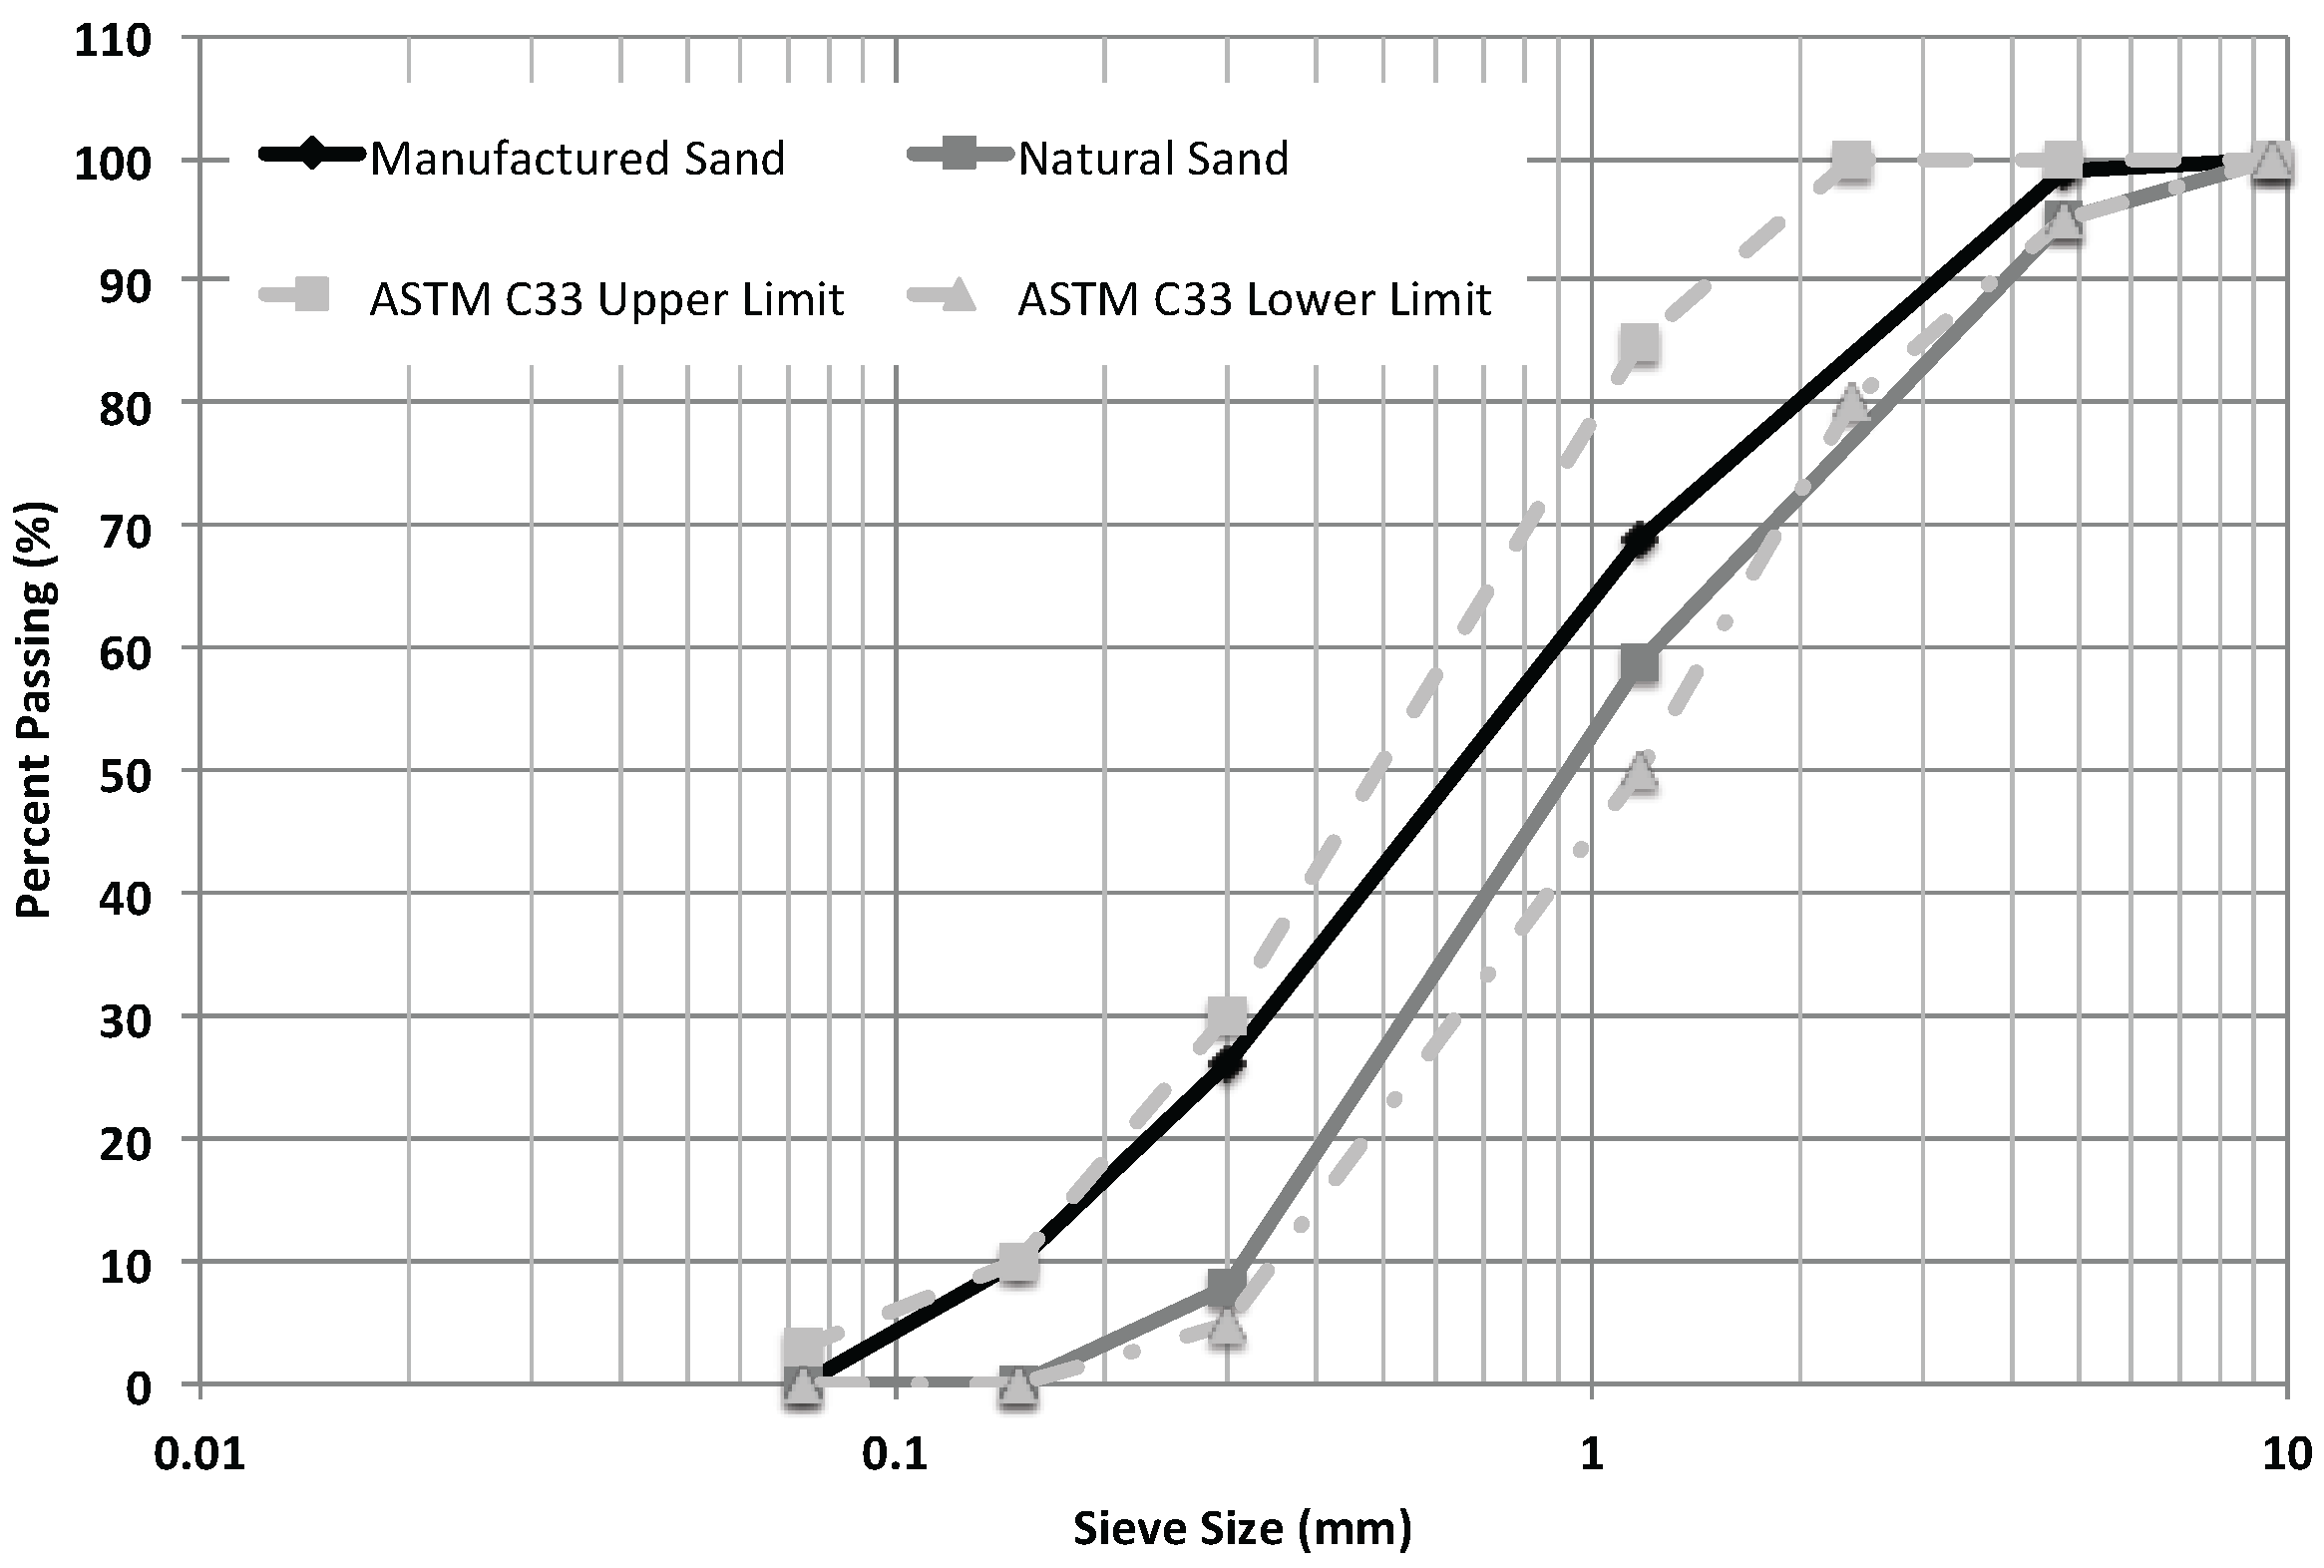
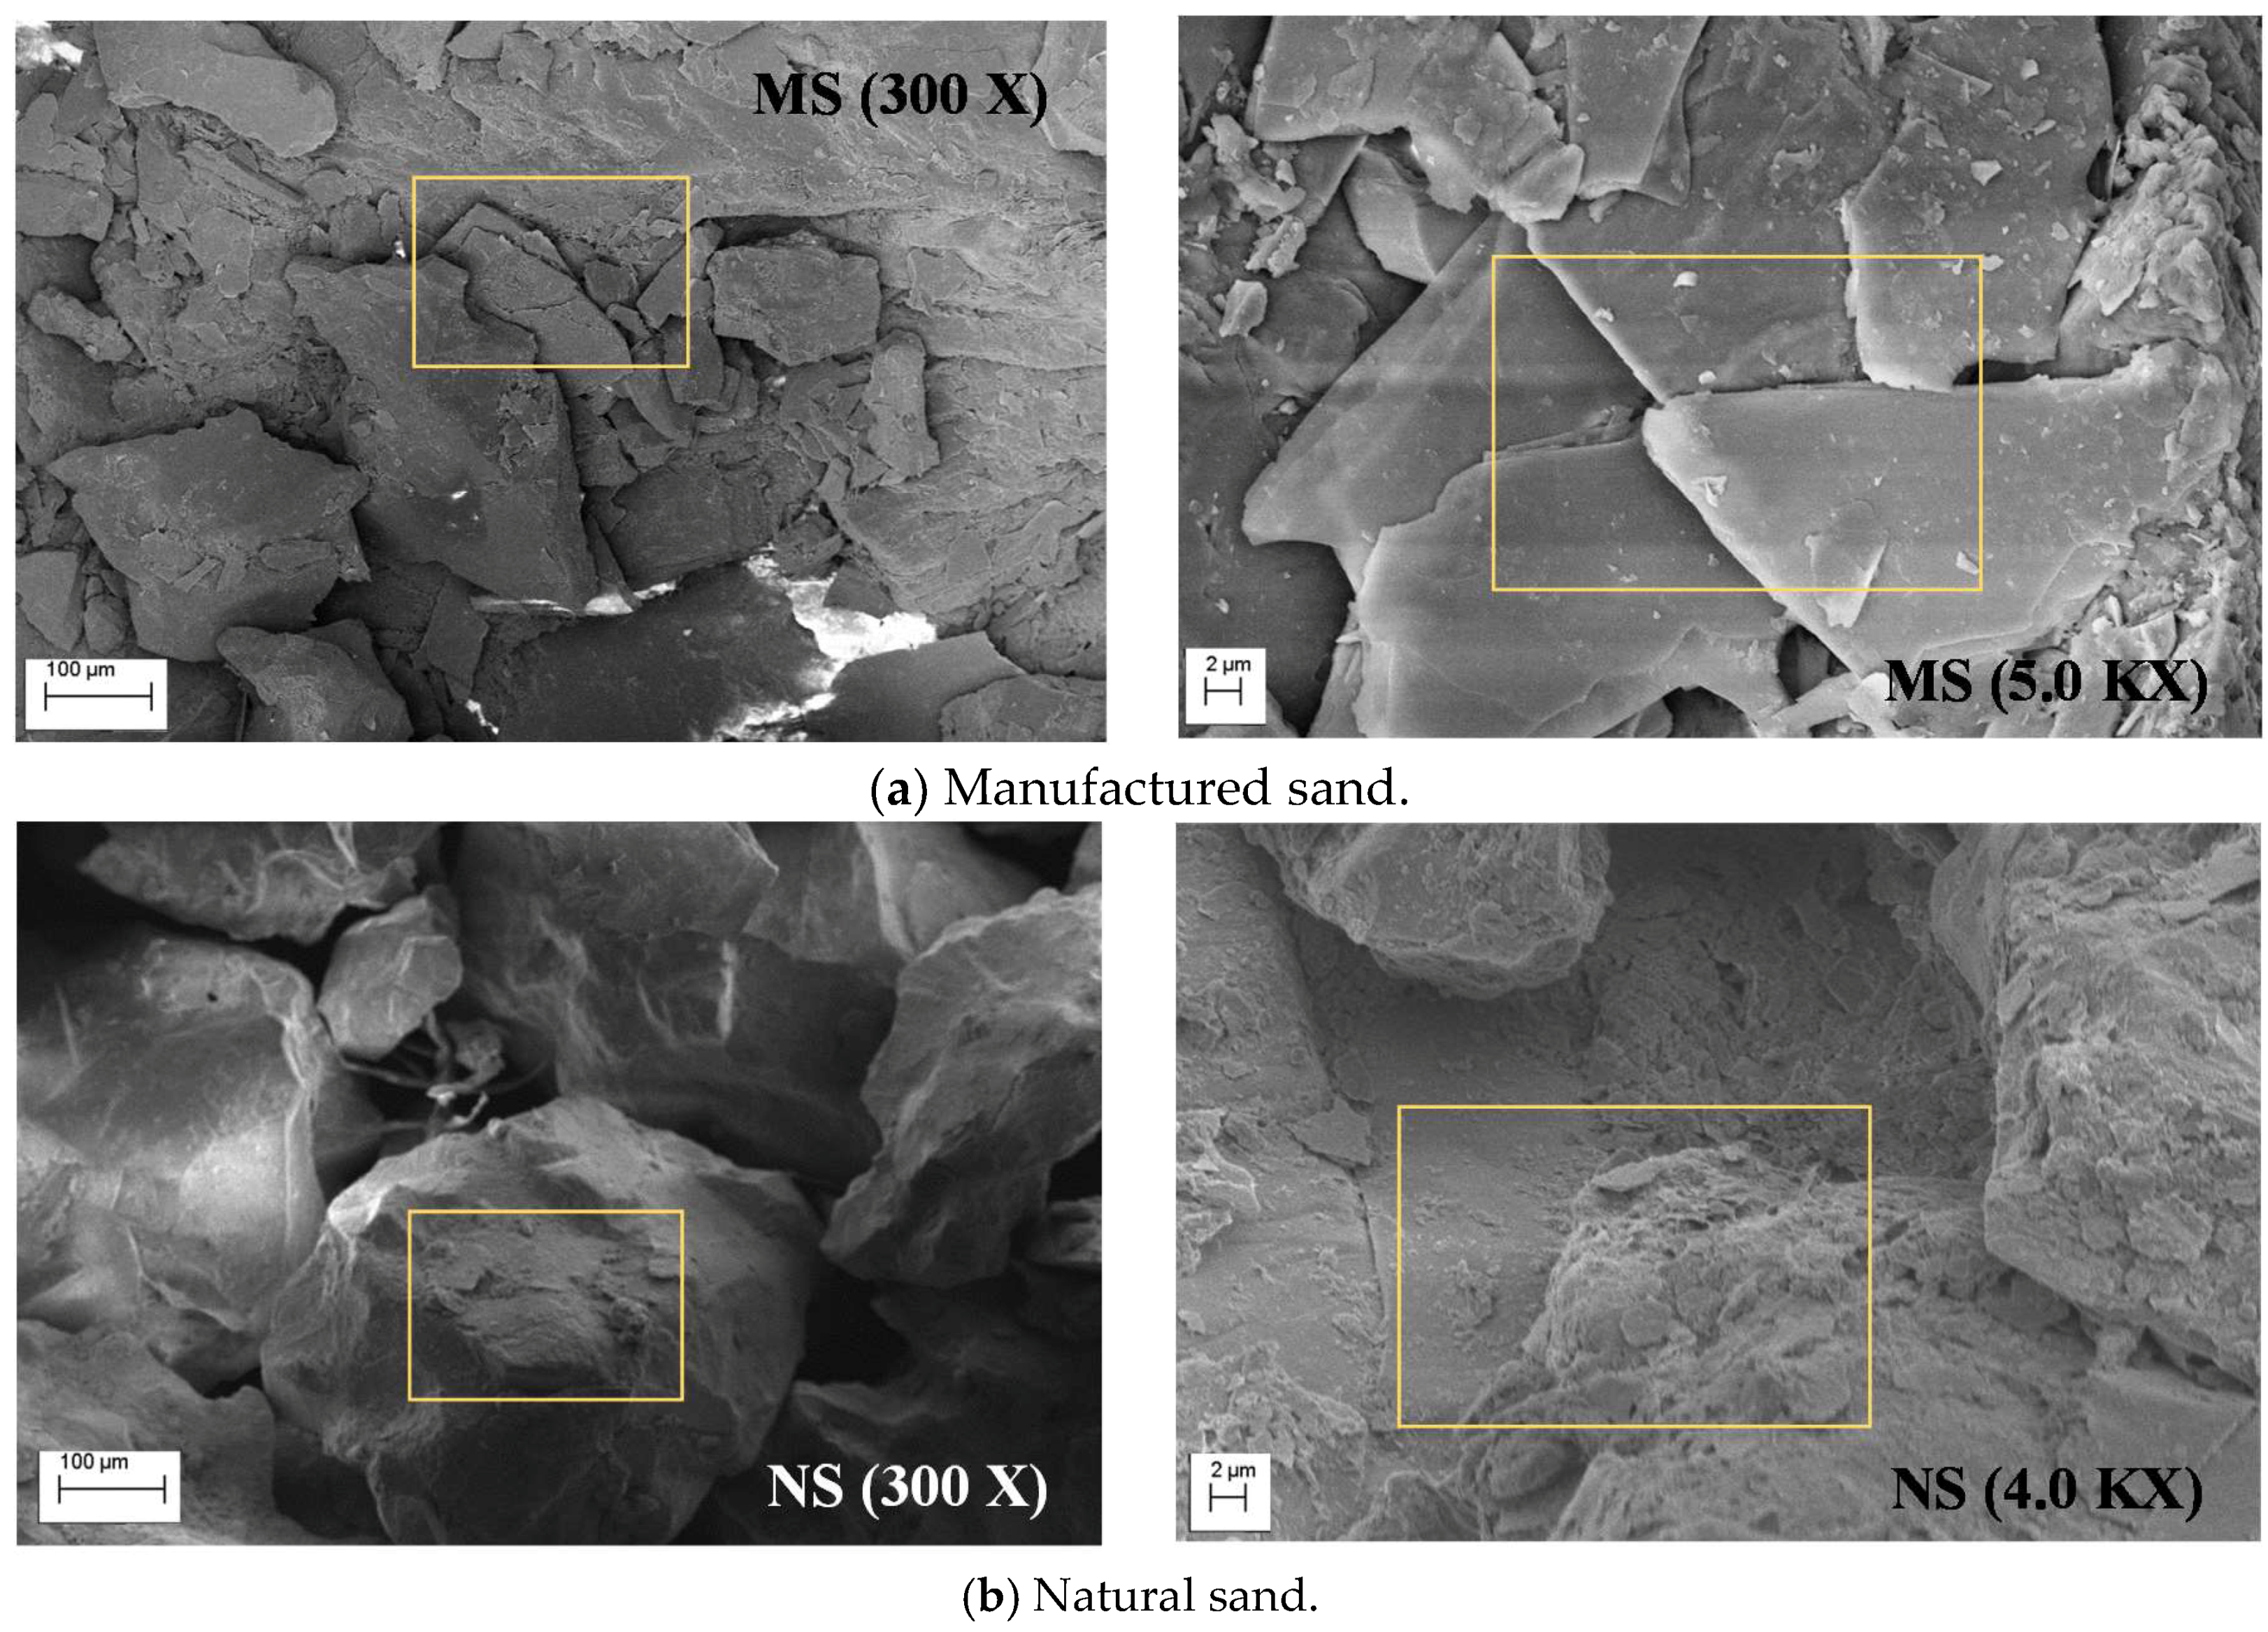
3.3.1. Fine Aggregate: Manufactured and Natural Sand

SEM images of the manufactured and natural sands at 300 X (left) and 5000 X (right) magnifications are shown in Figure 7. As expected, the natural sand is smooth and round, while the manufactured sand has a rough surface with an angular and elongated shape. Therefore, improved workability is expected with concrete containing natural sand. As shown in Table 4, the major components of the manufactured sand were oxygen (O), iron (Fe), silicon (Si), and tantalum (Ta), which account for more than 60% of the composition by weight. For natural sand, the predominant element is Si, and more than 75% by weight of the natural sand is O, Si, aluminum (Al), and Fe.

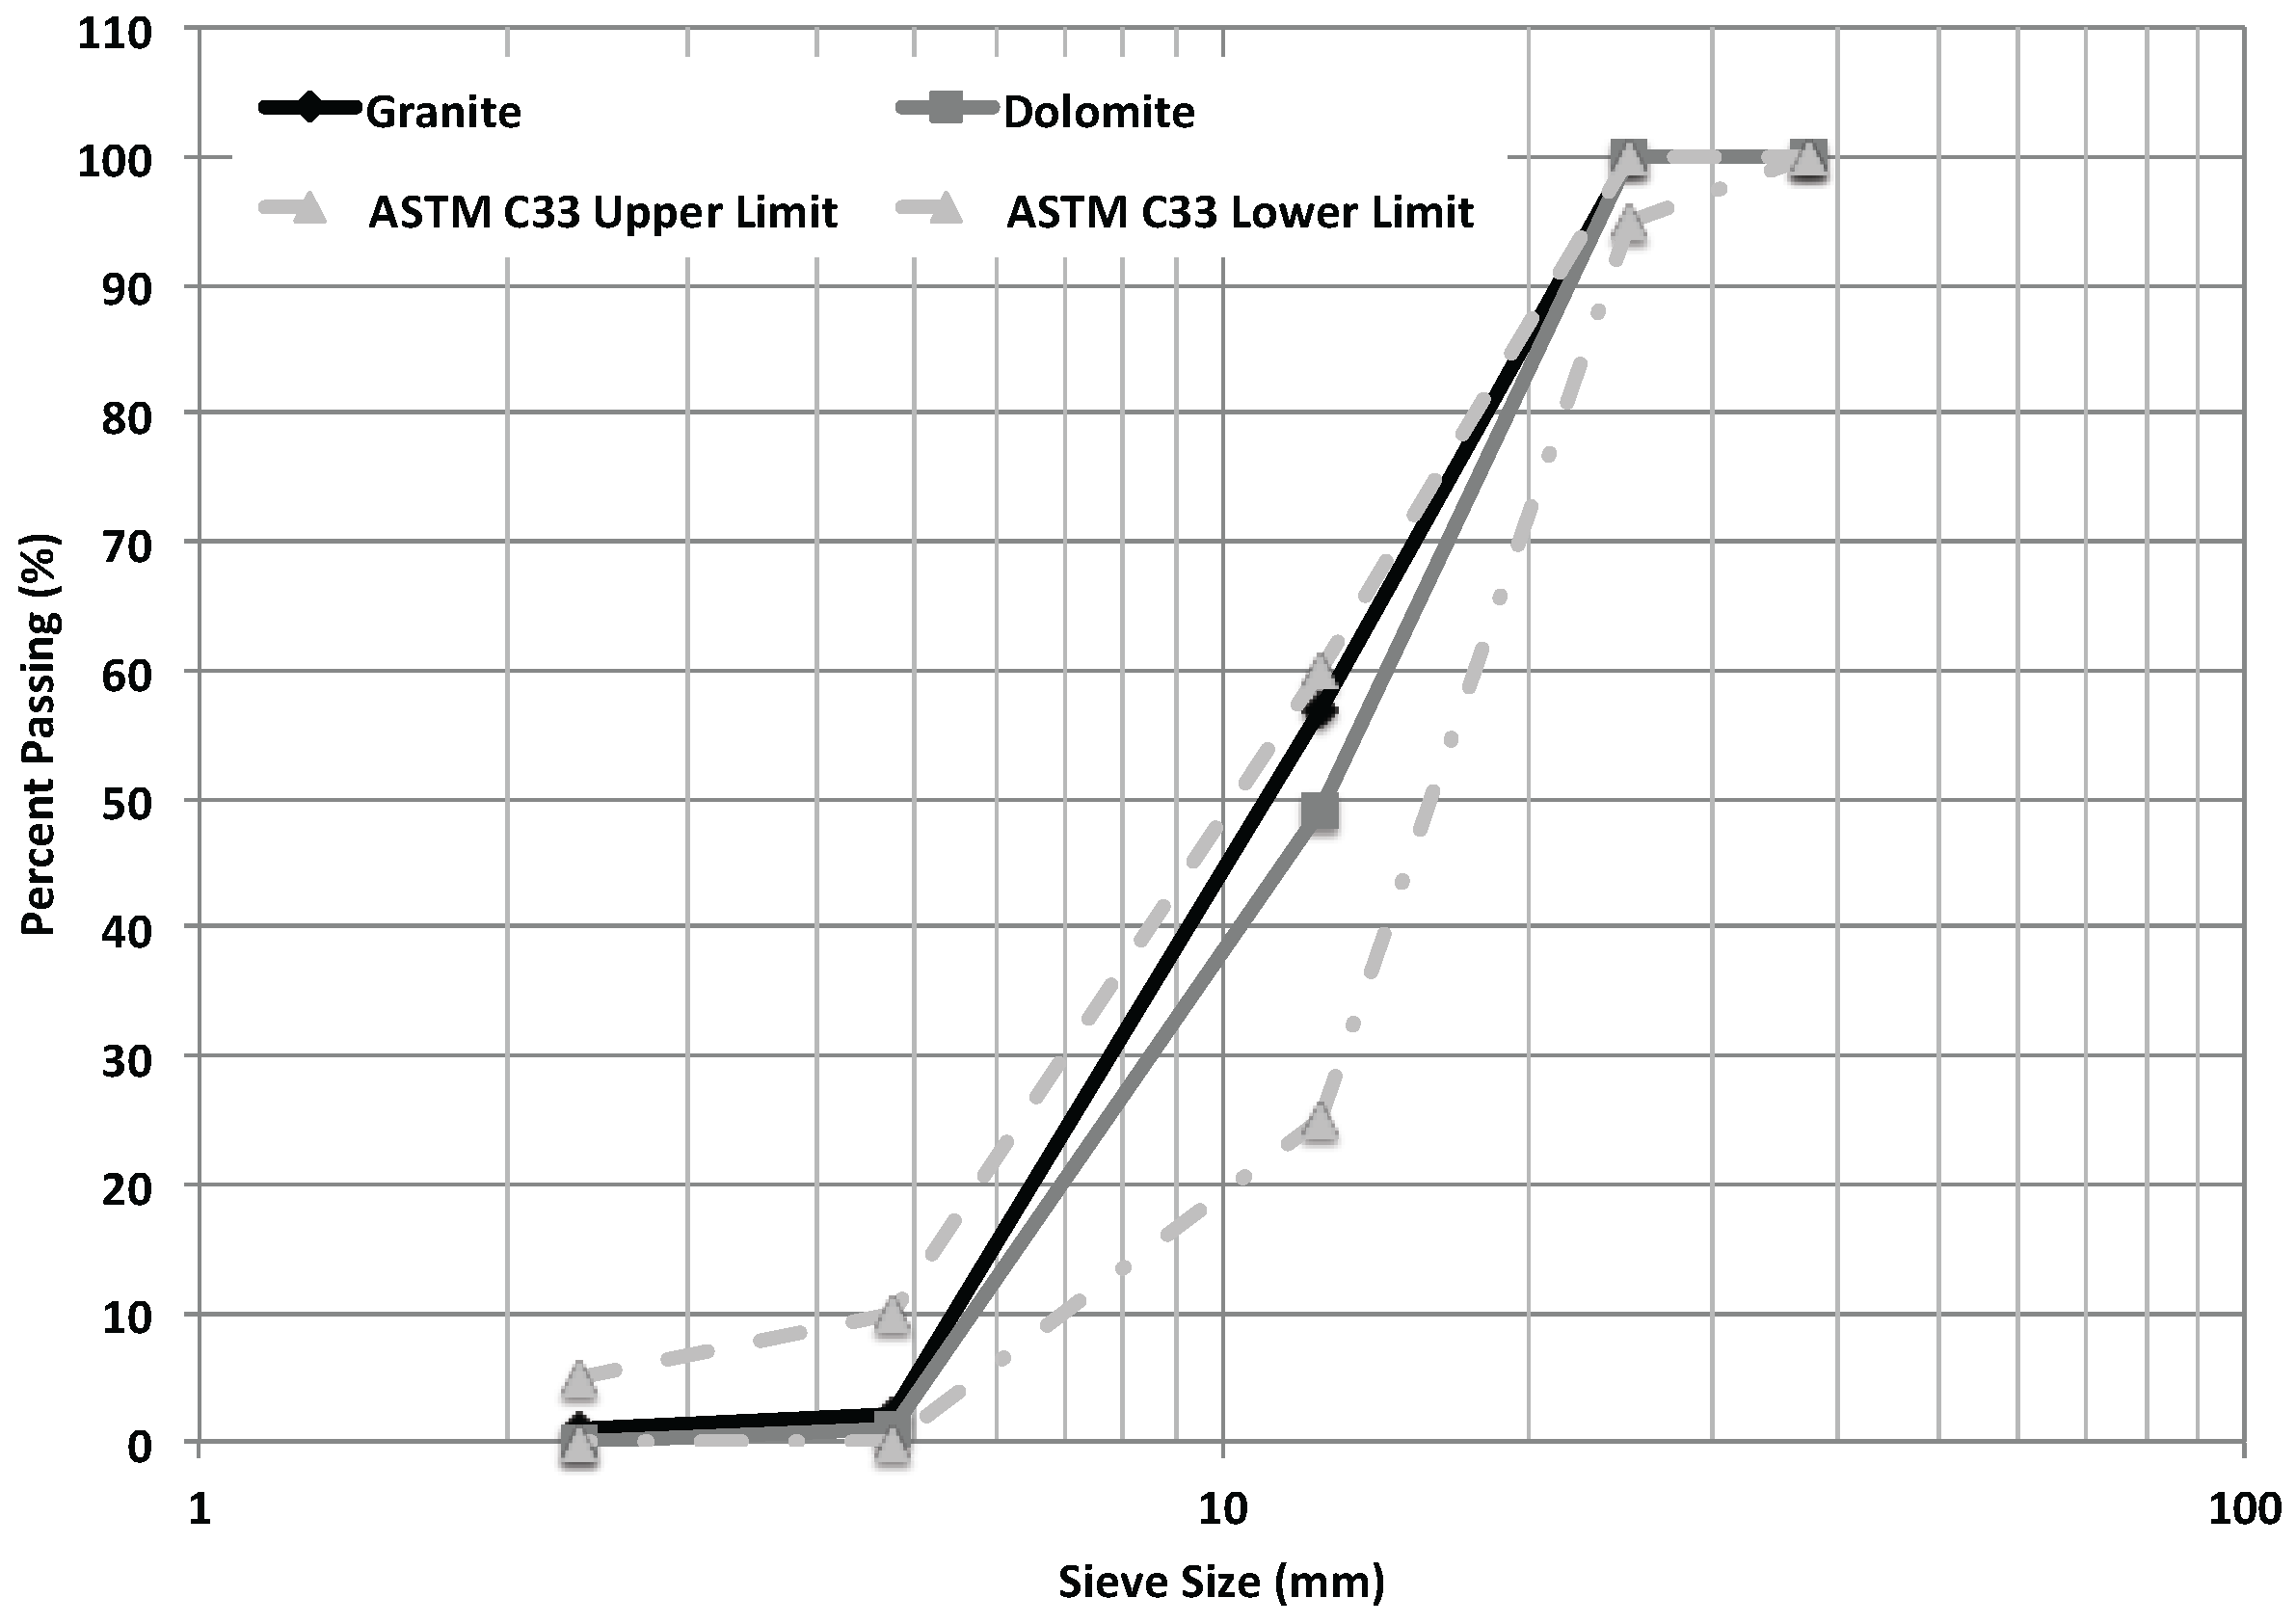
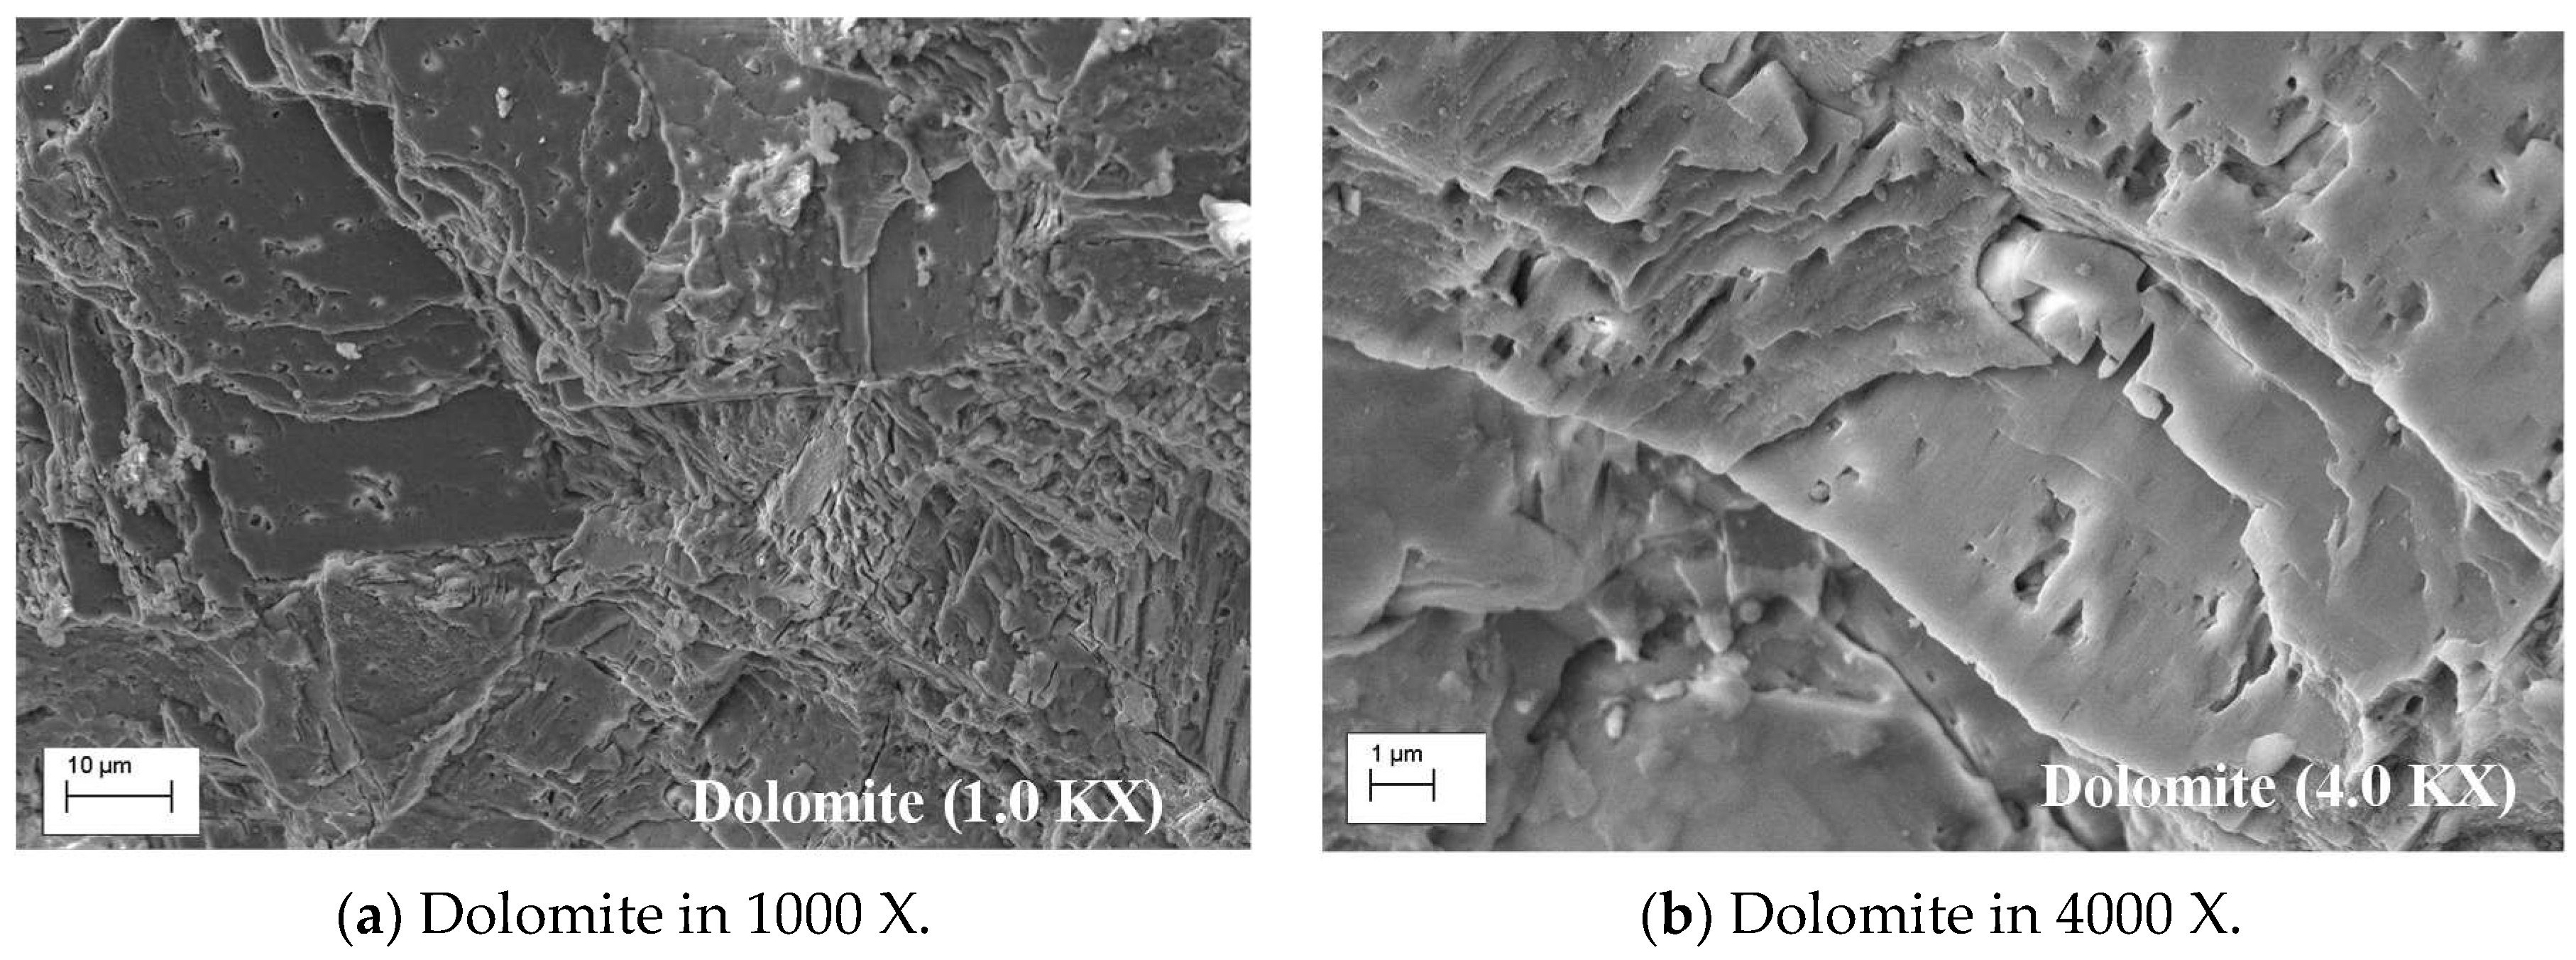
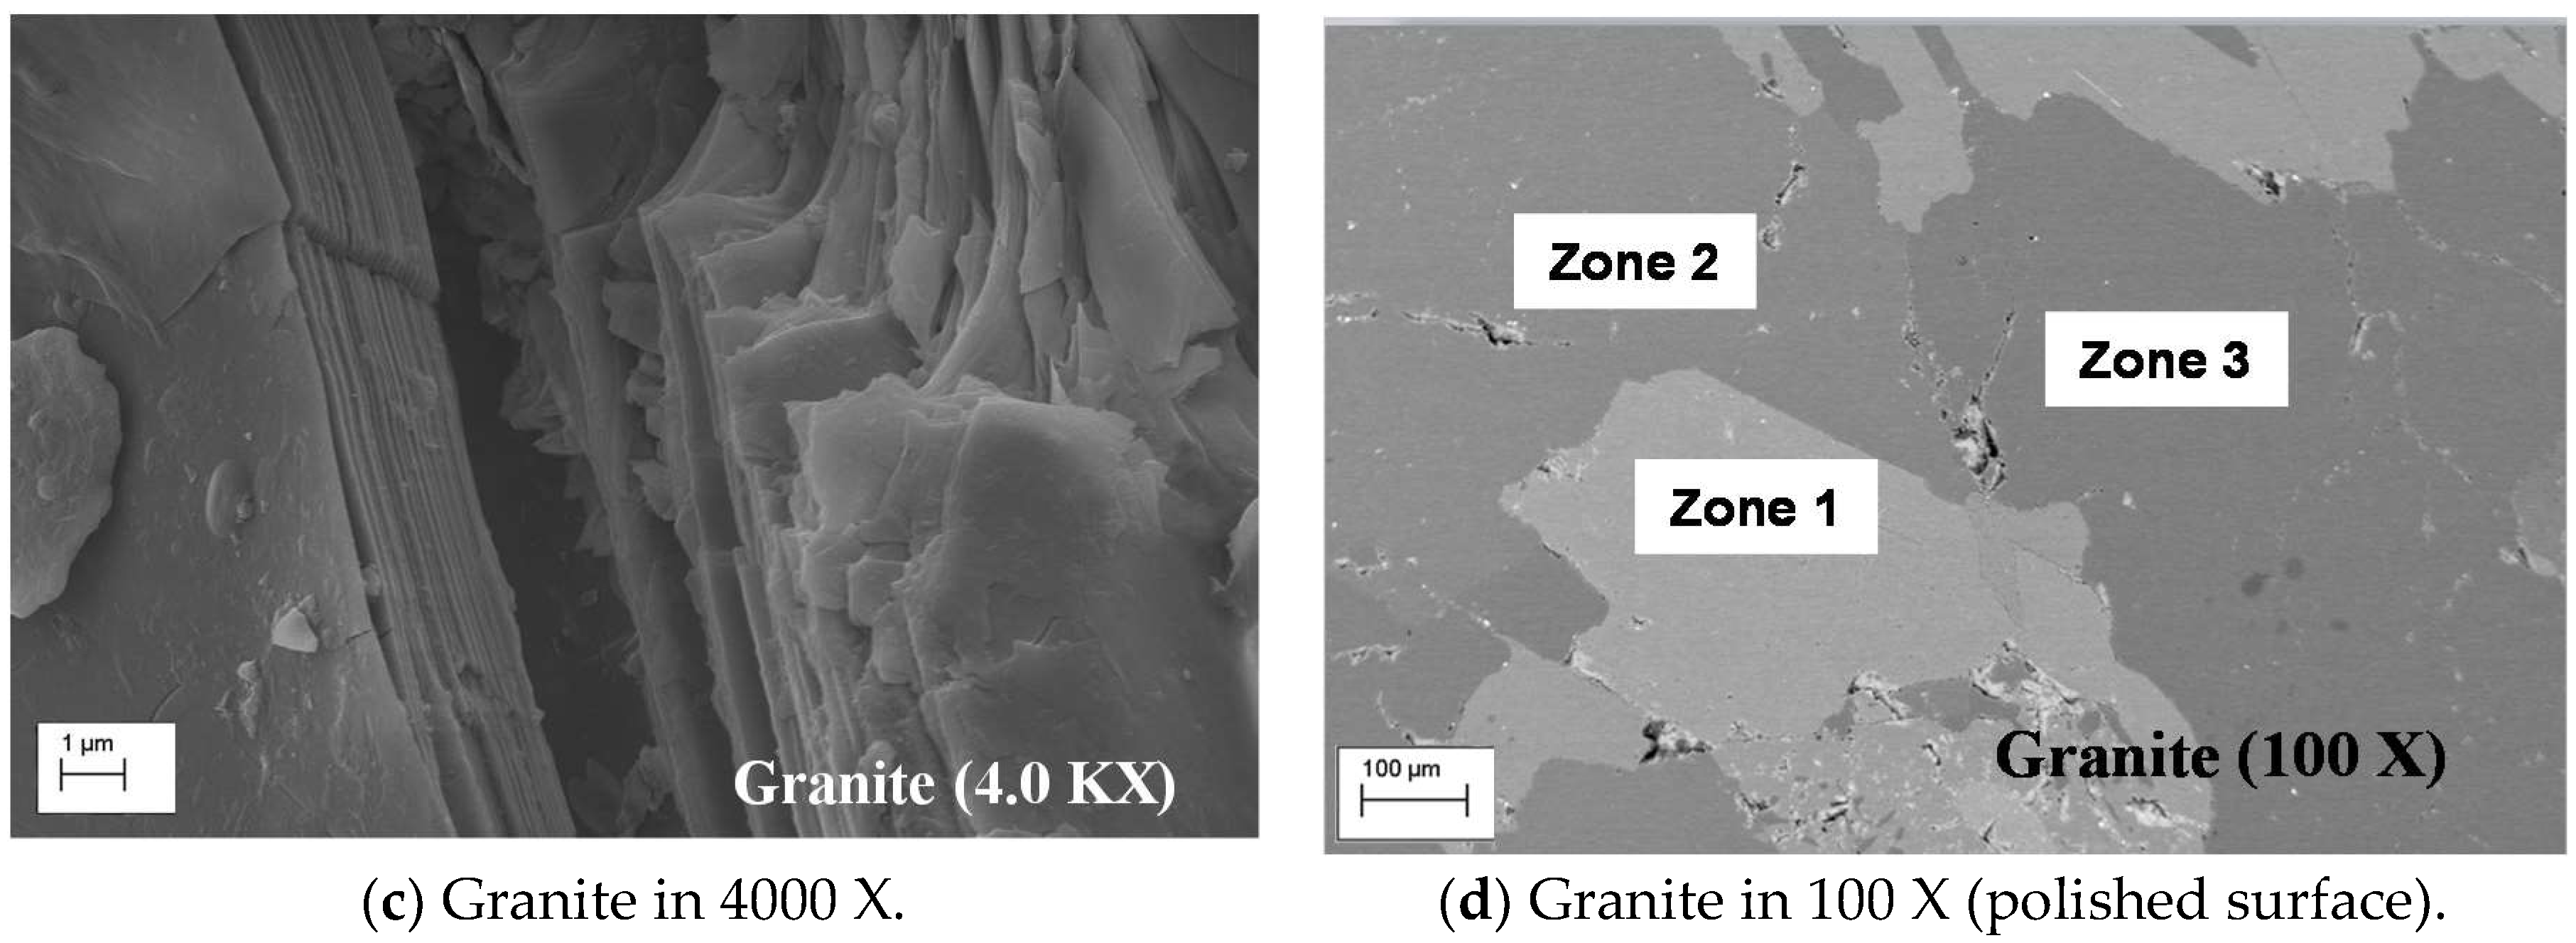
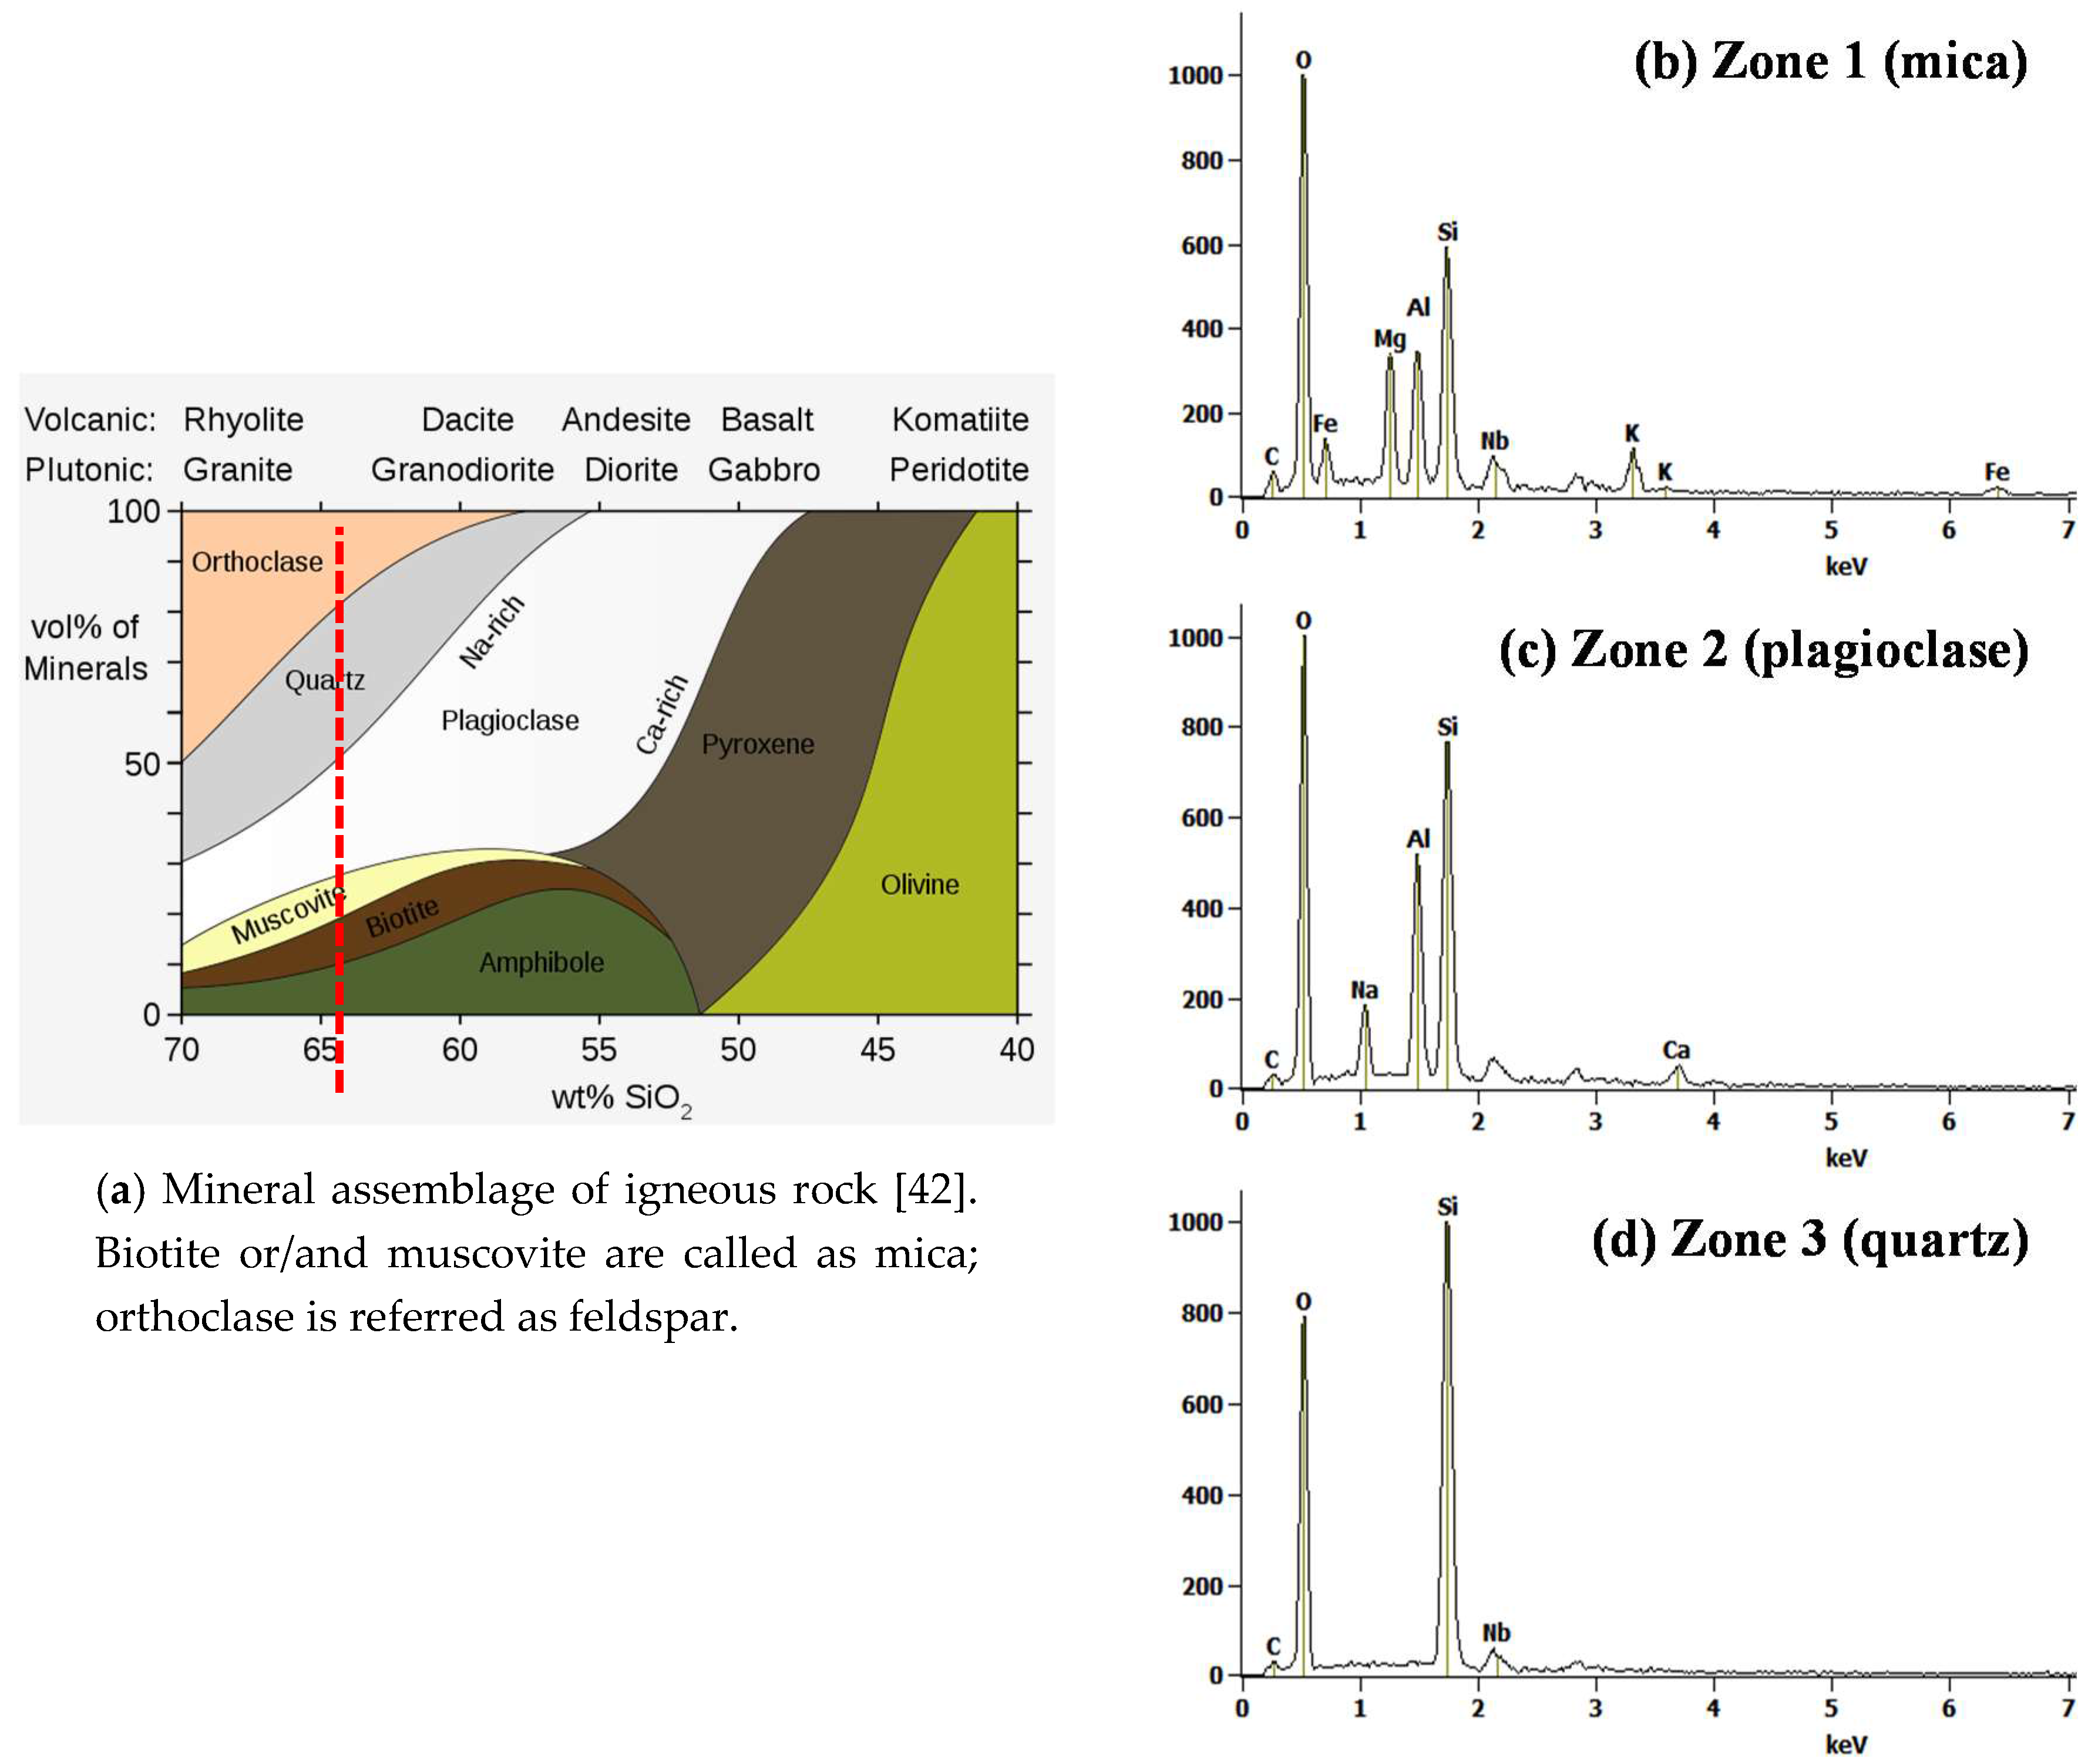
3.3.2. Coarse Aggregate: Dolomite and Granite

Dolomite is a carbonate mineral (calcium magnesium carbonate, CaMg(CO3)2) that is formed by chemical or biological precipitations from seawater reacting with CaCO3 [36]. Typical oxide analysis of dolomite indicates 47.7% CO2, 30.4% CaO, and 21.9% MgO by weight [37,38,39,40,41]. SEM images of dolomite are shown in Figure 8a,b. The images show dolomite deposition in beds, layers, and strata, which are characteristic of sedimentary rock [42]. The EDX data shown in Table 4 confirm that the calcium and magnesium are more abundant than any other impurity element.
Granite is a type of igneous rock consisting of different minerals. The SEM image of granite (Figure 8c) shows a partial platy structure. In addition, the granite shows special features in the form of three separate zones identified by backscattered electron image analysis (see Figure 8d). The mineral assemblage of igneous rocks is shown in Figure 9a. The igneous rocks mainly consist of feldspar, quartz, mica, and amphibole minerals. These forms interlock in a somewhat equigranular matrix of feldspar and quartz with darker biotite mica and amphibole scattered within the lighter color minerals. By definition, granite is an igneous rock with at least 20% quartz and up to 65% alkali feldspar by volume. The EDX data shown in Table 4 indicates the percentage of Si, and the granite used in this study can be located in the mineral assemblage of igneous rocks (see the vertical dashed line in Figure 9a).
EDX analysis results of the three distinct zones in the granite sample are shown in Figure 9b–d. The brighter Zone 1 contains a higher percentage of iron and magnesium. It may contain a mica group of sheet silicate (phyllosilicate) minerals. The darker Zone 2 is rich in silicon, aluminum, sodium, and cobalt. It may contain an aluminosilicate and a part of the feldspar family, mainly plagioclase. The darkest Zone 3 is rich in silicon and mostly contains quartz. Niobium and tantalum were predominantly found in the granite sample by elemental analysis. Niobium and tantalum are generally found as primary minerals in alkaline igneous rocks like granite [41].

3.4. Microstructural Evaluation

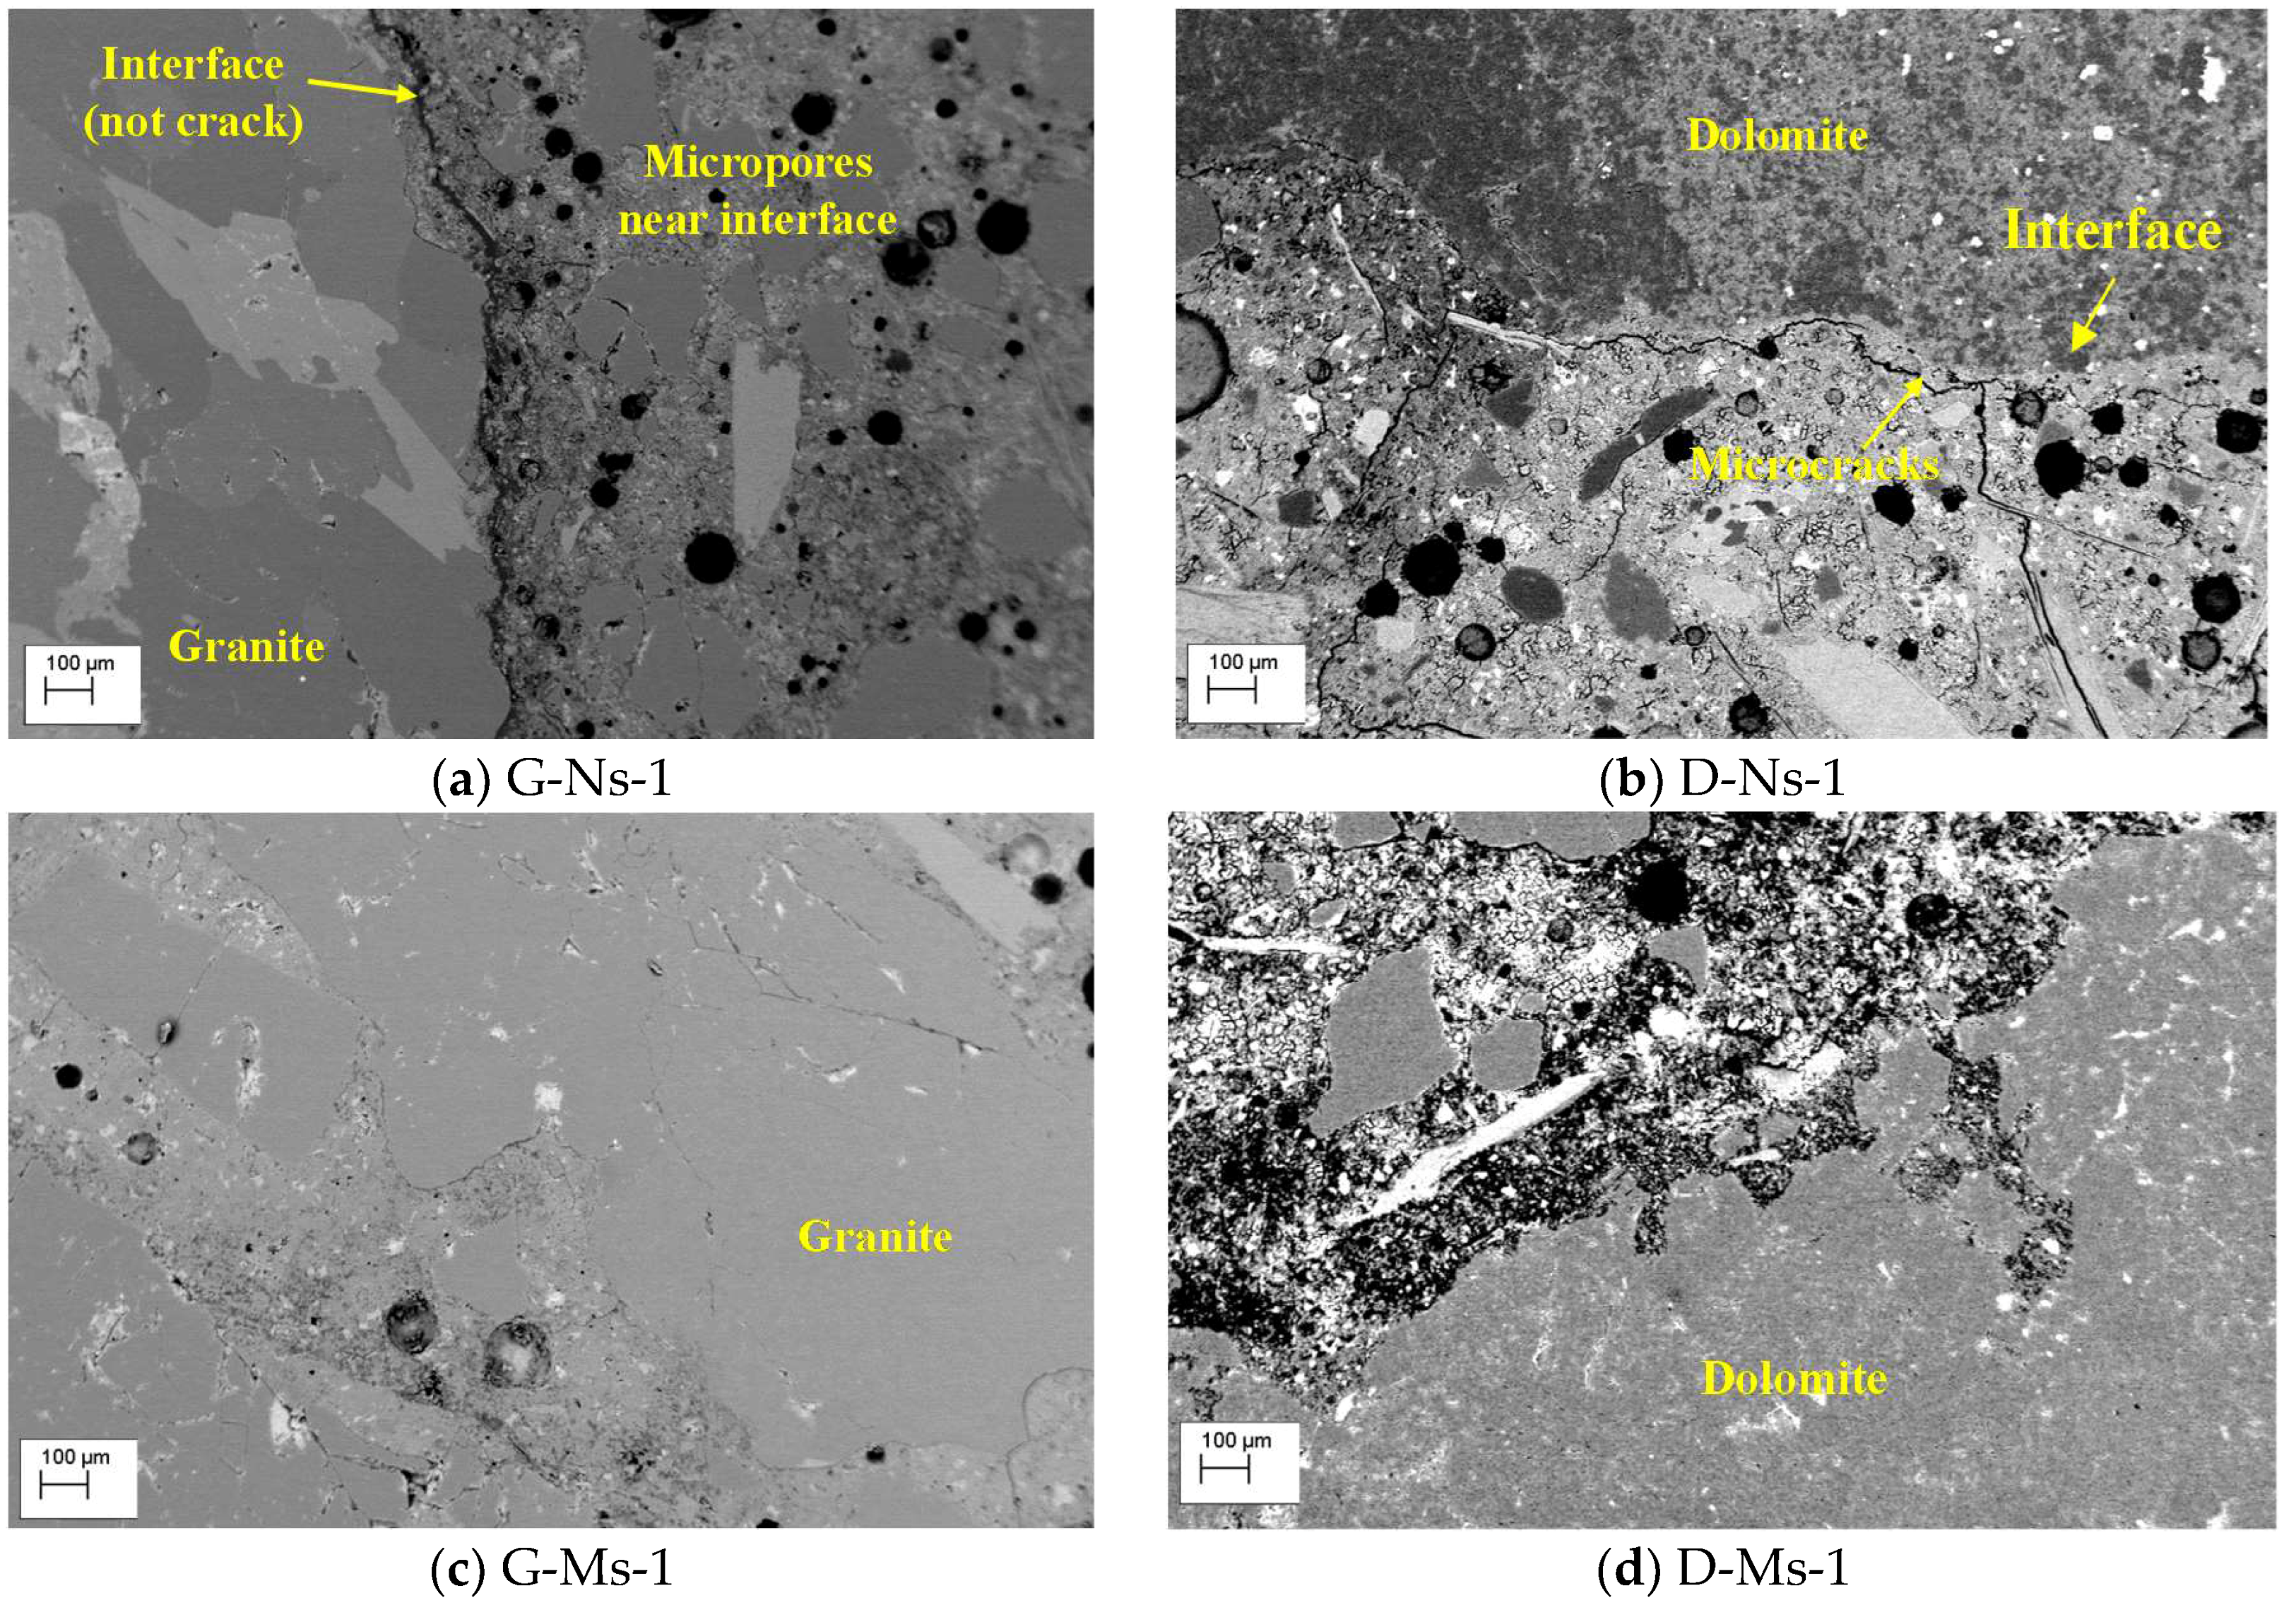
3.4.1. Micro-Pores and Micro-Cracks

Micro-pores and micro-cracks near the ITZ in concrete were assumed to reduce the compressive strength. The microstructure of cement paste and concrete was evaluated by backscatter-mode with the SEM. Entrained air voids are spherical, leading to easy recognition using backscatter SEM. The images show clear micro-pores and micro-cracks with the darkest color. Figure 10 shows the backscatter SEM images of each high-volume coarse aggregate concrete mixture. The specimens with natural sand show higher amounts of micro-pores and micro-cracks compared to their manufactured sand counterparts. Few micro-pores and no micro-cracks were found in the G-Ms-1 mixture, while D-Ms-1 shows unwanted entrapped air to some extent, but limited micro-cracks or micro-pores near the aggregate. Overall, darker areas represent higher porosity but do not necessarily mean structural deficiency. G-Ns-1 shows a significant amount of micro-pores surrounding the aggregate, which correlates to the lower compressive strength when compared to mixtures with the dolomite coarse aggregate. D-Ns-1 has a significant amount of both micro-cracks and micro-pores, which will likely cause a reduction in compressive strength when compared to its companion mixture with manufactured sand.
Micro-cracks could occur during the sample preparation process of cutting, fracturing, polishing the specimens, even during CTE test. Some of cracks from those processes, however, likely involve crack widths greater than 10 µm, and are confined to the sample edge [42]. Thus, the micro-cracks in Figure 10 are attributed to early-age thermal cracking, which occur when the restrained thermal contraction strain exceeds the tensile strain capacity of concrete. The concrete specimens with higher CTEs are expected to be more susceptible to thermal stress, and consequently, micro-cracks can occur more easily near the ITZ [43].

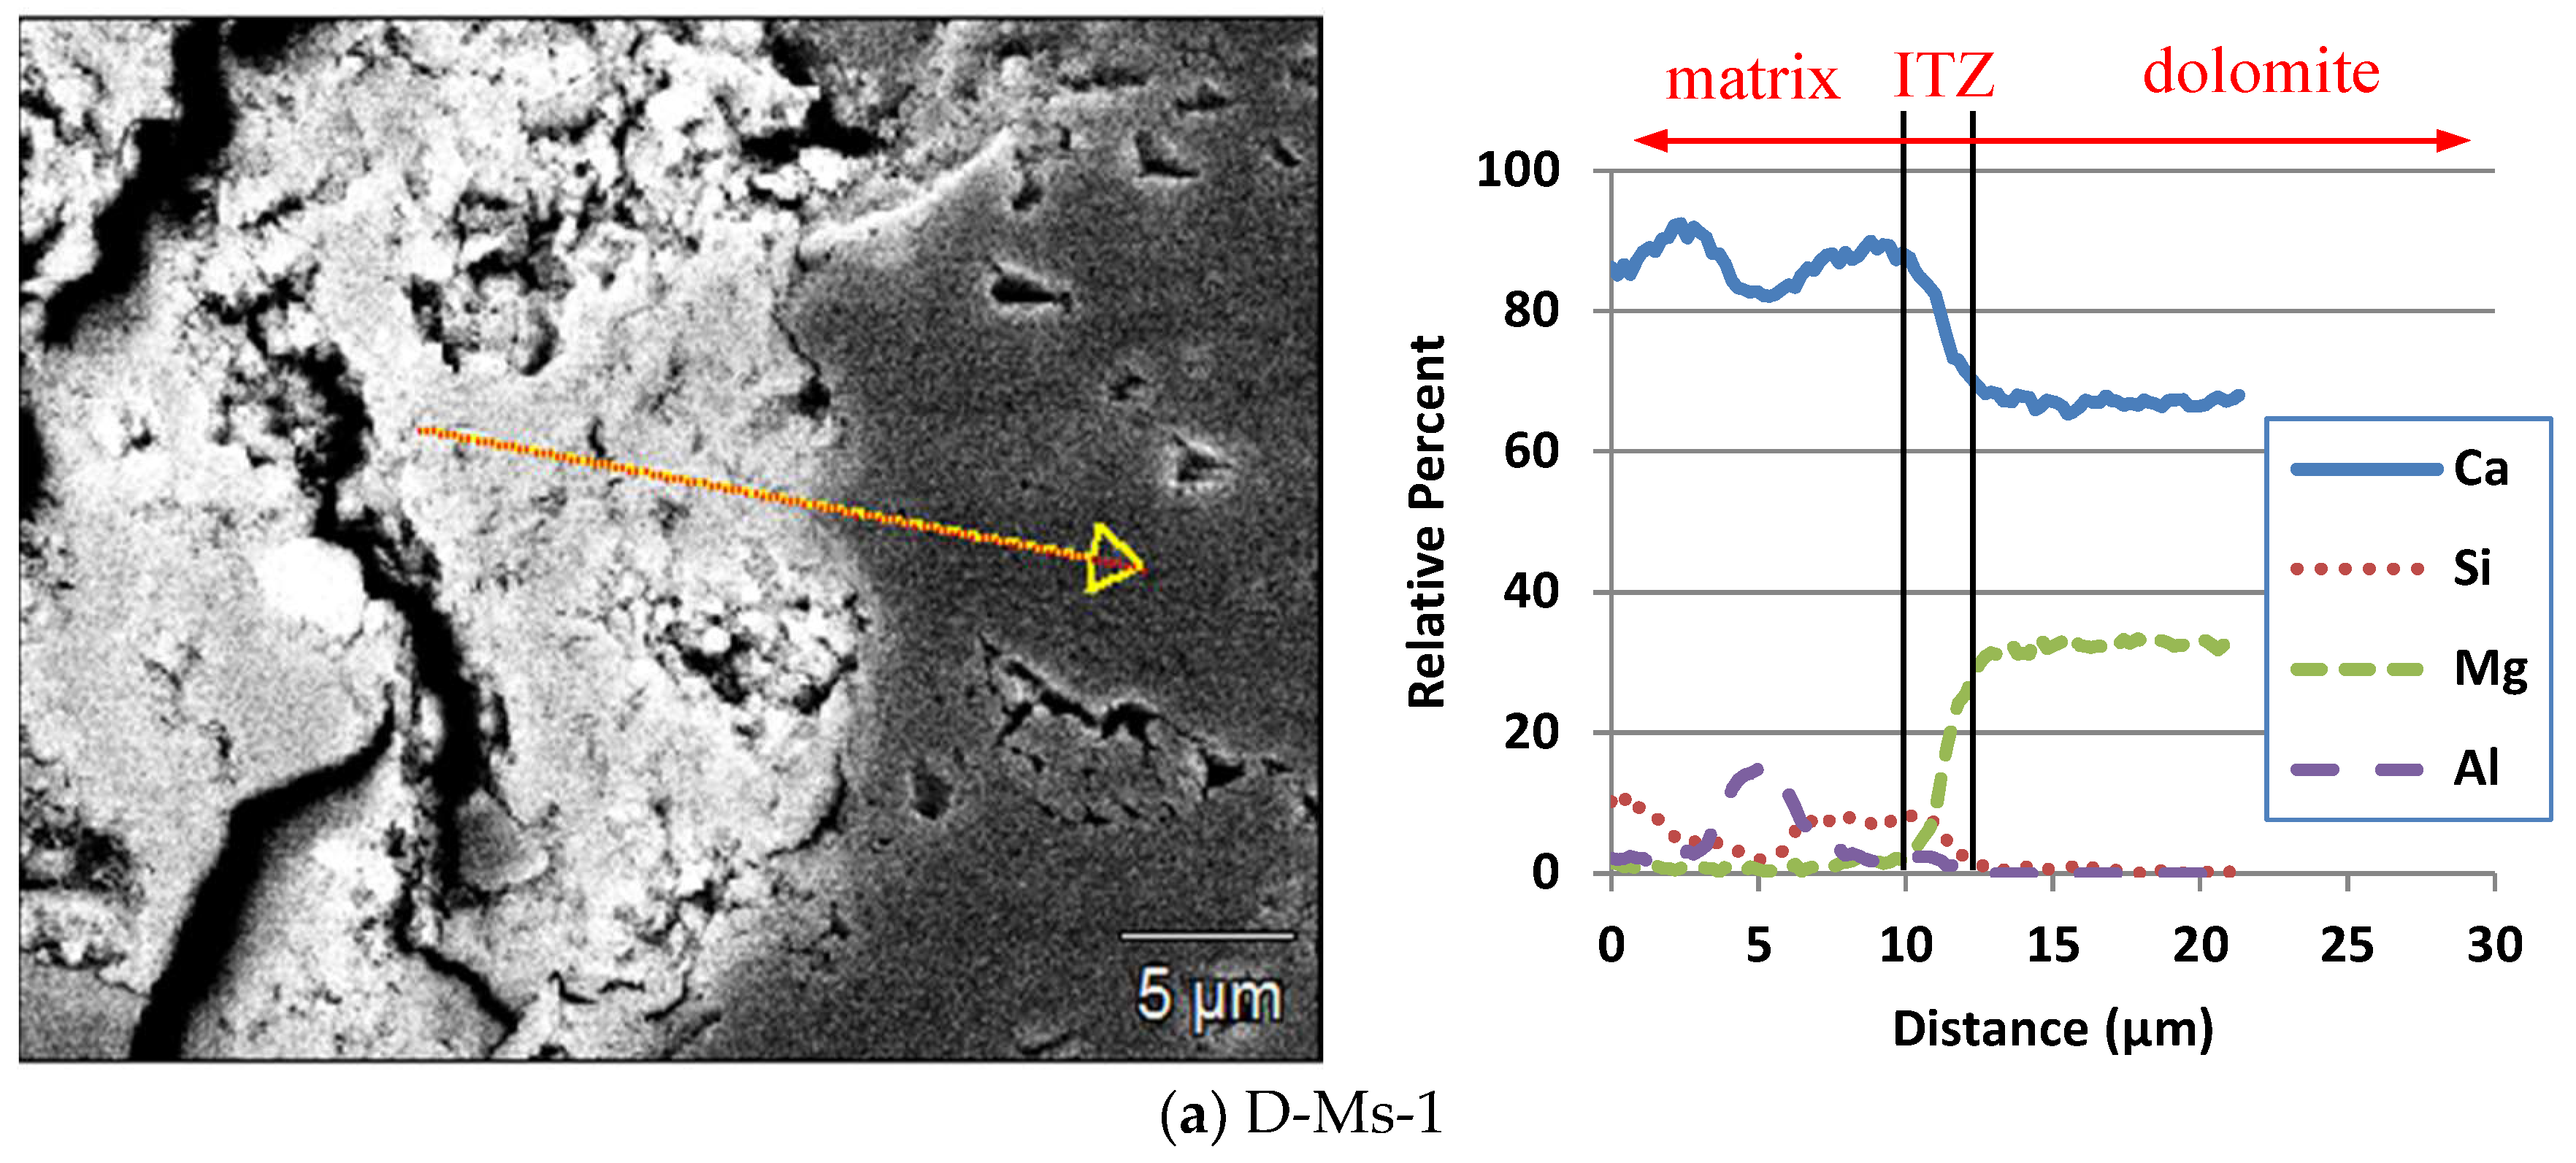
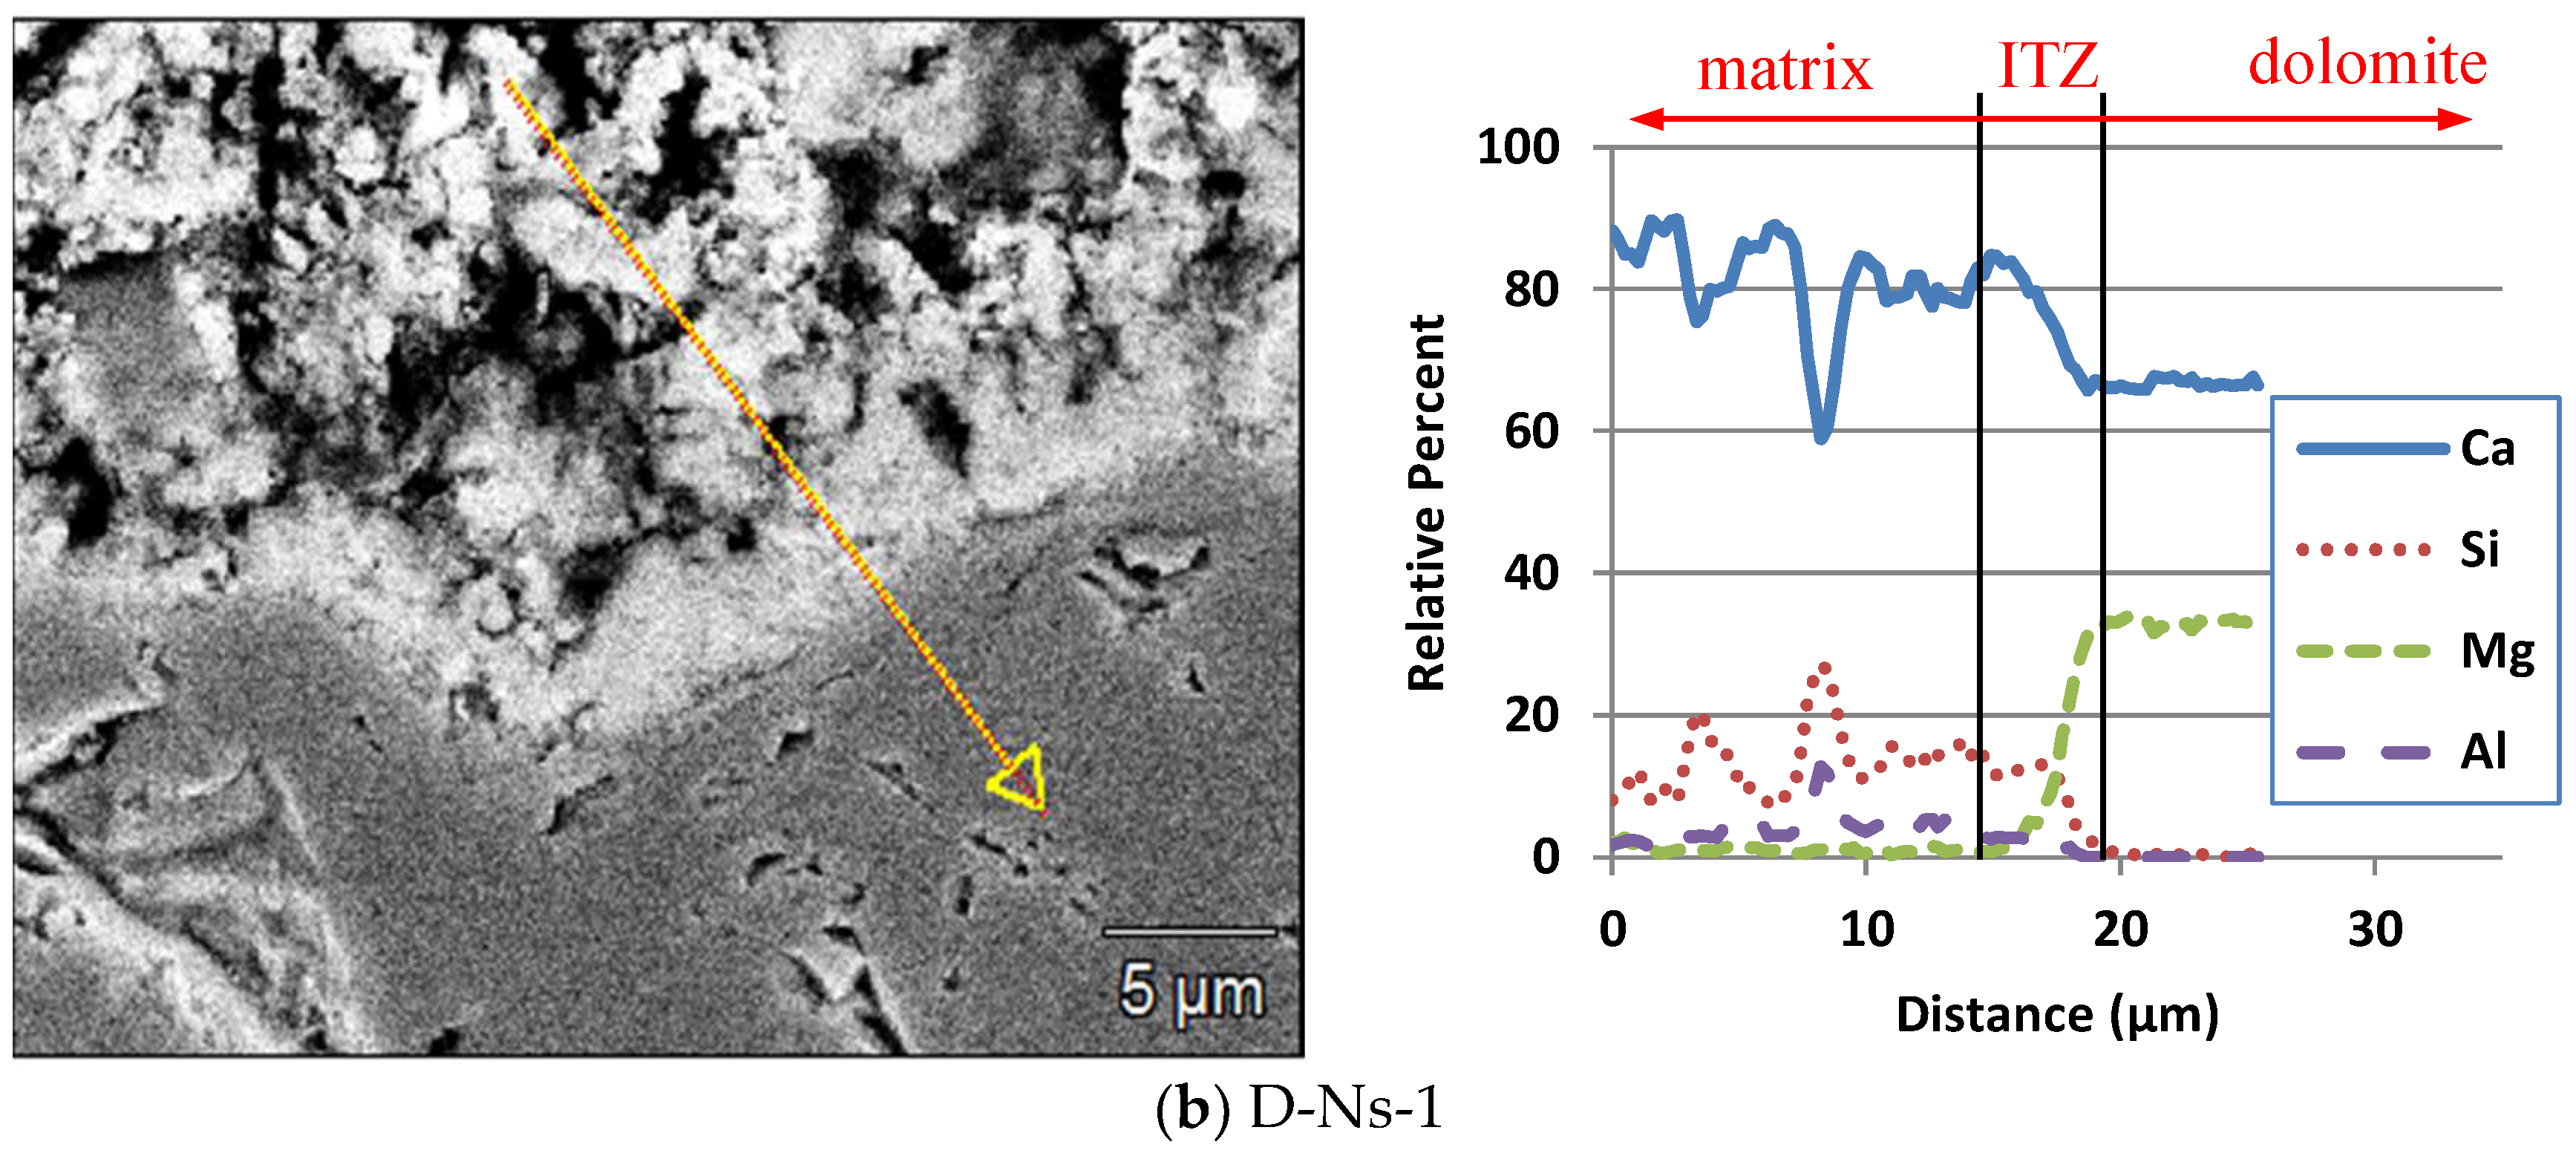
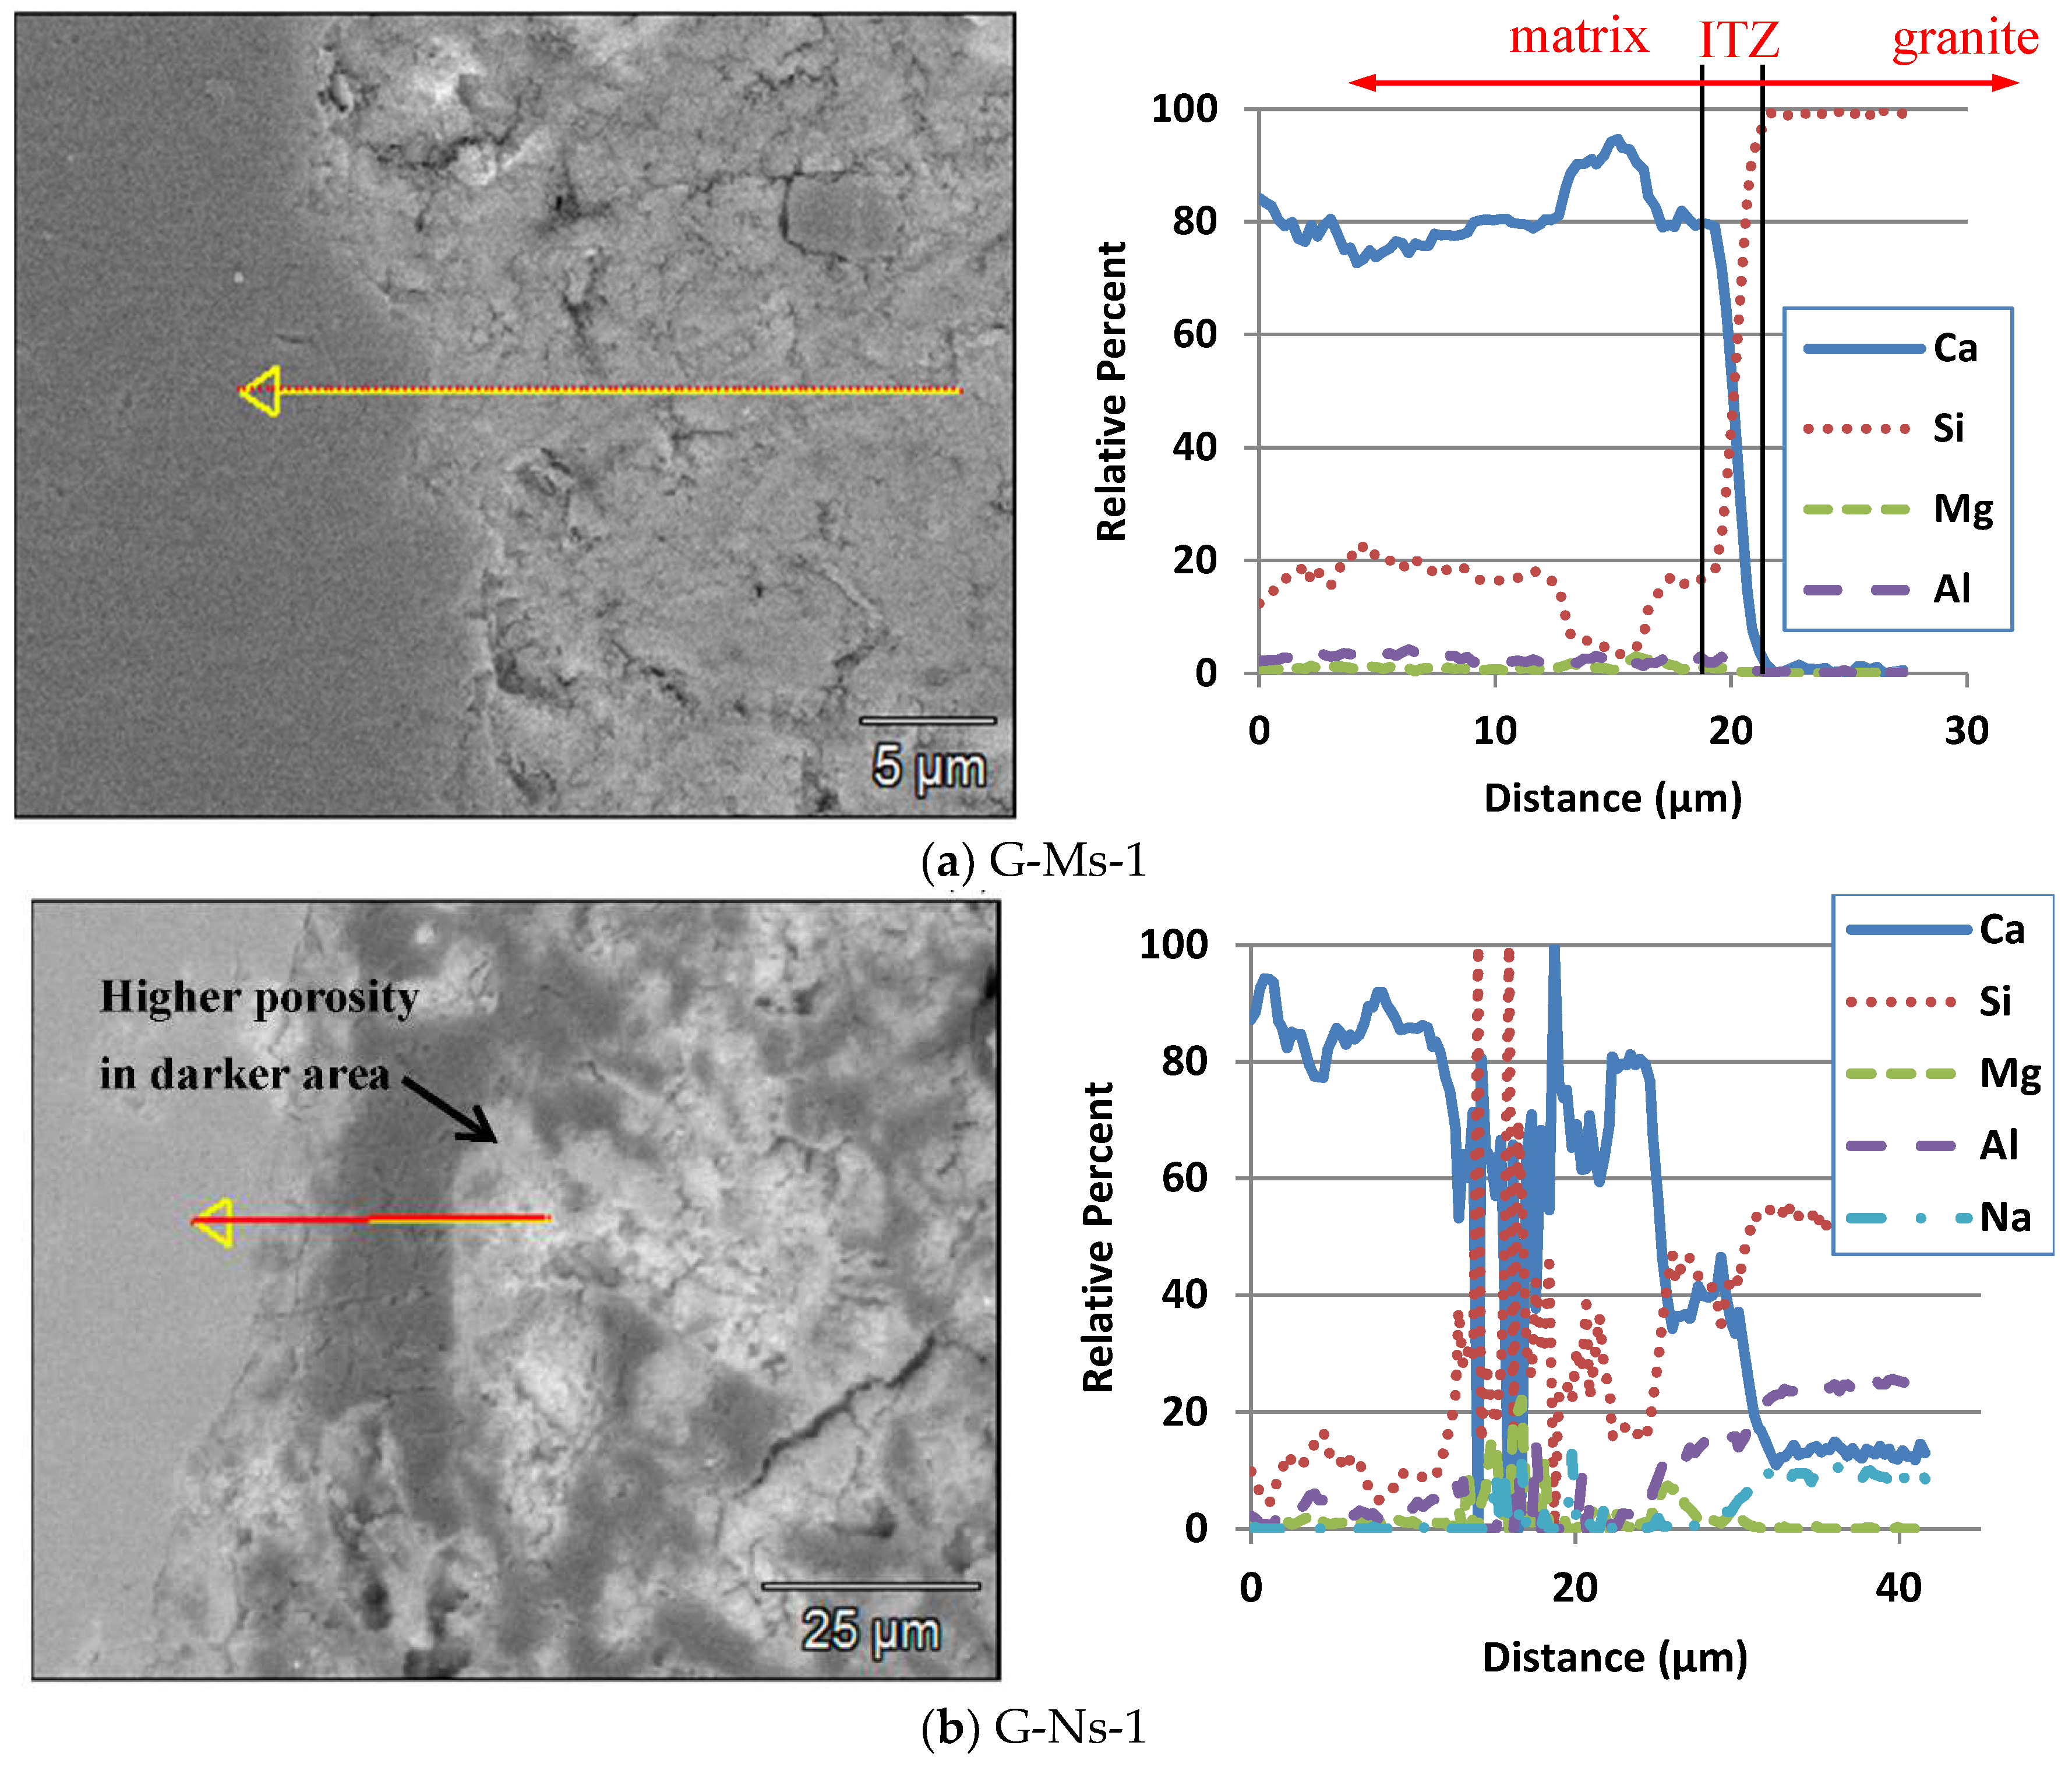
3.4.2. Characterization of Interfacial Transition Zone (ITZ)

The ITZ originates from the packing of small cement grains (with size ranging from 5 to 40 μm) against aggregate particles. This size difference results in the wall effect, where small grains are accumulated in the zone closest to the aggregate with higher porosity with larger grains located farther away [44,45]. Smaller cement grains are more prone to hydration, and fewer unhydrated cement grains are thus observed at the interface. The dimensions of the ITZ depend on the varying grain sizes of the cement matrix and the ITZ can involve various sizes with heterogeneity. Therefore, the ITZ is not commonly distinguishable through image analysis of the concrete microstructure and instead appears as a rapid change in chemical compositions most prominent in the region 10 to 20 μm around the aggregate.
SEM and EDX were conducted for microstructural and chemical analyses in the ITZ. For the characterization of ITZ, the line scanning technique in SEM/EDX was employed to estimate the width of the ITZ. The line scanning EDX results are shown in Figure 11 for D-Ms-1 and D-Ns-1 mixtures and Figure 12 for G-Ms-1 and G-Ns-1 mixtures. In the first 15 μm of the line scanning for the dolomite specimens (D-Ms-1 and D-Ns-1), high calcium (Ca) content and very low silicon (Si) content were detected, which may indicate a large amount of calcium hydroxide (Ca(OH)2) in the ITZ [46,47]. As the scanning distance increased, the chemical compositions varied drastically. The Ca and Si contents suddenly decreased while the magnesium (Mg) content sharply increased for both dolomite specimens. The calculated ratio of Ca:Si:Mg for both specimens was approximately 2:0:1, which is in good agreement with the chemical compositions of dolomite CaMg(CO3)2 detected by EDX and provided in Table 4. Larger variations in the chemical content were found in the ITZ due to its intrinsic non-homogeneous characteristic, but the detected chemical compositions were nearly constant when the dolomite was scanned. For the granite specimens, the G-Ms-1 specimen experienced the same trend observed in the dolomite specimens. However, G-Ns-1 had significant variation in chemical elements in the line scanning. Figure 12 shows darker areas involving higher porosity. Additionally, high and fluctuating concentrations of Si were detected approximately 20 μm into the line scanning for the G-Ns-1 specimen. This phenomenon coupled with the high porosity may explain the increased CTE and lower compressive strength when compared to other mixtures examined in this study (see Figure 6).
The width of the “core” ITZ, the distance over which chemical compositions are dramatically changed, was determined by the EDX line scanning technique (see Figure 11 and Figure 12). The ITZ is commonly considered to range from 20 to 50 µm, but the width of the core ITZ can be associated with the degree of cement hydration in the ITZ and can be used as an indicator to characterize the microstructure of the ITZ. A narrower width of the core ITZ may cause a higher compressive strength of the concrete specimen. D-Ns-1 displayed the widest core ITZ, while G-Ms-1 had the narrowest. G-Ns-1 exhibited significant fluctuations in signal due to the high porosity and the width of the core ITZ could thus not be determined. The results of line scanning show a similar trend to those of the compressive strength, and a wider core ITZ corresponded to a lower compressive strength.

4. Discussion of Findings

Different paste-aggregate interfacial microstructures are created when different types of fine and coarse aggregates with different chemical composition, surface texture, angularity, and pore structures are used in concrete. The performance of concrete specimens was investigated in association with the thermal expansion behavior and compressive strength. The effects of aggregate type are discussed based on the microstructure, especially near the ITZ.
Crushed sand is produced by crushing a large parent mass of rock. The shape depends on the nature and the degree of stratification of the rock deposit, the type of crushing equipment used, and the size reduction ratio. These properties have an important influence on the quality of fresh and hardened concrete [48,49]. As the volume of cement paste depends on the shape, texture, grading, and fineness modulus of the crushed sand. The use of crushed sand is generally limited in quantity due to the high cement paste volume needed to obtain adequate concrete workability [1,2,4]. As shown in Figure 7a,b, the manufactured sand has a more angular shape and rougher surface than the natural sand and produced higher compressive strength and smaller CTE values. The strengthened ITZ between the paste and fine aggregate is attributed to the rough texture and shape of the manufactured sand. Compared with dolomite specimens, the specimens with granite had a slightly lower compressive strength and higher CTE. Zone 1 shown in SEM image of Figure 8 was assessed by EDX (see Figure 9b), and the result sufficiently supports that the granite used in this study contain mica. Thus, the presence of mica in granite rocks is believed to involve weak cleavage planes that initiate failure in the coarse aggregate, which is similar to previous findings [23].
The CTE of concrete was simply correlated with the compressive strength. The concrete with lower CTE was expected to have higher compressive strength due to the lower thermal response, especially with low age, which would lead to fewer micro-cracks. This expected trend was observed with the fine aggregate, but the effect of the coarse aggregate type was not clear. The coarse granite and dolomite aggregates do not have distinct differences associated with surface morphology (surface texture, shape, surface pores, etc.). The mineralogy of the coarse aggregate in this study may rarely be a matter of concern unless the aggregate contains constituents such as opal, which is reactive silica mineral [21].
In the normal strength concrete, the weakest components are the interface between hardened cement paste and aggregate. Microstructure images have been commonly used as a tool to characterize the ITZ of concrete; however, the image alone does not provide quantitative information. Therefore, in this study, the line scanning technique in SEM/EDX was employed to estimate the width of the ITZ, which can be one of the indicators to characterize the ITZ. The hypothesis is that that wider ITZ causes lower compressive strength. Figure 11 shows that the ITZ width matches well with the results of the compressive strength test. D-Ms-1 exhibits the smallest widest ITZ with the highest compressive strength while G-Ns-1 shows the largest ITZ with the lowest compressive strength. However, the effect of the coarse aggregate type is still not clear in the assessment of the ITZ width. Another possibility is that the fine aggregate is a predominant factor in controlling the formation of the microstructure of cement paste when two aggregate types involve a similar level of surface morphology and reactivity toward cement hydration.

5. Conclusions

The effect of the mineralogy of aggregates was evaluated in regards to concrete performance characteristics such as the CTE, compressive strength, and microstructure, especially near the ITZ. The following conclusions are drawn from the analyses of the experimental investigation conducted in this study.
  • Based on the proposed technology which the line scanning analyses (SEM and EDX) of ITZ regions, it is feasible to establish a ITZ database for the different types of aggregate used in concrete with sensitive analyses. The ITZ database which can be established by this proposed technology may help engineers to identify potential problem of micro-cracking due to the different types of aggregate.
  • With the proposed technology, the ITZ and CTE database of a wide range of aggregates such as lightweight aggregate (porous limestone, expanded shale, clay and slate, etc.) and recycled concrete aggregate (RCA) can be established and characterized thus structural and field engineers can be aware of the probability of nano- and micro-cracks due to the aggregate types.
  • The type of fine aggregate and its volume were found to have a significant effect on CTE, which increased with the Si volume content in the fine aggregate. Natural sand had approximately twice the Si content of manufactured sand in petrographic analyses, and the CTE of natural sand concrete specimens was thus always higher than that of manufactured sand specimens. Thus, it is recommendable to determine the volume content of Si in aggregates before engineer decides a concrete mix proportion.
  • The concrete specimens with dolomite coarse aggregate had a higher CTE than specimens with granite, but the influence of the coarse aggregate type on the concrete CTE appears to be relatively small.
  • For the concrete specimens with higher CTE, the micro-crack density in the ITZ tended to be higher. This is attributed to the early-age thermal cracking. Specimens with higher CTE are expected to be more susceptible to thermal stress.
  • Higher CTE appears to result in lower compressive strength, suggesting that specimens with natural sand would have higher CTE values but lower compressive strength than manufactured sand specimens.
  • From SEM images, the manufactured sand has a more angular shape and rougher surface than the natural sand. This angular shape provides better interlocking and the rough surface texture develops a greater mechanical bond with the cement paste so that higher compressive strength can be achieved.

6. Further Research

This study was limited to only two types of fine and coarse aggregate and specimens with a large portion of coarse aggregate. Thus, for better assessment of the correlation between CTE and compressive strength, separate components of the concrete, cement matrix, aggregates, and ITZ should be studied.

Acknowledgments

Authors thank the technical support of Kazi M. Tasneem and the the helpful suggestions of Jingyoung Kim and Youngjoo Park.

Author Contributions

Boo Hyun Nam and S. Sonny Kim designed and conceived the whole procedure of this study. Stephan A. Durham contributed to the introduction and discussion sections. Jinwoo An performed and analyzed the mechanical and petrographic tests.

Conflicts of Interest

The authors declare no conflict of interest.

References

  1. ARA, Inc. Guide for Mechanistic-Empirical Design of New and Rehabilitated Pavement Structures; National Cooperative Highway Research Program, Transportation Research Board, National Research Council: Washington, DC, USA, 2004. [Google Scholar]
  2. Cusson, D.; Hoogeveen, T. Measuring Early-Age Coefficient of Thermal Expansion in High-Performance Concrete. In Proceedings of the International RILEM Conference on Volume Changes of Hardening Concrete: Testing and Mitigation, Lyngby, Denmark, 20–23 August 2006; pp. 321–330. [Google Scholar]
  3. Jeong, J.H.; Zollinger, D.G. Finite-Element Modeling and Calibration of Temperature Prediction of Hydrating Portland Cement Concrete Pavements. J. Mater. Civ. Eng. 2006, 18, 317–324. [Google Scholar] [CrossRef]
  4. Kada, H.; Lachemi, M.; Petrov, N.; Bonneau, O.; Aïtcin, P.C. Determination of the Coefficient of Thermal Expansion of High Performance Concrete from Initial Setting. Mater. Struct. 2002, 35, 35–41. [Google Scholar] [CrossRef]
  5. Jeong, J.H.; Lee, J.H.; Suh, Y.C.; Zollinger, D.G. Effect of Slab Curling on Movement and Load Transfer Capacity of Saw-Cut Joints. Transp. Res. Rec. 2006, 1947, 69–78. [Google Scholar] [CrossRef]
  6. Mallela, J.; Abbas, A.; Harman, T.; Rao, C.; Liu, R.; Darter, M.I. Measurement and Significance of the Coefficient of Thermal Expansion of Concrete in Rigid Pavement Design. Transp. Res. Rec. 2005, 1919, 38–46. [Google Scholar] [CrossRef]
  7. Mindess, S.; Young, F.; Darwin, D. Concrete; Prentice Hall, Inc.: Upper Saddle River, NJ, USA, 2003. [Google Scholar]
  8. American Association of State Highway and Transportation Officials (AASHTO). Standard Method of Test for Coefficient of Thermal Expansion of Hydraulic Cement Concrete. In Standard Specifications for Transportation Materials and Methods of Sampling and Testing; AASHTO TP 60-00; American Association of State Highway and Transportation Officials: Washington, DC, USA, 2005. [Google Scholar]
  9. American Association of State Highway and Transportation Officials (AASHTO). Mechanistic-Empirical Pavement Design Guide: A Manual of Practice; American Association of State Highway and Transportation Officials: Washington, DC, USA, 2008. [Google Scholar]
  10. Federal Highway Administration (FHWA). Coefficient of Thermal Expansion in Concrete Pavement Design, TechBrief; Federal Highway Administration: Washington, DC, USA, 2011.
  11. Grattan-Bellew, P.E.; Beaudoin, J.J.; Vallée, V.G. Effect of Aggregate Particle Size and Composition on Expansion of Mortar Bars Due to Delayed Ettringite Formation. Cem. Concr. Res. 1998, 28, 1147–1156. [Google Scholar] [CrossRef]
  12. Hobbs, D.W. The Dependence of the Bulk Modulus, Young’s Modulus, Creep, Shrinkage and Thermal Expansion of Concrete upon Aggregate Volume Concentration. Mater. Struct. 1971, 4, 107–114. [Google Scholar] [CrossRef]
  13. Won, M. Improvements of Testing Procedures for Concrete Coefficient of Thermal Expansion. Transp. Res. Rec. 2005, 1919, 23–28. [Google Scholar] [CrossRef]
  14. Jeong, J.H.; Zollinger, D.G. Age and Moisture Effects on Thermal Expansion of Concrete Pavement Slabs. J. Mater. Civ. Eng. 2012, 24, 8–15. [Google Scholar] [CrossRef]
  15. Sellevold, E.J.; Bjøntegaard, Ø. Coefficient of Thermal Expansion of Cement Paste and Concrete: Mechanisms of Moisture Interaction. Mater. Struct. 2006, 39, 809–815. [Google Scholar] [CrossRef]
  16. Yeon, J.; Choi, S.; Won, M. Effect of Relative Humidity on Coefficient of Thermal Expansion of Hardened Cement Paste and Concrete. Transp. Res. Rec. 2009, 2113, 83–91. [Google Scholar] [CrossRef]
  17. Tanesi, J.; Kutay, M.; Abbas, A.; Meininger, R. Effect of Coefficient of Thermal Expansion Test Variability on Concrete Pavement Performance as Predicted by Mechanistic-Empirical Pavement Design Guide. Transp. Res. Rec. 2007, 2020, 40–44. [Google Scholar] [CrossRef]
  18. Alungbe, G.D.; Tia, M.; Bloomquist, D.G. Effects of Aggregate, Water/Cement Ratio, and Curing on the Coefficient of Linear Thermal Expansion of Concrete. Transp. Res. Rec. 1992, 1335, 41–51. [Google Scholar]
  19. Al-Oraimi, S.K.; Taha, R.; Hassan, H.F. The Effect of the Mineralogy of Coarse Aggregate on the Mechanical Properties of High-Strength Concrete. Constr. Build. Mater. 2006, 20, 499–503. [Google Scholar] [CrossRef]
  20. Mehta, P.K.; Monterio, P.J.M. Concrete: Structure, Properties, and Materials; Prentice Hall, Inc.: Englewood Cliffs, NJ, USA, 1993. [Google Scholar]
  21. Aitcin, P.C.; Mehta, P.K. Effect of Coarse Aggregate Characteristics on Mechanical Properties of High Strength Concrete. ACI Mater. J. 1990, 87, 103–107. [Google Scholar]
  22. Strategic Highway Research Program (SHRP). High Performance Concrete: A State-of-The-Art Report; SHRP-C/FR-91-103; Strategic Highway Research Program, National Research Council: Washington, DC, USA, 1991. [Google Scholar]
  23. Aitcin, P.C.; Mindess, S. High-performance concrete: Science and applications. In Materials Science of Concrete V; Skalny, J., Mindess, S., Eds.; American Ceramic Society: Westerville, OH, USA, 1998; pp. 477–511. [Google Scholar]
  24. ACI Committee 363. State-of-The-Art Report on High Strength Concrete; American Concrete Institute: Farmington Hill, MI, USA, 1984. [Google Scholar]
  25. Goble, C.; Cohen, M. Influence of Aggregate Surface Area on Mechanical Properties of Mortar. ACI Mater. J. 1999, 96, 657–662. [Google Scholar]
  26. Bonavetti, V.; Irassar, E.F. The Effect of Stone Dust Content in Sand. Cem. Concr. Res. 1994, 24, 580–590. [Google Scholar] [CrossRef]
  27. Celik, T.; Marar, K. Effects of Crushed Stone Dust on Some Properties of Concrete. Cem. Concr. Res. 1996, 26, 1121–1130. [Google Scholar] [CrossRef]
  28. ASTM International. Standard Specification for Concrete Aggregates. In Annual Book of ASTM Standards; ASTM C33/C33M-13; American Society for Testing and Materials: West Conshohocken, PA, USA, 2013. [Google Scholar]
  29. Kim, S.H.; Yang, J.; Nam, B.H.; Jeong, J.H. Effect of Materials and Age on the Coefficient of Thermal Expansion of Concrete Paving Mixtures. Road Mater. Pavement Des. 2015, 16, 445–458. [Google Scholar] [CrossRef]
  30. ASTM International. Standard Test Method for Resistance to Degradation of Large-Size Coarse Aggregate by Abrasion and Impact in the Los Angeles Machine. In Annual Book of ASTM Standards; ASTM C535-12; American Society for Testing and Materials: West Conshohocken, PA, USA, 2012. [Google Scholar]
  31. ASTM International. Standard Test Method for Relative Density (Specific Gravity) and Absorption of Coarse Aggregate. In Annual Book of ASTM Standards; ASTM C127-15; American Society for Testing and Materials: West Conshohocken, PA, USA, 2015. [Google Scholar]
  32. American Association of State Highway and Transportation Officials (AASHTO). Coefficient of Thermal Expansion of Hydraulic Cement Concrete. In Standard Specifications for Transportation Materials and Methods of Sampling and Testing; AASHTO T 336; American Association of State Highway and Transportation Officials: Washington, DC, USA, 2011. [Google Scholar]
  33. ASTM International. Standard Test Method for Compressive Strength of Cylindrical Concrete Specimens. In Annual Book of ASTM Standards; ASTM C39/C39M-15; American Society for Testing and Materials: West Conshohocken, PA, USA, 2015. [Google Scholar]
  34. ASTM International. Standard Practice for Petrographic Examination of Hardened Concrete. In Annual Book of ASTM Standards; ASTM C856-17; American Society for Testing and Materials: West Conshohocken, PA, USA, 2017. [Google Scholar]
  35. Little, D.; Button, J.; Jayawickrama, P.; Solaimanian, M.; Hudson, B. Quantify Shape, Angularity and Surface Texture of Aggregates Using Image Analysis and Study Their Effect on Performance; FHWA/TX-06/0-1707-4; Texas Transportation Institute, The Texas A&M University System: College Station, TX, USA, 2003. [Google Scholar]
  36. Walther, J. Essentials of Geochemistry; Jones & Bartlett Learning: Sudbury, MA, USA, 2009. [Google Scholar]
  37. Blatt, H.; Middleton, G.V.; Murray, R.C. Origin of Sedimentary Rocks; Prentice Hall, Inc.: Englewood Cliffs, NJ, USA, 1972. [Google Scholar]
  38. Nam, B.H.; Yeon, J.H.; Behring, Z. Effect of Daily Temperature Variations on the Continuous Deflection Profiles of Airfield Jointed Concrete Pavements. Constr. Build. Mater. 2014, 73, 261–270. [Google Scholar] [CrossRef]
  39. Tasneem, K.M.; Nam, B.H.; Kim, J.Y.; Kim, S.H.; Park, Y.J. Effects of Aggregate on the Thermal Expansion Behavior of Concrete. In Proceedings of the Second Transportation & Development Congress, Orlando, FL, USA, 8–11 June 2014. [Google Scholar]
  40. Nam, B.H.; Stokoe, K.H.; Lee, J.S.; Scullion, T.; Leidy, J.; Oshinski, E. Characterization of Jointed Concrete Pavement Under Daily and Seasonal Temperature Variations Using RDD and FWD Measurements. In Proceedings of the Transportation Research Board 90th Annual Meeting, Washington, DC, USA, 24 January 2011. [Google Scholar]
  41. Tyrrell, G.W. The Principles of Petrology; John Wiley & Sons, Inc.: New York, NY, USA, 1973. [Google Scholar]
  42. Ehlers, G.E.; Blatt, H. Petrology, Igneous Sedimentary and Metamorphic; CBS Publishers and Distribution: Delhi, India, 1997. [Google Scholar]
  43. Parker, R.L.; Fleischer, L. Geochemistry of Niobium and Tantalum; Geological Survey Professional Paper 612; US Department of the Interior: Washington, DC, USA, 1968.
  44. Bisschop, J.; Van Mier, J.G.M. How to Study Drying Shrinkage Microcracking in Cement-Based Materials Using Optical and Scanning Electron Microscopy? Cem. Concr. Res. 2002, 32, 279–287. [Google Scholar] [CrossRef]
  45. Shah, S.P.; Swartz, S.E.; Ouyang, C. Fracture Mechanics of Concrete: Applications of Fracture Mechanics to Concrete, Rock and Other Quasi-Brittle Materials; John Wiley & Sons, Inc.: New York, NY, USA, 1995. [Google Scholar]
  46. Neville, A.M. Properties of Concrete; Pitman Pub.: London, UK, 1981. [Google Scholar]
  47. Scrivener, K.L.; Crumbie, A.K.; Laugesen, P. The Interfacial Transition Zone (ITZ) between Cement Paste and Aggregate in Concrete. Interface Sci. 2004, 12, 411–421. [Google Scholar] [CrossRef]
  48. Neville, A.M.; Brooks, J.J. Concrete Technology; Longman Scientific & Technical: London, UK, 1993. [Google Scholar]
  49. Triantafyllou, G.G.; Rousakis, T.C.; Karabinis, A.I. Analytical assessment of the bearing capacity of RC beams with corroded steel bars beyond concrete cover cracking. Compos. Part B Eng. 2017, 119, 132–140. [Google Scholar] [CrossRef]
Figure 1. Gradation curves and ASTM C33 grading requirements for fine aggregates.
Applsci 07 01307 g001
Figure 2. Gradation curves for coarse aggregates and ASTM C33 grading requirements for number 57 aggregate.
Applsci 07 01307 g002
Figure 3. Test setup for the determination of the coefficient of thermal expansion (CTE) of the cylindrical concrete specimens.
Applsci 07 01307 g003
Figure 4. Effect of low volume of coarse aggregate and high volume of fine aggregate on concrete CTE.
Applsci 07 01307 g004
Figure 5. Effect of high volume of coarse aggregate and low volume of fine aggregate on concrete CTE.
Applsci 07 01307 g005
Figure 6. The results of the compressive strength and the modulus of the elasticity.
Applsci 07 01307 g006
Figure 7. SEM images of fine aggregates (note: 1 KX = 1000 X).
Applsci 07 01307 g007
Figure 8. SEM images of dolomite and granite with magnification (note: 1 KX = 1000 X).
Applsci 07 01307 g008aApplsci 07 01307 g008b
Figure 9. Mineral assemblage of igneous rock and chemical compositional analysis results.
Applsci 07 01307 g009
Figure 10. Backscatter SEM images showing microstructure (micro-pores and micro-cracks).
Applsci 07 01307 g010
Figure 11. Line scanning analyses (SEM and energy dispersive X-ray (EDX)) of ITZ regions for dolomite concrete mixtures.
Applsci 07 01307 g011aApplsci 07 01307 g011b
Figure 12. Line scanning analyses (SEM and EDX) of interfacial transition zone (ITZ) regions for granite concrete mixtures.
Applsci 07 01307 g012
Table 1. Basic physical properties of coarse aggregates and standard test methods.
PropertiesTest ValuesTest Methods
DolomiteGranite
Specific gravity(SSD)2.822.69ASTM C127
(Apparent)2.862.72ASTM C127
Absorption capacity, %0.60.6ASTM C127
L.A. abrasion mass loss, %2133ASTM C535
Table 2. Mixture design matrix.
Mixture IDw/cWater (kg/m3)Cement (kg/m3)Fly Ash (kg/m3)Coarse AggregateFine Aggregate
Dolomite (kg/m3)Granite (kg/m3)Manufactured Sand (kg/m3)Natural Sand (kg/m3)
D-Ms-10.5184273951245-595-
D-Ms-20.518427395682-1127-
D-Ns-10.5184273951245--517
D-Ns-20.518427395682--979
G-Ms-10.518427395-1245595-
G-Ms-20.518427395-6821127-
G-Ns-10.518427395-1245-517
G-Ns-20.518427395-682-979
Note: the total volume of manufactured and natural sand is different due to the specific gravity.
Table 3. Measured and average CTE values.
Mixture IDCTE (με/°C)Mixture IDCTE (με/°C)
HeatingCoolingAverageHeatingCoolingAverage
D-Ms-18.38.58.5
(0.07 *)
G-Ms-17.77.97.9
(0.19 *)
8.68.87.98.3
8.58.67.77.9
8.38.67.98.3
8.38.57.98.1
D-Ms-28.18.58.3
(0.05 *)
G-Ms-28.18.38.3
(0.18 *)
8.38.68.18.5
8.18.58.18.5
8.38.68.18.5
7.98.38.38.5
D-Ns-18.89.29.0
(0.15 *)
G-Ns-18.89.08.8
(0.10 *)
9.09.48.89.0
8.89.28.89.0
8.89.48.69.0
8.89.08.68.8
D-Ns-29.59.99.7
(0.18 *)
G-Ns-29.79.99.7
(0.13 *)
9.79.99.79.9
9.59.99.79.7
9.59.79.79.9
9.59.99.59.7
The temperature range for CTE measurement is from 10 °C to 50 °C. * Standard deviation.
Table 4. Chemical compositions of aggregates (% by weight).
ElementCoarse AggregateFine Aggregate
DolomiteGraniteManufactured SandNatural Sand
C15.274.65.338.35
O47.2827.9125.3226.97
Na-2.652.15-
Mg12.181.531.110.38
Al0.074.717.0914.54
Si0.1218.5911.4920.6
K-0.791.148.71
Ca25.082.822.990.35
Ti-0.360.290.76
V-0.380.09-
Cr-0.2--
Mn-0.21-1.14
Fe-12.71513.76
Co.-3.433.52-
Ni-3.95.492.84
Cu-1.911.310.29
Zn-0.862.891.29
Nb-3.624.58-
Ta- 8.8210.23-

