Numerical Study on the Seismic Performance of a Steel–Concrete Hybrid Supporting Structure in Thermal Power Plants

1
School of Civil Engineering, Chang’an University, Xi’an 710061, China
2
School of Civil Engineering, Xi’an University of Science and Technology, Xi’an 710054, China
3
School of Civil Engineering, Xi’an University of Architecture and Technology, Xi’an 710055, China
*
Author to whom correspondence should be addressed.
Appl. Sci. 2018, 8(2), 294; https://0-doi-org.brum.beds.ac.uk/10.3390/app8020294
Submission received: 23 January 2018
/
Revised: 10 February 2018
/
Accepted: 13 February 2018
/
Published: 16 February 2018
(This article belongs to the Section Mechanical Engineering)
Abstract
:This paper presents the numerical investigation on the seismic performance of a steel–concrete hybrid structure consisting of reinforced concrete (RC) tubular columns and steel braced truss with A-shaped steel frames, which is a novel supporting structural system to house air-cooled condensers (ACC) in large-capacity thermal power plants (TPPs). First, the finite element (FE) modeling approach for this hybrid structure using the software ABAQUS was validated by a range of pseudo-dynamic tests (PDTs) performed on a 1/8-scaled sub-structure. The failure process, lateral displacement responses, changing rules of dynamic characteristic parameters and lateral stiffness with increase of peak ground acceleration (PGA) were presented here. Then, nonlinear time-history analysis of the prototype structure was carried out. The dynamic characteristics, base shear force, lateral deformation capacity, stiffness deterioration and damage characteristics were investigated. Despite the structural complexity and irregularity, both experimental and numerical results indicate that the overall seismic performance of this steel–concrete hybrid supporting structure meets the seismic design requirements with respect to the high-intensity earthquakes.
1. Introduction
In the past two decades, many studies on steel–concrete hybrid structures have been carried out [1,2,3]. Compared to either traditional steel or reinforced concrete (RC) structures, steel–concrete hybrid structures are more efficient and economical since they can effectively combine the advantages of structural steel and RC components. In practice, a huge number of high-rise buildings applied the steel–concrete hybrid structural system [4,5,6,7]. Moreover, for industrial buildings, due to the limits of industrial requirements and special loads characteristics, the steel–concrete hybrid structural system has the unique priority to realize more flexible structural layouts [8,9]. With the development of society and economy, more and more novel steel–concrete hybrid structural systems have been developed.
RC tubular column-steel braced truss structure is a novel steel–concrete hybrid supporting structural system to house air-cooled condensers (ACC) in large-capacity thermal power plants (TPPs). As a water-saving cooling process in TPPs, ACC technique is widely applied in the coal-rich but water-shortage regions [10,11]. Compared with the traditional supporting structure that consists of a series of A-shaped steel frames resting on a steel truss platform supported by an array of RC tubular columns, the novel supporting structure utilized steel diagonal braces to connect the steel truss and columns so as to further upgrade the structural safety performance. Figure 1 shows the photos of a practical supporting structure with steel diagonal braces. As a type of special and complex industrial structure, its main characteristics could be summarized as follows:
- (1)
- Long-span and heavy-load structure. The height is about 60~70 m and the span is about 100~120 m. The vertical load is above 10,000 tons due to the large industrial units.
- (2)
- Steel–concrete vertical hybrid structure consisting of different substructures made of different materials. The lower parts are a series of RC tubular columns. The middle part is a steel braced truss, where steel diagonal braces are set between the lower chords of truss and the corbels of columns. The upper parts are a series of A-shaped steel frames, above 10 m-height.
- (3)
- Rigid-upper-flexible-bottom structure. Due to the characteristics of structural components and industrial requirements, the stiffness and mass are mainly distributed in the upper structure, resulting in the uneven distribution of stiffness and mass along the vertical direction.
Taking these complexities and irregularities into account, in order to apply ACC technology in large-capacity TPPs located in strong earthquake prone regions, it is necessary to conduct a thorough study on the seismic performance of this hybrid structure. As we know, the pseudo-dynamic test (PDT) method is an effective way to investigate the seismic resistant capacity of building structures subjected to earthquake waves, and it involves online computers that are net worked with each other to control the input forces [12,13]. With the PDT techniques, we can not only simulate the responses of large-scale structures subjected to earthquake, but also observe closely the seismic-resistant capacity of structures using slow loading procedures [14,15]. In view of this, a series of pseudo-dynamic tests were performed on a 1/8 scaled sub-structure, and the general experimental results have been introduced [16]. However, due to the peculiarities of the structural system and limitations of the scaled model sub-structural test method, the seismic performance of this hybrid structure hasn’t been clarified yet.
It is known that the numerical simulation is another effective approach to investigate the seismic performance of structures, and significant progress has been made in the development of nonlinear analysis programs for evaluating the seismic performance of steel–concrete hybrid structures [17,18,19,20,21]. Accordingly, on the basis of experimental results, the numerical investigation on the seismic performance of this hybrid structure was conducted in this study. At first, a finite element (FE) simulation of the test specimen was conducted by using the software ABAQUS so as to validate the numerical modeling approaches. In addition, some experimental results not reported before were presented here together with the FE simulation results. Then, the numerical model for the prototype structure was developed to further investigate the seismic behavior through nonlinear time-history analysis.
2. Structure Description
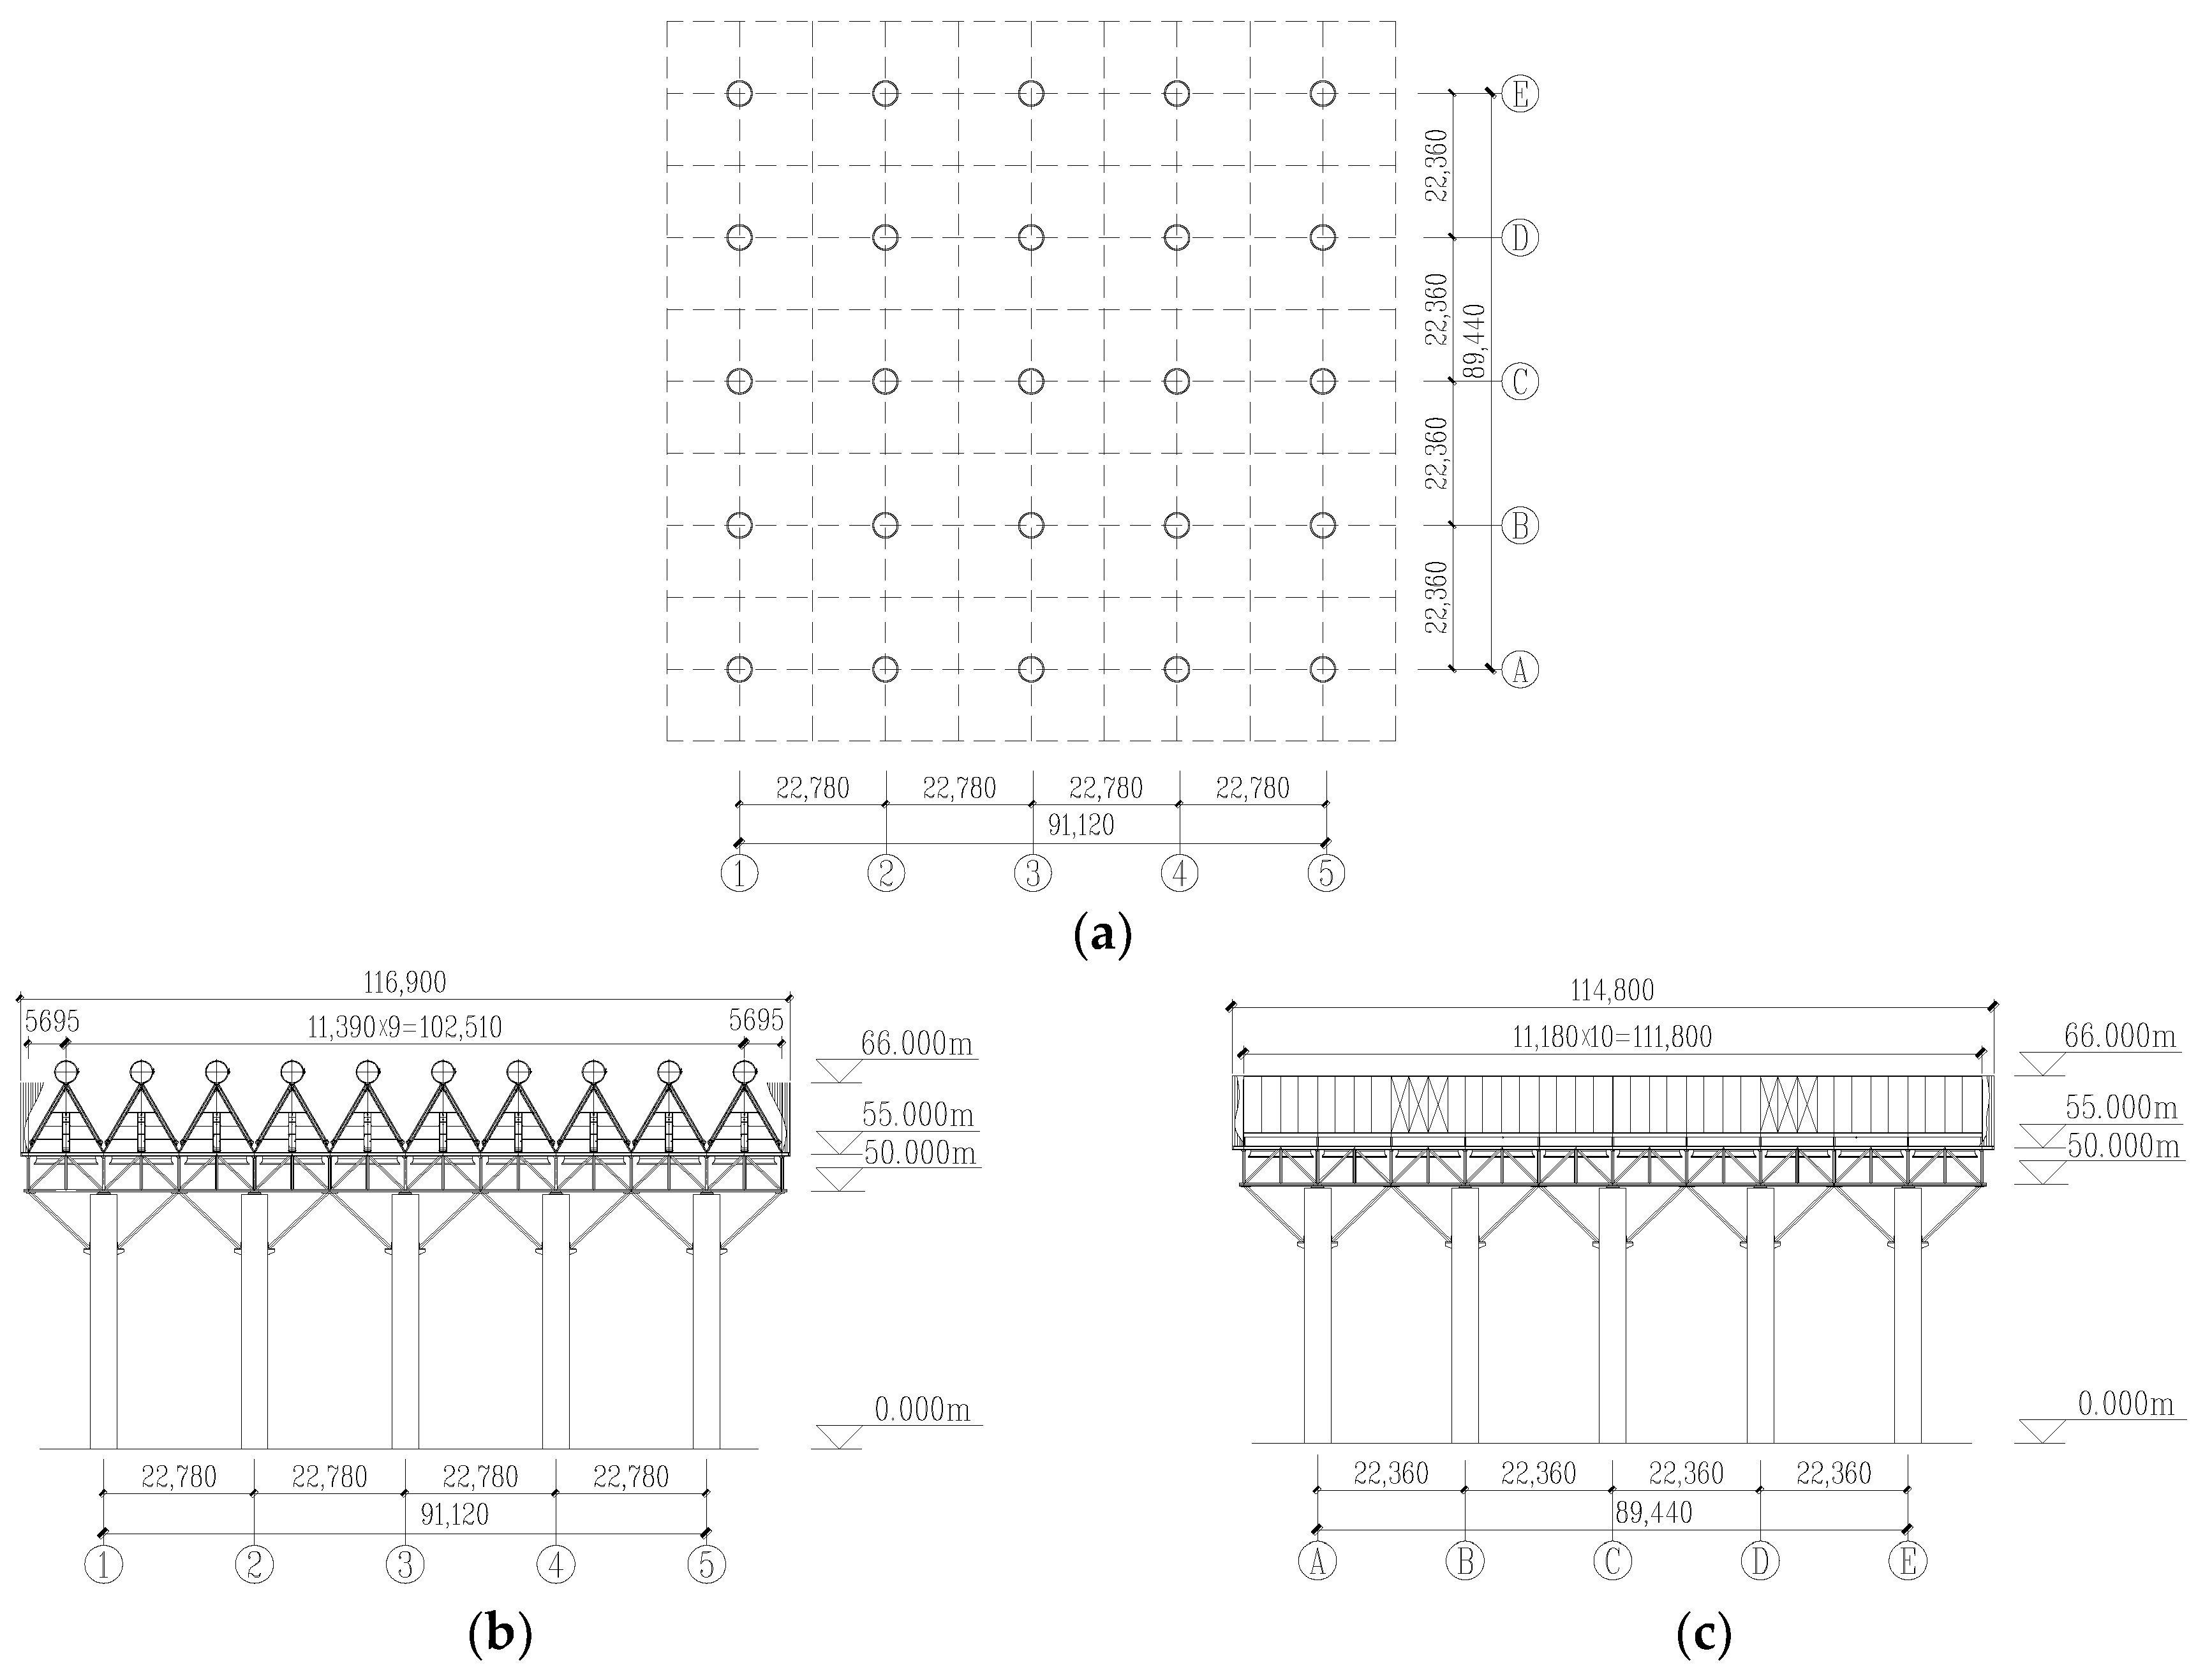
The prototype structure is a 66 m-height air-cooled condenser supporting structure assumed to be located in high seismic zone of China. The plan layouts and elevation views of the prototype structure are shown in Figure 2. Table 1 summarizes the cross sectional properties of the main structural components.
The seismic precautionary intensity of the located area for the prototype structure is 8-degree and the site condition is site-class II. According to the China seismic design code [22], all structures should satisfy the seismic demands under three hazard levels, that is, the structure should keep elastic under the frequent earthquake with 63.3% probability of exceedance in 50 years (Level 1), should be in use after repairment under the basic earthquake with 10% probability of exceedance in 50 years (Level 2), and should not collapse under the rare earthquake with 2% probability of exceedance in 50 years (Level 3). In addition, for the major construction projects, such as the air-cooled condenser supporting structure presented in this study, should not collapse under the very rare earthquake with 10−4 probability of exceedance in one year (Level 4) recommended by the seismic ground motion parameters zonation map of China [23]. For the 8-degree of seismic precautionary intensity for the hybrid structure presented in this study, the peak accelerations corresponding to the four seismic hazard levels as introduced above are 0.10, 0.20, 0.40 and 0.60 g, respectively.
3. Pseudo-Dynamic Tests and Numerical Analysis of Model Structure
3.1. Introduction of Test Program
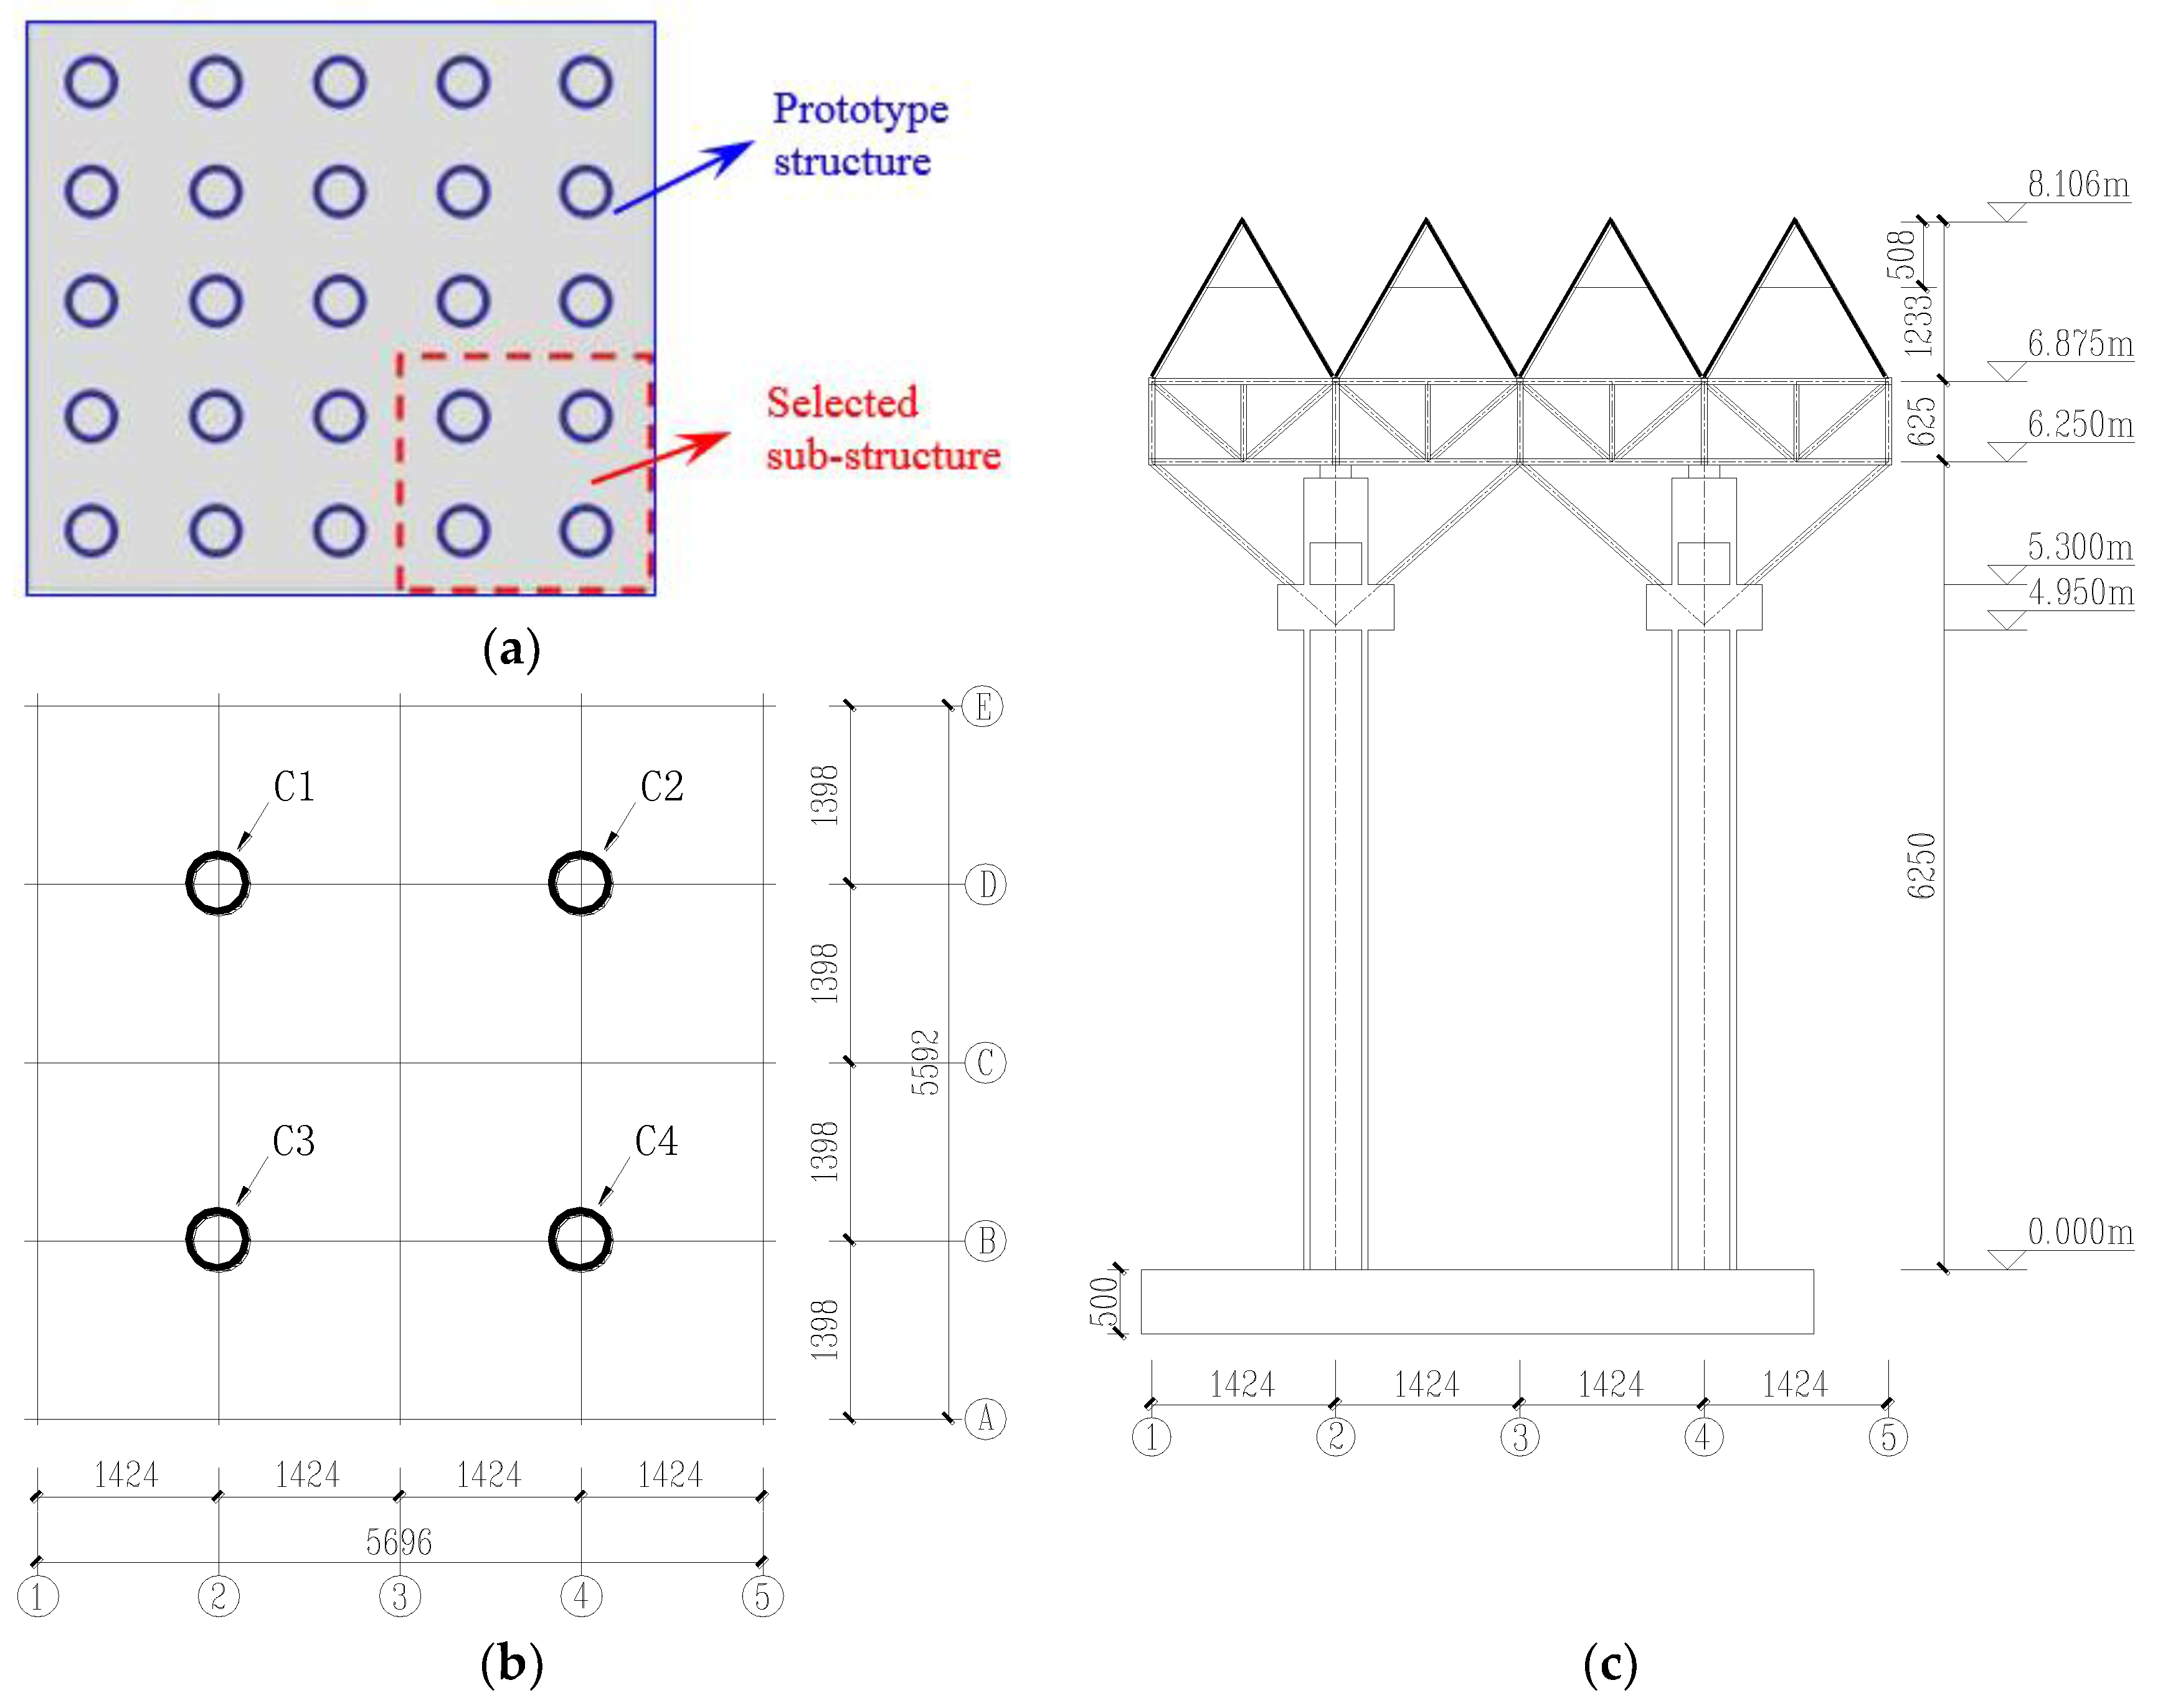
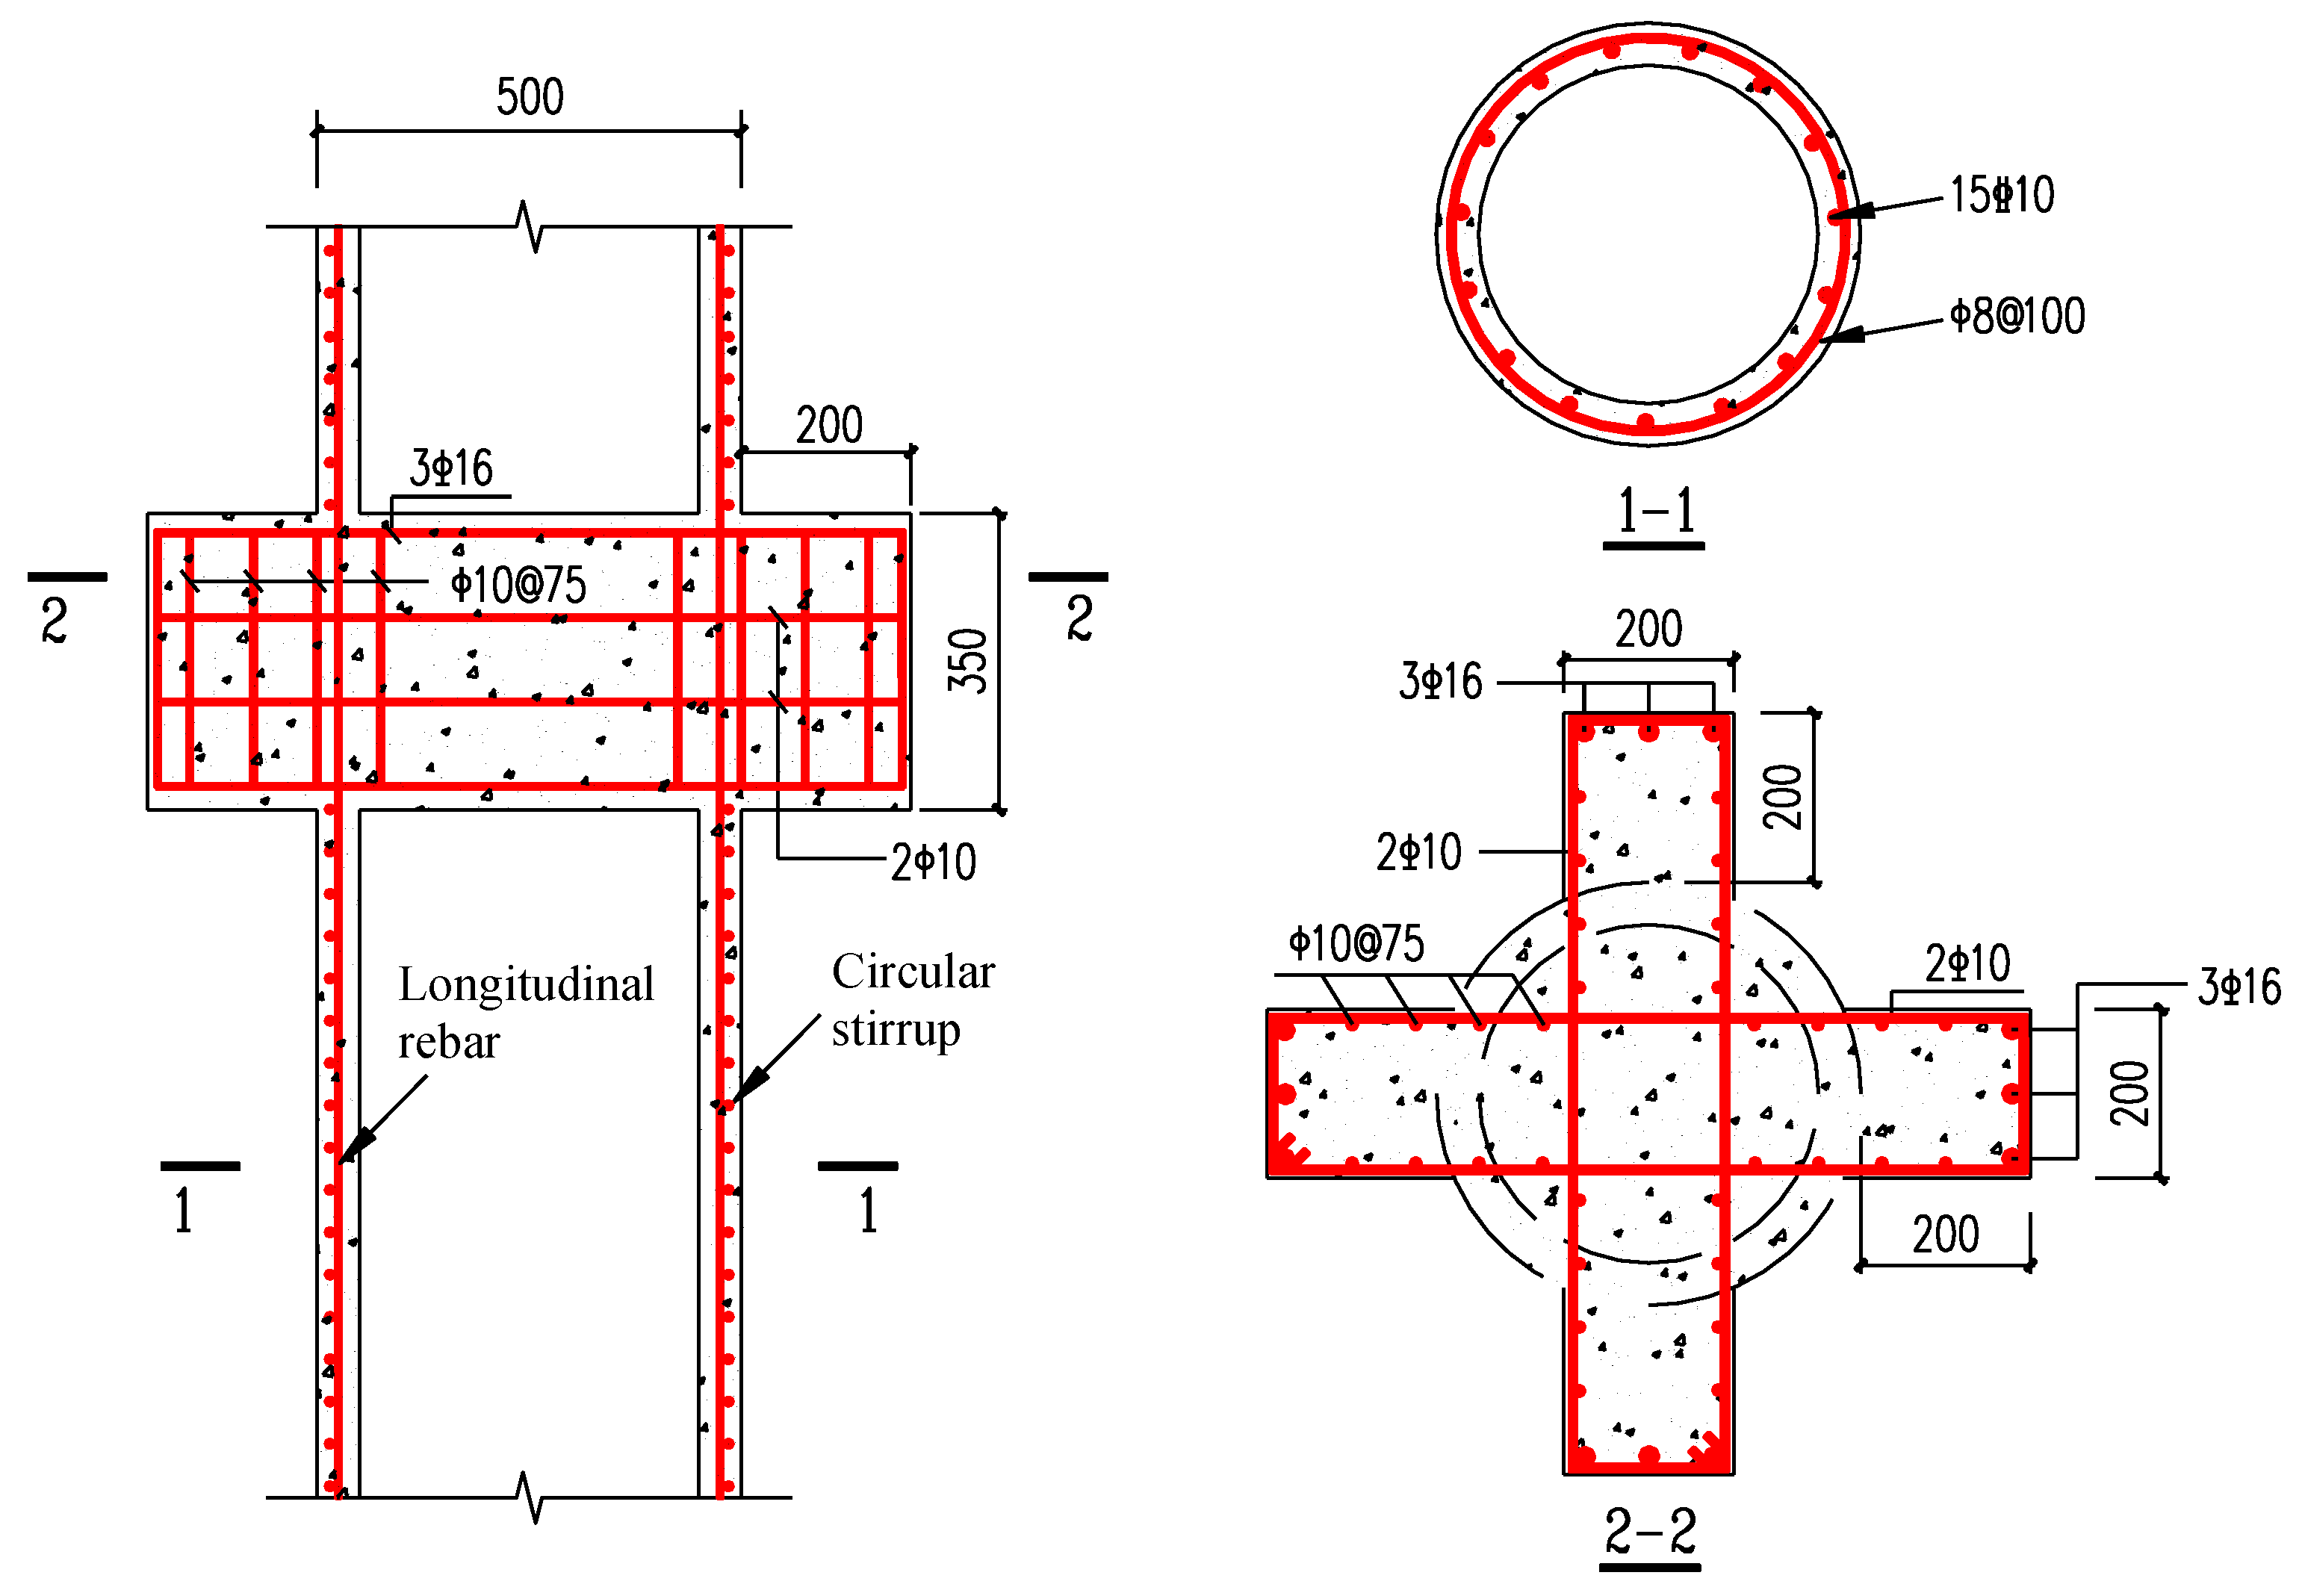
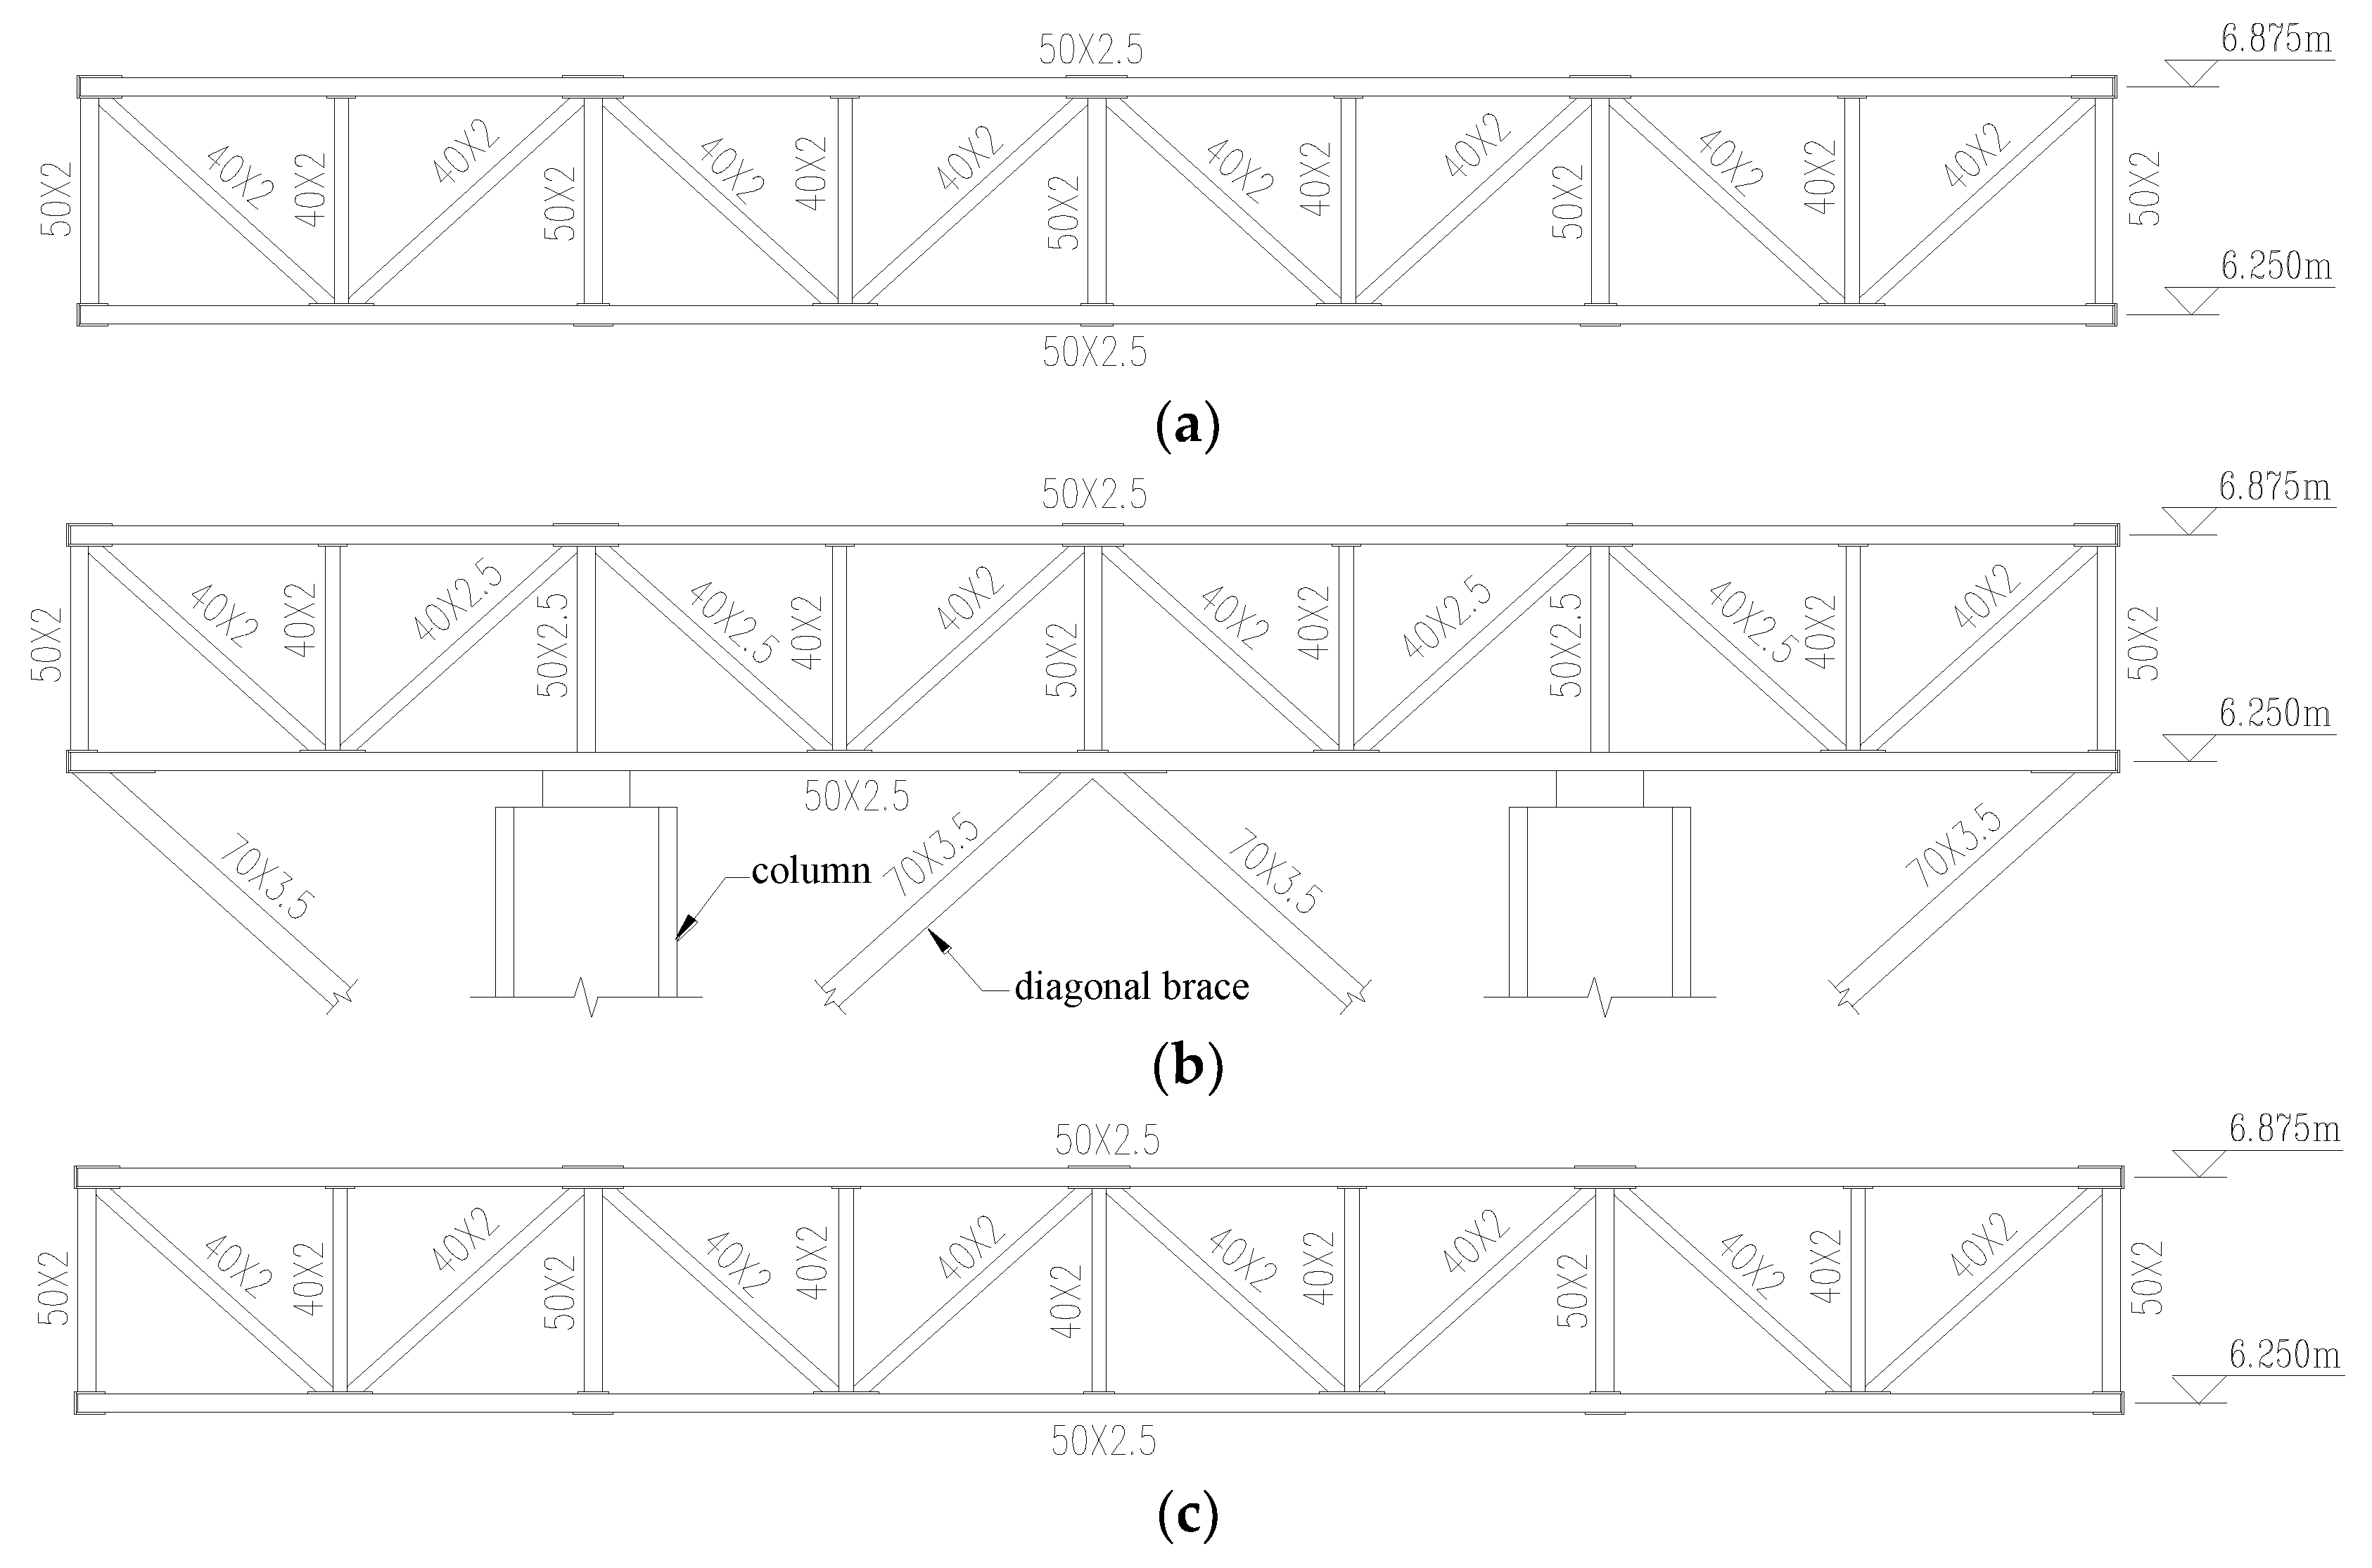
Due to limitation of the test field, a scaled sub-structure was selected from the prototype structure, as shown in Figure 3. The scaling factor for length L was determined as 1/8. Other scaling factors can be obtained by the principle of dimensional analysis [24]. Figure 3 shows the layouts and dimensions of test specimen. Figure 4 shows the steel arrangements of the RC tubular column. Considering there were no proper shaped steel to simulate the scaled steel truss, square hollow steel tubes were selected to fabricate the steel truss used in the specimen. The cross section details of the steel truss are shown in Figure 5. Table 2 provides the material properties of steel used in the specimen. The actual compressive and tensile strength of concrete used for the tubular columns were 28.3 and 2.5 MPa, respectively. The modulus of elasticity of concrete was 3.22 × 10⁴ N/mm2.
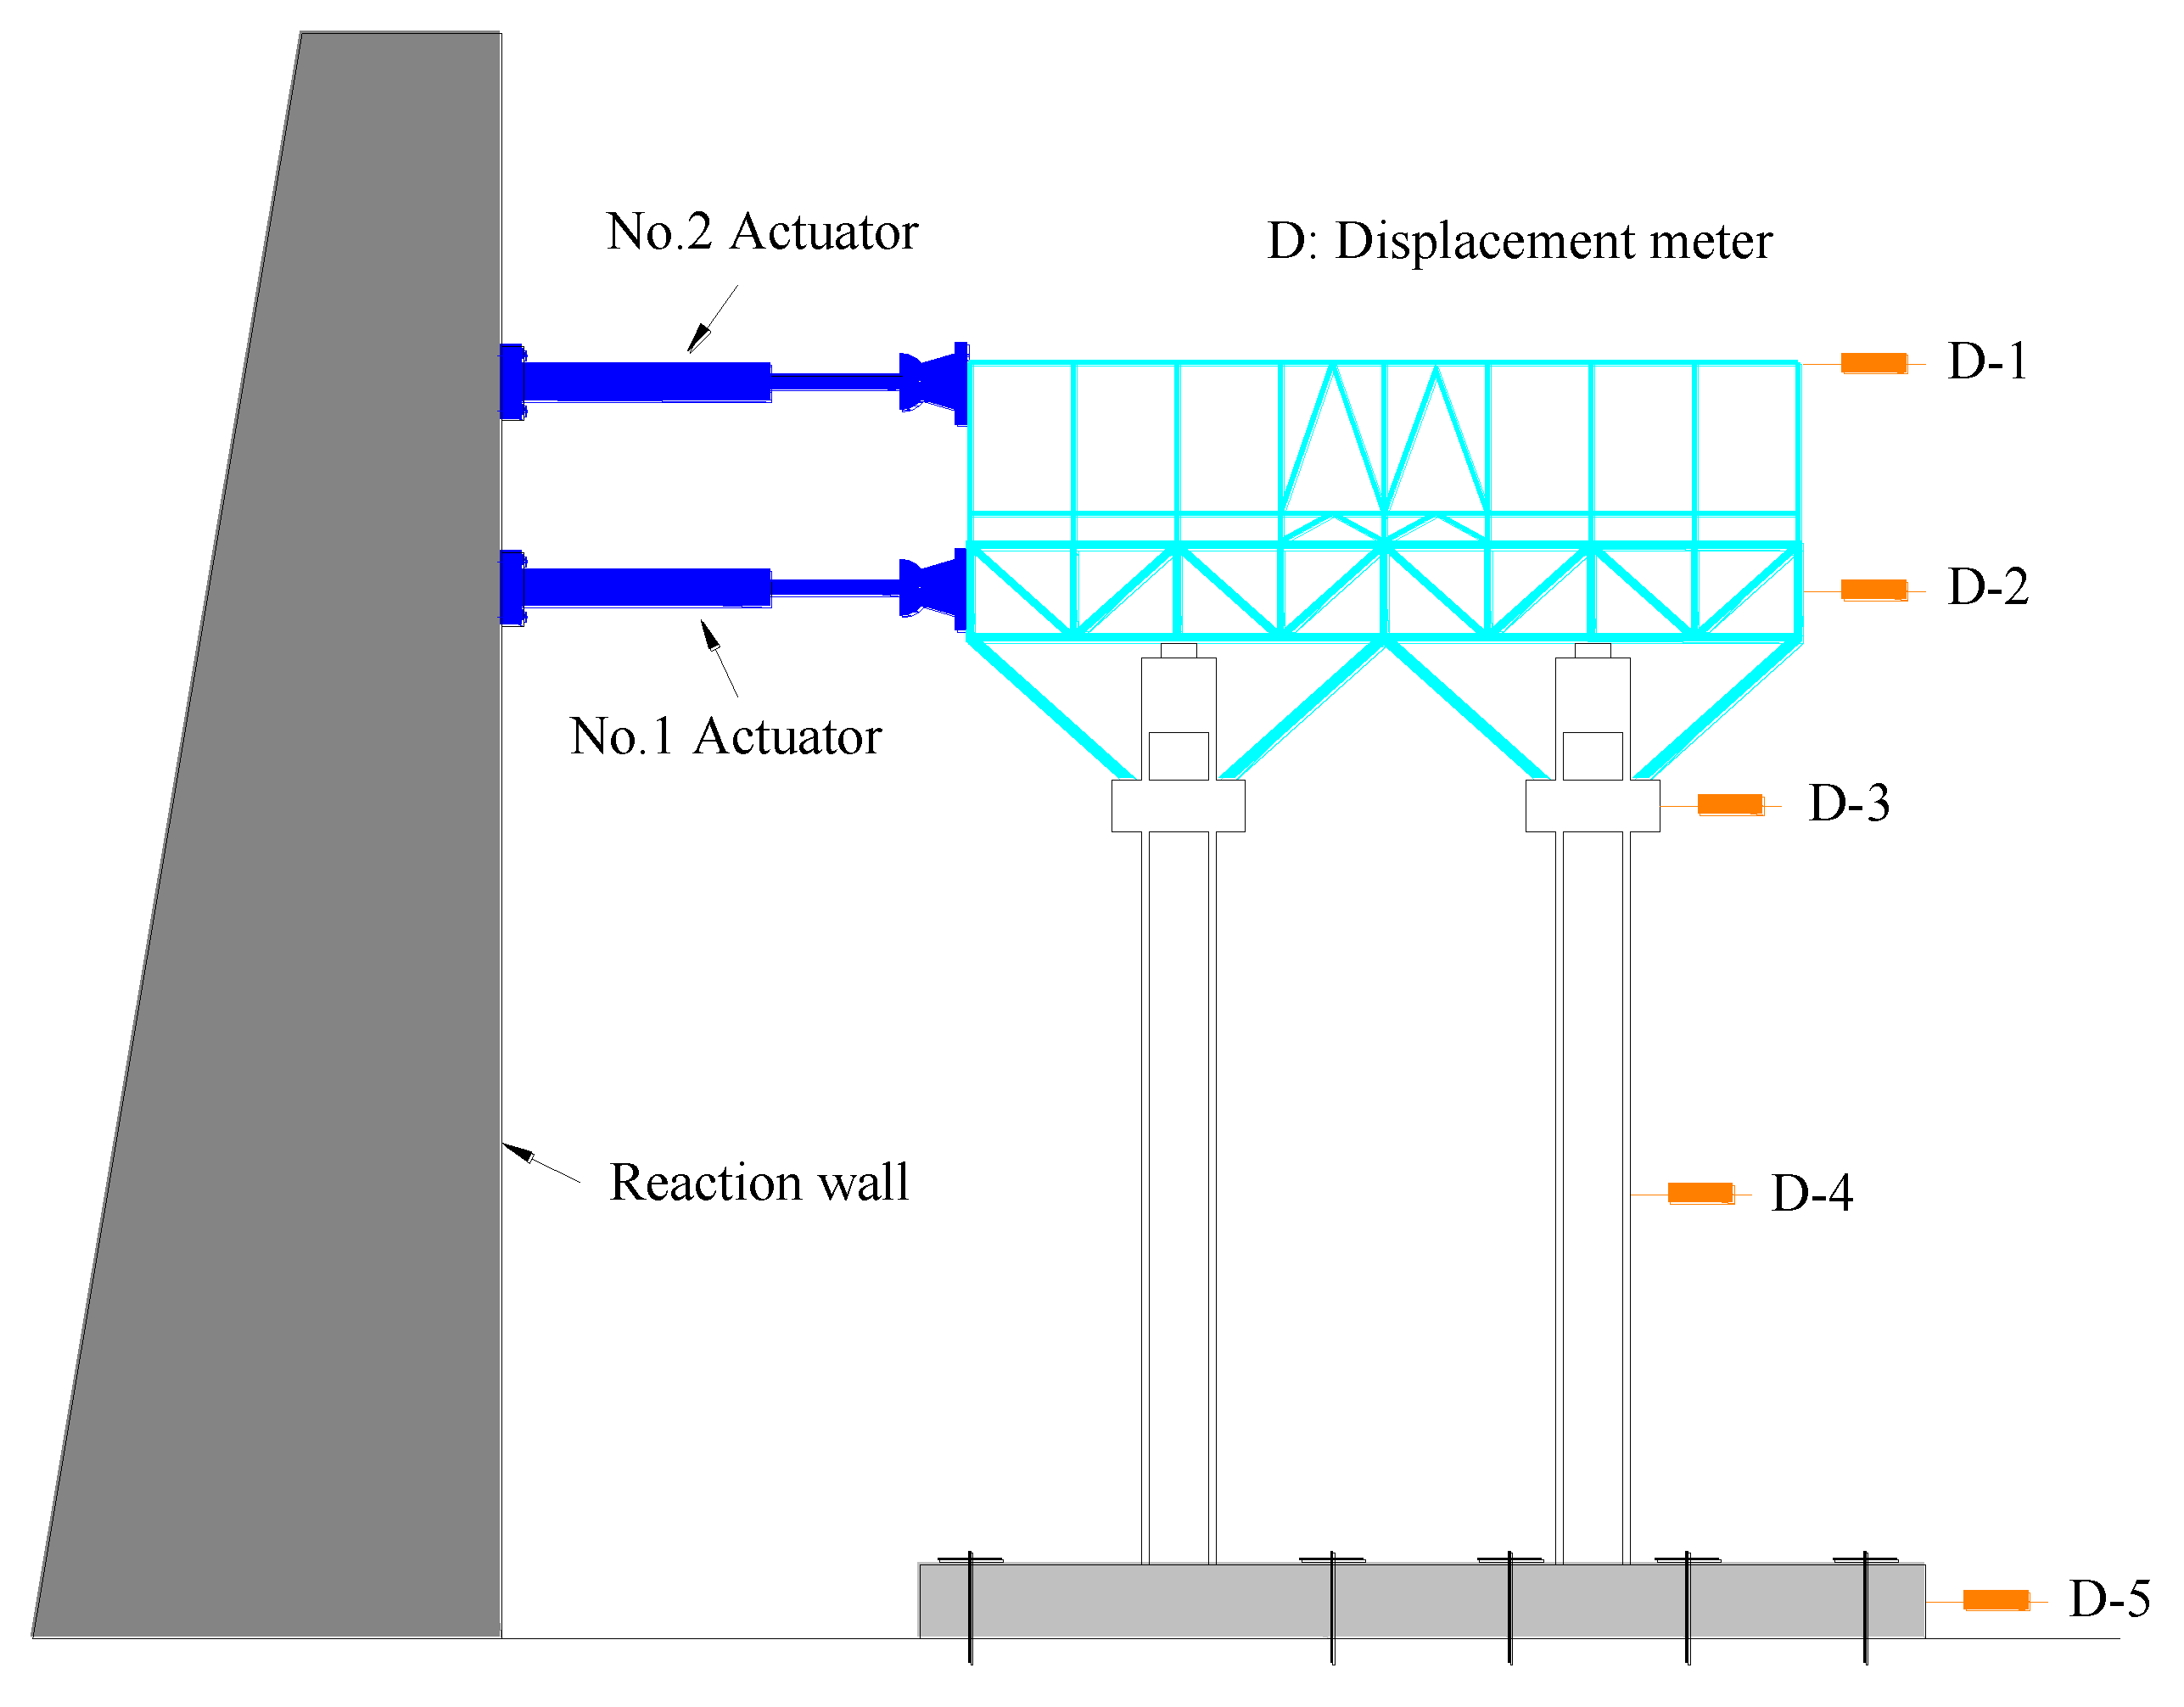
Figure 6 shows the test setup. Two hydraulic actuators were fixed respectively at the middle part of steel truss platform (6.563 m) and the top of A-shaped frame (8.106 m). The lower actuator located on the middle part of steel truss was set as the main control point. The loading protocol of each actuator was controlled by an online computing system capable of operating the PDT procedures. The input forces provided by the actuators was calculated by the Newmark-β method during the online PDT procedure [16].
The initial 8 s of El-Centro (NS) record was selected as the input ground motion for its ample spectral components and adaptability to the sites. Based on the time scaling factor of 1/, the duration and time interval of the input ground motion were determined as 2.8 s and 0.0035 s, respectively. Seven intensity levels of PGAs with 0.05, 0.10, 0.20, 0.30, 0.40, 0.60 and 0.80 g were used to simulate different hazard levels of earthquakes. In addition, free vibration with duration of 1.75 s was added for each loading case to investigate the changing rules of dynamic characteristics with the increase of PGA. Therefore, each PGA level was finally loaded by 800 steps (2.8 s) and subsequent 500 steps (1.75 s).
The loading ratio between the two actuators was 1:1.28, which was derived by the first mode vibration and mass matrix [16]. During the whole loading process, lateral displacements were recorded by the displacement meters (e.g., D-1) laterally installed on the top of A-shaped frame, middle part of steel truss, corbel, middle part of column and ground beam, as shown in Figure 6.
3.2. Finite Element Modeling Program
3.2.1. General
To further enhance the understanding of the seismic behavior for this steel–concrete hybrid supporting structure, nonlinear finite element analysis was carried out on the basis of experimental study. A full 3D fiber-based FE modeling approach for this hybrid structure was developed by the software ABAQUS. Meanwhile, through the comparative analysis between the numerical and experimental results, the modeling approaches for this peculiar steel–concrete hybrid structure were validated, which can be adopted to develop the numerical model of prototype structure.
3.2.2. Model Elements and Constitutive Relationships of Materials
A three-dimensional beam element B31 was employed to model the steel truss and diagonal braces. It has two nodes and each node has 6-degree-of-freedom. Shear deformation and finite axial strain are considered. For different types of cross sections, multiple integration points are used to export the stress and strain. In this paper, box-, I-, circular- and L-shaped cross sections were used, and the number of the corresponding integration points are 16, 13, 8 and 9 respectively. A quadrilateral shell element with reduced integration S4R was used to model the RC tubular columns. It is a general shell element with 4 nodes and each node has 6-degree-of-freedom. It could consider the transverse shear deformation. It follows the Mindlin shell theory with increase of the thickness, while follows the Kirchhoff shell theory with decrease of the thickness. It considers the finite membrane strain and arbitrarily large rotation, suitable for the large deformation analysis. The numerical integration method is adopted to calculate the stress and strain for each cross-sectional point along the thickness direction of the shell element. 5 integration points are assigned in the thickness direction so as to simulate the progressive failure process of the shell element [25,26,27,28].
For steel components including the truss, A-shaped frames and diagonal braces, the stress-strain relationship of steel was simulated by the bilinear kinematic hardening model, which takes into account the Bauschinger effect under cyclic loading. The material parameters of the steel are given in Table 2.
For concrete tubular columns, the concrete damaged plasticity (CDP) model provided in the material library of ABAQUS was adopted to simulate the mechanical behavior of concrete. The compressive strength, tensile strength and Young’s modulus were introduced in Section 3.1. The uniaxial tensile and compressive damaged stress-strain relationships expressed by Equations (1)–(7) were used to determine the parameters of the damaged plasticity model of concrete according to the China design code of concrete structures [29].
where dt and dc are respectively the uniaxial tensile and compressive damage evolution parameters for concrete; E0 is the initial elastic modulus of concrete; and are respectively the peak strains of the uniaxial tensile and compressive stress-strain curves for concrete; αt and αc are respectively the descending stage parameters of the uniaxial tensile and compressive stress-strain curves for concrete, equal to 1.95 and 1.94, respectively; fc is the uniaxial compressive strength of concrete.
The energy equivalence hypothesis was adopted to establish the damage evolution rules, and it supposed that the elastic complementary energy of the damaged material has the same form with the undamaged material, except that the stress of the undamaged material should be replaced by the effective stress of the damaged material [30]. The elastic complementary energy corresponding to the undamaged material and the damaged material can be expressed by Equations (8) and (9), respectively.
where is the effective stress; is the Cauchy stress; D is the scalar damage variable.
According to the energy equivalence hypothesis, the following equation can be obtained.
Then, the CDP law can be described as follows:
Herein, we assumed that there is no damage before the stresses reach the peak values for both of the tensile and compressive cases. Finally, compare Equation (11) with Equations (1)–(7), the damage model of concrete in this paper can be expressed by the following equations.
3.2.3. Numerical Model Description
Figure 7a shows the whole FE model of the test specimen. In practice, the steel diagonal braces were connected with the column through corbels in the specimen, as shown in Figure 7b. However, in order to simply the FE modeling procedure, the steel diagonal brace was connected with the column directly. Four pieces of steel plates were added on the four elements around the brace-to-column connection point to avoid the stress concentration. Figure 7c shows the simplified brace-to-column connection of the FE model. The tie constraint was used as the general interaction law for all the welded steel components, i.e., the welded connections in the A-shaped frames, steel truss, A-shaped frame-to-truss connections and truss-to-brace connections, and hence possible relative displacements and rotations of the welded connections were fully neglected. Integral modeling method was adopted to simulate the concrete and steel rebars in RC columns, where the embedded constraint was used for the steel rebars. The pin-connected joint was used to simulate the column-to-truss connection, which is between the rigid and pin connections in the test specimen where the top of column and steel truss was connected through the welded connections between the embedded steel plate in the top column and the steel truss, as shown in Figure 7d. Meanwhile, in order to transfer the actions from the steel truss to the columns uniformly, the three-dimensional truss element T3D2 was used to realize the load transfer process, as shown in Figure 7e. It has two nodes, and each node has 3-degree-of-translational freedom.
3.3. Experimental and Numerical Results
3.3.1. Cracking Process and Failure Modes
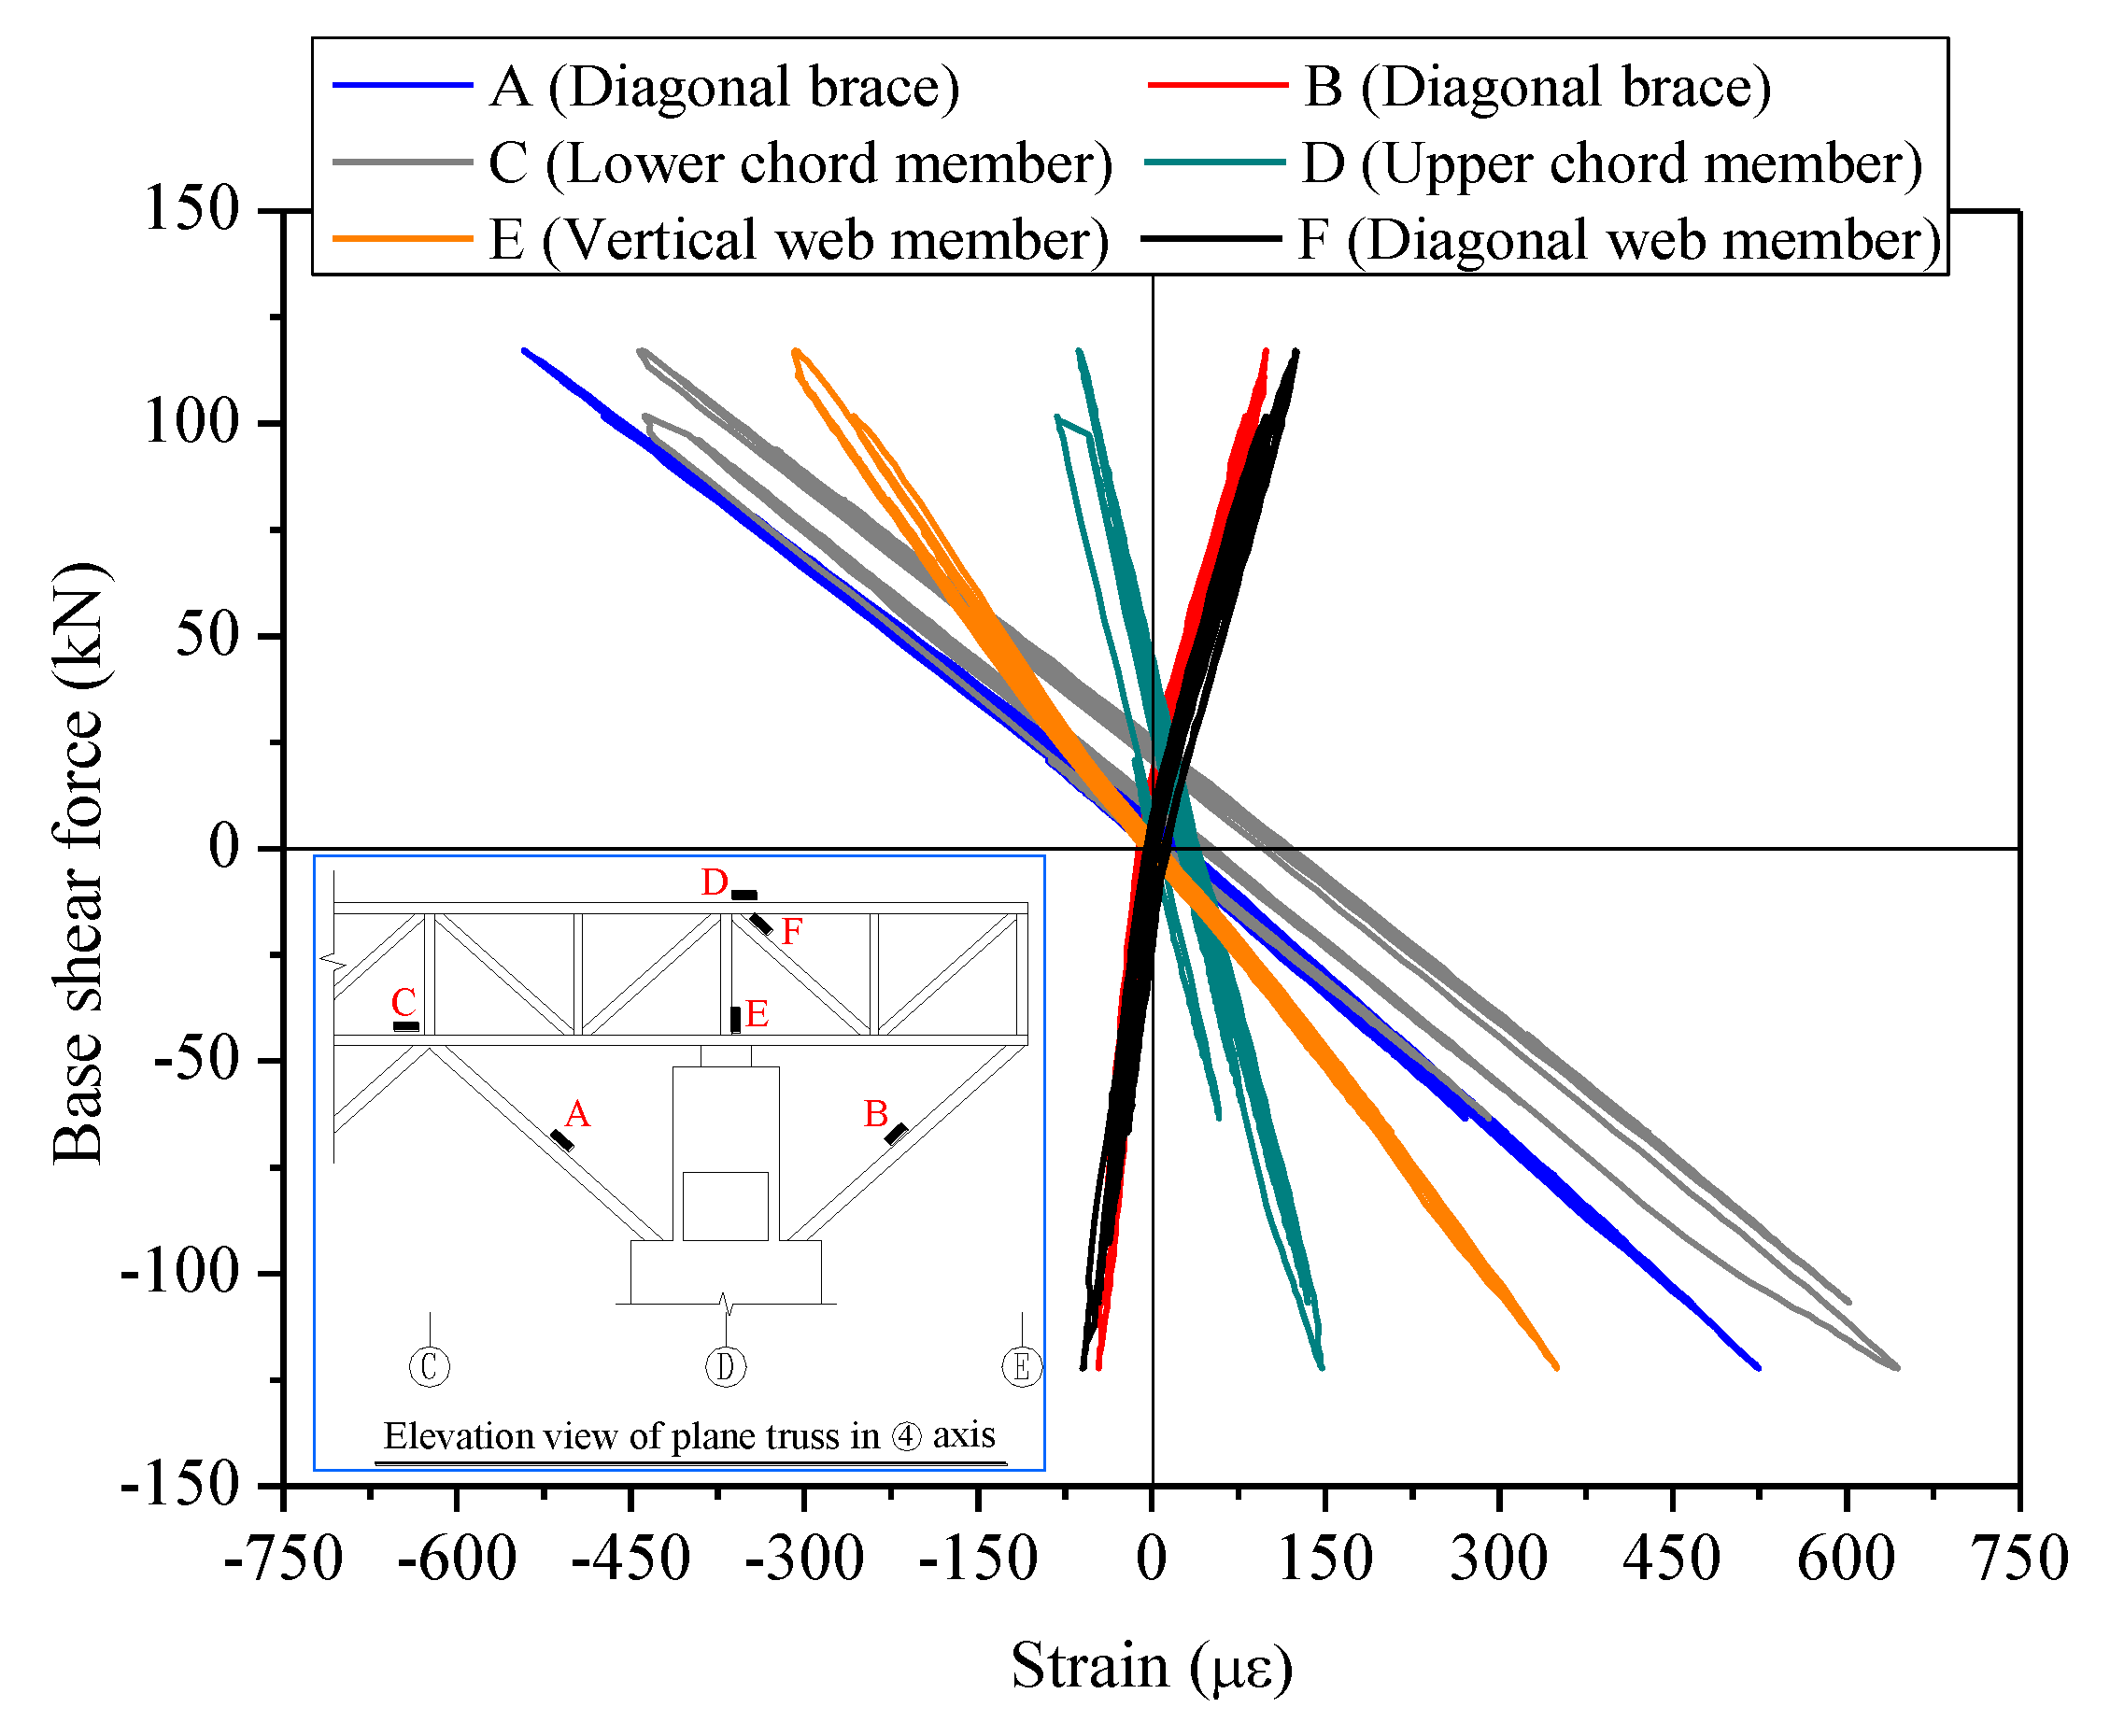
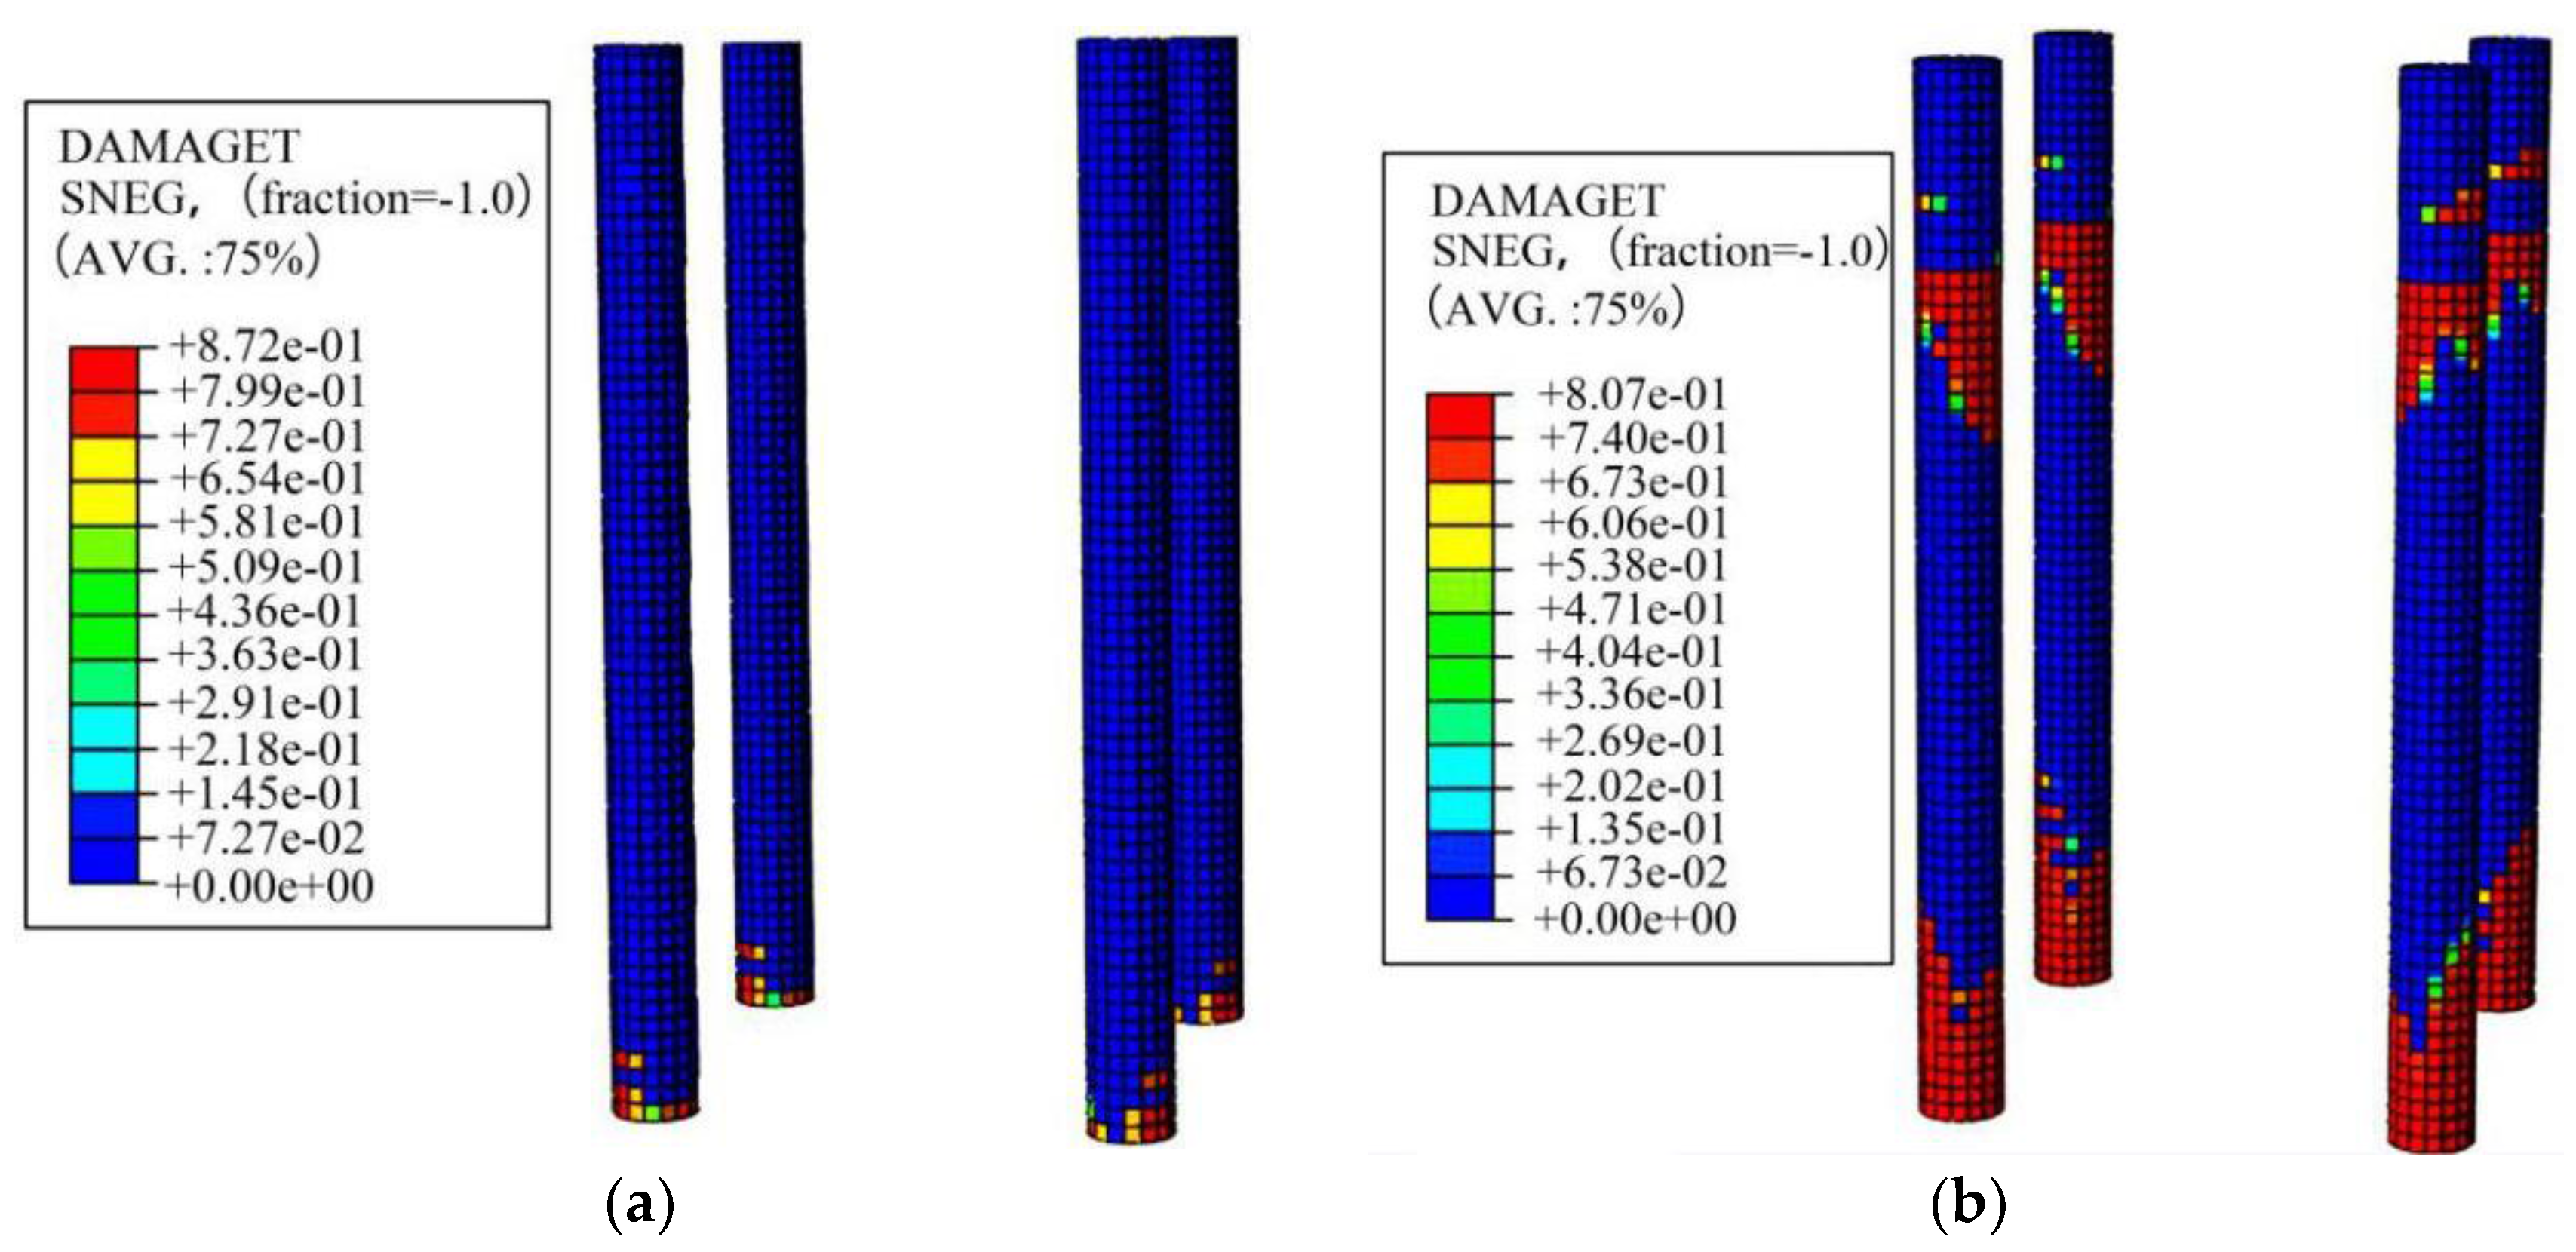
In general, cracks mainly occurred on the tubular columns during the PDTs, however, the steel components including the truss, diagonal braces and A-shaped frames kept elastic. Figure 8 shows the measured strains of the steel truss members and diagonal brace during the final PDT case with PGA of 0.8 g. It can be found that the steel truss and diagonal braces did not yield. Moreover, it was observed that all of the four tubular columns exhibited similar failure modes. Table 3 summarizes the cracking details of column C1 as designated in Figure 3a under PDTs. Initially, no noticeable cracks occurred at peak acceleration levels of 0.05 and 0.1 g, indicating that the tubular columns were nearly under elastic stage. When PGA came up to 0.20 g, the initial cracks were observed on the bottom of column. Figure 9 shows the observed cracking patterns of columns after PDTs. Figure 10a,b respectively show the numerical tensile damage distribution patterns of columns at the end of loading case with PGA of 0.20 and 0.60 g, which agreed well with the test results. Both the experimental and numerical results indicated that the cracks formed and developed on the bottom of column, lower part of corbel and upper part of corbel successively with the increase of PGA. Analysis showed that the observed damage coincided with the expected design results. Because the steel truss and A-shaped frames bear the important plants directly due to the technological requirements in TPPs, are expected to suffer negligible damage under earthquakes. In addition, as the strengthening components to improve the overall stiffness and the structural integrity, the steel diagonal braces should not failure ahead of other components.
3.3.2. Lateral Displacement Responses
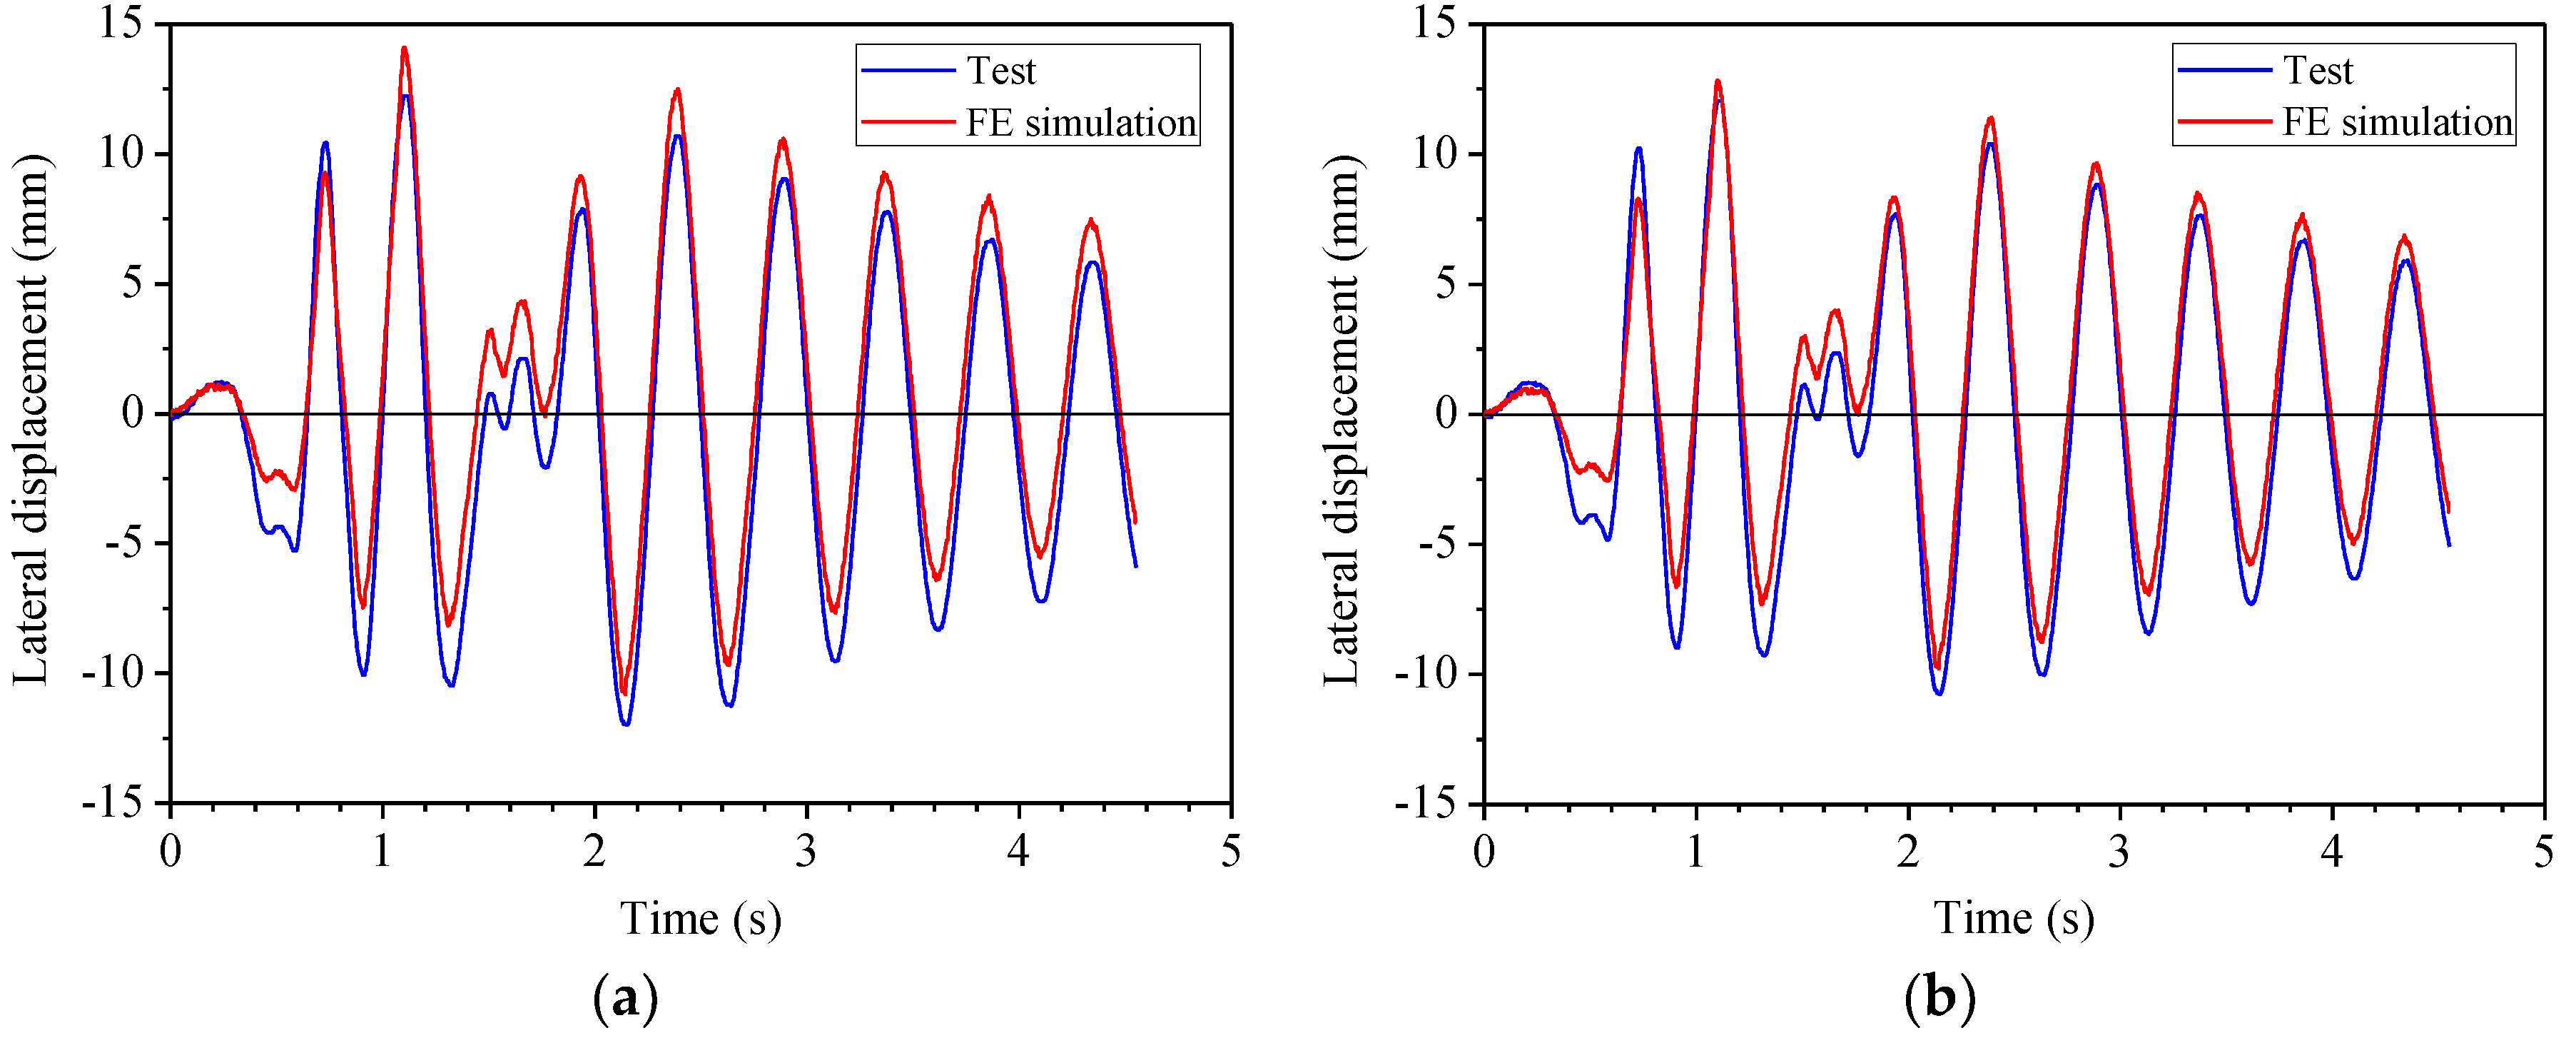
Table 4 summarizes the test results of maximum lateral displacements and drift ratios on the top of A-shaped frame. Figure 11 presents the comparison of time-history lateral displacement responses between the FE simulation and test results. It can be found that there was a good agreement between the numerical and experimental results. Both the peak values and phases of the lateral displacements exhibited the reasonable accuracy. This indicated that the proposed FE simulation approaches could reasonably simulate the seismic behavior of this hybrid structure. In addition, it can be seen that the occurring moments of peak displacements were delayed with increase of PGA, as shown in Figure 11d. This was due to the fact that the accumulated damage of the specimen with increase of PGA, resulting in the stiffness deterioration.
3.3.3. Changing Rules of Dynamic Characteristic Parameters and Lateral Stiffness
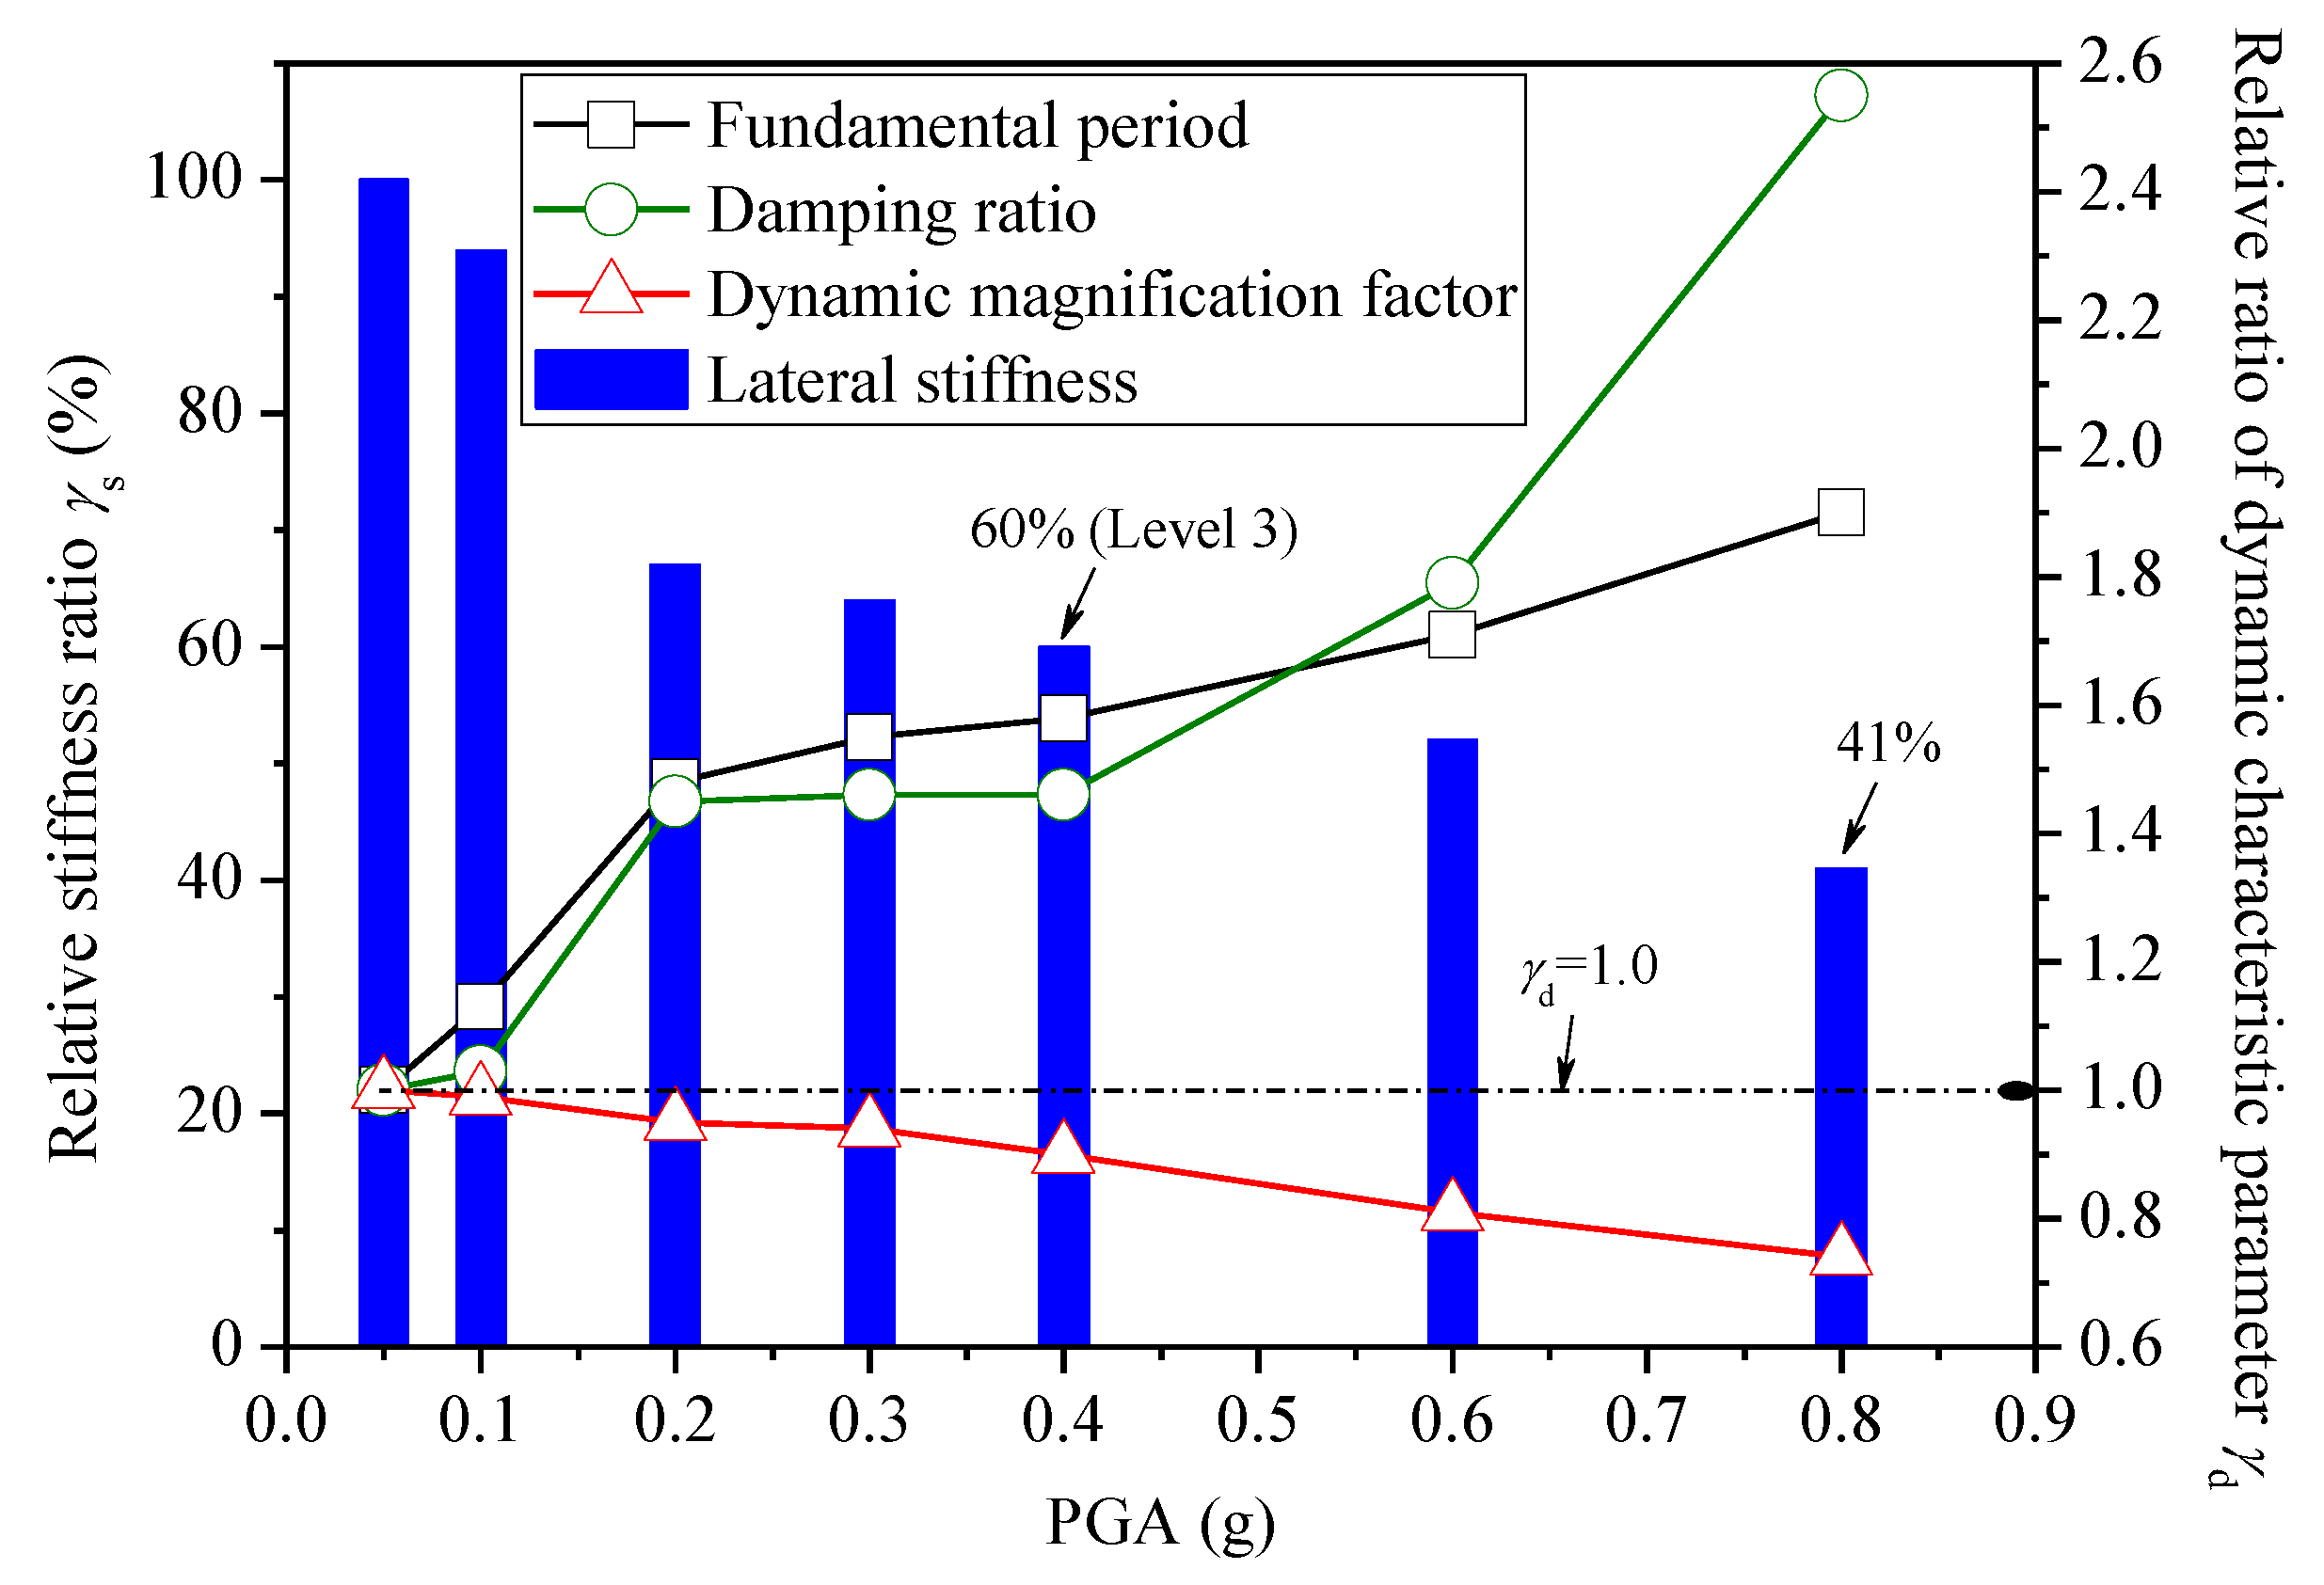
With the increase of PGA, the structural damage generated and accumulated, resulting in the elongation of fundamental period, the increase of the damping ratio and the decrease of dynamic magnification factor. Meanwhile, the lateral stiffness gradually deteriorated with the accumulation of structural damage.
Table 5 shows test results of the fundamental period, damping ratio, dynamic magnification factor and lateral stiffness of the specimen under PDTs. The dynamic magnification factor was defined as the ratio between the maximum acceleration response and input PGA. The lateral stiffness Ki was calculated by the following formula [16]:
where +Fi and −Fi are respectively the peak load under the ith loading case of the PDTs in two opposite directions; +Xi and −Xi are respectively the displacement corresponding to the peak load under the ith loading case of the PDTs in two opposite directions.
In order to investigate the changing rules of dynamic characteristic parameters and lateral stiffness of the specimen with the increase of PGA, the relative ratio γd was defined as the ratio between the dynamic characteristic parameter, i.e., fundamental period, damping ratio and dynamic magnification, under one specific loading case of the PDTs to that under the first loading case with PGA of 0.05 g. Specially, when PGA is 0.05 g, the relative ratios of the dynamic characteristics parameters are 1. Similarly, the relative stiffness ratio γs was defined as the ratio between the lateral stiffness under one specific loading case of the PDTs to that under the first loading case with PGA of 0.05 g. It is 100% when PGA equals to 0.05 g.
Figure 12 presents the relative stiffness ratio γs and relative ratios γd of dynamic characteristic parameters of the specimen subjected to different PGAs. It can be found that the specimen had obvious stiffness deterioration characteristics, due to the cracks occurring and propagation on RC tubular columns. When PGA was less than 0.20 g, the stiffness deteriorated sharply due to the initial cracking of concrete. Then, the speed of stiffness deterioration slowed after PGA came up to 0.20 g. When PGA equaled to 0.40 g which referred to the seismic hazard level 3 as introduced in Section 2, the stiffness was about 60% of its initial value, indicating that the lateral stiffness performance of the specimen was good enough to meet the design requirement of “not collapse under rare earthquake” in the China seismic design code [22]. Correspondingly, with the increase of PGA, the fundamental period and damping ratio increased, while the dynamic magnification factor decreased.
4. Numerical Analysis of Prototype Structure
4.1. FE Model of Prototype Structure
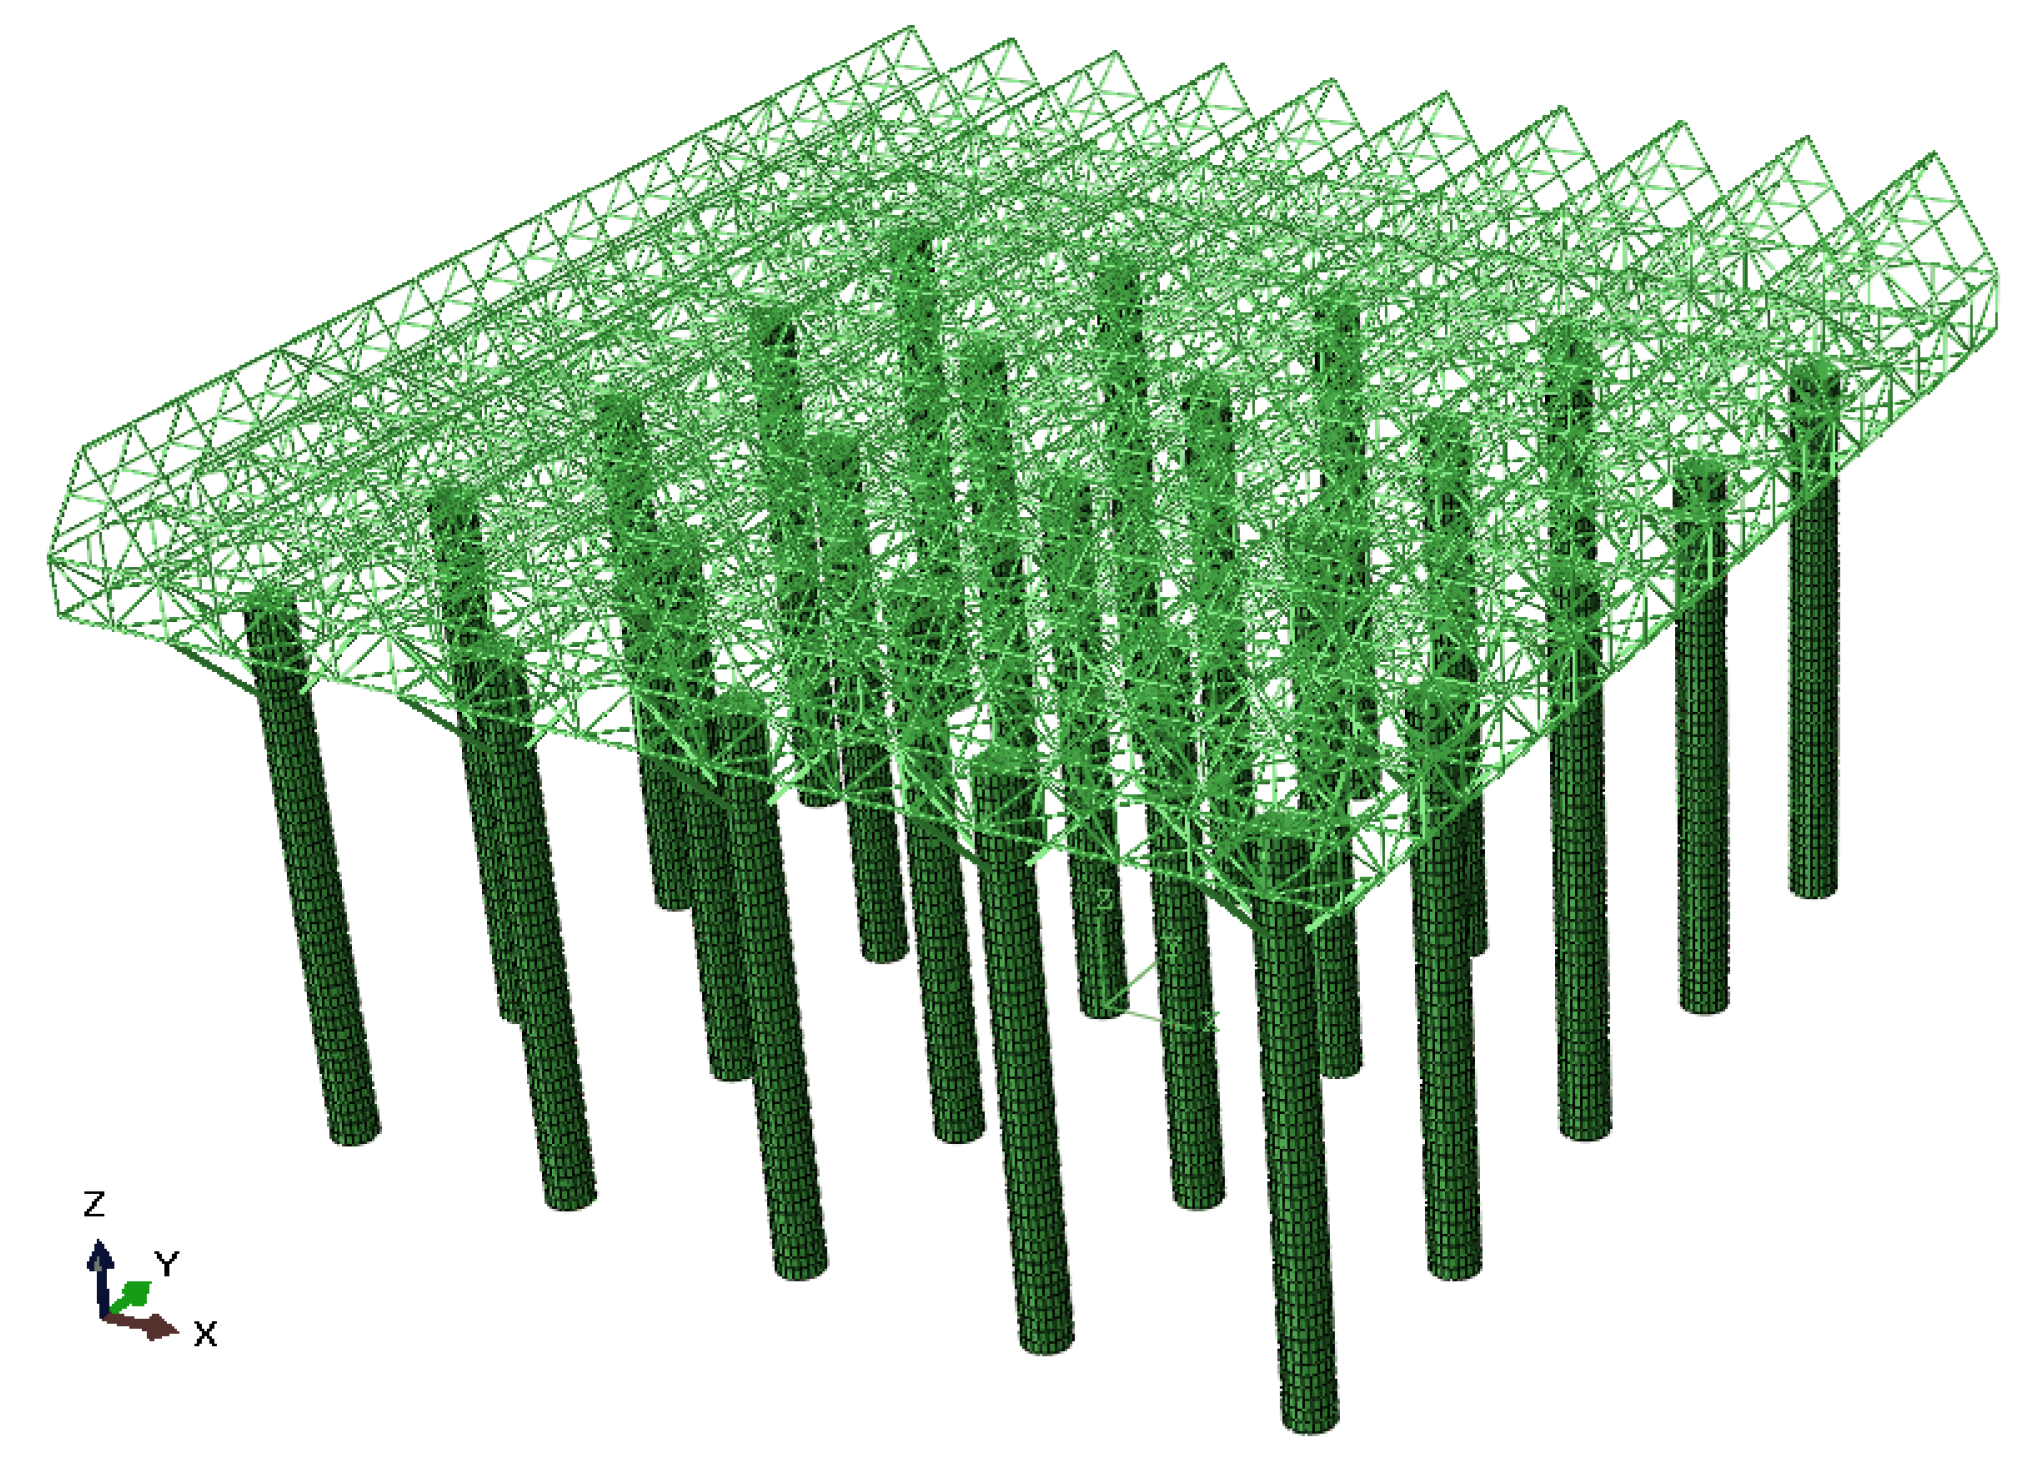
The FE model of the prototype structure was developed through the modeling approach which has been validated with test results. The layouts and dimensions of the prototype structure are shown in Figure 2. The cross sectional and material properties of structural components are given in Table 1. Figure 13 shows the whole FE model of the prototype structure.
4.2. Dynamic Characteristics
The dynamic characteristics of the prototype structure are shown in Table 6. Figure 14 shows the vibration modes of first three modes. As shown in Table 6, it can be found that the accumulated participating mass coefficients of the first three vibration modes can reach above 0.97. In addition, the first fundamental period was 1.216 s and the corresponding vibration mode was torsion, as shown in Figure 14a. The plan layouts are regular and symmetric (as shown in Figure 2), however, the stiffness and mass mainly distribute on the upper part of the structure along the vertical direction, easily generate the torsional effect which is adverse to the seismic design. According to the China seismic design code [22], the period ratio between the first torsional mode and the first translation mode should not be larger than 0.85 so as to prevent excessive structural torsion. The calculated result showed that the period ratio of this structure was about 1.02, which was larger than 0.85. This indicated that the torsional effect should not be neglected in the structural design for this hybrid structure.
4.3. Nonlinear Time-History Analysis
In this section, nonlinear dynamic time-history analyses were carried out on the FE model of prototype structure. As introduced in Section 2, the prototype structure was located in 8-degree seismic precautionary intensity region. According to the China seismic design code [22], when conducting the time-history analysis, the peak acceleration of input ground motion should be respectively scaled to 0.70, 0.20 and 0.40 g to reflect the three seismic hazard levels (frequent, basic and rare earthquakes) corresponding to the 8-degree seismic intensity. In this study, EL-Centro (NS) wave was selected as the input ground motion. The duration is 30 s and the time interval is 0.02 s. In addition, considering the importance of the lifeline engineering, the ground motion with the PGA of 0.62 g was added to further investigate the seismic performance of this hybrid structure under more severe earthquakes, which is in accordance with the rare earthquake hazard level corresponding to 9-degree seismic intensity recommended by the China seismic design code [22]. Furthermore, it also could be regarded as the very rare earthquake hazard level corresponding to 8-degree seismic intensity with 10−4 probability of exceedance in one year. Because the peak acceleration of ground motion for the very rare earthquake could be taken as the 2.7–3.2 times of the PGA corresponding to the basic earthquake recommended by the seismic ground motion parameters zonation map of China [23], equals to 5.4–0.64 g.
Figure 15a,b show the time-history base shear force curves and roof lateral displacement curves subjected to different seismic hazard levels. Table 7 summarizes the maximum base shear forces and shear-weight ratios. The shear-weight ratio λ of the structure was calculated by the following formula [22]:
where VEK is the maximum base shear force; G is the representative value of gravity load.
Both time-history base shear force and displacement curves showed that the occurring moment of peak responses were delayed with increase of PGA, due to the accumulation of the structural damage. In addition, according to the China technical specification for concrete structures of tall building [31], the floor shear-weight ratio of structures under the frequent earthquake should be no less than 0.032 for those structures with significant torsion effects or whose fundamental periods are less than 3.5 s. The calculated results showed that the shear-weight ratio of this hybrid structure was 0.058, which was larger than 0.032. This indicated that the shear force distribution of this hybrid structure meets the requirements of the design code.
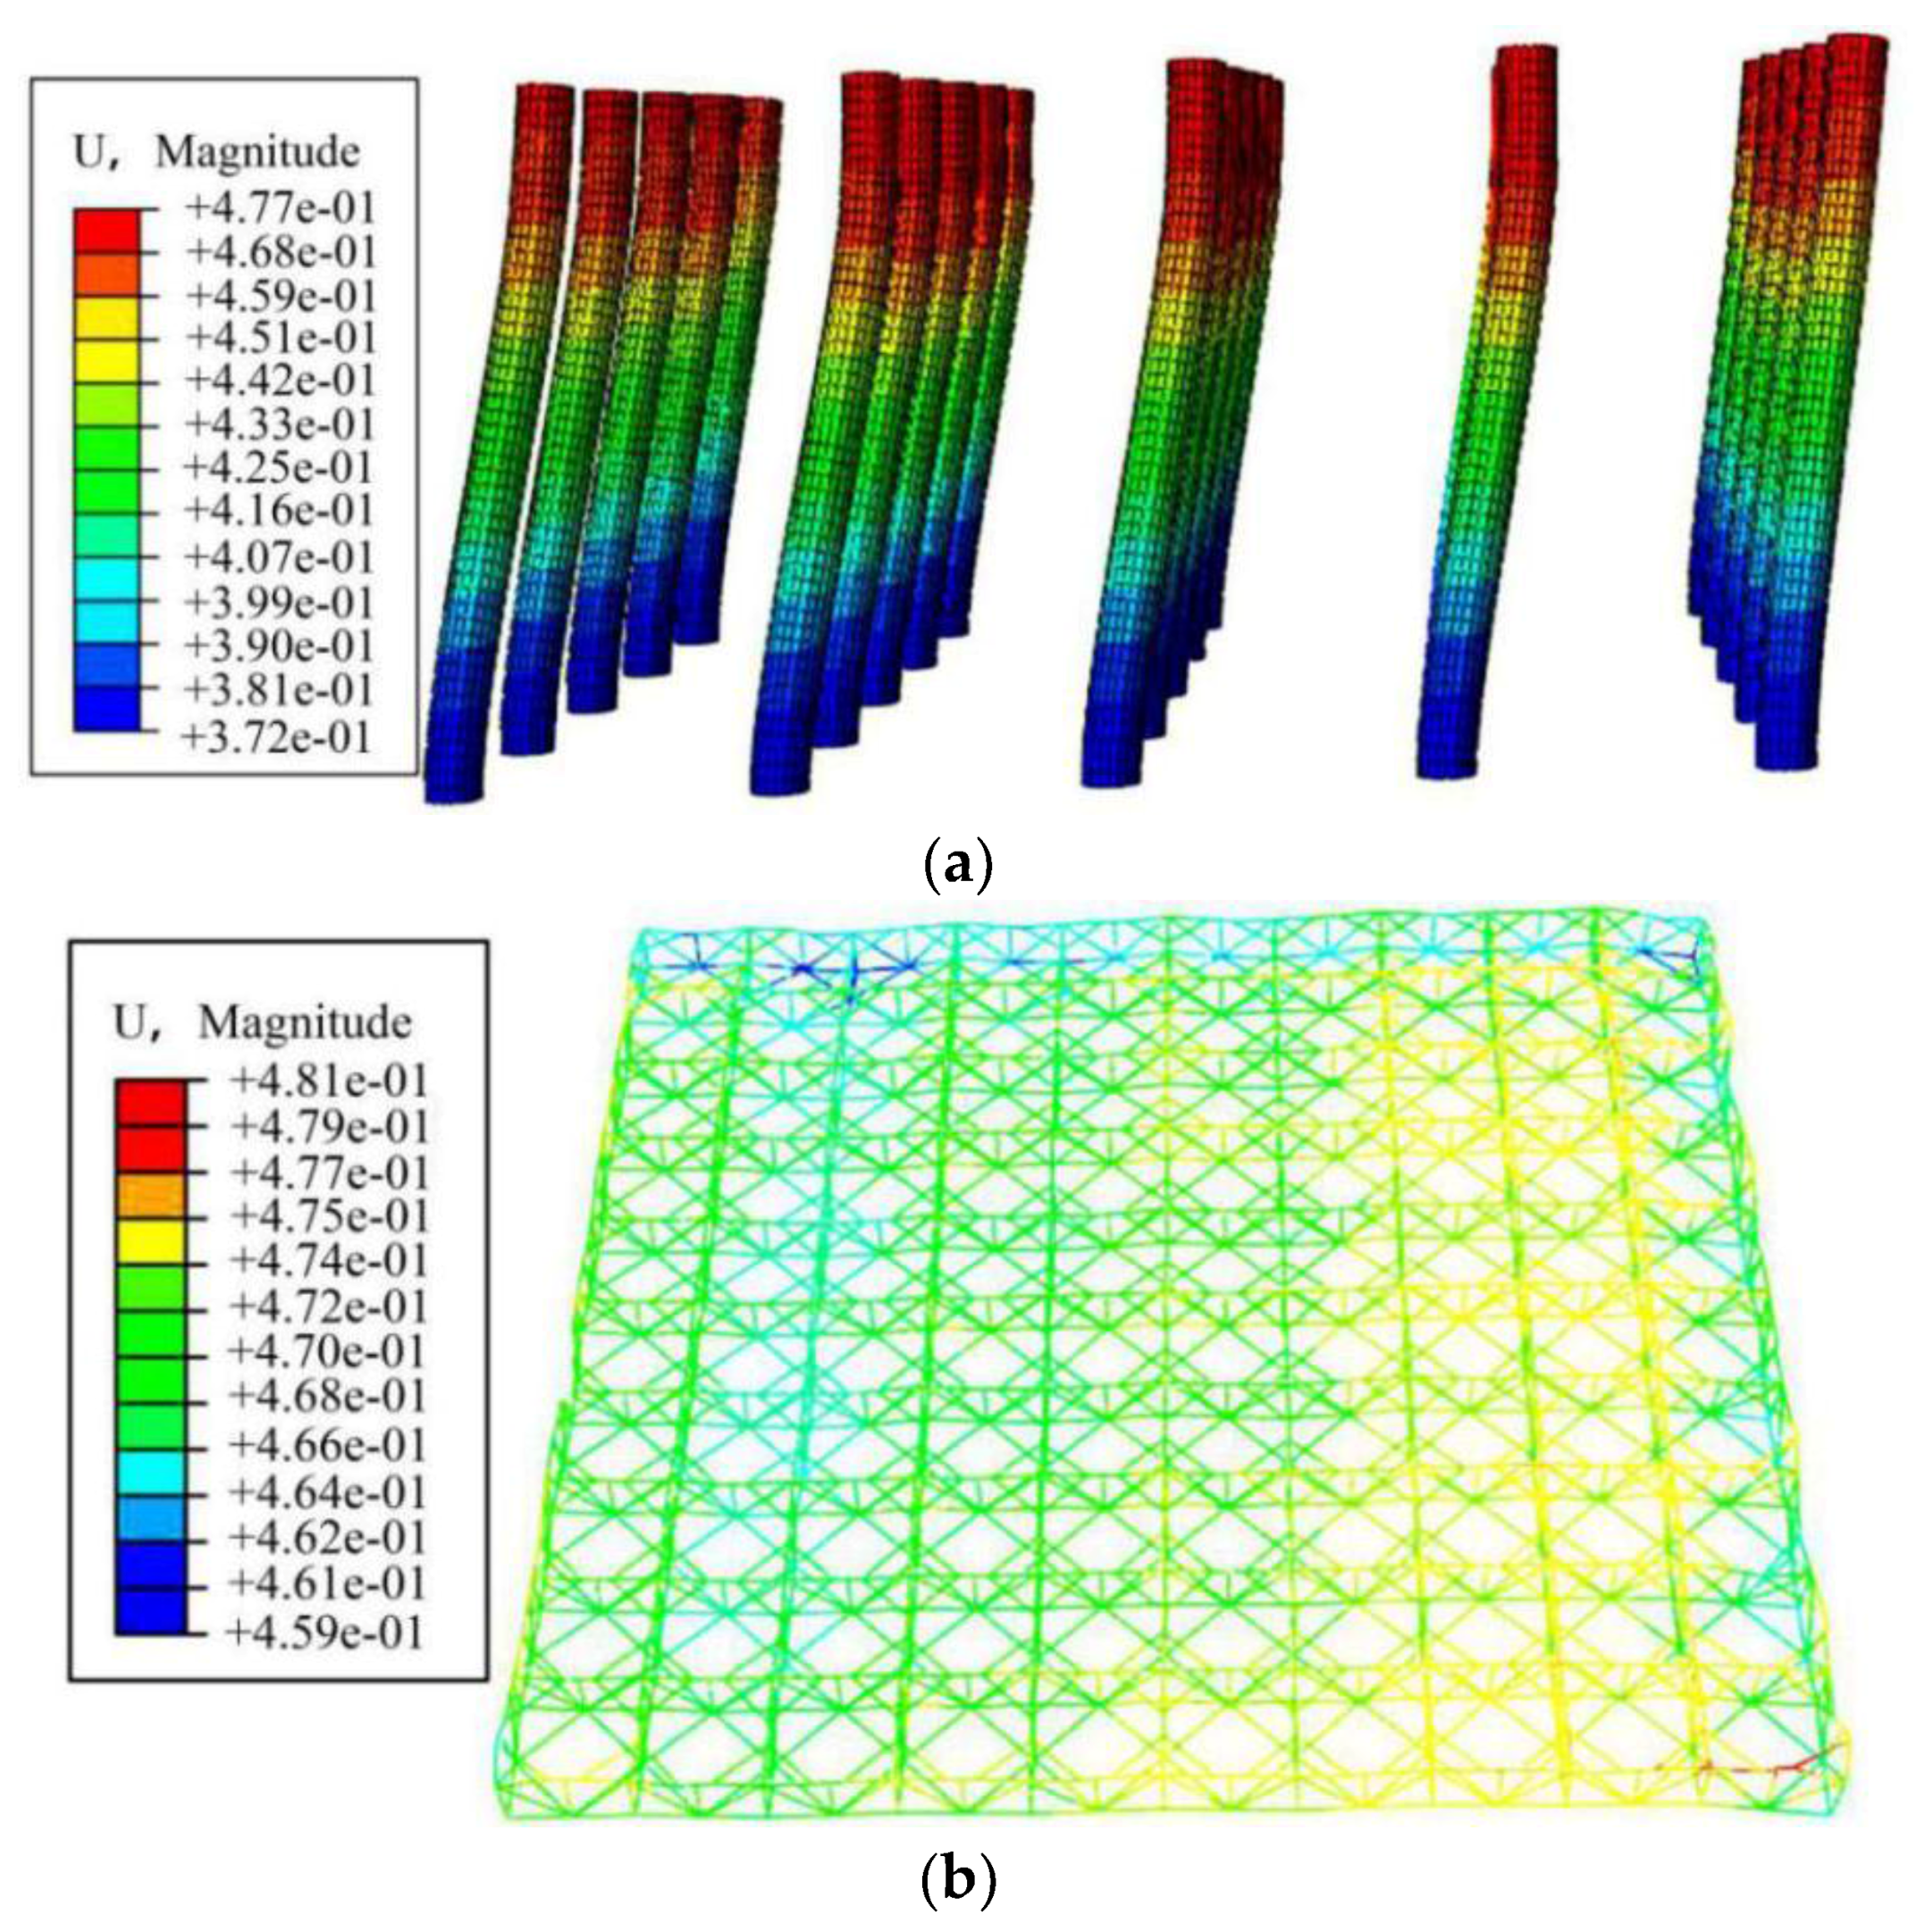
Figure 16 shows the displacement nephograms of RC tubular columns and the steel truss under the rare earthquake with PGA of 0.40 g at the moment when the displacements reached the maximum values. Figure 17 shows the maximum lateral displacement versus height curves under different hazard levels. It can be found that the lateral deformation pattern of this hybrid structure was shear mode. The deformation of steel truss could be recognized as the global translation, because the in-plane deformation of steel truss was very small, as shown in Figure 16b, the difference between the maximum and minimum displacements was only 22 mm. This was due to the rigid-upper-flexible-bottom characteristics of the stiffness distribution along the vertical direction for this kind of hybrid structure. The plastic deformation of this hybrid structure mainly occurred in the RC tubular columns. Therefore, RC tubular columns are the main energy dissipating components for this kind of hybrid structure.
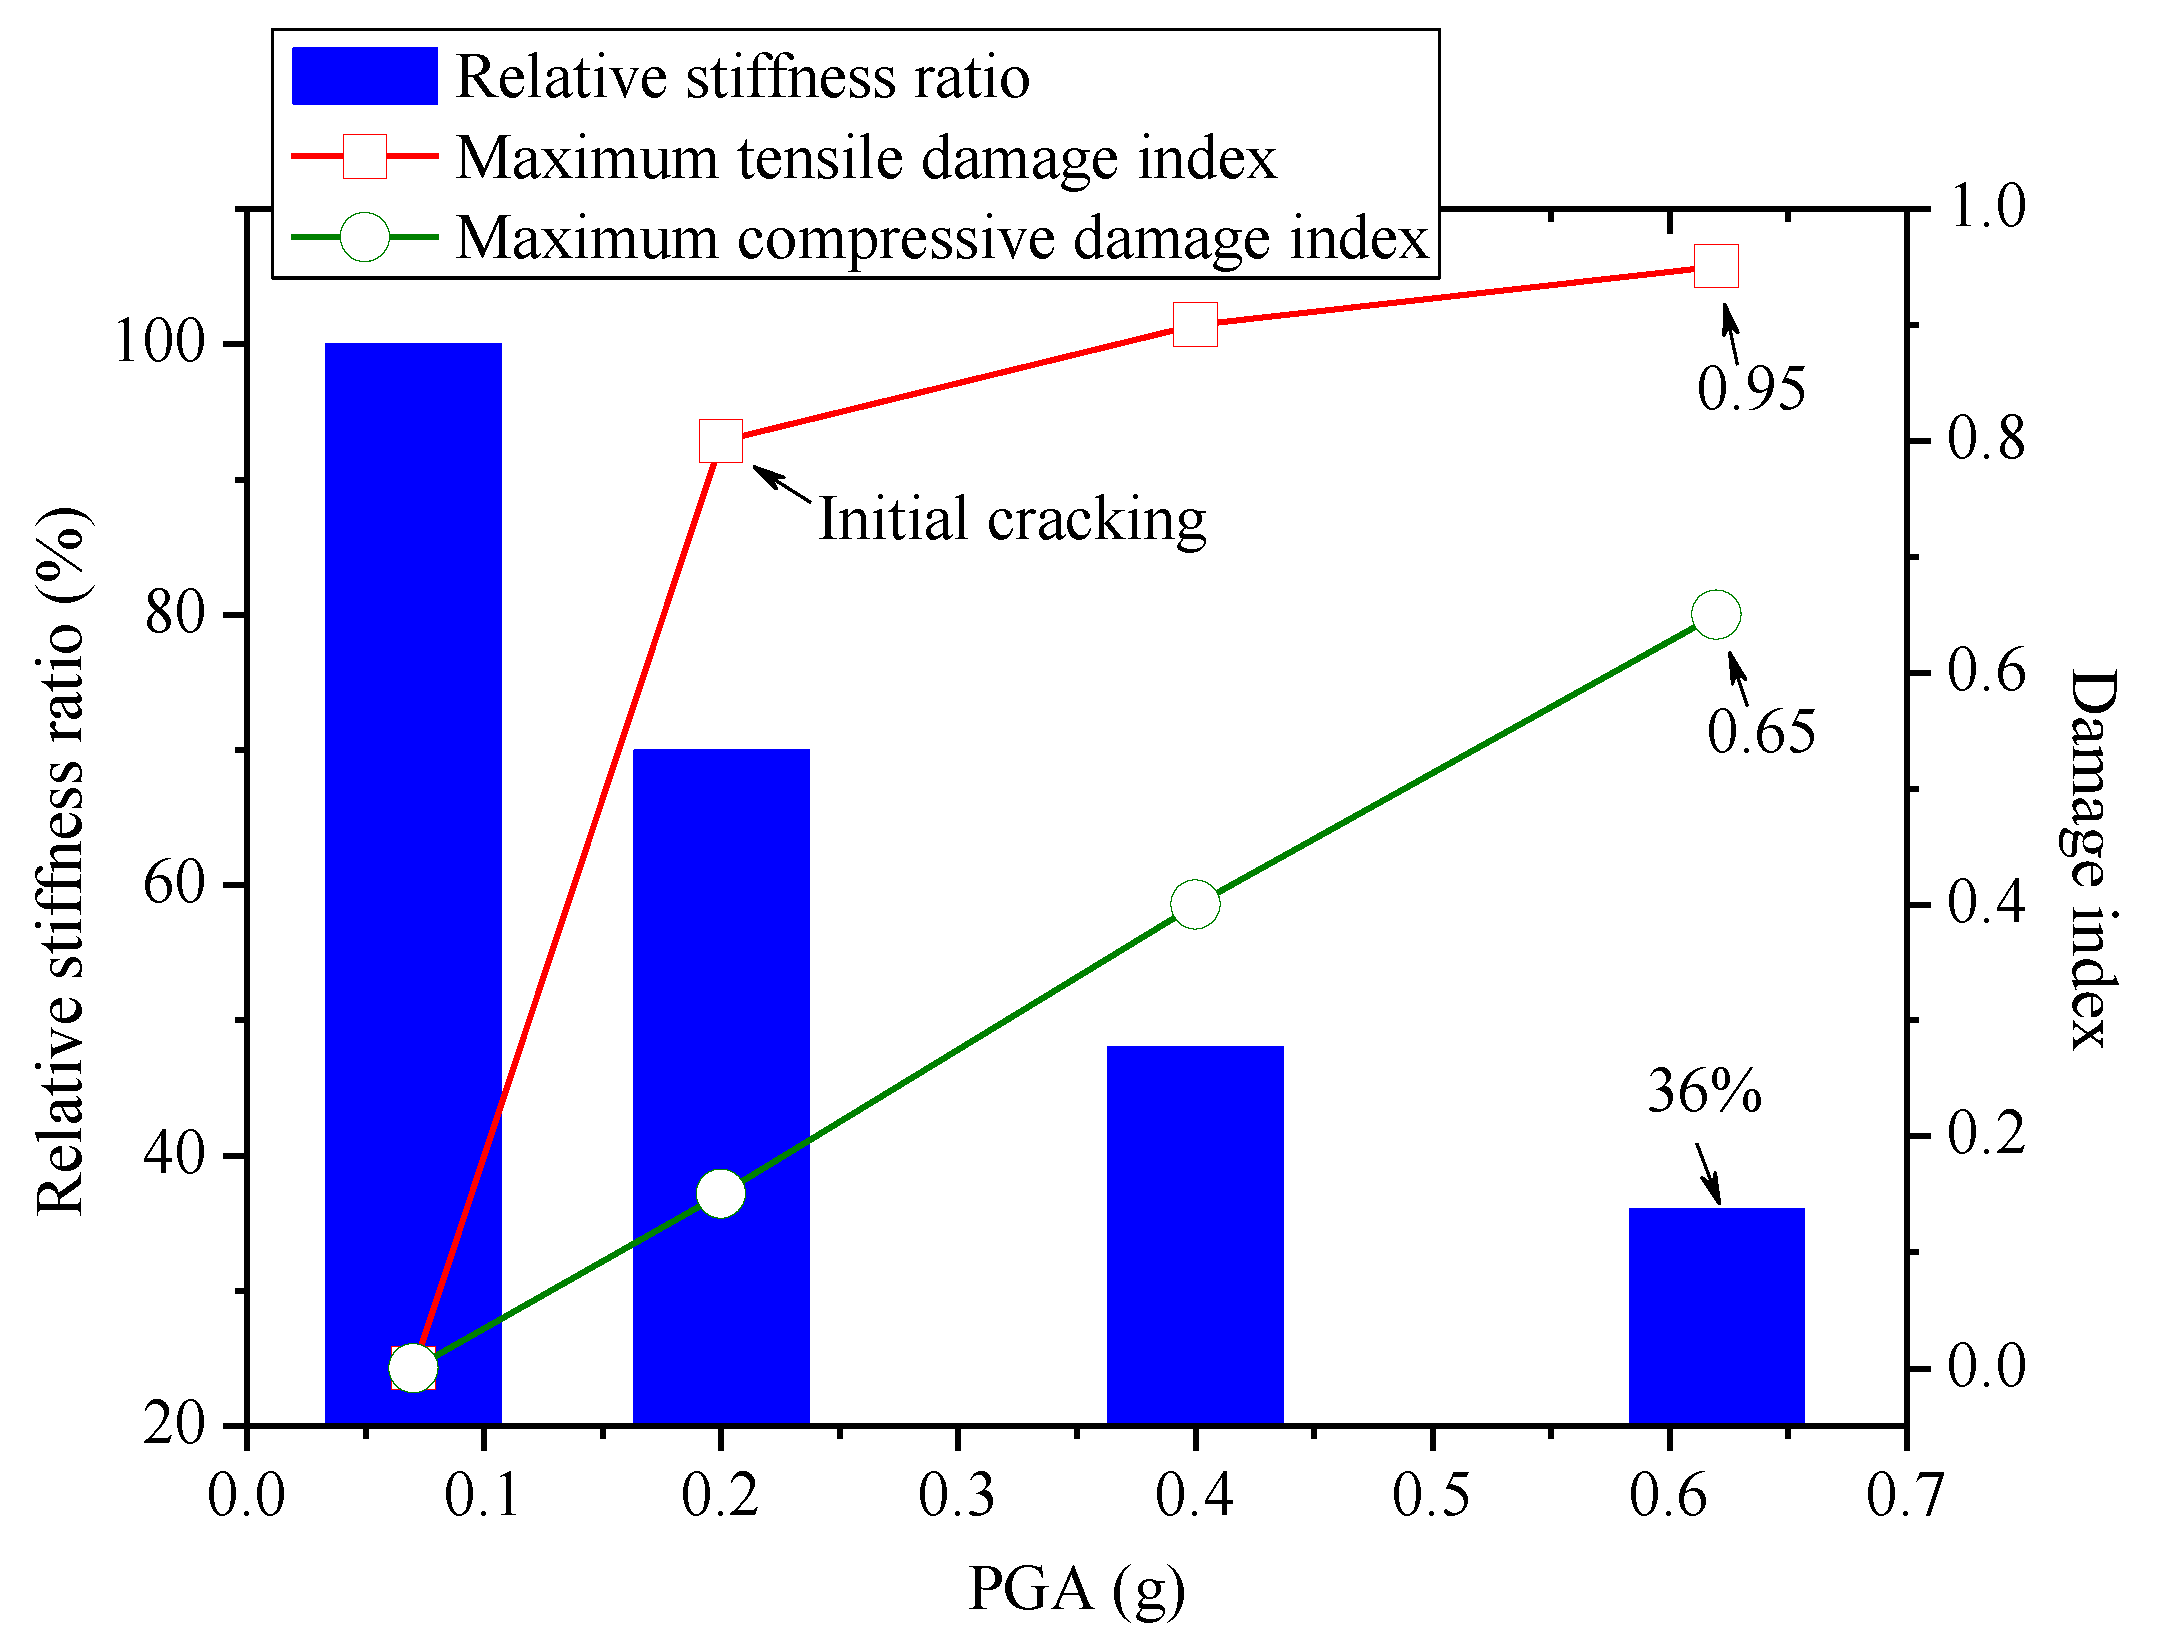
Table 8 summarizes the maximum lateral displacements and drift ratios. The numerical results showed that the maximum roof drift ratios were respectively 0.06%, 0.13%, 0.22% and 0.40% under the frequent earthquake, basic earthquake, rare earthquake and very rare earthquake. Figure 18 shows the maximum stress of steel components, i.e., A-shaped steel frames, steel diagonal braces and steel truss, subjected to different hazard levels of earthquakes. The results indicated that the steel components did not yield, which were in accordance with the PDT results of the model structure. Figure 19 shows the relative stiffness ratios and damage indexes of the structure. It can be found that the lateral stiffness of the structure decreased with the increase of PGA, however, it was still 36% of the initial stiffness under the very rare earthquake. With the increase of PGA, the damage gradually generated and accumulated. When the PGA equaled to 0.62 g which referred to the very rare earthquake having 10−4 probability of exceedance in one year, the maximum tensile damage index was 0.95, indicating that the structure damaged severely but still not collapse. Actually, it is not feasible to evaluate its performance states for this peculiar hybrid structure by reference to general buildings (e.g., frame structures, shear structures) due to lack of the specified allowable limits of maximum drift ratios for this kind of hybrid structure recommended by the seismic design code [22]. However, despite the structural complexity and irregularity, both the experimental and numerical investigations demonstrated that the RC tubular column-steel braced truss hybrid structure could satisfy the seismic design requirements in high intensity regions. Nevertheless, further analysis is needed in order to propose the performance objectives and the criterion for this peculiar steel–concrete hybrid supporting structure. Moreover, damping and dissipative devices, such as the hysteretic dampers, friction dampers, viscous dampers, or any other dissipative devices having a rigid-plastic behavior, might be properly located in the structure to increase the energy dissipative capacity and avoid the yielding of the primary structure constituted by the RC columns and steel truss with A-shaped steel frames [32,33].
5. Conclusions
The experimental and numerical researches were conducted to investigate the seismic performance of a steel–concrete hybrid supporting structure consisting of RC tubular columns and steel braced truss with A-shaped steel frames. The following conclusions can be drawn:
- (1)
- The FE numerical results of the test model structure were in good agreement with the experimental results, indicating that the proposed FE modeling approaches are reasonable to simulate the seismic behavior of the steel braces truss-RC tubular column hybrid structure.
- (2)
- PDTs and FE numerical results showed that the cracks occurred and developed successively on the bottom of column, the lower part of corbel and the upper part of corbel with the increase of PGA. The measured strains showed that the steel truss and diagonal braces did not yield during the PDTs, which coincided with the expected design results.
- (3)
- PDTs results showed that the specimen had obvious stiffness deterioration characteristics resulted from the cracks occurring and propagation on RC tubular columns. When PGA was greater than 0.20 g, the speed of stiffness deterioration then slowed. When the PGA came up 0.40 g, the stiffness was about 60% of the initial stiffness. After PGA equaled to 0.80 g, the stiffness was about 41% of the initial value. Correspondingly, with the increase of PGA, the fundamental period and damping ratio increased, while the dynamic magnification factor decreased.
- (4)
- The FE numerical results of the prototype structure showed that the first fundamental period was 1.216 s and the corresponding vibration mode was torsion. The period ratio between the first torsion period and the first translation period of this hybrid structure was about 1.02, which was larger than specified limit value of 0.85 in China seismic design code. This indicated that the torsion effect should not be neglected in the design of this kind of hybrid structure. In addition, the numerical results showed that the shear-weight ratio of this hybrid structure is 0.058, which was larger than 0.032, indicating that the shear force distribution of this hybrid structure meets the requirements of the design code.
- (5)
- The overall lateral deformation pattern of this hybrid structure was shear mode. The maximum drift ratios of this hybrid structure subjected to different hazard levels of earthquakes were obtained. Under the very rare earthquake, the structure damaged severely, however, the stiffness was still 36% of the initial stiffness and the maximum tensile damage index was about 0.95 which was less than 1, indicating that this hybrid structure could keep upright and not collapse under the severe earthquake. Overall, the RC tubular column-steel braced truss hybrid structure could meet the seismic design requirements with respect to the high-intensity earthquakes.
- (6)
- Further analysis is needed in order to propose the performance objectives and the criterion for this peculiar steel–concrete hybrid supporting structure. Moreover, damping and dissipative devices, such as the hysteretic dampers, friction dampers, viscous dampers, or any other dissipative devices having a rigid-plastic behavior, might be properly located in the structure to increase the energy dissipative capacity and avoid the yielding of the primary structure constituted by the steel truss and RC columns.
Acknowledgments
The authors gratefully acknowledge the support for this research from the National Natural Science Foundation of China (NSFC, Grant No. 51708037), China Postdoctoral Science Foundation (Grant No. 2017M610616) and Shanxi Province Postdoctoral Science Foundation (Grant No. 2017BSHEDZZ111).
Author Contributions
Bo Wang designed the study, modeled the structure, analyzed the data and wrote the paper; Tao Wu designed the experimental program; Huijuan Dai performed the experiments; Guoliang Bai contributed to the conception of this paper.
Conflicts of Interest
The authors declare no conflict of interest.
References
- Hajjar, J.F. Composite steel and concrete structural systems for seismic engineering. J. Constr. Steel Res. 2002, 58, 703–723. [Google Scholar] [CrossRef]
- Deierlein, G.G.; Noguchi, H. Overview of US-Japan research on the seismic design of composite reinforced concrete and steel moment frame structures. J. Struct. Eng. 2004, 130, 361–367. [Google Scholar] [CrossRef]
- Dall’Asta, A.; Leoni, G.; Morelli, F.; Salvatore, W.; Zona, A. An innovative seismic-resistant steel frame with reinforced concrete infill walls. Eng. Struct. 2017, 141, 144–158. [Google Scholar] [CrossRef]
- Dall’Asta, A.; Leoni, G.; Zona, A.; Hoffmeister, B.; Bigelow, H.; Degée, H.; Braham, C.; Bogdan, T.; Salvatore, W.; Morelli, F.; et al. Innovative Hybrid and Composite Steel-Concrete Structural Solutions for Building in Seismic Area; Final Report, EUR 26932 EN; European Commission: Brussels, Belgium, 2015. [Google Scholar] [CrossRef]
- Jiang, H.J.; Li, S.R.; Zhu, Y.L. Seismic performance of high-rise buildings with energy-dissipation outriggers. J. Constr. Steel Res. 2017, 134, 80–91. [Google Scholar] [CrossRef]
- Nguyen, Q.H.; Tran, V.T.; Hjiaj, M. Hybrid RC-steel members under bending and shear: Experimental investigation and design model. J. Constr. Steel Res. 2017, 138, 837–850. [Google Scholar] [CrossRef]
- Ding, Y.; Wu, M.; Xu, L.H.; Zhu, H.T.; Li, Z.X. Seismic damage evolution of steel–concrete hybrid space-frame structures. Eng. Struct. 2016, 119, 1–12. [Google Scholar] [CrossRef]
- Wang, B.; Bai, G.L.; Dai, H.J.; Zhu, J.N.; Li, H.X. Study on mechnical performance of T-type strong-beam weak-column variable-column SRC joints under low-cyclic reversed loading. China Civ. Eng. J. 2014, 47, 47–58. (In Chinese) [Google Scholar]
- Wang, B.; Bai, G.L.; Liu, L.; Dai, H.J. Elastic-plastic seismic response and anti-seismic lines of SRC frame-bent hybrid structure. J. Vib. Shock 2014, 33, 46–52. (In Chinese) [Google Scholar]
- Bai, G.L.; Zhu, L.H.; Zhao, C.L.; Li, H.X. Model test on behavior of direct air cooled condenser support plat form under service load and earthquake action. J. Build. Struct. 2008, 10, 42–49. (In Chinese) [Google Scholar]
- Yao, Z.L.; Bai, G.L.; Dang, F.N.; Li, H.X. Study on seismic behavior of a steel truss-reinforced concrete column structure. J. Build. Struct. 2011, 32, 30–36. (In Chinese) [Google Scholar]
- Nakashima, M.; Kato, H.; Takaoka, E. Development of real-time pseudo dynamic testing. Earthq. Eng. Struct. Dyn. 1992, 21, 79–92. [Google Scholar] [CrossRef]
- Chang, S.Y.; Chen, T.W.; Yang, C.H. Pseudo dynamic technique to obtain reliable shock response. Int. J. Struct. Stab. Dyn. 2014, 14, 1350050. [Google Scholar] [CrossRef]
- Mahin, S.; Shing, P.B. Pseudo dynamic method for seismic testing. J. Struct. Eng. 1985, 111, 1482–1503. [Google Scholar] [CrossRef]
- Khoo, H.H.; Tsai, K.C.; Tsai, C.Y.; Cheng, Y.T.; Wang, K.J. Bidrectional substructure pseudo-dynamic tests and analysis of a full-scale two-story buckling-restrained braced frame. Earthq. Eng. Struct. Dyn. 2016, 45, 1085–1107. [Google Scholar] [CrossRef]
- Wang, B.; Dai, H.J.; Wu, T.; Bai, G.L.; Bai, Y.T. Experimental investigation on seismic behavior of steel truss-RC column hybrid structure with steel diagonal braces. Appl. Sci. 2018, 8, 131. [Google Scholar] [CrossRef]
- Jiang, H.J.; Fu, B.; Liu, L.; Yin, X.W. Study on seismic performance of a super tall steel-concrete hybrid structure. Struct. Des. Tall Spec. Build. 2014, 23, 334–349. [Google Scholar] [CrossRef]
- Amadio, C.; Bedon, C.; Fasan, M. Numerical assessment of slab-interaction effects on the behaviour of steel-concrete composite joints. J. Constr. Steel Res. 2017, 139, 397–410. [Google Scholar] [CrossRef]
- Yan, J.B.; Li, Z.X.; Xie, J. Numerical and parametric studies on steel-elastic concrete composite structures. J. Constr. Steel Res. 2017, 133, 84–96. [Google Scholar] [CrossRef]
- Amadio, C.; Bedon, C.; Fasan, M.; Pecce, M.R. Refined numerical modelling for the structural assessment of steel-composite beam-to-column joints under seismic loads. Eng. Struct. 2017, 138, 394–409. [Google Scholar] [CrossRef]
- Xing, Y.; Han, Q.H.; Xu, J.; Guo, Q.; Wang, Y.H. Experimental and numerical study on static behavior of elastic concrete-steel composite beams. J. Constr. Steel Res. 2016, 123, 79–92. [Google Scholar] [CrossRef]
- Ministry of Housing and Urban-Rural Development of the People’s Republic of China. Code for Seismic Design of Buildings (GB 50011-2010); China Architecture and Building Press: Beijing, China, 2016. (In Chinese)
- General Administration of Quality Supervision, Inspection and Quarantine of the People’s Republic of China; Standardization Administration of the People’s Republic of China. Seismic Ground Motion Parameters Zonation Map of China (GB 18306-2015); China Zhijian Publishing House: Beijing, China; China Standards Press: Beijing, China, 2015. (In Chinese)
- Kumar, S.; Itoh, Y.; Saizuka, K.; Usami, T. Pseudo dynamic Testing of Scaled Models. J. Struct. Eng. 1997, 123, 524–526. [Google Scholar] [CrossRef]
- Nascimbene, R. Numerical model of a reinforced concrete building: Earthquake analysis and experimental validation. Period. Polytech. Civ. Eng. 2015, 59, 521–530. [Google Scholar] [CrossRef]
- Nascimbene, R. Towards non-standard numerical modeling of thin-shell structures: Geometrically linear formulation. Int. J. Comput. Methods Eng. Sci. Mech. 2014, 15, 126–141. [Google Scholar] [CrossRef]
- Brunesi, E.; Nascimbene, R. Extreme response of reinforced concrete buildings through fiber force-based finite element analysis. Eng. Struct. 2014, 69, 206–215. [Google Scholar] [CrossRef]
- Nascimbene, R. An arbitrary cross section, locking free shear-flexible curved beam finite element. Int. J. Comput. Methods Eng. Sci. Mech. 2013, 14, 90–103. [Google Scholar] [CrossRef]
- Ministry of Housing and Urban-Rural Development of the People’s Republic of China. Code for Design of Concrete Structures (GB50010-2010); China Architecture and Building Press: Beijing, China, 2011. (In Chinese)
- Sidoroff, F. Description of Anisotropic Damage Application to Elasticity. IUTAM Colloquium on Physical Nonlinearities in Structural Analysis; Springer: Berlin, Germany, 1981; pp. 237–244. [Google Scholar]
- Ministry of Housing and Urban-Rural Development of the People’s Republic of China. Technical Specification for Concrete Structures of Tall Building (IGJ3-2010); China Architecture and Building Press: Beijing, China, 2010. (In Chinese)
- Longo, A.; Montuori, R.; Piluso, V. Failure mode control and seismic response of dissipative truss moment frames. J. Struct. Eng. 2012, 138, 1388–1397. [Google Scholar] [CrossRef]
- Longo, A.; Montuori, R.; Piluso, V. Theory of plastic mechanism control of dissipative truss moment frames. Eng. Struct. 2012, 37, 63–75. [Google Scholar] [CrossRef]
Figure 1.
Photos of a practical supporting structure with diagonal braces: (a) Global structure; (b) A-shaped steel frames resting on the steel truss.
Figure 1.
Photos of a practical supporting structure with diagonal braces: (a) Global structure; (b) A-shaped steel frames resting on the steel truss.

Figure 2.
Structural layouts of prototype structure (unit: mm): (a) Plan layouts of columns; (b) Elevation view along the A-shaped frame direction; (c) Elevation view perpendicular to A-shaped frame direction.
Figure 2.
Structural layouts of prototype structure (unit: mm): (a) Plan layouts of columns; (b) Elevation view along the A-shaped frame direction; (c) Elevation view perpendicular to A-shaped frame direction.

Figure 3.
Layouts and dimensions of test specimen (unit: mm): (a) Sub-structure selected from the prototype structure; (b) Plan layout of reinforced concrete (RC) tubular columns; (c) Elevation view along the direction of A-shaped frames.
Figure 3.
Layouts and dimensions of test specimen (unit: mm): (a) Sub-structure selected from the prototype structure; (b) Plan layout of reinforced concrete (RC) tubular columns; (c) Elevation view along the direction of A-shaped frames.

Figure 4.
Steel arrangements of the RC tubular column (in mm).

Figure 5.
Cross sections of members in steel truss (unit: mm): (a) Elevation view of plane trusses in ①, ⑤, , axises; (b) Elevation view of plane trusses in ②, ④, , axises; (c) Elevation view of plane trusses in ③, axises (The axises were designated in Figure 3).
Figure 5.
Cross sections of members in steel truss (unit: mm): (a) Elevation view of plane trusses in ①, ⑤, , axises; (b) Elevation view of plane trusses in ②, ④, , axises; (c) Elevation view of plane trusses in ③, axises (The axises were designated in Figure 3).

Figure 6.
Test setup.

Figure 7.
Schematic of finite element (FE) model for the test specimen: (a) Whole model; (b) Photo of actual connection between the diagonal brace and column; (c) Simplification of the brace-to-column connection; (d) Photo of actual truss-to-column connection; (e) Simplification of the truss-to-column connection.

Figure 8.
Measured strains versus base shear force of the steel truss and diagonal braces under the final loading case of PDTs with PGA of 0.80 g.
Figure 8.
Measured strains versus base shear force of the steel truss and diagonal braces under the final loading case of PDTs with PGA of 0.80 g.

Figure 9.
Observed cracking patterns of tubular columns at the end of PDTs: (a) Bottom of column; (b) Lower part of corbel; (c) Upper part of corbel.
Figure 9.
Observed cracking patterns of tubular columns at the end of PDTs: (a) Bottom of column; (b) Lower part of corbel; (c) Upper part of corbel.

Figure 10.
Numerical results of tensile damage patterns of tubular columns: (a) At the end of loading case with PGA (peak ground acceleration) of 0.20 g; (b) At the end of loading case with PGA of 0.60 g.
Figure 10.
Numerical results of tensile damage patterns of tubular columns: (a) At the end of loading case with PGA (peak ground acceleration) of 0.20 g; (b) At the end of loading case with PGA of 0.60 g.

Figure 11.
Comparison of time-history lateral displacement responses between the FE simulation and test results: (a) Top of A-shaped frame under 0.40 g; (b) Middle part of truss under 0.40 g; (c) Middle part of column under 0.40 g; (d) Top of A-shaped frame under 0.20 g, 0.40 g and 0.60 g.
Figure 11.
Comparison of time-history lateral displacement responses between the FE simulation and test results: (a) Top of A-shaped frame under 0.40 g; (b) Middle part of truss under 0.40 g; (c) Middle part of column under 0.40 g; (d) Top of A-shaped frame under 0.20 g, 0.40 g and 0.60 g.


Figure 12.
Relative stiffness ratio and relative ratios of dynamic characteristic parameters under PDTs.
Figure 12.
Relative stiffness ratio and relative ratios of dynamic characteristic parameters under PDTs.

Figure 13.
FE model of the prototype structure.

Figure 14.
Vibration mode shapes: (a) First mode (torsional vibration); (b) Second mode (vibration direction is perpendicular to the A-shaped frame direction); (c) Third mode (vibration direction is along the A-shaped frame direction).
Figure 14.
Vibration mode shapes: (a) First mode (torsional vibration); (b) Second mode (vibration direction is perpendicular to the A-shaped frame direction); (c) Third mode (vibration direction is along the A-shaped frame direction).

Figure 15.
Time-history response curves subjected to different PGAs: (a) Base shear force; (b) Roof lateral displacement.
Figure 15.
Time-history response curves subjected to different PGAs: (a) Base shear force; (b) Roof lateral displacement.

Figure 16.
Displacement nephograms of RC tubular columns and the steel truss under the rare earthquake at the moment when the displacements reached the maximum values (unit: m; the deformation scale factor is 100): (a) Columns; (b) Truss.
Figure 16.
Displacement nephograms of RC tubular columns and the steel truss under the rare earthquake at the moment when the displacements reached the maximum values (unit: m; the deformation scale factor is 100): (a) Columns; (b) Truss.

Figure 17.
Maximum lateral displacements versus height curves subjected to different hazard levels.

Figure 18.
Maximum stress of the steel components of structure subjected to different hazard levels.
Figure 18.
Maximum stress of the steel components of structure subjected to different hazard levels.

Figure 19.
Relative stiffness ratios and maximum damage indexes of the structure subjected to different hazard levels.
Figure 19.
Relative stiffness ratios and maximum damage indexes of the structure subjected to different hazard levels.


Table 1.
Cross sectional properties of structural components.
| Component | Material | Location | Cross Section (mm) | |
|---|---|---|---|---|
| Tubular column | Concrete (C40) | External diameter | 4000 | |
| Wall thickness | 400 | |||
| Steel rebar | Longitudinal rebar | Φ25 (HRB400) | ||
| Circular stirrup | Φ10 (HPB300) | |||
| Truss | Steel (Q345B) | Web member | Diagonal | Φ273 × 10 |
| Vertical | Φ180 × 6 | |||
| Chord member | Lower | HW300 × 305 | ||
| Upper | HW350 × 350 | |||
| Diagonal brace | Steel (Q345B) | – | 口450 × 450 × 30 | |
| A-shaped frame | Steel (Q345B) | Horizontal beam | HN390 × 300 × 10 | |
| Diagonal column | HM300 × 200 × 8 | |||
Table 2.
Material properties of steels used in the test specimen.
| Material | Position of Sampling | Section (mm) | Yield Strength Fy (MPa) | Ultimate Strength Fu (MPa) | Modulus of Elasticity (N/mm2) | |
|---|---|---|---|---|---|---|
| Steel rebar | Tubular column | Stirrup | φ8 | 325 | 435 | 2.0 × 10⁵ |
| Longitudinal rebar | φ10 | 532 | 656 | |||
| Steel tube | Truss | Diagonal web member | 40 × 2.5 | 432 | 463 | |
| 40 × 2.0 | 380 | 445 | ||||
| Vertical web member | 50 × 2.5 | 400 | 430 | |||
| 50 × 2.0 | 382 | 453 | ||||
| Chord member | 50 × 2.5 | 400 | 430 | |||
| Diagonal brace | 70 × 3.5 | 365 | 420 | |||
| A-shaped frame | Horizontal beam | 30 × 1.5 | 323 | 403 | ||
| Diagonal column | 40 × 1.5 | 375 | 480 | |||
Table 3.
Cracking details of the column C1 under pseudo-dynamic tests (PDTs).
| PGA (g) | Maximum Roof Drift Ratio (%) | Base Part of Column | Upper Part of Corbel | Lower Part of Corbel | ||||
|---|---|---|---|---|---|---|---|---|
| Cracks Distribution Height (m) | Number of New Cracks | Cracks Distribution Height (m) | Number of New Cracks | Cracks Distribution Height (m) | Number of New Cracks | |||
| + | − | |||||||
| 0.20 | 0.10 | 0.10 | 0~1.1 | 8 | 311th loading step | —— | ||
| 0~0.5 | 4 | |||||||
| 0.30 | 0.13 | 0.12 | 0~1.8 | 12 | 0~0.5 | 2 | ||
| 0.40 | 0.16 | 0.15 | 0~1.8 | 7 | 0~0.7 | 3 | ||
| 0.60 | 0.22 | 0.21 | 0~2.0 | 6 | 0~1.0 | 5 | 0~0.5 | 3 |
| 0.80 | 0.36 | 0.40 | 0~2.0 | 5 | 0~1.0 | 4 | 0~0.5 | 6 |
Table 4.
Test results of maximum lateral displacements and drift ratios on the top of A-shaped frame.
Table 4.
Test results of maximum lateral displacements and drift ratios on the top of A-shaped frame.
| PGA (g) | Forward Loading Direction (+) | Backward Loading Direction (−) | ||
|---|---|---|---|---|
| Maximum Lateral Displacement (mm) | Maximum Roof Drift Ratio (%) | Maximum Lateral Displacement (mm) | Maximum Roof Drift Ratio (%) | |
| 0.05 | 1.28 | 0.02 | 0.97 | 0.01 |
| 0.10 | 2.05 | 0.03 | 1.52 | 0.02 |
| 0.20 | 8.23 | 0.10 | 8.07 | 0.10 |
| 0.30 | 10.70 | 0.13 | 9.77 | 0.12 |
| 0.40 | 12.72 | 0.16 | 11.73 | 0.14 |
| 0.60 | 17.99 | 0.22 | 16.66 | 0.21 |
| 0.80 | 29.07 | 0.36 | 32.29 | 0.40 |
Table 5.
Dynamic characteristic parameters and lateral stiffness of the specimen subjected to different PGAs.
Table 5.
Dynamic characteristic parameters and lateral stiffness of the specimen subjected to different PGAs.
| PGA (g) | Fundamental Period (s) | Damping Ratio (%) | Dynamic Magnification Factor | Lateral Stiffness (kN/mm) |
|---|---|---|---|---|
| 0.05 | 0.31 | 4.78 | 1.60 | 9.63 |
| 0.10 (Level 1) | 0.35 | 4.93 | 1.59 | 9.04 |
| 0.20 (Level 2) | 0.46 | 6.95 | 1.52 | 6.47 |
| 0.30 | 0.48 | 6.96 | 1.50 | 6.18 |
| 0.40 (Level 3) | 0.49 | 6.97 | 1.44 | 5.78 |
| 0.60 (Level 4) | 0.53 | 8.57 | 1.29 | 4.98 |
| 0.80 | 0.59 | 12.19 | 1.18 | 3.95 |
Table 6.
Numerical results of dynamic characteristics.
| Mode Number | Period (s) | Vibration Mode | Participating Mass Coefficient | ||
|---|---|---|---|---|---|
| X Direction | Y Direction | RZ Direction | |||
| 1 | 1.216 | Torsion | 0.023 | 0.000 | 0.964 |
| 2 | 1.194 | Y-direction translation | 0.950 | 0.000 | 0.026 |
| 3 | 1.185 | X-direction translation | 0.001 (0.974) | 1.000 (1.000) | 0.000 (0.990) |
Note: The value in the bracket is the accumulated participating mass coefficient.
Table 7.
Base shear forces and shear-weight ratios under different earthquake intensity levels.
| Hazard Level (PGA) | Frequent Earthquake (0.07 g) | Basic Earthquake (0.20 g) | Rare Earthquake (0.40 g) | Very Rare Earthquake (0.62 g) | ||||
|---|---|---|---|---|---|---|---|---|
| Loading direction | Positive (+) | Negative (−) | Positive (+) | Negative (−) | Positive (+) | Negative (−) | Positive (+) | Negative (−) |
| Base shear force (kN) | 19,823 | 17,730 | 32,253 | 35,736 | 43,745 | 43,732 | 60,916 | 63,447 |
| Shear-weight ratio | 0.065 | 0.058 | 0.105 | 0.117 | 0.143 | 0.143 | 0.199 | 0.207 |
Table 8.
Summary of maximum lateral displacements and drift ratios.
| Hazard Level (PGA) | Maximum Lateral Displacement (mm) | Maximum Drift Ratio (%) | ||||
|---|---|---|---|---|---|---|
| Top of A-Shaped Frame | Top of Truss | Top of Column | Top of A-Shaped Frame | Top of Truss | Top of Column | |
| Frequent earthquake (0.07 g) | 36.55 | 28.74 | 28.79 | 0.06 | 0.05 | 0.06 |
| Basic earthquake (0.20 g) | 82.94 | 73.55 | 70.38 | 0.13 | 0.13 | 0.14 |
| Rare earthquake (0.40 g) | 142.49 | 140.91 | 138.85 | 0.22 | 0.26 | 0.28 |
| Very rare earthquake (0.62 g) | 262.12 | 257.28 | 250.93 | 0.40 | 0.47 | 0.50 |
© 2018 by the authors. Licensee MDPI, Basel, Switzerland. This article is an open access article distributed under the terms and conditions of the Creative Commons Attribution (CC BY) license (http://creativecommons.org/licenses/by/4.0/).
Share and Cite
MDPI and ACS Style
Wang, B.; Wu, T.; Dai, H.; Bai, G. Numerical Study on the Seismic Performance of a Steel–Concrete Hybrid Supporting Structure in Thermal Power Plants. Appl. Sci. 2018, 8, 294. https://0-doi-org.brum.beds.ac.uk/10.3390/app8020294
AMA Style
Wang B, Wu T, Dai H, Bai G. Numerical Study on the Seismic Performance of a Steel–Concrete Hybrid Supporting Structure in Thermal Power Plants. Applied Sciences. 2018; 8(2):294. https://0-doi-org.brum.beds.ac.uk/10.3390/app8020294
Chicago/Turabian StyleWang, Bo, Tao Wu, Huijuan Dai, and Guoliang Bai. 2018. "Numerical Study on the Seismic Performance of a Steel–Concrete Hybrid Supporting Structure in Thermal Power Plants" Applied Sciences 8, no. 2: 294. https://0-doi-org.brum.beds.ac.uk/10.3390/app8020294
Note that from the first issue of 2016, this journal uses article numbers instead of page numbers. See further details here.