Acoustic Emission/Seismicity at Depth Beneath an Artificial Lake after the 2011 Tohoku Earthquake

Graduate School of Engineering, Tohoku University, 6-6-04, Aramaki Aza Aoba, Aoba-ku, Sendai 980-8579, Japan
Appl. Sci. 2018, 8(8), 1407; https://0-doi-org.brum.beds.ac.uk/10.3390/app8081407
Submission received: 20 July 2018
/
Revised: 10 August 2018
/
Accepted: 16 August 2018
/
Published: 20 August 2018
(This article belongs to the Special Issue Structural Health Monitoring of Large Structures Using Acoustic Emission–Case Histories)
Abstract
:Acoustic emission (AE)/seismicity activity increased near the city of Sendai, Japan, after the 11 March 2011 Tohoku earthquake in a newly seismically active region near the Nagamachi-Rifu fault, which caused a magnitude 5.0 earthquake in 1998. The source of this activity was around 12 km beneath an artificial lake. At the same time, activity on the Nagamachi-Rifu fault nearly ceased. More than 1550 micro-earthquakes were observed between 11 March 2011 and 1 August 2012, of which 63% exhibited similar waveforms and defined 64 multiplets. It appears that crustal extension of about 2 m during the Tohoku earthquake and additional extension of about 1 m during the following year changed the stress field in this region, thus generating micro-earthquakes and controlling their frequency. However, it has been presumed that crustal movement during the Tohoku earthquake did not affect the direction of principal stress, and that these events induced repeated quasi-static slips at asperities and the resultant micro-earthquakes.
1. Introduction
Acoustic emission (AE)/seismicity is important for evaluating the stability of geological structures; for instance, the delineation of fracture systems from AE activity in geothermal reservoirs is indispensable for thermal energy extraction [1]. The stability evaluation of fractures during hydraulic stimulation in geothermal reservoirs is necessary to avoid inducing large AE events, where the relationship between large AE events and the pore-pressure distribution in reservoirs is studied [2]. The stability of geological structures is also important from the viewpoint of disaster prevention. The dynamic behavior of geological structures has been studied by many seismologists who have examined repeating earthquakes and slow slip at seismic zones [3,4,5].
The 11 March 2011 Tohoku earthquake and its many aftershocks brought widespread destruction to eastern Japan [6,7,8]. This seismic activity occurred on both offshore and inland faults. Although thrust events dominated seismicity before and during the Tohoku earthquake, eastward movement of the shallow crust of the overriding tectonic plate caused extension that relaxed the subduction-related horizontal compressional stress locally, resulting in normal movement on some inland faults after the Tohoku earthquake [9].
Close observations of seismic activity are indispensable for the monitoring of the stability of geological structures. This paper describes a seismic swarm that occurred beneath an artificial lake near the plane of an active fault in Sendai city, Japan, after the Tohoku earthquake. It has long been known that changes in the water level of reservoirs can trigger substantial earthquakes, and it is shown that the seismic activity was sensitive to the small change of tectonic stress caused by the water level of the artificial lake.
2. Study Area
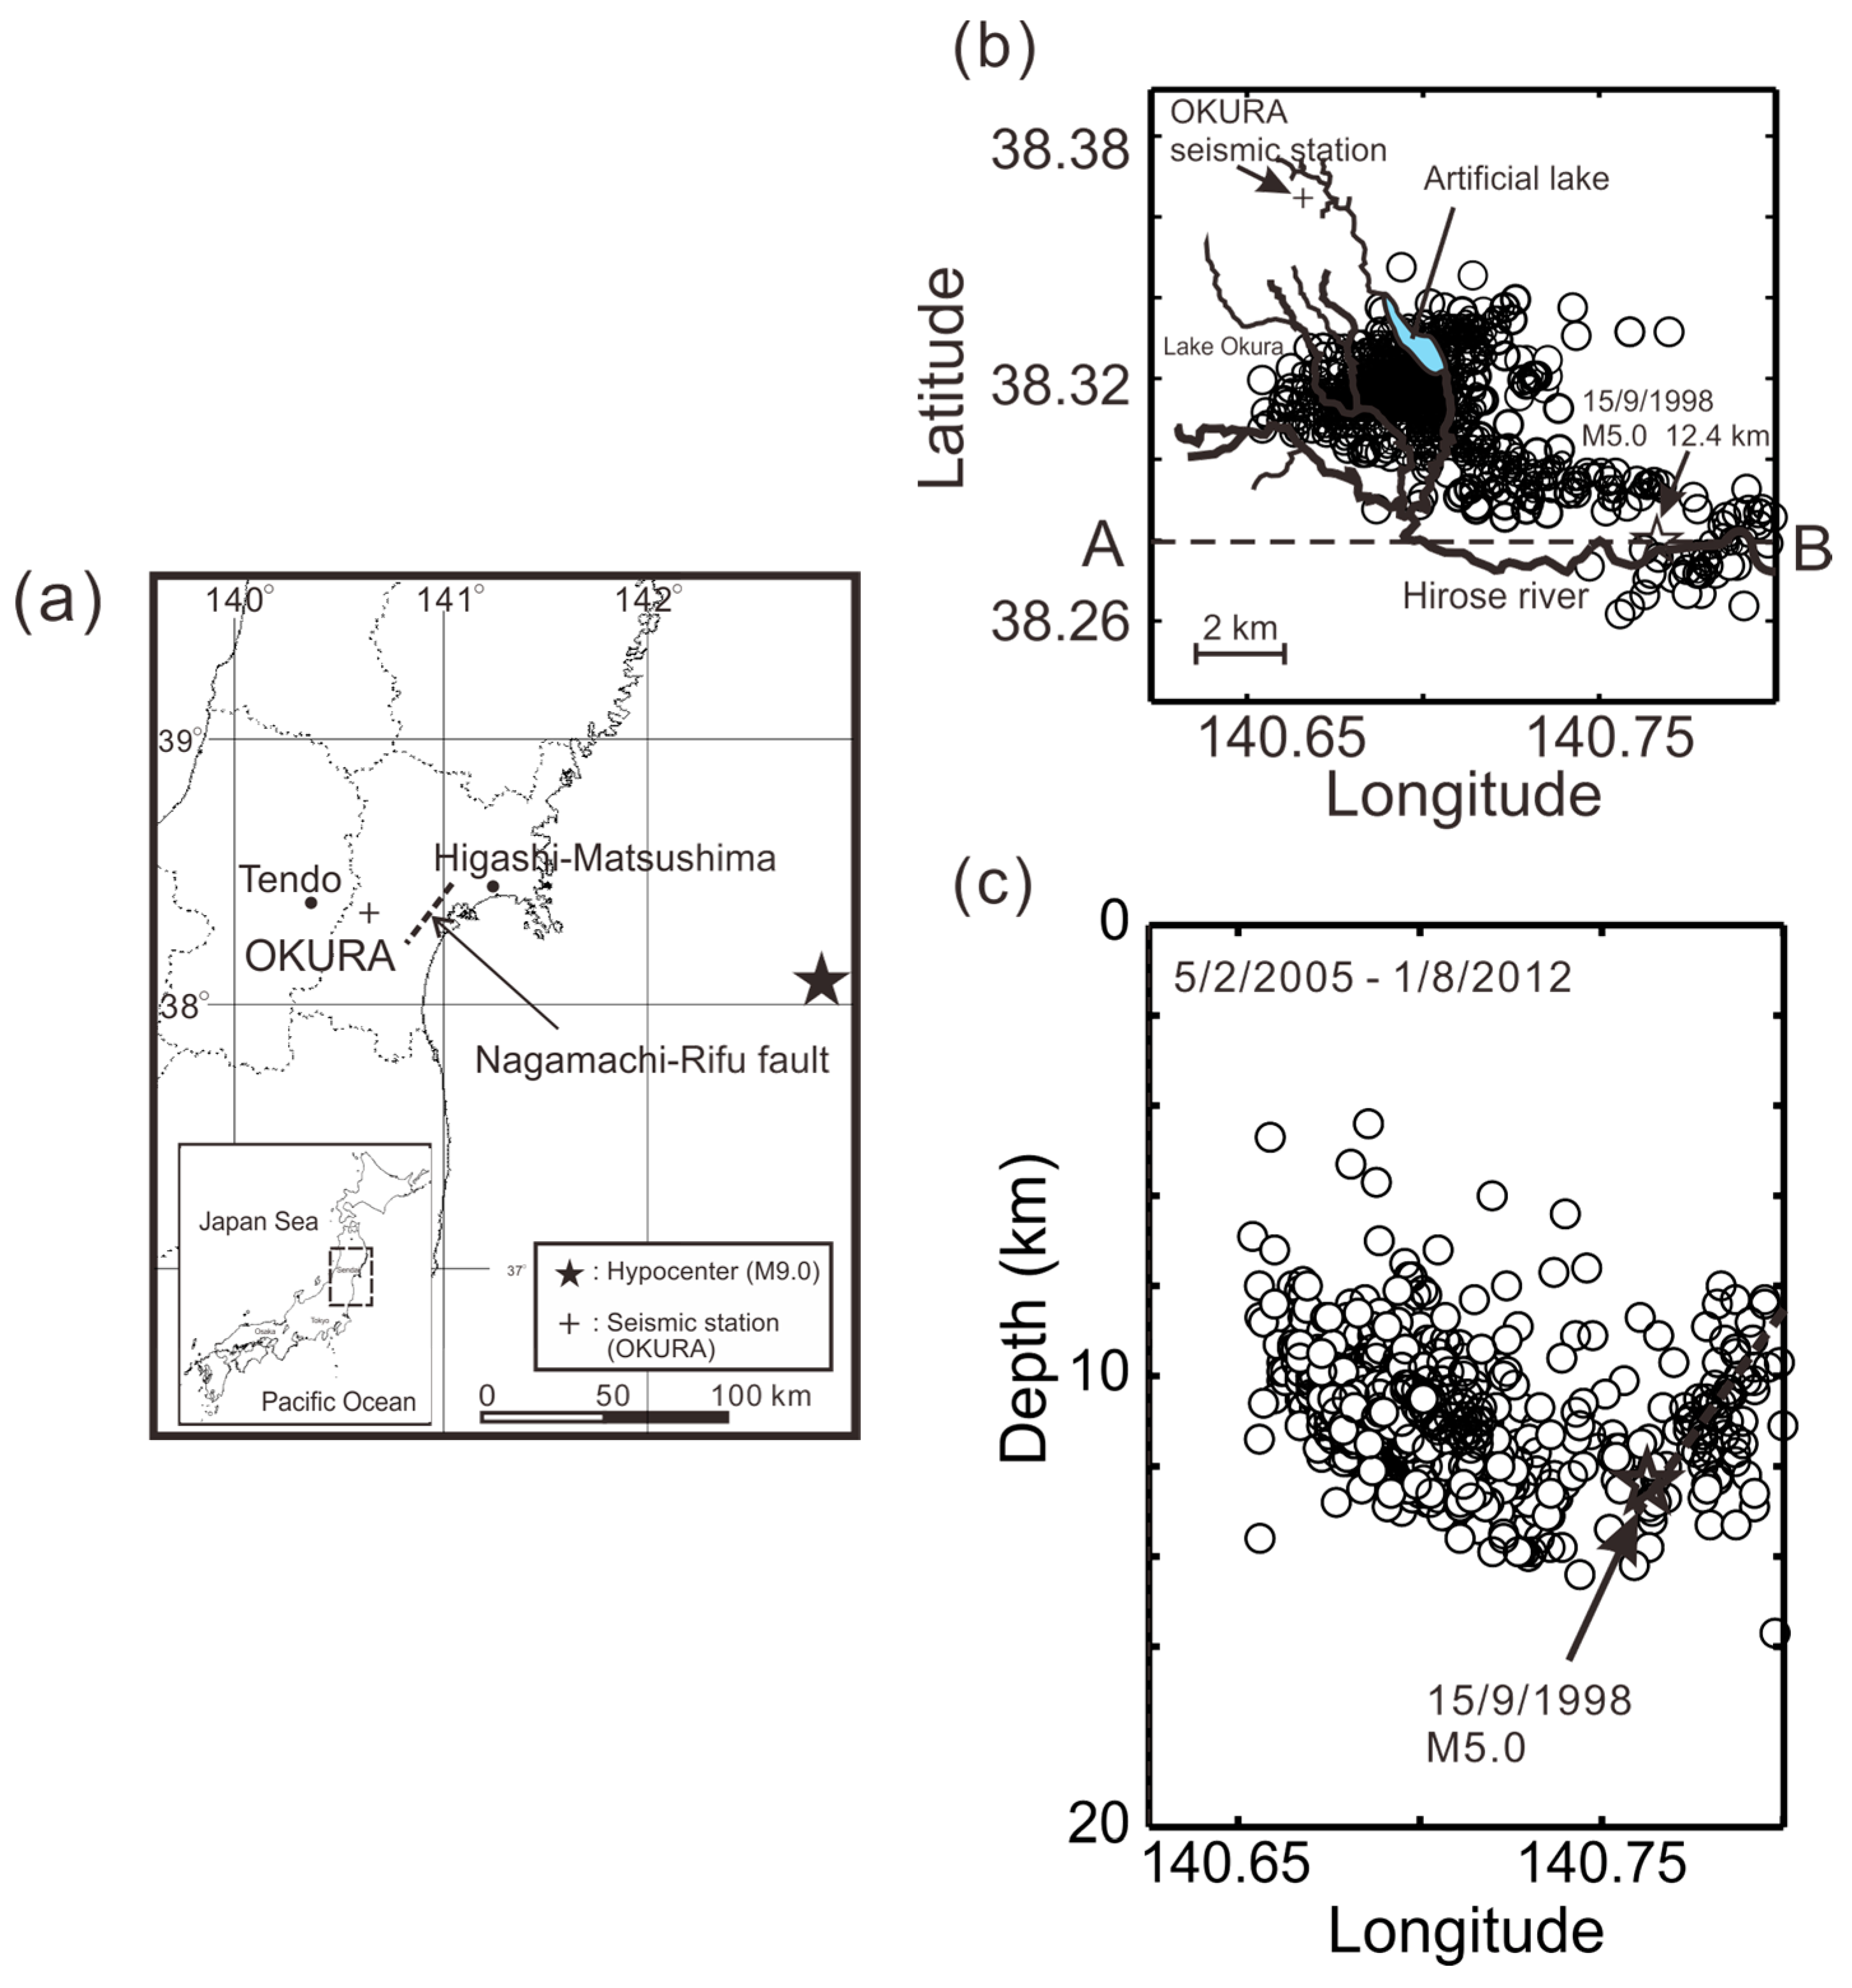
The study area is in the western part of Sendai city, Miyagi Prefecture, Japan, about 150 km west of the Tohoku earthquake epicenter (Figure 1a). Here, a river terrace is present on both sides of the Hirose River. A double arch dam, built across a tributary to the Hirose River in 1961, created a reservoir named Lake Okura, with a 1.6 km2 surface area and a storage capacity of 2.8 × 10⁷ m3. The water level is normally maintained between 240 and 270 m above sea level (masl), which corresponds to water depths of 0 to 30 m (Miyagi Prefecture, http://www.pref.miyagi.jp/snd-dam/data/okdam-cyosui.htm). The Nagamachi-Rifu fault extends approximately 15 km under Sendai city, striking northeast–southwest and dipping about 45° to the northwest [10,11]. Estimates of the stress field made by the multiple inverse method [12] indicate that the direction of minimum principal stress is vertical and the direction of maximum principal stress varies from east–west to northwest–southeast.
At Sendai city, very high seismic intensities (greater than 6 on the Japan Meteorological Agency scale) were recorded during the Tohoku earthquake. GPS (Global Positioning System) data documented crustal movements of more than 5 m at the coast and about 2.5 m in Sendai city. The Nagamachi-Rifu fault is known to be active in the Sendai area [10,13,14]. Seismic activity increased near this fault after the Tohoku earthquake, and more than 1550 events were observed between 11 March 2011 and 1 August 2012. A micro-earthquake is physically the same to as an AE and the term “AE” is generally used for much smaller seismic events with smaller magnitude, and this paper discusses the stability of geological structures using micro-earthquakes in the same manner.
3. Tectonic Conditions before and after the Tohoku Earthquake
On 15 September 1998, an earthquake of magnitude (M) 5.0 occurred at a 12.4 km depth, on the deepest part of the Nagamachi-Rifu fault [14]. The mechanism of this earthquake and its aftershocks was reverse faulting, and the P-axes of the events described a line oriented east–west to northwest–southeast; the maximum principal stress direction in the deep part of the active fault was northwest–southeast.
On the basis of GPS data from an observation point about 6 km southeast of the dam, the Geospatial Information Authority of Japan (GSI) reported crustal movement of 2.55 m eastward and 16 cm ground subsidence during the Tohoku earthquake (e.g., [15]). The GSI also measured eastward crustal movements of 1.85 m in Tendo city, 30 km to the west, and 3.98 m in Higashi-Matsushima city, 70 km to the east (GSI, http://www.gsi.go.jp/index.html; Figure 1a). From these data plus the assumption of an elastic rock mass in the area, the strain change resulting from the Tohoku earthquake was estimated to be 2.13 × 10⁻⁵ in the study area. Eastward crustal movement around Sendai continued after the earthquake, reaching about 1 m during the following year (GSI; http://www.gsi.go.jp/cais/chikakuhendo40012.html).
It appears that the direction of maximum principal stress in the study area was roughly east–west both before and after the Tohoku earthquake [7]. However, at the Kamaishi mine, ≈170 km northeast of Sendai, horizontal displacement of 3.3 m was observed during the Tohoku earthquake [16]. In situ measurements of tectonic stress at the mine documented a large change in the stress field in the shallow crust in the two years after the Tohoku earthquake, with the principal stress decreasing in the east–west direction and increasing in the north–south direction [16].
The evidence suggests that although the Tohoku earthquake caused large changes of the stress field in some parts of the shallow crust, changes in the orientation of the stress field at seismogenic depths were small in the study area, which implies that the stress field in the study area still favors reverse faulting.
4. AE Activity before and after the Tohoku Earthquake
A large number of micro-earthquakes were recorded in western Sendai city from 5 February 2005 to 1 August 2012, a period spanning the time of the Tohoku earthquake (Figure 1). The distribution of hypocenters defines two areas of AE activity, largely corresponding to seismic events before and after the Tohoku earthquake, respectively (Figure 2 and Figure 3).
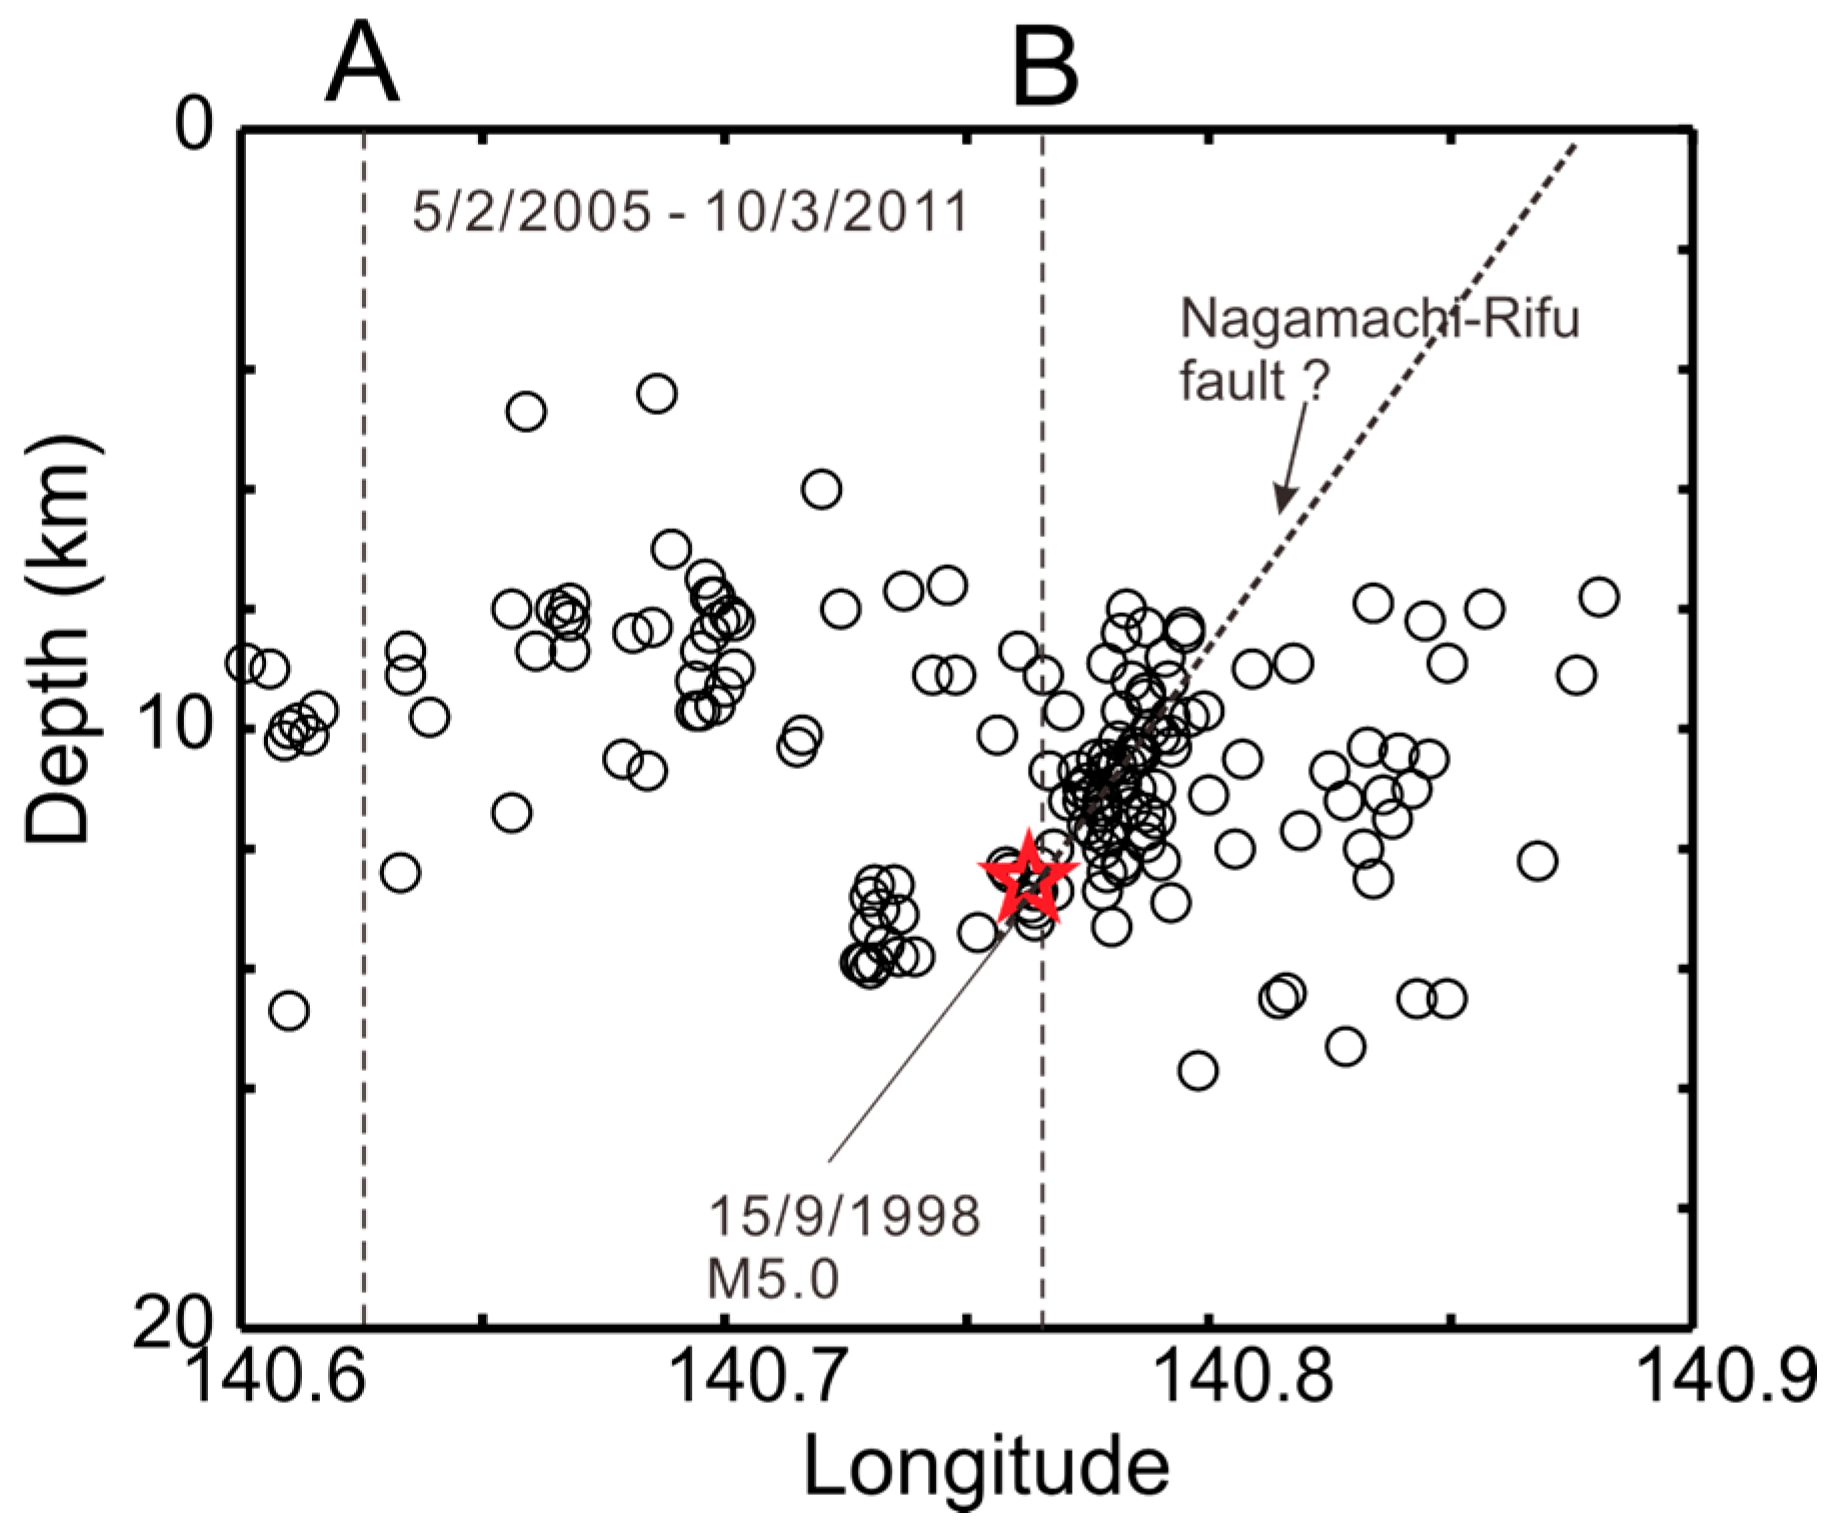
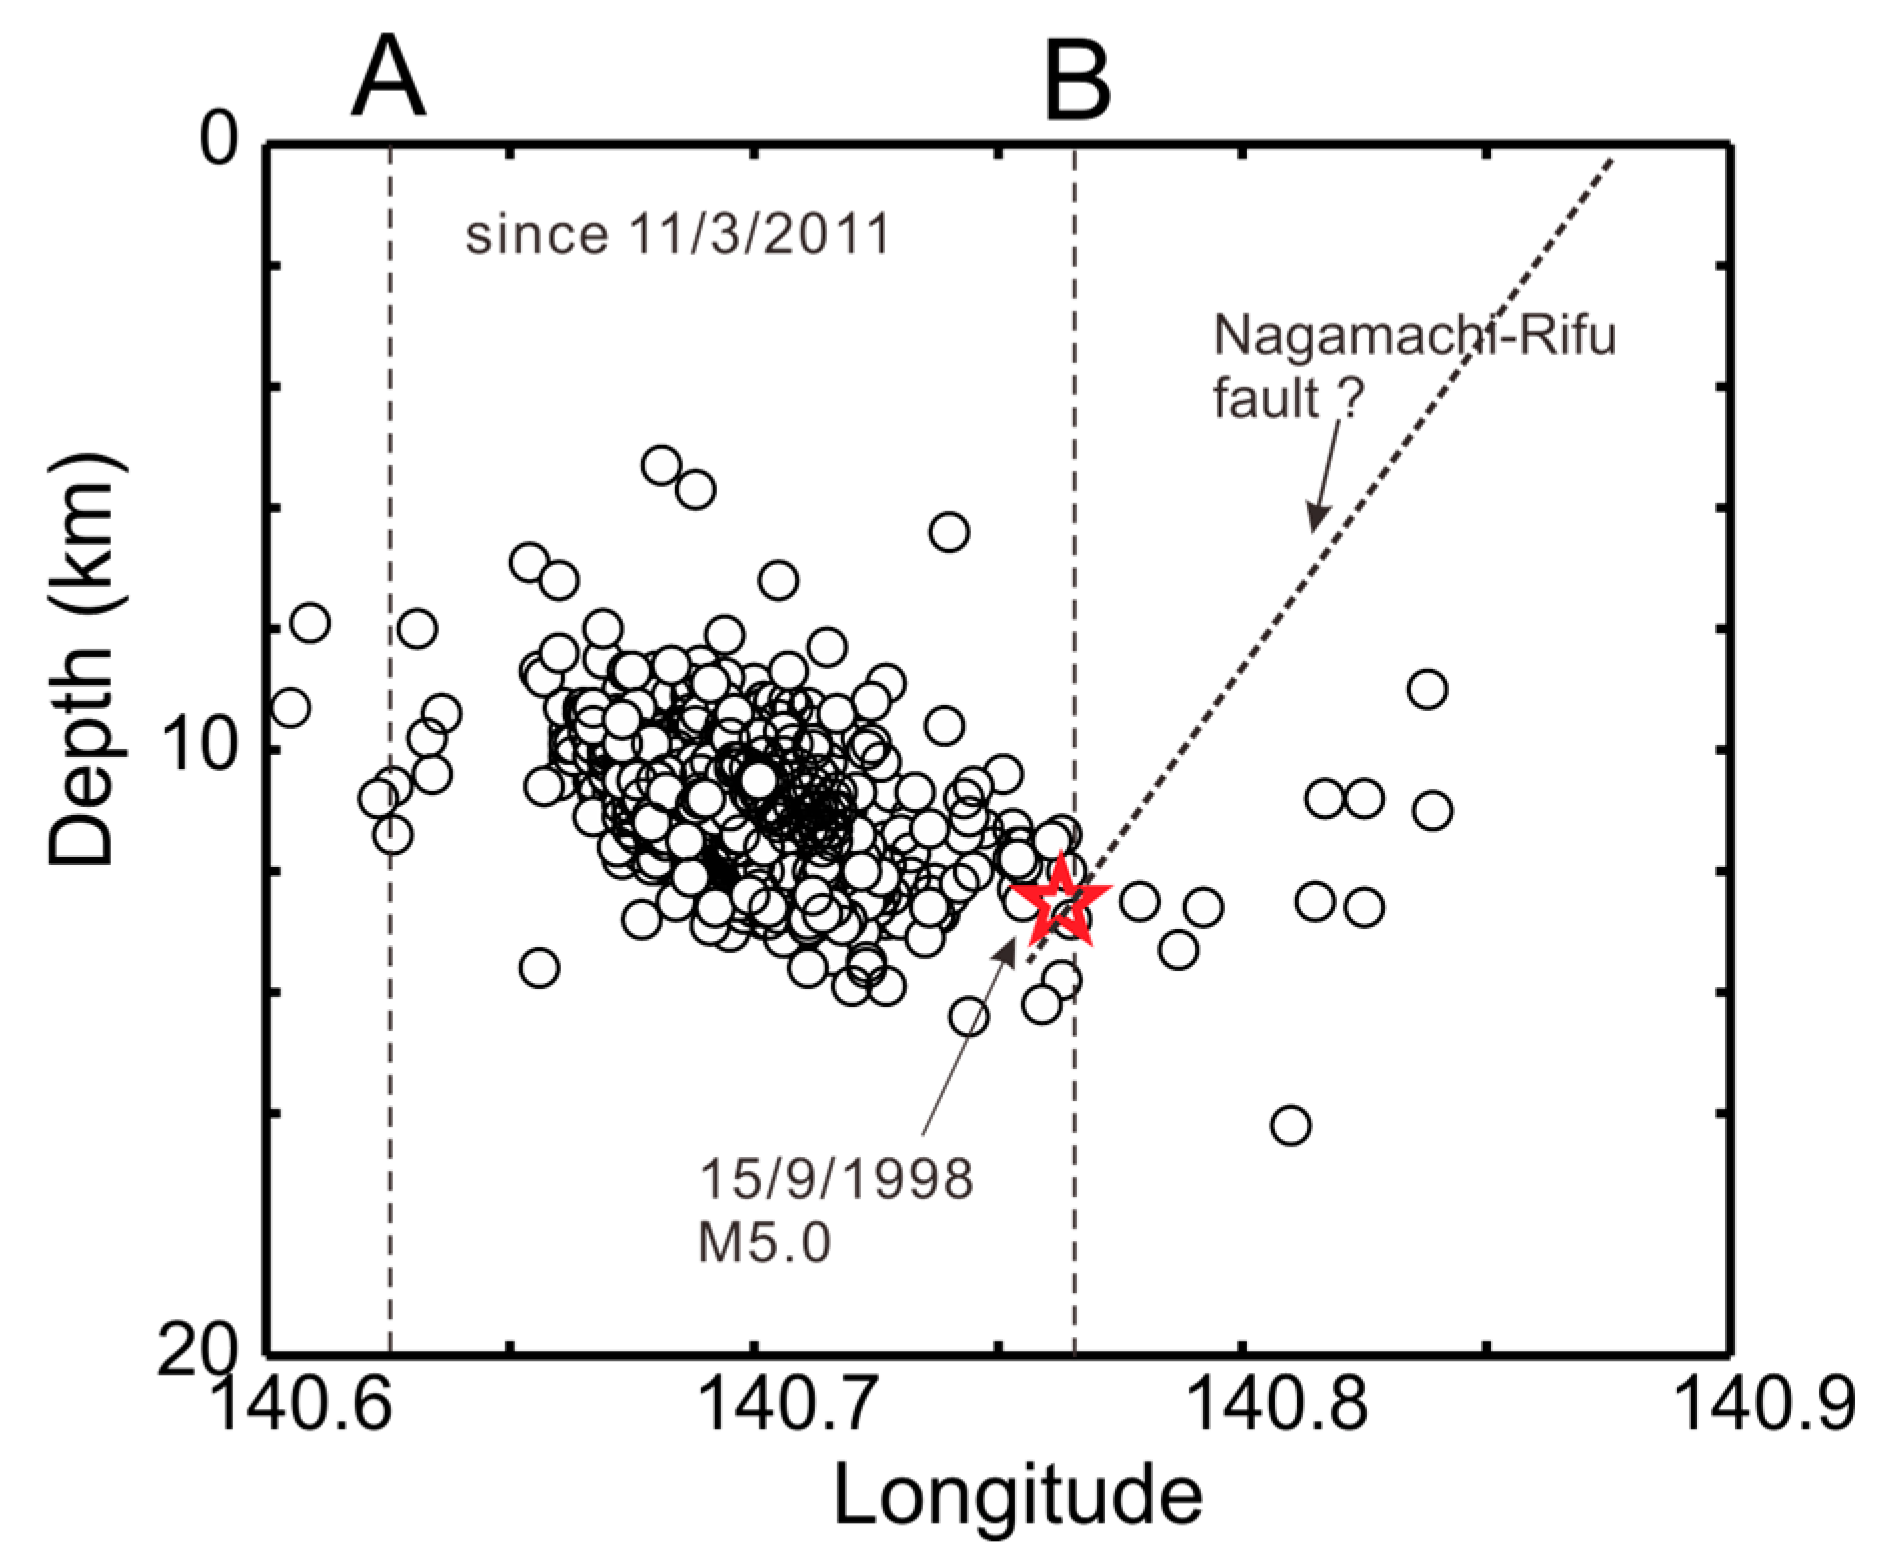
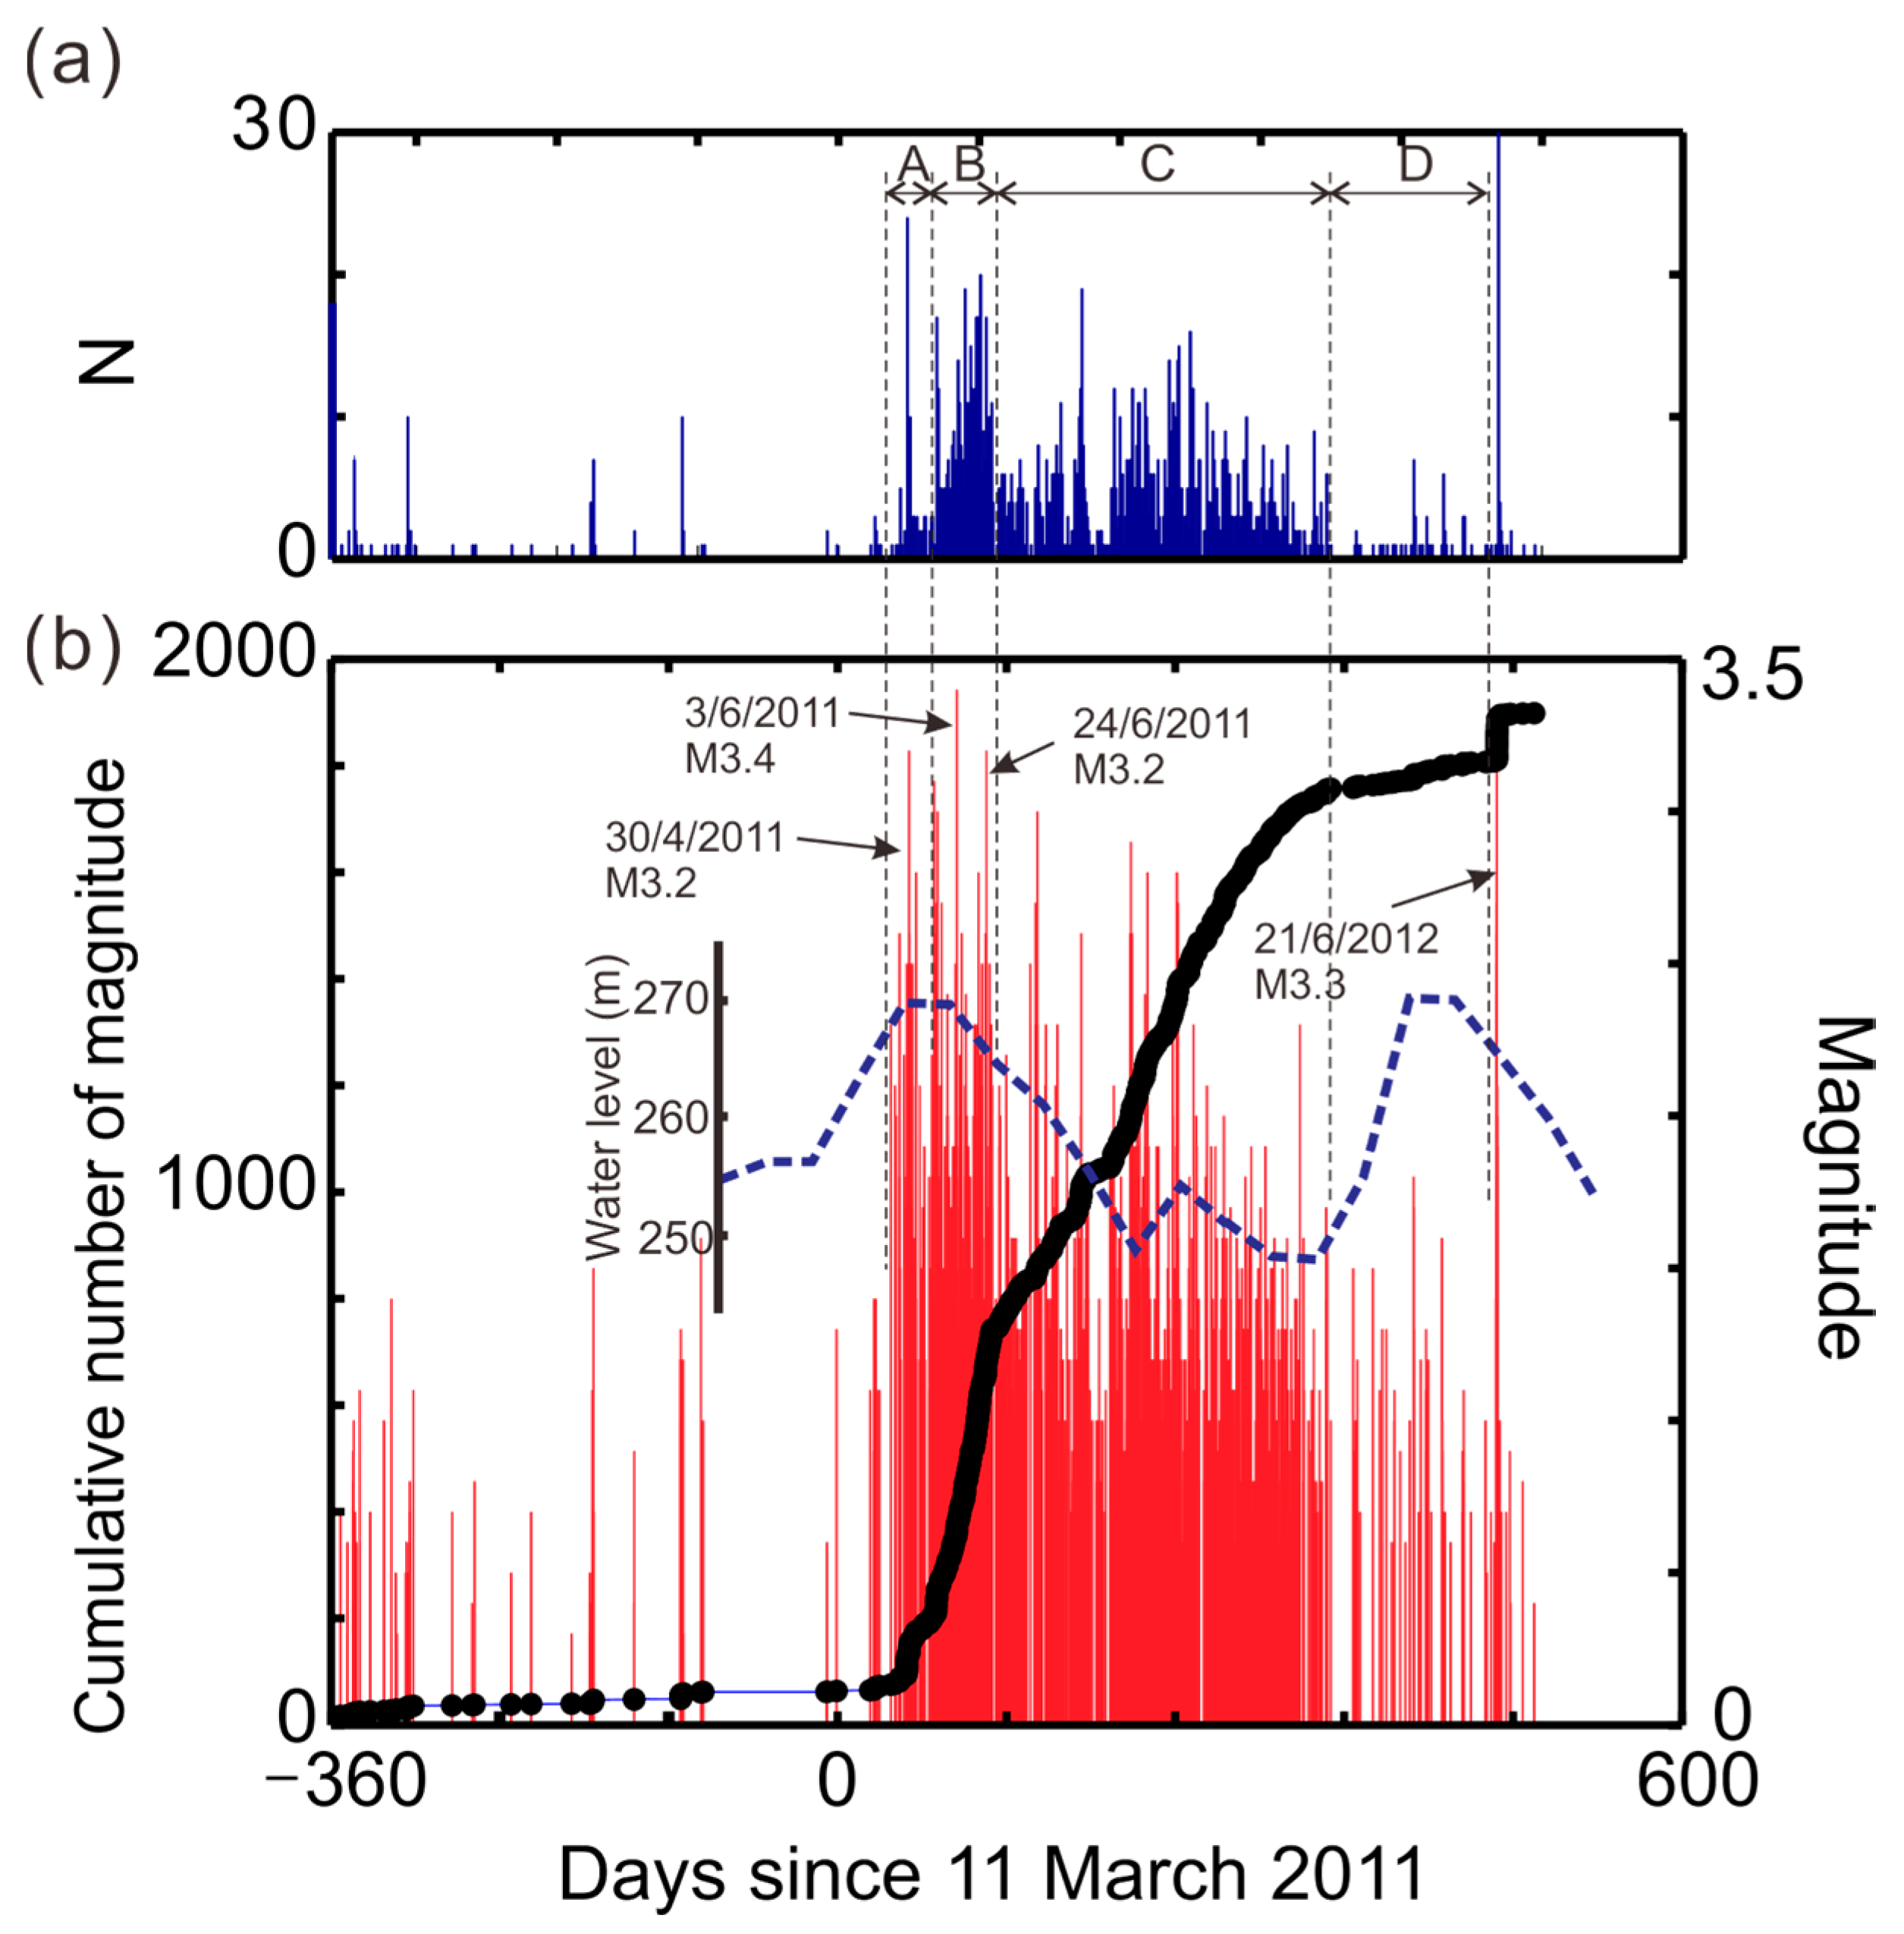
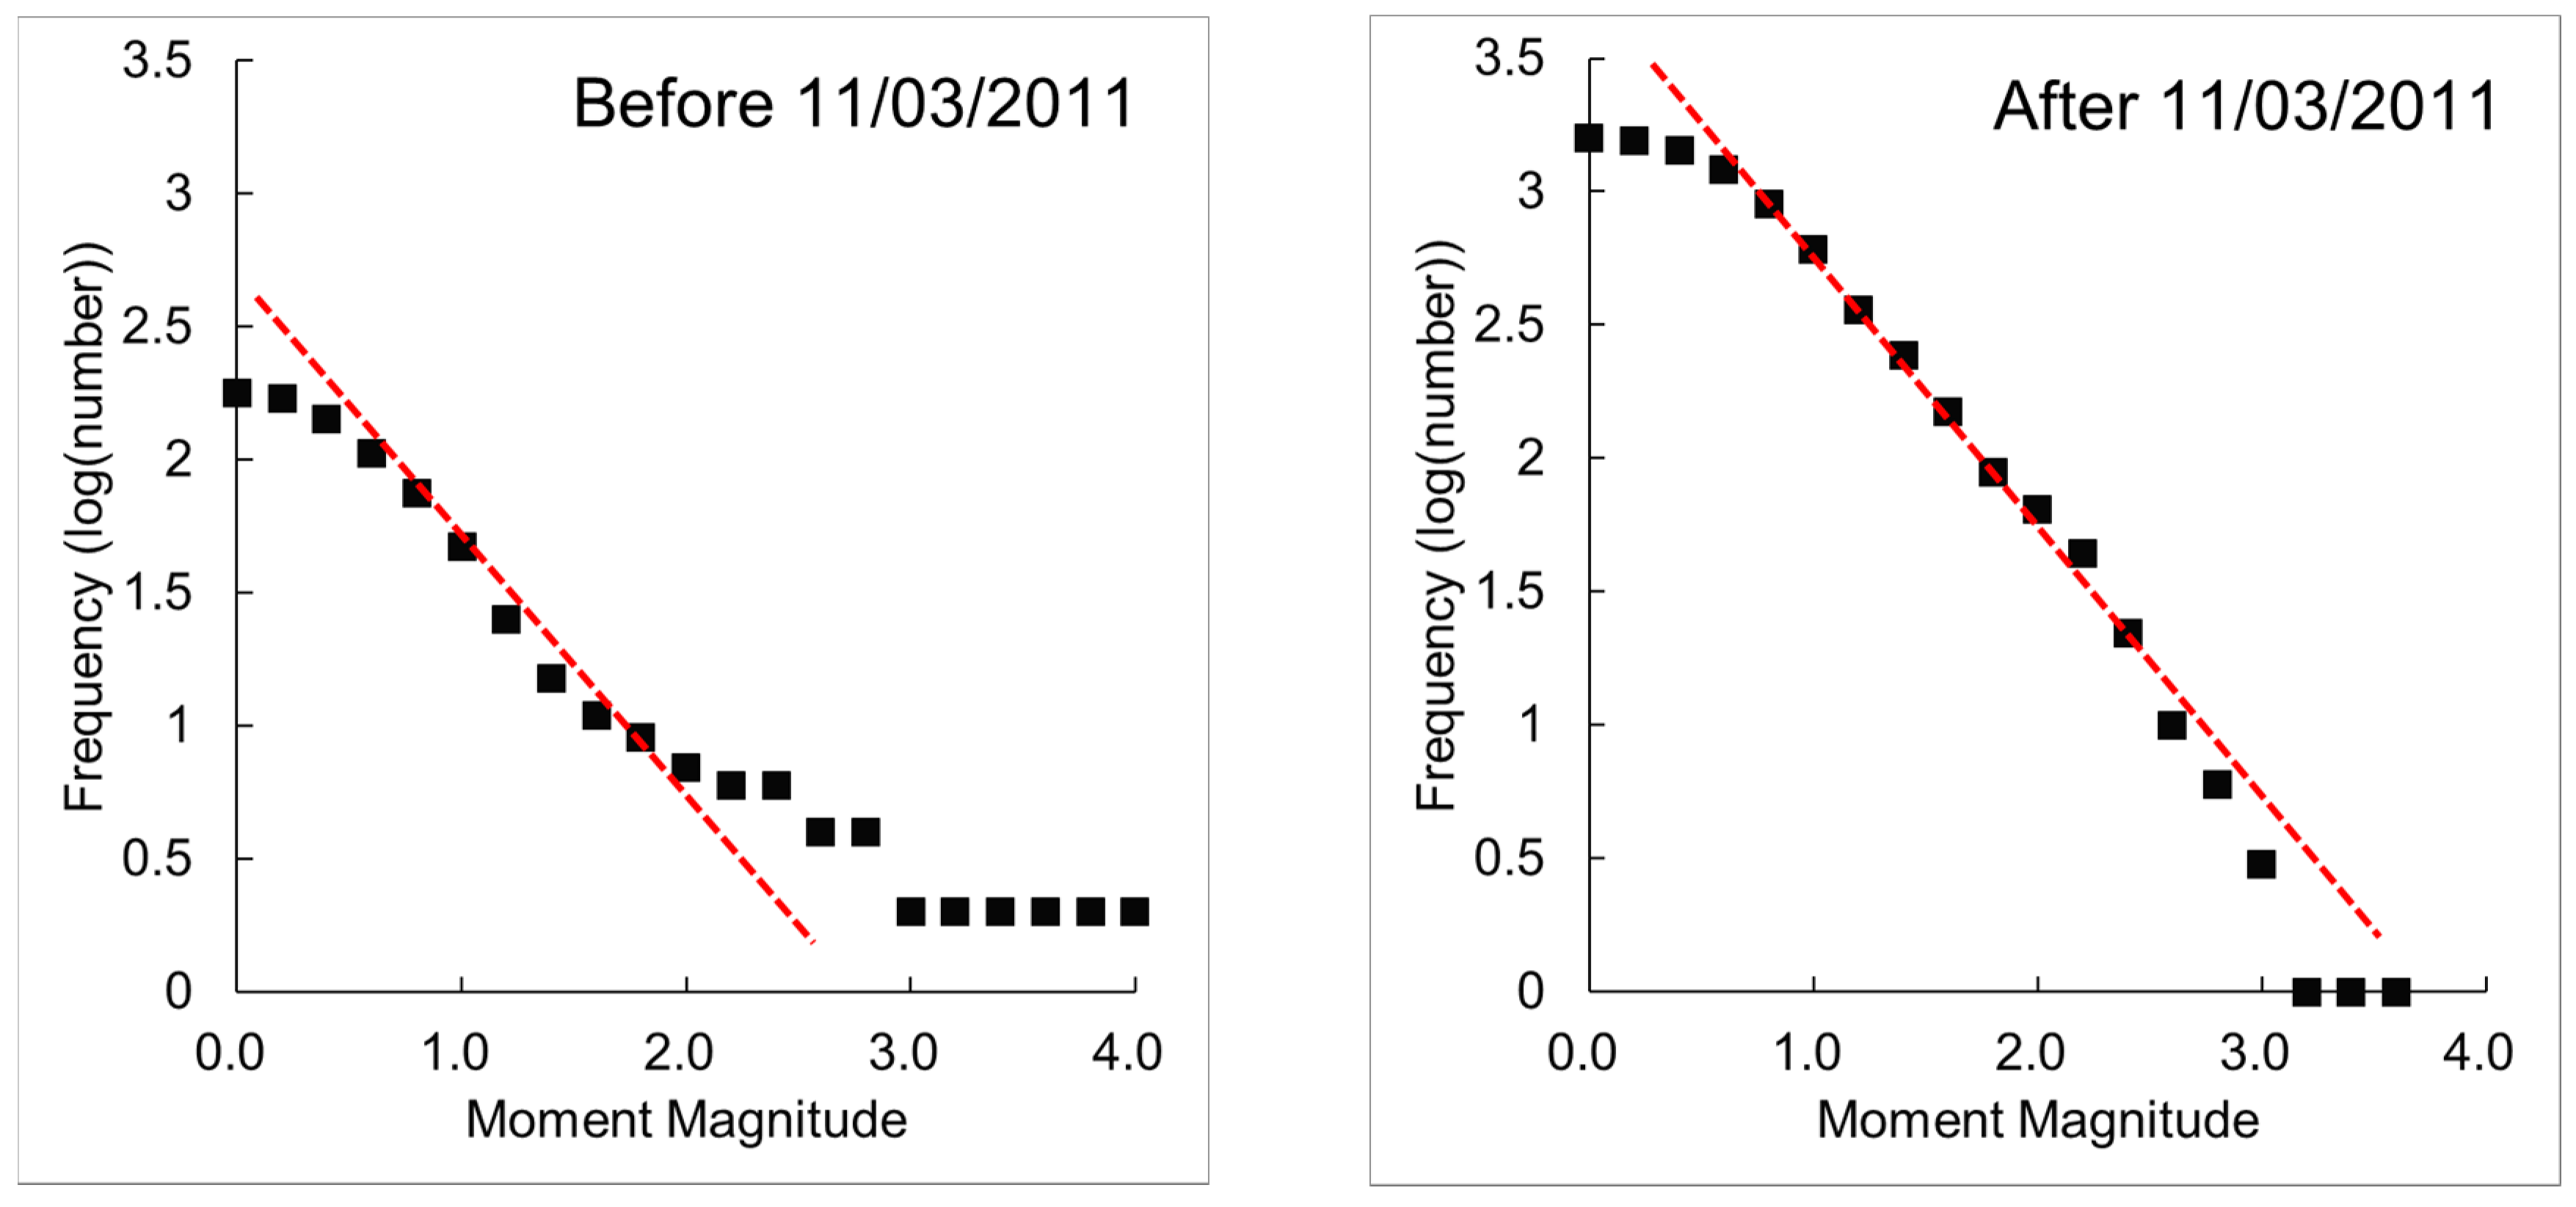
The AE events before the Tohoku earthquake occurred at depths between 8 and 14 km on the Nagamachi-Rifu fault. However, after the earthquake, this activity ceased and a new active zone appeared to the west, generating hundreds of events between 11 March 2011 and 1 August 2012 at depths of 8 to 14 km. Activity in the study area did not increase immediately after the Tohoku earthquake, but began a gradual rise on 3 April and totaled 11 events (maximum magnitude 2.3) by 21 April. After 24 April, AE activity increased further, and by 1 August 2012, more than 1550 AE events had occurred. It is known that smaller earthquakes (e.g., aftershocks) occur after a previous large earthquake in the same area of the main shock, and the frequency of aftershocks decreases with the reciprocal of time after the main shock (Omori’s law). However, clear mainshock and aftershocks are not identified after the Tohoku earthquake in Figure 4; thus, the typical decay of earthquake swarms is difficult to discern. The relationship between the event activity and the seasonal variations in water level in other years were investigated. However, the clear relationship as seen in Figure 4 was not observed before the Tohoku earthquake and after the studied period, and the seismic activity was very low in 2017. Figure 5 shows the Gutenberg-Richter relation before and after 11 March 2011. The b-value was 1.0 before 11 March and 0.92 after 11 March, indicating that larger events became more frequent after the Tohoku earthquake.
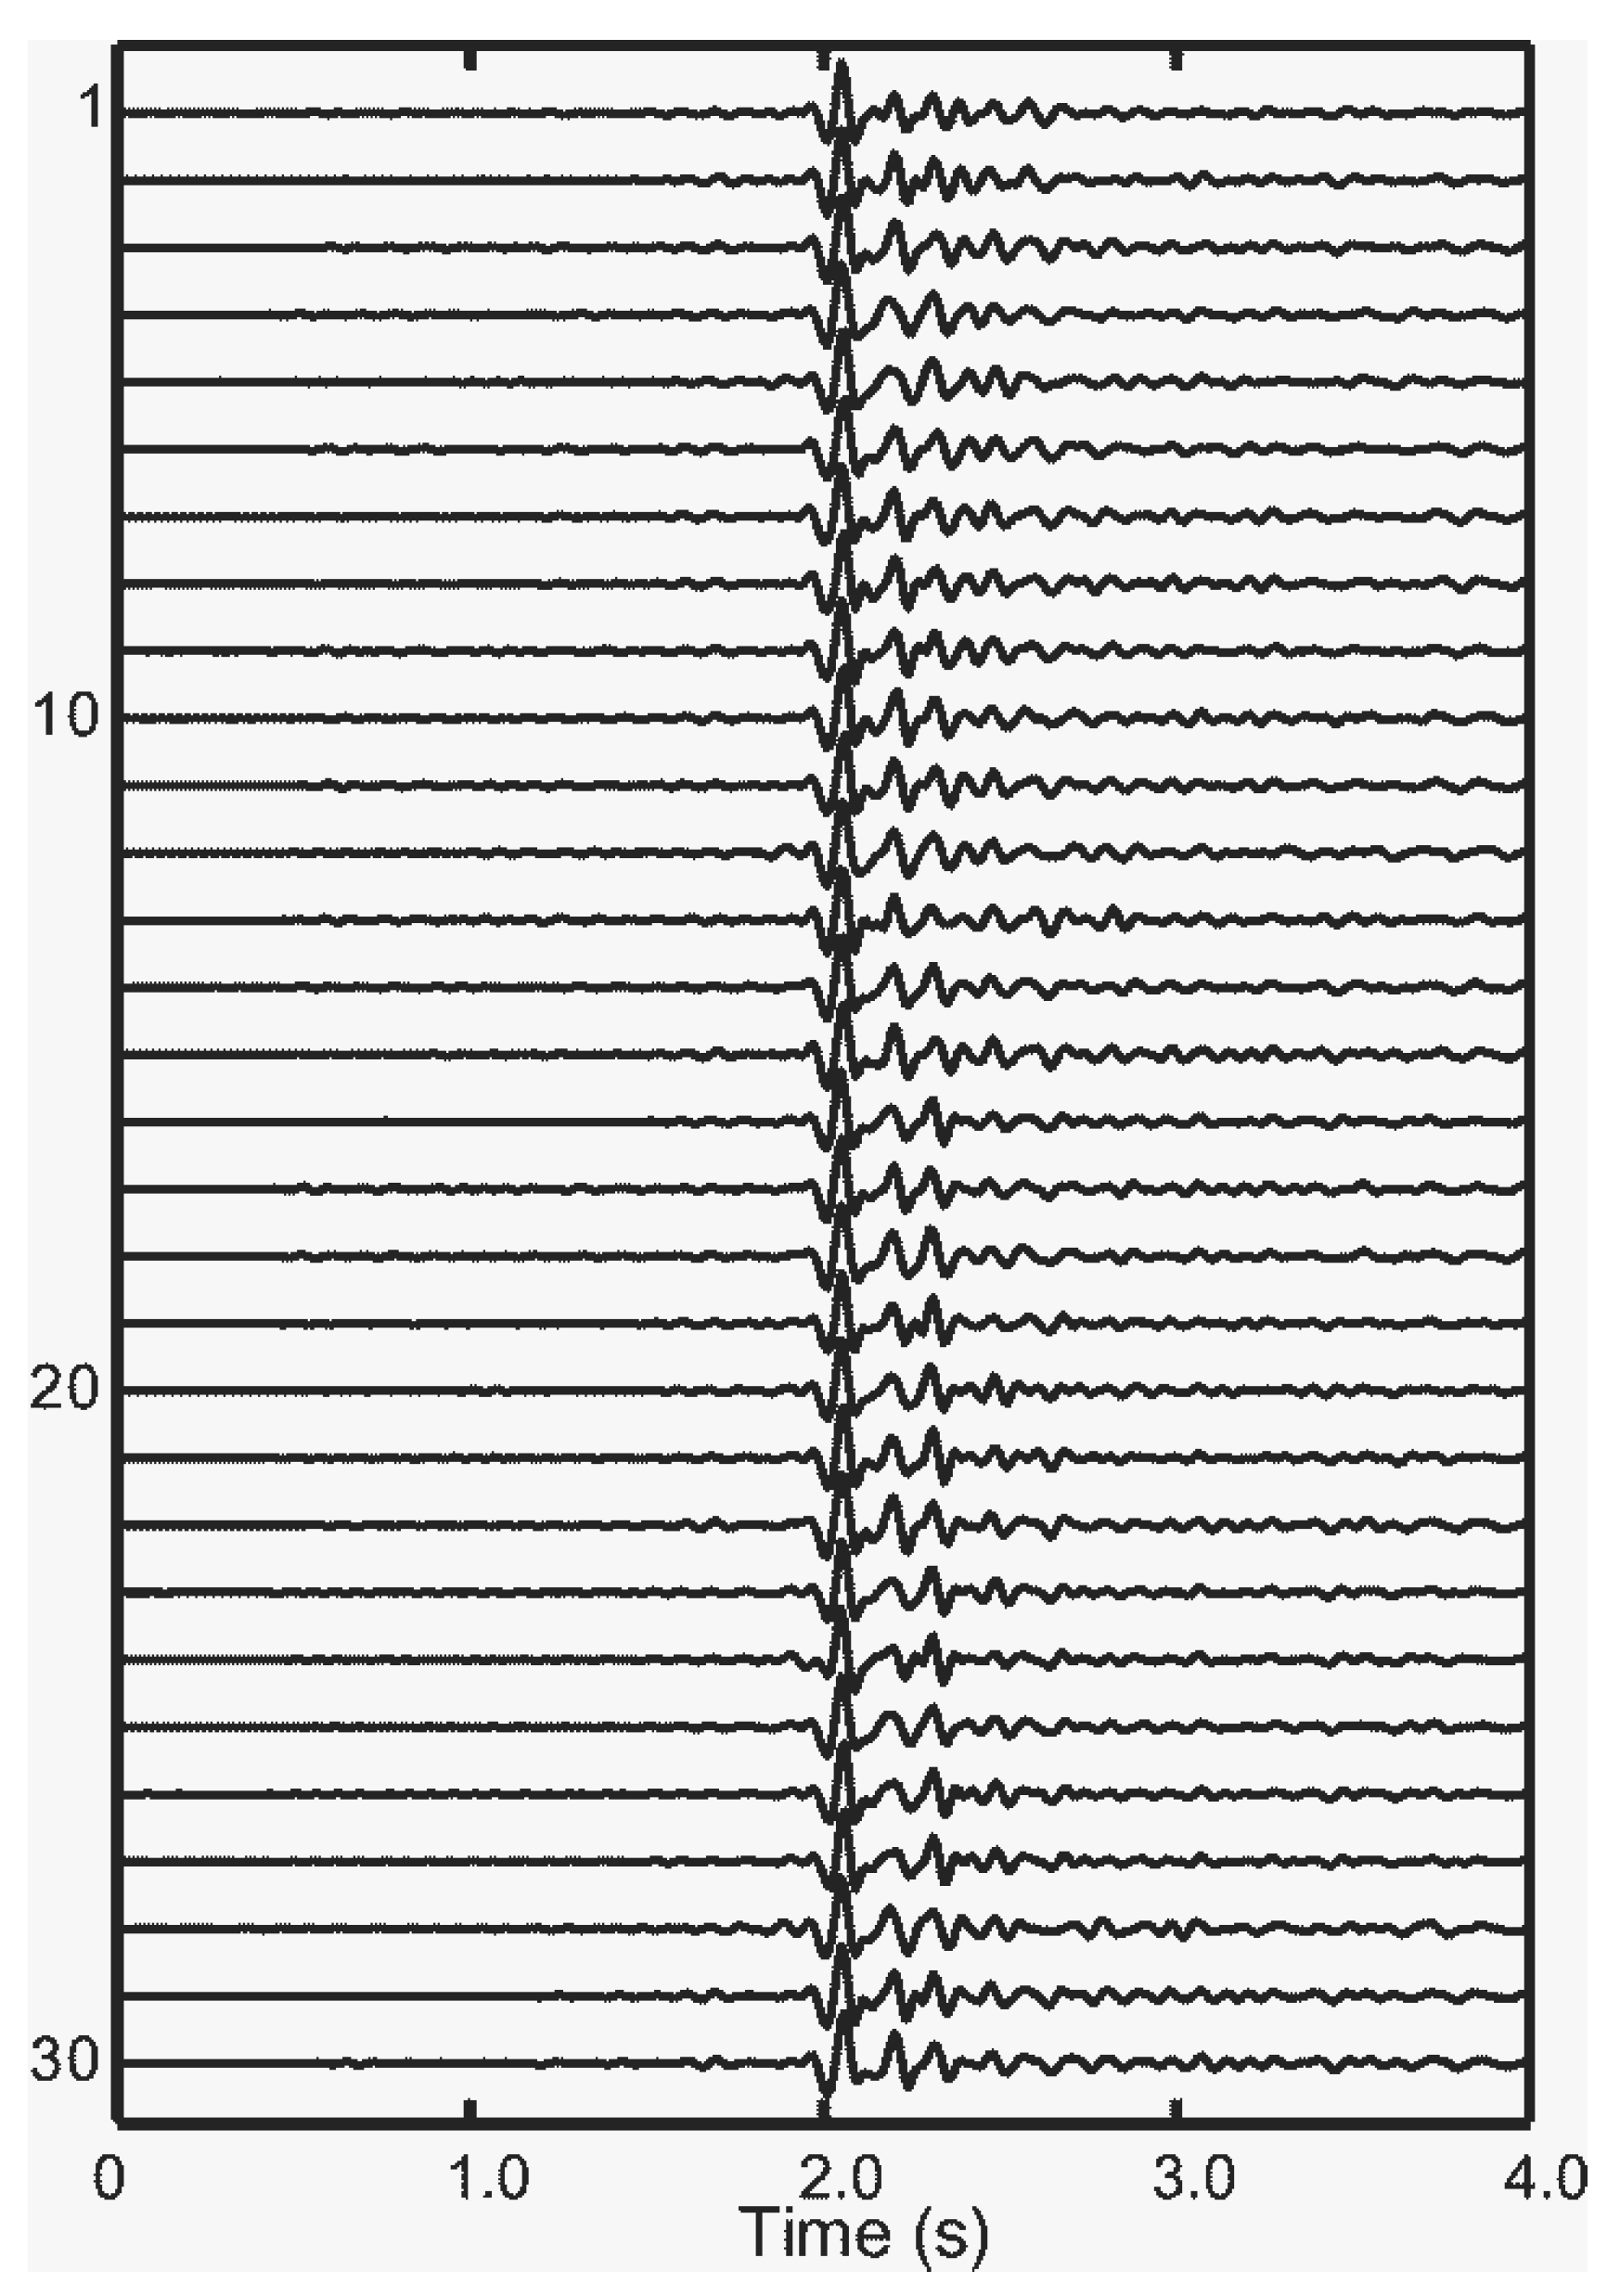
Among the micro-earthquakes after 11 March 2011, we identified events that shared similar waveforms (Figure 6), known as repeating earthquakes or multiplets [17,18,19]. By calculating coherences for all possible pairs of events, and using coherence greater than 0.98 as the criterion for similarity, we identified 985 similar events (63% of those observed), which defined 64 multiplets. Travel-time differences of P- and S-waves were determined by cross-correlating the P- and S-components with their master events.
The mean and standard deviation of the travel-time differences between P- and S-waves were 0.024 and 0.04 s, respectively. Source locations were not corrected according to travel-time differences because the number of seismic stations was insufficient to properly constrain them. However, the similarity of P- and S-wave travel times suggests that the multiplet sources were close together on adjacent fractures.
During the period following the Tohoku earthquake, eight earthquakes larger than M 3.0 were observed at more than 40 stations, making it possible to estimate their source mechanisms by using P-wave polarity distributions. Figure 7a shows the fault plane solution of the largest of these events (M 3.4 on 3 June 2011), for which only P-wave polarities that were clearly detected by visual inspection were used to determine the nodal planes. The other seven of these events had the same mechanism, indicating that the fault planes strike north-northeast–south-southwest and dip at about 65°, and that the slip included both left-lateral strike-slip and reverse components. The accuracy of the source locations was not enough to identify the orientation of the fault plane which caused the micro-earthquakes. If the source locations were approximated to a plane, the plane was dipping around 45 degrees to the east and striking nearly north-south, and this orientation was similar to one of the nodal planes in Figure 7a. The orientation of nodal planes for the mainshock of the 1998 M 5.0 earthquake (Figure 7b) [14] was similar to those of the eight M > 3 events (Figure 7a), but included a right-lateral strike-slip component.
5. Discussion
East–west crustal extension during the Tohoku earthquake relaxed the subduction-related horizontal compressional stress in the study area. The extension decreased normal stresses on east- and west-dipping fault planes and, because shear stress on the reverse faults decreased, they were dynamically stabilized against shear slip. Thus, the number of normal faulting events increased after the Tohoku earthquake [7], and earthquakes on the Nagamachi-Rifu fault nearly ceased after 11 March 2011, as horizontal compressional stress on the fault surface decreased.
After the Tohoku earthquake, seismic activity increased in a region 6 km west of the source of the 1998 earthquake (Figure 3), apparently on newly activated fractures. Fault plane solutions (Figure 7a) indicate that the newly activated fractures dip either east or west and slipped with left-lateral strike-slip and reverse mechanisms. Seismic activity on these fractures, which were previously under critical conditions for reverse faulting, would be expected to decrease when horizontal compressional stress was relaxed during the Tohoku earthquake and lowered the shear stress on the fault plane. However, seismic activity increased after the earthquake, so we must seek other contributing factors.
One possible explanation is a relative increase of principal stress in the north–south direction [16]. This would have created conditions favoring left-lateral strike-slip faulting. Fault plane solutions after the Tohoku earthquake (Figure 7a) include both left-lateral and reverse components, whereas for the 1998 earthquake (Figure 7b), although a left-lateral component was present, reverse faulting was dominant. This result suggests that a relative increase of principal stress in the north–south direction may have also increased the left-lateral component, but the Tohoku earthquake did not dramatically change the contrast between the principal east–west and north–south stresses. This observation implies that the differential stress was greater before the Tohoku earthquake, and that the Tohoku earthquake did not significantly affect the stress field in the study area.
The triggering of earthquakes is sensitive to changes in stress when conditions are critical for shear slip. For example, tidal changes are a likely factor in triggering certain seismic events [20] even though the stress change due to earth tides is no greater than about 103 Pa [21]. On the other hand, the water level of Lake Okura changes by about 20 m, which corresponds to a change in overburden pressure of 200 × 103 Pa. This increase in the overburden stress would increase the pore pressure in the fractures under the lake. AE events can be triggered by increased pore pressure due to fluid diffusion (or pressure diffusion) associated with increases of water level in a lake or reservoir, and it is known that small changes of pore pressure can trigger earthquakes [1,22]. Earthquakes triggered by this mechanism have been reported at several kilometers depth beneath a reservoir in the Koyna district of India [23]. Here, micro-earthquakes started when the water level of Lake Okura approached its maximum level of 270 masl, and the rate of events peaked at 25/day just after that water level was reached. Although those facts do not establish a correlation, fluctuations of the lake level should not be precluded as a possibility in explaining the swarm.
The increase of seismic activity after the Tohoku earthquake can be explained as follows. Before the earthquake, strain energy was accumulating in fractures such that they reached a critical condition for shear slip before 11 March 2011, but cohesion on the fracture surfaces kept the fault locked. Given that crustal movement at this time was a few centimeters per year, cohesive strengthening would have been aseismic. In the process that increases frictional resistance to sliding, generally referred to as healing, micromechanical processes (e.g., increases of asperity contact areas) result in cohesive strengthening [24]. Crustal extension during the Tohoku earthquake changed the direction of shear stress on fractures and weakened the contacts across fracture planes, thus activating shear slip at asperities that were under critical conditions for shear slip. It appears that quasi-static slips occurred repeatedly in the newly activated fracture zone after the Tohoku earthquake, causing AE events as great as M 3.4. This interpretation is supported by the observation of many AE events with similar waveforms (accounting for 63% of located micro-earthquakes) and the decrease after 11 March of the gradient of the high-magnitude tail of earthquake magnitude distributions (Figure 5).
6. Conclusions
About 40 days after the 2011 Tohoku earthquake, a micro-earthquake swarm began west of Sendai, Japan, centered about 8–14 km deep beneath an artificial lake near the down-dip projection of an active fault that caused an M 5 earthquake in 1998. Observations suggest that the new fractures were seismically activated, even though fracturing should have been stabilized by a decrease of principal stress in the east–west direction that was caused by the Tohoku earthquake. It is typically presumed that crustal movement during the Tohoku earthquake did not affect the direction of principal stress; however, a relative increase of the principal stress magnitude in the north–south direction in the study area may have caused a change in the direction of shear stress on fracture surfaces, thus weakening the contacts at asperities. These events induced repeated quasi-static slips at asperities and the resultant AE events. The magnitudes and frequency of the micro-earthquakes indicate that these fractures were capable of causing micro-earthquakes with magnitudes of about 4. The results of this study indicate that ongoing monitoring of the earthquake swarm is important for mitigation of damage caused by micro-earthquakes at these newly activated inland faults. The findings of this study may be helpful as a case history to understand the stability of geological structures in at the kilometer scale.
Author Contributions
H.M. has performed the works of conceptualization, methodology, writing–original draft preparation, writing–review and editing.
Funding
This research received no external funding.
Acknowledgments
The earthquake waveform data and source location data used in this study were acquired from the Hi-net website of the National Research Institute for Earth Science and Disaster Prevention (NIED), Japan.
Conflicts of Interest
The authors declare no conflicts of interest.
References
- Mukuhira, Y.; Moriya, H.; Ito, T.; Asanuma, H.; Häring, M. Pore pressure migration during hydraulic stimulation due to permeability enhancement by low-pressure subcritical fracture slip. Geophys. Res. Lett. 2017, 44, 3109–3118. [Google Scholar] [CrossRef]
- Moriya, H.; Naoi, M.; Nakatani, M.; van Aswegen, G.; Murakami, O.; Kgarume, T.; Ward, A.K.; Durrheim, R.J.; Philipp, J.; Yabe, Y.; et al. Delineation of large localized damage structures forming ahead of an active mining front by using advanced acoustic emission mapping techniques. Int. J. Rock Mech. Min. Sci. 2015, 79, 157–165. [Google Scholar] [CrossRef] [Green Version]
- Talwani, P. On the nature of reservoir-induced seismicity. Pure Appl. Geophys. 1977, 150, 473–492. [Google Scholar] [CrossRef]
- Nakajima, J.; Uchida, N. Repeated drainage from megathrusts during episodic slow slip. Nat. Geosci. 2018, 11, 351–356. [Google Scholar] [CrossRef]
- Ariyoshi, K.; Uchida, N.; Matsuzawa, T.; Hino, R.; Hasegawa, A.; Hori, T.; Kaneda, Y. A trial estimation of frictional properties, focusing on aperiodicity off Kamaishi just after the 2011 Tohoku earthquake. Geophys. Res. Lett. 2014, 41, 8325–8334. [Google Scholar] [CrossRef] [Green Version]
- Hirose, F.; Miyaoka, K.; Hayashimoto, N.; Yamazaki, T.; Nakamura, M. Outline of the 2011 off the Pacific coast of Tohoku Earthquake (Mw 9.0)—Seismicity: Foreshocks, mainshock, aftershocks, and induced activity. Earth Planets Space 2011, 63, 513–518. [Google Scholar] [CrossRef]
- Ide, S.; Baltay, A.; Beroza, G.C. Shallow dynamic overshoot and energetic deep rupture in the 2011 Mw 9.0 Tohoku-Oki Earthquake. Science 2011, 332, 1426–1429. [Google Scholar] [CrossRef] [PubMed]
- Sato, M.; Ishikawa, T.; Ujihara, N.; Yoshida, S.; Fujita, M.; Mochizuki, M.; Asada, A. Displacement above the hypocenter of the 2011 Tohoku-Oki earthquake. Science 2011, 332, 1395. [Google Scholar] [CrossRef] [PubMed]
- Yoshida, K.; Hasegawa, A.; Okada, T.; Iinuma, T.; Ito, Y.; Asano, Y. Stress before and after the 2011 great Tohoku-oki earthquake and induced earthquakes in inland areas of eastern Japan. Geophys. Res. Lett. 2012, 39, L03302. [Google Scholar] [CrossRef]
- Nakamura, A.; Asano, Y.; Hasegawa, A. Estimation of deep fault geometry of the Nagamachi-Rifu fault from seismic array observations. Earth Planets Space 2002, 54, 1027–1031. [Google Scholar] [CrossRef] [Green Version]
- Nakajima, J.; Hasegawa, A.; Horiuchi, S.; Yoshimoto, K.; Yoshida, T.; Umino, N. Crustal heterogeneity around the Nagamachi-Rifu fault, northeastern Japan, as inferred from travel-time tomography. Earth Planets Space 2006, 58, 843–853. [Google Scholar] [CrossRef] [Green Version]
- Yamaji, A. The multiple inverse method: A new technique to separate stresses from heterogeneous fault-slip data. J. Struct. Geol. 2000, 22, 441–452. [Google Scholar] [CrossRef]
- Umino, N.; Ujikawa, H.; Hori, S.; Hasegawa, A. Distinct S-wave reflectors (bright spots) detected beneath the Nagamachi-Rifu fault, NE Japan. Earth Planets Space 2002, 54, 1021–1026. [Google Scholar] [CrossRef] [Green Version]
- Umino, N.; Okada, T.; Hasegawa, A. Foreshock and aftershock sequence of 1998 M5.0 Sendai, northeastern Japan, earthquake and its implications for earthquake nucleation. Bull. Seismol. Soc. Am. 2002, 92, 2465–2477. [Google Scholar] [CrossRef]
- Ozawa, S.; Nishimura, T.; Suito, H.; Kobayashi, T.; Tobita, M.; Imakiire, T. Coseismic and postseismic slip of the 2011 magnitude-9 Tohoku-Oki earthquake. Nature 2011, 475, 373–376. [Google Scholar] [CrossRef] [PubMed]
- Sakaguchi, K.; Koyano, T.; Yokoyama, T. Change in stress field in the Kamaishi Mine, associated with the 2011 Tohoku-oki earthquake. In Proceedings of the 13th Japan Symposium on Rock Mechanics, Okinawa, Japan, 9–11 January 2013; pp. 513–517. (In Japanese). [Google Scholar]
- Moriya, H.; Niitsuma, H.; Baria, R. Multiplet-clustering analysis reveals structural details within the seismic cloud at the Soultz geothermal field, France. Bull. Seismol. Soc. Am. 2003, 93, 1606–1620. [Google Scholar] [CrossRef]
- Nadeau, R.M.; McEvilly, T.V. Periodic pulsing characteristic microearthquakes on the San Andreas fault. Science 2004, 303, 220–222. [Google Scholar] [CrossRef] [PubMed]
- Igarashi, T. Spatial changes of inter-plate coupling inferred from sequences of small repeating earthquakes in Japan. Geophys. Res. Lett. 2010, 37, L20304. [Google Scholar] [CrossRef]
- Chen, H.J.; Chen, C.C.; Tseng, C.Y.; Wang, J.H. Effect of tidal triggering on seismicity in Taiwan revealed by the empirical mode decomposition method. Nat. Hazards Earth Syst. Sci. 2012, 12, 2193–2202. [Google Scholar] [CrossRef] [Green Version]
- Tsuruoka, H.; Ohtake, M.; Sato, H. Statistical test of the tidal triggering of earthquakes: Contribution of the ocean tide loading effect. Geophys. J. Int. 1995, 122, 183–194. [Google Scholar] [CrossRef]
- Talwani, P.; Cobb, J.S.; Schaeffer, M.F. In situ measurements of hydraulic properties of a shear zone in northwestern South Carolina. J. Geophys. Res. 1999, 104, 14993–15003. [Google Scholar] [CrossRef] [Green Version]
- Talwani, P. Seismogenic properties of the crust inferred from recent studies of reservoir-induced seismicity–Application to Koyna. Curr. Sci. 2000, 79, 1327–1333. [Google Scholar]
- Scholz, C.H.; Engelder, T. Role of asperity indentation and ploughing in rock friction. Int. J. Rock Mech. Min. Sci. 1976, 13, 149–154. [Google Scholar] [CrossRef]
Figure 1.
(a) Map of northeastern Honshu, Japan, with inset showing location of study area. The solid star marks the epicenter of the Tohoku earthquake; (b) Map showing epicenters of micro-earthquakes from 5 February 2005 to 1 August 2012; (c) Vertical cross section showing hypocenters of micro-earthquakes projected onto line A–B. Open stars show the location of the magnitude 5.0 earthquake of 15 September 1998.

Figure 2.
Vertical cross section showing hypocenters of micro-earthquakes before the Tohoku earthquake projected onto the vertical plane defined by line A–B (location in Figure 1b). The dashed line shows the downward projection of the Nagamachi-Rifu fault. The red star represents the source location of the earthquake of magnitude (M) 5.0 occurred on 15 September 1998.

Figure 3.
Vertical cross section showing hypocenters of micro-earthquakes after the Tohoku earthquake projected onto the vertical plane defined by line A–B. The red star represents the source location of the earthquake of magnitude (M) 5.0 occurred on 15 September 1998.
Figure 3.
Vertical cross section showing hypocenters of micro-earthquakes after the Tohoku earthquake projected onto the vertical plane defined by line A–B. The red star represents the source location of the earthquake of magnitude (M) 5.0 occurred on 15 September 1998.

Figure 4.
(a) Number of micro-earthquakes per day and (b) magnitudes and cumulative number of seismic events (N) during the 360 days before and 600 days after the Tohoku earthquake along with the water level of Lake Okura. The record ends on 1 August 2012.
Figure 4.
(a) Number of micro-earthquakes per day and (b) magnitudes and cumulative number of seismic events (N) during the 360 days before and 600 days after the Tohoku earthquake along with the water level of Lake Okura. The record ends on 1 August 2012.

Figure 5.
Histograms showing the Gutenberg-Richter relation.

Figure 6.
Example of a set of waveforms constituting a multiplet. Amplitudes are normalized to the maximum amplitude of each waveform. The vertical axis represents the number of events.
Figure 6.
Example of a set of waveforms constituting a multiplet. Amplitudes are normalized to the maximum amplitude of each waveform. The vertical axis represents the number of events.

Figure 7.
(a) Waveforms of eight M > 3 earthquakes after the Tohoku earthquake and fault plane solution for the largest event (M 3.4, 3 June 2011). Open circle and closed circle represent negative and positive P-wave polarities, respectively; (b) Fault plane solution for the 1998 M 5.0 earthquake on the Nagamachi-Rifu fault, which was reproduced following the result by Umino et al. [14].

© 2018 by the author. Licensee MDPI, Basel, Switzerland. This article is an open access article distributed under the terms and conditions of the Creative Commons Attribution (CC BY) license (http://creativecommons.org/licenses/by/4.0/).
Share and Cite
MDPI and ACS Style
Moriya, H. Acoustic Emission/Seismicity at Depth Beneath an Artificial Lake after the 2011 Tohoku Earthquake. Appl. Sci. 2018, 8, 1407. https://0-doi-org.brum.beds.ac.uk/10.3390/app8081407
AMA Style
Moriya H. Acoustic Emission/Seismicity at Depth Beneath an Artificial Lake after the 2011 Tohoku Earthquake. Applied Sciences. 2018; 8(8):1407. https://0-doi-org.brum.beds.ac.uk/10.3390/app8081407
Chicago/Turabian StyleMoriya, Hirokazu. 2018. "Acoustic Emission/Seismicity at Depth Beneath an Artificial Lake after the 2011 Tohoku Earthquake" Applied Sciences 8, no. 8: 1407. https://0-doi-org.brum.beds.ac.uk/10.3390/app8081407
Note that from the first issue of 2016, this journal uses article numbers instead of page numbers. See further details here.