Modeling Power Generation and Energy Efficiencies in Air-Cathode Microbial Fuel Cells Based on Freter Equations


1
Department of Bioproducts & Biosystems Engineering, University of Minnesota, 1390 Eckles Avenue, St. Paul, MN 55108, USA
2
Department of Biological Engineering, University of Idaho, 875 Perimeter Drive, MS 0904, Moscow, ID 83844-0904, USA
3
Department of Biological and Agricultural Engineering, ENGR 215, University of Arkansas, Fayetteville, AR 72701, USA
*
Author to whom correspondence should be addressed.
Appl. Sci. 2018, 8(10), 1983; https://0-doi-org.brum.beds.ac.uk/10.3390/app8101983
Submission received: 19 September 2018
/
Revised: 12 October 2018
/
Accepted: 14 October 2018
/
Published: 19 October 2018
(This article belongs to the Special Issue Microbial Fuel Cells)
Abstract
:Featured Application
The established mathematical model for air-cathode microbial fuel cells can be used to predict the electrical current and power generation as well as energy efficiencies at varying operating conditions.
Abstract
The model proposed in this study was based on the assumption that the biomass attached to the anode served as biocatalysts for microbial fuel cell (MFC) exoelectrogenesis, and this catalytic effect was quantified by the exchange current density of anode. By modifying the Freter model and combining it with the Butler–Volmer equation, this model could adequately describe the processes of electricity generation, substrate utilization, and the suspended and attached biomass concentrations, at both batch and continuous operating modes. MFC performance is affected by the operating variables such as initial substrate concentration, external resistor, influent substrate concentration, and dilution rate, and these variables were revealed to have complex interactions by data simulation. The external power generation and energy efficiency were considered as indices for MFC performance. The simulated results explained that an intermediate initial substrate concentration (about 100 mg/L under this reactor configuration) needed to be chosen to achieve maximum overall energy efficiency from substrate in the batch mode. An external resistor with the value approximately that of the internal resistance, boosted the power generation, and a resistor with several times of that of the internal resistance achieved better overall energy efficiency. At continuous mode, dilution rate significantly impacted the steady-state substrate concentration level (thus substrate removal efficiency and rate), and attached biomass could be fully developed when the influent substrate concentration was equal to or higher than 100 mg/L at any dilution rate of the tested range. Overall, this relatively simple model provided a convenient way for evaluating and optimizing the performance of MFC reactors by regulating operating parameters.
1. Introduction
A microbial fuel cell (MFC) is a device oxidizing organic substrates in the liquid environment and releasing electrical energy to external loads. Anode attached biomass works as catalysts for substrate oxidization [1]. The catalytic microorganisms at anodes, mostly enriched from mixed microbial consortia, are capable of handling various organic substrates [2,3], and can potentially be used in degrading organic substrates in various types of wastewater.
Due to complicated interactions between various design and operating variables in this hybrid type of reactor, it is not easy to experimentally achieve optimal conditions for power and energy generation and efficient substrate removal. Mathematical models thus provide a simple approach to investigate the effects of different variables and optimize the MFC performances. The electrochemical reactions at anode are emphasized in MFC modeling [4,5] since the anode reactions are features of MFC, and MFC performance can partly be predicted from the growth status of the anode attached bacteria [6]. The current MFC anode models are normally based on redox mediators that supposedly exist in the medium. Research progress already reveals that the outer membrane-bound cytochromes and the nanowire of bacteria conduct electricity [1], so bacteria as a whole, which are directly attached to the anode surface, can be regarded as catalysts. It can thus be assumed that only the directly anode-attached bacteria, or bacteria of a monolayer [7], contribute to electricity generation. Besides, the suspended bacteria must also be included in the model because the attached and suspended bacterial populations reach a dynamic equilibrium between each other, and because both populations utilize substrate for growth. This inclusion is especially essential when studying substrate utilization between the populations. The Freter model, which originally describes the dynamics of the suspended bacteria and wall-attached bacteria in a bioreactor [8,9], is herein adopted. The main reason for favoring this model is that it emphasizes the formation of a bacterial monolayer on a wall structure which is similar to the process of anode-bacteria attachment. The Freter model is first revised to account for the feature of MFC where electricity generation consumes substrate (Figure 1), before using it to describe the MFC bacterial populations.
In this study, a dynamic model for MFC was developed based on microbial reaction, electrochemical reaction, and mass balances. Numerical simulation of the model was conducted to investigate the effect of varying operating parameters, including initial or influent substrate concentration, dilution rate, and external resistor, on the MFC microbial populations, substrate removal, power generation, and energy efficiency. Factors influencing the energy efficiency were especially emphasized in numerical simulation for both batch and continuous modes of operation.
2. Materials and Methods
2.1. MFC Design and Operation
Two identical single-chamber air-cathode MFC reactors, with a total volume of 155 mL, were fabricated from clear/extruded acrylic tubes (5 cm in internal diameter and 7.5 cm in length), covered with 0.25 cm thick plexiglass acrylic endplates at both ends. The anode was made from plain carbon cloth, while the air-cathode was made from 0.5 mg cm−2 Pt-containing (10% in carbon black) carbon cloth treated with Nafion, and with polytetrafluoroethylene (PTFE) as a gas diffusion backing layer [10]. A 2.2 kΩ resistor was connected in the circuit as an external load.
Anaerobic sludge was obtained for MFC inoculation from a swine manure lagoon at the University of Minnesota Southern Research and Outreach Center in Waseca, MN. The sludge was sieved through a 1 mm mesh sieve to remove sand, gravels, and plant residues prior to use. Sodium acetate was dissolved in 50 mM phosphate buffer solution (pH 7) to prepare a medium with 40 mM acetate. Other nutrients also added to enhance and maintain the development of bacteria included (g L−1): 0.31 NH4Cl, 0.13 KCl, and mineral and vitamin solutions.
Data Acquisition
The voltage (Uext) across the external resistor was measured by voltage probes and recorded by a CR 1000 data logger (Campbell Scientific, Inc., Logan, UT, USA). The anodic and cathodic potentials were monitored using standard Ag/AgCl electrodes (MF-2072, BASi, Inc., West Lafayette, IN, USA). The data logger supporting software, LoggerNet Version 3.4 (Campbell Scientific, Inc., Logan, UT, USA), was used to monitor and collect the voltage data of the MFC reactors.
2.2. Model Description
The mathematical model of microbial fuel cells to be developed simulated and predicted the electrochemical performance in batch or continuous mode of operation. A few assumptions were made to simplify the modeling of different MFC reactors. First, the anode-attached microbes were assumed to be the catalyst for the exoelectrogenic process; second, the exchange current density, or the catalytic effect, was proportional to the concentration of the attached biomass; third, the mass transfer of acetate to anode and oxygen gas to cathode, assumed to be fast enough, compared to the electrochemical processes, was not a limiting factor and was thus neglected; and fourth, the hydrolytic products of dead cells were assumed to not provide a carbon source or energy to the suspended or attached bacterial growth.
2.2.1. Electrode Potentials
The electrode potential (against the standard hydrogen electrode, SHE or the normal hydrogen electrode, NHE) was dependent on the standard electrode potential and the concentration of active species according to the Nernst equation:
where was the formal potential (pH- and concentration-adjusted reduction potential), was the standard electrode potential, was the stoichiometric number for species i (positive for oxidized species, and negative for reduced species), and was the concentration of the species i. In the pH region of this study, the Mineql+ [11] simulation indicated that bicarbonate was the major form in the carbonate equilibrium system. Thus, the anodic and cathodic reactions proceeded as follows:
2HCO3− + 9H+ + 8e−→CH3COO− + 4H2O E0 = 0.187 V
O2 + 4H+ + 4e−→2H2O E0 = 1.229 V
The anode and cathode electrode potentials ( and, respectively) based on the assumed acetate and bicarbonate concentrations could be estimated as follows:
The experimentally measured cathodic potentials usually were much lower than the predicted values [12,13], partly due to other reactions that might have happened on the cathode surface which resulted in a mixed cathodic potential of lower values. For example, hydrogen peroxide production could happen on cathode to deviate the cathode potential to a lower value (e.g., 0.36 V) [12]. In accordance with both the literature information and the cathode potential at open-circuit operation in this study, a cathode potential of 0.51 V (NHE), rather than 0.805 V (NHE), was adopted herein. The electromotive force (Eemf) was defined as the difference between the cathode and anode potentials:
2.2.2. Exchange Current and Overpotential
Overpotential is defined as the difference of an electrode potential from its formal potential in a fuel cell. The Butler–Volmer equation, neglecting the reverse cathodic reaction [14], was used to express the relationship between the exchange current and anode overpotential:
where was the electric current, was the exchange current density of anode, αA was the transfer coefficient of the anodic reaction, and was the anode overpotential. In a similar way, the cathode overpotential could be formulated with the reverse reaction neglected as follows:
where was the exchange current density of cathode, αC was the charge transfer coefficient of the cathode reaction, and was the cathode overpotential. The exchange current density of cathode was consistent during the MFC operation, due to the unchanging amount of the catalyst (0.5 mg cm−2 of Pt), but that of anode was proportional to the increasing catalyst load, which was the attached biomass concentration here [15]:
where was the unit exchange current density of exoelectrogenic biomass, and w was the attached biomass concentration on anode.
2.2.3. Mass Balances
A model that was proposed to describe the suspended and attached microbial formation [8,9] in an aqueous environment was modified and adopted in this study. In this model, bacteria could divide, suspend and decay in the reactor medium, and could also attach to a surface with a dynamic equilibrium between attachment and detachment. Since bacterial growth and electricity generation consumed substrate when it was available, the three components of the system, the substrate concentration (S), the suspended biomass concentration (u), and the attached biomass concentration (w), which were dictated by mass balances, were expressed in three ordinary differential equations as follows:
where D was the dilution rate, Sin was the influent substrate concentration, was the biomass yield of substrate, was the suspended bacterial growth rate, was the attached bacterial growth rate, was the ratio of projected anode surface area to reactor volume, was the substrate utilization rate by electricity and heat generation, was the suspended bacterial death rate, was the attached bacterial death rate, was the detachment rate of bacteria from wall, was the attachment rate of bacteria to anode surface, was the fraction of daughter cells attached to anode, and was the wall occupation fraction. Some of those parameters in the equations could be defined through further fundamental design and operating parameters:
where was the dilution rate, was the MFC reactor volume, was the projected anode surface area, was the maximum specific growth rate of suspended bacteria, was the half saturation coefficient of suspended bacteria of the Monod kinetics, was the maximum specific growth rate of attached bacteria, was the half saturation coefficient of attached bacteria.
2.2.4. Ohm’s Law and Kirchhoff’s Voltage Law
By applying Ohm’s law, the electrical current of the circuit, the voltage drop (Um) across the resistance (Rm) of electrolyte solution of MFC medium, and the voltage drop (Uc) across the contact resistance (Rc) of MFC could be obtained:
where was the external voltage across the external resistor (), was the distance between two electrodes, and was the conductivity of MFC medium. By combining all the polarization losses along the circuit of MFC, the voltage conservation according to Kirchhoff’s voltage law could be denoted as follows:
2.2.5. Power and Energy Efficiencies
The power () extracted by the external load of a resistor was the product of the external voltage and current:
The power extracted by the electrical circuit of MFC (), or termed as an MFC cell, was the product of the electromotive force and current:
The power lost through the polarization of the activation overpotentials of anode and cathode, the contact resistance, and the medium resistance, was the power emitted in a form of heat:
The rate of the substrate (acetate) loss through MFC cell () could be calculated as follows:
where was the heat of combustion of acetic acid, and was the relative molecular weight of acetic acid.
Besides the energy loss by heat generation in MFC, the chemical energy of substrate was also lost by providing energy for the growth of the suspended and attached bacteria. The corresponding powers for the suspended () and attached () bacteria could be calculated as follows:
Although some studies [13] suggested that the energy efficiency was further reduced by the more positive potential (close to 0 V, NHE) of redox intermediates than that of the substrate, this energy loss was not considered because our experiment achieved anode potentials close to that of the substrate. Therefore, the MFC cell energy efficiency () and overall energy efficiency () were defined as follows:
Please note that in batch mode, the overall energy efficiency was calculated differently:
2.2.6. Model Parameters
Some constants and parameters involved in microbial fuel cell processes described in Equations (from (1) to (30)) were listed in Table 1. During modeling and simulation, units of those parameters and variables were not necessarily SI units, but some were adjusted to the suitable magnitudes. Microbial parameters of acetate utilizers in anaerobic conditions were adopted from the literature [16]. Some model parameters associated with electrochemical processes, including charge transfer coefficients (αA and αC) and exchange current densities (, and ) were estimated from the polarization dataset obtained from one of two MFC reactors in this experiment. The quasi-Newton approach was used to minimize the χ2 test statistic as an error function:
where was the number of data points, and was the i-th experimental value, and was the i-th calculated value. The polarization curve data of the other reactor was used for validation.
3. Results and Discussion
3.1. Parameter Estimation
Two identically-made MFC reactors with respect to reactor configuration and electrode materials were inoculated with the same anaerobic sludge and operated in parallel. After MFC were fully inoculated and operated for 30 d, polarization curves of MFC was obtained by varying the external resistor from 2200 to 220 Ω, with the electrode potentials recorded (Figure 2A). The resultant electrochemical parameters estimated by fitting polarization curves of electrodes were listed in Table 2. The simulation results based on the estimated parameters were in good agreement with the experimental data of both reactors, as shown in Figure 2B,C. The anodic exchange current density of 62.5 mA m−2 was in the same order of a literature value of 29 mA m−2 [17]. The cathodic exchange current density (0.975 mA m−2) observed in this study was higher than those of non-catalyzed and bio-catalyzed cathodes [18,19] but lower than another Pt-based cathode [20]. To further validate the model, the external voltage (Uext) during inoculation stage was simulated based on the listed parameters except the unit exchange current, which was fitted from the experimental data at the inoculation stage (0.129 mA mg−2 biomass) and had a difference by 32% from 0.189 mA mg−1 which was fitted from polarization curves. This difference could be a result of the change of the activity or catalytic effect of the attached biomass during the inoculation and 30 d operation. The simulated data and the experimental data of the inoculation stage generally showed good agreement with each other (Figure 2D).
3.2. Simulation of Batch Mode MFC
3.2.1. Effect of Initial Substrate Concentration
Simulation of the proposed model was performed through Matlab on a personal computer to illustrate the processes of substrate utilization, biomass concentration evolution, and voltage generation across an external resistor. Since most MFC studies in literature were carried out in batch mode, this simulation assumed the medium dilution rate D = 0 with initial substrate (HAc) concentrations of 10, 100, 1000, and 2400 mg L−1, consecutively.
The simulation results are shown in Figure 3. Initial substrate concentrations of 1000 and 2400 mg L−1 did not show obvious decrease in the first 4 d (Figure 3A), but substrate was consumed dramatically after this period. MFCs started with the lower substrate concentrations behaved differently from the higher strength cases, as a continuous and gradual decrease was observed. The substrate in the case of 100 mg L−1 lasted the longest, i.e., 9 d, which almost doubled that in the higher strength cases. These results indicated that it was not always that more concentrated substrate could sustain the longest reaction period, and a moderate substrate concentration should be chosen for keeping MFC from starvation. Trends of substrate utilization were generally the work of suspended bacteria, which could accumulate to a high level and subsequently, consumed substrate at a high rate that rapidly reduced substrate concentration (Figure 3B). For example, in the initial substrate concentrations of 100 and 2400 mg L−1, the peak suspended biomass concentrations were 2.5 and 117 mg L−1, respectively. The latter was 47 times higher than the former, which consumed substrate at a higher rate due to two reasons: the higher level of biomass concentration and the enhanced specific substrate utilization rate indicated by the Monod equation (Equations (15) and (16)).
The attached biomass concentrations (Figure 3C) accumulated to their plateau values (0.033 mg cm−2) for all initial substrate concentrations (in 2 d for 1000 and 2400 mg L−1, and in 4 d for 100 mg L−1), except for the one with 10 mg L−1 substrate, indicating that there might exist a lower limit for substrate concentration. Thus, a substrate concentration lower than 10 mg L−1 should be avoided during inoculation stage. The higher the initial substrate concentration, the longer the attached biomass would sustain: both lasted more than 25 d for 1000 and 2400 mg L−1, but only 23 d for 100 mg L−1 before the biomass disappeared. The electricity generation (Figure 3D) was simulated in a form of external voltage (Uext) for the initial substrate concentrations of 100 and 2400 mg L−1, because both of them fully developed the attached biomass, and were also the typical levels for the low and high substrate concentrations, respectively. During the first few days of anode inoculation, the growing voltage was caused by the growing attached biomass and eventually reached a plateau value of about 0.39 V. Since the substrate lasted longer in the 100 mg L−1 MFC than in the 2400 mg L−1 MFC, the electricity generation also lasted longer by 4 more days. Energy generated was 25.1 and 40 J for 2400 mg L−1 MFC and for 100 mg L−1 MFC, with overall energy efficiencies extracted from acetate (ηoverall) of 0.46% and 17.7%, respectively. Therefore, based on electricity energy generation and overall energy efficiency, the MFC with 100 mg L−1 of substrate substantially outperformed the one with 2400 mg L−1. Controlling the initial substrate concentration was thus demonstrated as a way of regulating the suspended biomass concentration, and was helpful in harvesting more energy from the substrate for electricity.
The growing amount of the attached biomass not only increased the external voltage (Uext), but also improved the external power, evidenced by the gradual expansion of the polarization curves against the time in Figure 4. These simulations were based on the high initial substrate concentration of 2400 mg L−1 in order to avoid a noticeable substrate decrease in 2 d. The pattern of the curve expansion was similar to that which was observed in the literature [4,6], illustrating the importance of the attached biomass on power generation.
3.2.2. Effect of External Resistor
From the comparisons of external voltage and overall energy efficiency, it could be seen that under this experimental condition, a 100 mg L−1 of initial substrate worked best among the four tested substrate concentrations. The next step of this study simulated the impact of the external resistor on the batch mode MFC voltage and power generation as well as overall energy efficiency. In MFC study, the internal resistance (Rin) is used for indicating the overall resistance of a reactor, which is a useful index because varying an external resistor to the value of internal resistance generates the maximum external power density [21]. Depending on the reactor design and operation, the values of Rin might differ but usually was within a range of several hundreds of Ohms, which was also in accordance with the observations (332 Ω in the experimental study; and 471 Ω in the simulation study) in MFC reactors in this study. In order to see the effect of external resistors on MFC energy and power generation, a range of resistor covering the values of internal resistance was chosen for simulation, i.e., 10, 300, 1000, and 2200 Ω.
The simulation results were presented in Figure 5. The smaller the value of the external resistor was, the more rapidly the substrate was consumed (Figure 5A), which was also observed in two-chamber MFC reactors for organic matter removal [22,23]. The main reason was that the increased heat generation, which depicted the part of energy loss through overpotentials (Equation (24)), consumed the substrate at a higher rate as a result of the increased current with the smaller external resistor [24]. When the resistor reduced to 10 Ω, a major part of the substrate was lost via heat, so that there was not enough substrate to fully support the suspended (Figure 5B) and attached microbial growth. Therefore, the 10-Ω resistor caused an apparently impaired power generation performance due to the failure of the microbial growth. On the other hand, the small resistor was beneficial for organic substrate removal because of its higher substrate utilization rate, being more appropriate for treating high strength wastewater, such as swine wastewater [25]. A greater external resistor yielded a higher external voltage (Figure 5C), and took a longer substrate consumption time. Simulation of external power generation (Figure 5D) confirmed that 300 Ω, which was the closest among the three to the internal resistance observed in this study, generated the largest power. A similar trend was also observed in a previous experimental study [23]. However, this value of resistor sustained a shorter reaction time by 2 to 3 d compared to that of 1000 and 2200 Ω. Overall, the 1000 Ω resistor harvested the most energy from substrate, achieving overall energy efficiency of 20.7% (Table 3). Energy efficiency between 15% and 20% achieved in experimental studies was considered the best cases [26,27], while a value of around 5% was more frequently observed for general cases [27,28].
3.3. Simulation of Continuous Mode MFC
3.3.1. Effect of Influent Substrate Concentration and Dilution Rate
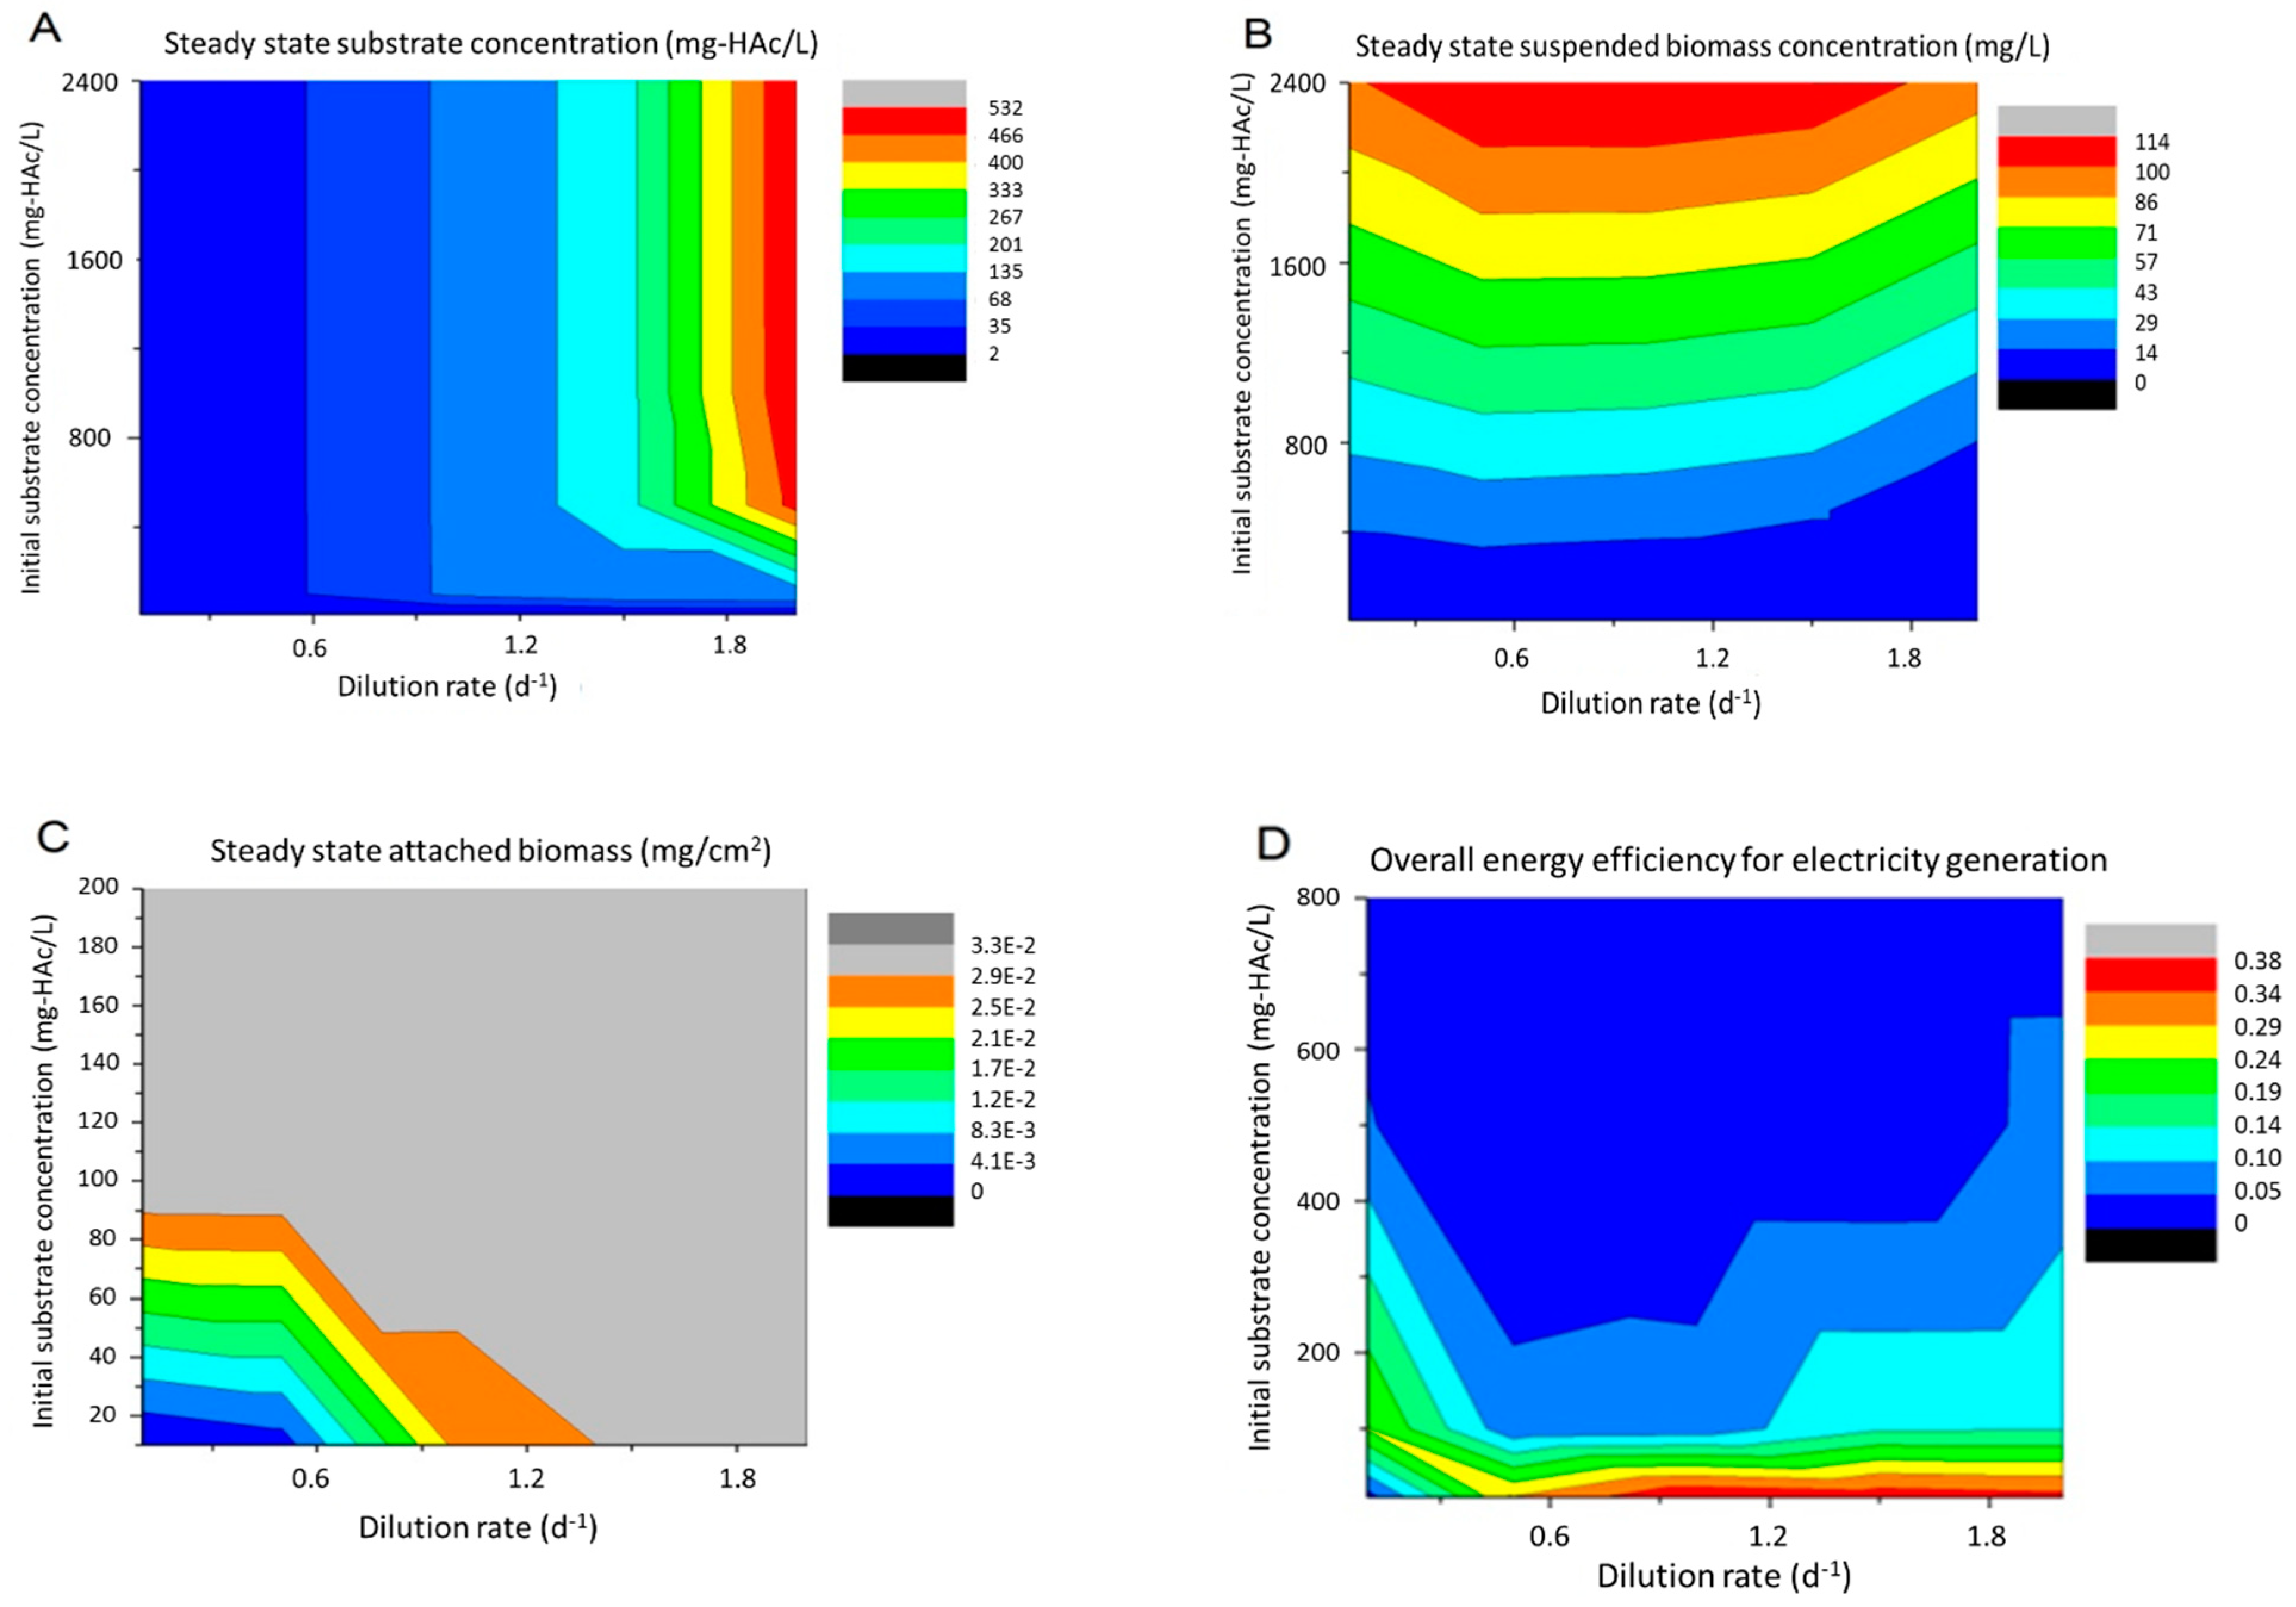
When MFC reactors were operated in continuous mode, the operating variables that might have pronounced effects were dilution rate (D) and influent substrate concentration (Sin). These two variables controlled the substrate inflow rate and biomass washout rate, and therefore would eventually impact MFC power generation and energy efficiency at steady state. So in the simulation, the dilution rate was varied between 0.1 to 2 d−1. The upper limit was chosen to be less than the maximum microbial specific growth rate (2.4 d−1) to prevent biomass washout. The influent substrate (HAc) concentration was between 10 to 2400 mg L−1. The results, including the substrate concentration, suspended biomass concentration, attached biomass concentration and overall energy efficiency, were plotted in Figure 6. Please note that the external power (Pext) was not considered in the simulation of varying S0 and D, because it was found that when assuming the attached biomass was fully grown at steady state, the external power was a function of the external resistor, rather than a function of these two operating variables. It should be noted that little effort in MFC studies of varying these operating parameters was found in continuous mode, so literature data for comparison were not available.
At a given level of the influent substrate concentration, the steady state substrate concentration went up with the increasing dilution rate, basically due to the increased substrate inflow to the reactor (Figure 6A). When the influent substrate concentration was higher than 500 mg L−1, the concentration did not have much impact on the steady state substrate concentration at a given dilution rate. But when the influent concentration was lower than 500 mg L−1 and the dilution rate was greater than 1.5 d−1, the steady state concentration increased along with the influent concentration. The suspended biomass concentration obviously increased with the influent substrate concentration in a linear manner at any dilution rate (Figure 6B). The dilution rate between 0.5 and 1 d−1 resulted in a maximum suspended biomass at a given influent substrate concentration, because a lower rate caused substrate limitation and a higher rate could partially wash out suspended biomass. The attached biomass was more stable and could generally achieve its maximum in most cases (Figure 6C), except for the cases of Sin, which were much lower than 100 mg L−1 and were too low to provide enough carbon sources for supporting the bacterial growth and attachment. As to the overall energy efficiency, it could be concluded that a higher influent substrate concentration reduced the efficiency (Figure 6D). The only exception was the case with about 10 mg L−1 of influent substrate and 0.1 d−1 of dilution rate, under which condition the attached biofilm was not fully mature, due to substrate deficiency, so the MFC did not generate electricity. Considering the tradeoff between higher electrical power generation (reflected by the attached biomass concentration, which was the catalyst) and acceptable overall energy efficiency, it was recommended to operate MFC with about 100 mg L−1 of influent substrate concentration. Meanwhile, at this substrate concentration, the choice of a lower dilution rate, e.g., 0.1 d−1, would help achieve lower effluent substrate and better removal efficiency, and the choice of a larger dilution rate, e.g., 2 d−1, might otherwise help generate more electric energy.
3.3.2. Effect of External Resistor
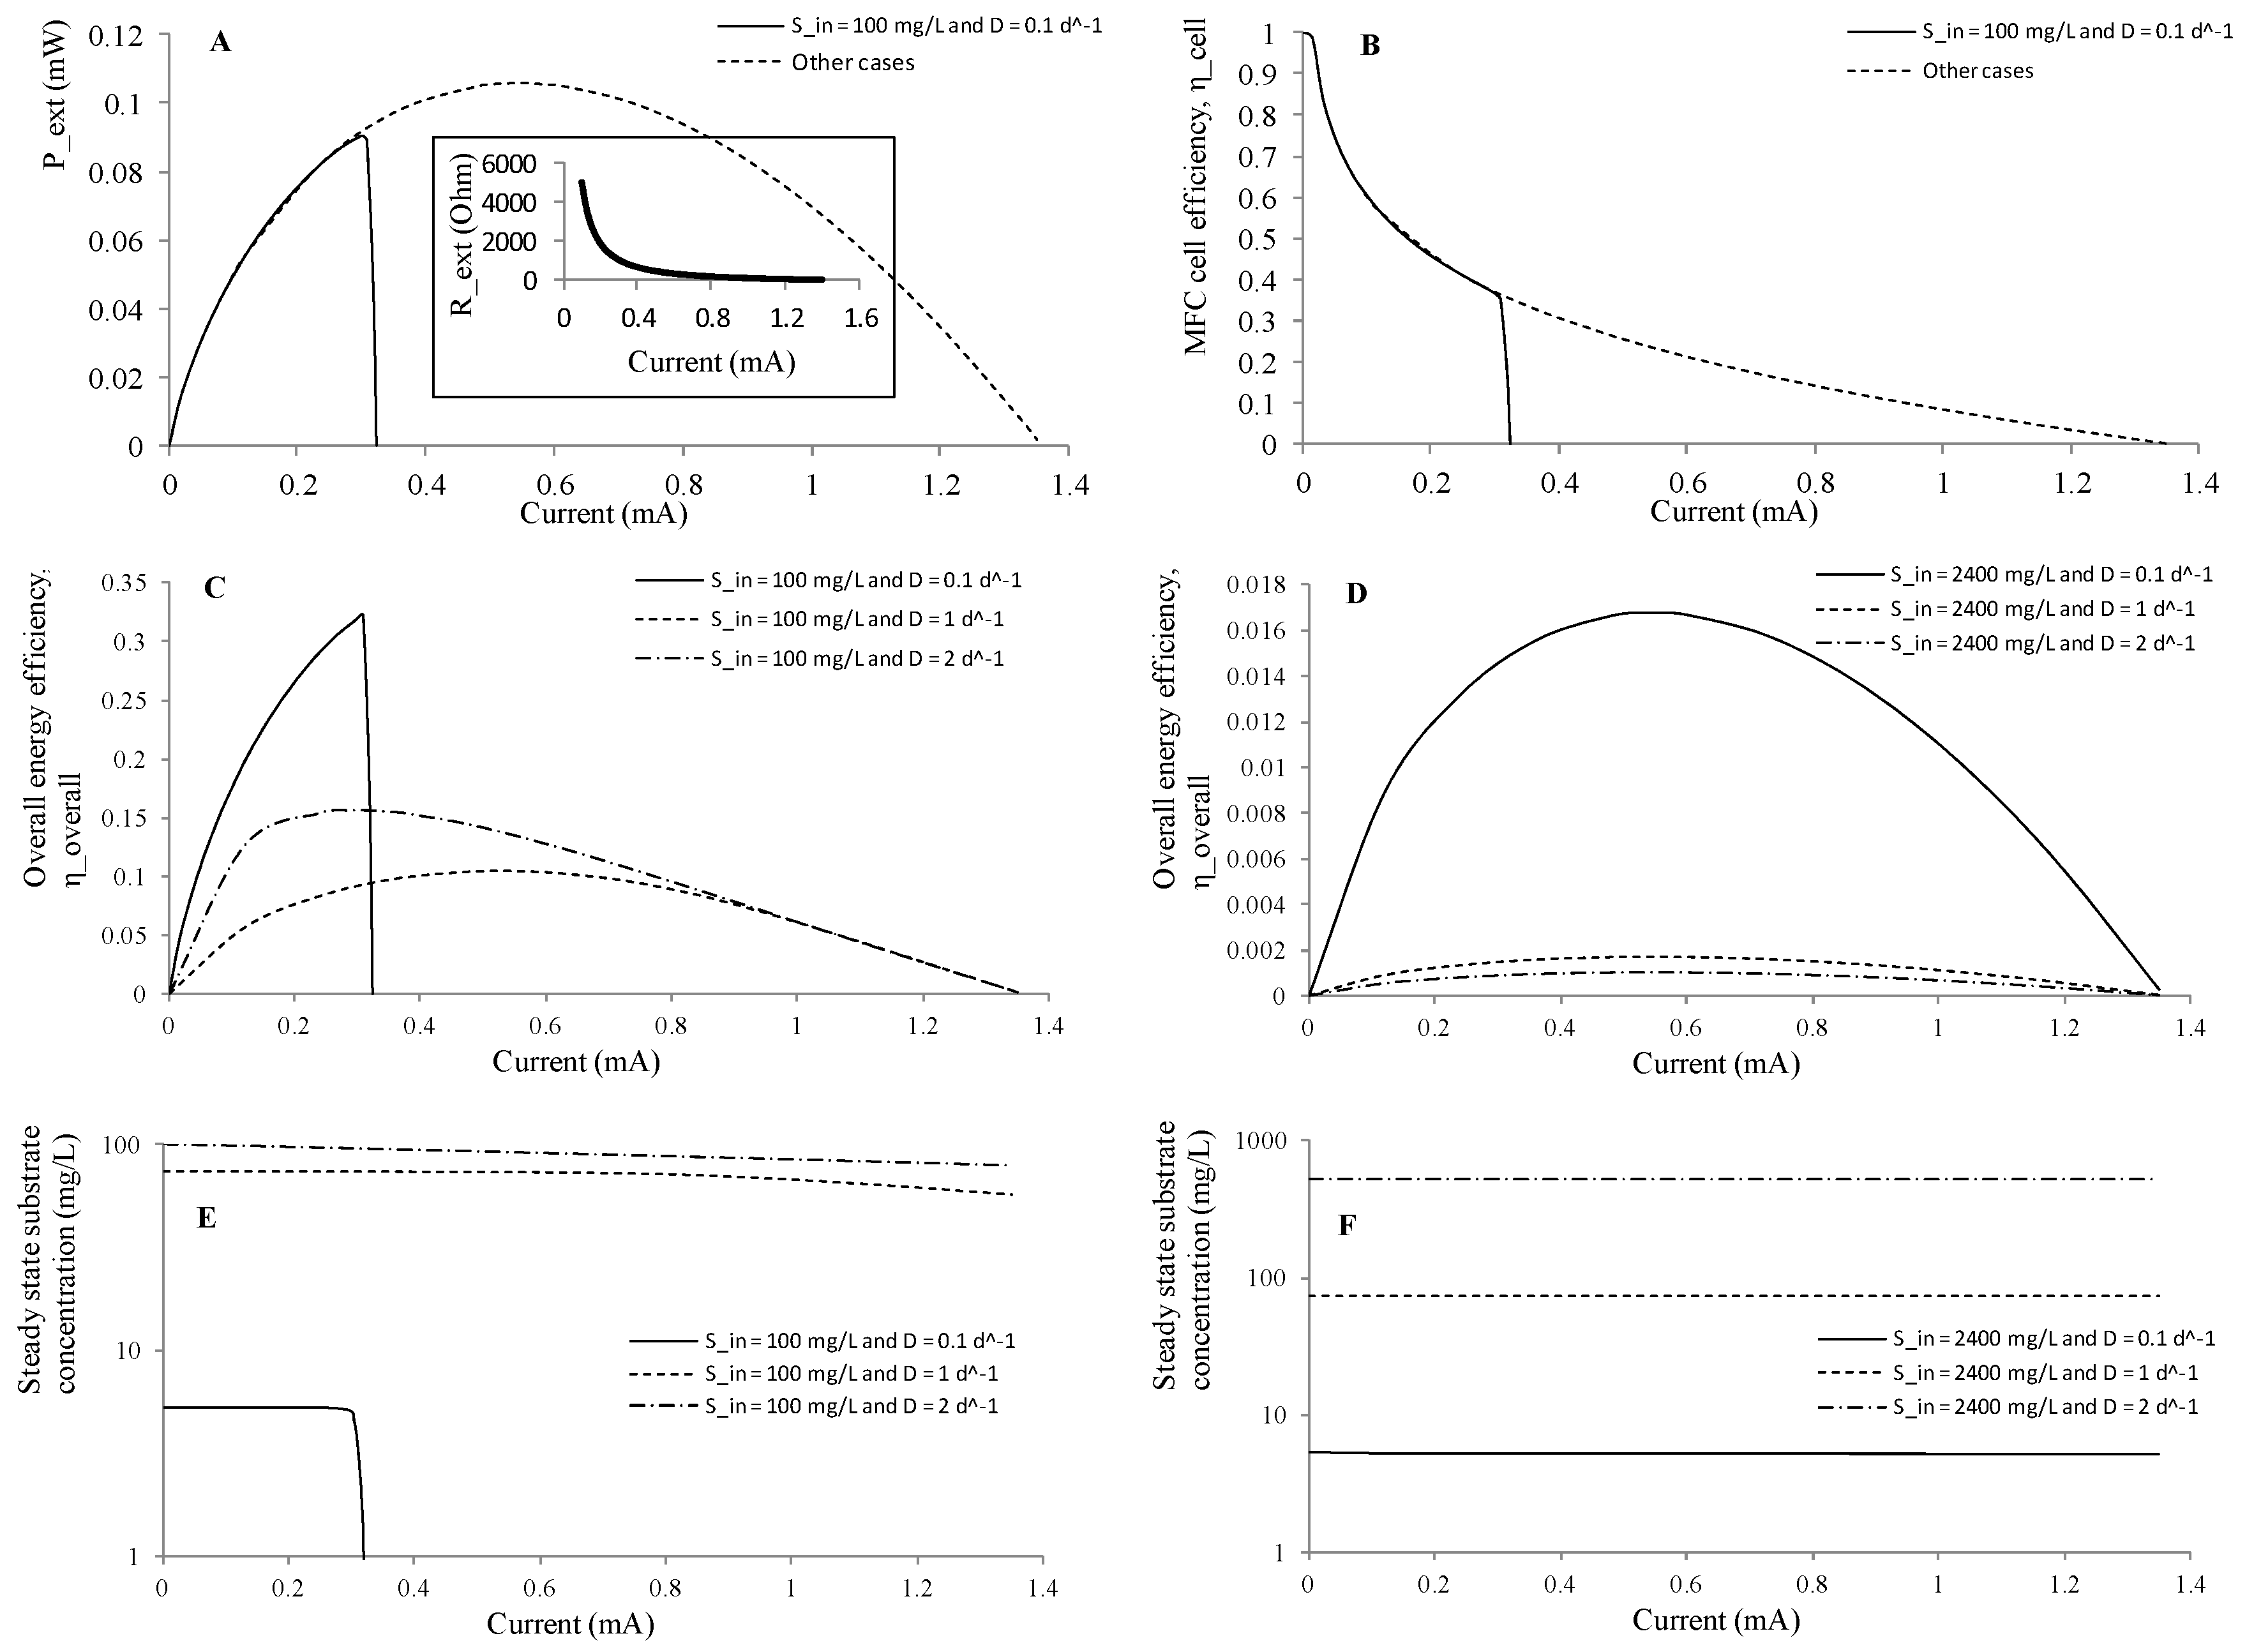
The next simulation was implemented for changing electrical currents by varying Rext at the operating conditions of Sin and D listed in Table 4. The relationship between Rext and current I was depicted in the inset of Figure 7A. These results were useful for determining a suitable range of the external resistor for better substrate removal, power generation or overall energy recovery. As shown in Figure 7A and Table 4, all cases resulted in a maximum power generation (Pext, max) of 0.106 mW at Rext of 352 Ω, except for the case of the lowest substrate loading (Sin = 100 mg L−1 and D = 0.1), which had a highest power of 0.091 mW at Rext of 1007 Ω. For the lowest substrate loading, a further decrease of Rext distributed more organic substrate utilization for heat generation and would finally lead to a system failure without electrical generation due to substrate limitation for biomass growth. On the contrary, all the MFCs with enough substrate generated the same external powers at given Rext. Figure 7B plotted the results of MFC cell efficiency (ηcell, defined in Equation (28)), which showed that MFC cell efficiency decreased with the increasing circuit current (or the decreasing external resistor) because of the increased heat loss through the cell (Equation (24)). Again, the curve of the lowest substrate loading differed from the others and was interrupted at Rext less than 928 Ω due to insufficient substrate available for biomass growth.
Figure 7C,D showed the overall energy efficiencies for the influent substrate concentrations of 100 and 2400 mg L−1, respectively. For the lower substrate cases, the maximum overall energy efficiencies (ηoverall, max) were between 0.105 and 0.322, and were achieved at different external resistors depending on dilution rates (928 Ω at D = 0.1 d−1; 405 Ω at D = 1 d−1; and 1017 Ω at D = 2 d−1). For the higher substrate cases, the maximum overall energy efficiencies were between 0.0011 and 0.0167, and were achieved at Rext = 352 Ω at which the Pext, max values were concurrently obtained. Therefore, the lower substrate concentration reactor had one or two orders of magnitude of higher overall efficiency than that of the higher substrate concentration. This substantial difference was a result of more proliferated biomass growth at higher substrate concentrations and the biomass in turn consumed more substrate. Please also note that the internal resistance Rin estimated by polarization curves was 471 Ω, and was independent of these operating parameters. The steady state substrate concentration (S) and substrate removal were almost staying unchanging at different electrical current (Figure 7E,F), but depended on the influent substrate concentration and dilution rate, as discussed earlier. Removal efficiencies greater than 94.7% or about 100% were achieved at Sin = 100 mg L−1 and D = 0.1 d−1, and Sin = 2400 mg L−1 and D = 0.1 d−1, respectively.
4. Conclusions
The model proposed in this study was based on the assumption that the anode attached to the bacterial monolayer served as biocatalysts for MFC exoelectrogenesis. By modifying the Freter model and combining it with the Butler–Volmer equation, this model could adequately describe the processes of electricity generation, substrate utilization, and suspended and attached biomass growth, in both batch and continuous operating mode. MFC performances were impacted by various operating variables such as initial substrate concentration, external resistor, influent substrate concentration, and dilution rate, and their interactions, which were revealed by data simulation to be complicated. The simulation results explained that in batch mode, an intermediate initial substrate concentration (S0 about 100 mg L−1 at this reactor configuration) was appropriate to achieve maximum overall energy efficiency. With the S0 of 100 mg L−1, an external resistor (about 300 Ω) with the value of around the internal resistance (Rin of about 471 Ω) could boost the power generation, and a resistor of about twice (about 1000 Ω) that value achieved better overall energy efficiency. However, a small external resistor should be adopted for MFC reactors aiming to rapidly remove organic substrates. In continuous mode and at Rext = 2200 Ω, the anode-attached biomass could fully grow when the influent substrate concentration was equal to or higher than 100 mg L−1 at any dilution rates within the tested range. The maximum external power of 0.106 mW could be achieved at Rext = 352 Ω when there was enough substrate to sustain the power generation. An influent substrate concentration of 100 mg L−1 achieved the overall energy efficiency greater than 10%. The high substrate concentration, e.g., 2400 mg L−1, encouraged substantial biomass growth and thus reduced the overall energy efficiency to less than 2%. For the low influent substrate concentration (100 mg L−1), the maximum power generation and overall energy efficiency could not be concurrently achieved, and operating MFC at an external resistor Rext close to the internal resistance (Rin) or two of Rin was recommended to obtain optimal values for both indices. Overall, this relatively simple model provided a convenient way for evaluating and optimizing performance of MFC reactors by regulating operating parameters.
Author Contributions
All authors were involved in conceiving and designing the experiments. H.L. and S.X.W. conducted the experiments and analyzed the data. H.L. wrote the manuscript with S.X.W. and J.Z. reviewing the draft and providing edits and corrections. J.Z. finalized the final version and acted as the submitting and corresponding author for the manuscript.
Funding
This research received no external funding.
Conflicts of Interest
The authors declare no conflicts of interest.
References
- Logan, B.E. Exoelectrogenic bacteria that power microbial fuel cells. Nat. Rev. Microbiol. 2009, 7, 375–381. [Google Scholar] [CrossRef] [PubMed]
- Ren, Z.; Ward, T.E.; Regan, J.M. Electricity production from cellulose in a microbial fuel cell using a defined binary culture. Environ. Sci. Technol. 2007, 41, 4781–4786. [Google Scholar] [CrossRef] [PubMed]
- Rezaei, F.; Xing, D.; Wagner, R.; Regan, J.M.; Richard, T.L.; Logan, B.E. Simultaneous cellulose degradation and electricity production by Enterobacter cloacae in a microbial fuel cell. Appl. Environ. Microb. 2009, 75, 3673–3678. [Google Scholar] [CrossRef] [PubMed]
- Picioreanu, C.; Head, I.M.; Katuri, K.P.; van Loosdrecht, M.C.M.; Scott, K. A computational model for biofilm-based microbial fuel cells. Water Res. 2007, 41, 2921–2940. [Google Scholar] [CrossRef] [PubMed]
- Hamelers, H.V.M.; Ter Heijne, A.; Stein, N.; Rozendal, R.A.; Buisman, C.J.N. Butler-Volmer-Monod model for describing bio-anode polarization curves. Bioresour. Technol. 2011, 102, 381–387. [Google Scholar] [CrossRef] [PubMed]
- Ren, Z.; Ramasamy, R.P.; Cloud-Owen, S.R.; Yan, H.; Mench, M.M.; Regan, J.M. Time-course correlation of biofilm properties and electrochemical performance in single-chamber microbial fuel cells. Bioresour. Technol. 2011, 102, 416–421. [Google Scholar] [CrossRef] [PubMed]
- Bond, D.R.; Lovley, D.R. Electricity production by Geobacter sulfurreducens attached to electrodes. Appl. Environ. Microb. 2003, 69, 1548–1555. [Google Scholar] [CrossRef]
- Freter, R.; Brickner, H.; Fekete, J.; Vickerman, M.M.; Carey, K.E. Survival and implantation of Escherichia coli in the intestinal tract. Infect. Immun. 1983, 39, 686–703. [Google Scholar] [PubMed]
- Mašić, A.; Eberl, H.J. Persistence in a Single Species CSTR Model with Suspended Flocs and Wall Attached Biofilms. Bull. Math. Boil. 2012, 74, 1001–1026. [Google Scholar] [CrossRef] [PubMed]
- Liu, H.; Logan, B.E. Electricity generation using an air-cathode single chamber microbial fuel cell in the presence and absence of a proton exchange membrane. Environ. Sci. Technol. 2004, 38, 4040–4046. [Google Scholar] [CrossRef] [PubMed]
- Schecher, W.; McAvoy, D. MINEQL+ Version 4.5; Environmental Research Software: Hallowell, ME, USA, 1998. [Google Scholar]
- Logan, B.E. Microbial Fuel Cells, 1st ed.; Wiley-Interscience: Hoboken, NJ, USA, 2008. [Google Scholar]
- Schröder, U. Anodic electron transfer mechanisms in microbial fuel cells and their energy efficiency. Phys. Chem. Chem. Phys. 2007, 9, 2619–2629. [Google Scholar] [CrossRef] [PubMed]
- Zeng, Y.; Choo, Y.F.; Kim, B.H.; Wu, P. Modelling and simulation of two-chamber microbial fuel cell. J. Power Sources 2010, 195, 79–89. [Google Scholar] [CrossRef]
- Neyerlin, K.; Gu, W.; Jorne, J.; Gasteiger, H.A. Study of the exchange current density for the hydrogen oxidation and evolution reactions. J. Electrochem. Soc. 2007, 154, B631–B635. [Google Scholar] [CrossRef]
- Batstone, D.J.; Keller, J.; Angelidaki, I.; Kalyuzhnyi, S.; Pavlostathis, S.; Rozzi, A.; Sanders, W.; Siegrist, H.; Vavilin, V. The IWA Anaerobic Digestion Model No 1(ADM 1). Water Sci. Technol. 2002, 45, 65–73. [Google Scholar] [CrossRef] [PubMed]
- Liu, J.; Lowy, D.; Baumann, R.; Tender, L. Influence of anode pretreatment on its microbial colonization. J. Appl. Microbiol. 2007, 102, 177–183. [Google Scholar] [CrossRef] [PubMed] [Green Version]
- Freguia, S.; Rabaey, K.; Yuan, Z.; Keller, J. Non-catalyzed cathodic oxygen reduction at graphite granules in microbial fuel cells. Electrochim. Acta 2007, 53, 598–603. [Google Scholar] [CrossRef]
- Freguia, S.; Rabaey, K.; Yuan, Z.; Keller, J. Sequential anode-cathode configuration improves cathodic oxygen reduction and effluent quality of microbial fuel cells. Water Res. 2008, 42, 1387–1396. [Google Scholar] [CrossRef] [PubMed] [Green Version]
- Wang, B.; Han, J.-I. A single chamber stackable microbial fuel cell with air cathode. Biotechnol. Lett. 2009, 31, 387–393. [Google Scholar] [CrossRef] [PubMed]
- Fan, Y.; Sharbrough, E.; Liu, H. Quantification of the internal resistance distribution of microbial fuel cells. Environ. Sci. Technol. 2008, 42, 8101–8107. [Google Scholar] [CrossRef] [PubMed]
- Jia, Y.H.; Tran, H.T.; Kim, D.H.; Oh, S.J.; Park, D.H.; Zhang, R.H.; Ahn, D.H. Simultaneous organics removal and bio-electrochemical denitrification in microbial fuel cells. Bioprocess Biosyst. Eng. 2008, 31, 315–321. [Google Scholar] [CrossRef] [PubMed]
- Katuri, K.P.; Scott, K.; Head, I.M.; Picioreanu, C.; Curtis, T.P. Microbial fuel cells meet with external resistance. Bioresour. Technol. 2011, 102, 2758–2766. [Google Scholar] [CrossRef] [PubMed]
- Mench, M.M. Fuel Cell Engines; John Wiley & Sons: Hoboken, NJ, USA, 2008. [Google Scholar]
- Wu, X.; Yao, W.; Zhu, J. Effect of pH on continuous biohydrogen production from liquid swine manure with glucose supplement using an anaerobic sequencing batch reactor. Int. J. Hydrogen Energy 2010, 35, 6592–6599. [Google Scholar] [CrossRef]
- Jung, S.; Regan, J.M. Comparison of anode bacterial communities and performance in microbial fuel cells with different electron donors. Appl. Microbiol. Biotechnol. 2007, 77, 393–402. [Google Scholar] [CrossRef] [PubMed]
- Liu, H.; Cheng, S.; Logan, B.E. Power generation in fed-batch microbial fuel cells as a function of ionic strength, temperature, and reactor configuration. Environ. Sci. Technol. 2005, 39, 5488–5493. [Google Scholar] [CrossRef] [PubMed]
- He, Z.; Wagner, N.; Minteer, S.D.; Angenent, L.T. An upflow microbial fuel cell with an interior cathode: Assessment of the internal resistance by impedance spectroscopy. Environ. Sci. Technol. 2006, 40, 5212–5217. [Google Scholar] [CrossRef] [PubMed]
Figure 1.
A schematic of organic substrate and energy flow in a microbial fuel cell.

Figure 2.
Electrochemical parameters estimation and validation; (A) the electrode potential during polarization experiment; (B,C) model validation for experimental data from another identical microbial fuel cell (MFC) reactor (B for Uext, and C for Pext); and (D) comparison of the simulated and experimental Uext during inoculation stage.

Figure 3.
Simulated time-course profiles of process variables at different initial substrate concentration. (A) the substrate concentration; (B) suspended biomass concentration; (C) attached biomass concentration, and (D) the external voltage Uext.
Figure 3.
Simulated time-course profiles of process variables at different initial substrate concentration. (A) the substrate concentration; (B) suspended biomass concentration; (C) attached biomass concentration, and (D) the external voltage Uext.

Figure 4.
Simulated polarization curves at different moments of inoculation. Attached bacteria concentration reached a plateau value after about 2 d, and the polarization curves did not change much thereafter.
Figure 4.
Simulated polarization curves at different moments of inoculation. Attached bacteria concentration reached a plateau value after about 2 d, and the polarization curves did not change much thereafter.

Figure 5.
Simulated batch performance of MFC with 100 mg L−1 initial substrate at different external resistors. (A) substrate concentration; (B) suspended biomass concentration; (C) external voltage; and (D) power generation.
Figure 5.
Simulated batch performance of MFC with 100 mg L−1 initial substrate at different external resistors. (A) substrate concentration; (B) suspended biomass concentration; (C) external voltage; and (D) power generation.

Figure 6.
Process variables and MFC performance predicted at steady state under different dilution rates and influent substrate concentrations. (A) steady state substrate concentration; (B) suspended biomass concentration; (C) attached biomass concentration, and (D) the overall energy efficiency ηext.

Figure 7.
Simulated MFC performance at steady state under different electrical currents (or external resistors), dilution rates and influent substrate concentrations. (A) steady state power density; (B) MFC cell energy efficiency; (C) overall energy efficiency at Sin = 100 mg L−1; and (D) Sin = 2400 mg L−1; (E) effluent substrate concentration at Sin = 100 mg L−1; and (F) Sin = 2400 mg L−1.


Table 1.
Constants, and design and operating parameters of a microbial fuel cell system. NHE: the normal hydrogen electrode.
Table 1.
Constants, and design and operating parameters of a microbial fuel cell system. NHE: the normal hydrogen electrode.
| Parameter Symbol | Description | Value | Units |
|---|---|---|---|
| Physical | |||
| F | Faraday’s constant | 96,485 | C/mol |
| R | Ideal gas constant | 8.314 | J/mol/K |
| T | Room temperature | 298 | K |
| ΔHc | Heat of combustion of acetic acid | −875,000 | J/mol |
| M | Relative molecular weight of acetic acid | 60 | g/mol |
| Electrochemical | |||
| EA0’ | Formal reduction potential of anode | −0.335 | V vs. NHE |
| EC0’ | Formal reduction potential of cathode | 0.51 | V vs. NHE |
| Reactor configuration | |||
| A | Projected surface area of electrode | 0.002 | m2 |
| d | Distance between anode and cathode | 0.075 | m |
| V | Volume of MFC reactor | 1.55 × 10⁻⁴ | m3 |
| δ | Ratio of anode surface area to MFC volume | 13 | m2/m3 |
| Rc | Contact resistance of MFC | 20 | Ω |
| Operating | |||
| D | Dilution rate | 0–2 | d−1 |
| Sin | Substrate concentration | 10–2400 | g/m3 |
| Q | Flow rate | 0–7.8 × 10⁻⁵ | m3/d |
| σ | Conductivity of MFC medium | 1.1 | S/m |
| Rext | External resistor | 2200 | Ω |
| [HCO3−] | Bicarbonate concentration | 1 × 10−4.5 | kmol/m3 |
| PO2 | Partial oxygen pressure at cathode | 0.2 | atm |
| pH | −log10 of proton concentration | 7 | Dimensionless |
| Microbial | |||
| γ | Biomass yield from substrate | 0.05 | g/g |
| ku | Death rate of suspended bacteria | 0.02 | d−1 |
| kw | Death rate of attached bacteria | 0.02 | d−1 |
| α | Bacterial attachment rate | 0.05 | d−1 |
| β | Bacterial detachment rate | 0.05 | d−1 |
| mu | Maximum specific growth rate of suspended bacteria | 2.4 | d−1 |
| mu | Maximum specific growth rate of attached bacteria | 2.4 | d−1 |
| au | Half saturation coefficient of suspended bacteria | 100 | g/m3 |
| aw | Half saturation coefficient of attached bacteria | 100 | g/m3 |
| wmax | Maximum bacterial attachment | 0.33 a | g/m2 |
a The maximum amount of bacteria attached on electrode was calculated from the bacteria dimensions observed in SEM images, and this value was close to the literature values of 0.47 to 0.52 g/m2 [7].
Table 2.
Estimated electrochemical parameters for MFC in this study.
| Estimated Parameters | Description | Value | Units |
|---|---|---|---|
| αA | Charge transfer coefficient, anode | 0.318 | Dimensionless |
| αC | Charge transfer coefficient, cathode | 0.694 | Dimensionless |
| joA | Exchange current density, anode | 62.5 | mA/m2 |
| joAU | Unit exchange current, anode | 0.189 | mA/mg |
| joC | Exchange current density, cathode | 0.975 | mA/m2 |
Table 3.
Simulated peak power and energy recovery from an external resistor, and overall energy efficiency (ηoverall) at different external resistors.
Table 3.
Simulated peak power and energy recovery from an external resistor, and overall energy efficiency (ηoverall) at different external resistors.
| External Resistor | Peak Power | Energy Recovered | ηoverall |
|---|---|---|---|
| 10 Ω | 0.0142 mW | 1.96 J | 0.87% |
| 300 Ω | 0.0998 mW | 37.1 J | 16.4% |
| 1000 Ω | 0.0882 mW | 47.3 J | 20.7% |
| 2200 Ω | 0.0685 mW | 40.0 J | 17.7% |
Table 4.
Simulated MFC performance: substrate removal, power generation and overall energy efficiency.
Table 4.
Simulated MFC performance: substrate removal, power generation and overall energy efficiency.
| Sin | D | Steady State S | S Removal | Pext, max | ηoverall, max | Rina | Rext, Pb | Rext, ηc |
|---|---|---|---|---|---|---|---|---|
| mg/L | d−1 | mg/L | % | mW | Ω | Ω | Ω | |
| 100 | 0.1 | 0–5.26 | >94.7 | 0.091 | 0.322 | 471 | 1007 | 928 |
| 1 | 57.6–73.5 | 26.5–42.4 | 0.106 | 0.105 | 352 | 405 | ||
| 2 | 79–100 | <21.0 | 0.106 | 0.156 | 352 | 1017 | ||
| 2400 | 0.1 | 5.17–5.26 | 100 | 0.106 | 0.0167 | 352 | 352 | |
| 1 | 73.9 | 96.9 | 0.106 | 0.0017 | 352 | 352 | ||
| 2 | 531 | 77.9 | 0.106 | 0.0011 | 352 | 352 |
a The internal resistance was estimated from the transiently simulated polarization curves in the electrical current range between 0.18 to 0.82 mA. b This was the value of the external resistor where the Pext, max was achieved. c This was the value of the external resistor where the ηoverall, max was achieved.
© 2018 by the authors. Licensee MDPI, Basel, Switzerland. This article is an open access article distributed under the terms and conditions of the Creative Commons Attribution (CC BY) license (http://creativecommons.org/licenses/by/4.0/).
Share and Cite
MDPI and ACS Style
Lin, H.; Wu, S.; Zhu, J. Modeling Power Generation and Energy Efficiencies in Air-Cathode Microbial Fuel Cells Based on Freter Equations. Appl. Sci. 2018, 8, 1983. https://0-doi-org.brum.beds.ac.uk/10.3390/app8101983
AMA Style
Lin H, Wu S, Zhu J. Modeling Power Generation and Energy Efficiencies in Air-Cathode Microbial Fuel Cells Based on Freter Equations. Applied Sciences. 2018; 8(10):1983. https://0-doi-org.brum.beds.ac.uk/10.3390/app8101983
Chicago/Turabian StyleLin, Hongjian, Sarah (Xiao) Wu, and Jun Zhu. 2018. "Modeling Power Generation and Energy Efficiencies in Air-Cathode Microbial Fuel Cells Based on Freter Equations" Applied Sciences 8, no. 10: 1983. https://0-doi-org.brum.beds.ac.uk/10.3390/app8101983
Note that from the first issue of 2016, this journal uses article numbers instead of page numbers. See further details here.