Nonlinearity of Microwave Electric Field Coupled Rydberg Electromagnetically Induced Transparency and Autler-Townes Splitting

 and
and 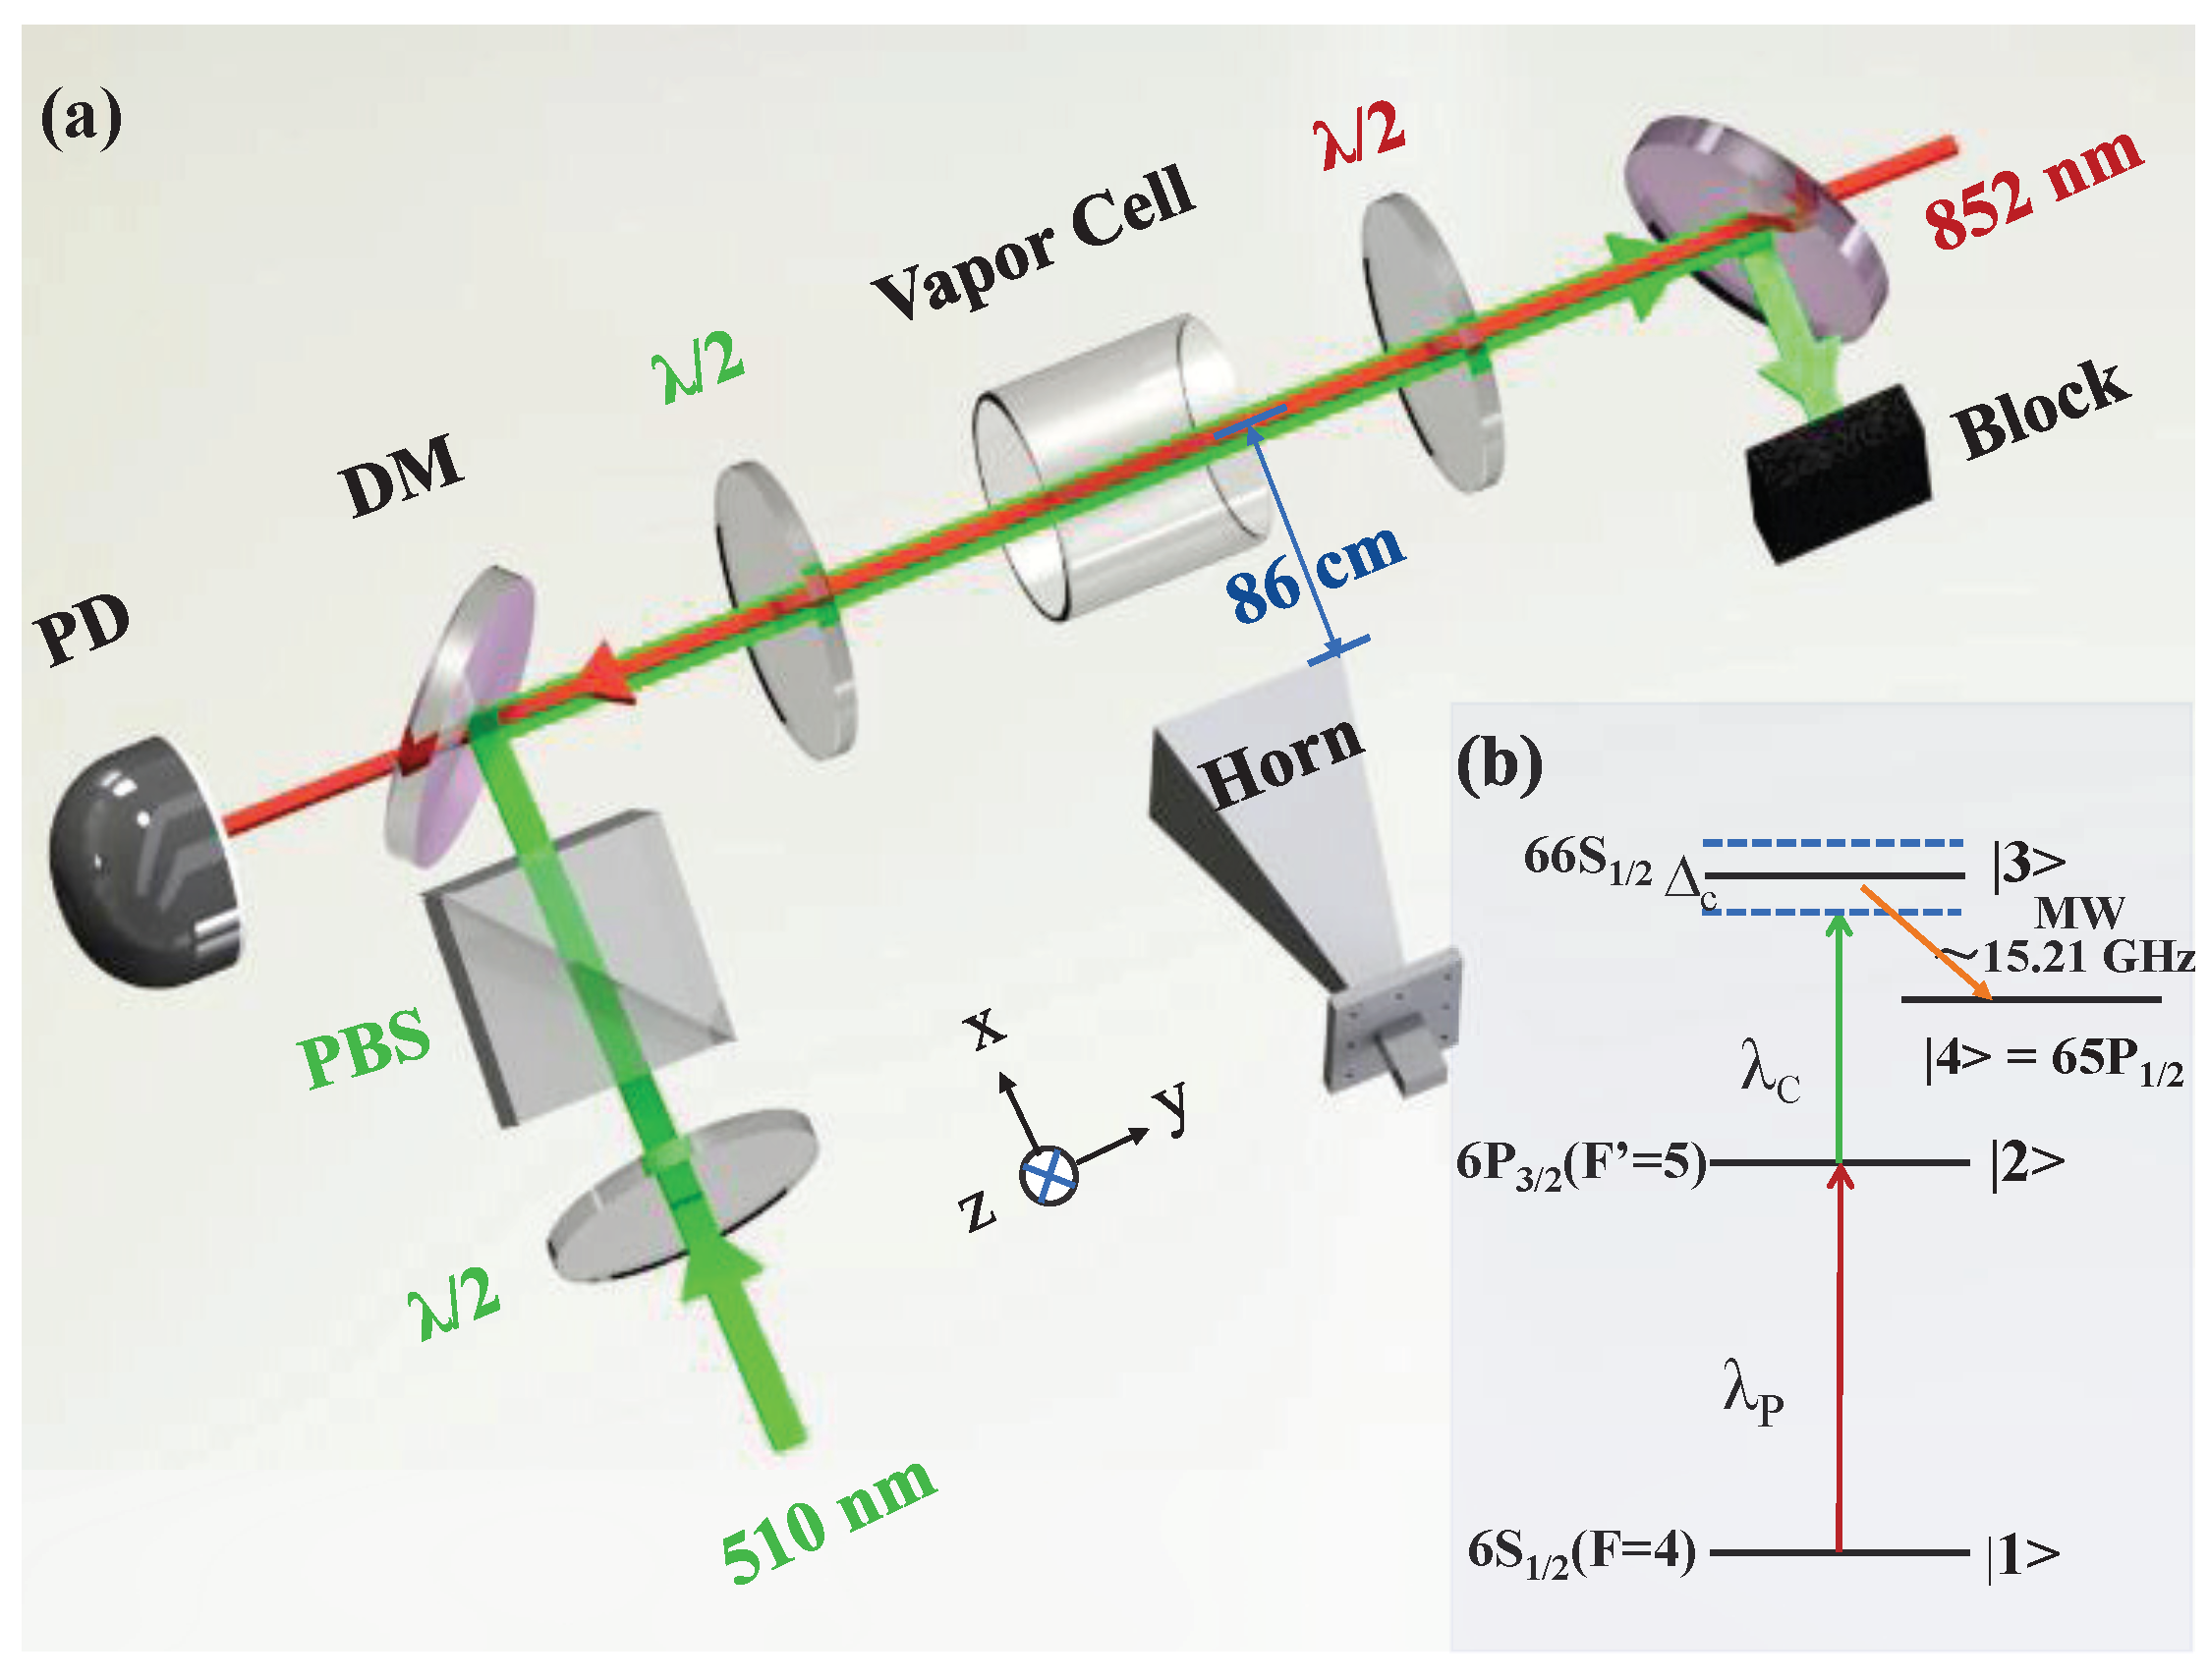
Abstract
:1. Introduction
2. Experimental Setup
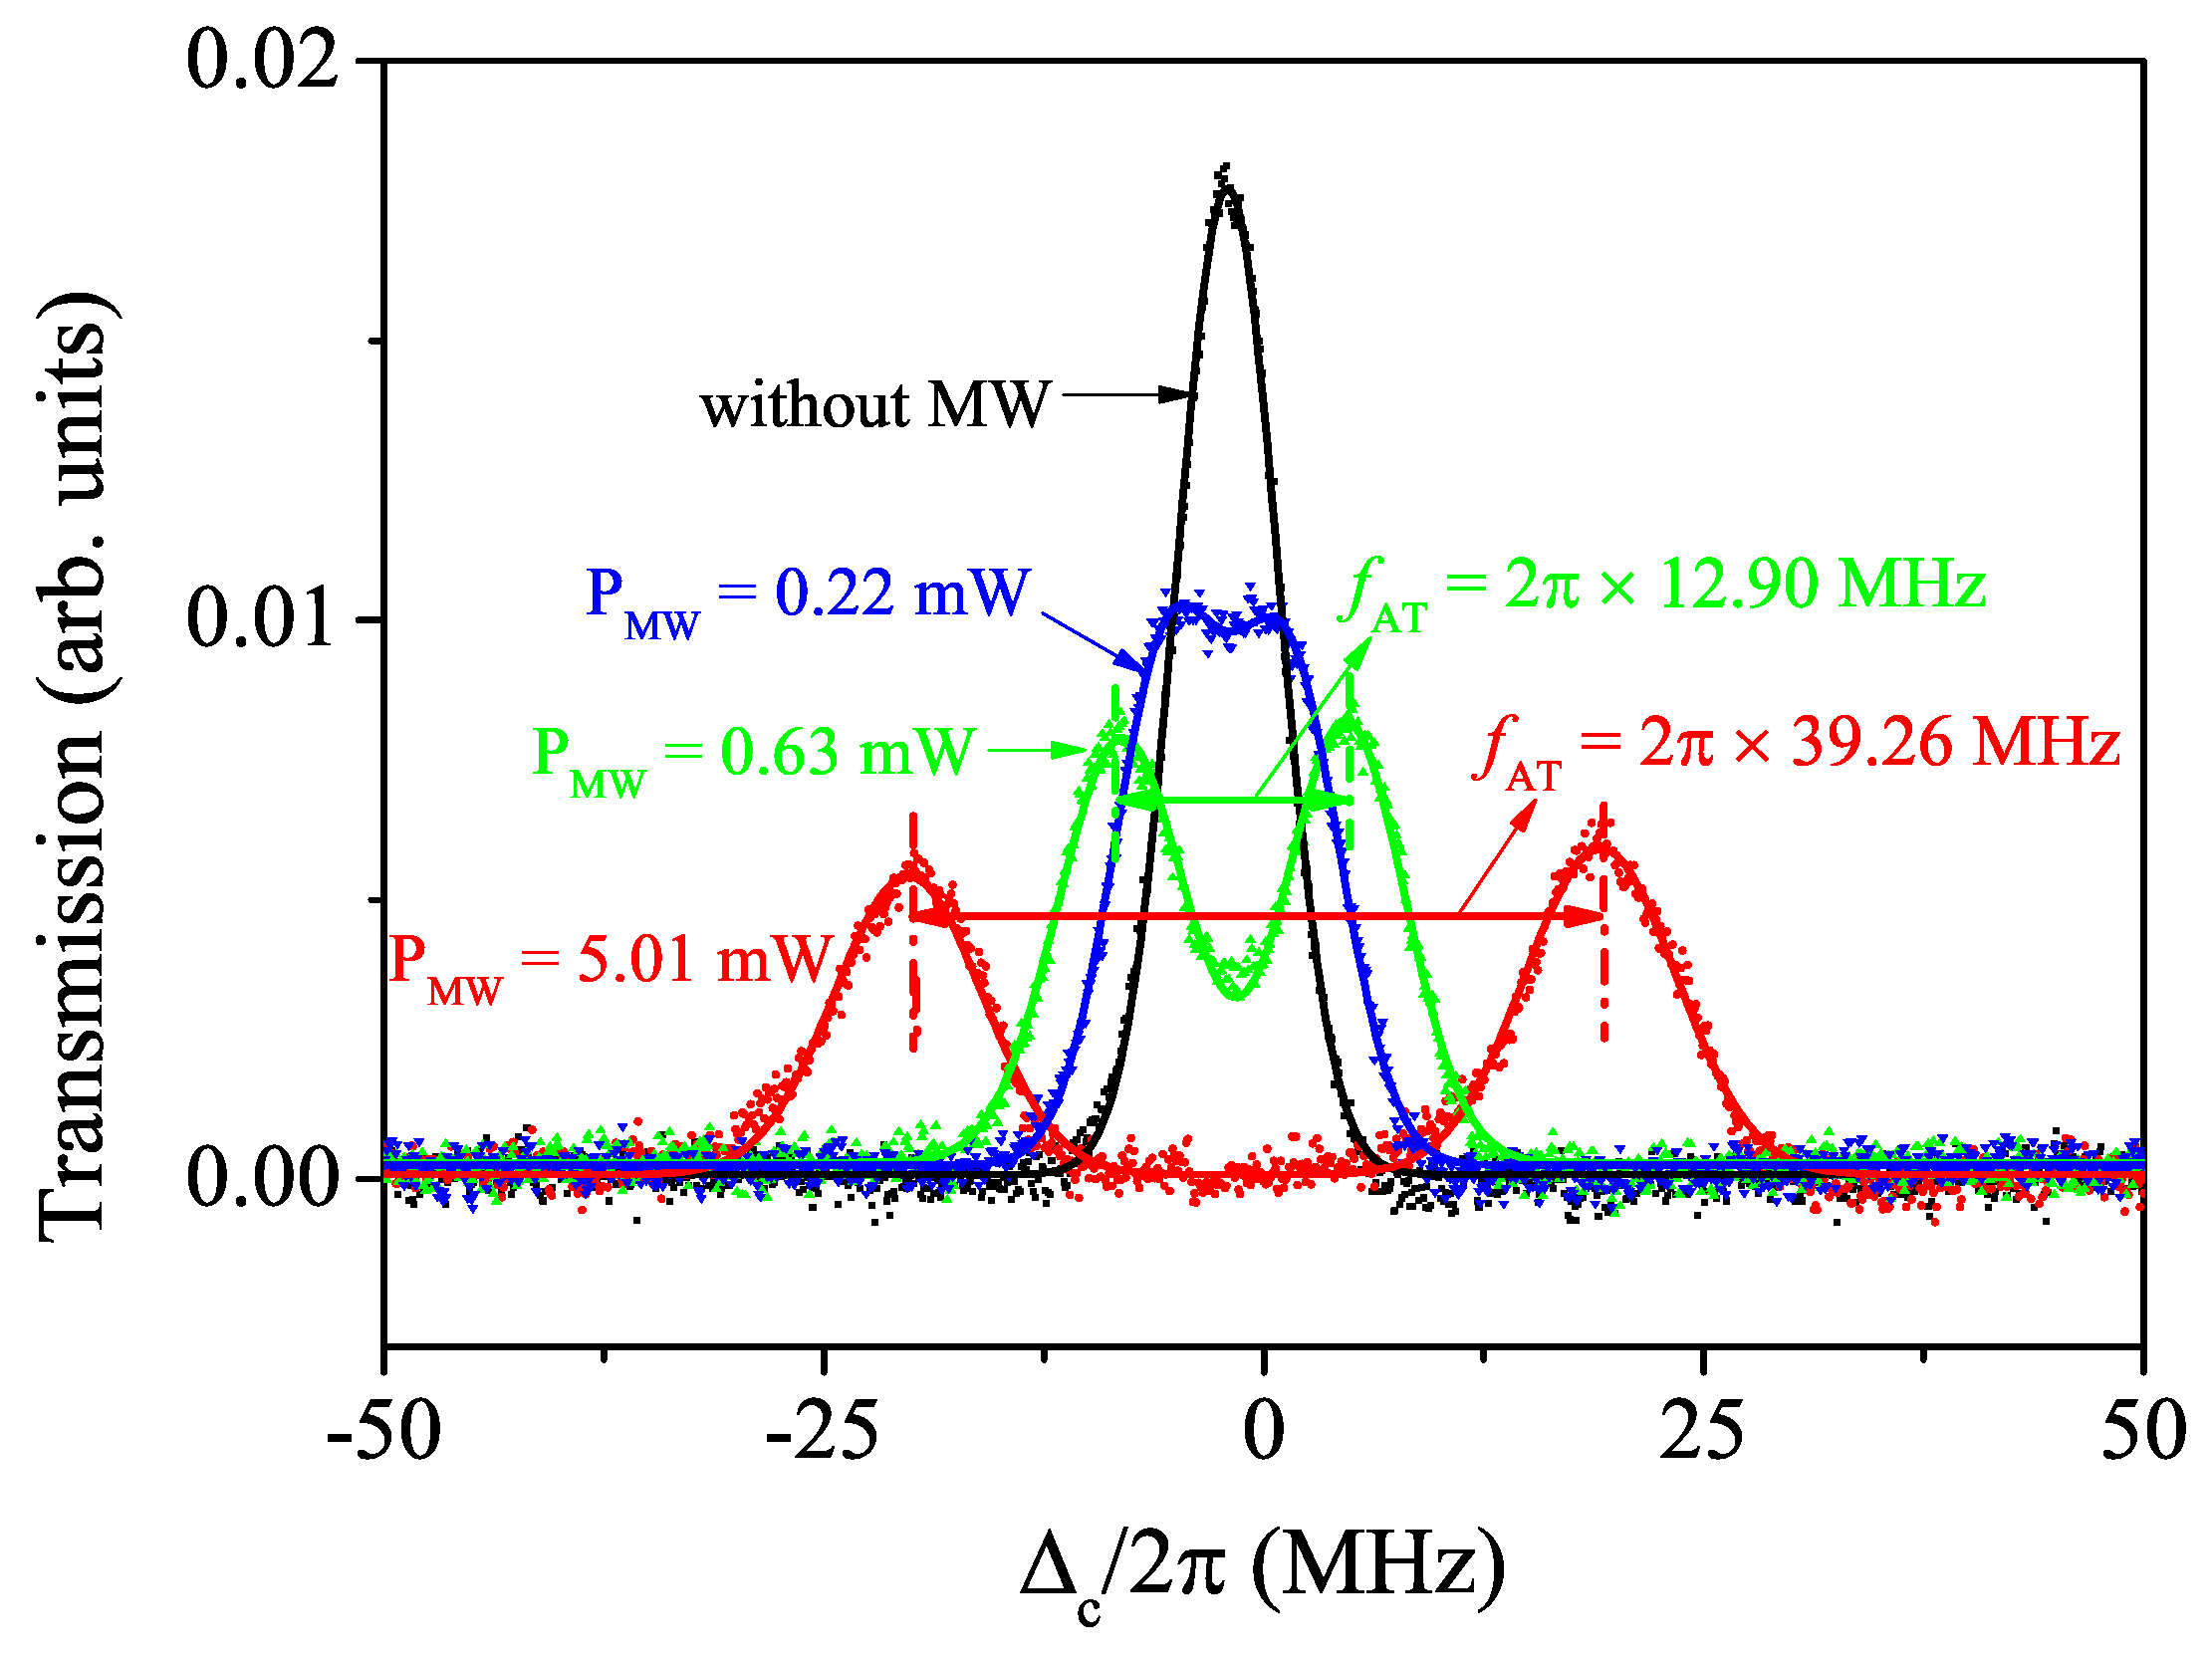
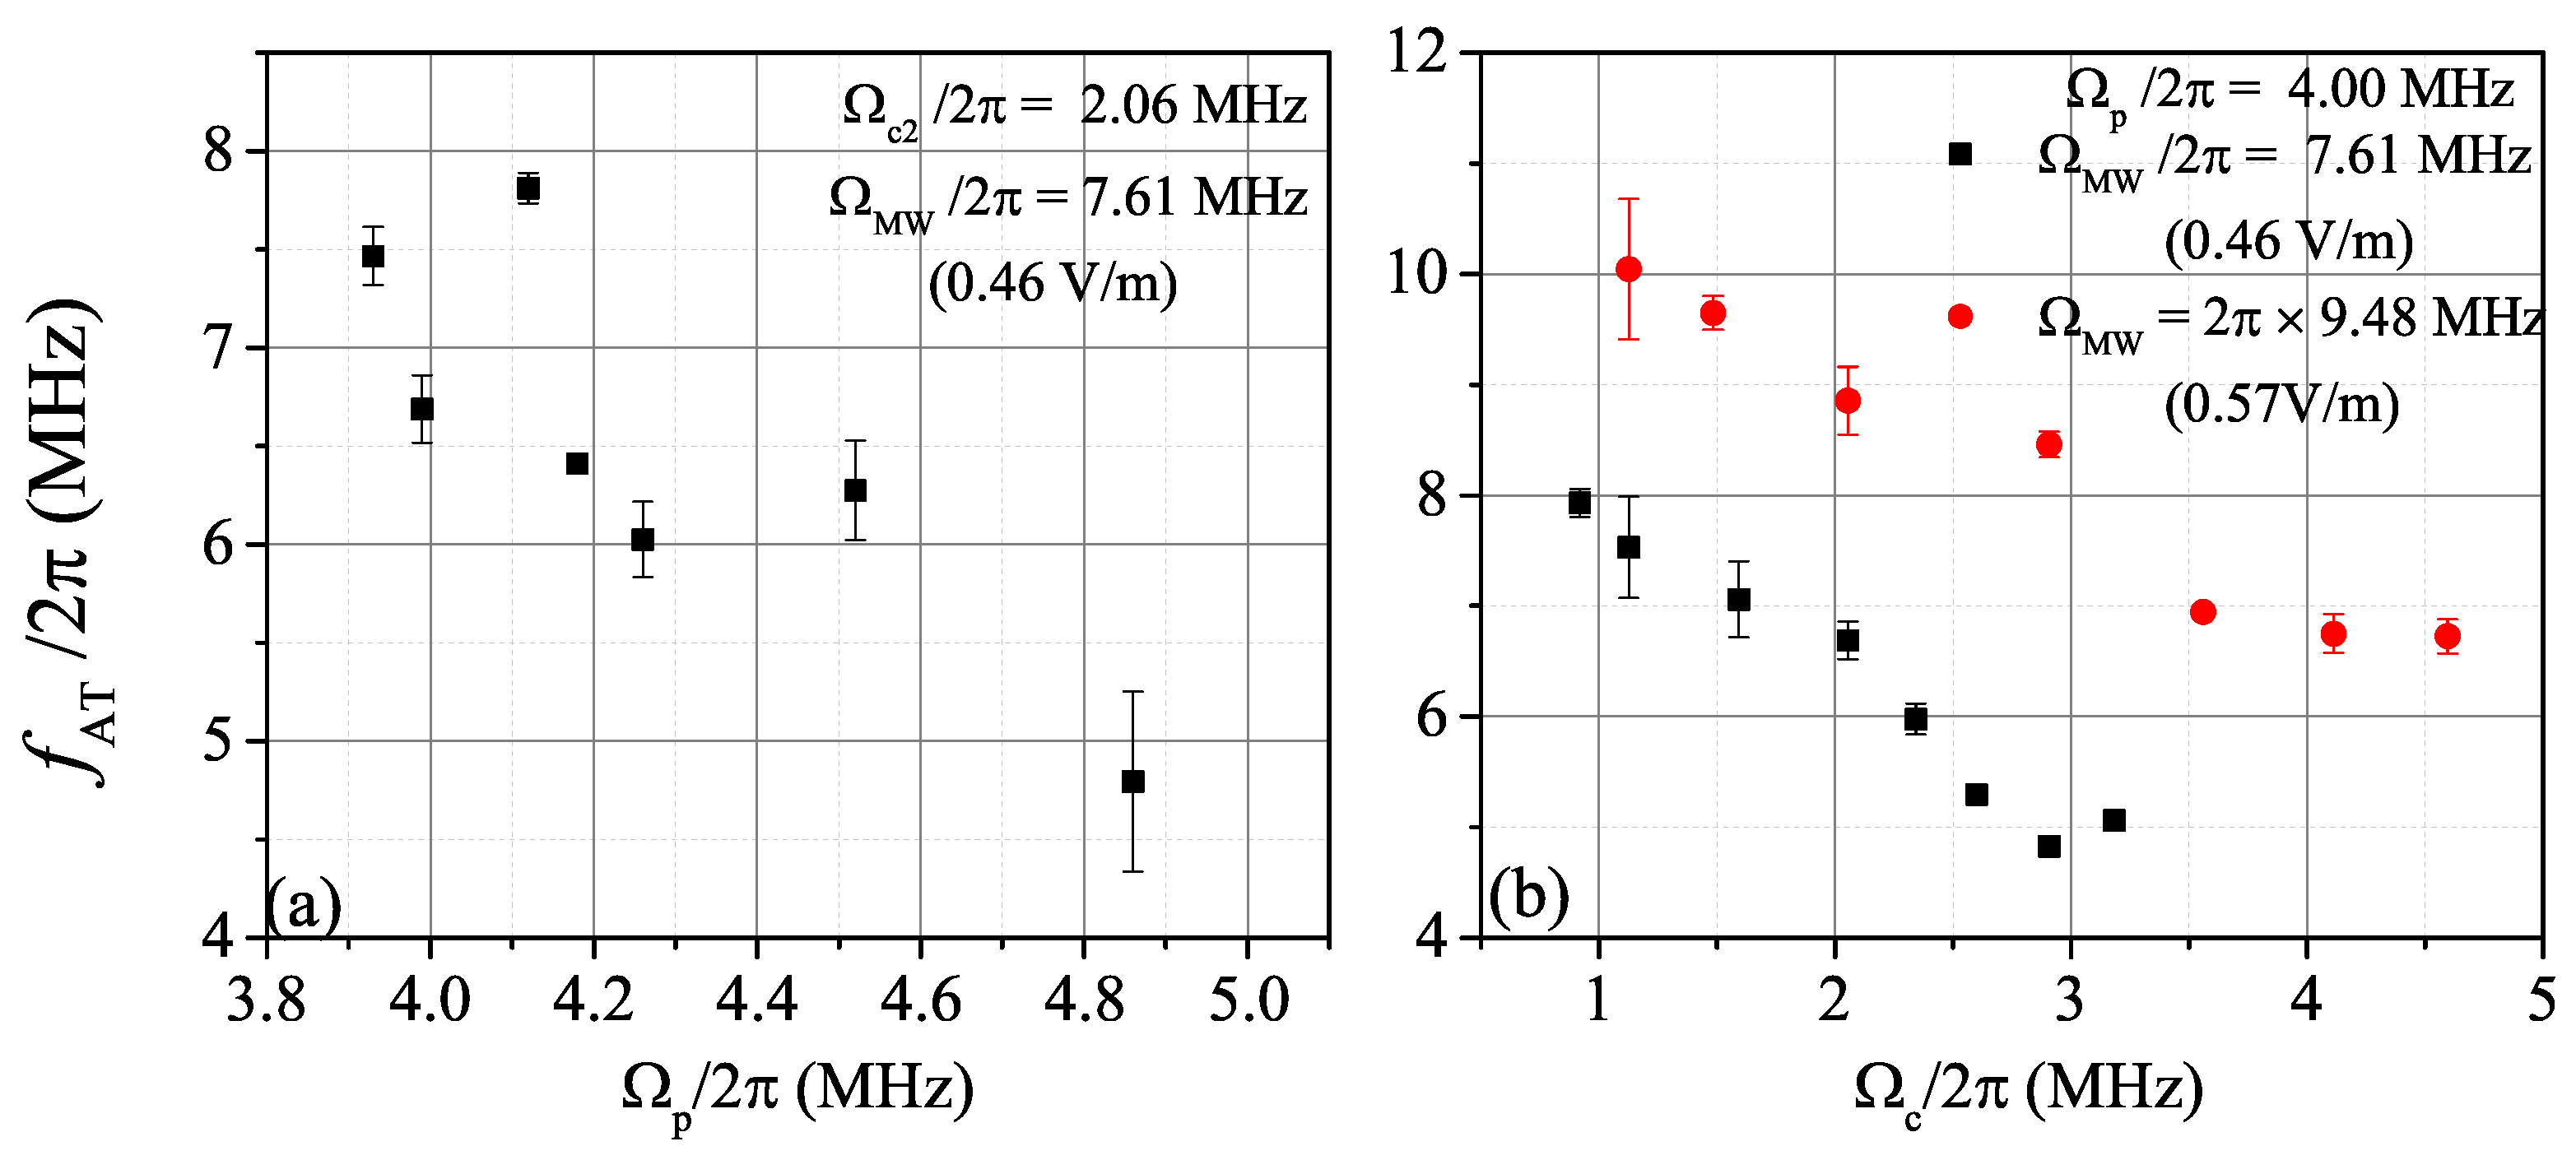
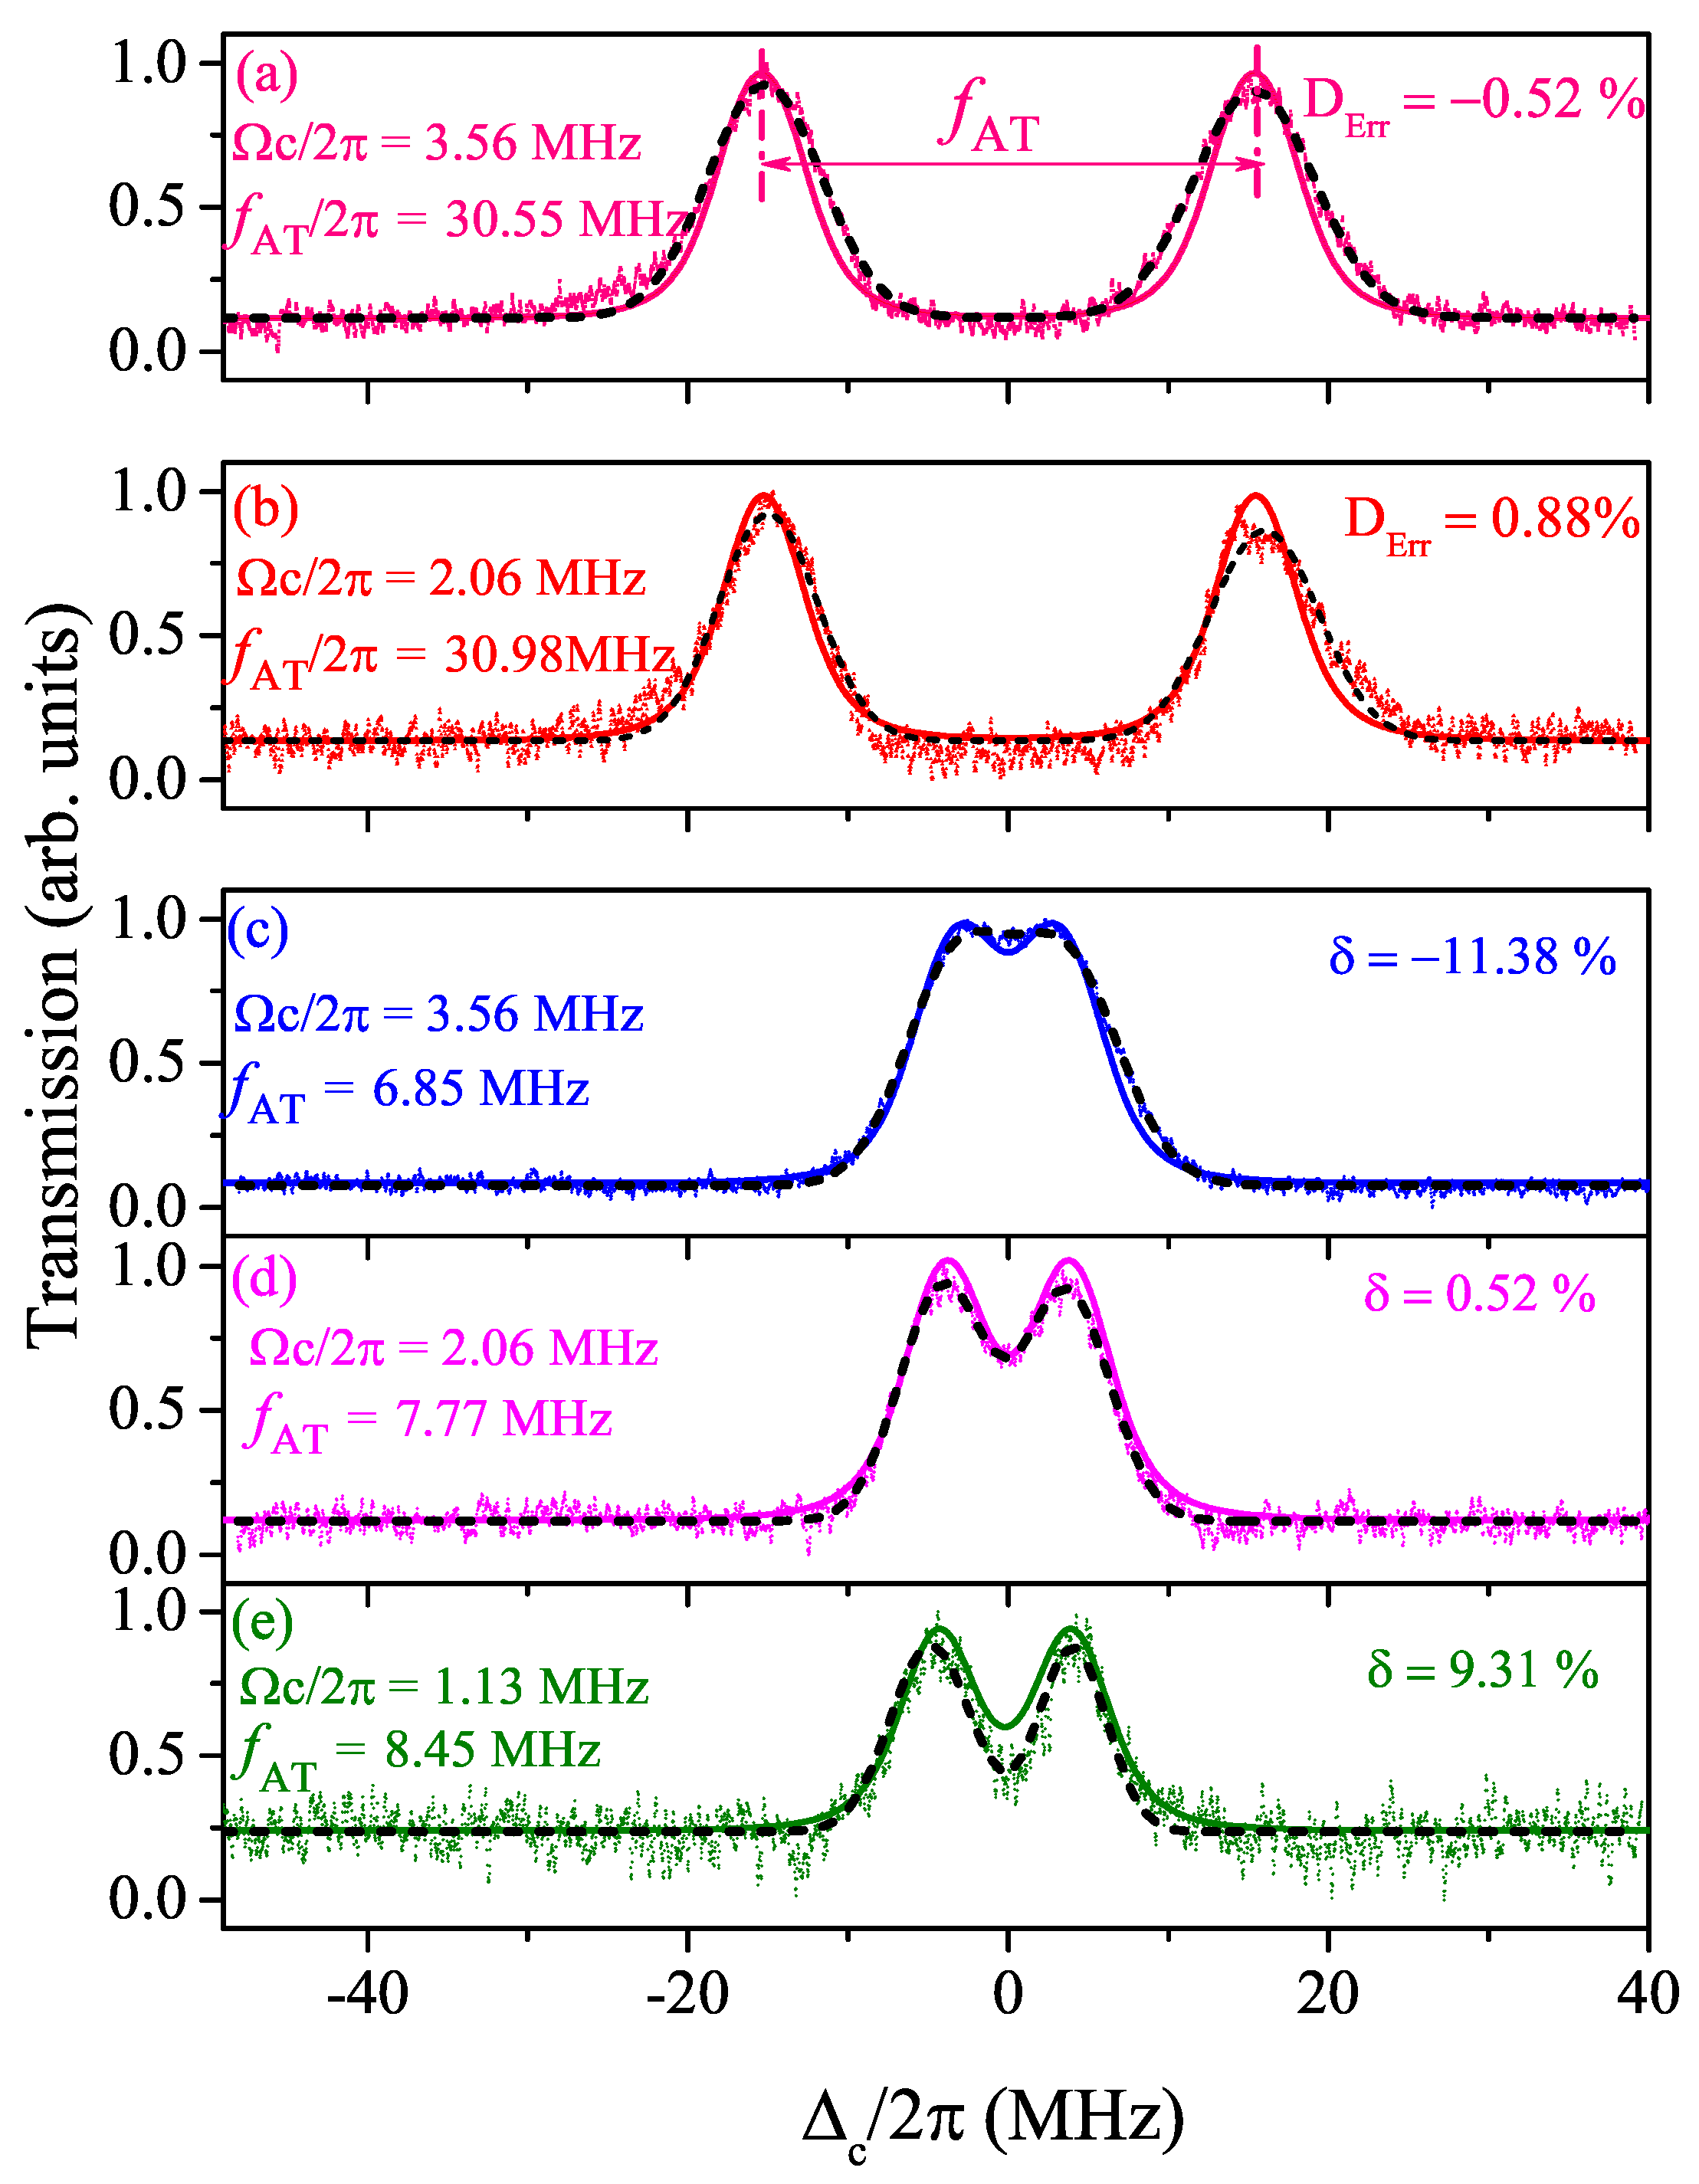
3. Results and Discussion
4. Conclusions
Author Contributions
Funding
Conflicts of Interest
References
- Martin, M.J.; Bishof, M.; Swallows, M.D.; Zhang, X.; Benko, C.; von-Stecher, J.; Gorshkov, A.V.; Rey, A.M.; Ye, J. A quantum many-body spin system in an optical lattice clock. Science 2013, 341, 632–636. [Google Scholar] [CrossRef]
- Biedermann, G.W.; Wu, X.; Deslauriers, L.; Roy, S.; Mahadeswaraswamy, C.; Kasevich, M.A. Testing gravity with cold-atom interferometers. Phys. Rev. A 2015, 91, 033629. [Google Scholar] [CrossRef]
- Savukov, I.M.; Seltzer, S.J.; Romalis, M.V.; Sauer, K.L. Tunable atomic magnetometer for detection of radio-frequency magnetic fields. Phys. Rev. Lett. 2005, 95, 063004. [Google Scholar] [CrossRef]
- Horsley, A.; Du, G.-X.; Pellaton, M.; Affolderbach, C.; Mileti, G.; Treutlein, P. Imaging of relaxation times and microwave field strength in a microfabricated vapor cell. Phys. Rev. A 2013, 88, 063407. [Google Scholar] [CrossRef]
- Horsley, A.; Du, G.-X.; Treutlein, P. Widefield microwave imaging in alkali vapor cells with sub-100 μm resolution. New J. Phys. 2015, 17, 112002. [Google Scholar] [CrossRef]
- Patton, B.; Versolato, O.O.; Hovde, D.C.; Corsini, E.; Higbie, J.M.; Budker, D. A remotely interrogated all-optical 87Rb magnetometer. Appl. Phys. Lett. 2012, 101, 083502. [Google Scholar] [CrossRef]
- Budker, D.; Romalis, M. Optical magnetometry. Nat Phys. 2007, 3, 227–234. [Google Scholar] [CrossRef]
- Gallagher, T.F. Rydberg Atoms; Cambridge University Press: New York, NY, USA, 1994. [Google Scholar]
- Holloway, C.L.; Gordon, J.A.; Jefferts, S.; Schwarzkopf, A.; Anderson, D.A.; Miller, S.A.; Thaicharoen, N.; Raithel, G. Broadband Rydberg Atom-Based Electric-Field Probe for SI-Traceable,Self-Calibrated Measurements. IEEE Trans. Antennas Propag. 2014, 62, 6169–6182. [Google Scholar] [CrossRef]
- Sedlacek, J.A.; Schwettmann, A.; Kübler, H.; Löw, R.; Pfau, T.; Shaffer, J.P. Microwave electrometry with Rydberg atoms in a vapour cell using bright atomic resonances. Nat. Phys. 2012, 8, 819–824. [Google Scholar] [CrossRef]
- Fan, H.Q.; Kumar, S.; Sedlacek, J.; Kübler, H.; Karimkashi, S.; Shaffer, J.P. Atom based RF electric field sensing. J. Phys. B At. Mol. Opt. Phys. 2015, 48, 202001. [Google Scholar] [CrossRef]
- Holloway, C.L.; Simons, M.T.; Gordon, J.A.; Dienstfrey, A.; Anderson, D.A.; Raithel, G. Electric field metrology for SI traceability: Systematic measurement uncertainties in electromagnetically induced transparency in atomic vapor. J. Appl. Phys. 2017, 121, 233106. [Google Scholar] [CrossRef]
- Gordon, J.A.; Holloway, C.L.; Schwarzkopf, A.; Anderson, D.A.; Miller, S.; Thaicharoen, N.; Raithel, G. Millimeter wave detection via Autler-Townes splitting in rubidium Rydberg atoms. Appl. Phys. Lett. 2014, 105, 024104. [Google Scholar] [CrossRef]
- Jiao, Y.C.; Han, X.X.; Yang, Z.W.; Li, J.K.; Raithel, G.; Zhao, J.M.; Jia, S.T. Spectroscopy of cesium Rydberg atoms in strong radio-frequency fields. Phys. Rev. A 2016, 94, 023832. [Google Scholar] [CrossRef]
- Jiao, Y.C.; Hao, L.P.; Han, X.X.; Bai, S.Y.; Raithel, G.; Zhao, J.M.; Jia, S.T. Atom-based radio-frequency field calibration and polarization measurement using cesium nDJ Floquet States. Phys. Rev. Appl. 2017, 8, 014028. [Google Scholar] [CrossRef]
- Fleischhauer, M.; Imamoglu, A.; Marangos, J.P. Electromagnetically induced transparency: Optics in coherent media. Rev. Mod. Phys. 2005, 77, 633–673. [Google Scholar] [CrossRef]
- Mohapatra, A.K.; Jackson, T.R.; Adams, C.S. Coherent optical detection of highly excited Rydberg states using electromagnetically induced transparency. Phys. Rev. Lett. 2007, 98, 113003. [Google Scholar] [CrossRef]
- Fan, H.Q.; Kumar, S.; Daschner, R.; Kübler, H.; Shaffer, J.P. Sub-wavelength microwave electric field imaging using Rydberg atoms inside atomic vapor cells. Opt. Lett. 2014, 39, 3030–3033. [Google Scholar] [CrossRef]
- Holloway, C.L.; Gordon, J.A.; Schwarzkopf, A.; Anderson, D.A.; Miller, S.A.; Thaicharoen, N.; Raithel, G. Sub-wavelength imaging and field mapping via electromagnetically induced transparency and Autler-Townes splitting in Rydberg atoms. Appl. Phys. Lett. 2014, 104, 244102. [Google Scholar] [CrossRef]
- Fan, H.Q.; Kumar, S.; Sheng, J.T.; Shaffer, J.P.; Holloway, C.L.; Gordon, J.A. Effect of vapor-cell geometry on Rydberg-atom-based measurements of radio-frequency electric fields. Phys. Rev. Appl. 2015, 4, 044015. [Google Scholar] [CrossRef]
- Autler, S.H.; Townes, C.H. Stark effect in rapidly varying fields. Phys. Rev. 1955, 100, 703–722. [Google Scholar] [CrossRef]
- Simons, M.T.; Gordon, J.A.; Holloway, C.L. Simultaneous use of Cs and Rb Rydberg atoms for dipole moment assessment and RF electric field measurements via electromagnetically induced transparency. J. Appl. Phys. 2016, 120, 123103. [Google Scholar] [CrossRef]
- Fan, J.B.; Jiao, Y.C.; Hao, L.P.; Xue, Y.M.; Zhao, J.M.; Jia, S.T. Microwave electromagnetically induced transparency and Aulter-Townes spectrum of cesium Rydberg atom. Acta Phys. Sin. 2018, 67, 093201. [Google Scholar]
- Hao, L.P.; Jiao, Y.C.; Xue, Y.M.; Han, X.X.; Bai, S.Y.; Zhao, J.M.; Raithel, G. Transition from electromagnetically induced transparency to Autler-Townes splitting in cold cesium atoms. New J. Phys. 2018, 20, 073024. [Google Scholar] [CrossRef]
- Scully, M.O.; Zubairy, M.S. Quantum Optics; Cambridge University Press: Cambridge, UK, 1997. [Google Scholar]
- Kumar, S.; Fan, H.Q.; Kübler, H.; Sheng, J.T.; Shaffer, J.P. Atom-based sensing of weak radio frequency electric fields using homodyne readout. Sci. Rep. 2017, 7, 42981. [Google Scholar] [CrossRef] [PubMed]


© 2019 by the authors. Licensee MDPI, Basel, Switzerland. This article is an open access article distributed under the terms and conditions of the Creative Commons Attribution (CC BY) license (http://creativecommons.org/licenses/by/4.0/).
Share and Cite
Hao, L.; Xue, Y.; Fan, J.; Jiao, Y.; Zhao, J.; Jia, S. Nonlinearity of Microwave Electric Field Coupled Rydberg Electromagnetically Induced Transparency and Autler-Townes Splitting. Appl. Sci. 2019, 9, 1720. https://0-doi-org.brum.beds.ac.uk/10.3390/app9081720
Hao L, Xue Y, Fan J, Jiao Y, Zhao J, Jia S. Nonlinearity of Microwave Electric Field Coupled Rydberg Electromagnetically Induced Transparency and Autler-Townes Splitting. Applied Sciences. 2019; 9(8):1720. https://0-doi-org.brum.beds.ac.uk/10.3390/app9081720
Chicago/Turabian StyleHao, Liping, Yongmei Xue, Jiabei Fan, Yuechun Jiao, Jianming Zhao, and Suotang Jia. 2019. "Nonlinearity of Microwave Electric Field Coupled Rydberg Electromagnetically Induced Transparency and Autler-Townes Splitting" Applied Sciences 9, no. 8: 1720. https://0-doi-org.brum.beds.ac.uk/10.3390/app9081720