Decolorization of Orange-G Aqueous Solutions over C60/MCM-41 Photocatalysts
by
 , and
, and
John Kyriakopoulos
1, 
Eleana Kordouli
1,*,
Kyriakos Bourikas
2,
Christos Kordulis
1,3 and
Alexis Lycourghiotis
1 1
Department of Chemistry, University of Patras, GR-26504 Patras, Greece
2
School of Science and Technology, Hellenic Open University, Tsamadou 13-15, GR-26222 Patras, Greece
3
Foundation for Research and Technology, Institute of Chemical Engineering Science (FORTH/ICE-HT), Stadiou str., Platani, P.O. Box 1414, GR-26504 Patras, Greece
*
Author to whom correspondence should be addressed.
Appl. Sci. 2019, 9(9), 1958; https://0-doi-org.brum.beds.ac.uk/10.3390/app9091958
Submission received: 18 April 2019
/
Revised: 8 May 2019
/
Accepted: 9 May 2019
/
Published: 13 May 2019
(This article belongs to the Section Chemical and Molecular Sciences)
Abstract
:The majority of the photocatalysts studied for azo-dye degradation are based on semiconductor materials. Studies reported on non-semiconducting materials are very scarce. In the present work, we studied the fullerene (C60) ability to accelerate photodegradation of the dye’s azo bond in the presence of ascorbic acid. A series of C60 supported on ordered mesoporous silica (MCM-41) catalysts, containing 1, 3, 6, 9, and 12 wt % of fullerene C60, was studied using Orange G (OG) as representative azo-dye. This study showed that partial decolorization is achieved in the dark by simple adsorption of the dye on the bare surface of the carrier. The extent of decolorization increases with the irradiation of the suspension due to photocatalytic degradation of the azo-bond. This is maximized over the sample containing 3 wt % of C60 and it has been attributed to the best combination of the extent of the dye adsorption with the high intrinsic photocatalytic activity of small C60 clusters predominated in this sample. This catalyst proved to be quite stable upon five subsequent photocatalytic cycles, losing less than 5% of its initial activity. No degradation of OG takes place in the absence of ascorbic acid.
1. Introduction
Discharge of industrial effluents containing hazardous contaminants, even at low concentrations, causes a negative impact on the environment [1]. Out of the various pollutants, dyes rank among the most notorious organic contaminants that are discharged into the environment as part of textile, leather, paints, paper, and dye manufacturing [2]. These are synthetic, water soluble, and dispersible organic compounds, which may adversely affect aquatic environment both aesthetically and chemically. Several studies have been addressed to the decolorization of aqueous media via adsorption of dyes on high surface area solids [1,3,4,5,6]. Aqueous media decolorization is also obtained by photocatalytic oxidation of such pollutants over UV irradiated titanium dioxide [7,8,9,10].
Photocatalytic oxidation belongs to advanced oxidation processes (AOPs), which combine powerful oxidizing agents (catalytic initiators) with UV or near-UV light for the removal of resistant organic pollutants and xenobiotics [11,12,13,14,15]. Among them, photocatalytic oxidation has been proven to be a promising technology for water treatment in order to destruct a variety of organic and inorganic contaminants [15,16,17]. The majority of the photocatalysts studied are based on semiconductor materials [18,19]. Studies reported on non-semiconducting materials are very scarce [20,21,22].
UV irradiation produces holes and electrons in the valence and conduction bands of semiconductor materials, respectively. The holes oxidize OH- to OH● free radicals. These are oxidative agents with high oxidative potential and may mineralize the dyes. Hydrogen peroxide also produces hydroxyl radicals and therefore sometimes is added to the reactor for achieving faster photocatalytic oxidation [23]. Photocatalytic degradation of dyes can be also achieved by singlet oxygen which is 1 eV stronger oxidative agent in comparison to the oxygen fundamental state and therefore strongly electrophilic [24].
Fullerenes have attracted special interest as photocatalysts due to their unique structure and properties [25,26]. In particular, the photoreactivity of C60 has received considerable attention due to its electron acceptability, intense absorption in near-UV light, and broad absorbance in the visible light region. A number of studies of our group have been reported dealing with C60 as a photocatalyst [27,28,29,30,31,32]. However, there are very few studies on the photocatalytic performance of C60 in aqueous solutions because it exhibits very low solubility in this solvent. Immobilization of C60 on high surface area supports is expected not only to inhibit aggregation of C60 molecules but also allows recycling of the supported photocatalyst and prevents potential environmental release of fullerene as there is an emerging consensus concerning the in vivo toxicity of these carbon nanoparticles [33].
Non-semiconducting materials like γ-Al2O3, SiO2, and MCM-41 exhibit high surface areas suitable to immobilize highly dispersed C60 moieties [27,29,30,31,32,34]. Recently, the photocatalytic degradation of methyl orange has been achieved even under visible irradiation over C60/SiO2 photo-catalyst in the presence of ascorbic acid [20]. The main advantage of using fullerene for photocatalytic water decontamination lies in its efficiency to activate reactive oxygen species even under visible light. The latter species are able to degrade micropollutants found in water [34]
A critical question at this point is whether the decolorizing activity of supported C60 is limited to methyl orange, eventually related to its molecular structure, or can it be applied generally for decolorizing aqueous systems. This is the reason for which the present study deals with decolorization of aqueous solutions containing Orange G. Orange G is an azo-dye with a wide range of applications (coloring wools and silks; pigmentation of paper, leather, and timber; printing ink; pH indicators; etc.) [10]. It is usually present, as a sodium salt, in two tautomeric forms in aqueous solutions. Organic solvents favor the azo form. In contrast, the hydrozon form predominates in aqueous solutions.
In the present article, we attempt to develop non-semiconducting materials for the decolorization of aqueous media with two main characteristics: very high specific surface area enhancing the adsorption of dyes and quite high photocatalytic activity. Specifically, we studied the decolorization of orange G aqueous solutions over C60/MCM-41 photocatalysts containing 1, 3, 6, 9, and 12 wt % of C60 in the presence of ascorbic acid. The investigation of the relative contribution of adsorption and photocatalysis to the whole decolorization, the determination of the best catalyst composition and a contribution to the decolorization reaction network are among the goals of the present work. To the best of our knowledge, it is the first time that one is attempting to combine the C60 photocatalytic performance with the high adsorption capacity of high surface area ordered mesoporous silica (MCM-41) for decolorization of an aqueous solution.
2. Experimental
2.1. Photocatalysts: Preparation and Characterization
The samples containing 1 and 3 wt % of C60 (1C60/MCM-41, 3C60/MCM-41) were prepared following the dry impregnation procedure [31]. The photocatalysts with 6, 9, and 12 wt % C60 (6C60/MCM-41, 9C60/MCM-41, 12C60/MCM-41) were synthesized by wet impregnation [32]. The MCM-41 mesoporous silica was synthesized according to the method reported in [31]. The impregnating solutions were prepared by dissolving the proper amount of C60 (Merck, Darmstadt, Germany, 99.5%) in 1,2-dichlorobenzene (for synthesis-Merck, Schuchardt, Germany). The impregnated samples were heated at 180 °C for 4 h in air in order the final catalysts to be obtained. The catalysts had been exhaustively characterized in previous contributions of our group [31,32] using N2 adsorption–desorption measurements (Tristar 3000 Micromeritics, Norcross, GA, USA), diffuse reflectance spectra (Varian Cary 3 equipped with an integration sphere, Australia), X-ray diffraction patterns recorded in the 2θ range of 2–10o (Siemens D-500 X-ray diffractometer, Houghton, MI, USA) and in the range of 10–110° (ENRAF NONIOUS FR 590 diffractometer, Holland), infrared spectra (Perkin-Elmer16 PC FT-IR spectrophotometer, Waltham, MA, USA), thermo gravimetric analysis (LabsysTM TG of Setaram, Caluire, France) and transmission electron microscopy (JEOL 2011, New Brunswick, Canada).
2.2. Photocatalytic Tests
The photocatalytic tests were performed at 400 mL aqueous suspensions containing 25 μM of orange G (OG, Merck, Darmstadt, Germany), 0.5 mM of ascorbic acid (AA, Sigma, China), and 300 mg of the photocatalyst. A glass semi-batch photoreactor was used (Heraeus, Hanau, Germany) equipped with magnetic stirrer (Figure S1), sampling system and a proper socket for glass electrode to measure the suspension’s pH. The lamp, TQ 150 (power: 150W), situated in a glass cooling jacket filled with re-circulated deionized water, is located inside the reactor. Thus, the emitted UV irradiation in wavelengths lower than 300 nm was cut off (Figure S2). Before each experiment the photoreactor was covered by aluminum paper to avoid the effect of external light. The reactor was fed with 15 mL/min air regulated by a mass flow controller (Brooks, Holland). The temperature of the suspension during the whole experimental procedure was maintained at 25±0.5 °C and the pH≈4. Liquid samples were taken at various time intervals. These were filtered (Millipore cellulose filters 0.22 nm, Ireland) for removing catalytic particles and then their spectra were recorded in the range 200–600 nm using a UV–Vis spectrophotometer (Varian, model Cary 3, Australia).
Each kinetic experiment was initially carried out for more than 180 min in dark in order to determine the extent of decolorization which is due to the adsorption of the Orange G on the photocatalyst’s surface. During this time, liquid samples were taken at various time intervals and analyzed as mentioned above. Then the lamp was switched on and kinetic procedure was performed under irradiation in order to monitor decolorization via photocatalytic oxidation.
3. Results and Discussion
3.1. Physicochemical Characteristics of the Photocatalysts
Detailed physicochemical characterization of the studied photocatalysts presented in our previous works [31,32], revealed that the SSABET of the C60/MCM-41 samples was slightly decreased (Table 1) and the mesoporous structure of MCM-41 remained intact upon deposition of C60 on its surface. The nature of the C60 species has not been changed upon the deposition of C60 on the MCM-41 surface or upon the development of the support-supported phase interactions during heating. The C60 was highly dispersed within the mesopores or the external surface of MCM-41 as clusters or crystallites/aggregates of very small size. Calculation of the size of C60 crystallites using the Scherer’s equation gave the following values: 1C60/MCM-41 & 3C60/MCM-41: < 4nm, 6C60/MCM-41: 18nm, 9C60/MCM-41: 45 nm, 12C60/MCM-41: 62 nm. The mesopore size of all the photocatalysts remained similar to that of the MCM-41 support. This finding in combination with the XRD results inferred that a preferential growth of C60 crystallites in one direction, namely a cylindrical growth inside the support pores takes place upon deposition of C60 on the MCM-41 surface.
3.2. Decolorization by Adsorption
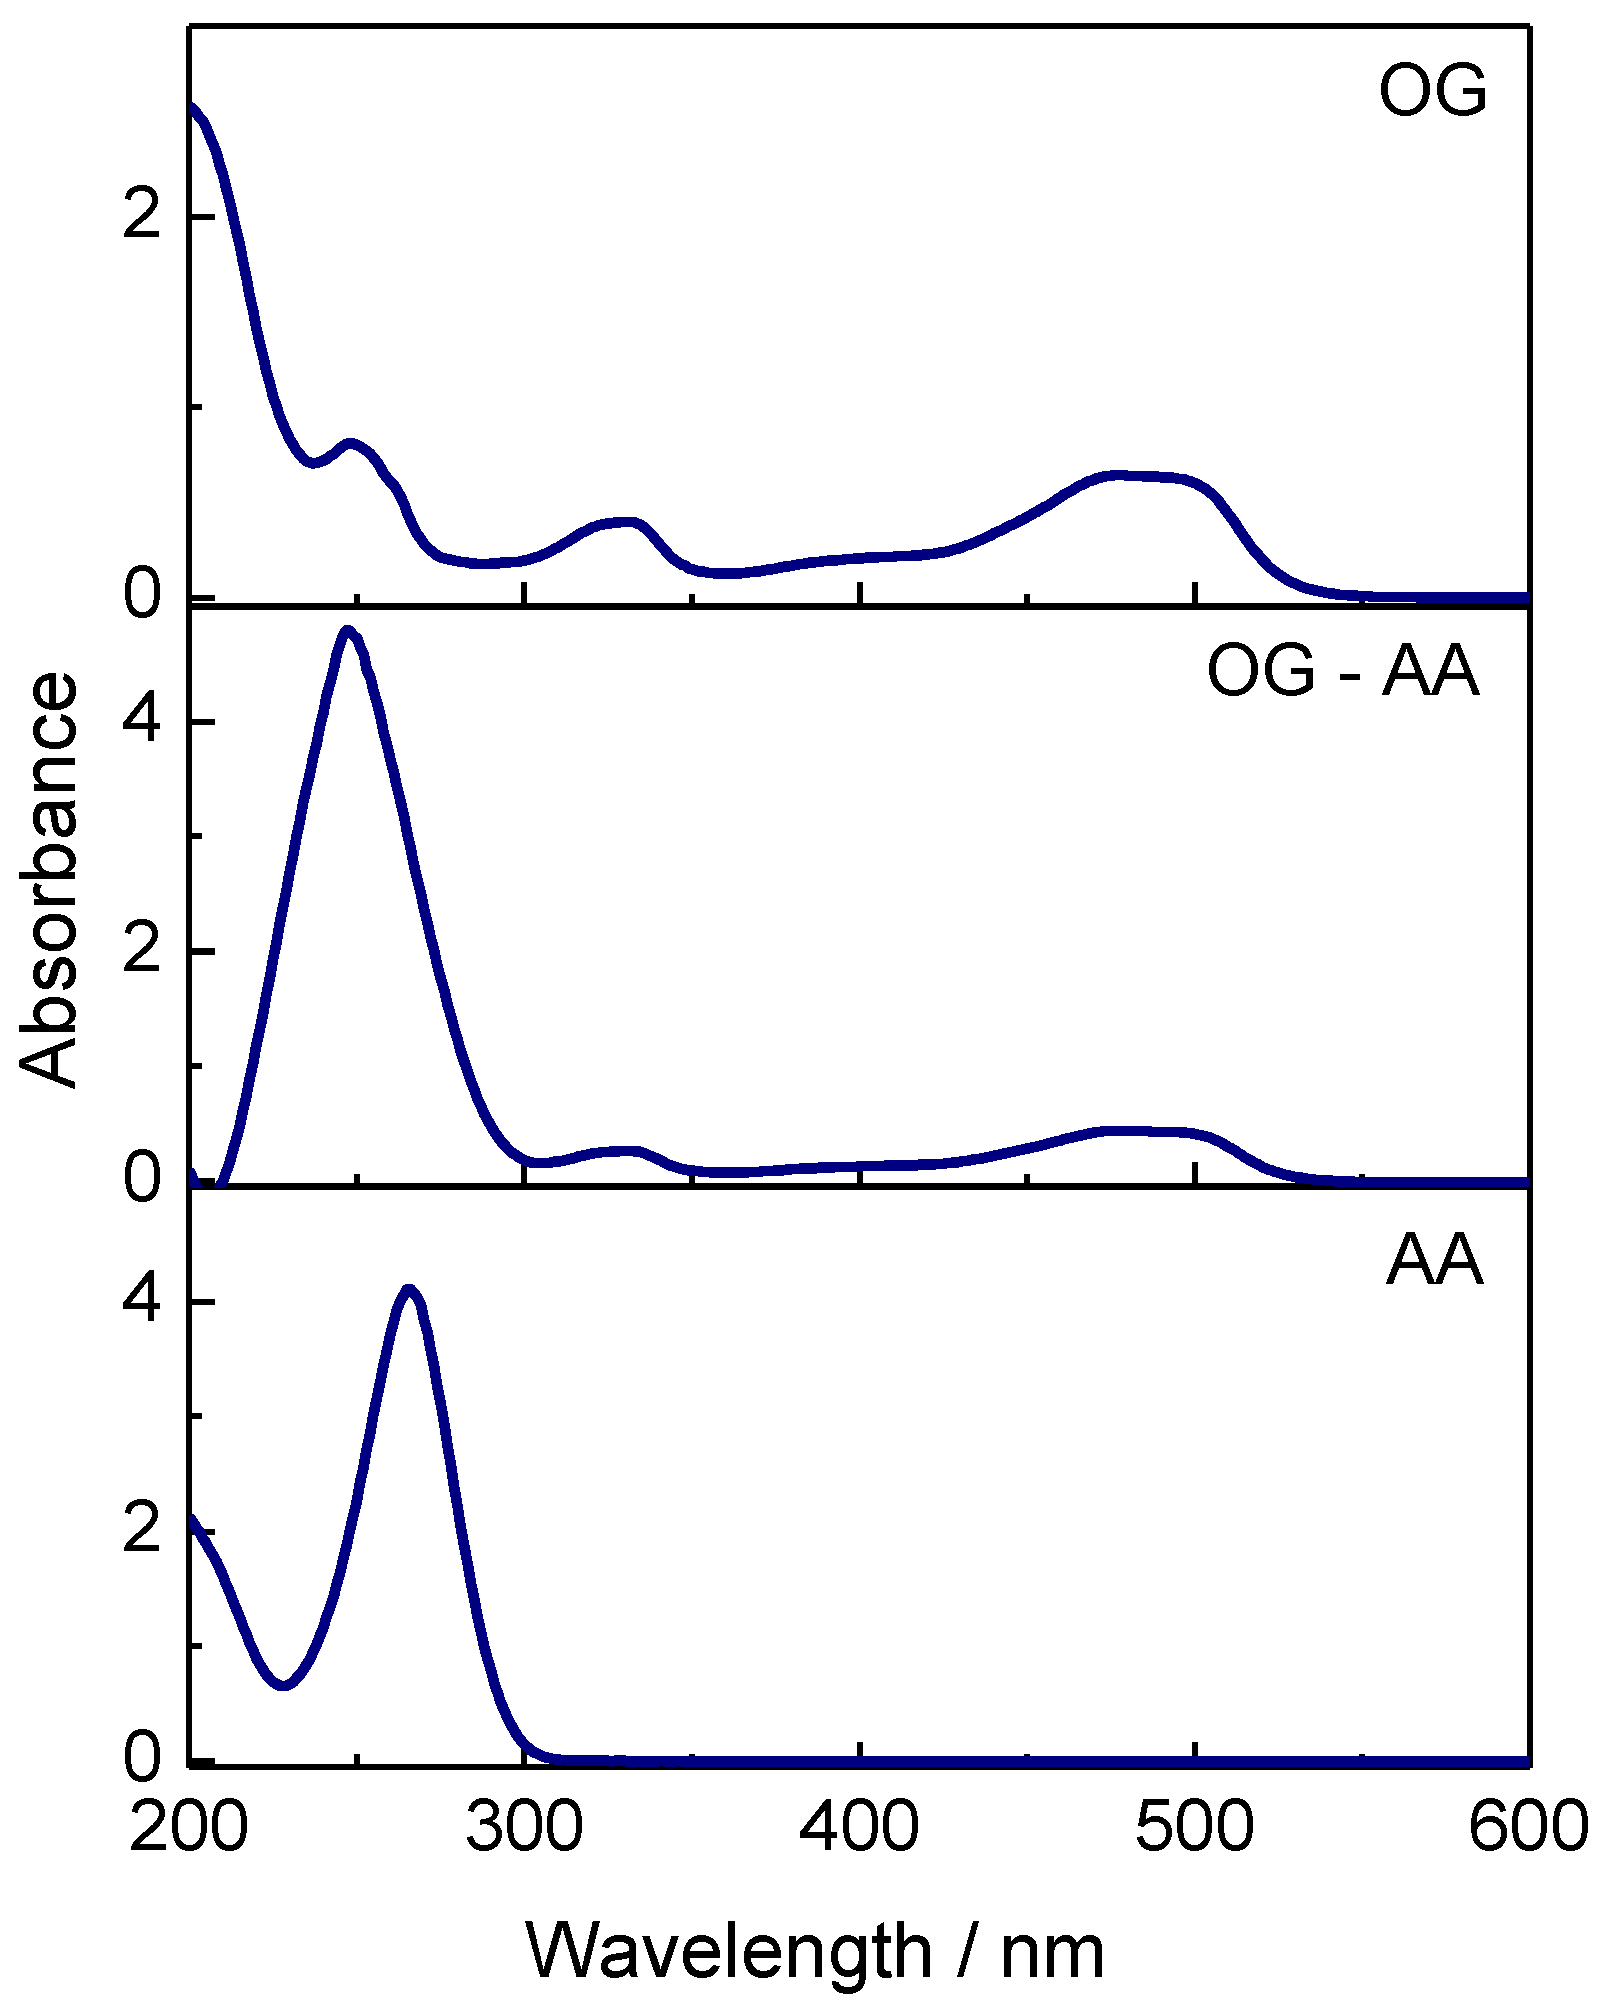
The electronic spectra of OG, OG–AA, and AA aqueous solutions are seen in Figure 1. The peaks at 475 and 410 nm, responsible for the color, are attributed respectively to the azo-bonds of hydrozon and azo form and the peaks at 250 and 330 nm are assigned to benzene and naphthalene rings of OG, respectively [35,36]. It should be noted that ascorbic acid absorption peak (265 nm) interferes with the benzene ring peak of azo dye located at 250 nm. On the other hand, we were obliged to doubly dilute the initial AA aqueous solution (Figure 1) in order to record correctly its spectrum. This was not necessary in the case of a solution containing both substances indicating that an interaction takes place between them in the solution.
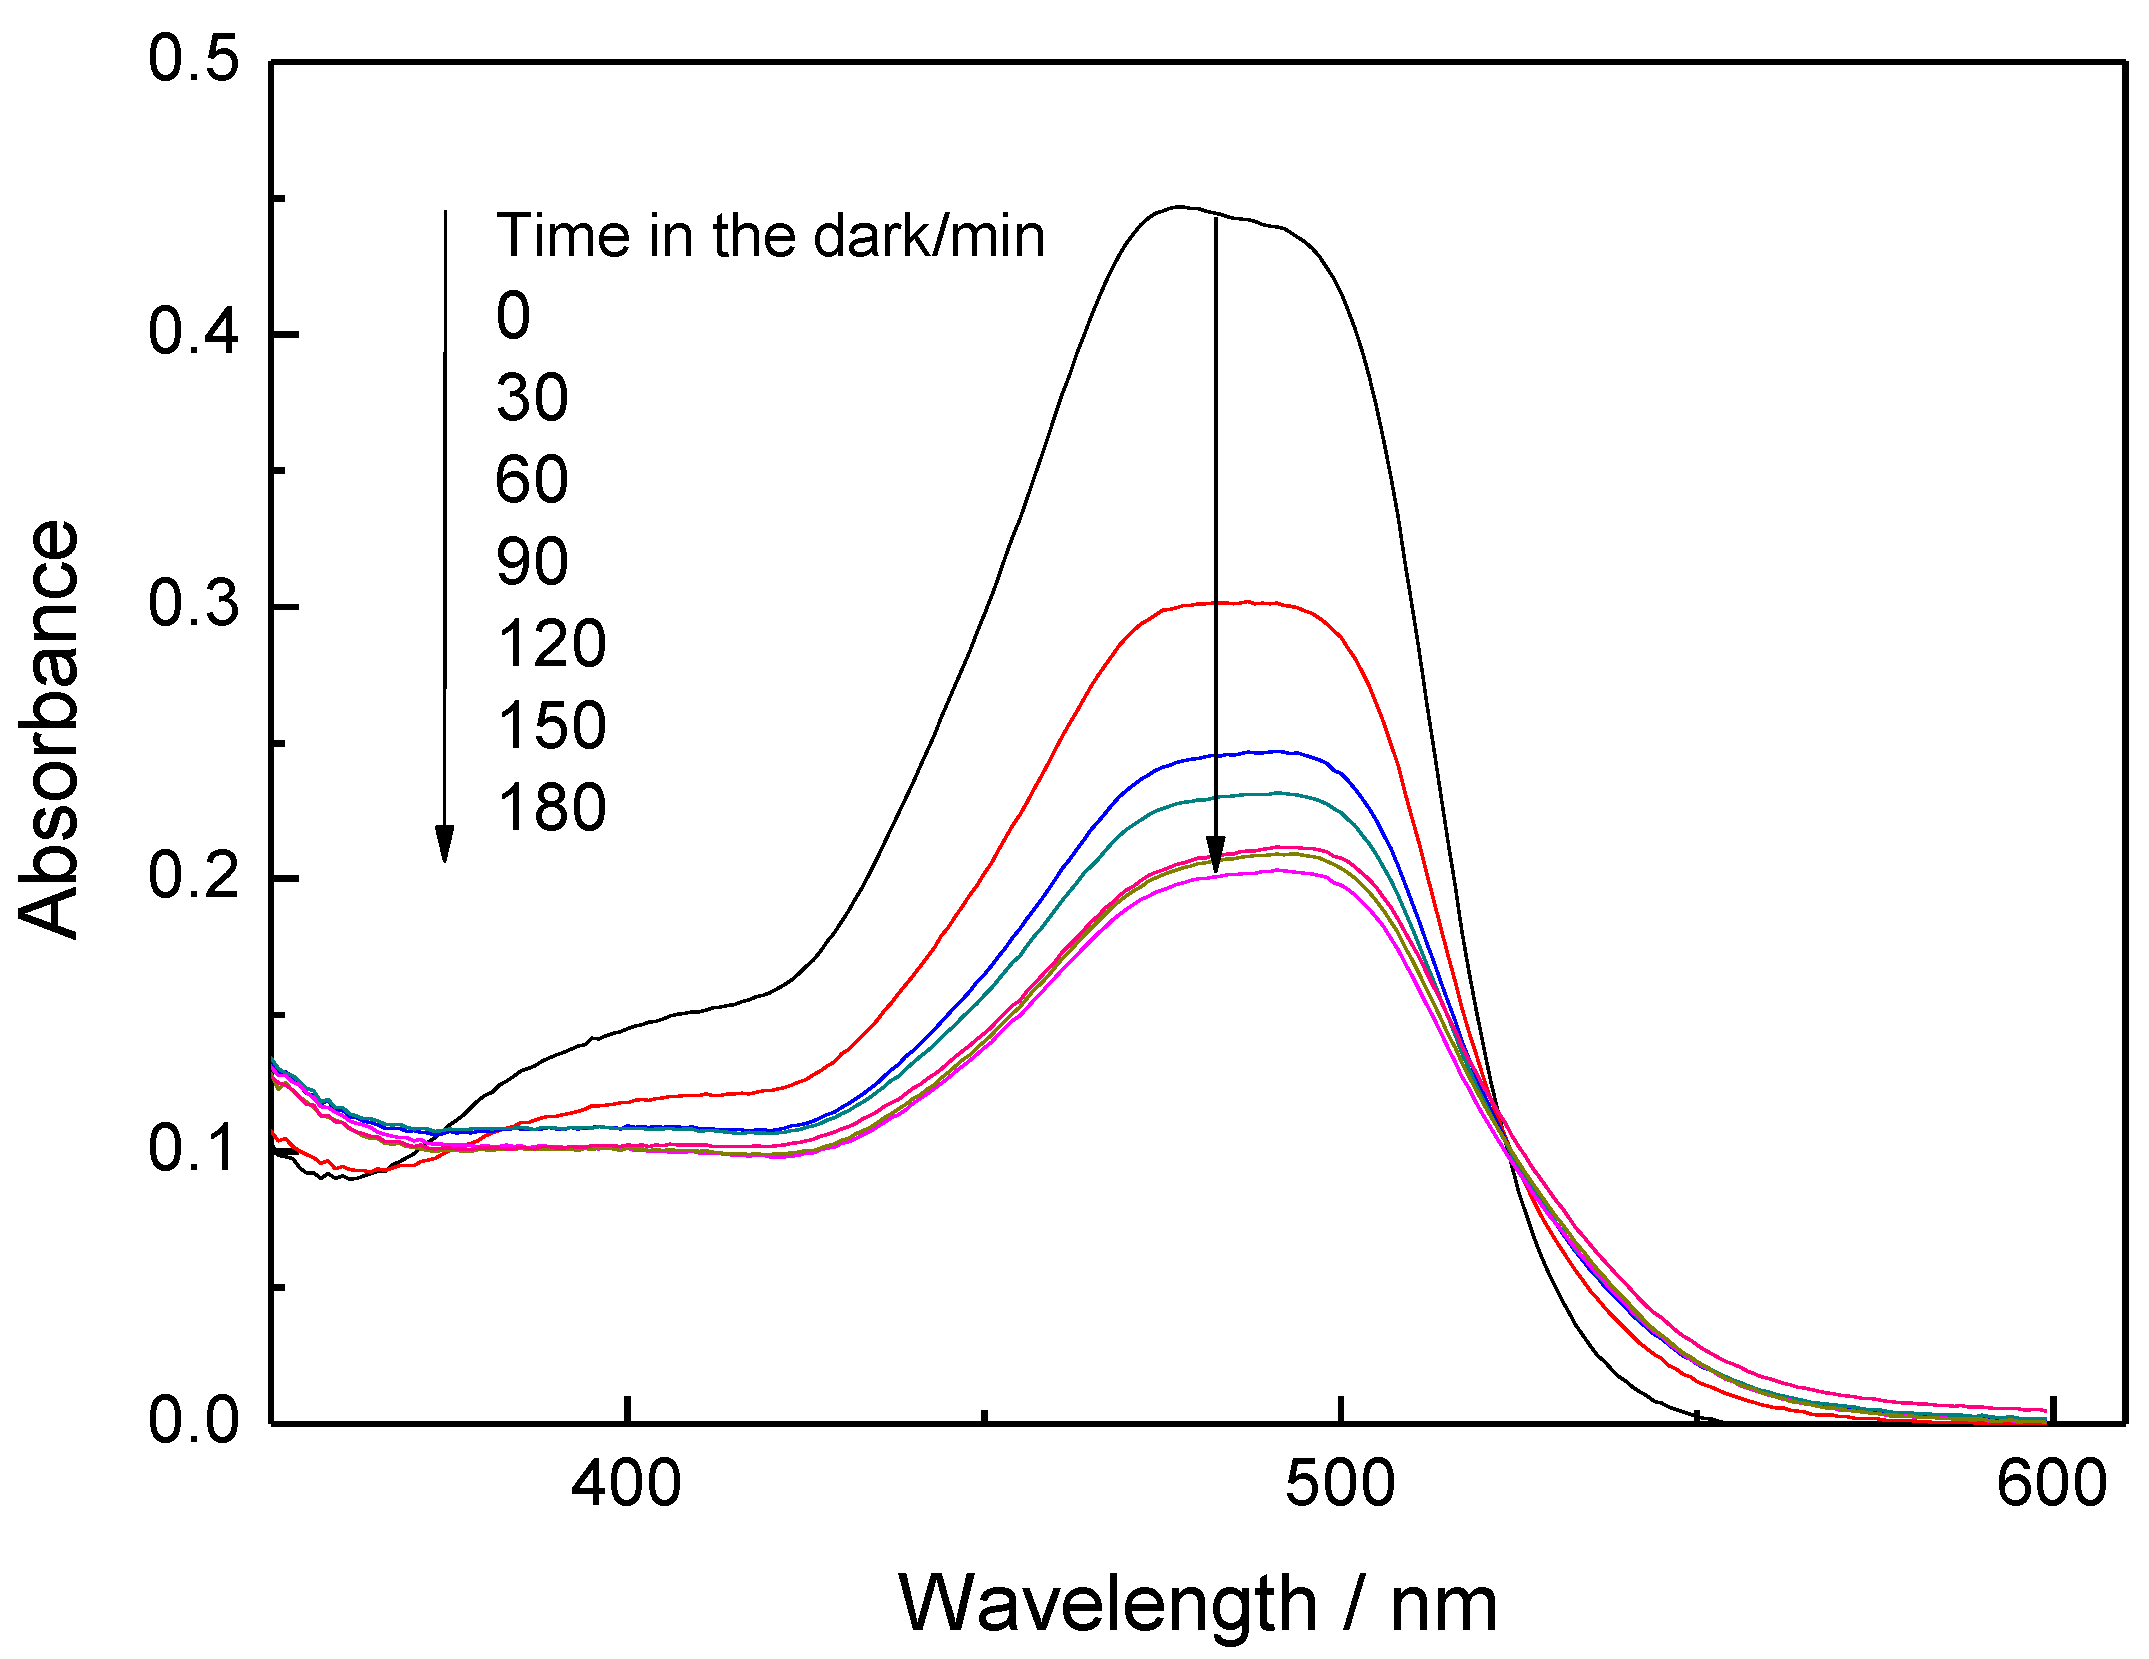
Figure 2 shows the electronic spectra of an OG-AA aqueous solution in contact with 3C60/MCM-41 catalyst recorded in the range 350–600 nm at various contact times in the dark. We observe that the absorbance in the above range decreases significantly up to 60 min and afterwards the decrease is slowing down and absorbance remains almost constant for the period of 120–180 min.
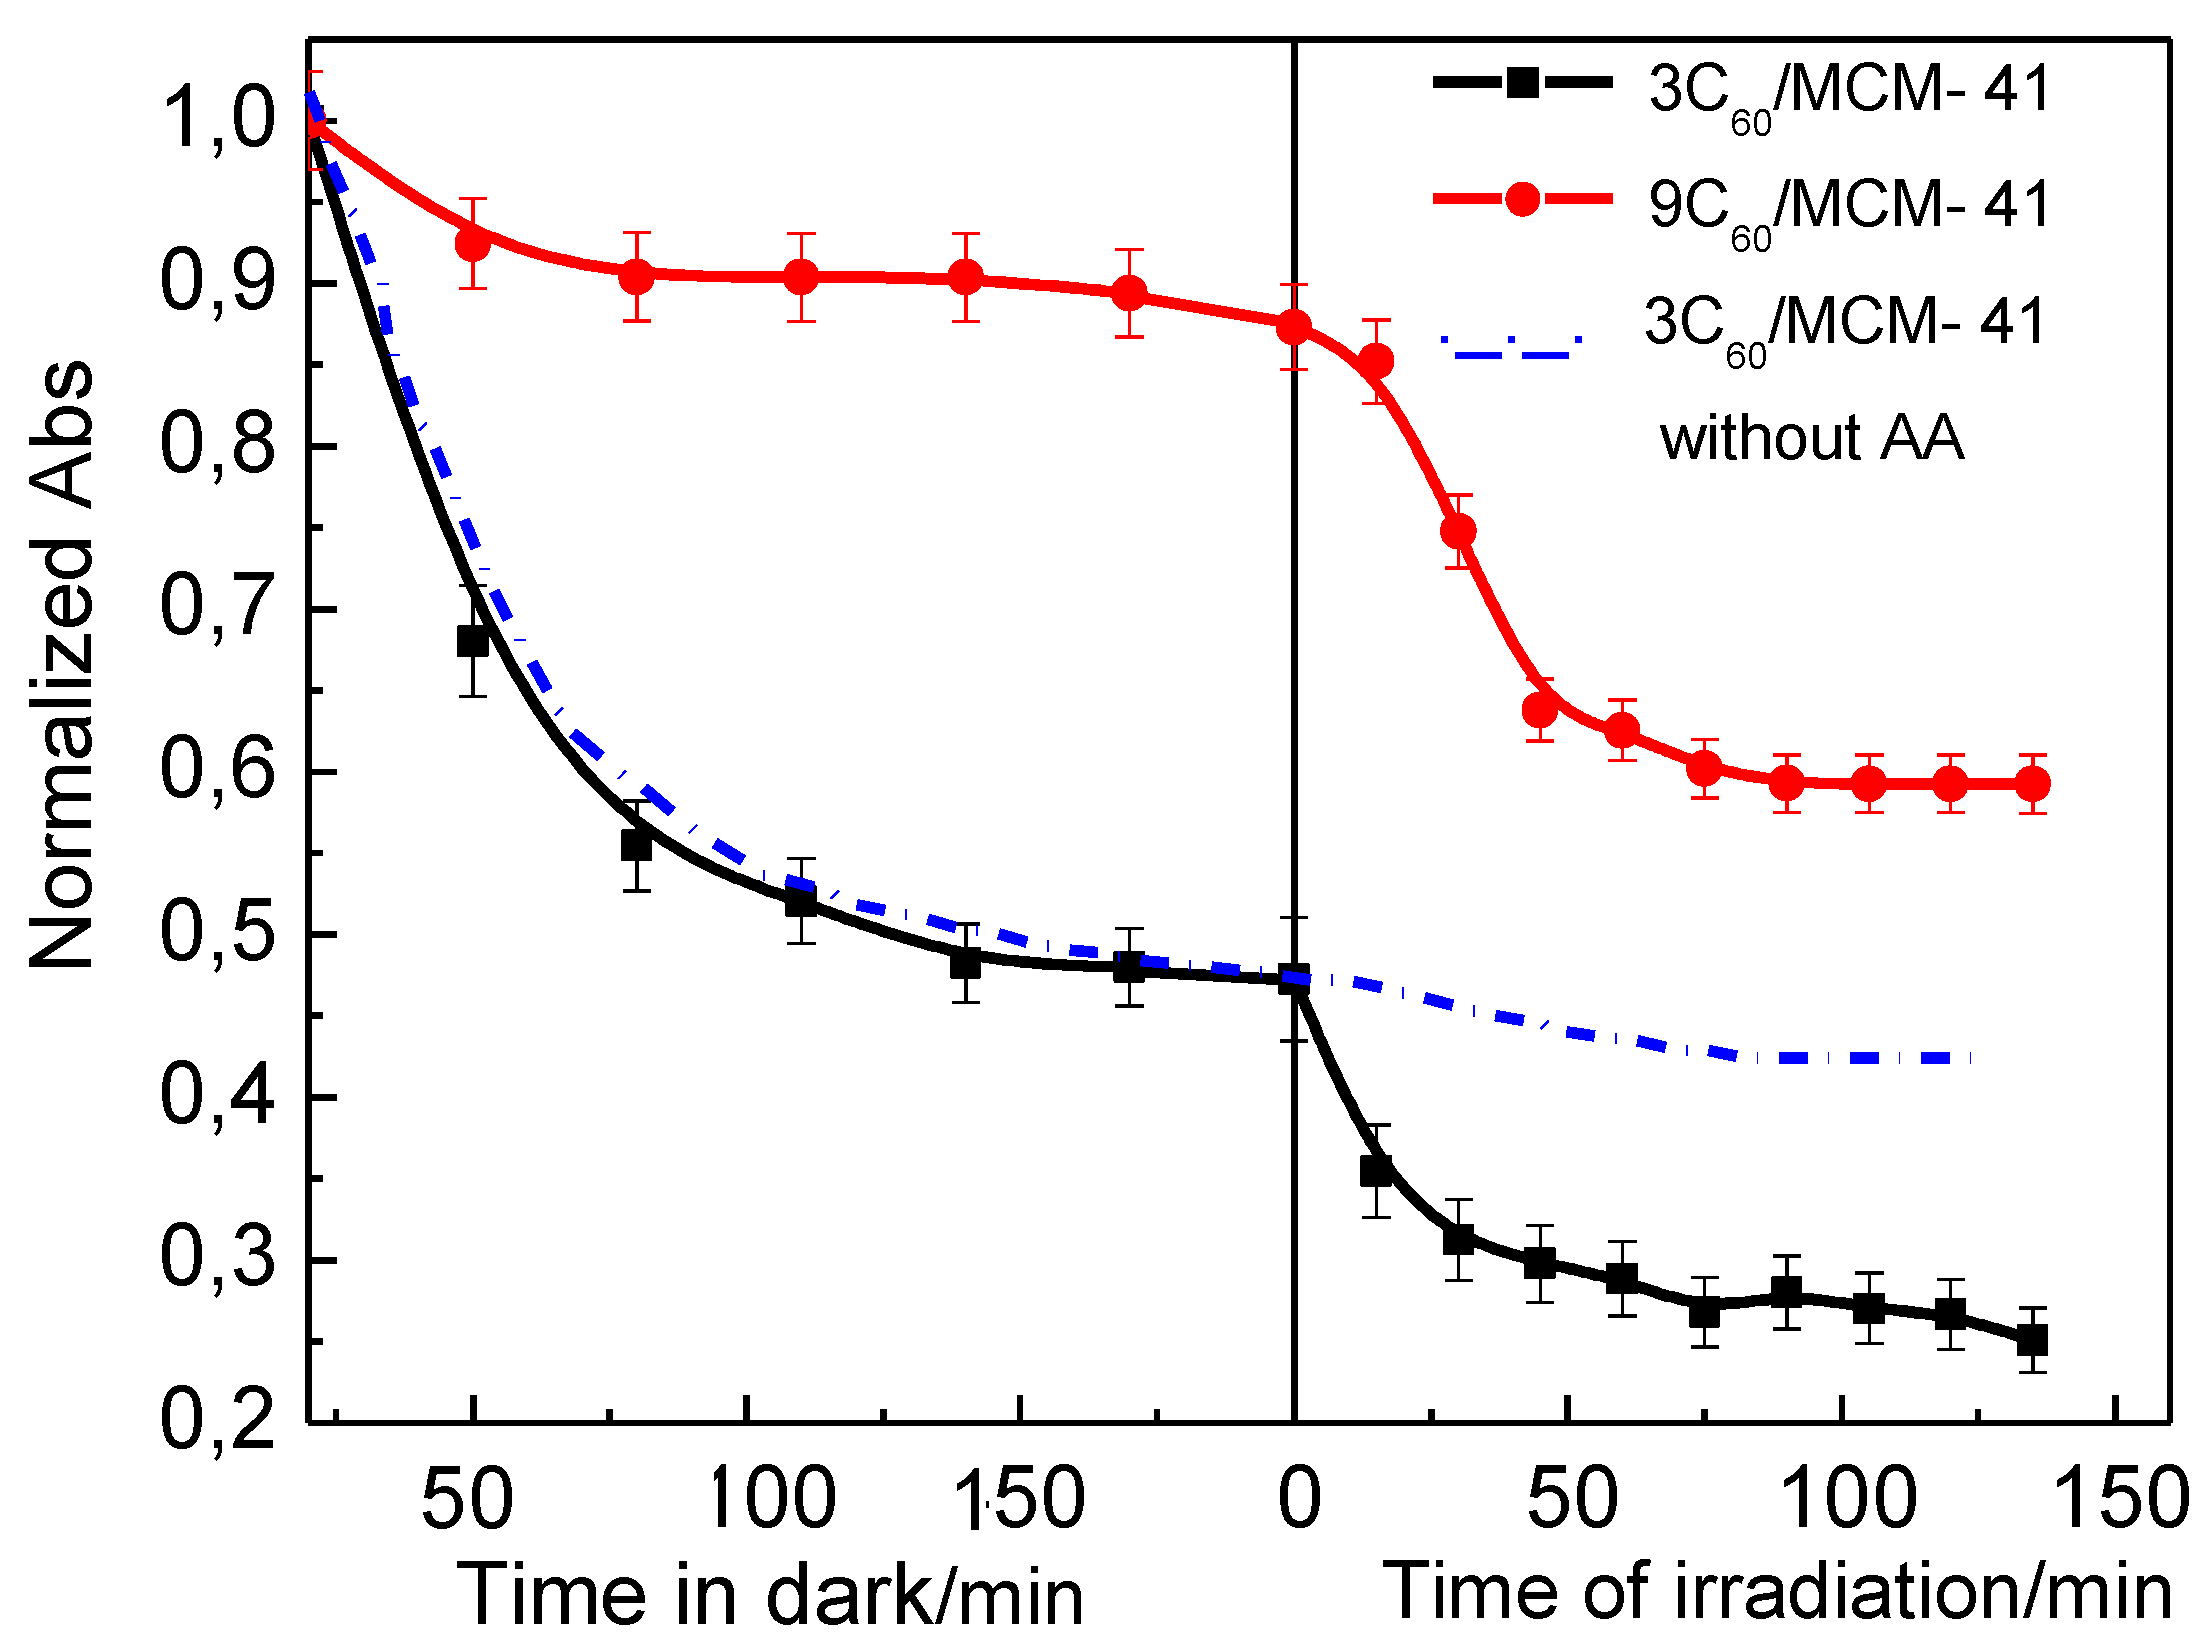
The kinetics of decolorization in the absence of light over two samples with different C60 loadings (3 and 9 wt % C60) are illustrated in Figure 3 (left part). The absorbance at 475 nm has been taken as a measure of decolorization. We observe that the extent of decolorization due to the adsorption depends on the photocatalyst composition. To study the adsorption kinetics, the pseudo-first-order and pseudo-second-order kinetic models were both examined according to Equations (1) and (2), respectively [37].
where, qe and qt (mg g−1) symbolize the amount of OG absorbed per gram of photocatalyst at adsorption equilibrium and each time t (min), respectively. kA1 (min−1) and kA2 (g mg−1 min−1) represent pseudo-first-order and pseudo-second-order rate constant, respectively. The aforementioned kinetic analysis of OG adsorption experiments showed that a pseudo second order kinetic law (Equation (2)) describes much better the experimental data (R2 > 0.99). This finding has been also reported for the adsorption kinetics of OG on the surface of other adsorbents [37]. The calculated kA2 values are given in Table 1. Inspection of this table shows that the adsorption rate constant values decrease as the C60 loading of the photocatalysts increases. This observation evidenced that the adsorption of OG takes place on the bare surface of MCM-41.
In order to further study this point, we have determined the specific adsorption of orange G (SA: expressed in μmol of OG adsorbed per gram of catalyst) on the surfaces of the samples studied after equilibration for 180 min in the dark. The values obtained are illustrated in Table 1.
Inspection of Table 1 shows that the extent of adsorption follows similar trend to those of specific surface area of the catalysts and the adsorption kinetic constant, as well. However, the decrease in the specific adsorption is abrupt from the second to the third sample (36.5 to 11.2 μmol g−1) whereas the corresponding decrease in the specific surface area is not so large (831 to 813 m2g−1). This suggests an additional reason for the decrease of the adsorption. One may propose that the decrease in the specific adsorption is also due to coverage of adsorption sites, situated on the surface of MCM-41, by the supported C60 clusters as the concentration of the latter is duplicated from the second to the third sample. The relatively low dispersion of the C60 supported clusters in the samples 9C60/MCM-41 and 12C60/MCM-41 [31,32] leaves uncovered sufficient portion of MCM-41 surface, justifying the relatively small additional decrease in the specific adsorption observed from the third to the fifth sample. Therefore, we consider that the decolorization through adsorption is taking place mainly on the bare surface of the carrier.
In a previous work [10], studying the mechanism of OG adsorption on the surface of TiO2, we had concluded that the adsorption of OG occurs mainly through the one of the two –SO3− groups of its structure, presumably due to steric constraints, on the positively charged surface sites. This has been also confirmed by Tang et al. [37], who studied the selective adsorption of anionic dyes on silver bromide-based nanomaterials and concluded that electrostatic attraction of –SO3− groups by positively charged surface sites is the dominating contribution to the adsorption of these dyes. It should be noticed that the above mentioned nanomaterials exhibited higher SA (~58 μmol/g) than that achieved over the best of our photocatalyst (3C60/MCM-41). This can be explained taking into account that although C60/MCM-41 photocatalysts are characterized by too high SSABET values, the silica nature of their support implies low surface density of positively charged sites at pH >~3 [38], where the adsorption and photocatalytic experiments took place.
3.3. Decolorization through Photocatalytic Splitting of Azo-Bonds
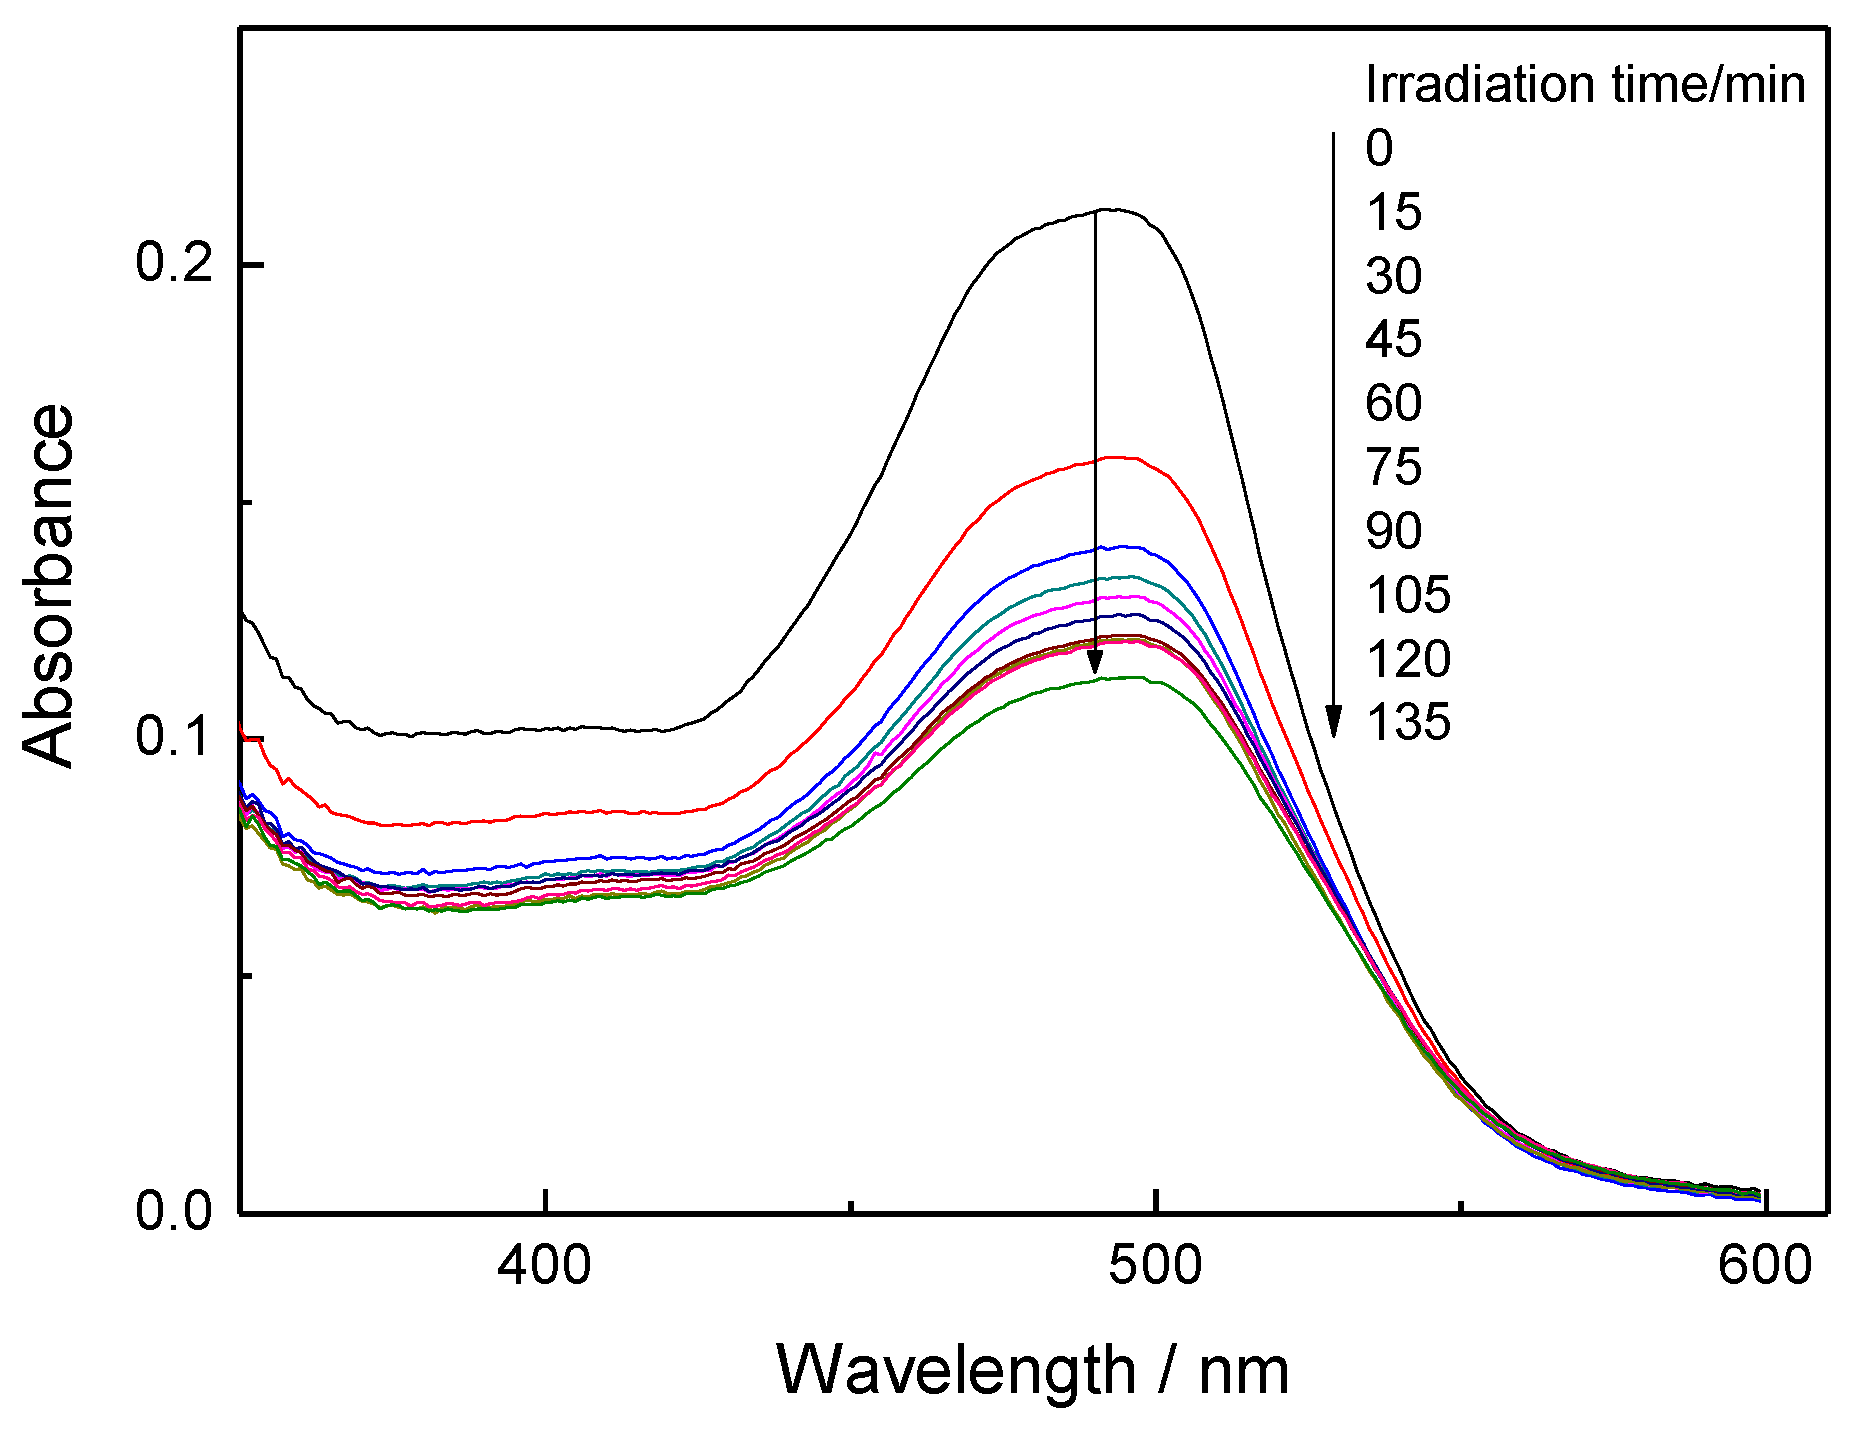
Figure 4 shows the absorption spectra of an OG-AA aqueous solution in contact with the 3C60/MCM-41 sample recorded in the range 350–600 nm at various irradiation times after equilibration in the dark. One can observe additional decrease of the absorbance in the whole range of the spectra with the irradiation time which could easily be attributed to the photocatalytic degradation of the azo dye.
Figure 3 (right part) illustrates the photocatalytic decolorization kinetics obtained over two samples with different C60 loadings (3 and 9 wt % C60) when the photoreactor lamp was switched on. One may observe that in both cases irradiation induces further reduction of the absorbance due to the photocatalytic decomposition of Orange G via the azo-bonds splitting. However, this is not the case in the absence of ascorbic acid (Figure 3). This reveals the key role of the ascorbic acid in the photocatalytic degradation mechanism of Orange G.
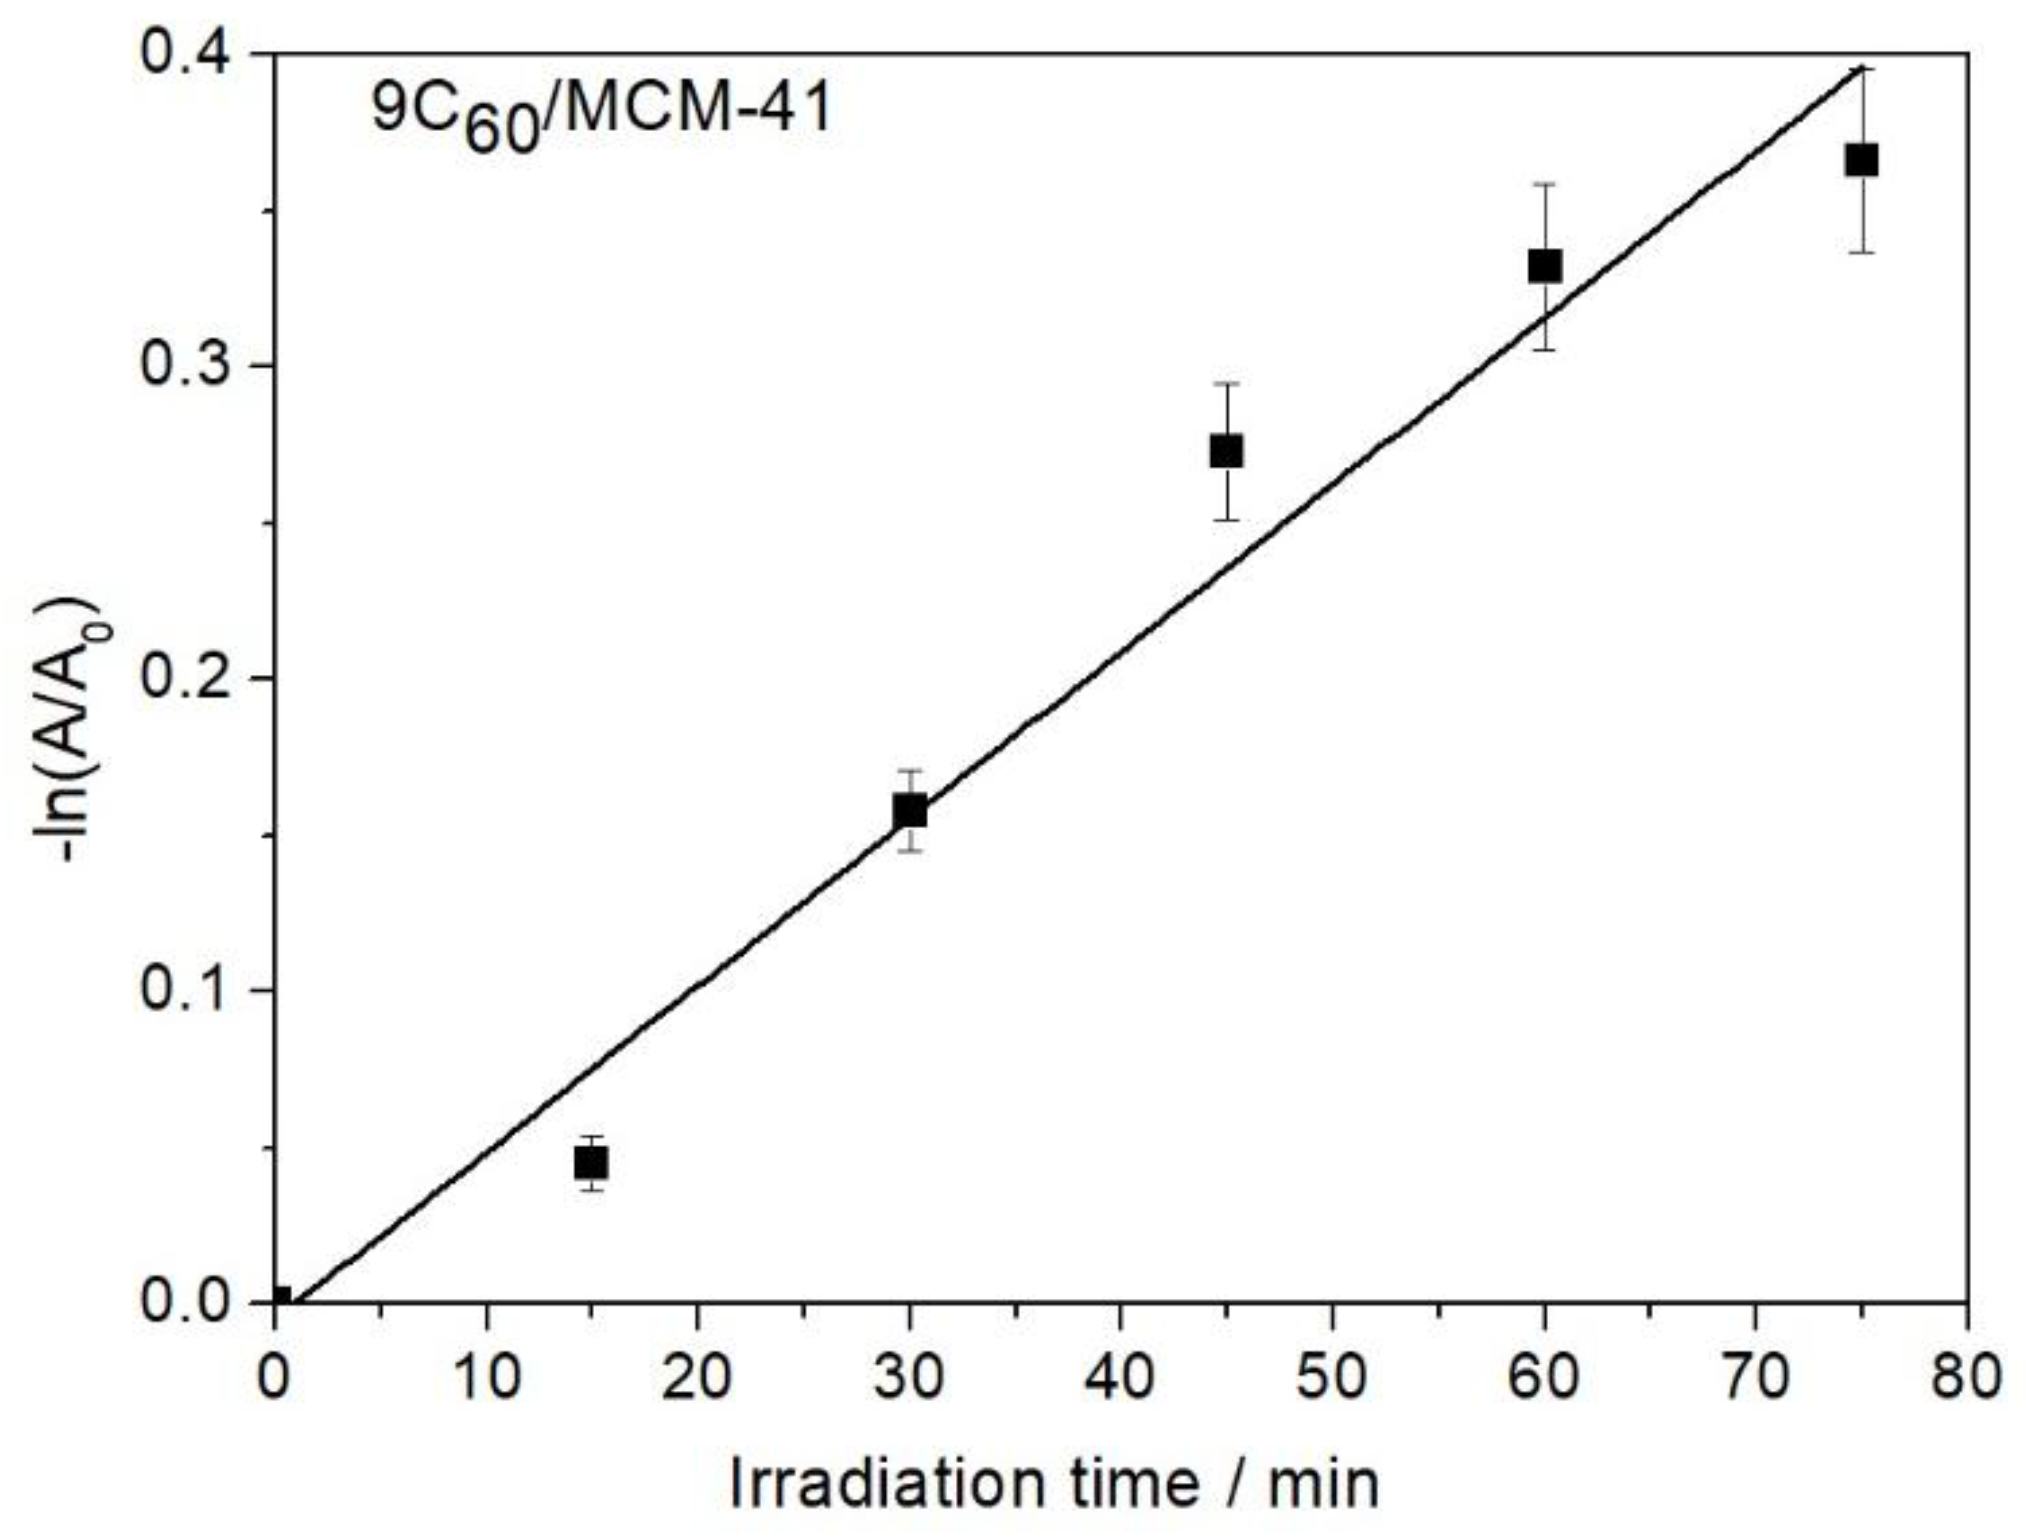
In order to further study decolorization through the photocatalytic splitting of azo-bonds, we determined the rate constants (kR) of photocatalytic reaction for the samples studied. Assuming that the concentration of O2 in the reaction mixture remains constant and equal to saturation due to the continuous feed with air, a pseudo-first-order photoreaction with respect to the Orange G (Equation 3) could be easily derived [10,39,40].
where A0 and A stand, respectively, for the absorption at zero time and irradiation time t. The linear plots, -ln(A/A0) vs. t, obtained for all the samples studied corroborated the aforementioned assumption. Correlation coefficients (R2) greater than 0.93 have been obtained in all cases. An example, over the sample 9C60/MCM-41, is illustrated in Figure 5.
The calculated photocatalytic reaction rate constant values are compiled in Table 1. These values are in good agreement with those reported in the recent literature for similar reaction conditions [39,40,41,42,43]. The kR value was initially increased with the C60 loading of the photocatalysts approaching its maximum over the 3C60/MCM41 sample. Then it was decreased considerably up to the sample 6C60/MCM41 and afterwards was slightly decreased with the fullerene content. The relatively high value for the photocatalytic reaction rate constant obtained over the sample 3C60/MCM41 can be effortlessly attributed to the very small C60 clusters, not detectable by XRD, supported on MCM-41 [31]. These clusters, in effect, exhibited also very high intrinsic photocatalytic activity in other photocatalytic reactions as in the olefins photoxidation [31].
By increasing the C60 content from 3 to 6 wt % the C60 clusters size is increasing [32], bringing about a significant decrease in the intrinsic activity. The further decrease in the value of the rate constant determined over the photocatalysts with C60 loading 9 and 12 wt % (Table 1) could be attributed to the additional size increase of C60 clusters and therefore to the decrease of their intrinsic activity. However, the decrease of reaction constant value observed as the C60 loading of the catalysts increases from 6 to 12 wt % is relatively low. This could be attributed to the partial compensation of the intrinsic activity decrease by the increase of photo sensitizer content per gram of catalyst.
The high values obtained for the specific adsorption of Orange G and the specific rate of photocatalytic splitting of azo-bonds over the sample 3C60/MCM-41 justify the relatively high value obtained for the percentage decolorization of the Orange G aqueous solutions (Table 1). The trend for this parameter follows the trend obtained for the rate constant of the catalytic splitting of azo-bonds (Table 1).
3.4. Interesting Characteristics of Decolorization Procedure
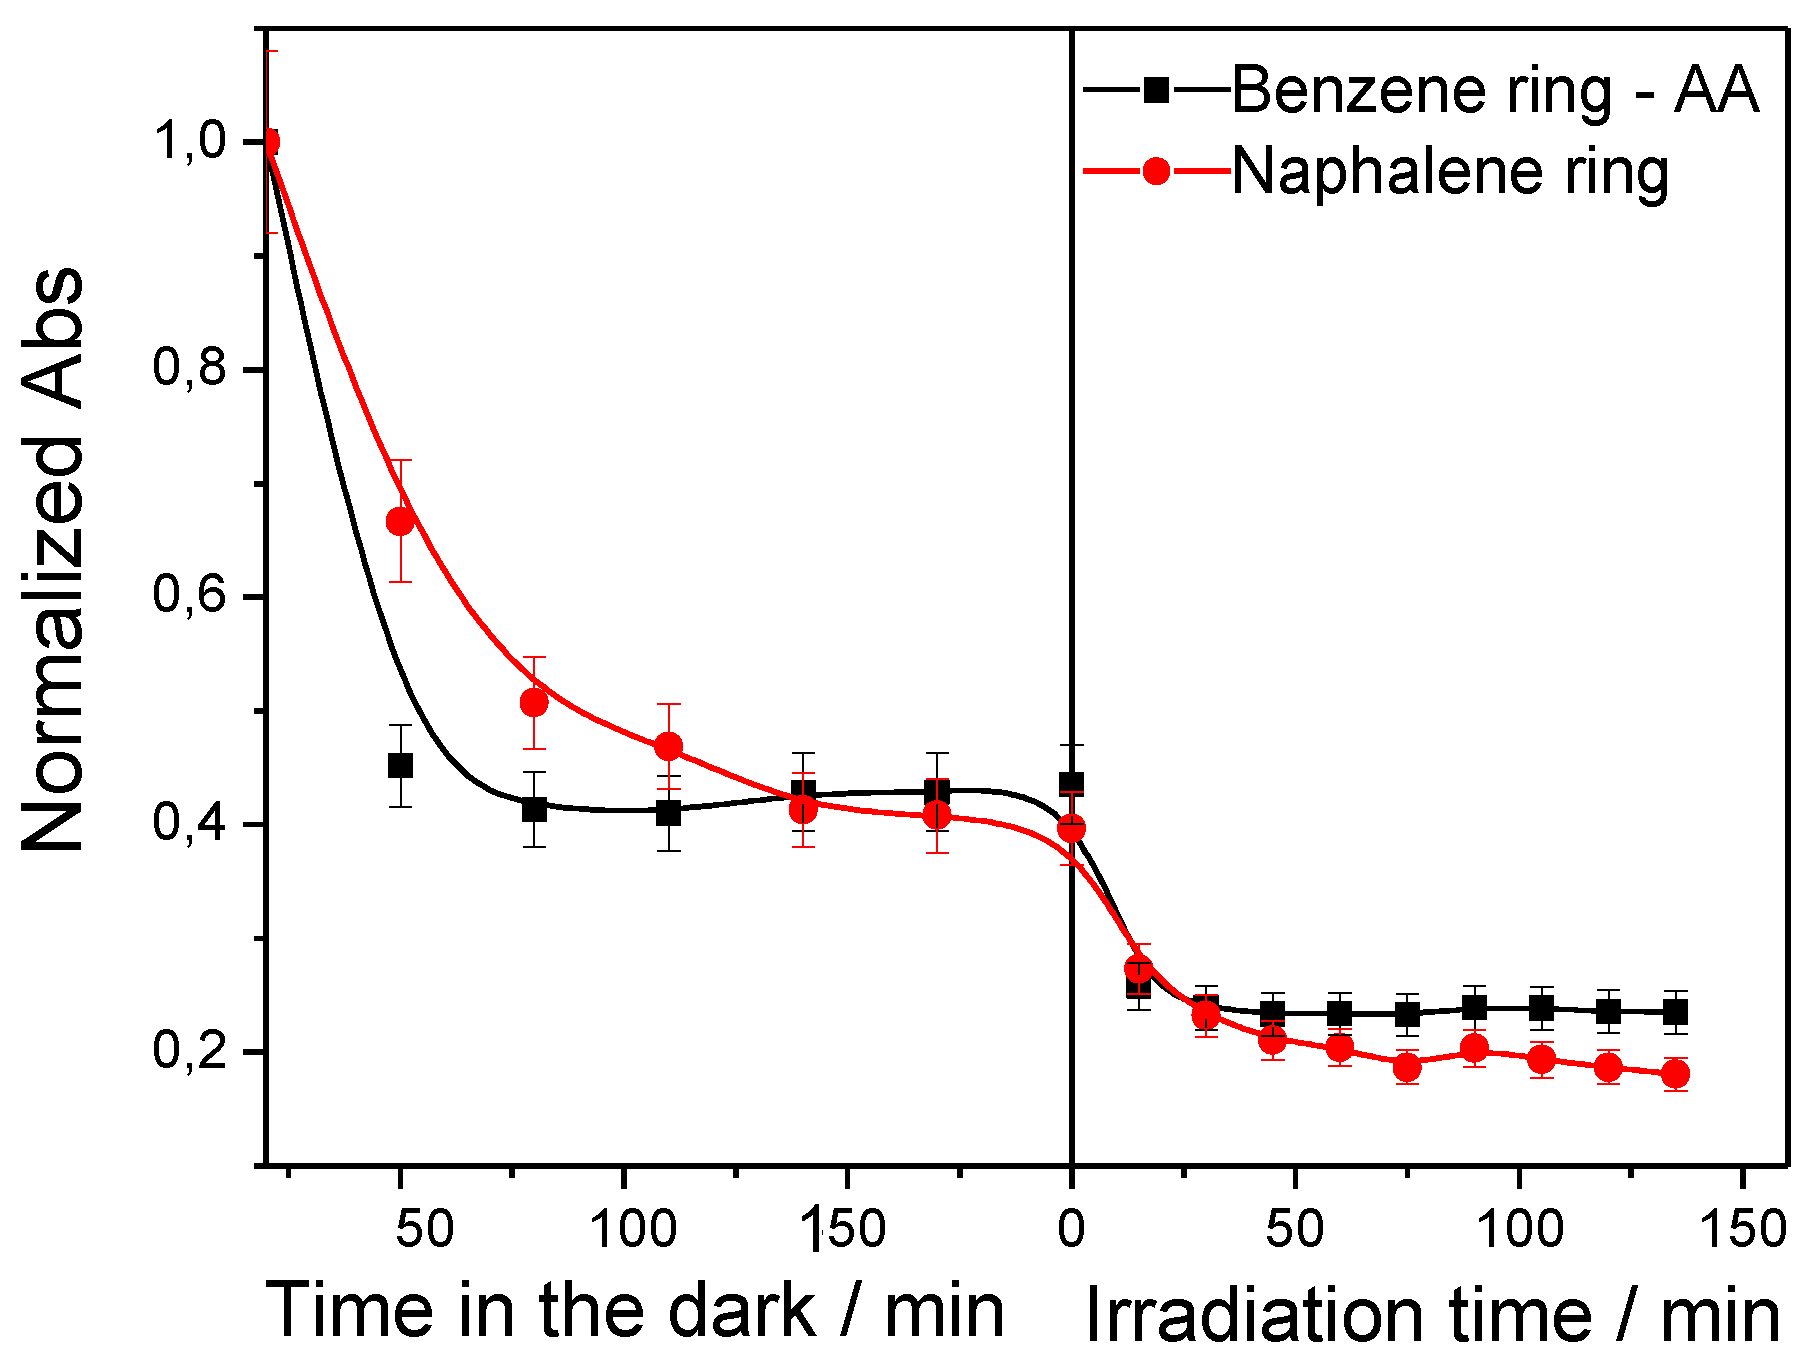
In order to investigate some details of the decolorization procedure, we have monitored the change with time in the absorption bands at 330 and 250 nm assigned to the naphthalene and benzene (interfered by AA) rings, respectively (Figure 6). Inspection of Figure 3 and Figure 6 shows that similar kinetics are followed concerning the decrease of the intensity of the absorption band at 475 nm with those observed for the absorption bands at 330 and 250 nm over the sample 3C60/MCM41 taken as an example. This is valid in the dark and under irradiation as well. Concentrating our attention to the experiments taking place in the absence of light, we observe that the normalized absorption is decreasing from 1 to about 0.43-0.45 at t=200 min for the three bands at 475, 330 and 250 nm assigned, respectively, to azo-bonds, naphthalene, and benzene (and ascorbic acid) rings. This suggests that the adsorption of Orange G on the solid surface is not accompanied by its decomposition and selective adsorption of some of the resulting molecules. The relatively faster initial decrease of the absorbance at 250 nm ascribed to benzene ring of the azo-dye and to AA could be attributed to the lower molecular weight of the latter (about 2.5 times lighter than OG) which facilitates its mass transfer from the solution to the catalyst surface.
Concerning the experiments taken place under irradiation, similar kinetics is observed for the decolorization (absorbance decrease at 475 nm, Figure 3) and absorbance decrease at 330 and 250 nm attributed, respectively, to naphthalene rings and to the benzene ring plus AA (Figure 6). In both cases, indeed, the normalized absorption is decreasing to 0.2–0.25 after 140 minutes of irradiation. This presumably suggests full destruction of Orange G, not only the simple cleavage of azo-bonds, as well as of the ascorbic acid.
According to our adsorption and photocatalytic kinetic results, it seems that adsorption is the rate determining step (kR>>kA2), see Table 1. This finding probably explains why complete decolorization has not been achieved in the reaction time for which photocatalytic degradation of OG has been studied (Figure 3).
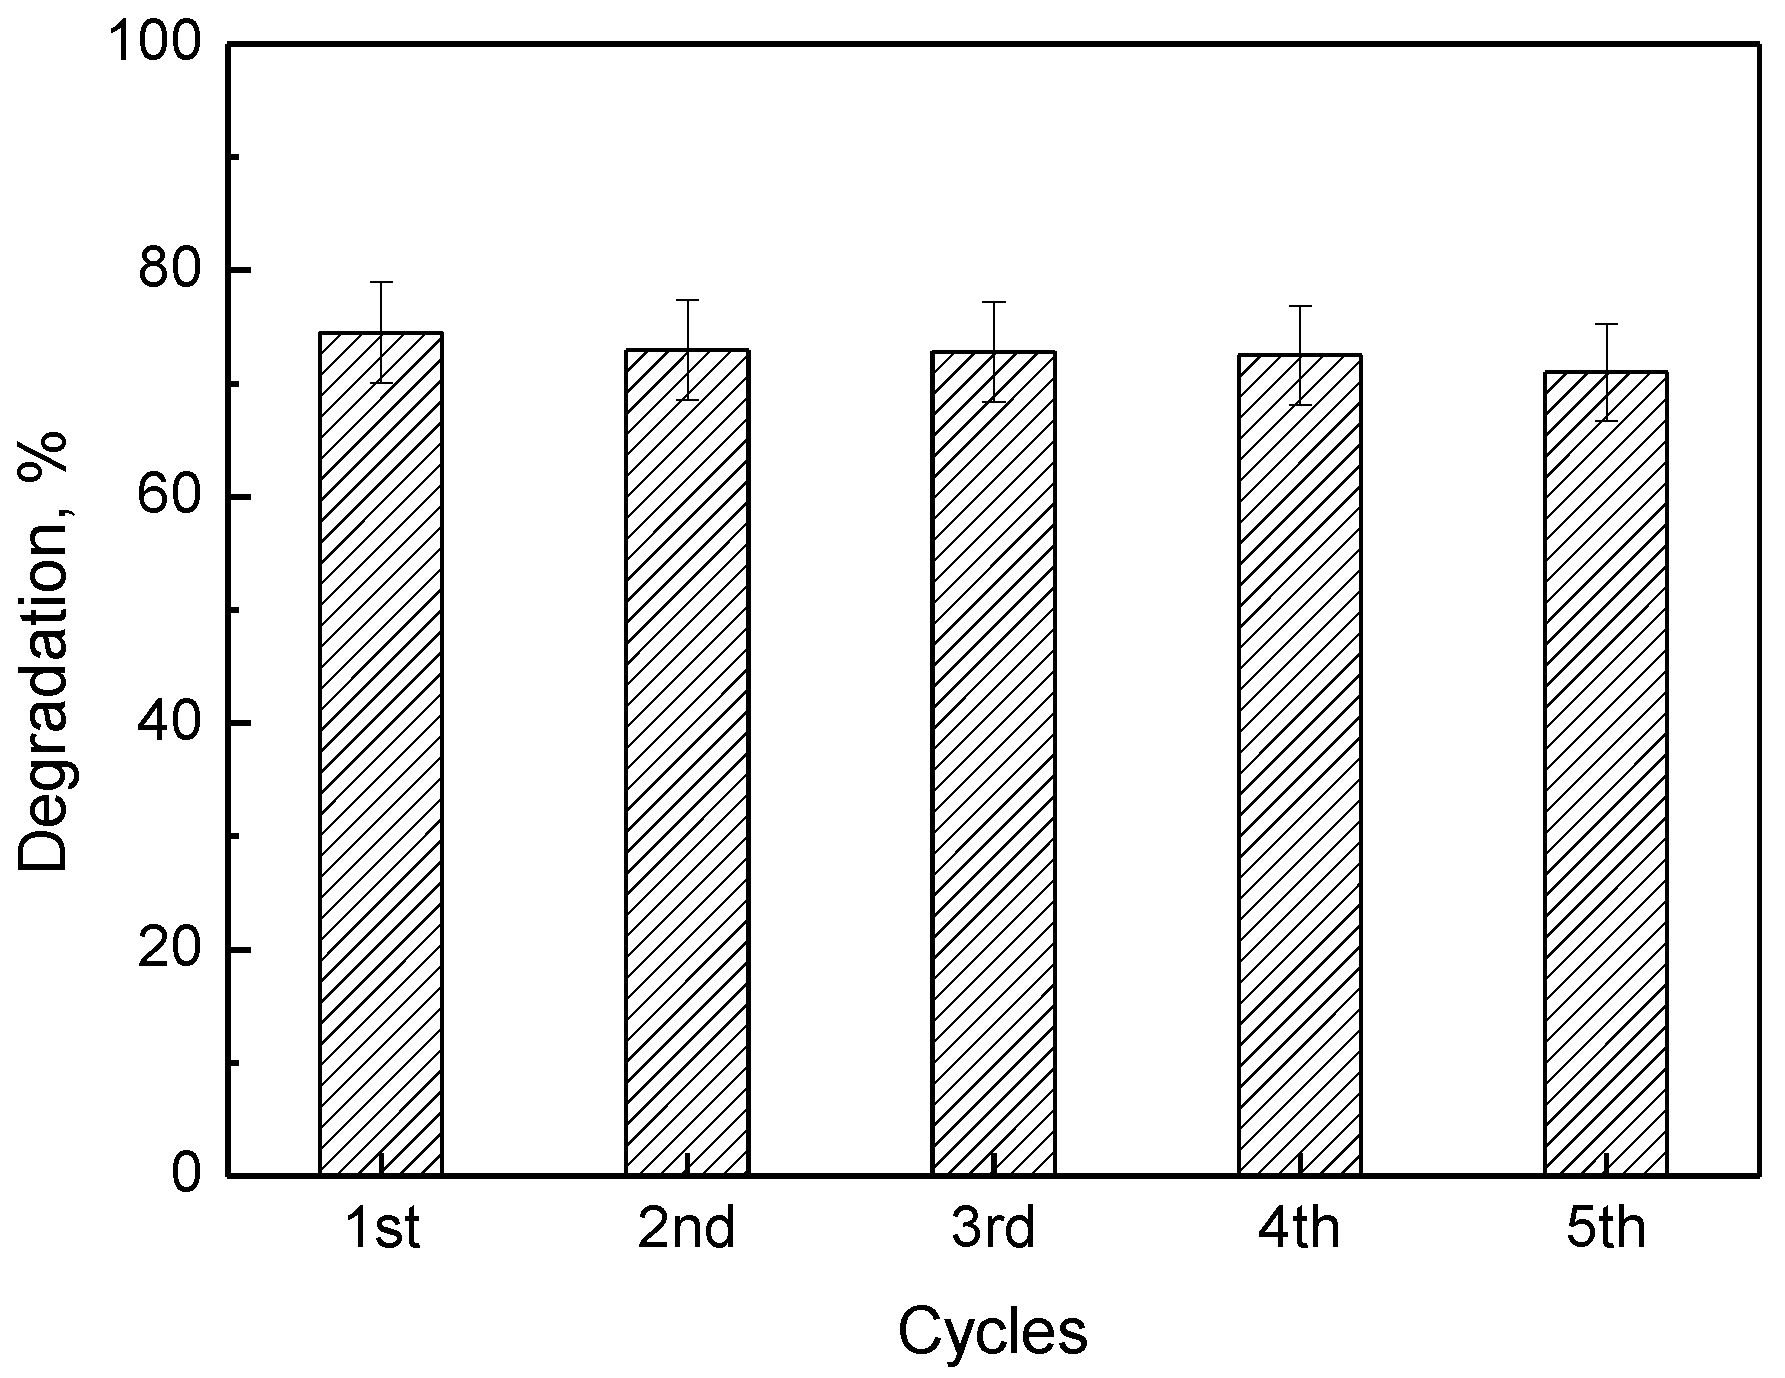
As a critical point in relevant studies, the reusability of the photocatalysts was developed, five subsequent cycles of OG photo-destruction were performed over the same sample of 3C60/MCM-41 catalyst, which showed the highest photocatalytic activity. The catalyst was thoroughly washed with triple-distilled water and dried at 110 °C overnight between the subsequent photocatalytic experiments. The results presented in Figure 7 reveal that this catalyst is quite stable losing less than 5% of its initial activity after five cycles.
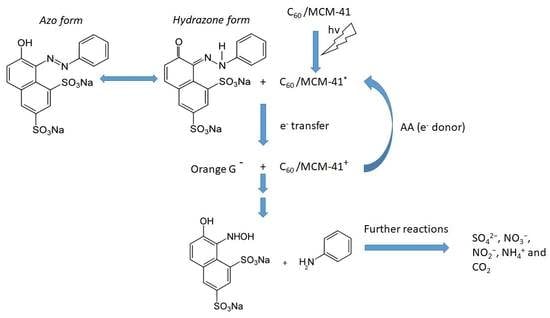
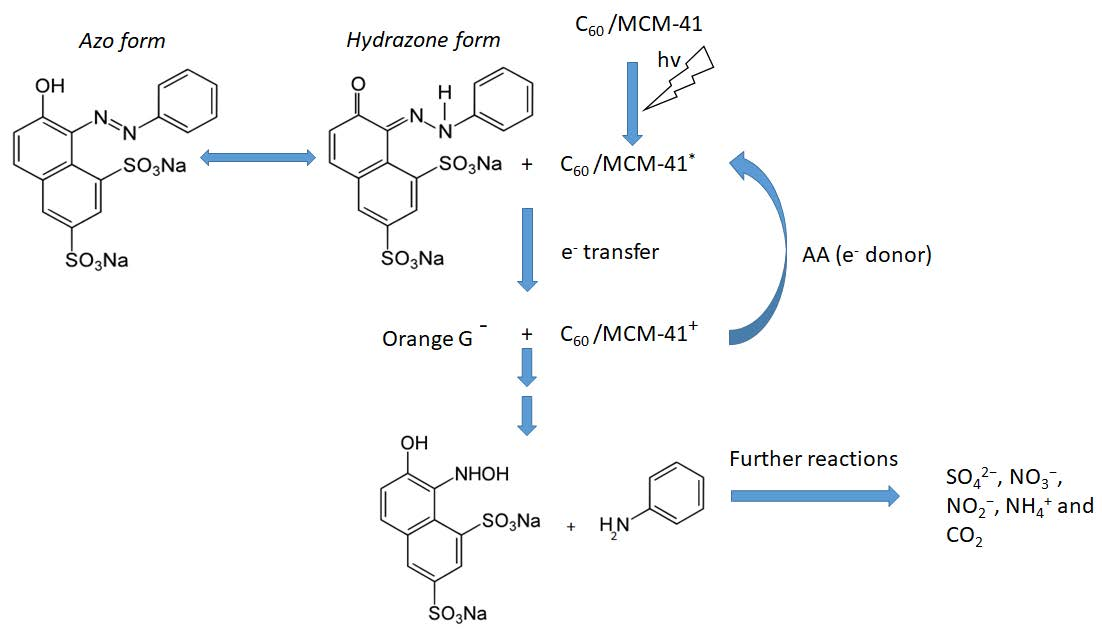
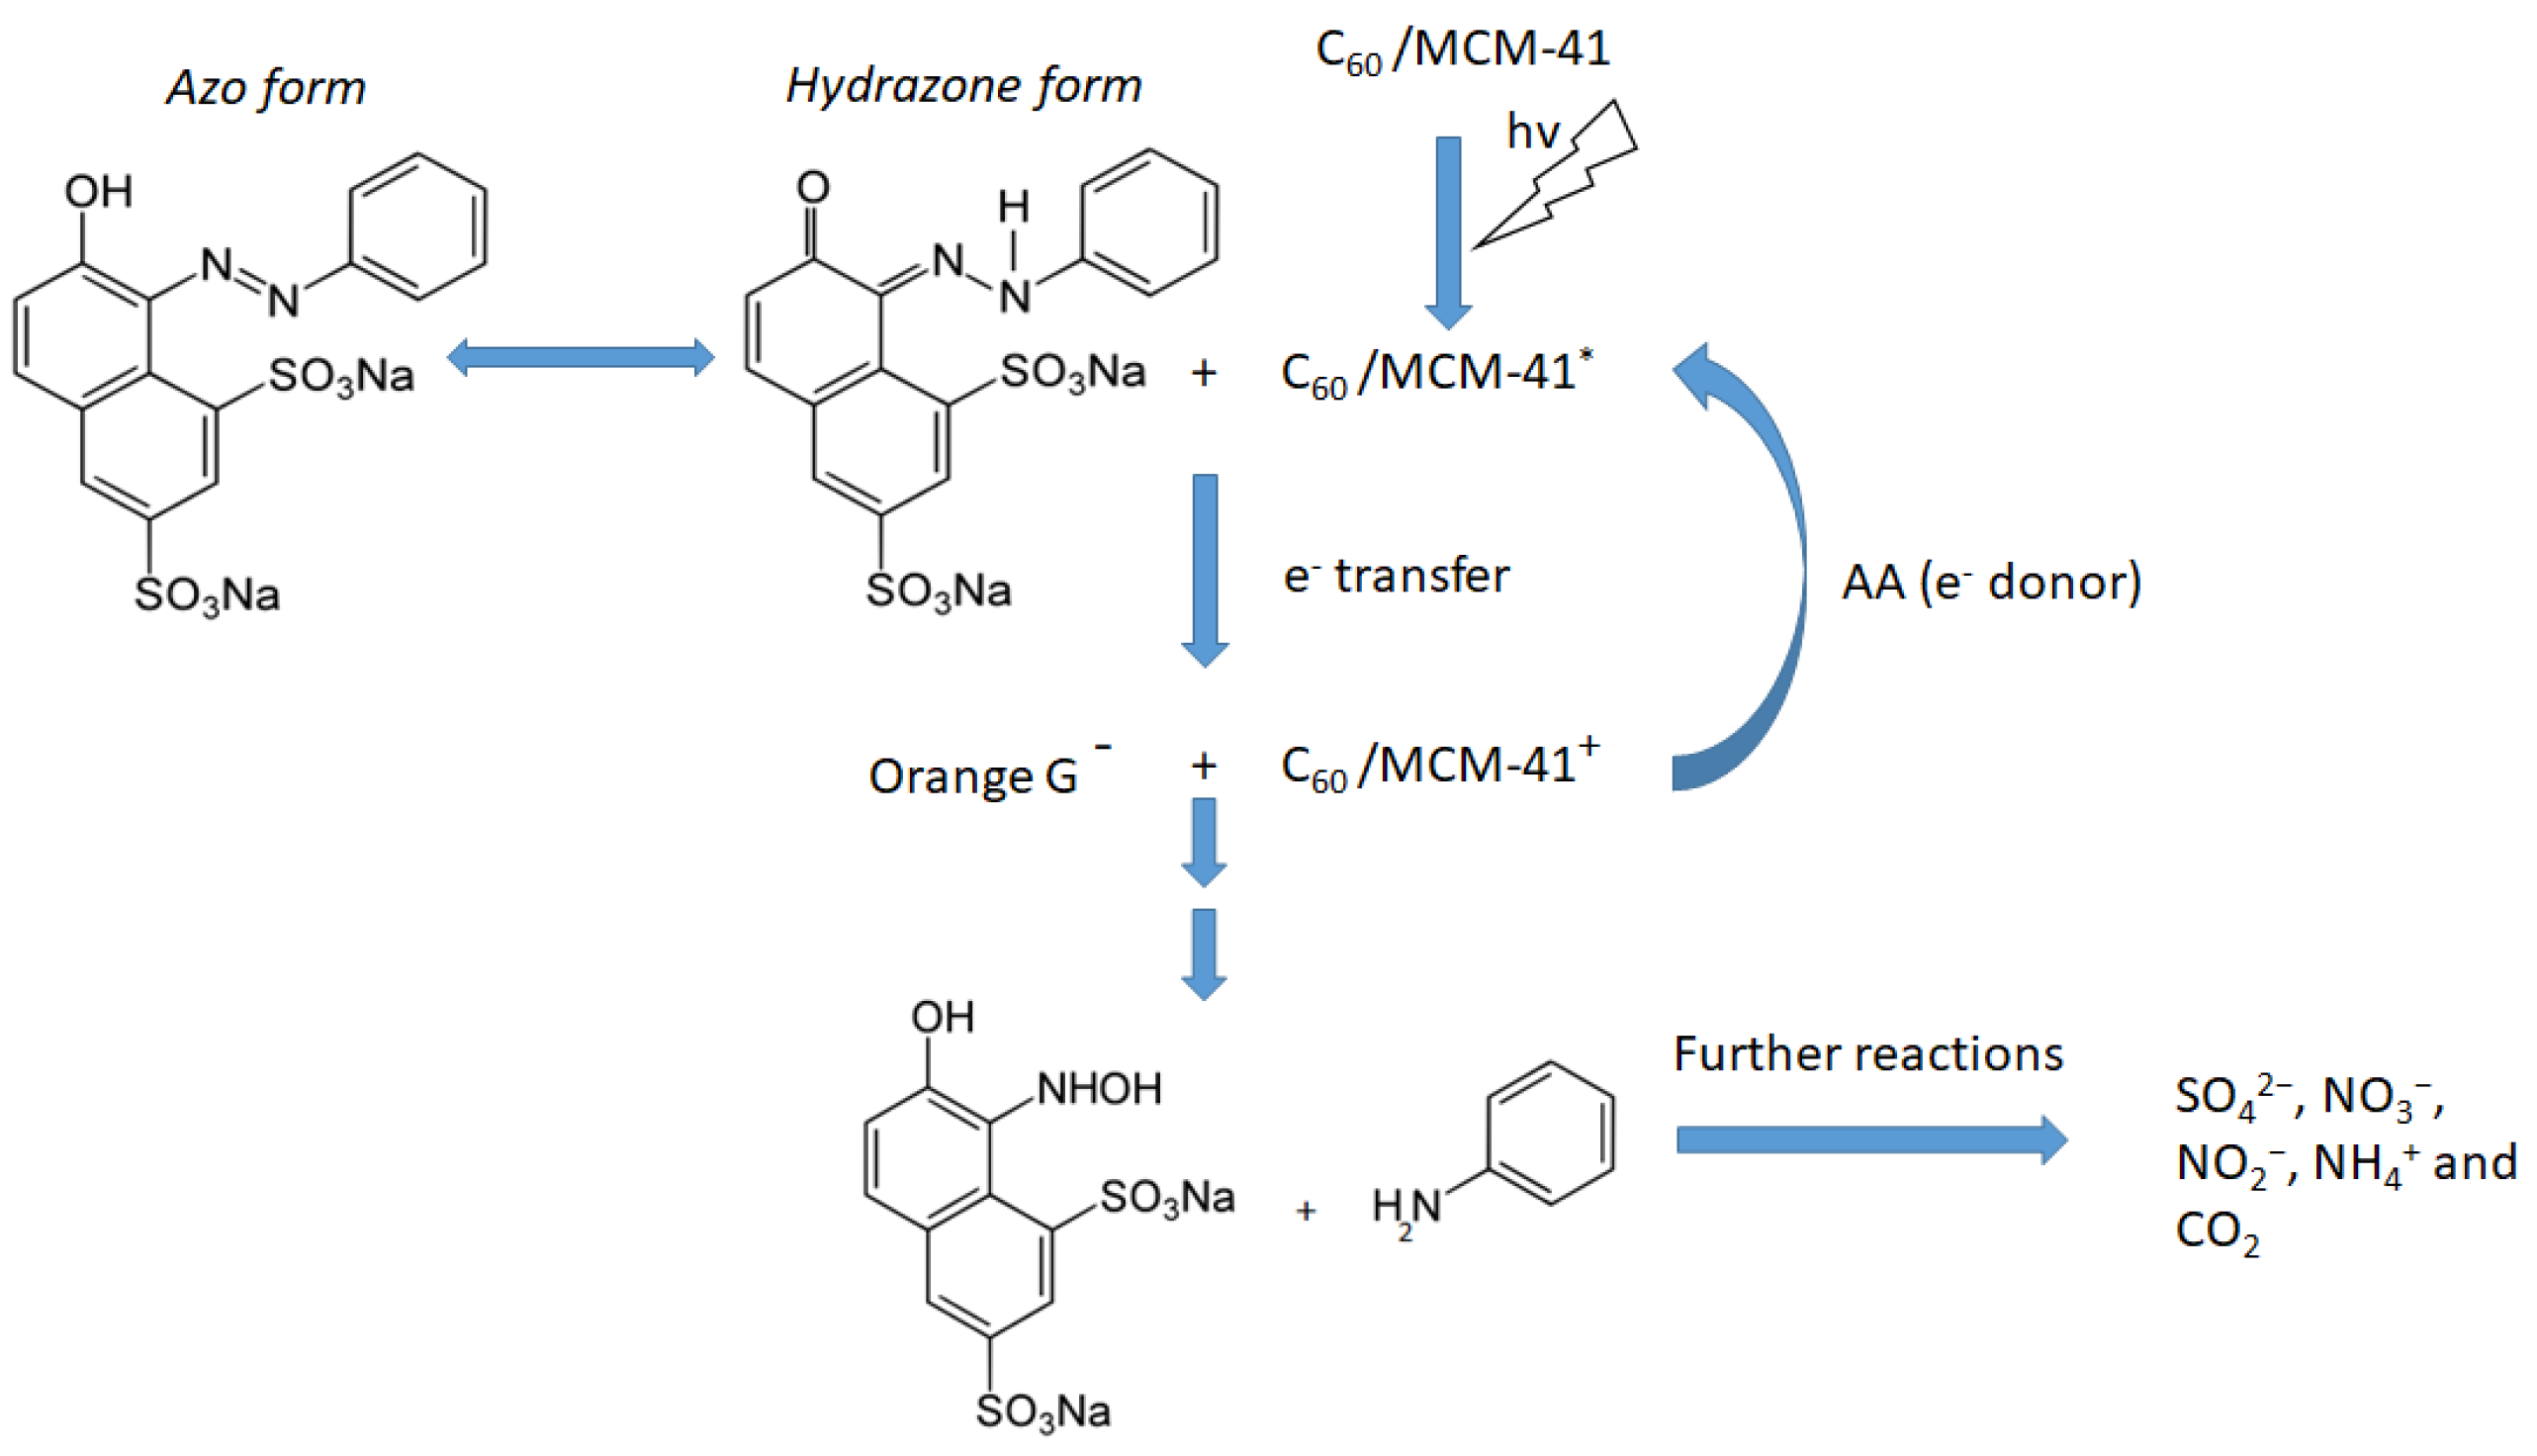
Taking into account our experimental findings, as well as the relevant literature [20,44,45], we can propose the following tentative reaction network for the photocatalytic degradation of OG over the C60/MCM-41 catalysts. Irradiation causes the excitation of C60 from the fundamental singlet state, 1C60, to the excited singlet state 1C60*. It is very probable that this state is transformed to the excited triplet state, 3C60*, by intersystem crossing [46]. Electron transfer occurs from the 3C60* to OG, being in the hydrozone form, adsorbed on catalyst surface and from AA to the 3C60*.This electron circulation activates the N-N bond and causes the decomposition of hydrozone structure towards 7-hydroxy-8-(hydroxyamino)naphthalene-1,3-disulfonic species and aniline. These intermediate products are further mineralized producing SO42−, NO3−, NO2−, NH4+, and CO2 [10]. Scheme 1 depicts the above described reaction network.
4. Conclusions
A series of C60/MCM-41 photocatalysts was studied for the first time in azo-dye removal from water. All these photocatalysts were proven to be active in the decolorization of orange G aqueous solutions.
The decolorization is achieved partly in the dark via adsorption of orange G on the bare MCM-41 surface following pseudo-second order kinetics. The adsorption in this stage is not accompanied by decomposition. The specific adsorption of the dye decreases as the fullerene content increases because photocatalyst specific surface area decreases and the surface of MCM-41 is covered by an increasing amount of the sensitizer.
The extent of decolorization is increased by irradiation in the presence of ascorbic acid and it is due to the photocatalytic degradation of the azo dye which is following first order kinetics.
The photocatalytic activity increases initially with C60 loading. It takes its maximum value over the sample containing 3 wt % C60 and then it significantly decreases as the C60 loading increases to 6 wt %. Further increase of C60 loading (up to 12 wt %) is accompanied by a slight decrease of photocatalytic activity being the result of a compromise between the increase of active phase loading and the lowering of its dispersion and thus intrinsic activity. The high photocatalytic activity exhibited by the sample 3C60/MCM-41 is attributed to the very small C60 clusters supported on MCM-41, which exhibit very high intrinsic activity.
The 3C60/MCM-41 catalyst proved to be quite stable upon five subsequent photocatalytic cycles, losing less than 5% of its initial activity.
The crucial role of ascorbic acid for photocatalytic degradation of azo-dyes over supported C60 catalysts has been demonstrated once again and a reaction network has been proposed.
Supplementary Materials
The following are available online at https://0-www-mdpi-com.brum.beds.ac.uk/2076-3417/9/9/1958/s1, Figure S1: Photocatalytic reactor (Heraeus) with the TQ 150 lamp situated in a glass cooling jacket filled with re-circulated deionized water and immersed in the reaction mixture, Figure S2: Relative spectral radiant flux of low pressure Hg lamp (TQ 150) being in a glass cooling jacket filled with re-circulated de-ionized water.
Author Contributions
All authors have contributed equally
Funding
This research received no external funding
Conflicts of Interest
The authors declare no conflict of interest
References
- Saeed, A.; Sharif, M.; Iqbal, M. Application Potential of Grapefruit Peel as Dye Sorbent: Kinetics, Equilibrium and Mechanism of Crystal Violet Adsorption. J. Hazard. Mater. 2010, 179, 564–572. [Google Scholar] [CrossRef] [PubMed]
- Monash, P.; Pugazhenthi, G. Adsorption of Crystal Violet Dye from Aqueous Solution Using Mesoporous Materials Synthesized at Room Temperature. Adsorption 2009, 15, 390–405. [Google Scholar] [CrossRef]
- Güzel, F.; Sayğılı, H.; Sayğılı, G.A.; Koyuncu, F. Decolorisation of Aqueous Crystal Violet Solution by a New Nanoporous Carbon: Equilibrium and Kinetic Approach. J. Ind. Eng. Chem. 2014, 20, 3375–3386. [Google Scholar] [CrossRef]
- Güzel, F.; Sayğılı, H.; Sayğılı, G.A.; Koyuncu, F. Elimination of Anionic Dye by Using Nanoporous Carbon Prepared from an Industrial Biowaste. J. Mol. Liq. 2014, 194, 130–140. [Google Scholar] [CrossRef]
- Senthilkumaar, S.; Kalaamani, P.; Subburaam, C.V. Liquid Phase Adsorption of Crystal Violet onto Activated Carbons Derived from Male Flowers of Coconut Tree. J. Hazard. Mater. B 2006, 136, 800–808. [Google Scholar] [CrossRef] [PubMed]
- Ahmad, R. Studies on Adsorption of Crystal Violet Dye from Aqueous Solution onto Coniferous Pinus Bark Powder (CPBP). J. Hazard. Mater. 2009, 171, 767–773. [Google Scholar] [CrossRef]
- Chen, L.C.; Chou, T.C. Photodecolorization of Methyl Orange Using Silver Ion Modified TiO2 as Photocatalyst. Ind. Eng. Chem. Res. 1994, 33, 1436–1443. [Google Scholar] [CrossRef]
- Li, Y.; Li, X.; Li, J.; Yin, J. Photocatalytic Degradation of Methyl Orange by TiO2-Coated Activated Carbon and Kinetic Study. Water Res. 2006, 40, 1119–1126. [Google Scholar] [CrossRef]
- Wang, X.H.; Li, J.G.; Kamiyama, H.; Moriyoshi, Y.; Ishigaki, T. Wavelength-Sensitive Photocatalytic Degradation of Methyl Orange in Aqueous Suspension over Iron(III)-Doped TiO2 Nanopowders under UV and Visible Light Irradiation. J. Phys. Chem. B 2006, 110, 6804–6809. [Google Scholar] [CrossRef] [PubMed]
- Kordouli, E.; Bourikas, K.; Lycourghiotis, A.; Kordulis, C. The Mechanism of Azo-Dyes Adsorption on the Titanium Dioxide Surface and Their Photocatalytic Degradation over Samples with Various Anatase/Rutile Ratios. Catal. Today 2015, 252, 128–135. [Google Scholar] [CrossRef]
- Batista, L.M.B.; Dos Santos, A.J.; Da Silva, D.R.; Alves, A.P.D.; Garcia-Segura, S.; Martinez-Huitle, C.A. Solar Photocatalytic Application of NbO2OH as Alternative Photocatalyst for Water Treatment. Sci. Total Environ. 2017, 596, 79–86. [Google Scholar] [CrossRef] [PubMed]
- Yang, Y.; Ok, Y.S.; Kim, K.H.; Kim, E.E.; Tsang, Y.F. Occurrences and Removal of Pharmaceuticals and Personal Care Products (PPCPs) in Drinking Water and Water/Sewage Treatment Plants: A Review. Sci. Total Environ. 2017, 596, 303–320. [Google Scholar] [CrossRef] [PubMed]
- Rodriguez-Narvaez, O.M.; Peralta-Hernandez, J.M.; Goonetilleke, A.; Bandala, E.R. Treatment Technologies for Emerging Contaminants in Water: A Review. Chem. Eng. J. 2017, 323, 361–380. [Google Scholar] [CrossRef]
- Khaki, M.R.D.; Shafeeyan, M.S.; Raman, A.A.A.; Daud, W.M.A.W. Application of Doped Photocatalysts for Organic Pollutant Degradation—A Review. Environ. Manag. 2017, 198, 78–94. [Google Scholar] [CrossRef]
- Uyguner-Demirel, C.S.; Birben, N.C.; Bekbolet, M. Elucidation of Background Organic Matter Matrix Effect on Photocatalytic Treatment of Contaminants Using TiO2: A Review. Catal. Today 2017, 284, 202–214. [Google Scholar] [CrossRef]
- Xiao, Q.; Yu, S.L.; Li, L.; Wang, T.; Liao, X.L.; Ye, Y.B. An Overview of Advanced Reduction Processes for Bromate Removal from Drinking Water: Reducing Agents, Activation Methods, Applications and Mechanisms. J. Hazard. Mater. 2017, 324, 230–240. [Google Scholar] [CrossRef] [PubMed]
- Vaiano, V.; Iervolino, G.; Rizzo, L.; Sannino, D. Advanced Oxidation Processes for the Removal of Food Dyes in Wastewater. Curr. Org. Chem. 2017, 21, 1068–1073. [Google Scholar] [CrossRef]
- Panda, D.; Manickam, S. Recent Advancements in the Sonophotocatalysis (SPC) and Doped-Sonophotocatalysis (DSPC) for the Treatment of Recalcitrant Hazardous Organic Water Pollutants. Ultrason. Sonochem. 2017, 36, 481–496. [Google Scholar] [CrossRef]
- Al-Hamdi, A.M.; Rinner, U.; Sillanpaa, M. Tin Dioxide as a Photocatalyst for Water Treatment: A Review. Process Saf. Environ. Prot. 2017, 107, 190–205. [Google Scholar] [CrossRef]
- Wakimoto, R.; Kitamura, T.; Ito, F.; Usami, H.; Moriwaki, H. Decomposition of Methyl Orange Using C60 Fullerene Adsorbed on Silica Gel as a Photocatalyst Via Visible-Light Induced Electron Transfer. Appl. Catal. B 2015, 166–167, 544–550. [Google Scholar] [CrossRef]
- Wang, X.; Maeda, K.; Thomas, A.; Takanabe, K.; Xin, G.; Carlsson, J.M.; Domen, K.; Antonietti, M. A Metal-Free Polymeric Photocatalyst for Hydrogen Production from Water under Visible Light. Nat. Mater. 2009, 8, 76–80. [Google Scholar] [CrossRef]
- Lyth, S.M.; Nabae, Y.; Moriya, S.; Kuroki, S.; Kakimoto, M.; Ozaki, J.; Miyata, S. Carbon Nitride as a Nonprecious Catalyst for Electrochemical Oxygen Reduction. J. Phys. Chem. C 2009, 113, 20148–20151. [Google Scholar] [CrossRef]
- Gligorovski, S.; Strekowski, R.; Barbati, S.; Vione, D. Environmental Implications of Hydroxyl Radicals (OH). Chem. Rev. 2015, 115, 13051–13092. [Google Scholar] [CrossRef]
- Talukdar, S.; Dutta, R.K. A Mechanistic Approach for Superoxide Radicals and Singlet Oxygen Mediated Enhanced Photocatalytic Dye Degradation by Selenium Doped ZnS Nanoparticles. RSC Adv. 2016, 6, 928–936. [Google Scholar] [CrossRef]
- Kroto, H.W.; O’Brien, J.R.; Curl, R.F.; Smalley, R.E. C60: Buckminsterfullerene. Nature 1985, 318, 162–163. [Google Scholar] [CrossRef]
- Chai, Y.; Guo, T.; Jin, C.; Haufler, R.E.; Felipe, L.P.; Fure, J.; Wang, L.; Alford, J.M.; Smalley, R.E. Fullerenes with Metals Inside. J. Phys. Chem. 1991, 95, 7564–7568. [Google Scholar] [CrossRef]
- Panagiotou, G.D.; Tzirakis, M.D.; Vakros, J.; Loukatzikou, L.; Orfanopoulos, M.; Kordulis, C.; Lycourghiotis, A. Development of [60] Fullerene Supported on Silica Catalysts for the Photo-Oxidation of Alkenes. Appl. Catal. A 2010, 372, 16–25. [Google Scholar] [CrossRef]
- Apostolopoulou, V.; Vakros, J.; Kordulis, C.; Lycourghiotis, A. Preparation and Characterization of [60] Fullerene Nanoparticles Supported on Titania Used as a Photocatalyst. Colloids Surf. A Phys. Eng. Asp. 2009, 349, 189–194. [Google Scholar] [CrossRef]
- Tzirakis, M.D.; Vakros, J.; Loukatzikou, L.; Amargianitakis, V.; Orfanopoulos, M.; Kordulis, C.; Lycourghiotis, A. γ-Alumina-Supported [60] Fullerene Catalysts: Synthesis, Properties and Applications in the Photooxidation of Alkenes. J. Mol. Catal. A Chem. 2010, 316, 65–74. [Google Scholar] [CrossRef]
- Vakros, J.; Panagiotou, G.; Kordulis, C.; Lycourghiotis, A.; Vougioukalakis, G.C.; Angelis, Y.; Orfanopoulos, M. Fullerene C60 Supported on Silica and γ-Alumina Catalyzed Photooxidations of Alkenes. Catal. Lett. 2003, 89, 269–273. [Google Scholar] [CrossRef]
- Kyriakopoulos, J.; Tzirakis, M.D.; Panagiotou, G.D.; Alberti, M.N.; Triantafyllidis, K.S.; Giannakaki, S.; Bourikas, K.; Kordulis, C.; Orfanopoulos, M.; Lycourghiotis, A. Highly Active Catalysts for the Photooxidation of Organic Compounds by Deposition of [60] Fullerene onto the MCM-41 Surface: A Green Approach for the Synthesis of Fine Chemicals. Appl. Catal. B 2012, 117–118, 36–48. [Google Scholar] [CrossRef]
- Kyriakopoulos, J.; Papastavrou, A.T.; Panagiotou, G.D.; Tzirakis, M.D.; Triantafyllidis, K.S.; Alberti, M.N.; Bourikas, K.; Kordulis, C.; Orfanopoulos, M.; Lycourghiotis, A. Deposition of Fullerene C60 on the Surface of MCM-41 Via the One-Step Wet Impregnation Method: Active Catalysts for the Singlet Oxygen Mediated Photooxidation of Alkenes. J. Mol. Catal. A Chem. 2014, 381, 9–15. [Google Scholar] [CrossRef]
- Lalwani, G.; Sitharaman, B. Multifunctional Fullerene and Metallofullerene Based Nanobiomaterials. Nano LIFE 2013, 3, 1342003. [Google Scholar] [CrossRef]
- Moor, K.J.; Kim, J.-H. Simple Synthetic Method Toward Solid Supported C60 Visible Light-Activated Photocatalysts. Environ. Sci. Technol. 2014, 48, 2785–2791. [Google Scholar] [CrossRef]
- Boumaza, S.; Bellal, B.; Boudjemaa, A.; Trari, M. Photodegradation of Orange G by the Hetero-Junction x%Bi2S3/TiO2 under Solar Light. Sol. Energy. 2016, 139, 444–451. [Google Scholar] [CrossRef]
- Sehati, S.; Entezari, M.H. Sono-Incorporation of CuO Nanoparticles on the Surface and into the Mesoporous Hexatitanate Layers: Enhanced Fenton-Like Activity in Degradation of Orange-G at Its Neutral pH. Appl. Surf. Sci. 2017, 399, 732–741. [Google Scholar] [CrossRef]
- Tang, L.; Wang, J.; Wang, L.; Jia, C.; Lv, G.; Liu, N.; Wu, M. Facile Synthesis of Silver Bromide-Based Nanomaterials and Their Efficient and Rapid Selective Adsorption Mechanisms Toward Anionic Dyes. ACS Sustain. Chem. Eng. 2016, 4, 4617–4625. [Google Scholar] [CrossRef]
- Bourikas, K.; Kordulis, C.; Lycourghiotis, A. Differential Potentiometric Titration: Development of a Methodology for Determining the Point of Zero Charge of Metal (Hydr) Oxides by One Titration Curve. Environ. Sci. Technol. 2005, 39, 4100–4108. [Google Scholar] [CrossRef]
- Liu, C.-F.; Huang, C.P.; Hu, C.-C.; Juang, Y.; Huang, C. Photoelectrochemical Degradation of Dye Wastewater on TiO2-Coated Titanium Electrode Prepared by Electrophoretic Deposition. Sep. Purif. Technol. 2016, 165, 145–153. [Google Scholar] [CrossRef]
- Nassar, M.Y.; Ali, A.A.; Amin, A.S. A Facile Pechini Sol–Gel Synthesis of TiO2/Zn2TiO2/ZnO/C Nanocomposite: An Efficient Catalyst for the Photocatalytic Degradation of Orange G Textile Dye. RSC Adv. 2017, 7, 30411–30421. [Google Scholar] [CrossRef]
- Hernandez-Uresti, D.B.; Martinez-de la Cruz, A.; Torres-Martinez, L.M. Photocatalytic Degradation of Organic Compounds by PbMoO4 Synthesized by a Microwave-Assisted Solvothermal Method. Ceram. Int. 2016, 42, 3096–3103. [Google Scholar] [CrossRef]
- Barzgari, Z.; Askari, S.Z.; Ghazizadeh, A. Fabrication of Nanostructured CuWO4 for Photocatalytic Degradation of Organic Pollutants in Aqueous Solution. J. Mater. Sci. Mater. Electron. 2017, 28, 3293–3298. [Google Scholar] [CrossRef]
- Roumila, Y.; Abdmeziem, K.; Rekhila, G.; Trari, M. Semiconducting Properties of Hydrothermally Synthesized Libethenite Application to Orange G Photodegradation. Mater. Sci. Semicond. Process. 2016, 41, 470–479. [Google Scholar] [CrossRef]
- Stylidi, M.; Kondarides, D.I.; Verykios, X.E. Pathways of Solar Light-Induced Photocatalytic Degradation of Azo Dyes in Aqueous TiO2 Suspensions. Appl. Catal. B Environ. 2003, 40, 271–286. [Google Scholar] [CrossRef]
- Madhavan, J.; Grieser, F.; Ashokkumar, M. Degradation of Orange-G by Advanced Oxidation Processes. Ultrason. Sonochem. 2010, 17, 338–343. [Google Scholar] [CrossRef]
- Arbogast, J.W.; Foote, C.S.; Kao, M. Electron Transfer to Triplet Fullerene C60. J. Am. Chem. Soc. 1992, 114, 2277–2279. [Google Scholar] [CrossRef]
Figure 1.
Electronic spectra of aqueous solutions of OG (25 μM), OG and AA (25 μM OG & 0.5 mM AA), and AA (0.25 mM).
Figure 1.
Electronic spectra of aqueous solutions of OG (25 μM), OG and AA (25 μM OG & 0.5 mM AA), and AA (0.25 mM).

Figure 2.
Absorbance of an aqueous solution containing OG and AA recorded at various contact times with the photocatalyst 3C60/MCM-41 in the dark.
Figure 2.
Absorbance of an aqueous solution containing OG and AA recorded at various contact times with the photocatalyst 3C60/MCM-41 in the dark.

Figure 3.
Change of absorbance determined at 475 nm for OG -AA aqueous solutions with the time in the presence of the 3C60/MCM-41 and 9C60/MCM-41 photo-catalysts as well as for the OG aqueous solution in the presence of the 3C60/MCM-41 photo-catalyst. The values on the y-axis are normalized over the absorbance at zero time.

Figure 4.
Absorbance spectra of OG-AA aqueous solution in contact with the 3C60/MCM-41 photocatalyst at various irradiation times after equilibration in the dark.
Figure 4.
Absorbance spectra of OG-AA aqueous solution in contact with the 3C60/MCM-41 photocatalyst at various irradiation times after equilibration in the dark.

Figure 5.
Kinetics of decolorization through irradiation over the photo-catalyst 9C60/MCM-41.

Figure 6.
Decrease of absorbance decrease determined at 330 and 250 nm with time over the sample 3C60/MCM41. The absorbance values are normalized over the absorbance at zero time.
Figure 6.
Decrease of absorbance decrease determined at 330 and 250 nm with time over the sample 3C60/MCM41. The absorbance values are normalized over the absorbance at zero time.

Figure 7.
Degradation (%) of Orange G aqueous solution using the same 3C60/MCM-41 powder (1–5 cycles). The initial concentrations of methyl orange and ascorbic acid were 25 μM and 0.50 mM, respectively.
Figure 7.
Degradation (%) of Orange G aqueous solution using the same 3C60/MCM-41 powder (1–5 cycles). The initial concentrations of methyl orange and ascorbic acid were 25 μM and 0.50 mM, respectively.

Scheme 1.
A schematic representation illustrating the tentative pathway of orange G (OG) degradation over C60/MCM-41 photocatalyst.
Scheme 1.
A schematic representation illustrating the tentative pathway of orange G (OG) degradation over C60/MCM-41 photocatalyst.


Table 1.
Values of specific surface area (SSABET), specific adsorption (SA), rate constants of adsorption (kA2) and photocatalytic decomposition (kR) of Orange G and percentage of decolorization of the aqueous solutions
Table 1.
Values of specific surface area (SSABET), specific adsorption (SA), rate constants of adsorption (kA2) and photocatalytic decomposition (kR) of Orange G and percentage of decolorization of the aqueous solutions
| Sample | C60 wt % | SSABET (m2g−1) | SA (μmol g−1) | kA2 × 103 (g min−1 mg−1) | kR × 102 (min−1g−1) | Decolorization (%)* |
|---|---|---|---|---|---|---|
| 1C60/MCM-41 | 1 | 851 | 37.2 | 6.1 | 0.56 | 41 |
| 3C60/MCM-41 | 3 | 831 | 36.5 | 5.1 | 1.38 | 74.9 |
| 6C60/MCM-41 | 6 | 813 | 11.2 | 0.5 | 0.63 | 39.5 |
| 9C60/MCM-41 | 9 | 777 | 10.4 | 0.2 | 0.54 | 40.8 |
| 12C60/MCM-41 | 12 | 760 | 9.6 | 0.2 | 0.48 | 44.3 |
* Determined at the end of the combined experiment in the dark and then under irradiation for 135min.
© 2019 by the authors. Licensee MDPI, Basel, Switzerland. This article is an open access article distributed under the terms and conditions of the Creative Commons Attribution (CC BY) license (http://creativecommons.org/licenses/by/4.0/).
Share and Cite
MDPI and ACS Style
Kyriakopoulos, J.; Kordouli, E.; Bourikas, K.; Kordulis, C.; Lycourghiotis, A. Decolorization of Orange-G Aqueous Solutions over C60/MCM-41 Photocatalysts. Appl. Sci. 2019, 9, 1958. https://0-doi-org.brum.beds.ac.uk/10.3390/app9091958
AMA Style
Kyriakopoulos J, Kordouli E, Bourikas K, Kordulis C, Lycourghiotis A. Decolorization of Orange-G Aqueous Solutions over C60/MCM-41 Photocatalysts. Applied Sciences. 2019; 9(9):1958. https://0-doi-org.brum.beds.ac.uk/10.3390/app9091958
Chicago/Turabian StyleKyriakopoulos, John, Eleana Kordouli, Kyriakos Bourikas, Christos Kordulis, and Alexis Lycourghiotis. 2019. "Decolorization of Orange-G Aqueous Solutions over C60/MCM-41 Photocatalysts" Applied Sciences 9, no. 9: 1958. https://0-doi-org.brum.beds.ac.uk/10.3390/app9091958
Note that from the first issue of 2016, this journal uses article numbers instead of page numbers. See further details here.