Preliminary Study on Greywater Treatment Using Nonwoven Textile Filters

1
Department of Hydraulic and Sanitary Engineering, Poznań University of Life Sciences, 60-637 Poznań, Piątkowska Str. 94 A, Poland
2
Department of Environmental Engineering, An Giang University, 18 Ung Van Khiem, Long Xuyen, An Giang 880000, Vietnam
*
Author to whom correspondence should be addressed.
Appl. Sci. 2019, 9(15), 3205; https://0-doi-org.brum.beds.ac.uk/10.3390/app9153205
Submission received: 21 June 2019
/
Revised: 29 July 2019
/
Accepted: 2 August 2019
/
Published: 6 August 2019
(This article belongs to the Special Issue Innovative Water and Wastewater Treatment Technologies for Supporting Global Sustainability 2020)
Abstract
:The objective of the study was to evaluate the usefulness of novel nonwoven textile filter technology for greywater treatment. This technology had already been used on a lab scale for septic tank effluent treatment; however, this study is the first time it has been used for greywater treatment. The set-up period with septic tank effluent (STE) feeding was significantly shorter than that of greywater feeding. The average capacities of both filter types were practically the same: 1.0–1.4 cm d−1. The relatively high efficiencies of chemical oxygen demand (CODCr) and biochemical oxygen demand (BOD5) removal (58.8–71.6% and 56.7–79.8%, respectively) were obtained thanks to the relatively low filtration velocity and effective diffusion of atmospheric air into the greywater. The relatively high efficiency of total suspended solids (TSS) removal (67.0–88.4%) was obtained by reducing the effective pore size of the filtration layer due to high biomass concentration and accumulation of suspended solids. Thanks to hydrostatic pressure, the filters can work practically with very low energy consumption. The pollutants removal efficiencies were satisfactory in respect to simple construction and maintenance, low investment and operational costs.
1. Introduction
Water is the core of life while humanity is facing increasingly severe water scarcity through population growth, climate change, etc. Water scarcity is already a fact in all continents. According to the United Nations (UN), about three billion people in parts of Asia and Africa will be faced with a water shortage in 2025 [1]. To sustainably protect water resources and to cope with water scarcity, greywater is emerging as a resource that has the potential to reduce stress for water scarcity regions. Greywater consists of sources that are discharged from the laundry, bath, and shower, and kitchen wastewater, excluding wastewater from toilets. Moreover, kitchen greywater contains a high level of nutrients and organic loadings and is often separated to improve efficiency for treatment and greywater reuse [2,3,4].
The characteristics of greywater not only depend upon factors such as the living standards, social and culture area of residents, and water shortage level, but also relate to traces found in many categories and production materials of soap, toothpaste, salt, shampoos, and detergents [4]. Indeed, the greywater fluctuated from 60 to 140 dm3 person−1 day−1 in the developed countries, while in the developing countries it amounted to 20–30 dm3 person−1 day−1 [5,6]. Greywater contributes to more than 50% of total volume of domestic wastewater [2,4]. However, the composition of organic matter (COD), N, P, and K in greywater is: 29–62%, 9–14%, 20–32%, and 18–22%, respectively [7]. In addition, total suspended solids present in the greywater that depend upon dirt and dust from clothes and zeolite are used in the detergents. The total suspended solids in the greywater range from 170 to 330 mg dm−3 and the particle size of the solid ranges from 10 to 100 µm [8,9].
Greywater is a potential source for reuse because it is less polluted but accounts for a significant volume in household wastewater. Greywater can be treated to reuse for toilet flushing, which has decreased up to 13–41% of total freshwater consumption [10]. Moreover, greywater has a high potential for irrigation because the required quality is not higher than toilet flushing and the plant can take up some nutrients in the greywater. According to Matos [11], household greywater provided enough irrigation for 20 m2 during months of the dry season, with 11.5 mm day−1. Greywater reuse has demonstrated efficiency in many regions that are facing water scarcity. An example in Sydney, Australia, where 3.99 × 10⁷ dm3 year−1 has been reused by saving 9.7 × 10⁶ dm3 year−1 when greywater reuse policy was implemented [12].
Nonwoven fabrics have found application in small wastewater treatment plants since the 1990s, mainly as bulk filters, consisting of pieces of polypropylene nonwoven and hanging or trickling filters [13]. Despite the good treatment results obtained in laboratory conditions, they are not always effective in the field [14]. Intensive wastewater recirculation (up to 700%) is often required. A significant application of nonwoven fabrics (geotextiles) consists of the separation of suspended matter, including activated sludge [15] and biological treatment accompanying wastewater runoff on the nonwoven surface, as well as the use of nonwoven fabrics in the form of biomass carrier [16]. In studies carried out by Korkut [17] and Korkut [18], nonwovens submerged in aerated reactors were used, with the flow of wastewater taking place mainly at the surface of nonwoven fabrics, not through their pores. A few studies were carried out using wastewater filtration through nonwoven fabric under aerobic or anaerobic conditions, mainly for the recognition of hydraulic properties and the process of clogging [19,20,21,22]. Non-woven or woven filters are used in various technological systems: as part of the first stage of treatment, e.g., in the form of composting sieves, mainly used for separation of solids from raw wastewater [23], as a second stage of treatment [13,24], and simultaneously as the first and second stage—mechanical and biological wastewater treatment [15,25]. Most of the research was carried out using geotextiles as a biomass carrier immersed in aerated [26] or oxygenated reactors [27]. Often, nonwoven fabrics were wrapped on membranes or aerated media. As a result, better contact with oxygen was achieved than through deep aeration of the liquid, which is the reactor content. In this respect, the principle of operation is similar to that of membrane bioreactors (MBR) [28].
Advantages of nonwoven fabrics noted by many authors include: laying the supporting media for the development of the biofilm, creating conditions for the growth of long age biomass and differentiation of oxygen conditions inside the nonwoven fabric (especially of a greater thickness), enabling the growth of various groups of organisms (heterotrophic and autotrophic) and the occurrence of many unit processes (appropriate for aerobic, anoxic, and anaerobic conditions) [18,29].
The characteristic properties of biomass covering non-woven filters were identified during the studies carried out on septic tank effluent bio-filtration (heterogeneous, granular structure inside the nonwoven fabric, more homogeneous and more strongly compacted, yet the structure of the filter cake on the filter surface being easy to detach).
Relatively high removal efficiency of total suspended solids (TSS): 67.3–79.3%, chemical oxygen demand (CODCr): 69.5–76.0%, and biochemical oxygen demand (BOD5): 51.3–73.1%was observed during the previous research carried out on septic tank effluent (STE) treatment by filtration. The results showed that filters for STE treatment can be a very useful technology as the second stage of an on-site wastewater treatment plant, especially in the conditions of treated wastewater discharge to surface waters [30].
Filters used for STE treatment meet the requirements of the regulation of the Ordinance of the Minister of Environment of 18 November 2014 on conditions to be met when introducing wastewater into waters or into the ground and on substances particularly harmful to the aquatic environment [31] in terms of not exceeding the maximum permissible values of pollution indicators in terms of total suspended solids, CODCr, and BOD5 (eight-layer filters).
However, several studies carried out on the domestic wastewater treatment using textiles as biomass supporting media or activated sludge separation barrier exist in the literature, there are no reports related to the greywater treatment by textile filters [18].
The objective of the study was to evaluate the usefulness of novel nonwoven textile filter technology and construction for greywater treatment.
2. Materials and Methods
Experimental sets were located in the laboratory of Department of Hydraulic and Sanitary Engineering (Poznań University of Life Sciences, Piątkowska Str. 94 A, Poznań). The study was made at a temperature close to room temperature, however, some differentiation was observed (17–27 °C). This was caused by window openings and central heating intensity fluctuation. The study was conducted from August 2017 till December 2018. From the last week of August till the beginning of October 2017, the initial start-up using tap water was performed in order to tightness of the set-up verification and flow rate (dosage volume) setting. Samples treated as greywater inflowing to filters were taken from reactors and outflowing—collected in beakers as dropping form filters (through the outflow pipes).
Two sets of filters were used in the tests (Figure 1).
The first set (set I) consisted of two filters: four-layer filter (filter 1) (3.6 mm thick, polyfelt TS 20 with a thickness of 0.9 mm each) and eight-layer filter (filter 2) (with a thickness of 7.2 mm). The dimensions of filters inside set I were: 6.0 × 20.0 × 40.0 cm (height). The reactor containing filters of set I was made of a PE panels, and its internal dimensions were: 17.0 × 28.0 × 40.0 cm. The filters of set I were made of geotextile wrapped around a plastic framework. The second set (set II) consisted of five filters (filter 1-filter 5) made of four-layer filtering material—polyfelt TS 20 (with a thickness of 3.6 mm). The reactor containing filters of set II was made of a PVC tube of 16.0 cm diameter and 40.0 cm long with five filters. The external diameter of a single filter was 2.36 cm and its height 35 cm. Non-woven geotextile (polyfelt TS 20) layers were glued on a galvanized steel grid with the dimensions of a single mesh of 12 × 12 mm. A few conclusions have been taken from building and operation of similar construction set-up used for septic tank effluent treatment [30], e.g., related to isolation—special gum rings have been used for connection of filters outflow pipes with the bottom of the reactor and geotextile coupons have been glued using specially dedicated glue.
The reactors were fed with greywater by a pump controlled by a programmable time controller, six times a day (every 4 h). Set I was fed with greywater of average volume 288 cm3 to the maximum level of 20.0–25.0 cm and minimum greywater level was 9.0–12.0 cm. Set II was fed with greywater of average volume 500 cm3 and operated at greywater levels: 20.0–23.0 cm (maximum) and 11.0–14.0 cm (minimum). Hydraulic capacity was calculated as the quotient of the outflow volume from a given filter and its active filtration surface per time unit. The second set (set II) dimensions have been changed comparing to the set I with the aim of reducing the total capacity of filters, however, the basic principles of technology and filters operation have remained unchanged.
The geotextile properties used in both sets (trade name: polyfelt TS 20) were: thickness: 0.9 mm, surface mass: 125 g m−2, specific surface area about 104 m2 m−3, opening size O90: 0.105 mm (according to EN ISO 12956) [32], permeability at stress 2 kPa 115 dm3 m−2 s−1.
The set I during the start-up period was fed with septic tank effluent and after reaching the expected biomass concentration the filter set I was fed with greywater. The set II was fed during both the start-up period and during work period - with greywater.
The aim of using two sets (set I and set II) was to compare the start-up period longevity. The set I was fed with STE, and then, with greywater. The set II was fed with greywater from the beginning of the experiment. The expected problem of filters start-up feeding with greywater was that due to the low biodegradability of greywater (compared with STE), some difficulty with attaining satisfactory final biomass occupancy and pollutant removal efficiency could appear.
Determination of pollution indicators, defined as: dissolved organic and nutrient compounds—five-day biochemical oxygen demand (BOD5) and chemical oxygen demand (CODCr) and total phosphorus (Ptot) was performed for greywater filtered through paper filters (with a pore size 4–7 μm) and—as particulate pollution indicator—total suspended solids (TSS). Determination of BOD5 was performed by the respirometric method and COD—by the dichromate method (Merck spectrophotometer). The content of the total suspended solids was determined by the drying-weight method. The concentration of total phosphorus in the greywater was investigated by the colorimetric method by means of a spectroquant Nova 60 Photometer (Merck, Germany) with Spectroquant kit No. 114449. The values of these indicators were determined in accordance with the following standards: PN-ISO 6060: 2006 (COD) [33], PN-EN ISO 6878:2006 (Ptot) [34] and PN-EN 872: 2007 (TSS) [35].
The greywater was semi-natural. The selection and proportions of ingredients used for the semi-natural greywater (simulating bath/shower outflow) preparation were based with the aim of achieving greywater properties that were comparable to Polish households. The proportions of greywater ingredients were arranged to obtain those that are typical for European (Polish) natural greywater: respectively 62% from shower, 31% from laundry, and 7% from wash basin. These proportions are comparable to those mentioned in the literature [36,37].
In order to make 36 dm3 of semi-natural greywater for the experiment, the following ingredients were used: 12 dm3 of natural laundry greywater discharged from the washing machine after washing 3–5 kg of clothes (washing powder, Ariel, Procter and Gamble, Warsaw, Poland), 24 dm3 of artificial greywater simulating bath/shower greywater, prepared using: g 3.6 g of shampoo (Head & Shoulders, Procter and Gamble, Warsaw, Poland), 5.7 g of shower gel (Colgate-Palmolive, Warsaw, Poland), 0.42 g of liquid soap (Serpol-Cosmetics Ltd., Poland), and 24 dm3 of tap water.
The semi-natural greywater for the experiment was collected and prepared every several days and stored in a fridge. The degradability of used greywater expressed as chemical oxygen demand to biochemical oxygen demand (CODCr/BOD5) rate was 3.2 for set I and 2.8 for set II, respectively. However, the semi-natural greywater being dosed was the same, the inflowing into the filters of set I and set II pollutants concentrations were slightly different due to the different average retention times in the bioreactors.
The average values of pollution indicators in the greywater flowing into the filters of set I were on average for the whole time of the experiment: 227.8 ± 27.2 mg O2 dm−3 (n = 18) for CODCr, 70.6 ± 5.1 mg O2 dm−3 (n = 18) for BOD5, 6.4 ± 1.1 mg Ptot dm−3 (n = 18) for Ptot, and 45.8 ± 15.8 mg dm−3 (n = 6) for total suspended solids (TSS). The average values of pollution indicators in greywater flowing into the filters of set II were on average for the whole time of the experiment: 153.1 ± 9.5 mg O2 dm−3 (n = 7) for CODCr, 49.2 ± 4.6 mg O2 dm−3 (n = 6) for BOD5, 4.2 ± 0.4 mg Ptot dm−3 (n = 7) for Ptot, and 49.4 ± 28.5 mg dm−3 (n = 4) for total suspended solids (TSS). The pollution compositions of the semi-natural greywater in the study fluctuated in the range of real greywater [4,6,38]. Moreover, organic matter detected as BOD5 and COD was close to the same value of real greywater in the study for greywater treatment by slow filters of sand and slate waste followed by granular activated carbon [39] and of real greywater compositions in airport [40].
Statistical analyses were conducted by using program R (version 3.5.1). All tests were conducted for the confidence interval of 95%. A paired t.test was conducted for samples of normal distribution and a paired wilcox.test for non-parameter distribution so as to compare the means of paired observations in set I (between filter 1 and filter 2) and set II (between filter 1 and filter 5) through time. The t. test/ wilcox.test was conducted to compare the means between selected filters of set I (filter 1) and set II (filter 1).
3. Results
3.1. Start-Up Period Longevities and Filter Hydraulic Capacities
The start-up period longevities were 12 weeks for set I (from beginning of October till 22 December 2017) and 22 weeks for set II (17 May–25 October 2018). CODCr, BOD5, Ptot, and TSS were collected to observe the removal efficiency on set I and set II from 25 December 2017 to 13 December 2018 (339 days) and from 25 October 2018 to 29 January 2019 (96 days), respectively.
The average filter hydraulic capacities (flow rates) of both filter sets for operational period (after the end of start-up period) were nearly equal: 1.0 ± 0.1 cm d−1 (n = 13 + 13) for filter 1 and 1.4 cm d−1 for filter 2 of set I and 1.0 ± 0.1–1.4 ± 0.2 cm d−1 (n = 21) for filters of set II. Due to the lack of sufficient measurement replications (breakage of ceramic pots) the filter 3 of set II has been excluded from the results analysis related to TSS. The greywater average retention time in the set I was 19.2–48.0 h and in the set II, it was 13.6–28.3 h.
3.2. Efficiency of Organic Compounds and Nutrients Removal
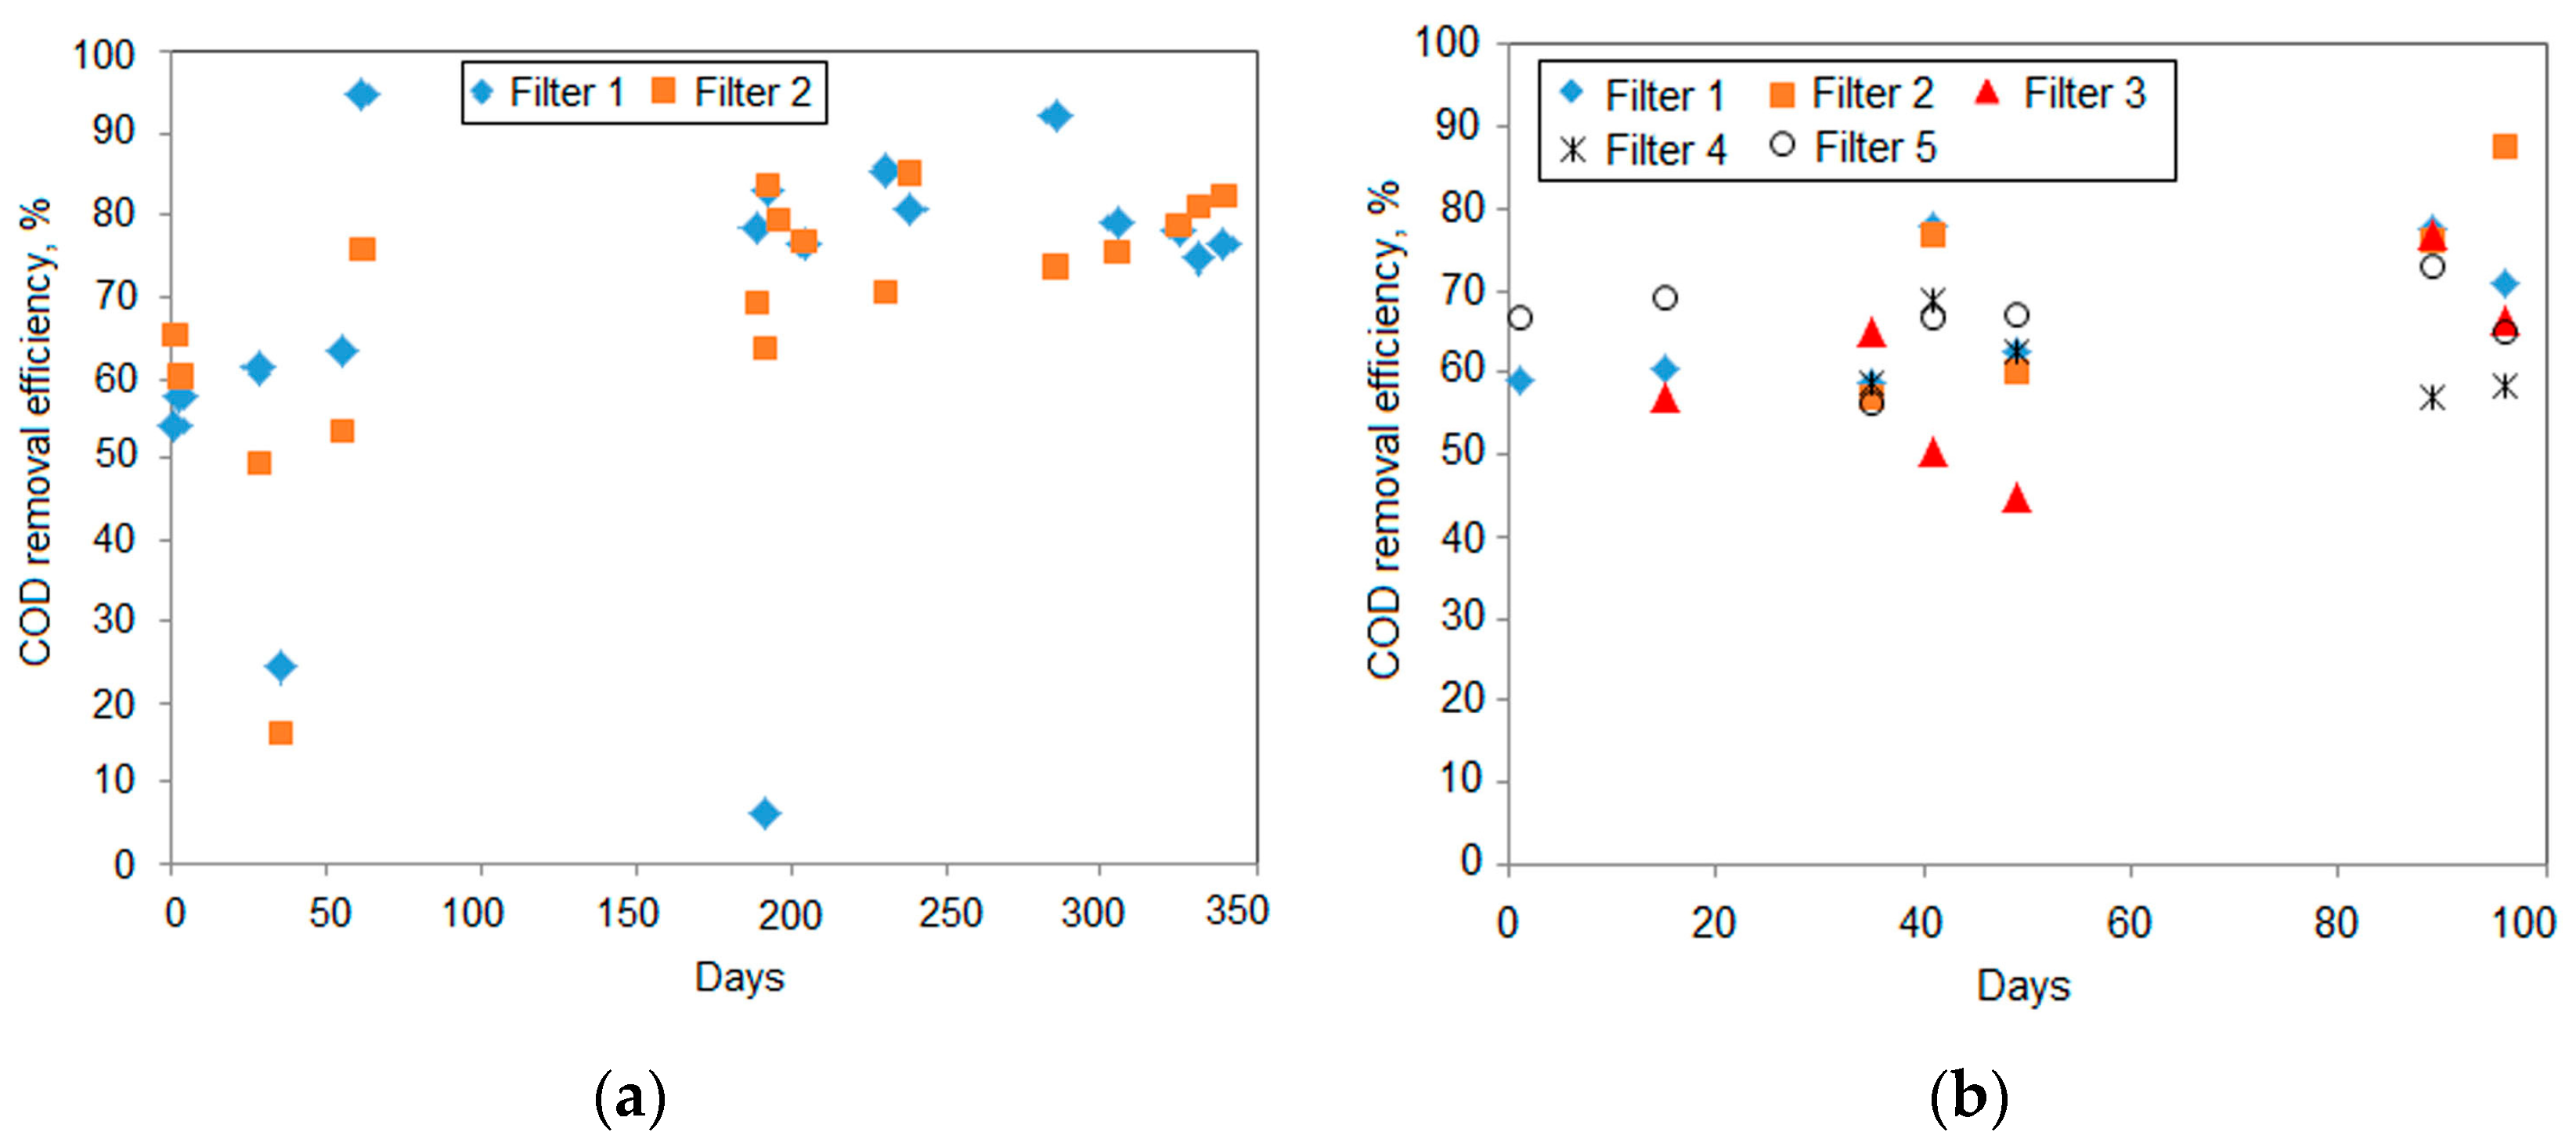
The treatment efficiencies of CODCr of set I and set II were shown in Figure 2.
The inflow CODCr values were: 227.8 ± 26.7 mg dm−3 (n = 18) and 153.1 ± 9.5 mg dm−3 (n = 7) for set I and set II, respectively (Figure 3 and Figure 4).
Efficiencies of removal of dissolved organic substances expressed as CODCr were: 68.7 ± 5.6% (n = 17) for filter 1 and 68.9 ± 4.0% (n = 18) for filter 2 of set I (Figure 3). Efficiencies of CODCr removal by filters of set II were from 58.8 ± 3.6% (n = 5) to 71.6 ± 6.4% (n = 5) and were related to their hydraulic capacity (Figure 4). In general—the lower hydraulic capacity—the higher the removal efficiency. The outflow CODCr values were in the range between 11.0 mg O2 dm−3 and 124.0 mg O2 dm−3 in the case of set I and between 19.0 mg O2 dm−3 and 88.0 mg O2 dm−3 in the case of set II.
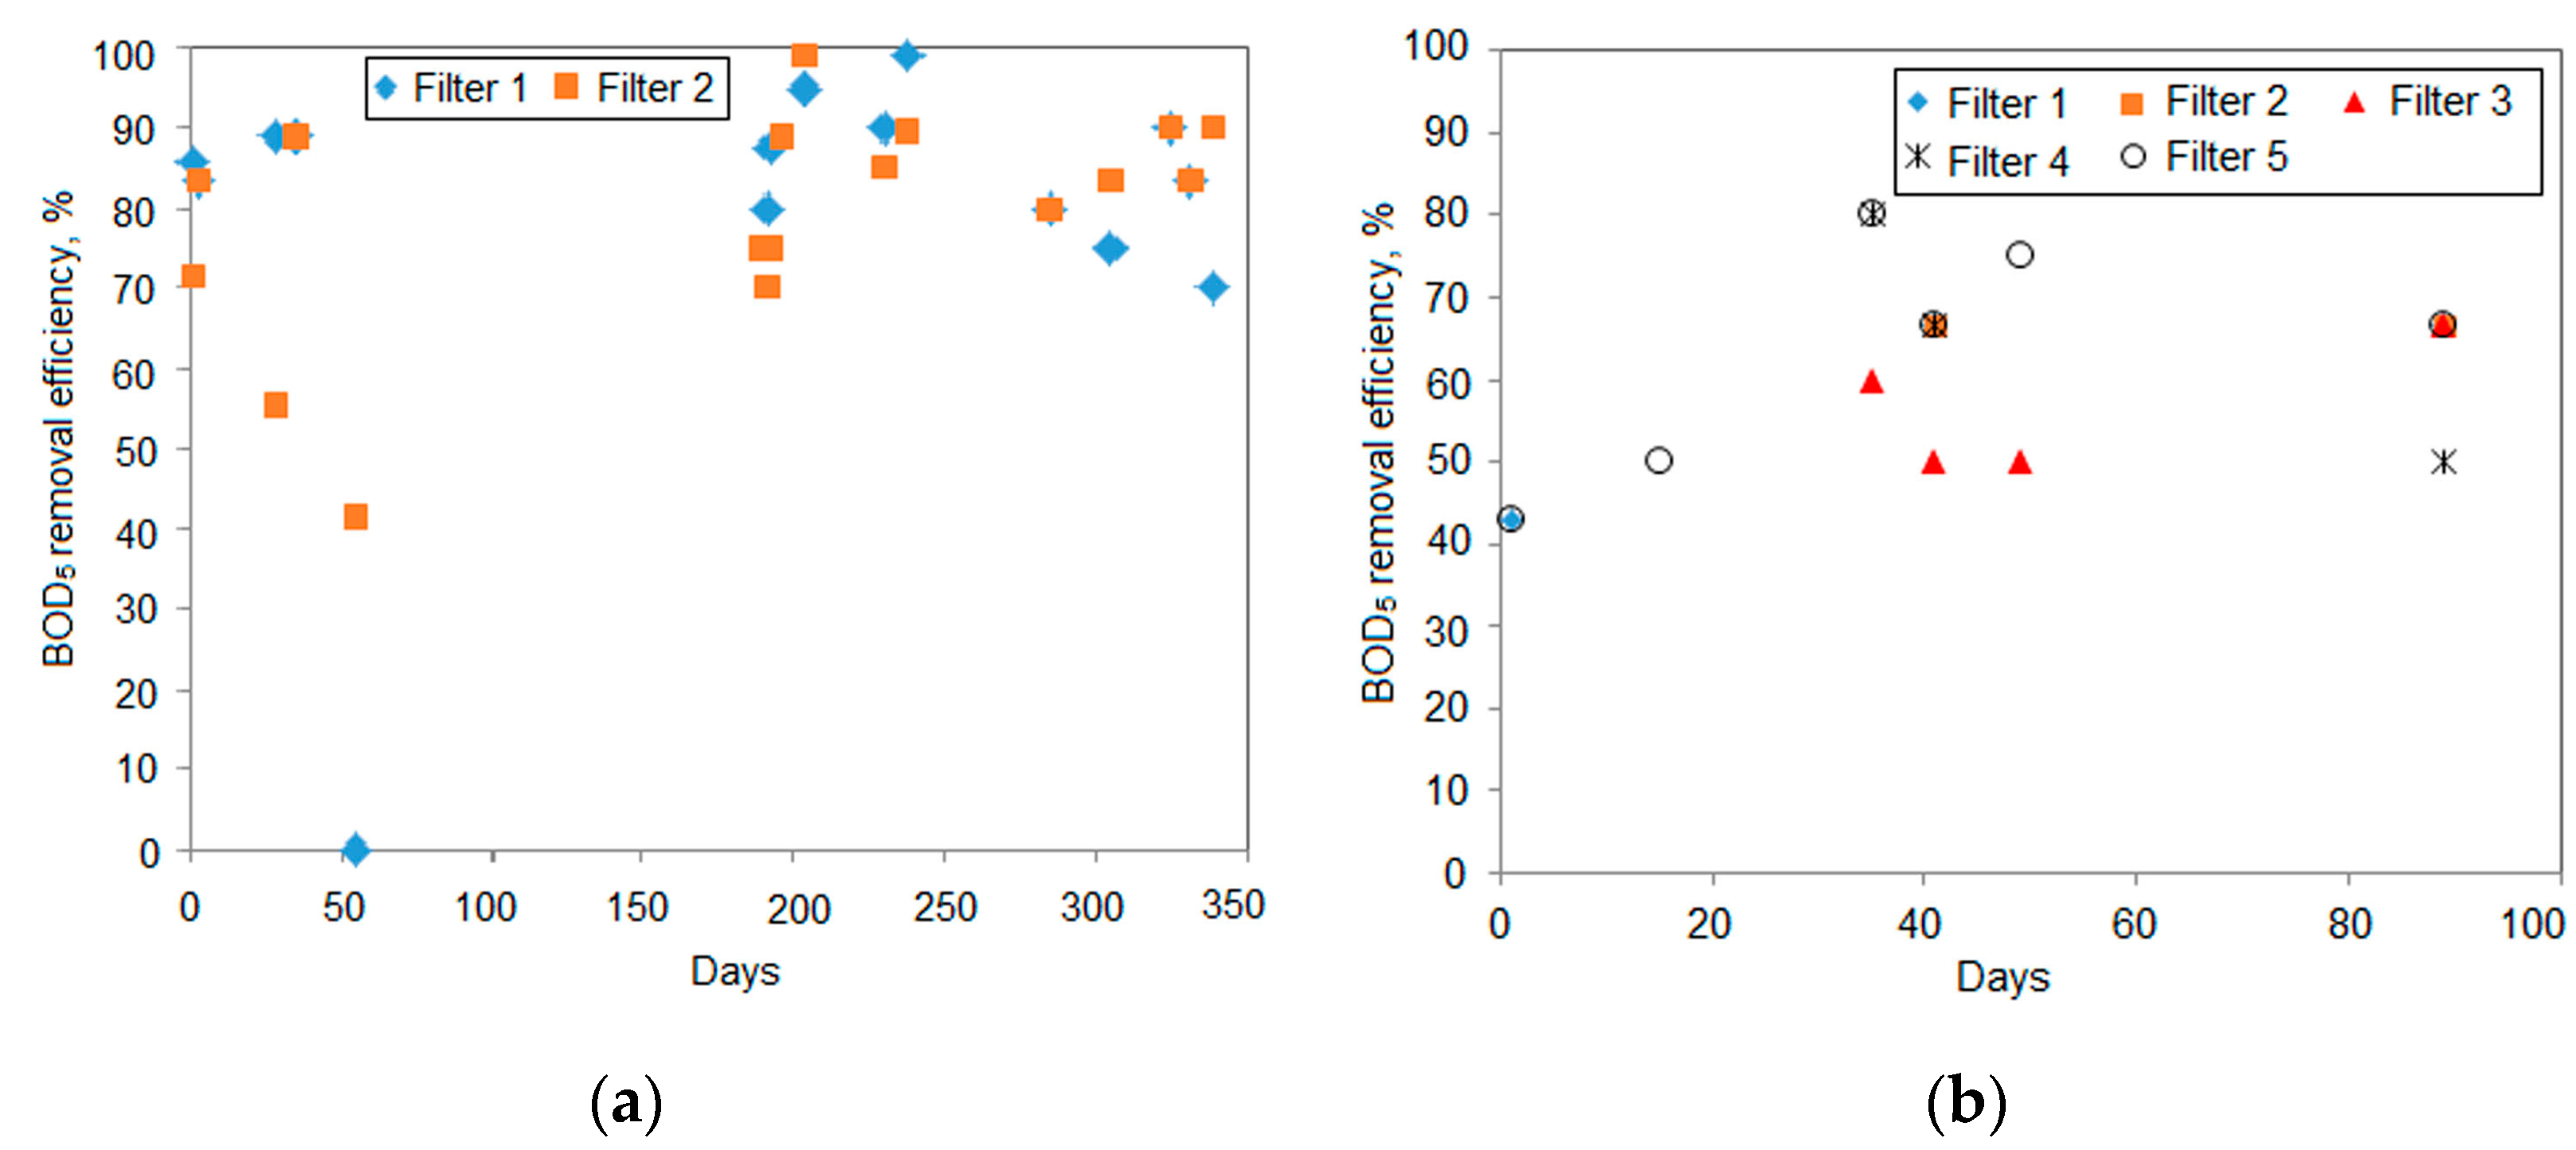
The results of BOD5 removal efficiencies of set I and set II were presented in Figure 5.
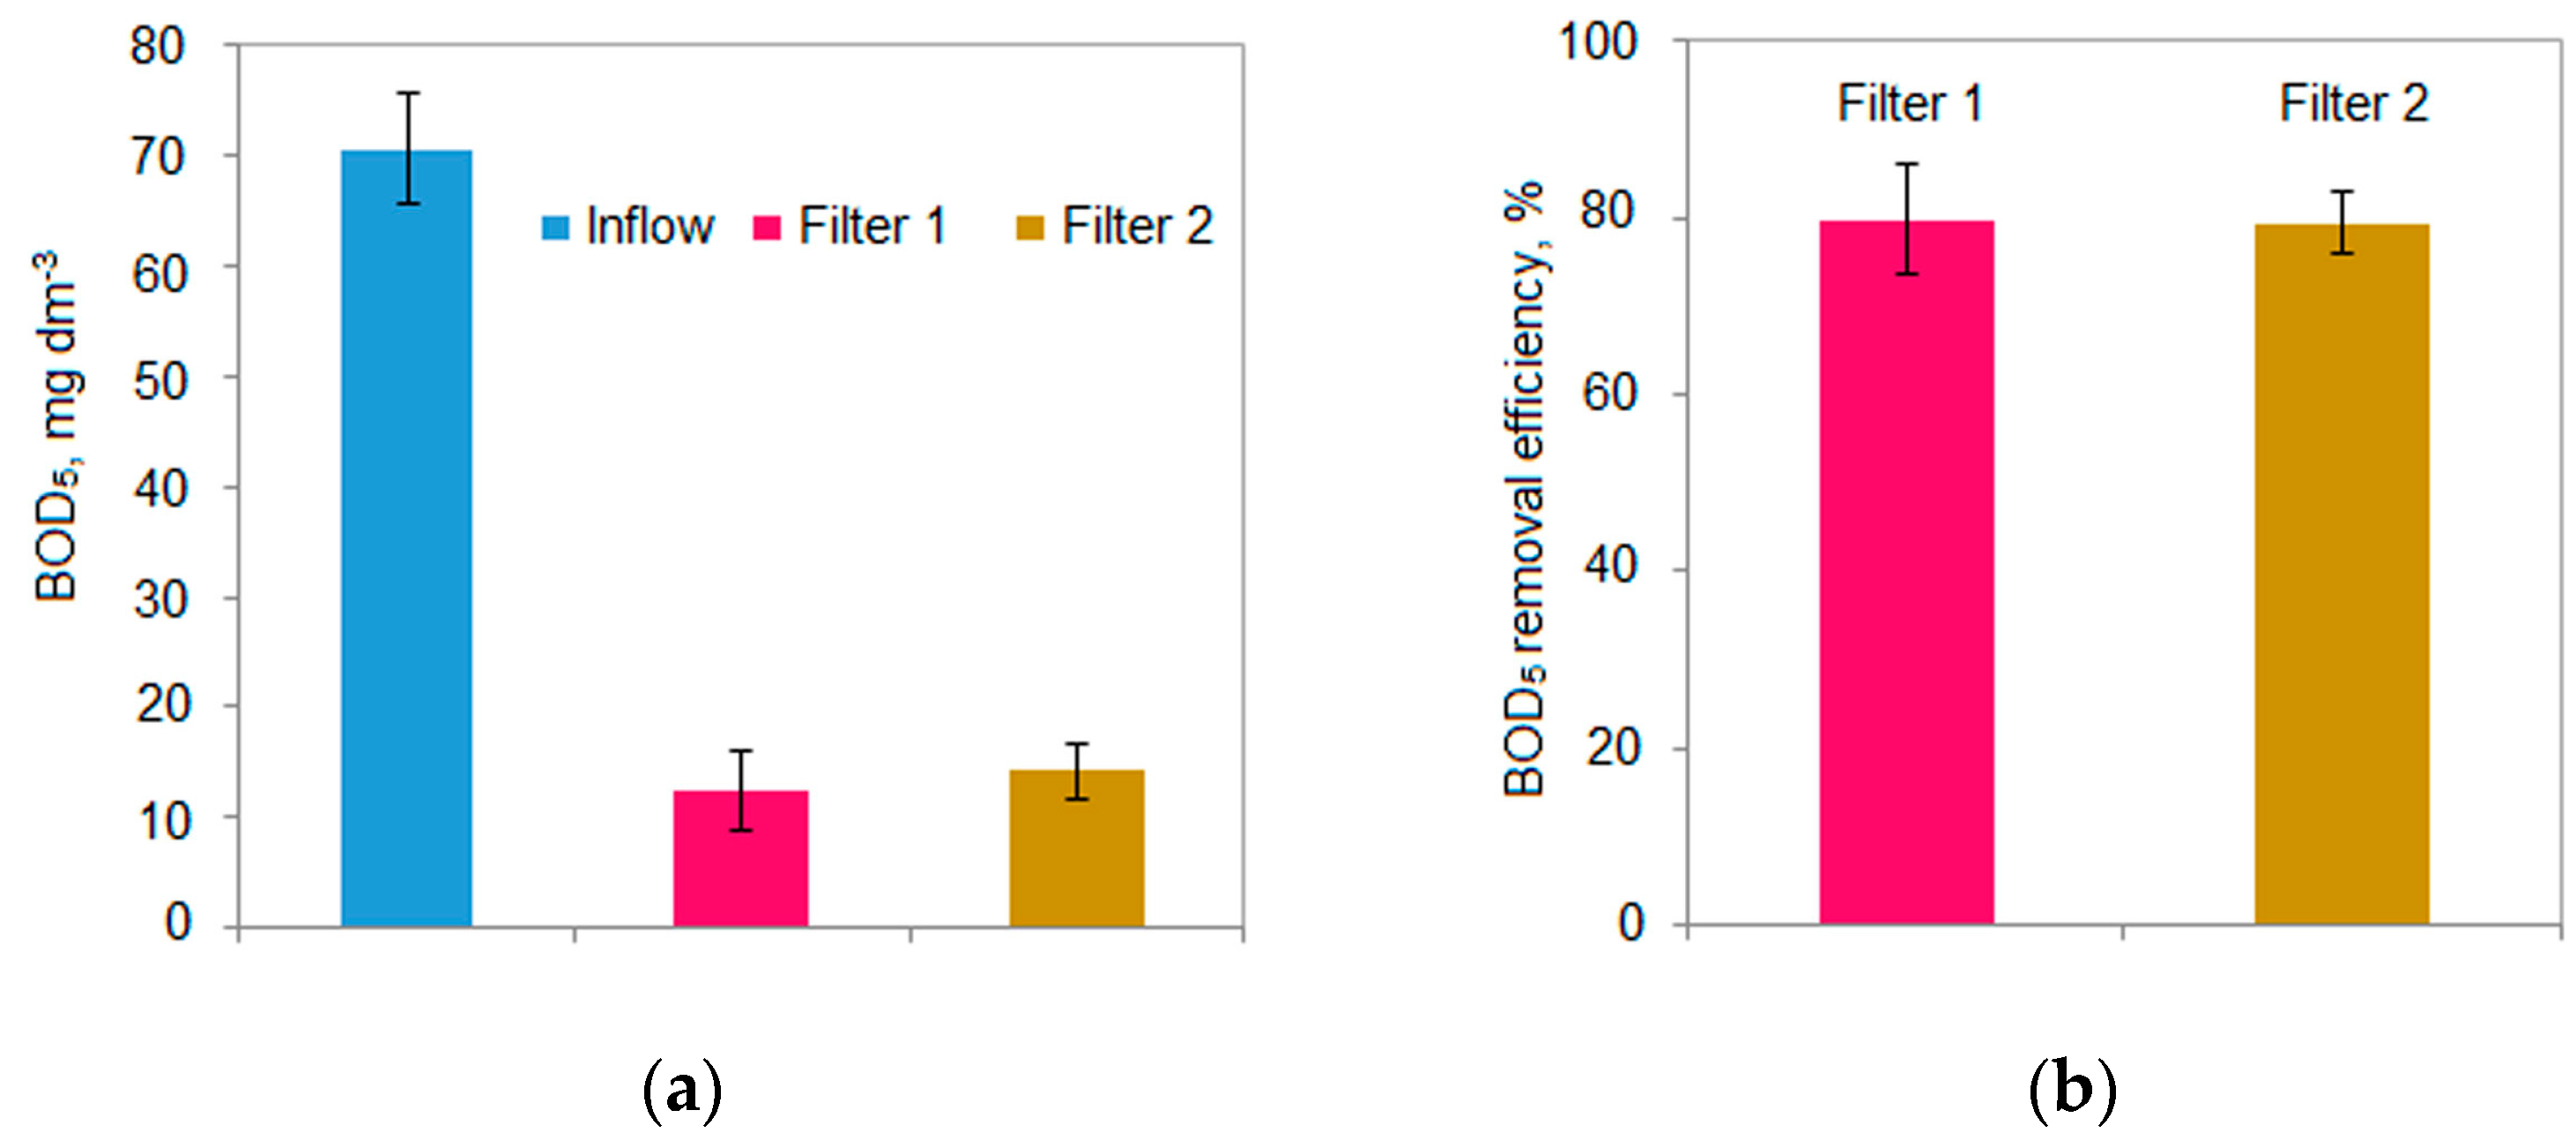
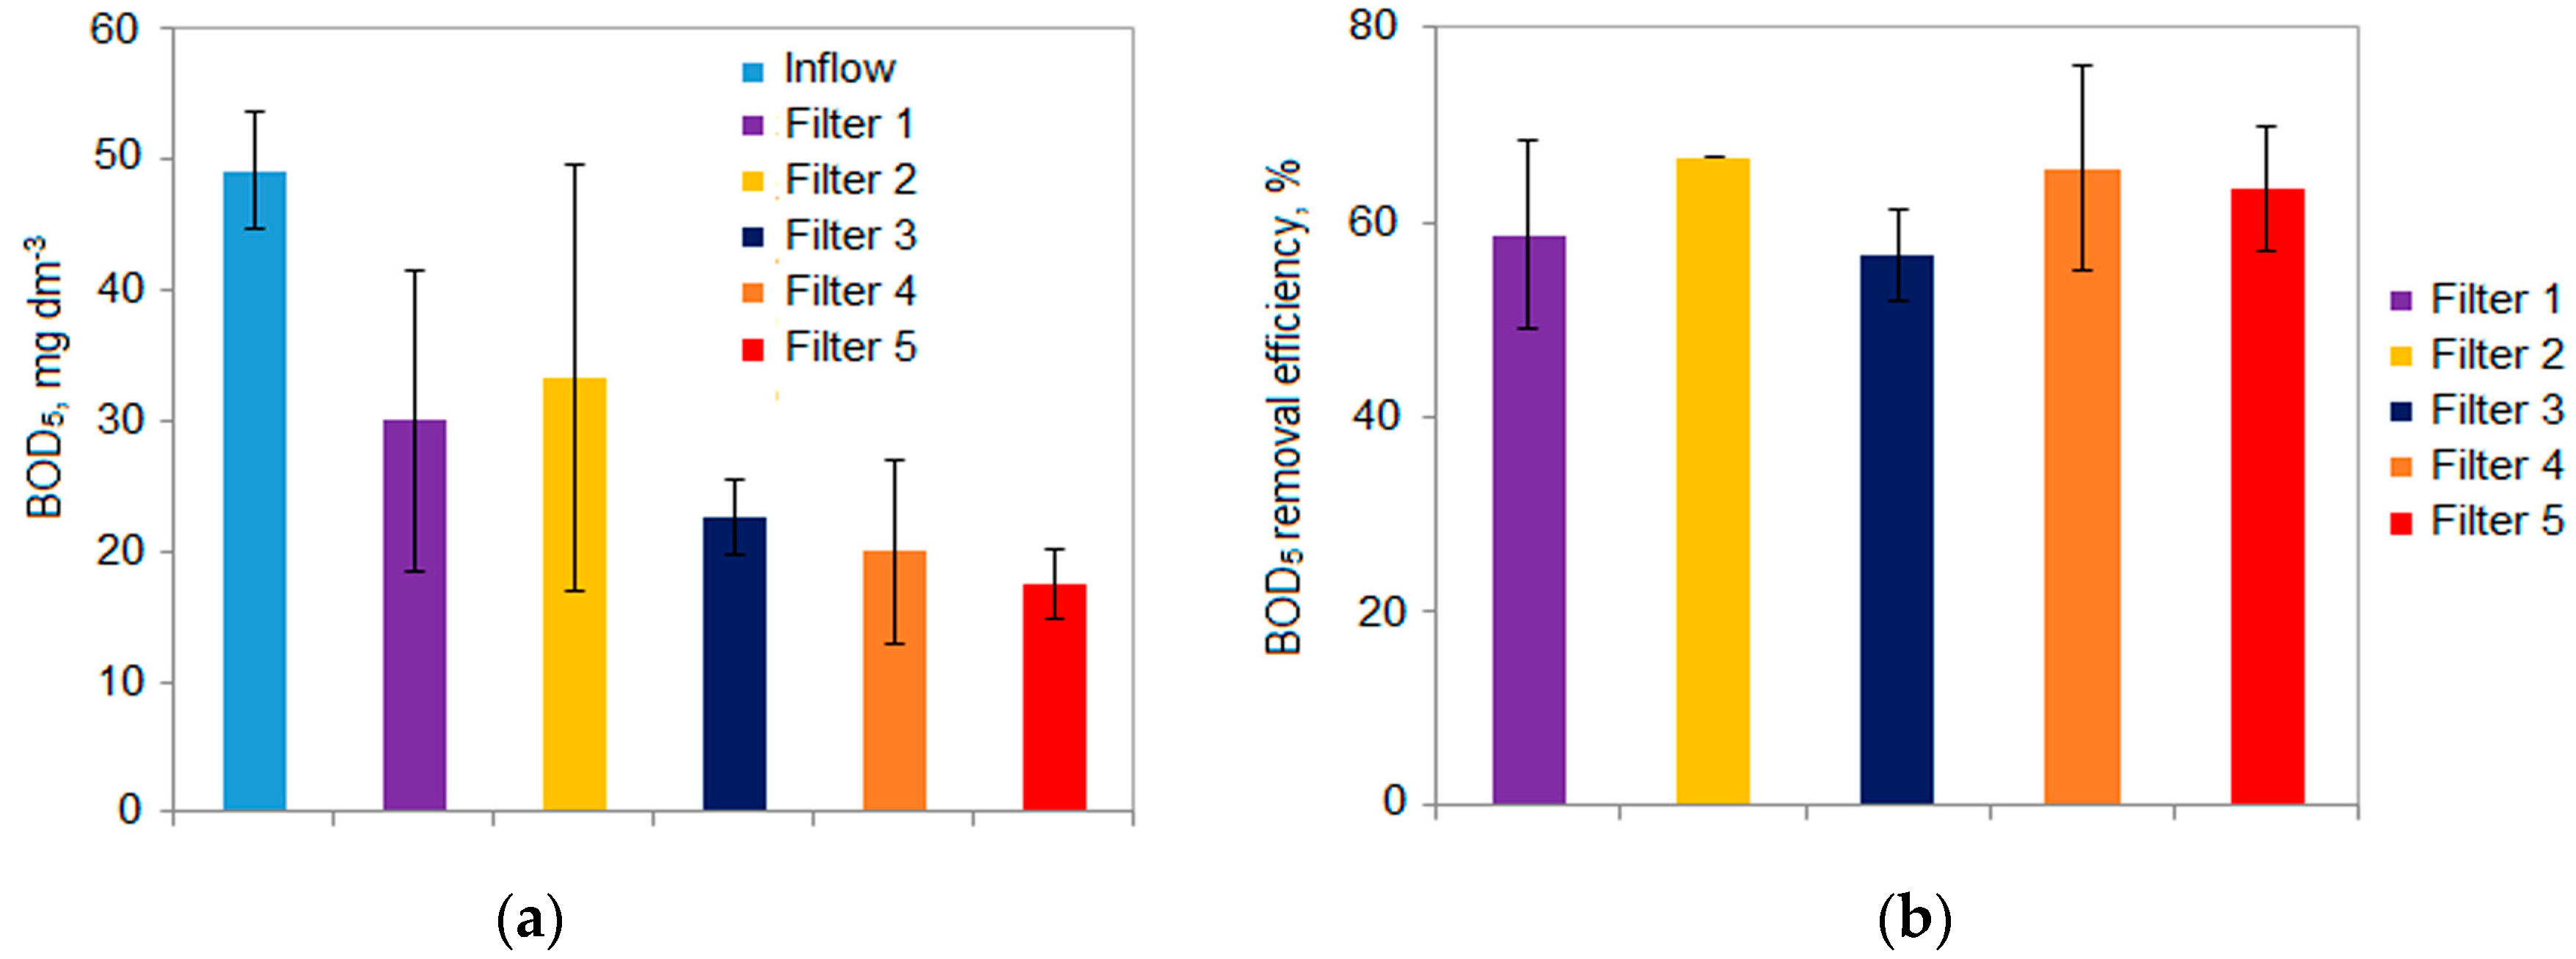
The inflow BOD5 values were: 70.6 ± 5.1 mg dm−3 (n = 17) and 49.2 ± 4.6 mg dm−3 (n = 6) for set I and set II, respectively (Figure 6 and Figure 7).
Efficiencies of removal of dissolved organic substances expressed as BOD5 were: 79.8 ± 6.2% (n = 15) in filter 1 and 79.4 ± 3.5% (n = 17) in filter 2 of set I (Figure 6). Efficiencies of BOD5 removal for filters in the set II were from 56.7 ± 4.7 (n = 4) to 66.7 ± 0.0% (n = 3) (Figure 7). The outflow BOD5 values were in the range between 5.0 mg O2 dm−3 and 60.0 mg O2 dm−3 in the case of set I and between 10.0 mg O2 dm−3 and 60.0 mg O2 dm−3 in the case of set II.
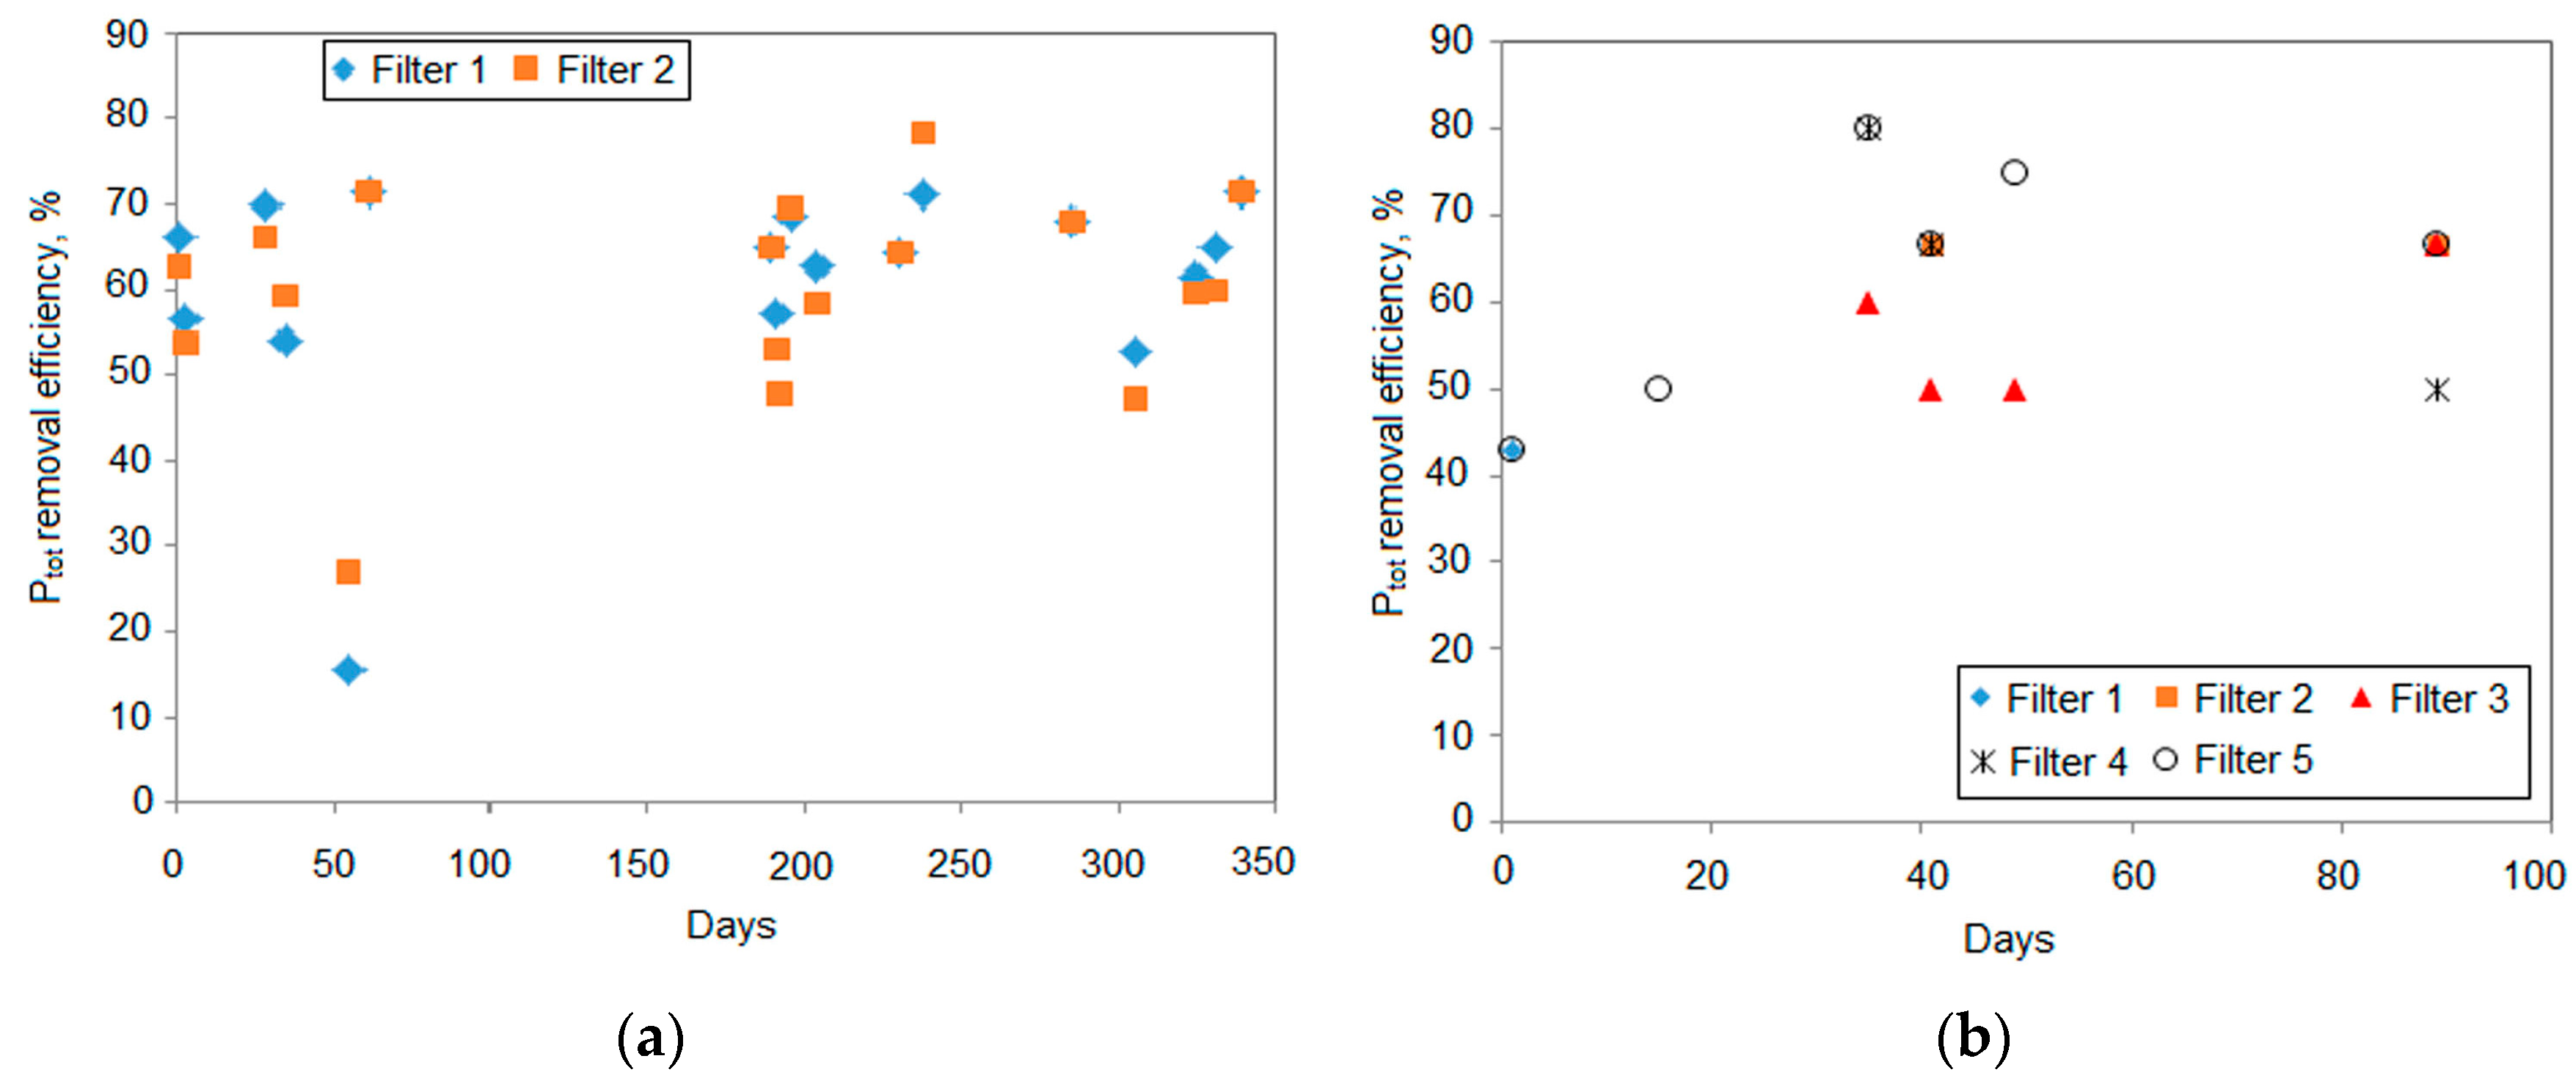
The Ptot removal efficiencies of set I and set II were shown in Figure 8.
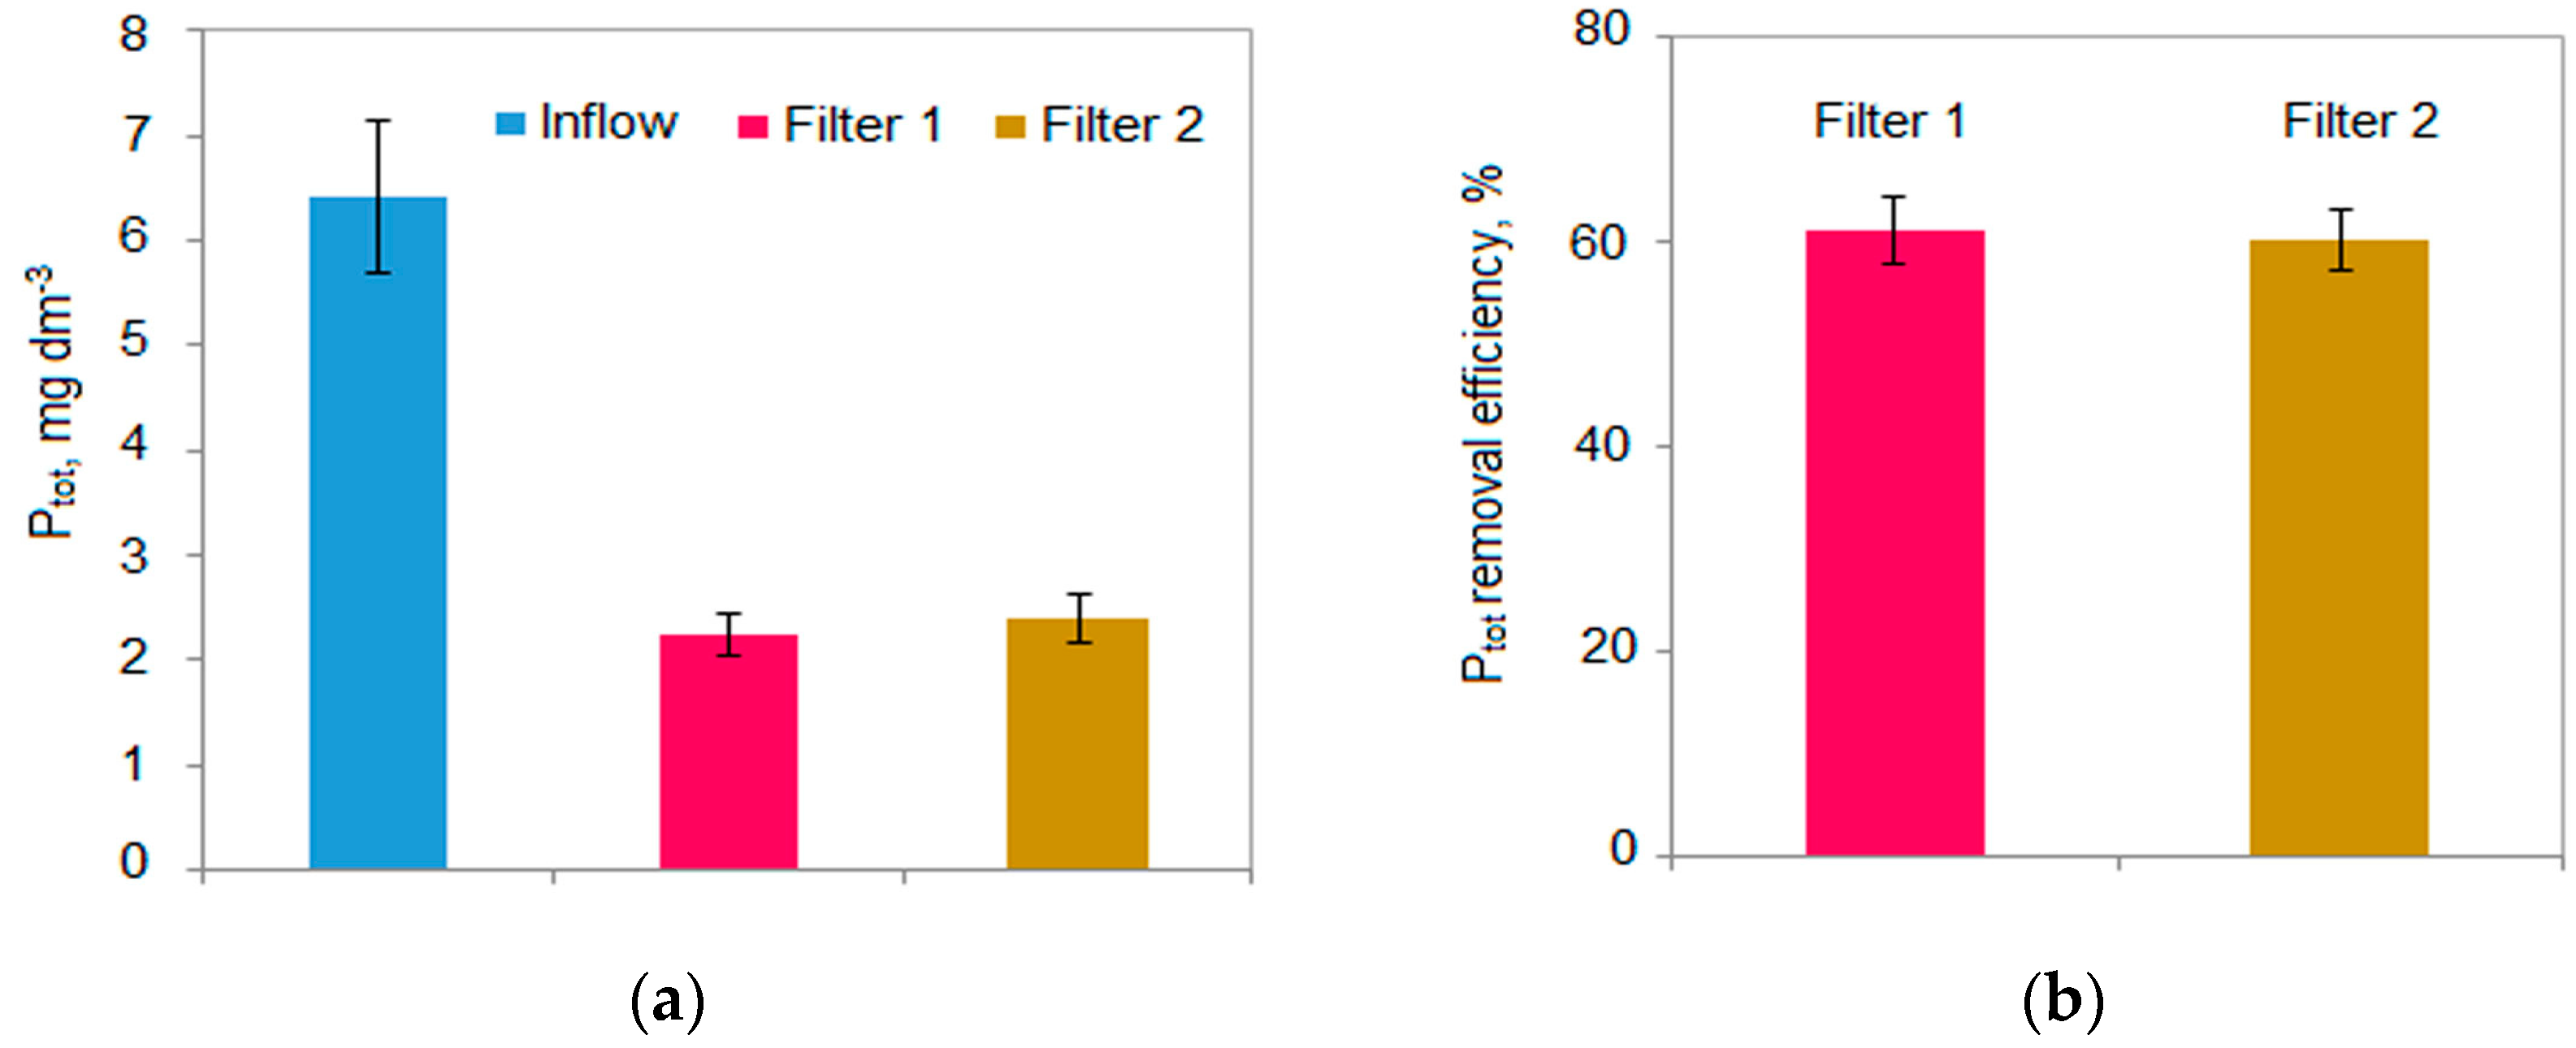
The inflow Ptot concentrations were: 6.4 ± 0.7 mg dm−3 (n = 18) and 4.2 ± 0.3 mg dm−3 (n = 7) for set I and set II, respectively (Figure 9 and Figure 10).
Efficiencies of total phosphorus removal (Ptot) were: 61.2 ± 3.3% (n = 17) in filter 1 and 60.2 ± 2.8% (n = 18) in filter 2 of set I (Figure 9). Effectiveness of total phosphorus removal was: 52.9 ± 7.0 (n = 5)–73.3 ± 1.6 ± 2.8% (n = 7) for filters in the set II (Figure 10). The outflow total phosphorus concentrations were in the range between 1.2 mg Ptot dm−3 and 3.9 mg Ptot dm−3 in the case of set I and between 0.8 mg Ptot dm−3 and 2.5 mg Ptot dm−3 in the case of set II.
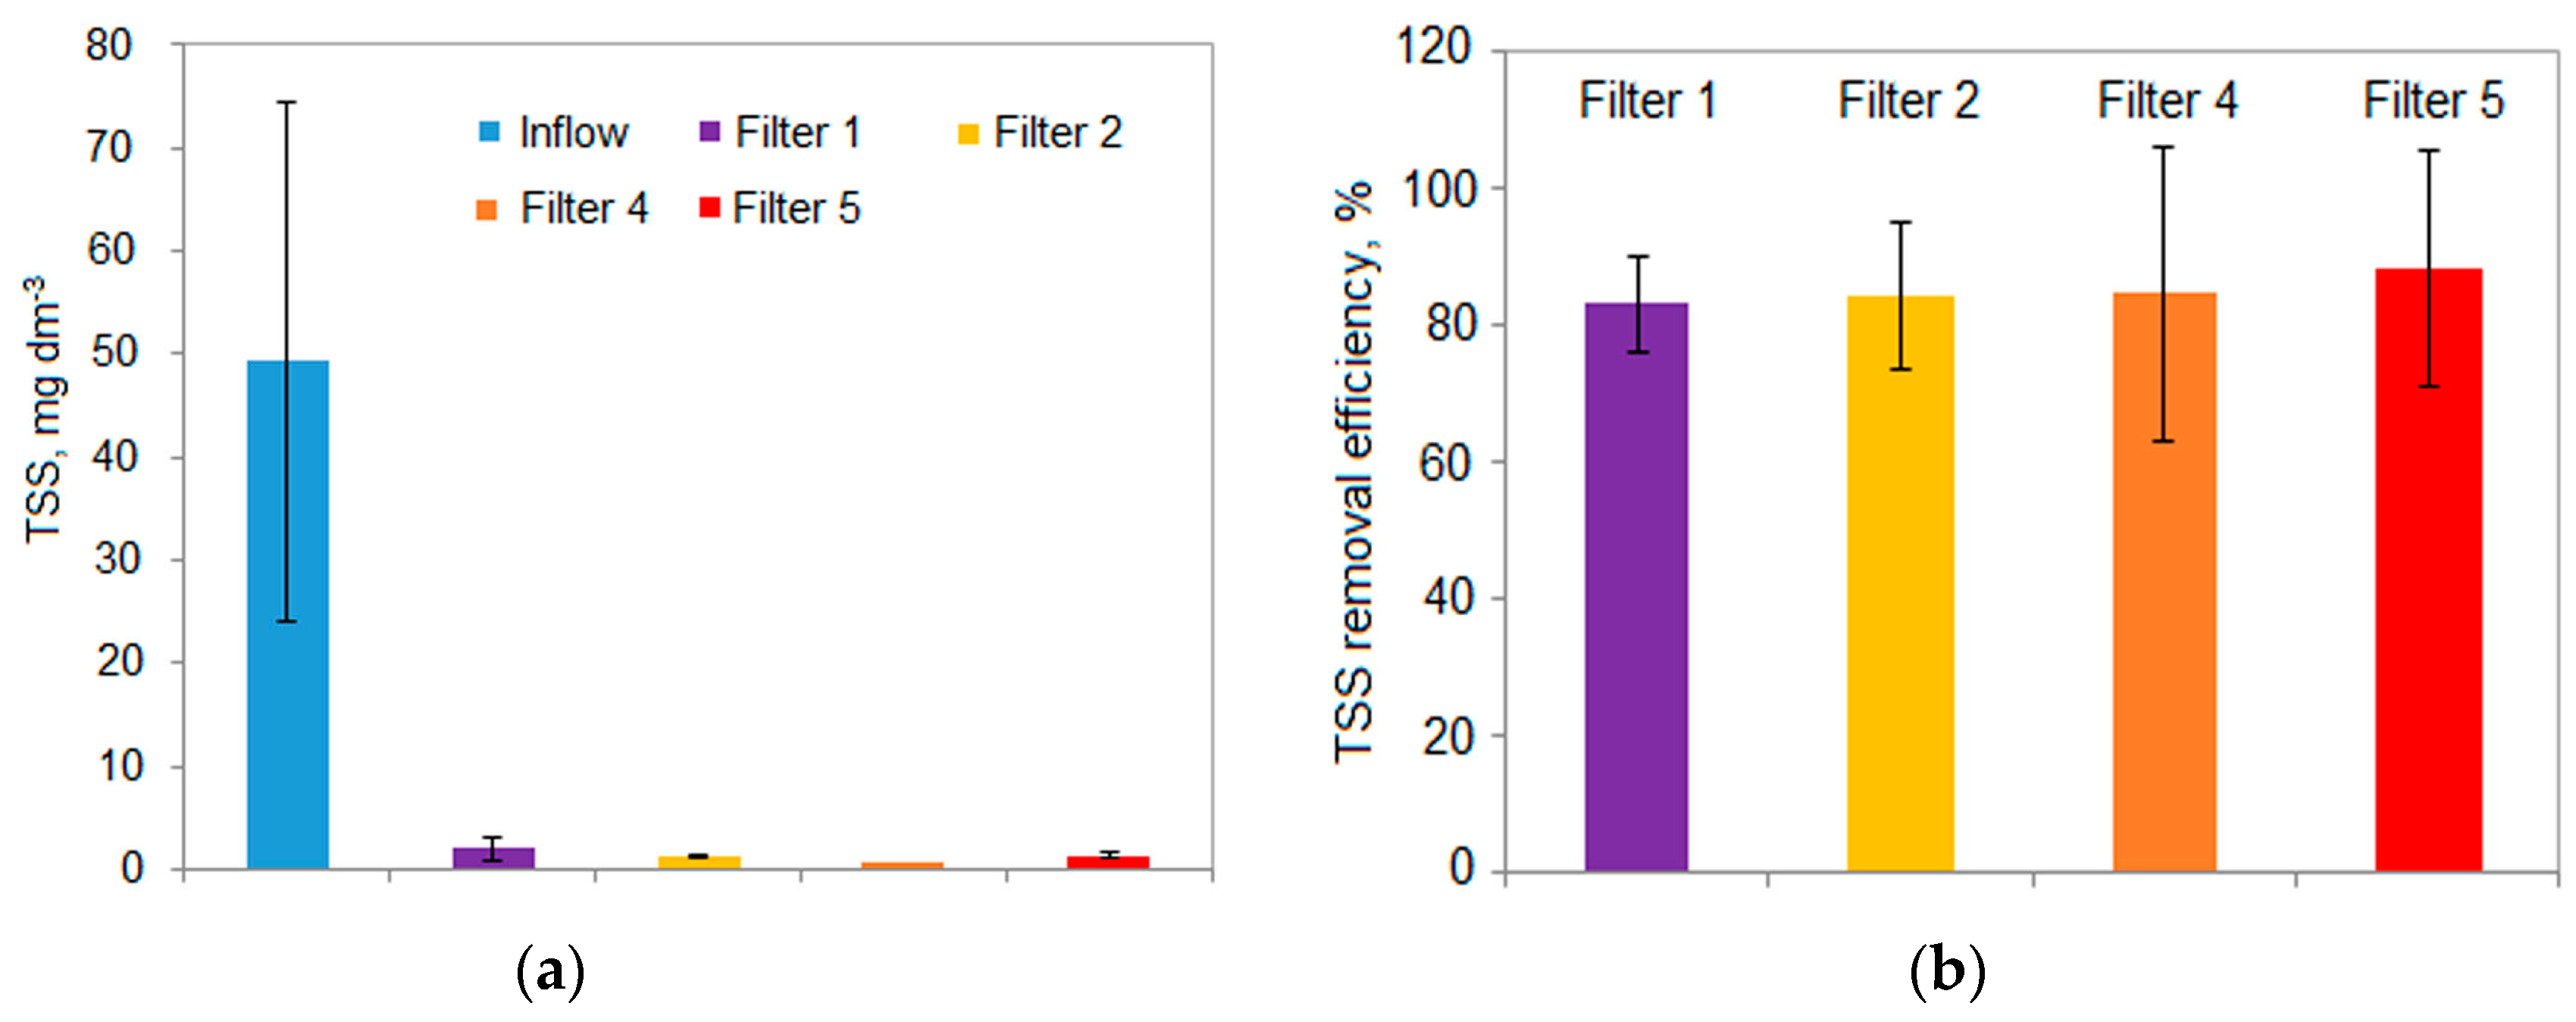
The removal efficiencies of TSS were shown in Figure 11.
The inflow TSS concentrations were: 45.8 ± 15.8 mg dm−3 (n = 6) and 49.4 ± 25.2 mg dm−3 (n = 4) for set I and set II, respectively (Figure 12 and Figure 13).
Total suspended solids removal efficiency was 67.0 ± 11,4% (n = 6) for filter 1 and 79.8 ± 6.1% (n = 6) for filter 2 of set I (Figure 12). Total suspended solids removal efficiency of set I was from 83.2 ± 7.1% (n = 4, filter 1) to 88.4 ± 7.5% (n = 4, filter 5) (Figure 13). The outflow of total suspended solids concentrations ranged from 0.5 mg dm−3 to 29.0 mg dm−3 in the case of set I and from 0.4 mg dm−3 to 25.9 mg dm−3 in the case of set II.
4. Discussion
The value obtained for set I start-up period was comparable to results of investigations carried out on filters treating STE (3–4 months for the removal of organic compounds) [36] while the start-up period for set II was much longer. The significantly longer start-up period of set II (comparing to start-up period of set I) was probably related to lower biodegradability of greywater (CODCr/BOD5 equal to 3.2) comparing to septic tank effluent biodegradability (CODCr/BOD5 equal to 2.8) and limited concentration of nutrients in the greywater.
The hydraulic capacity did not change significantly during the period over the last several weeks. The results related to this technology, mentioned in the previous papers [41] suggested the long-term hydraulic capacity stabilization at a value of about 1–2 cm d−1. This phenomenon can be explained by the excess biomass gravitational removal from the vertical situated filtering textile layer.
The greywater average retention times in both reactors were comparable. The current retention times were changeable for both sets of filters (reactors) due to the changeable greywater table level in the reactors, especially in the case of set II reactor (11–23 cm greywater table level).
It is worth noting that these filters, investigated previously (for septic tank effluent treatment), after a much shorter time of operation were equally effective according to the flow rate. This shows that for a long-term operation the flow rate does not decrease and is about 0.9–1.0 cm d−1. This is caused by the gravitational removal of excess sludge (biomass) from the vertically situated filtering textile layer.
The efficiencies of CODCr (59–72%) and BOD5 (57–80%) removal from greywater by nonwoven textile filters were comparable to the efficiency of nonwoven textile filters treating septic tank effluent [30,34]. Such values can be justified as satisfactory according to the lower bio-degradability of greywater compared to septic tank effluent. Until now there have been no limiting values in Poland for greywater treatment as a separate type of wastewater, therefore (until its establishment) the values required for domestic wastewater (mixed black and greywater) have to be taken into consideration. Most CODCr, BOD5 outflowing (treated) greywater concentrations meet the Regulation of the Minister of Environment of 18 November 2014. The presented technology and construction would be a useful means of limiting pollutant discharge into the environment or before the reuse of greywater. The relatively wide range of COD values in treated greywater was related to the very wide range of COD in inflowing greywater (e.g., 98–449 mg O2 dm−3 in case of set I). Maximum permissible values of pollution indicators for domestic wastewater or municipal water being introduced into waters or into the soil according to this regulation are: 40 mg O2 dm−3 for BOD5, 150 mg O2 dm−3 for COD, and 50 mg dm−3 for TSS.
Due to the changeability of treated greywater values (CODCr, BOD5) it is difficult to draw the conclusions related to filters and sets types (filter layer thickness).
The effectiveness of the removal of total phosphorus on non-woven filters (53–73%) was much lower than the efficiency of the removal of organic compounds. The removal of phosphorus compounds, mainly in the form of phosphates, proceeded with very variable efficiency.
The relatively high efficiency of mechanical treatment of greywater on nonwoven textile filters was obtained by reducing the effective pore size of the filtration layer due to high biomass concentration and accumulation of suspended solids. Aerobic decomposition of dissolved organic compounds at relatively high efficiency was possible due to the sufficient concentration of dissolved oxygen greywater flowing in the immediate vicinity of the biomass fixed on the nonwoven fabric and due to the low flow rate with a high efficiency of oxygen diffusion from the atmospheric air.
The reactors also played the role of settler; however, it is difficult to calculate the real retention time because the rate of mixing during dose application is unknown. On the other hand, the low hydraulic capacity of filters does not cause any local currents in the liquid phase of the reactor.
During the studies, it was observed that filters were covered by a filter cake of low cohesion, susceptible to dropping away due to the vertically oriented filtration layer. Thanks to this, these filters are less susceptible to clogging (they can operate without rinsing for at least one to two years) and the possible rinsing can be carried out in a simple way—by washing the filter surface with a water jet. In order to maintain a high removal efficiency of organic compounds and nitrification, periodic removal of sludge from the bottom of the reactor is recommended.
The basic pollution indicators removal efficiencies were satisfactory regarding simple construction and maintenance, low investment cost, and low operational costs (power and electric current consumption).
No statistically significant difference between four-layer filter and eight-layer filter of set I was stated (Table 1). Similar results were obtained for filters treating STE [30]. In that studies the difference was observed only according to BOD5 removal, but not according to TSS and CODCr removal efficiency.
The results of statistical analysis showed that the efficiency removal and outflow concentration of CODCr, Ptot, and BOD5 between filter 1 and filter 2 in set I and between filter 1 and filter 5 in set II did not constitute a statistically significant difference at the 95% confidence interval (Table 1). Moreover, the results of the statistical test of a different mean between filter 1 of set I and filter 1 of set II showed that only the concentration of Ptot in treated greywater showed a statistically significant difference (p = 0.04).
It was found that the filters worked, at least in the air-side layer, in aerobic conditions, which was indirectly confirmed by periodic removal of total and ammonium nitrogen. Obtaining aerobic conditions—even to a limited extent—enables the course of aerobic treatment processes and promotes a relatively high effectiveness of organic compound removal and also prevents the purified greywater from decomposing (rotting). It has been repeatedly confirmed in the research carried out that the nonwoven fabric and filter cake on the greywater side of filters, despite their considerable thickness, never showed any symptoms of anaerobic conditions—the observed color of the filter cake on the filter surface was always grey or brown-grey (not black), while the biomass smell was earthy (not decomposing). The aerobic conditions can be explained by the direction of filtration opposite to the direction of diffusion of atmospheric oxygen to greywater and living biomass, and allowing the relatively intensive contact of greywater with air at the air side, where the filtration layer is only moistened with greywater or covered with a thin layer of greywater flowing down the vertical filter surface. Similar results and observations were noted during studies on the filters treating STE. The availability of oxygen through the air-side surface of the filtration layer was favored by low outflow rates.
The basic processes occurring during greywater treatment on non-woven filters were: the removal of organic contaminants, determined as BOD5, CODCr, and total phosphorus. However, the removal of the latter ones proved to be unstable.
The beneficial effect accompanying the decrease in filter outflow rate was the increased and more stable removal efficiency [34]. Decrease of the flow rate of filters with a lowering of the greywater surface level is unfavorable from the point of view of their hydraulic efficiency (capacity), but it is of some advantage in terms of operation. At a reduced inflow rate or lack of greywater inflow (several days), greywater of about 10–15 cm depth remains in the reactor and “sustains” the conditions of biomass existence in the low located zone of the filters and causes capillary infiltration at the height of several centimeters.
Regardless of how the filters are fed, their filtration velocity after several months of operation can be estimated as 1–1.4 cm d−1, which with an average greywater volume of 25–40 dm3 from one person during 24 h means a demand of 1.8–4.0 m2 of filter surface area per person, and from 7.1 to 16 m2 for a four-person family. For four persons, between 9 and 20 filters are needed (with plan view dimensions: 1.0 × 0.01 m, height 0.4 m, and filter surface area of a single filter of 0.8 m2).
The filters have a large ratio of filter material surface to volume of treated greywater, thus diffusing oxygen from atmospheric air to greywater—where it runs in a sufficiently intensive manner so that forced (artificial) aeration is not necessary for the greywater. The filters can therefore work practically with very low energy consumption (related to greywater pumping only)—less than 0.5 kWh m−3 (several times per day for a period of several seconds using pump of power 400 watt).
Mechanical-biological treatment technology on non-woven filters allows also to capture the suspended solids outflowing from household and prevent a soil absorption system from clogging.
5. Conclusions
The following conclusions can be drawn based on the results of this study:
- The relatively high efficiency of biological treatment of dissolved organic substances (CODCr: 58.8–71.6%; BOD5: 56.7–79.8%) in greywater on both nonwoven textile filter sets was obtained thanks to the relatively low flow rate (filtration velocity), effective diffusion of atmospheric air into the greywater,
- The relatively high efficiency of mechanical treatment of greywater on both nonwoven textile filter sets (67.0–88.4%) was obtained by reducing the effective pore size of the filtration layer due to high biomass concentration and accumulation of suspended solids,
- No statistically significant difference (95% difference interval) between set I (fed during start-up period with septic tank effluent) and set II (fed during start-up period with greywater) was stated,
- No statistically significant difference (95% difference interval) between four-layer material filter and eight-layer material filter of set I was stated,
- The filters worked, at least in the air-side layer, in aerobic conditions, which was indirectly confirmed by the fact that the observed color of the filter cake on the filter surface was always grey or brown-grey, while the biomass smell was earthy,
- The filters can work practically with very low energy consumption—less than 0.5 kWh m−3.
The investigated filters seem to be very useful and attractive technology for greywater reuse e.g., with the objective of its usage for irrigation or toilets flushing thanks to relatively high treatment efficiency, greywater aeration (air-side surface of filter layer has a contact with atmospheric air at very thin film of treated greywater, what is flowing down on this surface), simple construction, easy maintenance, and very low energy consumption.
Author Contributions
Conceptualization, M.S.; methodology, M.S.; investigation, M.S.; data curation, M.S. and T.H.N; statistical analyses, T.H.N.; formal analysis, M.S. and T.H.N.; manuscript writing, M.S. and T.H.N.
Funding
This research received funding: Project No. 005/RID/2018/19 under “Wielkopolska Regional Initiative of Excellence in the area of life sciences of the Poznań University of Life Sciences”. The project financed under the program of the Minister of Science and Education in 2019–2022.
Acknowledgments
The authors acknowledge Mrs Jolanta Zawadzka from the Department of Hydraulic and Sanitary Engineering for her help in laboratory measurements and Amica S. A. company—for lending the washing machine.
Conflicts of Interest
The authors declare no conflict of interest.
References
- WWF. Water Scarcity. Available online: https://www.worldwildlife.org/threats/water-scarcity (accessed on 2 June 2019).
- Al-Jayyousi, O.R. Greywater Reuse: Towards Sustainable Water Management. Desalination 2003, 156, 181–192. [Google Scholar] [CrossRef]
- Friedler, E.; Hadari, M. Economic Feasibility of On-Site Greywater Reuse in Multi-Storey Buildings. Desalination 2006, 190, 221–234. [Google Scholar] [CrossRef]
- Gross, A.; Maimon, A.; Alfiya, Y.; Friedler, E. Greywater Reuse, 1st ed.; Taylor & Francis Group: Boca Raton, FL, USA, 2015. [Google Scholar]
- Adi, M.; Friedler, E.; Gross, A. Parameters Affecting Greywater Quality and Its Safety for Reuse. Sci. Total Environ. 2014, 487, 20–25. [Google Scholar]
- Li, F.; Wichmann, K.; Otterpohl, R. Review of the technological approaches for grey water treatment and reuses. Sci. Total Environ. 2009, 407, 3439–3449. [Google Scholar] [CrossRef] [PubMed]
- Kujawa-Roeleveld, K.; Grietje, Z. Anaerobic Treatment in Decentralised and Source-Separation-Based Sanitation Concepts. Rev. Environ. Sci. Biotechnol. 2006, 5, 115–139. [Google Scholar] [CrossRef]
- Eriksson, E.; Auffarth, K.; Henze, M.; Ledin, A. Characteristics of Grey Wastewater. Urban Water J. 2002, 4, 85–104. [Google Scholar] [CrossRef]
- Jefferson, B.; Palmer, A.; Jeffrey, P.; Stuetz, R.; Judd, S. Grey Water Characterisation and Its Impact on the Selection and Operation of Technologies for Urban Reuse. Water Sci. Technol. 2004, 50, 157–164. [Google Scholar] [CrossRef]
- Domenech, L.; Saurı, D. Socio-technical transitions in water scarcity contexts: Public acceptance of greywater reuse technologies in the metropolitan area of Barcelona. Resour. Conserv. Recycl. 2010, 55, 53–62. [Google Scholar] [CrossRef]
- Matos, C.; Sampaio, A.; Bentes, I. Greywater Use in Irrigation: Characteristics, Advantages and Concerns. In Irrigation—Water Management, Pollution and Alternative Strategies; Garcia-Garizabal, I., Abrahao, R., Eds.; IntechOpen Limited: London, UK, 2012; pp. 159–184. [Google Scholar]
- Sydney Water. Water Conservation Report: 2016–2017. Available online: http://www.sydneywater.com.au/web/groups/publicwebcontent/documents/document/zgrf/mdq3/~edisp/dd_047419.pdf (acccessed on 27 May 2019).
- Lacasse, R.; Belanger, G.; Henry, Y.; Talbot, P.; Młynarek, J.; Vermersch, O. A denitrification process based on a new filtering media for onsite wastewater treatment. In Proceedings of the Ninth National Symposium on Individual and Small Community Sewage Systems, Fort Worth, TX, USA, 11–14 March 2001; pp. 235–244. [Google Scholar]
- Wren, A.L.; Siegriest, R.L.; Lowe, K.S.; Laws, R. Field performance of textile filter units employed in onsite wastewater treatment systems. In Proceedings of the On-Site Wastewater Treatment X, Sacramento, CA, USA, 21–24 March 2004; pp. 514–525. [Google Scholar]
- Ren, X.; Shon, H.K.; Jang, N.; Lee, Y.G.; Bae, M.; Lee, J.; Cho, K.; Kim, I.S. Novel membrane bioreactor (MBR) coupled with a nonwoven fabric filter for household wastewater treatment. Water Res. 2010, 44, 751–760. [Google Scholar] [CrossRef] [Green Version]
- UNEP. Proceedings of the Workshop on Adopting, Applying and Operating Environmentally Sound Technologies for Domestic and Industrial Wastewater Treatment for the Wider Caribbean Region; CEP Technical Report No. 43; UNEP Caribbean Environment Programme: Kingston, UK, 1998. [Google Scholar]
- Korkut, E.N. Geotextiles as Biofilm Attachment Baffles for Wastewater Treatment. Ph.D. Thesis, Drexel University, Philadelphia, PA, USA, 2003. [Google Scholar]
- Korkut, E.N.; Martin, J.P.; Asce, M.; Yaman, C. Wastewater Treatment with Biomass Attached to Porous Geotextile Baffles. J. Environ. Eng. 2006, 132, 284–288. [Google Scholar] [CrossRef]
- Yaman, C. Geotextiles as Biofilm Filters in Wastewater Treatment. Ph.D. Thesis, Drexel University, Philadelphia, PA, USA, 2003. [Google Scholar]
- An, Y.; Wang, Z.; Wu, Z.; Yang, D.; Zhou, Q. Characterization of membrane foulants in an anaerobic non-woven fabric membrane bioreactor for municipal wastewater treatment. Chem. Eng. J. 2009, 155, 709–715. [Google Scholar] [CrossRef]
- Yaman, C.; Martin, J.P.; Asce, M.; Korkut, E. Use of layered geotextiles to provide a substrate for biomass development in treatment of septic tank effluent prior to ground infiltration. J. Environ. Eng. 2005, 131, 1667–1673. [Google Scholar] [CrossRef]
- Yaman, C.; Martin, J.P.; Korkut, E. Effects of wastewater filtration on geotextile Permeability. Geosynth. Int. 2006, 13, 87–97. [Google Scholar] [CrossRef]
- Ingerle, E.K.; Stegner, U. Das Filtersacksystem. Oesterr. Wasserwirtsch 1986, 38, 27–30. [Google Scholar]
- Ho, J.H.; Khanal, S.K.; Sung, S. Anaerobic membrane bioreactor for treatment of synthetic municipal wastewater at ambient temperature. Water Sci. Technol. 2007, 55, 79–86. [Google Scholar] [CrossRef] [PubMed]
- Seo, G.T.; Moon, B.H.; Lee, T.S.; Lim, T.J.; Kim, I.S. Non-woven fabric filter separation activated sludge reactor for domestic wastewater reclamation. Water Sci. Technol. 2002, 47, 133–138. [Google Scholar] [CrossRef]
- Alimahmoodi, M.; Yerushalmi, L.; Mulligan, C.N. Development of biofilm on geotextile in a new multi-zone wastewater treatment system for simultaneous removal of COD, nitrogen and phosphorus. Biores. Technol. 2012, 107, 78–86. [Google Scholar] [CrossRef] [PubMed]
- White, D.M.; Pilon, T.A.; Woolard, C. Biological treatment of cyanide containing wastewater. Water Res. 2000, 34, 2105–2109. [Google Scholar] [CrossRef]
- Pellicer-Nàcher, C.; Smets, B.F. Structure, composition, and strength of nitrifying membrane-aerated biofilms. Water Res. 2014, 57, 151–161. [Google Scholar] [CrossRef]
- Hibiya, K.; Nagai, J.; Tsuneda, S.; Hirata, A. Simple prediction of oxygen penetration depth in biofilms for wastewater treatment. Biochem. Eng. J. 2004, 19, 61–68. [Google Scholar] [CrossRef]
- Spychała, M. Efficiency of textile filters for wastewater treatment in conditions of stable wastewater table. Acta Sci. Pol. Form. Circumiectus 2016, 15, 19–34. (In Polish) [Google Scholar] [CrossRef]
- Ordinance Minister of the Environment. Conditions to be Met When Introducing Wastewater into Waters or into the Ground and on Substances Particularly Harmful to the Aquatic Environment. (In Polish). Poz. 1800 Dz. U. Warsaw, 16 December 2014. [Google Scholar]
- International Organization for Standardization. EN 129 ISO 12956. Geotextiles and Geotextile-Related Products—Determination of the Characteristic Opening Size; Technical Committee ISO/TC 221 Geosynthetics; International Organization for Standardization: London, UK, 2010. [Google Scholar]
- Polish Committee for Standardization. PN-ISO 6060. Water Quality—Determination of Chemical Oxygen Demand; Polish Committee for Standardization: Warszawa, Poland, 2006. [Google Scholar]
- Polish Committee for Standardization. PN-EN ISO 6878. Water Quality—Determination of Phosphorus. Spectrophotometric Method with Ammonium Molybdate; Polish Committee for Standardization: Warszawa, Poland, 2006. [Google Scholar]
- Polish Committee for Standardization. PN-EN 872. Water Quality—Determination of Suspensions—The Method Using Filter Filtration; Polish Committee for Standardization: Warszawa, Poland, 2007. [Google Scholar]
- Ghaitidak, D.M.; Kunwar, D.Y. Characteristics and treatment of greywater: A review. Environ. Sci. Pollut. Res. 2013, 20, 2795–2809. [Google Scholar] [CrossRef] [PubMed]
- Ochoa, S.I.C.; Ushijima, K.; Hijikata, N.; Funamizu, N. Treatment of domestic greywater by geotextile filter and intermittent sand filtration bioreactor. J. Water Reuse Desal. 2014, 5, 39–49. [Google Scholar] [CrossRef] [Green Version]
- Oron, G.; Adel, M.; Agmon, V.; Friedler, E.; Halperin, R.; Leshem, E.; Weinberg, D. Greywater use in Israel and worldwide: Standards and prospects. Water Res. 2014, 58, 92–101. [Google Scholar] [CrossRef] [PubMed]
- Zipf, M.S.; Pinheiro, I.G.; Conegero, M.G. Simplified greywater treatment systems: Slow filters of sand and slate waste followed by granular activated carbon. J. Environ. Manag. 2016, 176, 119–127. [Google Scholar] [CrossRef] [PubMed]
- Couto, E.A.; Aclijuri, M.L.; Assemany, P.P.; Santiego, A.F.; Carvalho, I.C. Greywater production in airports: Qualitative and quantitative assessment. Resour. Conserv. Recycl. 2013, 77, 44–51. [Google Scholar] [CrossRef] [Green Version]
- Spychała, M.; Łucyk, P. Effect of thickness of textile filter on organic compounds and nutrients removal efficiency at changeable wastewater surface level. Nauka Przyroda Technol. 2015, 9, 1–21. [Google Scholar] [CrossRef]
Figure 1.
(a) Set I, (b) set II, and (c) scheme of nonwoven textile filter set (differences in dimensions between set I and set II and construction details are described in the main text of the article).
Figure 1.
(a) Set I, (b) set II, and (c) scheme of nonwoven textile filter set (differences in dimensions between set I and set II and construction details are described in the main text of the article).

Figure 2.
Chemical oxygen demand (CODCr) removal efficiency in set I (a) and set II (b) during the experiment.
Figure 2.
Chemical oxygen demand (CODCr) removal efficiency in set I (a) and set II (b) during the experiment.

Figure 3.
Chemical oxygen demand (CODCr) inflow and outflow concentrations (a) and removal efficiencies (b) for set I.
Figure 3.
Chemical oxygen demand (CODCr) inflow and outflow concentrations (a) and removal efficiencies (b) for set I.

Figure 4.
Chemical oxygen demand (CODCr) inflow and outflow concentrations (a) and removal efficiencies (b) for set II.
Figure 4.
Chemical oxygen demand (CODCr) inflow and outflow concentrations (a) and removal efficiencies (b) for set II.

Figure 5.
Biochemical oxygen demand (BOD5) removal efficiency in set I (a) and set II (b) during the experiment.
Figure 5.
Biochemical oxygen demand (BOD5) removal efficiency in set I (a) and set II (b) during the experiment.

Figure 6.
Biochemical oxygen demand (BOD5) inflow and outflow concentrations (a) and removal efficiencies (b) for set I.
Figure 6.
Biochemical oxygen demand (BOD5) inflow and outflow concentrations (a) and removal efficiencies (b) for set I.

Figure 7.
Biochemical oxygen demand (BOD5) inflow and outflow concentrations (a) and removal efficiencies (b) for set II.
Figure 7.
Biochemical oxygen demand (BOD5) inflow and outflow concentrations (a) and removal efficiencies (b) for set II.

Figure 8.
Total phosphorus (Ptot) removal efficiency in set I (a) and set II (b) during the experiment.
Figure 8.
Total phosphorus (Ptot) removal efficiency in set I (a) and set II (b) during the experiment.

Figure 9.
Total phosphorus (Ptot) inflow and outflow concentrations (a) and removal efficiencies (b) for set I.
Figure 9.
Total phosphorus (Ptot) inflow and outflow concentrations (a) and removal efficiencies (b) for set I.

Figure 10.
Total phosphorus (Ptot) inflow and outflow concentrations (a) and removal efficiencies (b) for set II.
Figure 10.
Total phosphorus (Ptot) inflow and outflow concentrations (a) and removal efficiencies (b) for set II.

Figure 11.
Total suspended solids (TSS) removal efficiency in set I (a) and set II (b) during the experiment.
Figure 11.
Total suspended solids (TSS) removal efficiency in set I (a) and set II (b) during the experiment.

Figure 12.
Total suspended solids (TSS) inflow and outflow concentrations (a) and removal efficiencies (b) for set I.
Figure 12.
Total suspended solids (TSS) inflow and outflow concentrations (a) and removal efficiencies (b) for set I.

Figure 13.
Total suspended solids (TSS) inflow and outflow concentrations (a) and removal efficiencies (b) for set II.
Figure 13.
Total suspended solids (TSS) inflow and outflow concentrations (a) and removal efficiencies (b) for set II.


Table 1.
The result of statistical test.
| Parameter | Type of Treatment | Statistical Test | p |
|---|---|---|---|
| COD efficiency removal (%) | Set I (filter 1 and filter 2) | Paired wilcox.test | 0.46 |
| Set II (filter 1 and filter 5) | Paired t.test | 0.87 | |
| Filter 1 of set I and filter 1 of set II | Wilcox.test | 0.46 | |
| BOD5 efficiency removal (%) | Set I (filter 1 and filter 2) | Paired t.test | 0.28 |
| Ptot efficiency removal (%) | Set I (filter 1 and filter 2) | Paired wilcox.test | 0.67 |
| Set II (filter 1 and filter 5) | Paired t.test | 0.76 | |
| Filter 1 of set I and filter 1 of set II | Wilcox.test | 0.23 | |
| COD outflow (mg dm−3) | Set I (filter 1 and filter 2) | Paired t.test | 0.5 |
| Set II (filter 1 and filter 5) | Paired t.test | 0.79 | |
| Filter 1 of set I and filter 1 of set II | t.test | 0.4 | |
| BOD5 outflow (mg dm−3) | Set I (filter 1 and filter 2) | Paired wilcox.test | 0.47 |
| Ptot outflow (mg dm-3) | Set I (filter 1 and filter 2) | Paired wilcox.test | 0.53 |
| Set II (filter 1 and filter 5) | Paired wilcox.test | 0.79 | |
| Filter 1 of set I and filter 1 of set II | Wilcox.test | 0.004 * |
(*) The significant difference at 95% confidence interval.
© 2019 by the authors. Licensee MDPI, Basel, Switzerland. This article is an open access article distributed under the terms and conditions of the Creative Commons Attribution (CC BY) license (http://creativecommons.org/licenses/by/4.0/).
Share and Cite
MDPI and ACS Style
Spychała, M.; Nguyen, T.H. Preliminary Study on Greywater Treatment Using Nonwoven Textile Filters. Appl. Sci. 2019, 9, 3205. https://0-doi-org.brum.beds.ac.uk/10.3390/app9153205
AMA Style
Spychała M, Nguyen TH. Preliminary Study on Greywater Treatment Using Nonwoven Textile Filters. Applied Sciences. 2019; 9(15):3205. https://0-doi-org.brum.beds.ac.uk/10.3390/app9153205
Chicago/Turabian StyleSpychała, Marcin, and Thanh Hung Nguyen. 2019. "Preliminary Study on Greywater Treatment Using Nonwoven Textile Filters" Applied Sciences 9, no. 15: 3205. https://0-doi-org.brum.beds.ac.uk/10.3390/app9153205
Note that from the first issue of 2016, this journal uses article numbers instead of page numbers. See further details here.