Evaluation of the Indoor Air Quality in Governmental Oversight Supermarkets (Co-Ops) in Kuwait


College of Life Sciences, Environmental Technology Management, Kuwait University, P.O. Box 5969, Safat 13060, Kuwait
*
Author to whom correspondence should be addressed.
Appl. Sci. 2019, 9(22), 4950; https://0-doi-org.brum.beds.ac.uk/10.3390/app9224950
Submission received: 25 September 2019
/
Revised: 14 November 2019
/
Accepted: 14 November 2019
/
Published: 17 November 2019
(This article belongs to the Special Issue New Challenges for Indoor Air Quality)
Abstract
:Examining the indoor air environment of public venues, especially populated supermarkets such as Co-Ops in Kuwait, is crucial to ensure that these venues are safe from indoor environmental deficits such as sick building syndrome (SBS). The aim of this study was to characterize the quality of the indoor air environment of the Co-Ops supermarkets in Kuwait based on investigation of CO2, CO, NO2, H2S, TVOCs, and NMHC. On-site measurements were conducted to evaluate these parameters in three locations at the selected Co-Ops, and the perceived air quality (PAQ) was determined to quantify the air’s pollutants as perceived by humans. Moreover, the indoor air quality index (AQI) was constructed for the selected locations, and the ANOVA test was used to analyze the association between the observed concentrations among these environmental parameters. At least in one spot at each Co-Op, the tested environmental parameters exceeded the threshold limit set by the environmental agencies. The PAQ for Co-Op1, 2, and 3 are 1.25, 1.00, and 0.75 respectively. CO2 was significantly found in an association with CO, H2S, and TVOCs, and its indoor-outdoor concentrations were significantly correlated with R2 values ranges from 0.40 to 0.86 depending on the tested location.
1. Introduction
1.1. Co-Ops Supermarkets
The 73 Co-Operative (Co-Op) supermarkets in Kuwait are attractive and modern supermarkets scattered within the State of Kuwait. Each residential area in Kuwait has its own Co-Op which is managed by an elected board from the people who reside in that area and oversighted by the Social Affairs Ministry. The customers, who can be shareholders by paying the membership registration fee, are usually from the population in that residential area. At the end of each fiscal year, shareholders are rewarded 10% of their total purchasing during the year. Co-Ops are more like showrooms that allow vendors to show their goods, the price and quality of which are controlled by the board management. Therefore, for the benefit of the population, it is not permissible by law to establish a grocery business in the Co-Op’s residential area except if that residential area allows commercial activities, which was found to be very limited. Hence, Co-Ops have the advantage of being the only source of groceries for residents living in that certain area. For these reasons, and for the competitive price they provide, Co-Ops are very popular and attractive supermarkets in Kuwait. Studying how healthy these supermarkets’ buildings are and how safe the customers and the workers are from exposure to modern-day air pollutants such as carbon dioxide CO2, carbon monoxide CO, nitrogen dioxide NO2, hydrogen sulfide H2S, total volatile organic compounds TVOCs (including styrene and benzene), and non-methane hydrocarbons NMHC is crucial. To the best of the authors’ knowledge, no study has been performed to examine the indoor air quality of these Co-Ops supermarkets.
1.2. Indoor Air Quality (IAQ) Parameters
The issue of indoor air pollution of occupied buildings still draws public concern as several pollutants from various inside and outside sources have been detected within the indoor environments. In addition to the socio-economic impact of these indoor air pollutants, the occupants’ health is also threatened significantly [1]. Several studies [2,3,4,5] reported that CO2, CO, NO2, H2S, TVOCs, and NMHC, among other indoor pollutants, are risk factors of Sick Building Syndrome (SBS). CO2 is mainly responsible for the discomfort of breathing and is an indicator of human bioeffluents. Exposure to a low CO concentration level can cause headache, malaise, and fatigue [6]. For example, inhaling 10 ppm CO can lead to carboxyhemoglobin (HbCO) levels of 2% [7], where HbCO is responsible of oxygen reduction and anemic hypoxia [8]. TVOCs in indoor environment are linked with both asthma and rhinitis [9] and may cause skin, melanoma, lung and endocrine-related cancers [1]. The Agency for Toxic Substances & Disease Registry (ATSDR) has published public health statements (reports) for some indoor pollutants, and it was found that H2S may cause eye, nose and throat irritation, difficulty breathing, poor memory, tiredness, and balance problems [10]. Nitrogen dioxide, NO2, in the breathing air can cause cough, fluid buildup in the lungs, and nausea, while high levels may lead to death [11]. Therefore, it is extremely important to assess, monitor, and control indoor air environments, especially highly and frequently populated places. Due to their frequent occurrence in indoor environments and their serious health impacts to humans, these pollutants were chosen for this study.
1.3. Perceived Air Quality (PAQ)
In 1987, Fanger [12] introduced a new unit, decipol, to quantify the air’s pollutants as perceived by humans. Since then, researchers have widely used this concept as it reflects the indoor occupants’ needs and comfort [13]. The perceived air quality was derived from subjective measurements by which the occupants were asked to express their satisfactions with air quality on a −1 to + 1 scale.
1.4. Indoor Air Quality Index (AQI)
The Indoor Air Quality Index (AQI) is a numerical communication scale between the environmental agencies and the public to inform them of how clean or unhealthy the air is. Unfortunately, the AQI used by environmental agencies is used only for outdoors and for very limited pollutants. For example, the Environmental Protection Agency in the United States (EPA-US) only calculates the AQI for four pollutants: ozone, particulate matter, CO, and sulfur dioxide [14]. Some researchers [15,16] have tried to overcome these limitations and to establish an indoor AQI for several pollutants. Saad et al. [15] developed a breakpoints table for indoor pollutants such as CO2, CO, NO2, and TVOCs, by which AQI for indoor environments can be calculated.
1.5. Study Objectives
The aim of this study was to characterize the quality of the indoor air environment of the Co-Ops supermarkets in Kuwait based on investigation of CO2, CO, NO2, H2S, TVOCs, and NMHC.
2. Materials and Methods
2.1. Co-Operatives Locations and Description
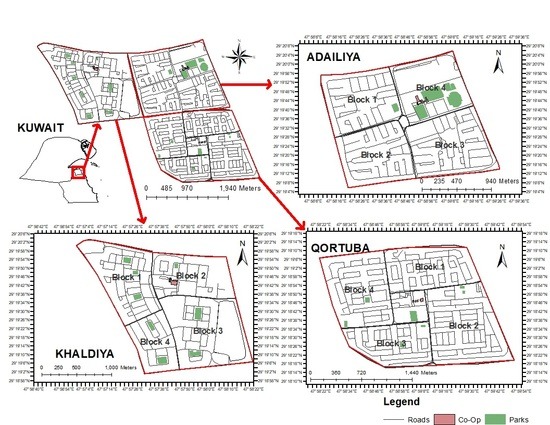
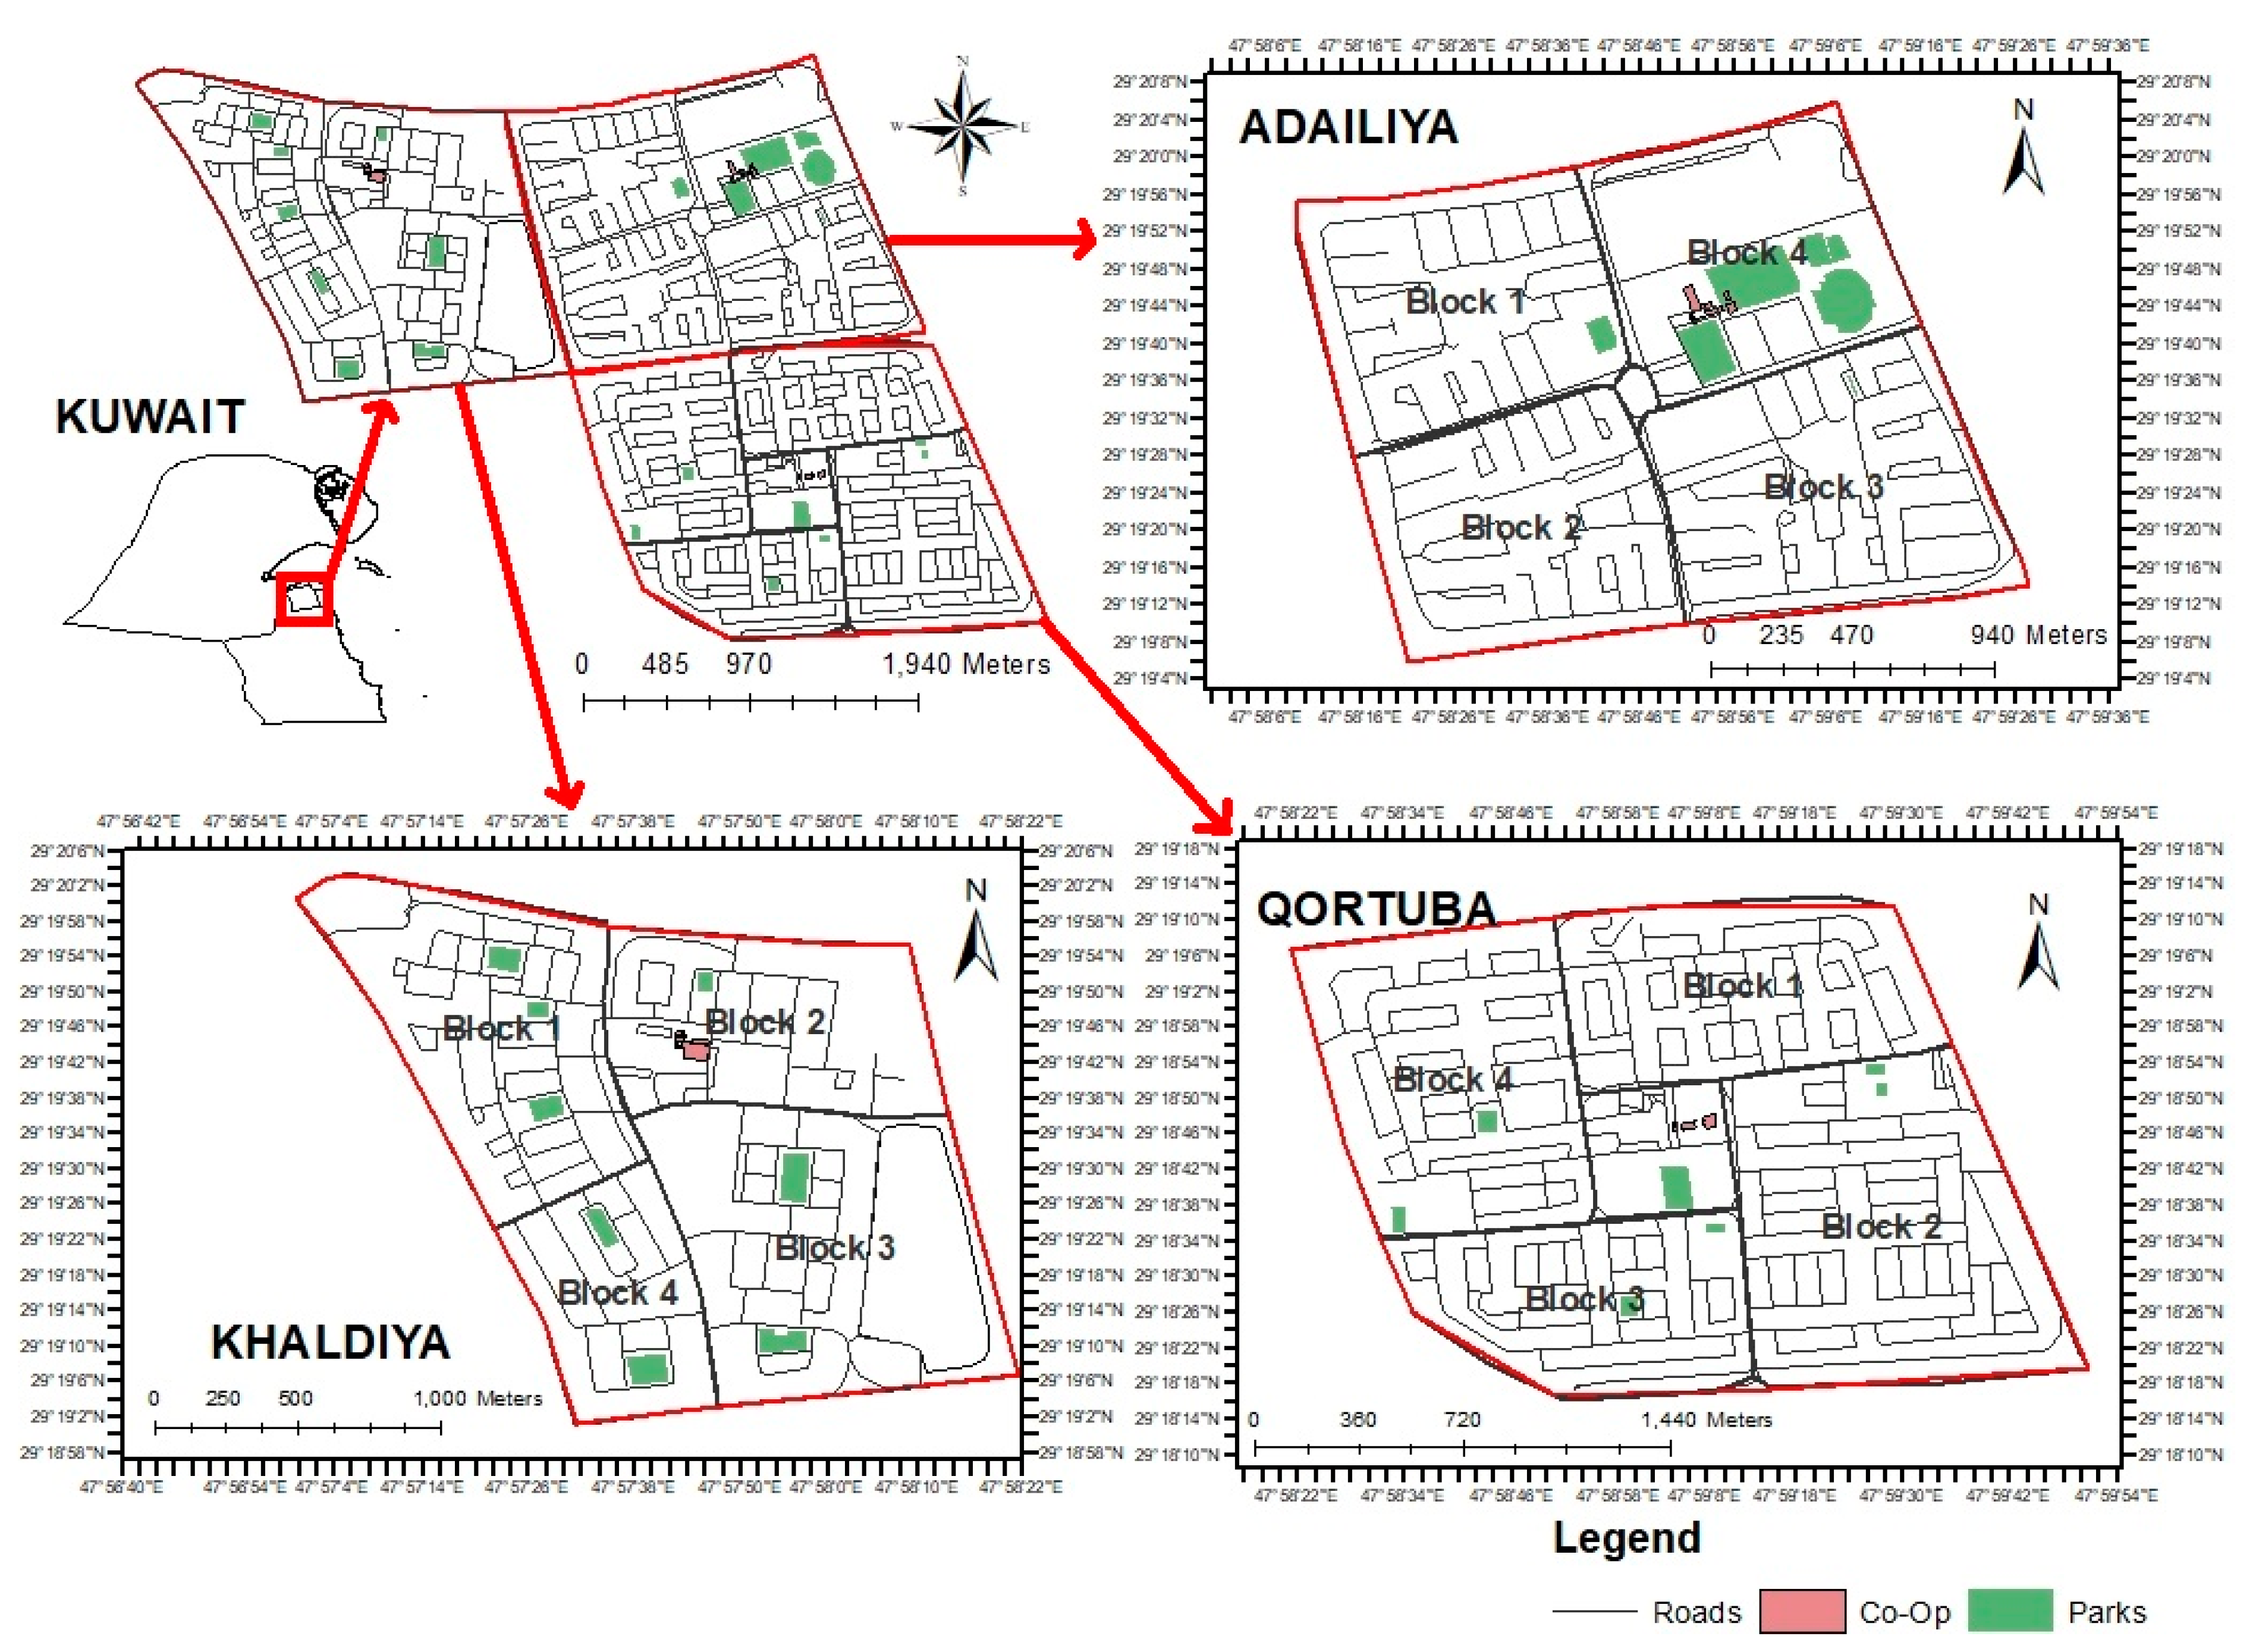
This study was conducted in three co-operative supermarkets in three different residential areas that belong to the Capital Governorate, Kuwait. Co-Op 1, Co-Op 2, and Co-Op 3 are located in residential area 1, Adailia, residential area 2, Qurtoba, and residential area 3, Khaldia, respectively. Figure 1 shows the geographical locations of the Co-Ops under study. Table 1 and Table 2 summarize the main characteristics of the residential areas and the Co-Ops under study, respectively. The population for each residential area was obtained from the Public Authority for Civil Information (PACI), Kuwait.
As Table 2 shows, Co-Op 1 and Co-Op 2 consist of two floor levels, while Co-Op 3 has an additional basement level. However, the design of the three Co-Ops are similar. In all the three Co-Ops, the ground level is designated for groceries, and the upper level is occupied by stores with different activities, such as a coffee shop, electronics, clothing, etc. The basement level in Co-Op 3 includes a stationary section and some groceries as well. Three spots in each Co-Op were selected in which the measurements were taken. To reduce the variability, the selected spots in the three Co-Ops were chosen to be the same activity. Therefore, spot 1 (S1) in the three Co-Ops was the vegetable section. Spot 2 (S2) was chosen to be the detergent section, and spot 3 (S3) was chosen to be the upper level where the individual stores were.
2.2. On-Site Measurements
In this study, six pollutants as indicators for the indoor of the Co-Ops’ air quality were measured, namely, carbon dioxide CO2, carbon monoxide CO, nitrogen dioxide NO2, hydrogen sulfide H2S, total volatile organic compounds TVOCs, and non-methane hydrocarbons NMHC. These indoor pollutants were measured with a portable air quality monitor (Aeroqual, Auckland, New Zealand, model: Series 500) with the appropriate indoor air quality sensors (Aeroqual sensors). The operational range of temperature and relative humidity are 0 to 40 °C and 10% to 90%, respectively, for all the sensors. Table 3 shows the specifications of the sensors used in this study. The sensors of CO, NO2, and H2S are gas sensitive electrochemical (GSE) sensor, in which a pollutant reaches the sensing electrode and an electrochemical reaction occurs causing electrons to flow at a level proportional to the pollutant concentration [17]. A common shortcoming of GSE sensors is their cross-sensitivity with similar molecules types [18]. CO2 concentration is detected by a nondispersive infrared (NDIR) sensor. NDIR sensor measures the difference between the amount of light received by the detector and the amount of light radiated by the infrared lamp; hence, CO2 molecules are quantified based on that difference [17]. TVOCs contamination is measured by a photo-ionization detector sensor (PID). In PID, the ultraviolet (UV) light’s energy removes an electron from the VOC molecule, which becomes a positively charged molecule and as a result, a flow of current is generated. The amount of resulting current is proportional to VOC’s concentration [19]. PID sensors’ lenses are expected, with usage, to be contaminated by dust and/or dirt; therefore, the lens must be cleaned frequently. NMHC is measured by gas sensitive semiconductor (GSS) sensor [20,21]. The literature has revealed that these sensors are reliable and they have been used by several studies [18,19,22,23,24,25,26,27,28].
The sampling point height in each spot and for each pollutant was designated to match the human respiratory height (between 1.3–1.6 m). In each spot and for each pollutant, to ensure the representative number of 15–20 data points, measurements were taken at a 1 min interval and for a 15 min duration as an adaptation of the method introduced by [18], except that this study emphasized on three time intervals, namely morning, noon, and evening. Shortly after, the data were transferred directly to a PC software via USB for further data analysis. The popular times for customer visits were determined by two means; firstly, by asking the working staff at Co-Ops; and secondly, by using the information provided by Google’s aggregated and anonymized data from customers who have opted into Google location history. These measurements were conducted three times: morning, noon, and evening. This was the case for each induvial pollutant in each allocated spot and for each Co-Op.
Air temperature and relative humidity were measured with a multifunctional digital anemometer (Mastech MS6252B, Brea, California, USA). Distance and areas were measured with a laser meter (Lecia model: DISTOTMD1, Zamudio, Spain).
2.3. Indoor Air Quality Indicators
Standards regulating indoor air quality parameters for non-occupational environments such as supermarkets lies in an inexplicit area. They are less definitive than the standards governing thermal comfort, for example [29]. This ambiguity in definition may refer to the unclear differentiation between how experts look to these standards for both safe the concentration level and the acceptable risk level [30]. If this problem is overstepped, however, there is a consensus in literature to adopt some common guidelines for indoor air quality pollutant values, which can be expressed as threshold concentrations above which negative health effects may arise. In addition to national and local environmental agencies, the World Health Organization (WHO), the American Society of Heating and Air-Conditioning Engineers (ASHRAE), California Ambient Air Quality Standards (CAAQS) provide prominent regulatory reports on indoor air quality assurance. A summary of the threshold limits paired with exposure duration (averaging period) for the indoor environment pollutants that have been examined in this study is shown in Table 4.
2.4. Indoor Air Quality Index (AQI)
This study adopted the indoor AQI breakpoints categories table developed by Saad et al. [15] for several pollutants, including CO2, CO, NO2, and TVOCs in which a sub-index is calculated from a segmented linear function that transforms indoor targeted concentrations onto a scale ranging from 100 to 0, as shown in Table 5. Each sub-index i is calculated by using a segmented linear function that relates pollutant concentration Xi to sub-index value Ii. A segmented linear function consists of straight-line segments joining discrete co-ordinates (i.e., breakpoints). For pollutant i and segment j, the co-ordinates of the jth breakpoints are represented by sub-index value Ii,j and the concentration Xi,j giving the ordered pair (Xi,j, Ii,j). If the observed concentration is Xi, the corresponding sub-index value Ii is calculated using Equation (1) over the concentration range:
then, the overall pollutant standards index is the maximum or the minimum of the calculated sub-indices, depending on the appropriate form of Equation (1) which is originally an interpolation equation and its range differs from the outdoor form (usually from 0 to 500) and the indoor form with a range of 100 to 0. As a result, the safest value in the outdoor range is the value that approaches zero, while the worst value of the indoor limits is the value that approaches zero. The variables of Equation (1) are as follow:
| Ii = | Index value for pollutant i |
| Xi = | Concentration of pollutant i |
| Xi,j = | Lower Breakpoint value of the concentration |
| Xi,j+1 = | Higher Breakpoint value of the concentration |
| Ii,j+1 = | Index Breakpoint value of Xi,j+1 |
| Ii,j = | Index Breakpoint value of Xi,j |
2.5. Perceived Air Quality (PAQ)
The Perceived Air Quality (PAQ) is a subjective evaluation procedure and an important factor in assessing the indoor environment, which can be determined by Equation (2):
where PD is percentage dissatisfied with air quality (%) which can be determined by Equation (3):
where ACC is the acceptability rating of the indoor air condition, which is obtained from the one-question questionnaire. The respondents vote for the acceptance condition using the acceptability scale that ranges from 1 to −1 and is coded as follows: 1 = clearly acceptable, 0 = just acceptable and/or just not acceptable, −1 = clearly not acceptable. The PAQ questionnaire was conducted in each Co-Op and the respondents were customers, staff, female, male, young and old participants, and it used a continuous acceptability scale recommended for use by untrained panel [15]. The perceived air quality were expected to support the findings of the indoor air quality assessment of Co-Ops.
AQ = 112(ln[PD] − 5.98)−4
2.6. Data Analysis and Correlations
Statistical analyses were performed using a IBM Statistical Package for the Social Sciences (SPSS). A box-whiskers and scatter plots were used to visualize the pollutants’ performance in each spot. A zero-order correlation coefficient was performed to examine the relationship between the pollutants along with analysis of variance (ANOVA). Indoor and outdoor regression of CO2 was conducted to investigate the outdoor/indoor model. In all the analyses, the statistical significance was set to 5% (α ≤ 0.05).
2.7. Indoor/Outdoor Regression
An indoor/outdoor correlation was only conducted for CO2. The outdoor CO2 measurements were conducted in the same manner as for indoor CO2, which was in the morning, noon, and evening. The wind speed, humidity, and air temperature measurements were measured by the instruments mentioned above. All the outdoor measurements were performed in the vicinity of the Co-Ops, i.e., between the entrance door and the parking lot.
3. Results and Discussion
3.1. On-Site Measurements of Indoor Air Quality Indicators
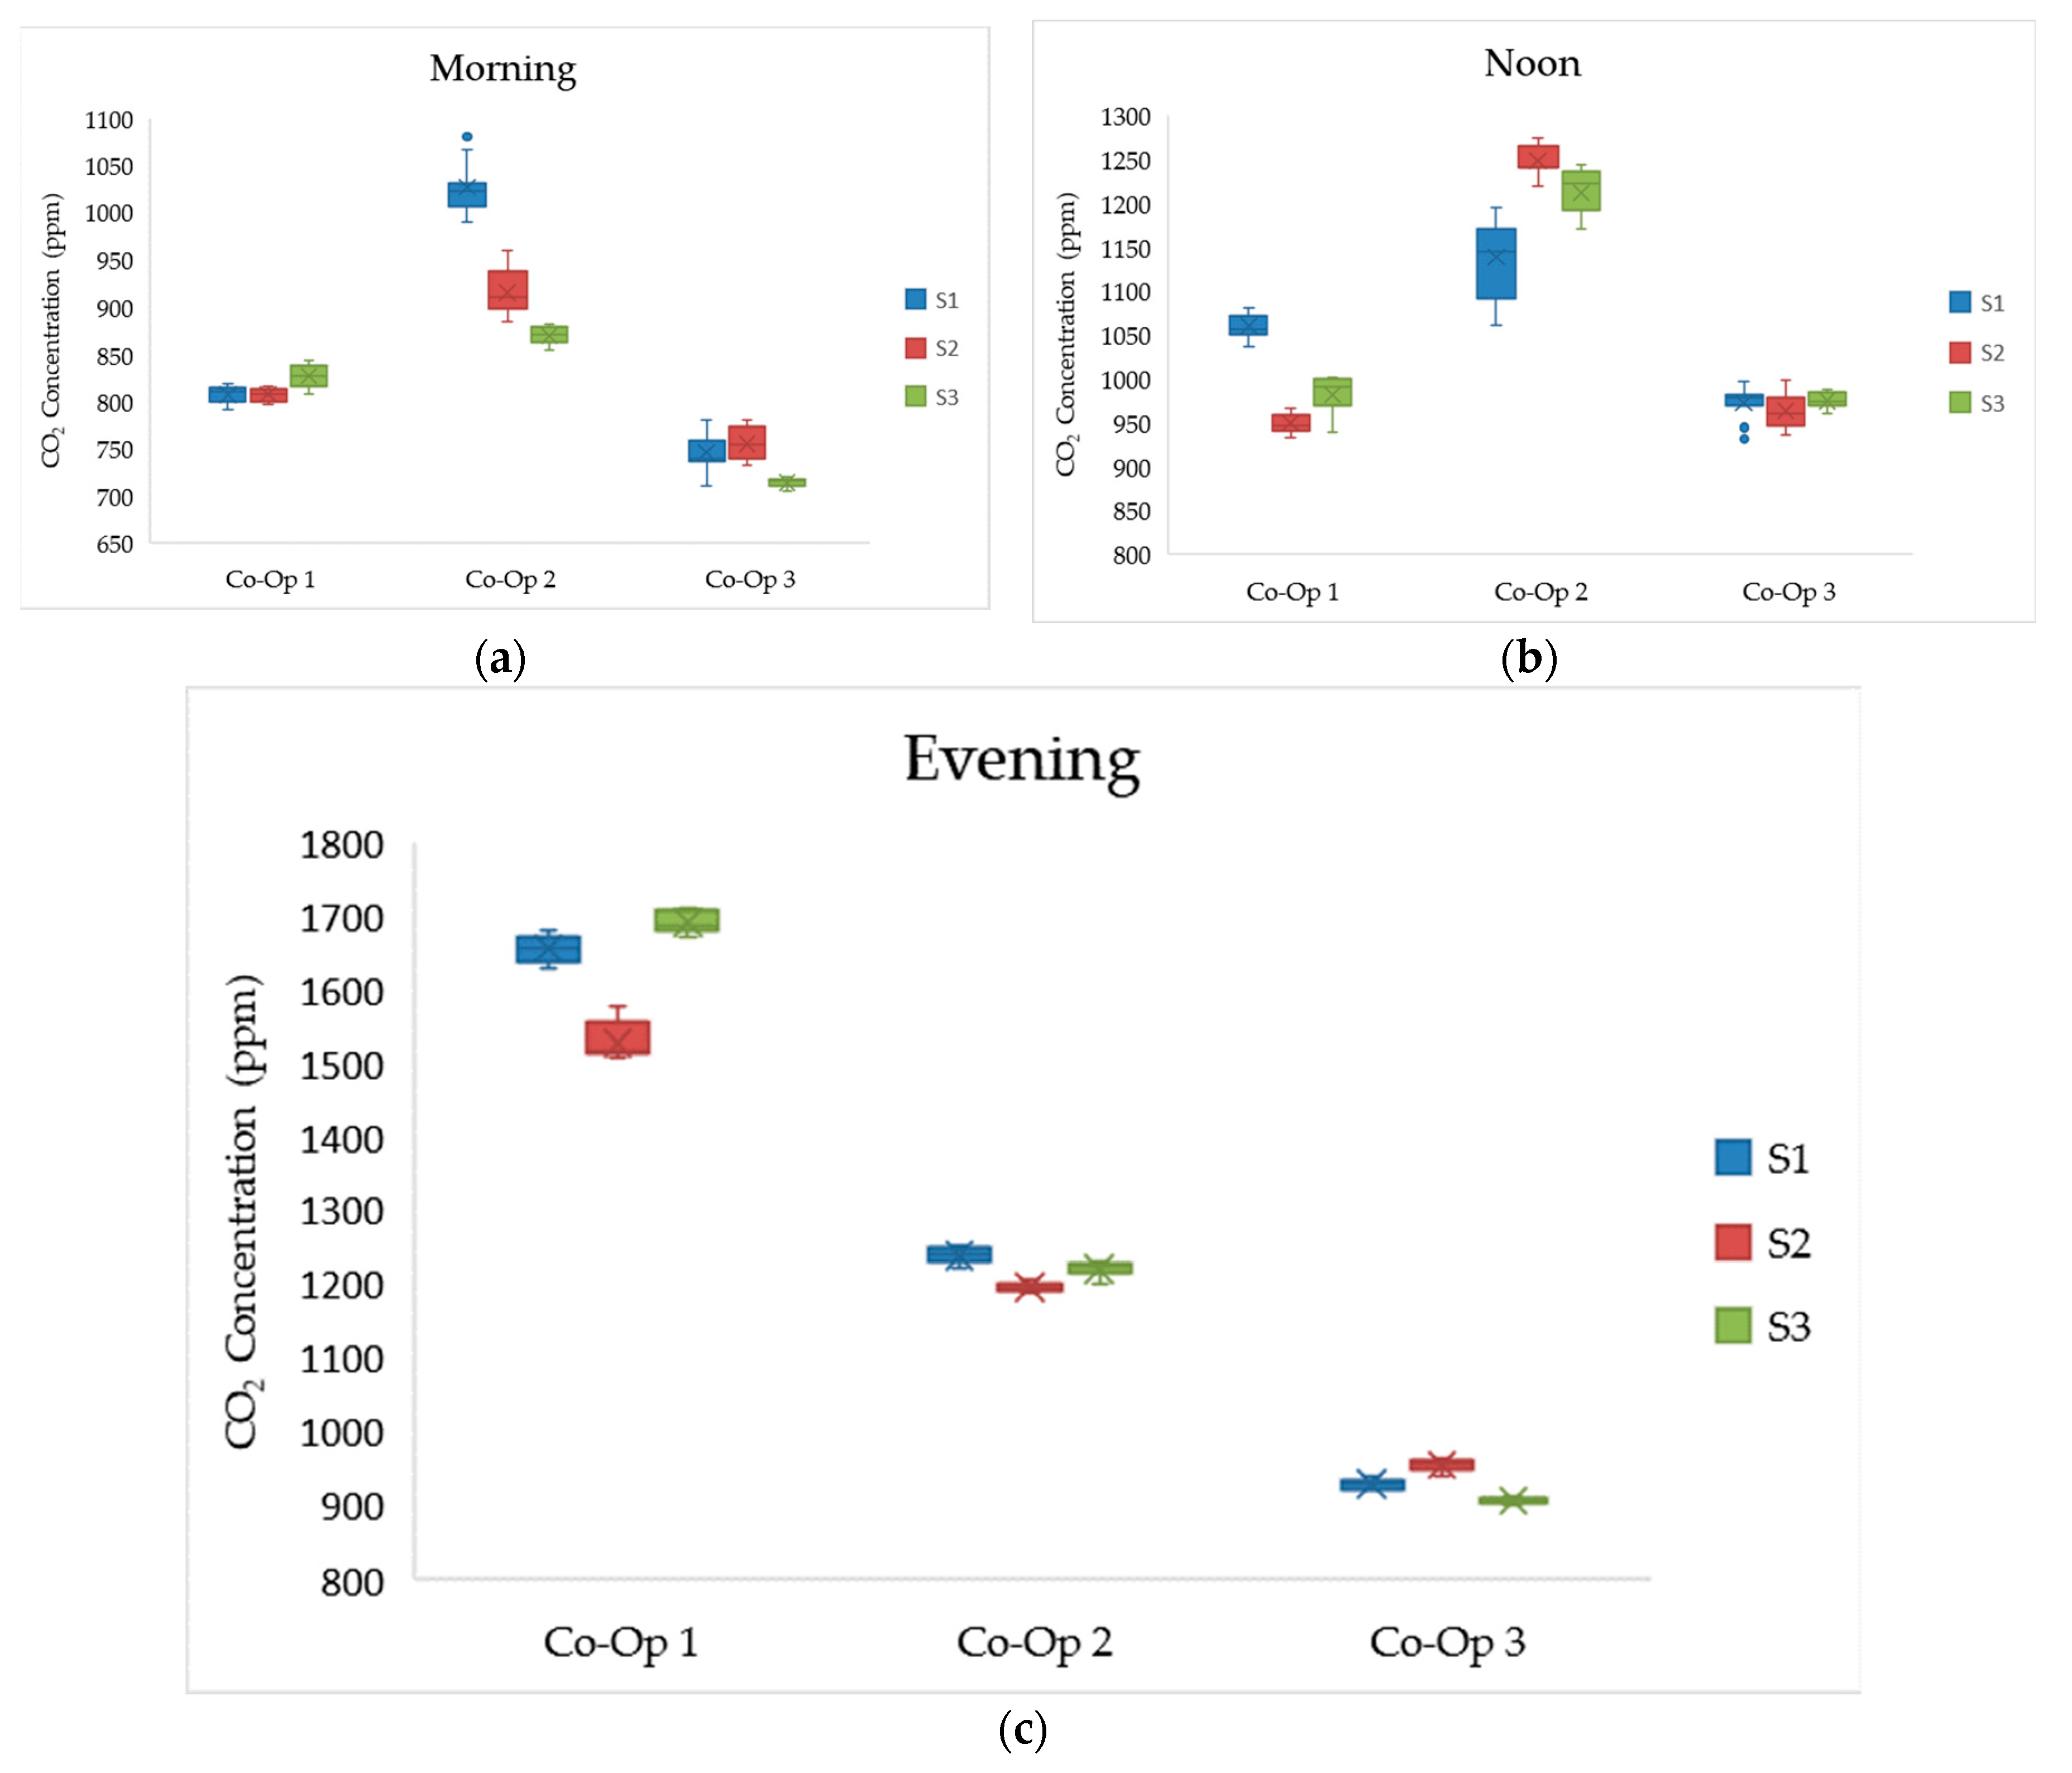
It is worth mentioning that the concentration averaging time in all the figures in this study is 15 min. It was found that the average duration visits to the Co-Ops was 15 to 45 min. Figure 2 shows the CO2 concentration for Co-Ops for spot 1, 2, and 3 in the morning, noon, and evening. The highest recorded CO2 concentrations were in descending order for the evening, noon, and morning. In the morning, most of the observed data points were within the threshold limit, whereas in the evening period, most of the recorded readings were highly above the threshold value, except for Co-Op 3. The × sign in the box plot refers to the mean value, while the • sign refers to an outlier value (comparing to other values). This symbolism is true for all the box-plots of data in Figure 2, Figure 3, Figure 4, Figure 5, Figure 6, Figure 7 and Figure 8 in this study.
A trend was noticed with the CO2 measurements: the CO2 concentration in the evening was the highest, then at noon. Figure 3, which shows the results for Co-Op 1, S1, demonstrates this finding. This may refer to customer density. Shang et al. [33] studied the CO2 concentration in four shopping malls in China and found that CO2 concentration was positively correlated with customer flow rate. Hence, CO2 concentration in the evening for mall C was the highest, with a maximum value of 1050 ppm at 17:30 [33].
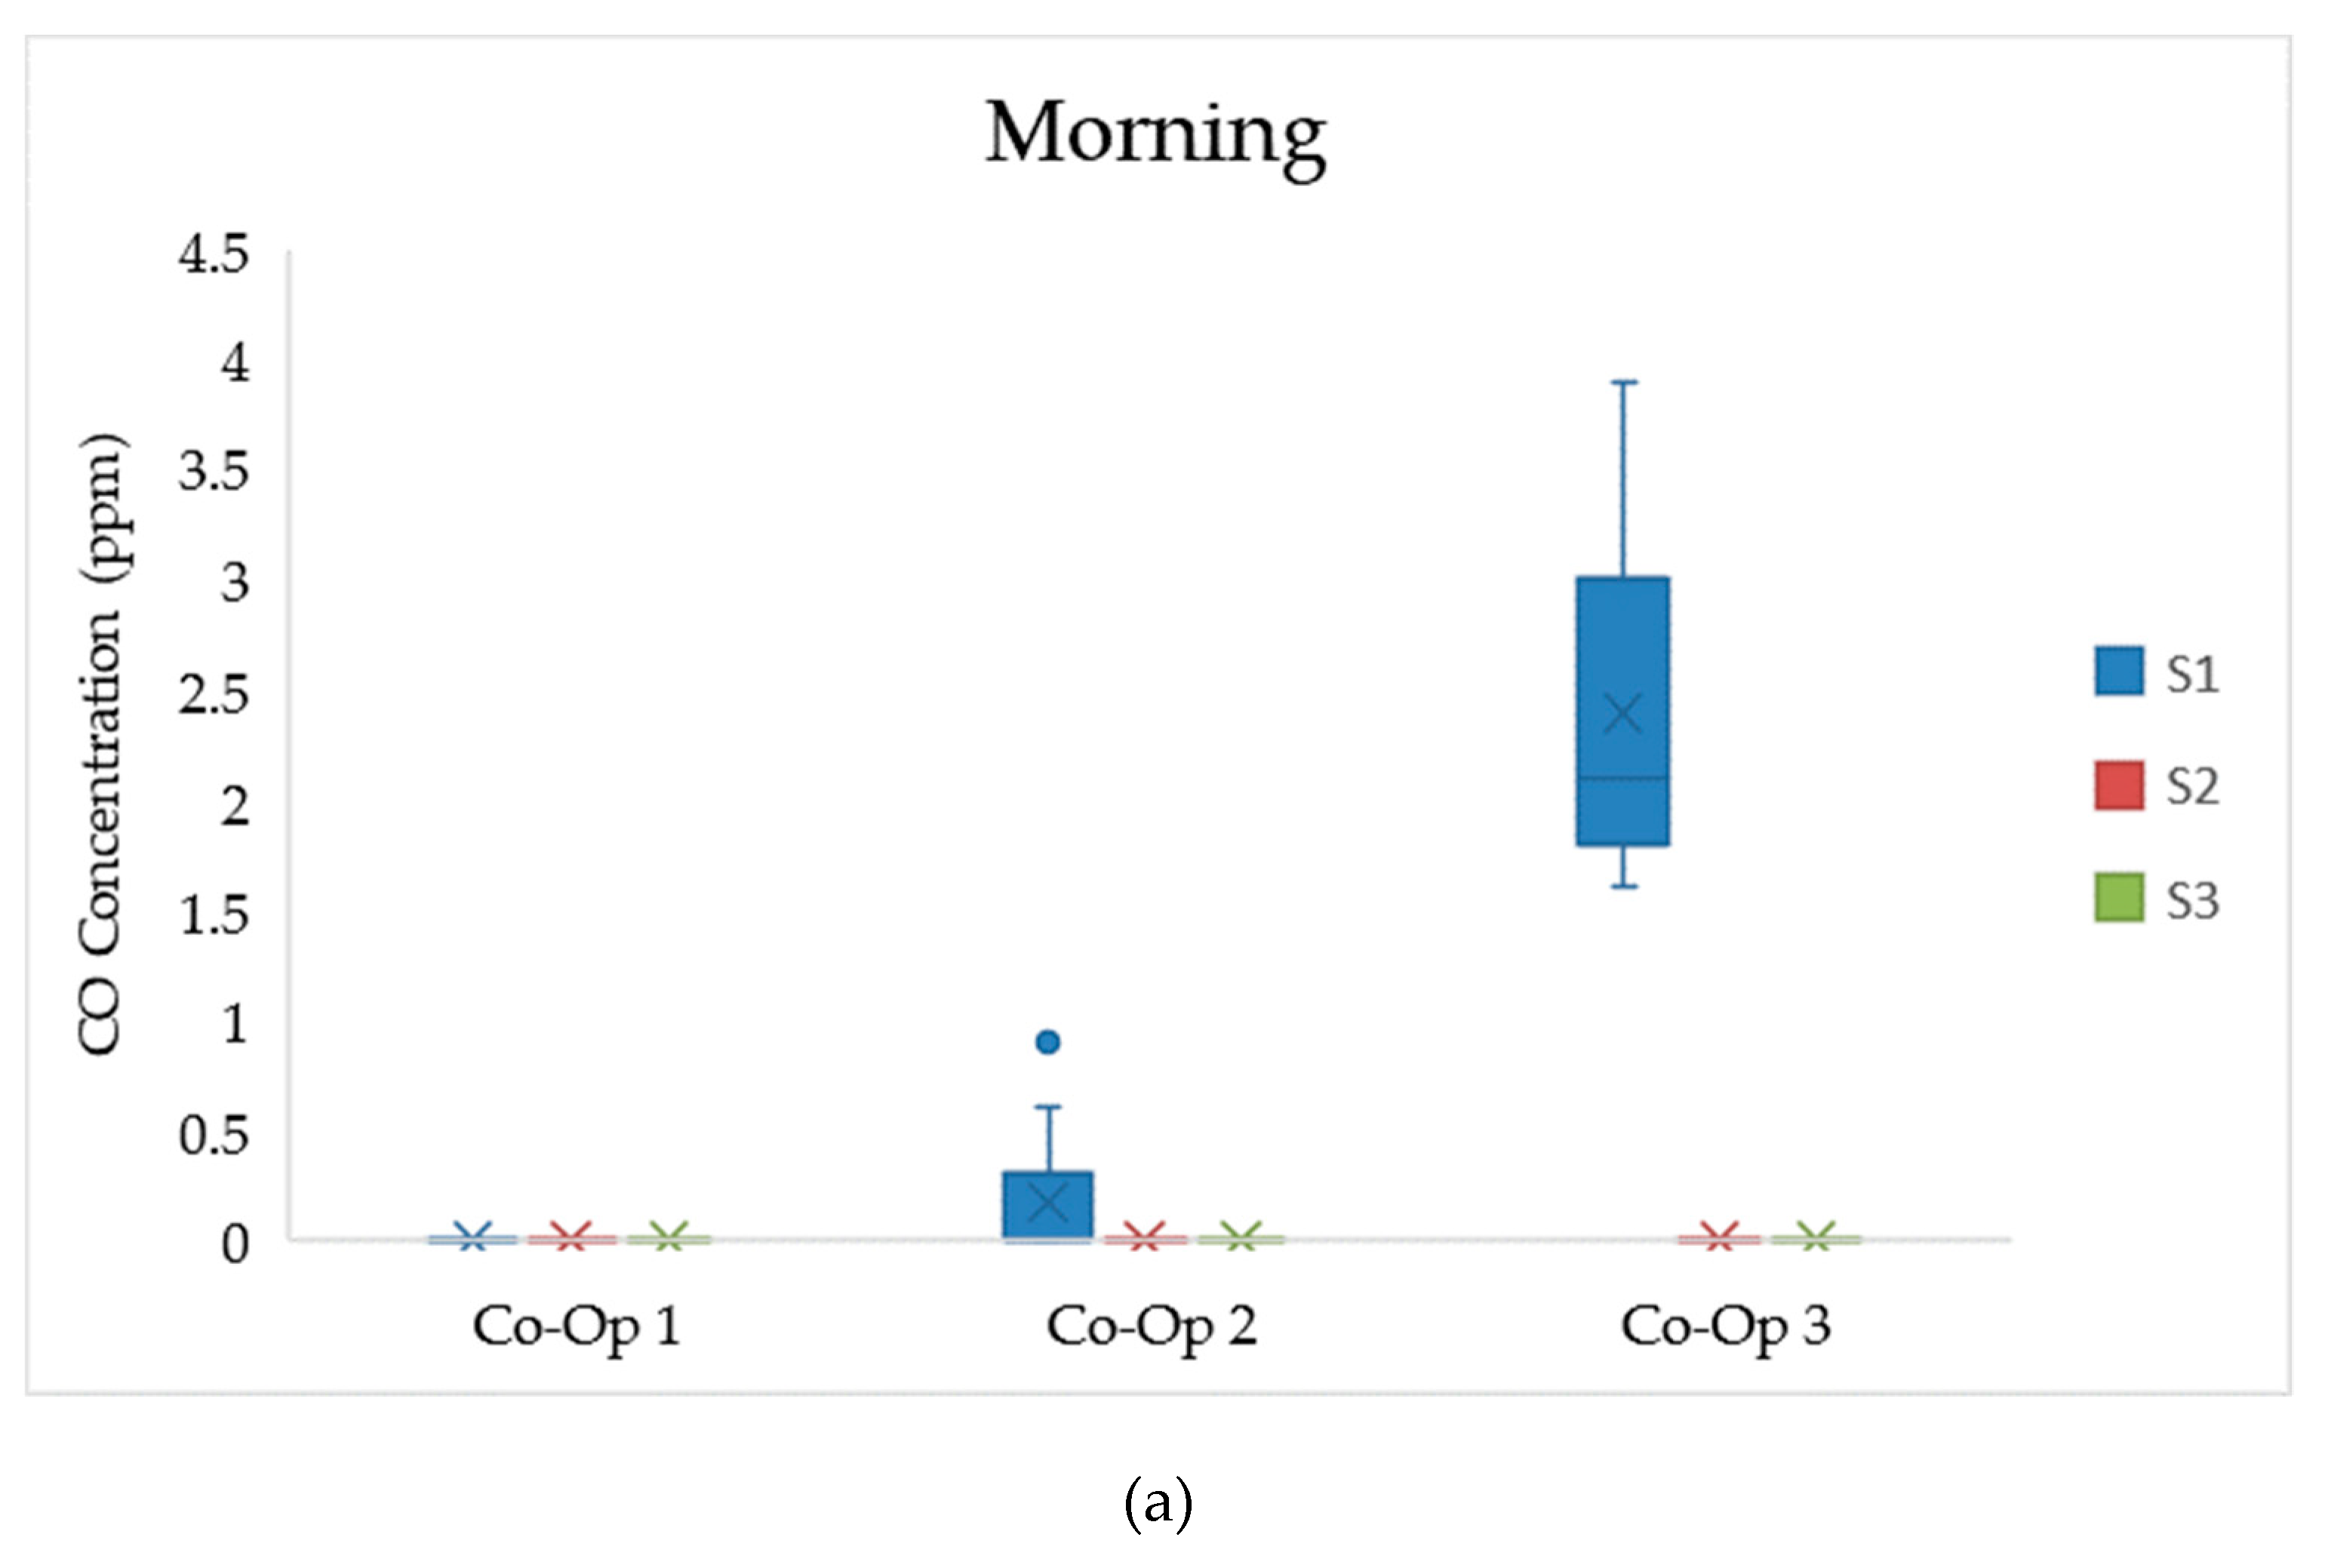
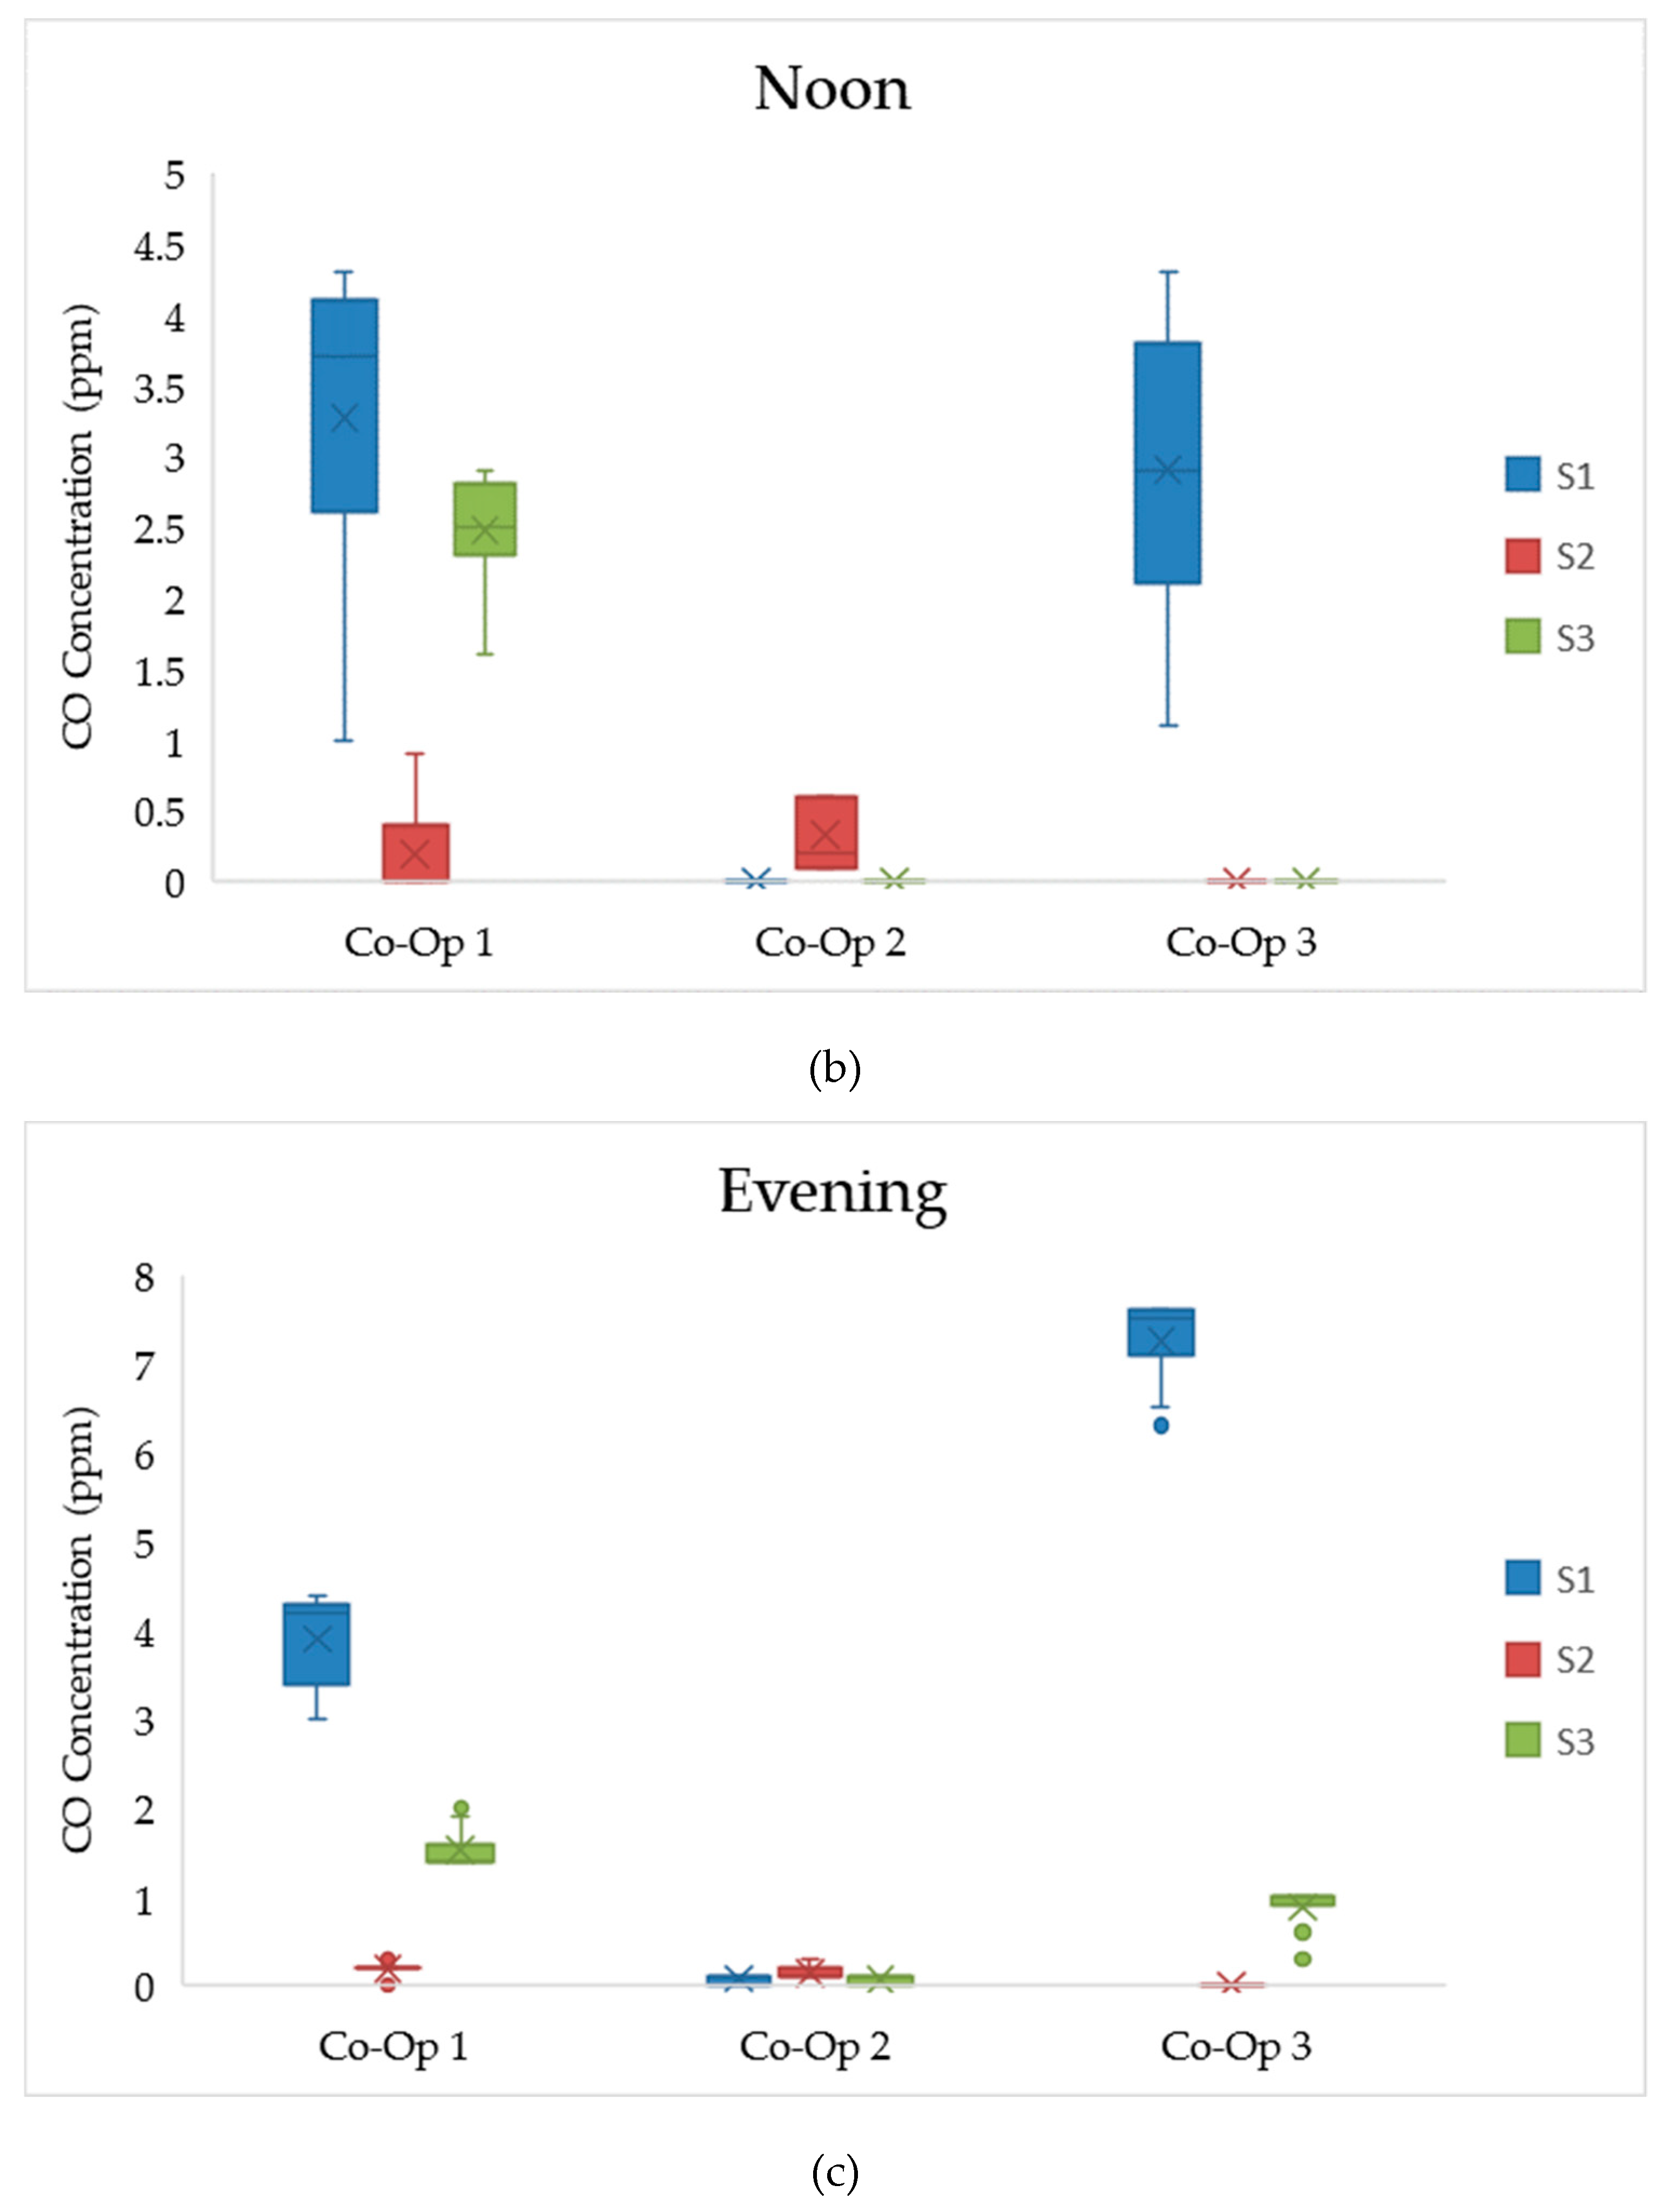
A comparison of the CO concentration findings for the morning, noon, and evening for all the Co-Ops, including all the spots, is shown in Figure 4.
Compared to the other spots, S1 at Co-Op 1 and S1 at Co-Op 3 show remarkable readings. In S1 at Co-Op 3, for instance, the mean value for the dataset passed the daily maximum exposure set by WHO. The mean of S1 at Co-Op 1 passed the upper limit value set by the Lithuania IAQ Regulations (the averaging period was not specified by the Lithuania IAQ Regulations). For the other spots, CO concentration ranged between 0.1 and 2 ppm. One possible source of CO in Co-Ops is automobiles crowded on the street passing by the Co-Op’s entrance.
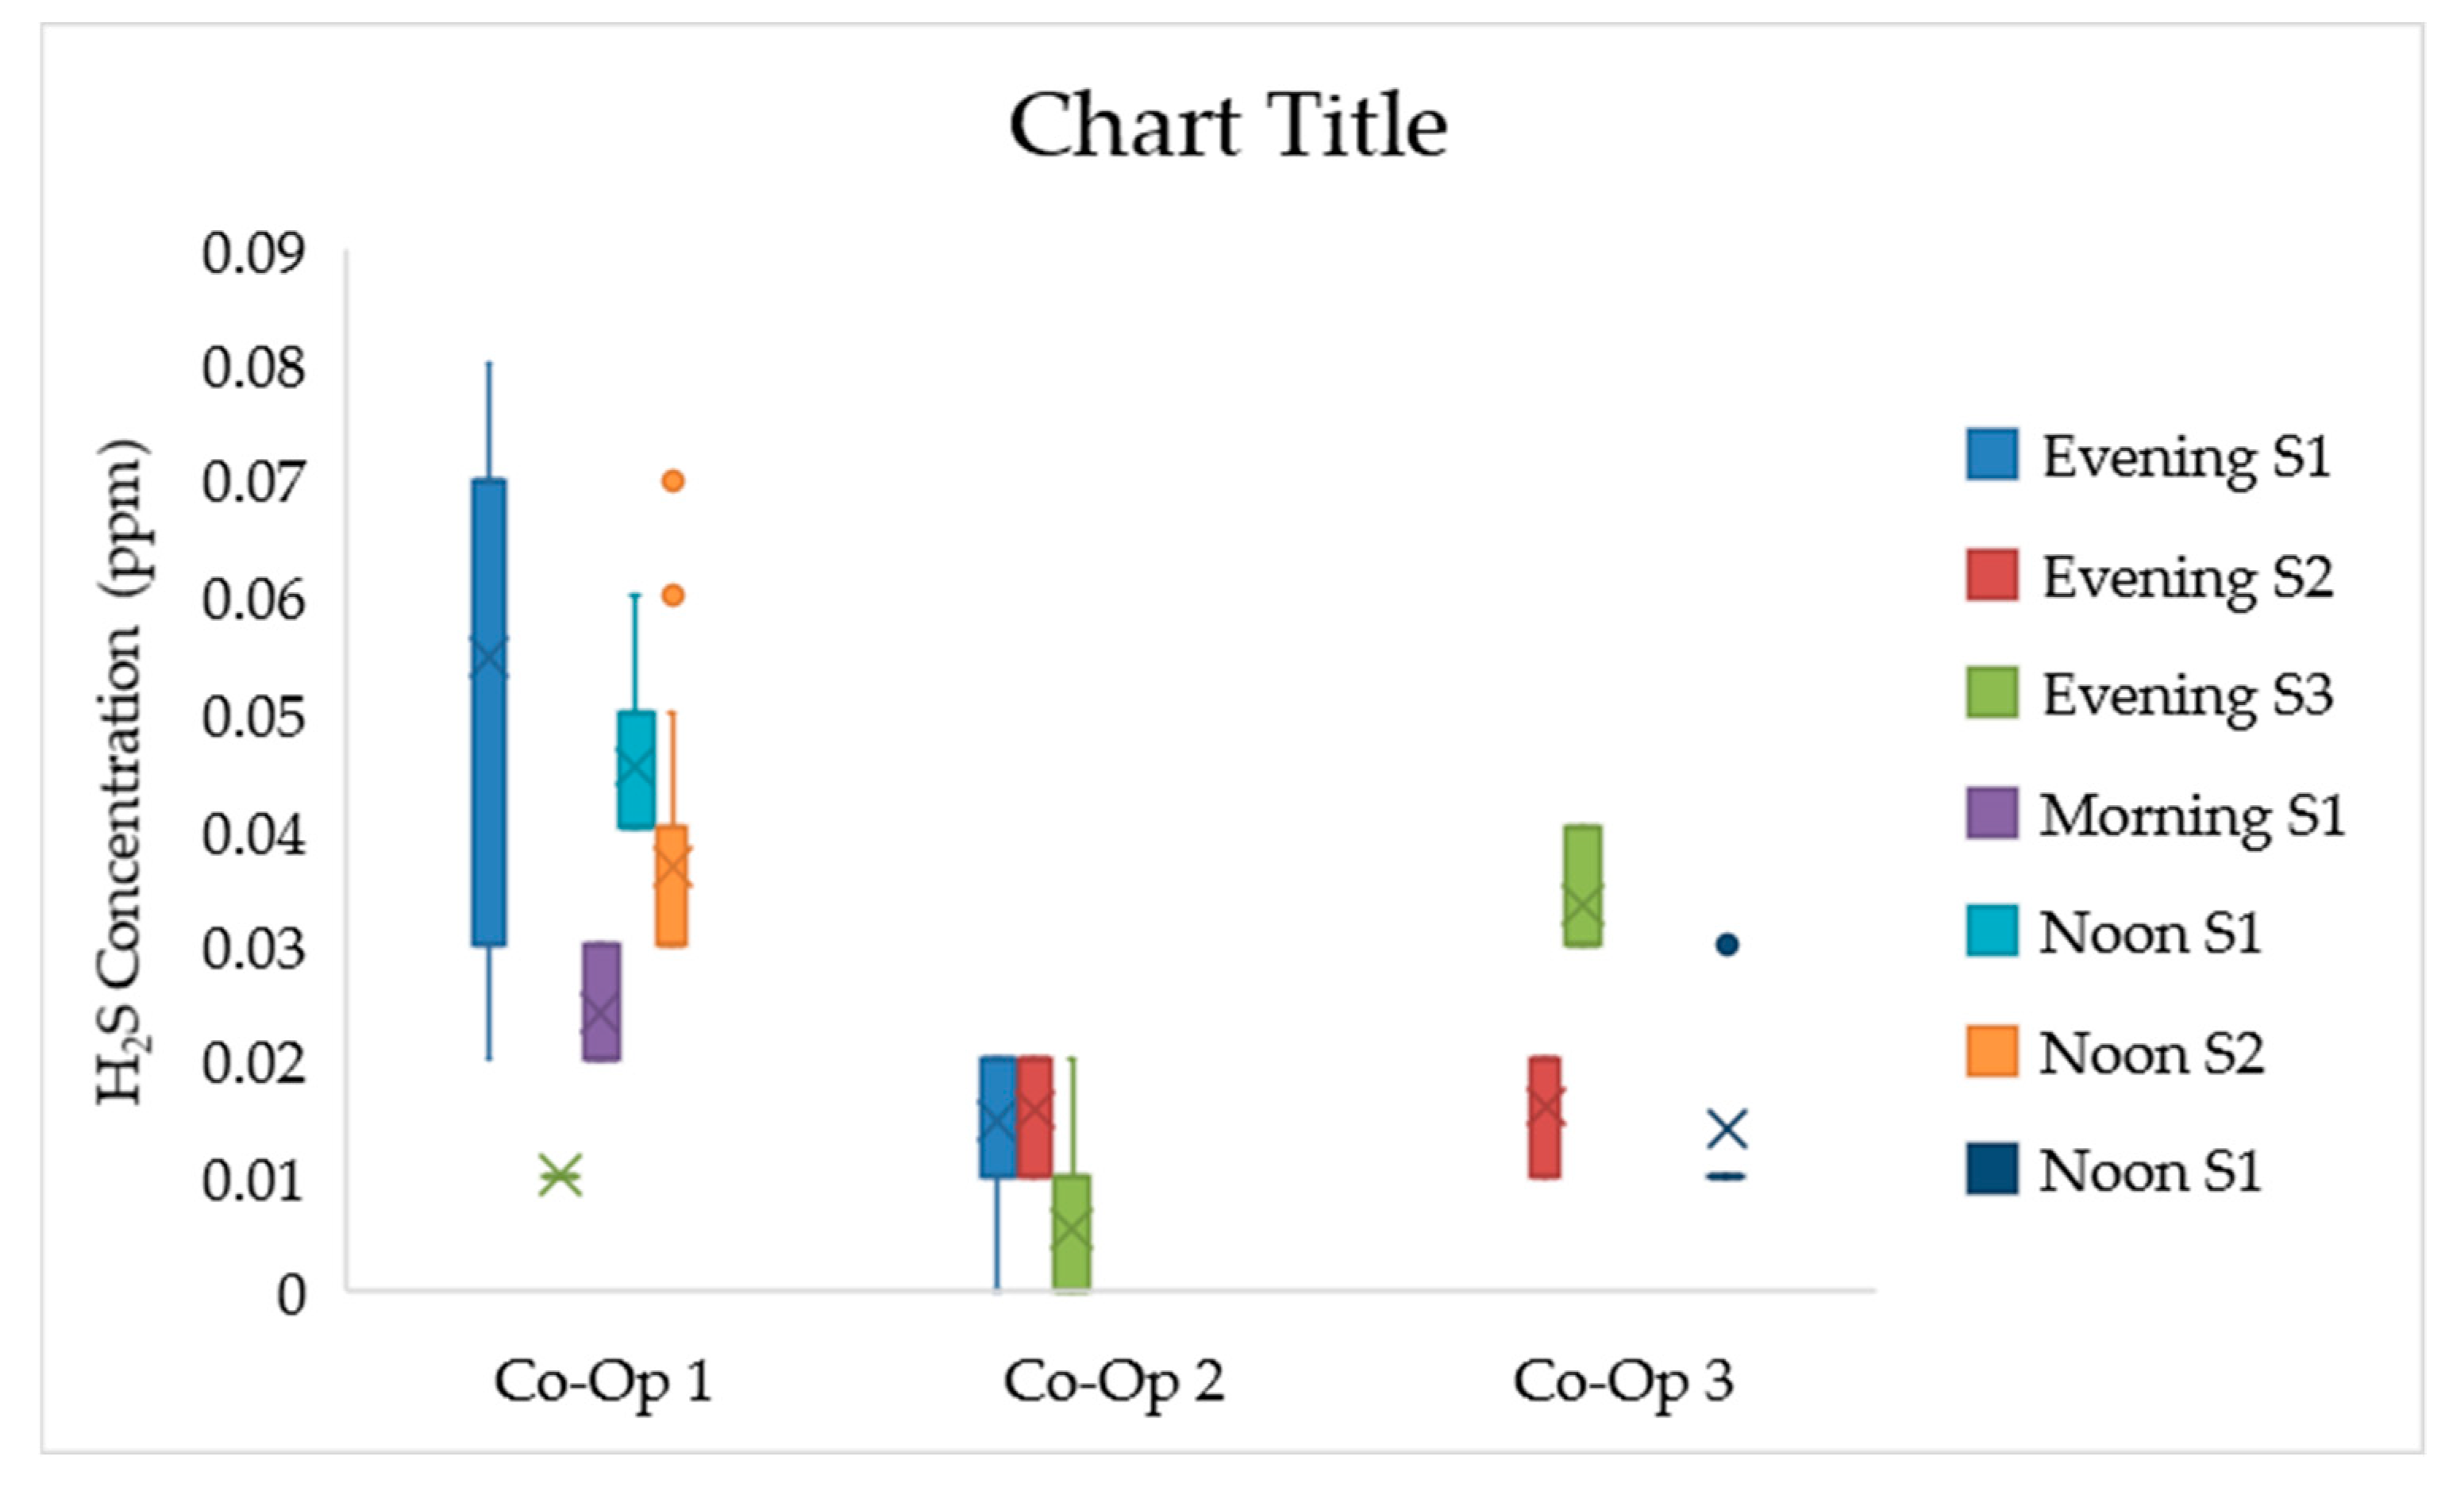
The variation of hydrogen sulfide (H2S) concentration among Co-Ops and different spots for different periods is depicted in Figure 5.
Figure 5 shows that the mean of four measurements exceeded the threshold limit set by CAAQS (averaging period of 1 h) and reached the fifth measurement Co-Op 1, S1 in the morning. Indeed, values of 0.07 and 0.08 of H2S concentration were reached at S1 (Co-Op 1) and S2 (Co-Op 1) respectively. Different indoor hydrogen sulfide concentrations were found in the literature. For example, Reuben et al. [34] found that the average value of hydrogen sulfide in a laboratory building was 5.7 ppm. Zorpas and Skouroupatis [35] documented that the average hydrogen sulfide concentration inside a museum was 0.002 ppm at afternoon. This difference is due the difference in the indoor environment.
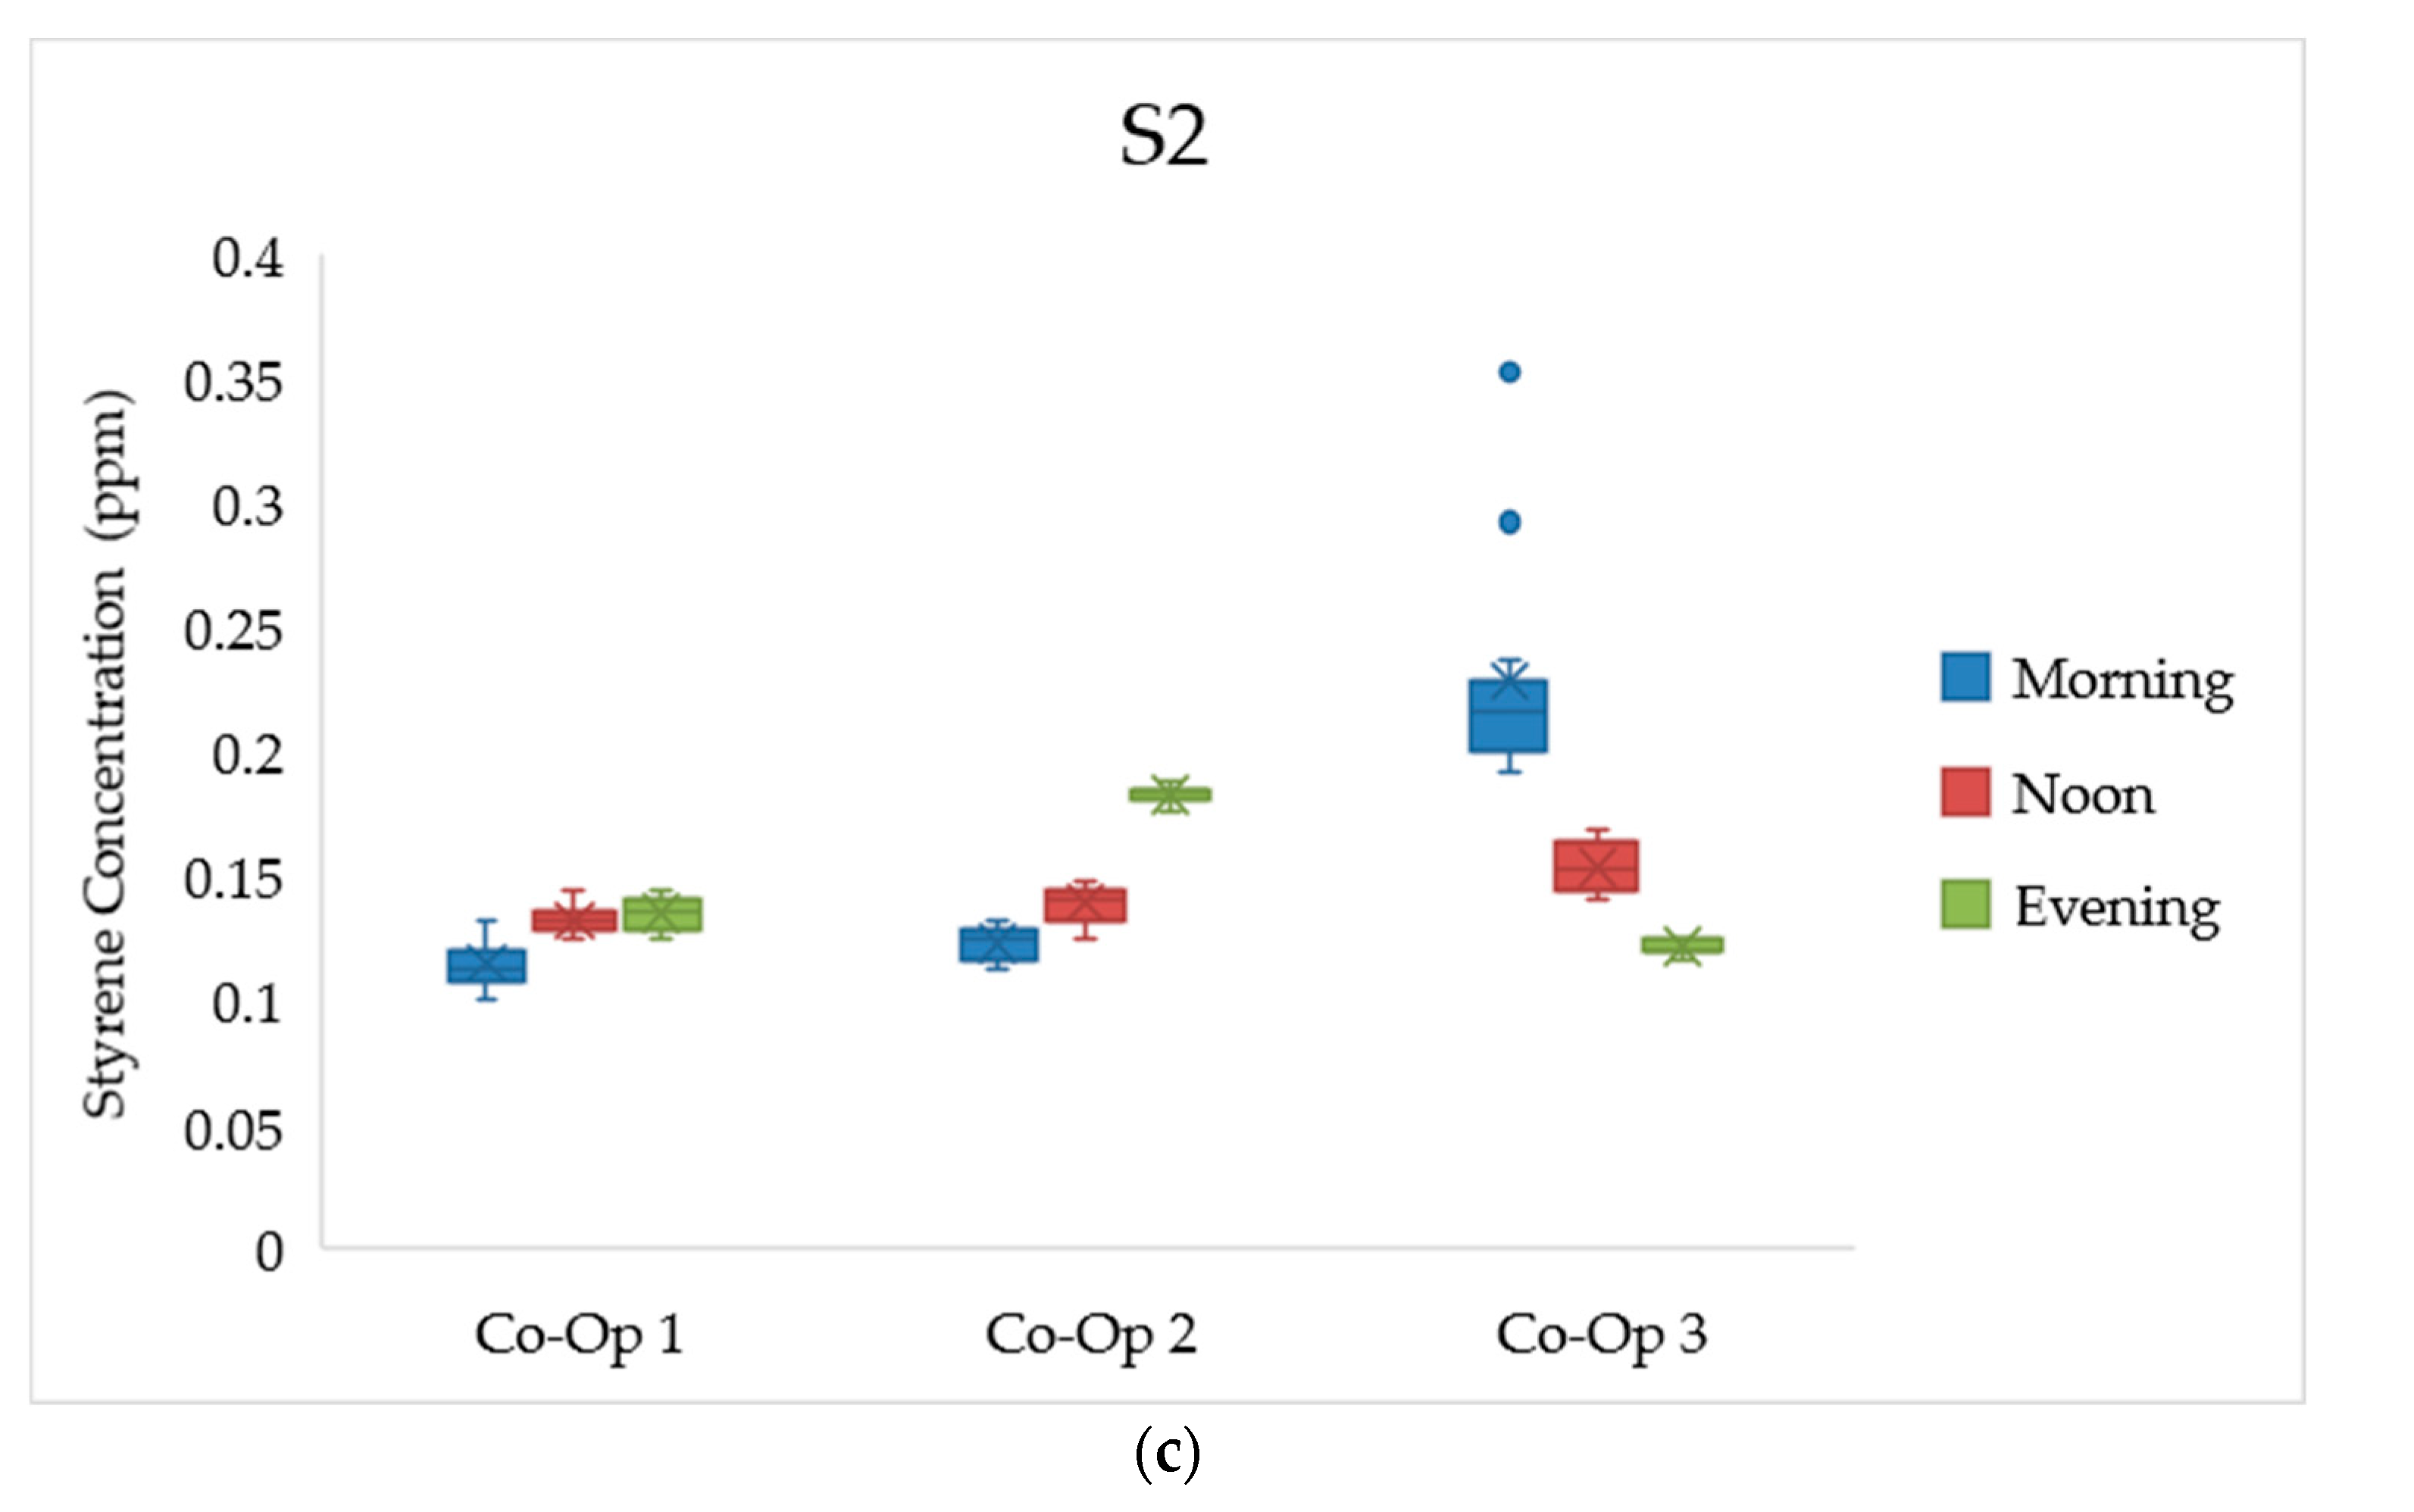
The VOC sensor, type PID, measures a very wide range of VOCs; hence, it can indicate the total VOCs (TVOCs). By multiplying the sensor concentration reading by the corresponding response factor (RF), the resulted required gas (specific compound of VOCs) can be obtained. The RF of benzene (C6H6) and styrene (C8H8) are 0.53 and 0.40, respectively, as stated in the manufacturer’s technical notes. The RF values ranges from 0.40 to 11.0. Besides TVOCs, C6H6 and C8H8 were chosen for VOCs representations for two reasons. Firstly because a smaller RF means that the PID sensor is more sensitive to the compound, which is the case for these two compounds and secondly, because of their hazardous health impact on humans. Figure 6 shows the concentrations of TVOCs, benzene, and styrene.
To present more datasets in different spots, S1, S2, and S3 datasets were presented for benzene, styrene, and TVOCs, respectively, in Figure 6. The mean concentrations of four datasets of benzene exceeded the threshold limit value set by ASHRAE (averaging period of 1 h), as shown in Figure 6b. The maximum value of benzene recorded was 0.254 ppm, which is a very high concentration compared to other datasets. In Figure 6c, no mean value (or maximum) exceeded the threshold limit; however, the morning readings at S2 (Co-Op 3) were the highest comparing to the other datasets. A possible explanation of this high reading of styrene may be due to the presence of photocopier machines in the basement level in Co-Op 3 where the basement level was designed with an opened roof. Photocopier machines are considered as a source for styrene, as stated in the ATSDR public health reports. The highest TVOC concentration recorded by Shang et al. [33] in a mall was 0.23 ppm (0.74 mg/m3), while it was 0.09 ppm (0.31 mg/m3) in a store building [1].
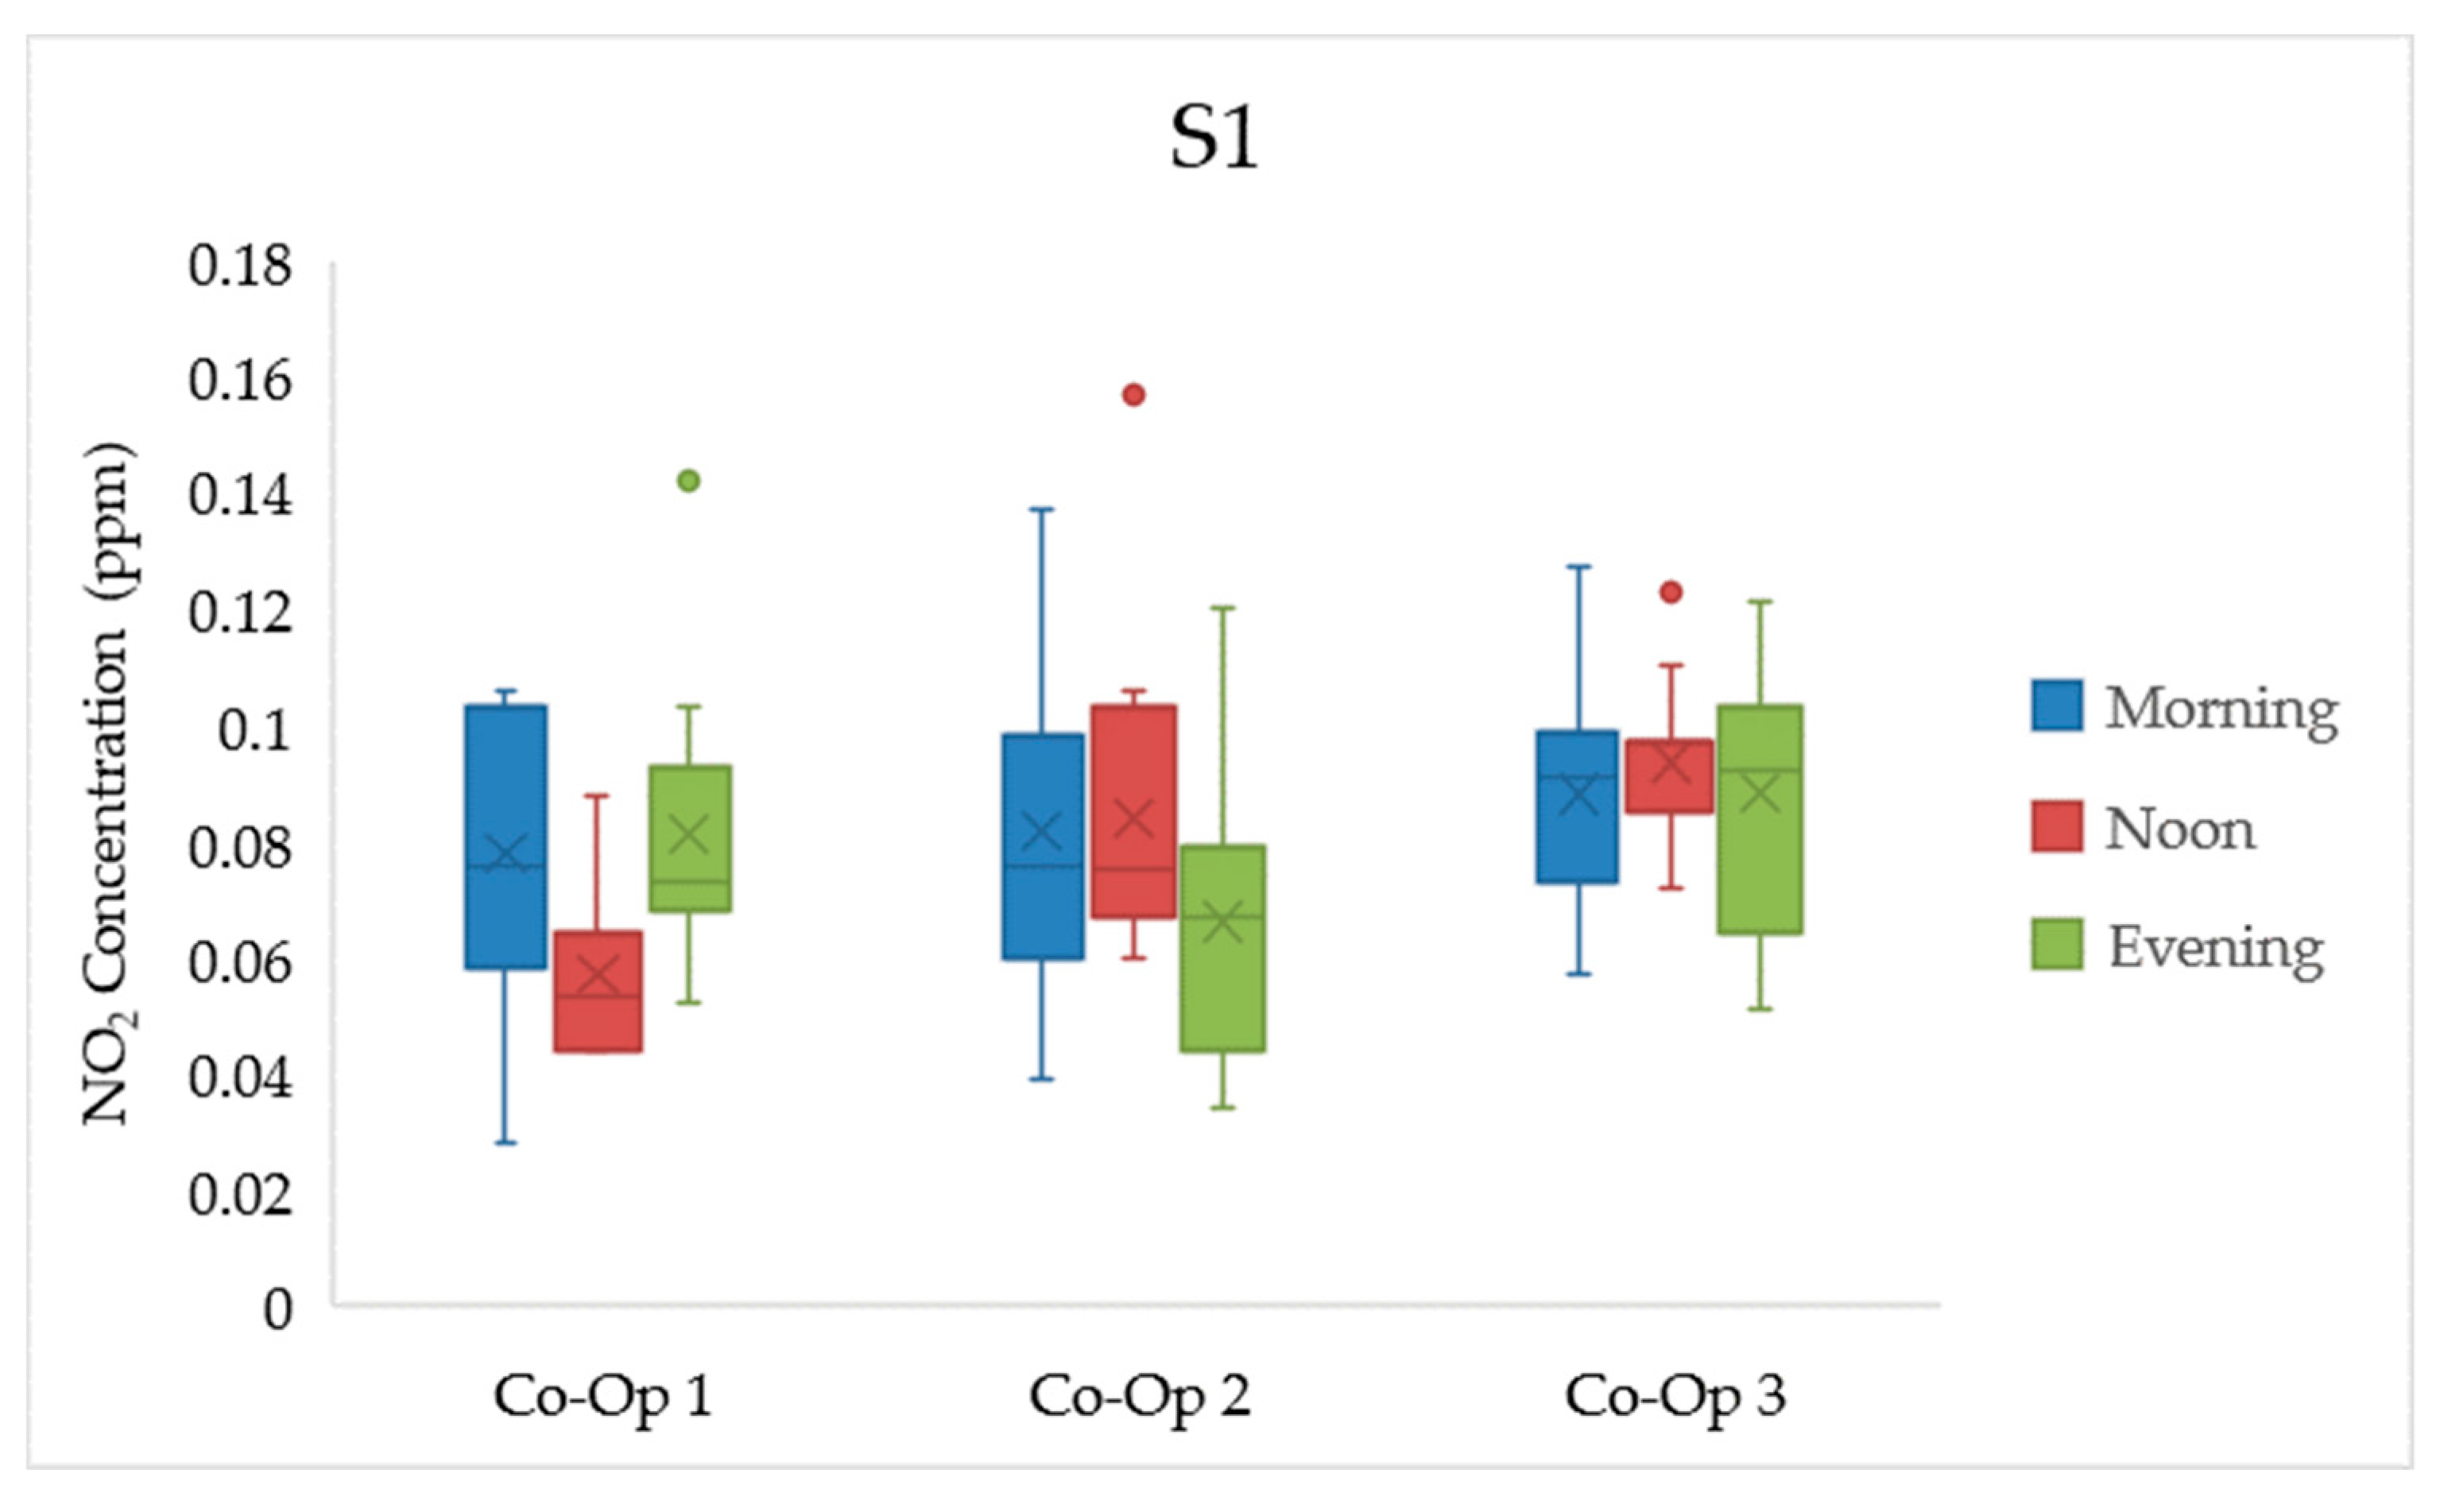
NO2 concentrations are shown in Figure 7.
The dataset shown in Figure 7 reveals that the mean values for all the datasets exceeded the threshold value set by WHO (averaging period of 1 h). This is a critical breach of the indoor air quality standards. A value of 0.10 ppm was recorded in a mall in Thailand [36], and an average NO2 level of 0.23 ppm was found in ice skating facilities around the world [37].
Figure 8 shows the NMHC measurements for S1 for different time periods.
3.2. Indoor Air Quality Index (AQI)
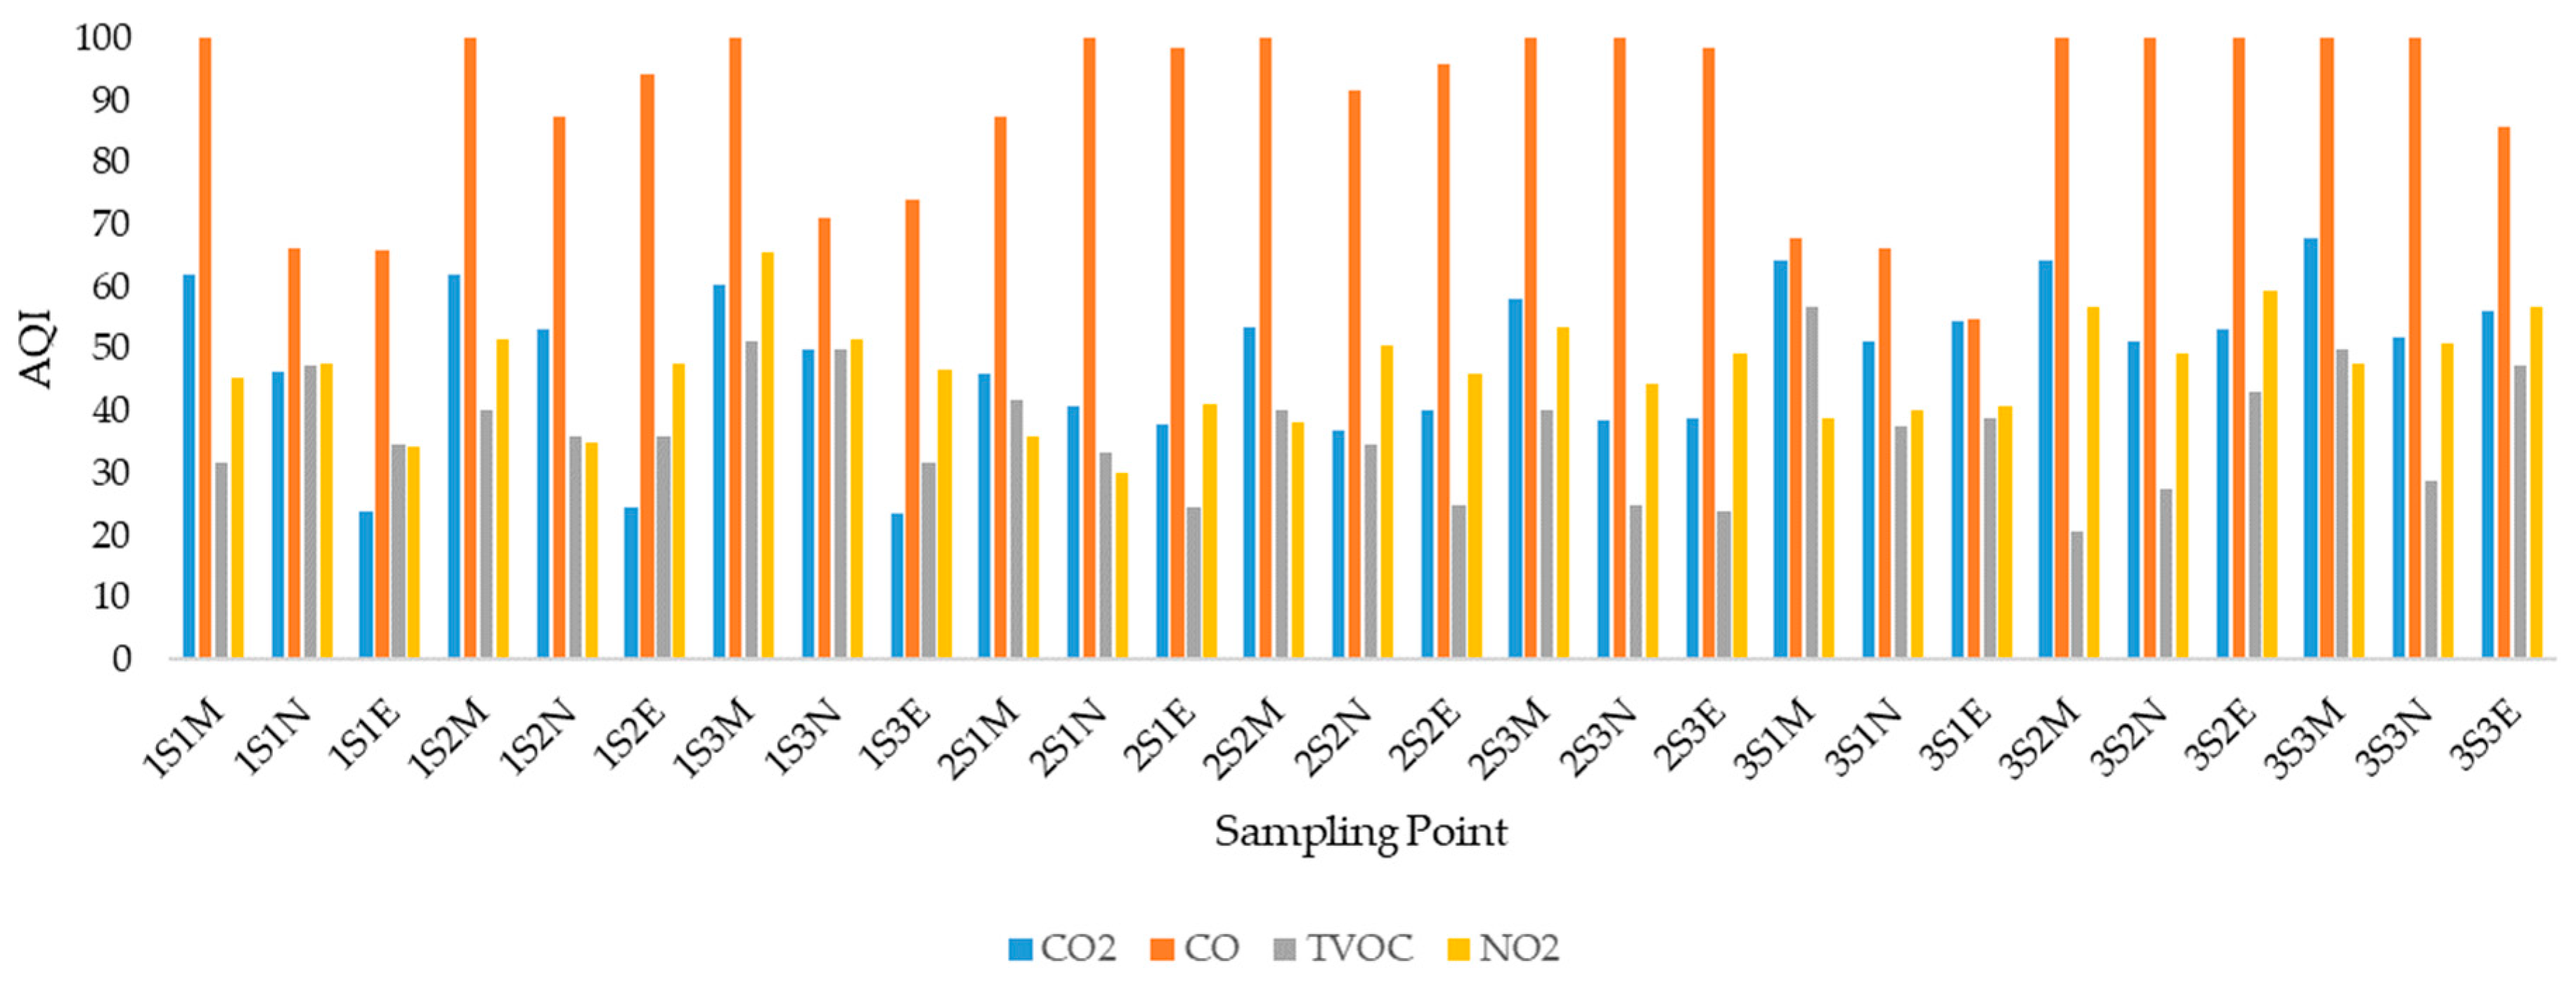
Figure 9 shows the AQI values for 27 sampling points for CO2, CO, VOC, and NO2.
Each sampling point, in Figure 9, has four AQI values corresponding to the mentioned environmental indicators. For CO2, the AQI values of 1S1E, 2S1E, and 3S1E lie in the hazardous category, while nine sampling points’ values are located in the unhealthy category and the rest are located in the moderate category. For TVOCs, the AQI values oscillate between the hazardous category, with five sampling points, and the unhealthy category, with 20 sampling points. Only two sampling points have AQI values that lie in the moderate set. For NO2, nine sampling points are located in the moderate category, while the other are located in the unhealthy category. The AQI values of CO are better compared to the other indicators with five sampling points located in the moderate category while the rest are located in the accepted healthy category.
3.3. Perceived Air Quality (PAQ)
In total, 2475 respondents distributed between the three Co-Ops assessed the air quality using the continuous acceptability scale. Table 6 shows the respondents’ distribution.
The perceived air quality reflects the Sick Building Syndrome (SBS) description. Table 7 shows the standard values of PAQ set by ASHARE in decipol of how the health of a building can be estimated [31]. The higher the standard PAQ value, the worse the health of a building is.
Table 8 shows the parameters values for Co-Op 1, Co-Op 2, and Co-Op 3 in order to determine the PAQ values.
Using Equations (1) and (2), PAQ values can be obtained. Table 9 shows the calculated values of PAQ for Co-Op1, Co-Op 2, and Co-Op 3. To investigate the reasons behind the difference in PAQ values in Table 9, the average concentration of each pollutant is documented against the PAQ for each Co-Op and presented in Table 9. The findings in Table 9 suggest that there is a positive correlation between PAQ and CO2/H2S levels. Shang et al. [33] conducted a questionnaire study at four malls in China and found that the score of air quality was near neutral: neither satisfied nor dissatisfied. In this study, the source of dissatisfaction may be correlated with the high level of carbon dioxide and/or the presence of hydrogen sulfide; hence, the correlation between CO2/H2S concentration and PAQ is examined further and expressed in Figure 10a,b.
As Figure 10 indicates, as CO2 and H2S concentrations rise, PAQ values rise too.
3.4. Correlations
Means and intercorrelations for pollutant in Co-Op 1, S1, evening are shown on Table 10.
The correlation matrix on Table 10 shows the association between the environmental indicators. For the given sampling point in Table 10, positive and significant relationships were found between CO2 and the other indicators, except for NO2. On the other hand, for the given site, carbon monoxide correlates well with carbon dioxide and hydrogen disulfide.
3.5. Indoor/Outdoor Regression
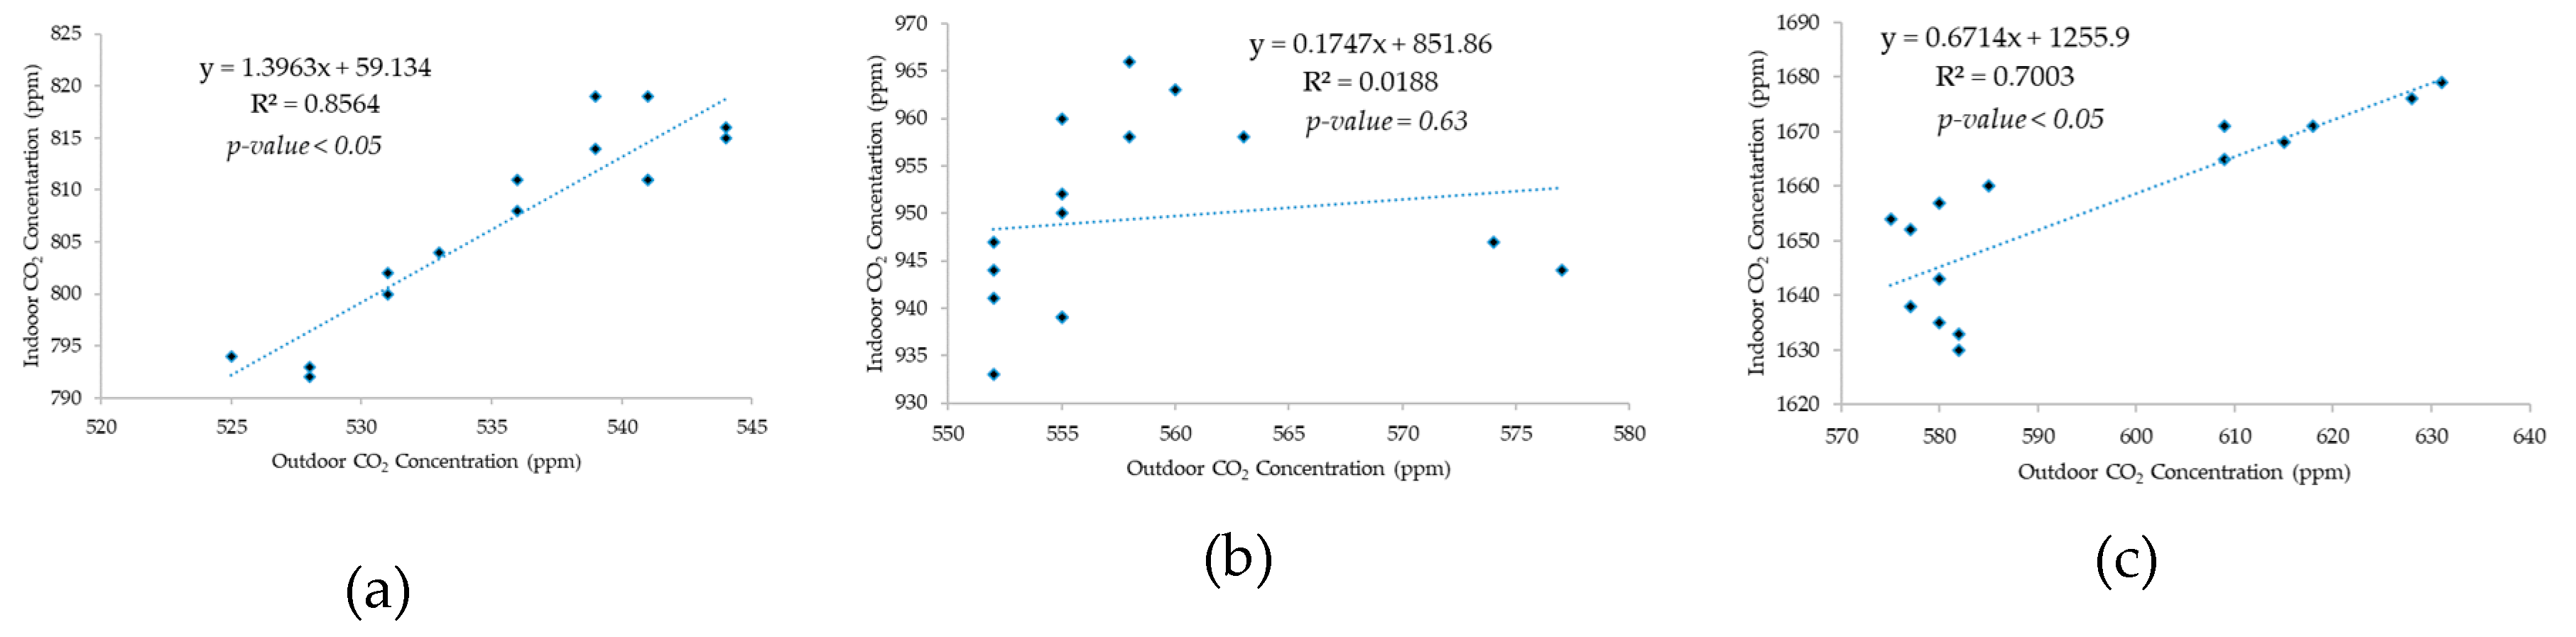
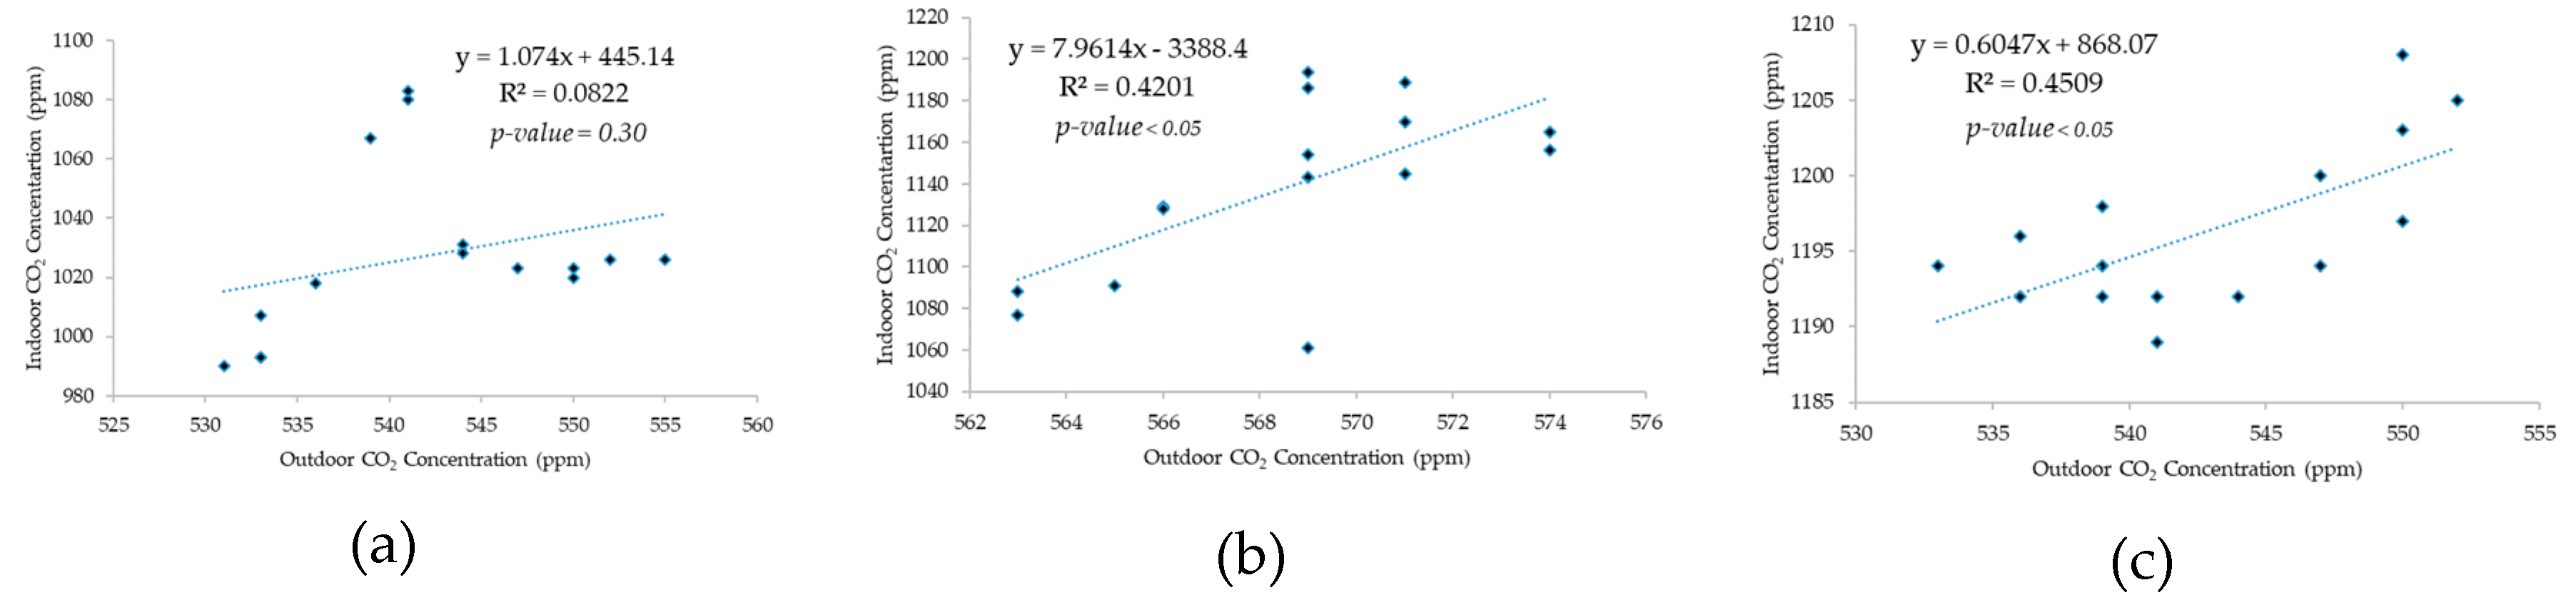
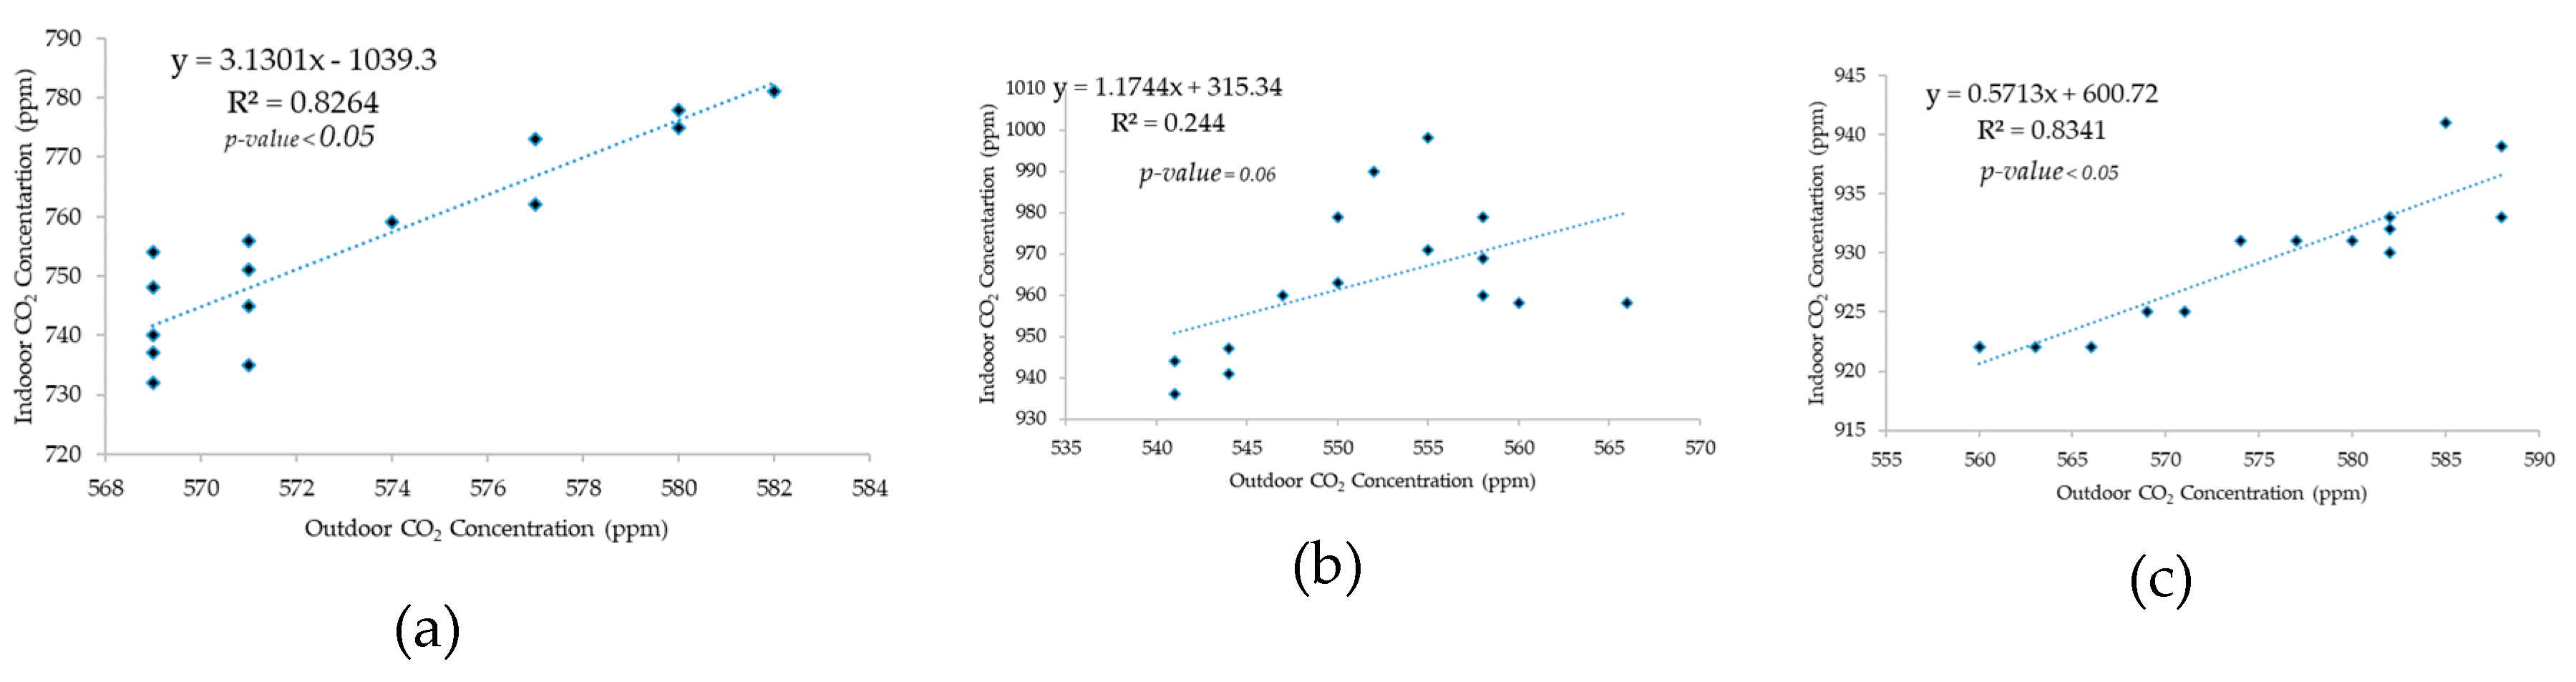
The CO2 outdoor-indoor regressions are plotted in Figure 11, Figure 12 and Figure 13 for Co-Op 1, 2, and 3 respectively, for (a): morning, (b): noon, and (c): evening.
The results reveal that for each Co-Op, there are two times where the indoor and outdoor concentrations are significantly correlated. For Co-Op 1, in the morning and in the evening, the correlation was depicted with R2 values of 0.8564 and 0.7003, as shown in Figure 11a,c respectively. For Co-Op 2, a correlation exists at noon and in the evening, with R2 values of 0.4201 and 0.4509, as presented in Figure 12b,c, respectively. For Co-Op 3, the correlation was noted in the morning and the evening, with R2 values of 0.8264 and 0.8341, as presented in Figure 13a,c respectively. Although the correlation between indoor and outdoor CO2 levels can imply the outdoor contribution as the source of the indoor levels, the difference between indoor/outdoor CO2 concentrations is an indication that indoor carbon dioxide levels were attributable to other sources than the atmospheric source.
4. Conclusions
This study examined the quality of the indoor air environment of Co-Ops supermarkets in Kuwait based on investigation of CO2, CO, NO2, H2S, TVOCs, and NMHC as environmental parameters. The on-site measurements revealed that most of the tested environmental parameters had exceeded the threshold limits set by the environmental agencies and organizations. The CO2 average measurements were remarkable, with 1630 ppm for the three spots in Co-Op 1 for the evening period, and it was 1220 ppm in Co-Op 2 for the same timing. In Co-Op 3, the CO2 readings comparing to the other Co-Ops were better, although they touched the 1000 pm limit concentrations, with an average of 930 ppm. The morning readings of CO2 for all the spots in all Co-Ops were lower than those of the noon and evening readings. Compared to the other pollutants, carbon dioxide, especially for Co-Op 1 and Co-Op 2, seriously breached the threshold limits, reaching 50% above the allowable limits at some locations. The persistent high limit of carbon dioxide needs further investigation. On the other hand, CO concentrations were acceptable, despite reaching almost half of the threshold limits, specifically for morning and evening reading for Co-Op 1 and 2. For the VOC readings, they exceeded the threshold limits in all Co-Ops for all the periods and at all the spots. The same breach was also detected with NO2 readings for Co-Op 1 (S1 and S3), Co-Op 2 (S1 and S2), and Co-Op 3 (S1). The H2S readings were not exempt from rupturing the environmental safety limits, since it exceeded the threshold limits in Co-Op 1 (S1 and S2), Co-Op 2 (S1), and Co-Op 3 (S1 and S3). The average period of the guideline source of CO, NO2, H2S, and TVOCs was one hour.
The calculated perceived air quality (PAQ) values for each Co-Op match the corresponding CO2 and H2S concentrations in these Co-Ops. Moreover, the PAQ values are aligned with the IAQ values for CO2 concentrations when comparing Co-Op 1 and Co-Op 3, and Co-Op 2 and Co-Op 3. This finding clarifies the importance of CO2 concentration as a quick indicator to human bioeffluents, as it compensates for the difference between the indoor to outdoor CO2 concentrations.
The existing correlation between the indoor pollutants is evidence of the complexity of the indoor air environment.
Author Contributions
A.A. (Azel Almutairi): conceptualization, methodology, data collection, and writing—original draft preparation. A.A. (Abdullah Alsanad): conceptualization, data curation, writing—review and editing. H.A.: data analysis and reviewing.
Conflicts of Interest
The authors declare no conflict of interest.
References
- Cheng, L.; Li, B.; Cheng, Q.; Baldwin, A.N.; Shang, Y. Investigations of indoor air quality of large department store buildings in China based on field measurements. Build. Environ. 2017, 118, 128–143. [Google Scholar] [CrossRef]
- De Robles, D.; Kramer, S.W. Improving Indoor Air Quality through the Use of Ultraviolet Technology in Commercial Buildings. Procedia Eng. 2017, 196, 888–894. [Google Scholar] [CrossRef]
- Guo, P.; Yokoyama, K.; Piao, F.; Sakai, K.; Khalequzzaman, M.; Kamijima, M.; Nakajima, T.; Kitamura, F. Sick building syndrome by indoor air pollution in Dalian, China. Int. J. Environ. Res. Public Health 2013, 10, 1489–1504. [Google Scholar] [CrossRef] [PubMed]
- Kishi, R.; Ketema, R.M.; Bamai, Y.A.; Araki, A.; Kawai, T.; Tsuboi, T.; Saito, I.; Yoshioka, E.; Saito, T. Indoor environmental pollutants and their association with sick house syndrome among adults and children in elementary school. Build. Environ. 2018, 136, 293–301. [Google Scholar] [CrossRef]
- Takigawa, T.; Saijo, Y.; Morimoto, K.; Nakayama, K.; Shibata, E.; Tanaka, M.; Yoshimura, T.; Chikara, H.; Kishi, R. A longitudinal study of aldehydes and volatile organic compounds associated with subjective symptoms related to sick building syndrome in new dwellings in Japan. Sci. Total Environ. 2012, 417–418, 61–67. [Google Scholar] [CrossRef] [PubMed]
- Guzman, J.A. Carbon monoxide Poisoning. Crit. Care Clin. 2012, 28, 537–548. [Google Scholar] [CrossRef] [PubMed]
- Raub, J.A.; Mathieu-Nolf, M.; Hampson, N.B.; Thom, S.R. Carbon monoxide poisoning—A public health perspective. Toxicology 2000, 145, 1–14. [Google Scholar] [CrossRef]
- Hess, D.R. Inhaled carbon monoxide: From toxin to therapy. Respir. Care 2017, 62, 1333–1342. [Google Scholar] [CrossRef] [PubMed]
- Billionnet, C.; Gay, E.; Kirchner, S.; Leynaert, B.; Annesi-Maesano, I. Quantitative assessments of indoor air pollution and respiratory health in a population-based sample of French dwellings. Environ. Res. 2011, 111, 425–434. [Google Scholar] [CrossRef]
- Agency for Toxic Substances and Disease Registry. Toxicological Profile of Hydrogen Sulfide. Available online: https://www.atsdr.cdc.gov/ToxProfiles/tp.asp?id=389&tid=67 (accessed on 19 October 2019).
- Agency for Toxic Substances and Disease Registry. Toxicological Profile of Nitrogen Oxides. Available online: https://www.atsdr.cdc.gov/toxfaqs/tf.asp?id=396&tid=69 (accessed on 19 October 2019).
- Fanger, P.O. Introduction of the olf and the decipol units to quantify air pollution perceived by humans indoors and outdoors. Energy Build. 1988, 12, 1–6. [Google Scholar] [CrossRef]
- Sakellaris, I.A.; Saraga, D.E.; Mandin, C.; Roda, C.; Fossati, S.; de Kluizenaar, Y.; Carrer, P.; Dimitroulopoulou, S.; Mihucz, V.G.; Szigeti, T.; et al. Perceived Indoor Environment and Occupants’ Comfort in European ‘Modern’ Office Buildings: The OFFICAIR Study. Int. J. Environ. Res. Public Health 2016, 13, 444. [Google Scholar] [CrossRef] [PubMed]
- EPA-US. Guidelines for the Reporting of Daily Air Quality—The Air Quality Index (AQI); EPA-US: Sacramento, CA, USA, 2006.
- Saad, S.M.; Shakaff, A.Y.M.; Saad, A.R.M.; Yusof, A.M.; Andrew, A.M.; Zakaria, A.; Adom, A.H. Development of indoor environmental index: Air quality index and thermal comfort index. AIP Conf. Proc. 2017, 1808, 020043. [Google Scholar]
- Wang, H. Developing an indoor air quality index system based on the health risk assessment. In Proceedings of the 11th International Conference on Air Quality and Climate, Barcelona, Spain, 12–16 March 2018; pp. 17–22. [Google Scholar]
- Aeroqual. What’s Best for Measuring Ozone, Electrochemical Sensors or HMOS? 2016. Available online: https://www.aeroqual.com/electrochemical-sensors-hmos (accessed on 20 October 2019).
- Minet, L.; Gehr, R.; Hatzopoulou, M. Capturing the sensitivity of land-use regression models to short-term mobile monitoring campaigns using air pollution micro-sensors. Environ. Pollut. 2017, 230, 280–290. [Google Scholar] [CrossRef] [PubMed]
- Spinelle, L.; Gerboles, M.; Kok, G.; Persijn, S.; Sauerwald, T. Review of portable and low-cost sensors for the ambient air monitoring of benzene and other volatile organic compounds. Sensors 2017, 17, 1520. [Google Scholar] [CrossRef]
- Schütze, A.; Baur, T.; Leidinger, M.; Reimringer, W.; Jung, R.; Conrad, T.; Sauerwald, T. Highly Sensitive and Selective VOC Sensor Systems Based on Semiconductor Gas Sensors: How to? Environments 2017, 4, 20. [Google Scholar] [CrossRef]
- Peterson, P.J.D.; Aujla, A.; Grant, K.H.; Brundle, A.G.; Thompson, M.R.; Vande Hey, J.; Leigh, R.J. Practical use of metal oxide semiconductor gas sensors for measuring nitrogen dioxide and ozone in urban environments. Sensors 2017, 17, 1653. [Google Scholar] [CrossRef]
- Szulczyński, B.; Gębicki, J. Currently Commercially Available Chemical Sensors Employed for Detection of Volatile Organic Compounds in Outdoor and Indoor Air. Environments 2017, 4, 21. [Google Scholar] [CrossRef]
- Cheung, P.K.; Jim, C.Y. Impacts of air conditioning on air quality in tiny homes in Hong Kong. Sci. Total Environ. 2019, 684, 434–444. [Google Scholar] [CrossRef]
- Karmakar, D.; Ghosh, T.; Padhy, P.K. Effects of air pollution on carbon sequestration potential in two tropical forests of West Bengal, India. Ecol. Indic. 2019, 98, 377–388. [Google Scholar] [CrossRef]
- Miskell, G.; Alberti, K.; Feenstra, B.; Henshaw, G.S.; Papapostolou, V.; Patel, H.; Polidori, A.; Salmond, J.A.; Weissert, L.F.; Williams, D.E. Reliable data from low cost ozone sensors in a hierarchical network. Atmos. Environ. 2019, 214, 116870. [Google Scholar] [CrossRef]
- Huang, J.; Song, Y.; Chu, M.; Dong, W.; Miller, M.R.; Loh, M.; Xu, J.; Yang, D.; Chi, R.; Yang, X.; et al. Cardiorespiratory responses to low-level ozone exposure: The inDoor Ozone Study in childrEn (DOSE). Environ. Int. 2019, 131, 105021. [Google Scholar] [CrossRef] [PubMed]
- Masiol, M.; Squizzato, S.; Chalupa, D.; Rich, D.Q.; Hopke, P.K. Spatial-temporal variations of summertime ozone concentrations across a metropolitan area using a network of low-cost monitors to develop 24 hourly land-use regression models. Sci. Total Environ. 2019, 654, 1167–1178. [Google Scholar] [CrossRef] [PubMed]
- Lin, C.; Gillespie, J.; Schuder, M.D.; Duberstein, W.; Beverland, I.J.; Heal, M.R. Evaluation and calibration of Aeroqual series 500 portable gas sensors for accurate measurement of ambient ozone and nitrogen dioxide. Atmos. Environ. 2015, 100, 111–116. [Google Scholar] [CrossRef]
- Parkinson, T.; Parkinson, A.; de Dear, R. Continuous IEQ monitoring system: Performance specifications and thermal comfort classification. Build. Environ. 2019, 149, 241–252. [Google Scholar] [CrossRef]
- Al-Hemoud, A.; Al-Awadi, L.; Al-Khayat, A.; Behbehani, W. Streamlining IAQ guidelines and investigating the effect of door opening/closing on concentrations of VOCs, formaldehyde, and NO2 in office buildings. Build. Environ. 2018, 137, 127–137. [Google Scholar] [CrossRef]
- ASHRAE. Standard 62.1-Ventilation for Acceptable Indoor Air Quality; ASHRAE: New York, NY, USA, 2016. [Google Scholar]
- EPA-Kuwait. Rules and Regulations—Standards; EPA-Kuwait: Kuwait City, Kuwait, 2014.
- Shang, Y.; Li, B.; Baldwin, A.N.; Ding, Y.; Yu, W.; Cheng, L. Investigation of indoor air quality in shopping malls during summer in Western China using subjective survey and field measurement. Build. Environ. 2016, 108, 1–11. [Google Scholar] [CrossRef]
- Reuben, U.; Ismail, A.F.; Ahmad, A.L.; Maina, H.M.; Daud, A. Indoor Air Quality and Sick Building Syndrome Among Nigerian Laboratory University Workers. J. Phys. Sci. 2019, 30, 179–195. [Google Scholar] [CrossRef]
- Zorpas, A.A.; Skouroupatis, A. Indoor air quality evaluation of two museums in a subtropical climate conditions. Sustain. Cities Soc. 2016, 20, 52–60. [Google Scholar] [CrossRef]
- Klinmalee, A.; Srimongkol, K.; Oanh, N.T.K. Indoor air pollution levels in public buildings in Thailand and exposure assessment. Environ. Monit. Assess. 2009, 156, 581–594. [Google Scholar] [CrossRef]
- Brauer, M.; Lee, K.; Spengler, J.D.; Salonen, R.O.; Pennanen, A.; Braathen, O.A.; Mihalikova, E.; Miskovic, P.; Nozaki, A.; Tsuzuki, T.; et al. Nitrogen Dioxide in Indoor Ice Skating Facilities: An International Survey. J. Air Waste Manag. Assoc. 1997, 47, 1095–1102. [Google Scholar] [CrossRef]
- Tang, J.H.; Chan, L.Y.; Chang, C.C.; Liu, S.; Li, Y.S. Characteristics and sources of non-methane hydrocarbons in background atmospheres of eastern, southwestern, and southern China. J. Geophys. Res. 2009, 114. [Google Scholar] [CrossRef] [Green Version]
- Cashman, J. International Chemical Safety Cards. Emergency Response Handbook for Chemical and Biological Agents and Weapons, 2nd ed.; CRC Press: Boca Raton, FL, USA, 2008; Available online: http://www.ilo.org/dyn/icsc/showcard.listCards3 (accessed on 20 September 2019).
Figure 1.
The geographical locations of the Co-Ops under study.

Figure 2.
CO2 concentration for all Co-Ops, spot S1, S2, and S3: (a) Morning; (b) Noon; (c) Evening.
Figure 2.
CO2 concentration for all Co-Ops, spot S1, S2, and S3: (a) Morning; (b) Noon; (c) Evening.

Figure 3.
CO2 concentration for Co-Op 1, S1.

Figure 4.
CO concentration for all the Co-Ops, spot S1, S2, and S3 for: (a) morning, (b) noon, and (c) evening.
Figure 4.
CO concentration for all the Co-Ops, spot S1, S2, and S3 for: (a) morning, (b) noon, and (c) evening.


Figure 5.
The H2S concentration for Co-Ops, spot S1, S2, and S3 for the morning, noon, and evening periods.
Figure 5.
The H2S concentration for Co-Ops, spot S1, S2, and S3 for the morning, noon, and evening periods.

Figure 6.
The volatile organic compounds concentration: (a) TVOCs in spot S3; (b) benzene in spot S1; (c) styrene in spot S2.
Figure 6.
The volatile organic compounds concentration: (a) TVOCs in spot S3; (b) benzene in spot S1; (c) styrene in spot S2.


Figure 7.
NO2 concentrations in S1 for several time periods.

Figure 8.
NMHC concentrations for S1 for different time periods.

Figure 9.
Indoor AQI for CO2, CO, VOC, and NO2 for 27 sampling points. (The sampling name format is as follows: the first number indicates the Co-Op number, S is the spot location, M = morning, N = noon, and E = evening; for example, 2S3M = Co-Op 2, Spot 3, morning).
Figure 9.
Indoor AQI for CO2, CO, VOC, and NO2 for 27 sampling points. (The sampling name format is as follows: the first number indicates the Co-Op number, S is the spot location, M = morning, N = noon, and E = evening; for example, 2S3M = Co-Op 2, Spot 3, morning).

Figure 10.
Correlation of PAQ to the average CO2 concentration (a) and the average H2S concentration (b).
Figure 10.
Correlation of PAQ to the average CO2 concentration (a) and the average H2S concentration (b).

Figure 11.
The outdoor-indoor regression of CO2 for Co-Op 1: (a) morning; (b) noon; (c) evening.

Figure 12.
The outdoor-indoor regression of CO2 for Co-Op 2: (a) morning; (b) noon; (c) evening.

Figure 13.
The outdoor-indoor regression of CO2 for Co-Op 3: (a) morning; (b) noon; (c) evening.


Table 1.
The main characteristics of the residential areas.
| Residential Area | Population 1 | Female | Male |
|---|---|---|---|
| 1, Adailia | 21636 | 11292 | 10344 |
| 2, Qurtoba | 33691 | 17748 | 15943 |
| 3, Khaldia | 19193 | 9928 | 9265 |
1 Residential area population. All the population’s data are from PACI.
Table 2.
The main characteristics of the Co-Ops.
| Co-Op 1 | Co-Op 2 | Co-Op 3 | |
|---|---|---|---|
| Number of shareholders | 7811 | 6000 | 6868 |
| Building Establishment | 1980 | 1992 | 2008 |
| Type of ventilation | Mechanical Natural | Mechanical | Mechanical |
| Area, m2 | 2850 | 2869 | 3500 |
| Floor Level | 2 (Ground and Upper floor) | 2 (Ground and Upper floor) | 3 (Basement, Ground, and Upper floor) |
| Distance from the main door to the parking lot (m) | 2.5 | 20.5 | 21.7 |
| Floor levels transportation | Elevator Escalator | Elevator Escalator | Elevator Escalator |
| Parking Bays | 2 | 3 | 2 |
Table 3.
Sensor specifications.
| Sensor | Type | Range (ppm) | Minimum Detection Limit (ppm) | Accuracy of Factory Calibration |
|---|---|---|---|---|
| CO2 | NDIR | 0–2000 | 10 | < ± 10 ppm + 5% |
| CO | GSE | 0–100 | 0.2 | < ± 10% |
| NO2 | GSE | 0–1 | 0.005 | < ± 0.02 ppm |
| H2S | GSE | 0–10 | 0.04 | < ± 0.05 ppm |
| TVOC | PID | 0–20 | 0.01 | < ± 0.02 ppm + 10% |
| NMHC | GSS | 0–25 | 0.1 | < ± 0.1 ppm + 10% |
Table 4.
Indoor Air Quality (IAQ) pollutant values recommended guidelines.
| Pollutant | Standard (ppm) | Averaging Period | Organization | Ref. |
|---|---|---|---|---|
| CO2 | 1000 | - | ASHRAE | [31] |
| 1000 | - | Norway IAQ Regulations | ||
| 1000 | - | Portugal IAQ Regulations | ||
| CO | 8.732 6.110 | 8 h Daily Max. | WHO | |
| 8.732 | 8 h | EPA-KW 1 | [32] | |
| 2.620 | - | Lithuania IAQ Regulations | ||
| 5.240 | 30 min | Romania IAQ Regulations | ||
| NO2 | 0.053 0.250 | 1 y 24 h | ASHRAE | [31] |
| 0.106 0.021 | 1 h 1 y | WHO | ||
| 0.106 | 1 h | EPA-KW | ||
| 0.053 | 1 h | Norway IAQ Regulations | ||
| H2S | 0.030 | 1 h | CAAQS | |
| TVOCs | 0.166 (As Acetaldehyde) | 8 h | ASHRAE | [31] |
| 0.189 (As Benzene) | 1 h | ASHRAE | [31] | |
| NMHC | - | - | - |
1 Environmental Protection Authority–Kuwait.
Table 5.
AQI breakpoint categories given by [15].
Table 5.
AQI breakpoint categories given by [15].
| Level of Health Concern | AQI | CO2 (ppm) | CO (ppm) | NO2 (ppm) | VOC (ppm) |
|---|---|---|---|---|---|
| Good | 100–76 | 340–600 | 0.0–1.7 | 0.000–0.021 | 0.000–0.087 |
| Moderate | 75–51 | 601–1000 | 1.8–8.7 | 0.022–0.080 | 0.088–0.261 |
| Unhealthy | 50–26 | 1001–1500 | 8.8–10 | 0.090–0.170 | 0.262–0.430 |
| Hazardous | 25–0 | 1501–5000 | 10.1–50 | 0.180–5.000 | 0.440–3.000 |
Table 6.
Continuous acceptability scale respondents among Co-Ops.
| Co-Op 1 | Co-Op 2 | Co-Op 3 | Total | |
|---|---|---|---|---|
| Number of Respondents | 924 | 746 | 805 | 2475 |
Table 7.
The standard values of perceived air quality (PAQ) by ASHARE.
| Decipol | Air Quality |
|---|---|
| 10 | Sick Building |
| 1 | Healthy Building |
| 0.1 | Town Outdoor Air |
| 0.01 | Mountainous Area Outdoor Air |
Table 8.
PAQ questionnaire parameters results for Co-Op 1.
| Co-Op 1 | No. | Recorded Scores | Number of People | Percentage % | ACC 1 |
|---|---|---|---|---|---|
| 1 | 1 | 63 | 6.82 | 0.068 | |
| 2 | 0.9 | 37 | 4.00 | 0.036 | |
| 3 | 0.8 | 85 | 9.20 | 0.074 | |
| 4 | 0.7 | 61 | 6.60 | 0.046 | |
| 5 | 0.6 | 42 | 4.55 | 0.027 | |
| 6 | 0.5 | 60 | 6.49 | 0.032 | |
| 7 | 0.4 | 38 | 4.11 | 0.016 | |
| 8 | 0.3 | 37 | 4.00 | 0.012 | |
| 9 | 0.2 | 38 | 4.11 | 0.008 | |
| 10 | 0.1 | 59 | 6.39 | 0.006 | |
| 11 | 0 | 212 | 22.94 | 0.000 | |
| 12 | −0.1 | 39 | 4.22 | −0.004 | |
| 13 | −0.2 | 31 | 3.35 | −0.007 | |
| 14 | −0.3 | 43 | 4.65 | −0.014 | |
| 15 | −0.4 | 21 | 2.27 | −0.009 | |
| 16 | −0.5 | 17 | 1.84 | −0.009 | |
| 17 | −0.6 | 11 | 1.19 | −0.007 | |
| 18 | −0.7 | 5 | 0.54 | −0.004 | |
| 19 | −0.8 | 6 | 0.65 | −0.005 | |
| 20 | −0.9 | 6 | 0.65 | −0.006 | |
| 21 | −1 | 13 | 1.41 | −0.014 | |
| Total | - | - | 924 | 100.00% | 0.25 |
1 ACC is obtained by multiplying the recorded scores by the percentage.
Table 9.
PAQ values for Co-Op 1, Co-Op 2, and Co-Op 3 and the average concentrations for each pollutant.
Table 9.
PAQ values for Co-Op 1, Co-Op 2, and Co-Op 3 and the average concentrations for each pollutant.
| PAQ | CO2 | CO | H2S | TVOCs | NO2 | NMHC | |
|---|---|---|---|---|---|---|---|
| Co-Op 1 | 1.25 | 1145 | 2.217 | 0.017 | 0.324 | 0.080 | 0.233 |
| Co-Op 2 | 1.00 | 1119 | 0.095 | 0.007 | 0.369 | 0.059 | 0.246 |
| Co-Op 3 | 0.75 | 880 | 0.550 | 0.005 | 0.326 | 0.061 | 0.204 |
Table 10.
Means and intercorrelations for pollutant in Co-Op 1, S1, Evening.
| CO2 | CO | H2S | TVOC | ||
|---|---|---|---|---|---|
| Mean ± σ | |||||
| CO2 | 1655.5 ± 16.4 | - | |||
| CO | 3.900 ± 0.520 | 0.938 | - | - | - |
| H2S | 0.055 ± 0.022 | 0.907 | 0.975 | - | - |
| TVOC | 0.340 ± 0.016 | 0.586 | 0.703 | 0.749 | - |
| NO2 | 0.081 ± 0.022 | −0.342 | −0.387 | −0.453 | −0.545 |
The bold italic values are significant at α ≤ 0.05.
© 2019 by the authors. Licensee MDPI, Basel, Switzerland. This article is an open access article distributed under the terms and conditions of the Creative Commons Attribution (CC BY) license (http://creativecommons.org/licenses/by/4.0/).
Share and Cite
MDPI and ACS Style
Almutairi, A.; Alsanad, A.; Alhelailah, H. Evaluation of the Indoor Air Quality in Governmental Oversight Supermarkets (Co-Ops) in Kuwait. Appl. Sci. 2019, 9, 4950. https://0-doi-org.brum.beds.ac.uk/10.3390/app9224950
AMA Style
Almutairi A, Alsanad A, Alhelailah H. Evaluation of the Indoor Air Quality in Governmental Oversight Supermarkets (Co-Ops) in Kuwait. Applied Sciences. 2019; 9(22):4950. https://0-doi-org.brum.beds.ac.uk/10.3390/app9224950
Chicago/Turabian StyleAlmutairi, Azel, Abdullah Alsanad, and Heba Alhelailah. 2019. "Evaluation of the Indoor Air Quality in Governmental Oversight Supermarkets (Co-Ops) in Kuwait" Applied Sciences 9, no. 22: 4950. https://0-doi-org.brum.beds.ac.uk/10.3390/app9224950
Note that from the first issue of 2016, this journal uses article numbers instead of page numbers. See further details here.