Article

Removal of Cyanotoxins–Microcystins from Water by Filtration through Granulated Composites of Bentonite with Micelles of the Cation Octadecyltrimethyl Ammonium (ODTMA)

1
Kinneret Limnological Laboratory, Israel Oceanographic and Limnological Research, P.O. Box 447, Migdal 14950, Israel
2
Water Industry Engineering, The Achi Racov School of Engineering, Kinneret Academic College, Jordan Valley 15132, Israel
3
The Robert H. Smith Faculty of Agriculture, Food and Environment, The Hebrew University of Jerusalem, Rehovot 76100, Israel
*
Author to whom correspondence should be addressed.
Submission received: 20 January 2021 / Revised: 22 February 2021 / Accepted: 23 February 2021 / Published: 10 March 2021
(This article belongs to the Collection Feature Papers for Applied Nano)

Abstract

:
Cyanobacteria and their toxins present potential hazards to consumers of water from lakes, reservoirs and rivers; thus, their removal via water treatment is essential. Previously, we demonstrated that nanocomposites of octadecyltrimethyl ammonium (ODTMA) complexed with clay could efficiently remove cyanobacteria and their toxins from laboratory cultures and lake water. In this study, we determined the capacity of ODTMA nanocomposites to remove cyanotoxins, namely microcystins (MCs), from water to below 1 µg/L via filtration. This capacity was 1500 mg MC-LR per Kg of nanocomposite. Similar capacities were estimated for the removal of other MC congeners (MC-WR, MC-3aspWR and MC-YR), whereas substantially lower capacities were recorded for more positively charged MC congeners, such as MC-RR and MC-3aspRR. Filtration results were simulated with a filtration model, which considers convection and adsorption/desorption of one to several toxins. Model calculations for the removal of MC-LR, under a variety of situations, fitted well with all the experimentally measured values and also estimated the co-removal of several MC congeners. In agreement with model predictions, results demonstrated that in the presence of MC-WR, the emerging concentrations of MC-RR congeners eventually exceed their solution values. In conclusion, granulated nanocomposites of ODTMA–bentonite can be applied for the removal of microcystins from drinking water.

1. Introduction

Cyanobacteria are notorious for producing water blooms. Toxic cyanobacterial blooms present an ever-increasing, serious threat to the quality of drinking water worldwide. In many cases, such blooms are dominated by toxic species such as Microcystis sp. that produce a family of structurally similar hepatotoxins, known as microcystins (MCs) [1]. MCs are monocyclic hepta-peptides made up of two protein amino acids and five non-protein amino acids. Over 200 MC variants have been discovered, but the most common and abundant MCs are MC-LR, MC-RR, MC-YR, and MC-LA (L, leucine; R, arginine; Y, tyrosine; and A, alanine), where MC-LR is the most studied and potently toxic [2]. Microcystins inhibit serine/threonine protein phosphatases (PPs) and cause liver damage and side effects in other organs. MCs act as tumor promoters and induce oxidative stress in animal cells. MC-LR shows the strongest acute toxicity, thus posing a severe threat to drinking water and food safety, followed by MC-YR and MC-RR [3].
Elimination of cyanobacteria and their toxins during the water treatment process is essential in order to meet water supply standards for cyanotoxins [4]. Chlorination has been the main strategy for disinfecting drinking water but it has a minor effect on the removal of MC contingents. Adsorption technology based on granulated activated carbon, as well as advanced oxidation processes (AOP), are currently the preferred processes to remove cyanotoxins from water [4,5]. However, these processes target only soluble toxins and not the toxins retained in cells. In the search for an efficient technology that may rapidly and reliably remove cells of cyanobacteria and other phytoplankton species from water, we recently demonstrated that cyanobacteria and cyanotoxins could be removed from lake water by filtration through a bed of granulated composites of bentonite with micelles of octadecyltrimethyl ammonium cation (ODTMA) [6]. This granulated composite was reported to be efficient in the removal of microorganisms from water [7,8,9,10]. Micelle–clay complexes are formed by an interaction of micelles of an organic cation with a long alkyl chain, such as ODTMA with sodium bentonite. The micelles, which include several tens to around several hundred molecules, are in the nanometer range, whereas the clay platelets have a thickness of around 1 nm and a typical area of around 1 µm2 [11]. The micelle–clay complex ODTMA–bentonite has an excess of positive charges of half of the cation-exchange capacity (CEC) of the clay mineral. Filtration of toxic cyanobacteria suspension through granulated composites yielded a significant reduction in the number of cyanobacteria cells, or filaments, and their corresponding toxins. Furthermore, the micelle–clay complex ODTMA–bentonite demonstrated a high removal rate of microcystins in batch experiments [6].
The current study focuses on the removal of cyanobacteria toxins, microcystins, from contaminated water by filtration through a bed of micelle–clay complex ODTMA–bentonite granules. We demonstrate efficient adsorption of various microcystin congeners, with clear selectivity related to the MC structure. A filtration model which considers convection and adsorption/desorption of the toxins was applied to simulate the removal of several MC congeners and demonstrated reliable application of nanocomposite granules for cyanotoxin removal from water.

2. Materials and Methods

Organisms and culture conditions—Two strains of Microcystis aeruginosa (Chroococcales) were used in this study (M. aeruginosa strain C1004 from KLL culture collection—http://kinneret.ocean.org.il/INCCA.aspx—and strain PCC7806 from Pasteur culture collection—https://catalogue-crbip.pasteur.fr/resultatRecherche.xhtml, accessed on 2 March 2021). Cyanobacteria species were cultivated in a BG11 medium [12] at 20 °C and under continuous light of 15 μmol quant m−2 s−1, to obtain a cell density of ca 1 × 10⁷ cells mL−1 with a chlorophyll concentration of ca 1000 μg L−1. Cultures from different growth phases were used for the extraction of microcystins. In addition, Microcystis colonies were collected from Lake Kinneret (Sea of Galilee, Israel) during a Microcystis bloom event (February–March 2018) [13], using a silk plankton net of 63-µm mesh size, to select predominantly Microcystis colonies. Immediately after transport to the laboratory, samples were first filtered through a 200-μm sieve to remove large particles and then through a 63-μm sieve. The collected samples of Microcystis colonies were maintained in a small volume of BG11 medium at 20 °C and continuous light of 15-μmol photons s−1 m−2 until further processing for the extraction of microcystins.
Microcystin congeners—Microcystin LR was purchased from Enzo Biochem, Inc. (New York, NY, USA). Other studied microcystins were extracted from cultivated M. aeruginosa strains. Strain C1004 provided MC-RR, MC [D-Asp3]-RR, MC-WR, and MC [D-Asp3]-WR. Strain PCC7806 provided MC-LR and Microcystis biomass collected from Lake Kinneret provided MC-YR, MC-LR, and MC-RR.
Extraction of MCs from cultures and collected biomass—MCs were extracted from Microcystis biomass by exposing laboratory cultures or field-collected Microcystis biomass to 0.1 mM ODTMA-Br. This cyanocide disrupts cyanobacteria cells, which results in the release of toxins and cellular components to the medium. Cell debris and other suspended particles were removed by filtration on a Whatman® GF/F 47-mm diameter membrane filter (www.gelifesciences.com/whatman, accessed on 2 March 2021) to obtain a clear solution enriched with MCs. In cases where high concentrations of soluble MCs were detected, the Microcystis biomass was removed by centrifugation, followed by filtration on Whatman® GF/F membrane filter.
Micelle–clay complex preparation and granulated activated carbon—Bentonite was purchased from Tolsa–Steetley, UK. The bromide salt of the organic cation ODTMA was purchased from Sigma-Aldrich (Sigma Chemical Co., St. Louis, MO, USA). Granulated complexes of ODTMA–clay were prepared as described in Nir et al. [8] and Nir and Ryskin [14]. Sieving of the granules was applied for particle sizes between 0.3 and 2 mm. Granular activated carbon (GAC) (ca. 2.5 mm) was purchased from Merck (Darmstadt, Germany).
Filtration experiments—Filtration columns (10-cm length, 1.4-cm diameter) were prepared, with non-woven, polypropylene geotextile (Markham Culverts Ltd., Lae, Papua New Guinea) coverings at the inlet and outlet of the column. Columns were filled with 9 g of complex (ODTMA–clay), unless other details are provided. Prepared columns were connected to a peristaltic pump (Cole-Palmer Masterflex L/S, Vernon Hills, IL, USA) with Tygon tubes. The filtration flow rate was ca 4.0 mL min−1. Prior to each experimental run, tap water was added to the columns at a slow rate in an upward direction in order to eliminate air pockets and channeling. Each experiment was conducted in duplicate. A GAC filtration column (10-cm length, 1.4-cm diameter) was prepared as described above, but the column was filled with 9 g of GAC.
Analysis of microcystins—The qualitative and quantitative analysis of microcystins in the collected column’s effluent and in pre-filtrated samples was performed using high-performance liquid chromatography (HPLC) and a diode array detector (DAD), following a published protocol [15]. The HPLC system was calibrated for the following microcystin congeners—MC-LR, MC-[D-Asp3]-RR, MC-RR, MC-WR, MC [D-Asp3]-WR, and MC-YR—using authentic standards purchased from Enzo Biochem, Inc. (NY, USA). Other eluted MC congeners could be identified by their typical absorption spectra, but due to the lack of standards, they were annotated as MC-like. Sensitivity and accuracy of this method was determined as proposed by [16]. Alternatively, MC concentrations were determined immunologically, using microcystin ELISA kits (Abraxis, Los Angeles, CA, USA), according to US EPA Official Method 546.
Theoretical analysis of kinetics of filtration—Filtration results were simulated with a model (Equation (1)), which considers convection and adsorption/desorption [17]. The column is of length L and a cross-section A and is filled with material whose molar concentration of adsorbing sites is R0. The beginning and end parts of the filter are at the coordinates X = 0 and X = L, respectively. We consider a situation where a solution containing several (I = 1, …, m) pollutants (e.g., microcystins) is provided at given concentrations, C0i, i.e., Ci(X,t) = C0i for X ≤ 0, where t denotes the time.
dCi(X,t)/dt = −v ә·Ci(X,t)/ә X − Ci·Ci(X,t)·R(X,t) + Di·RLi(X,t)
where RLi(X,t) is the molar concentration of occupied sites of type i and v denotes the flow velocity in the filter, which is given by
v = Qv/(A·f)
in which Qv is the flow rate (volume/time) and f is the fraction of pore volume out of the total volume of the filter. R(X,t) denotes the molar concentration of free adsorbing sites, i.e.,
R(X,t) = R0 − ∑ RLi(X,t)
Ci are the forward rate constants of adsorption (M−1 min−1) and Di (min−1) are the rate constants of dissociation.
The ratio between the adsorption and desorption rate constants is the equilibrium constant (at a given temperature), Ki (M−1) = Ci/Di. Another parameter is R0, the molar concentration of adsorption sites for a given amount of complex in the filter.

3. Results and Discussion

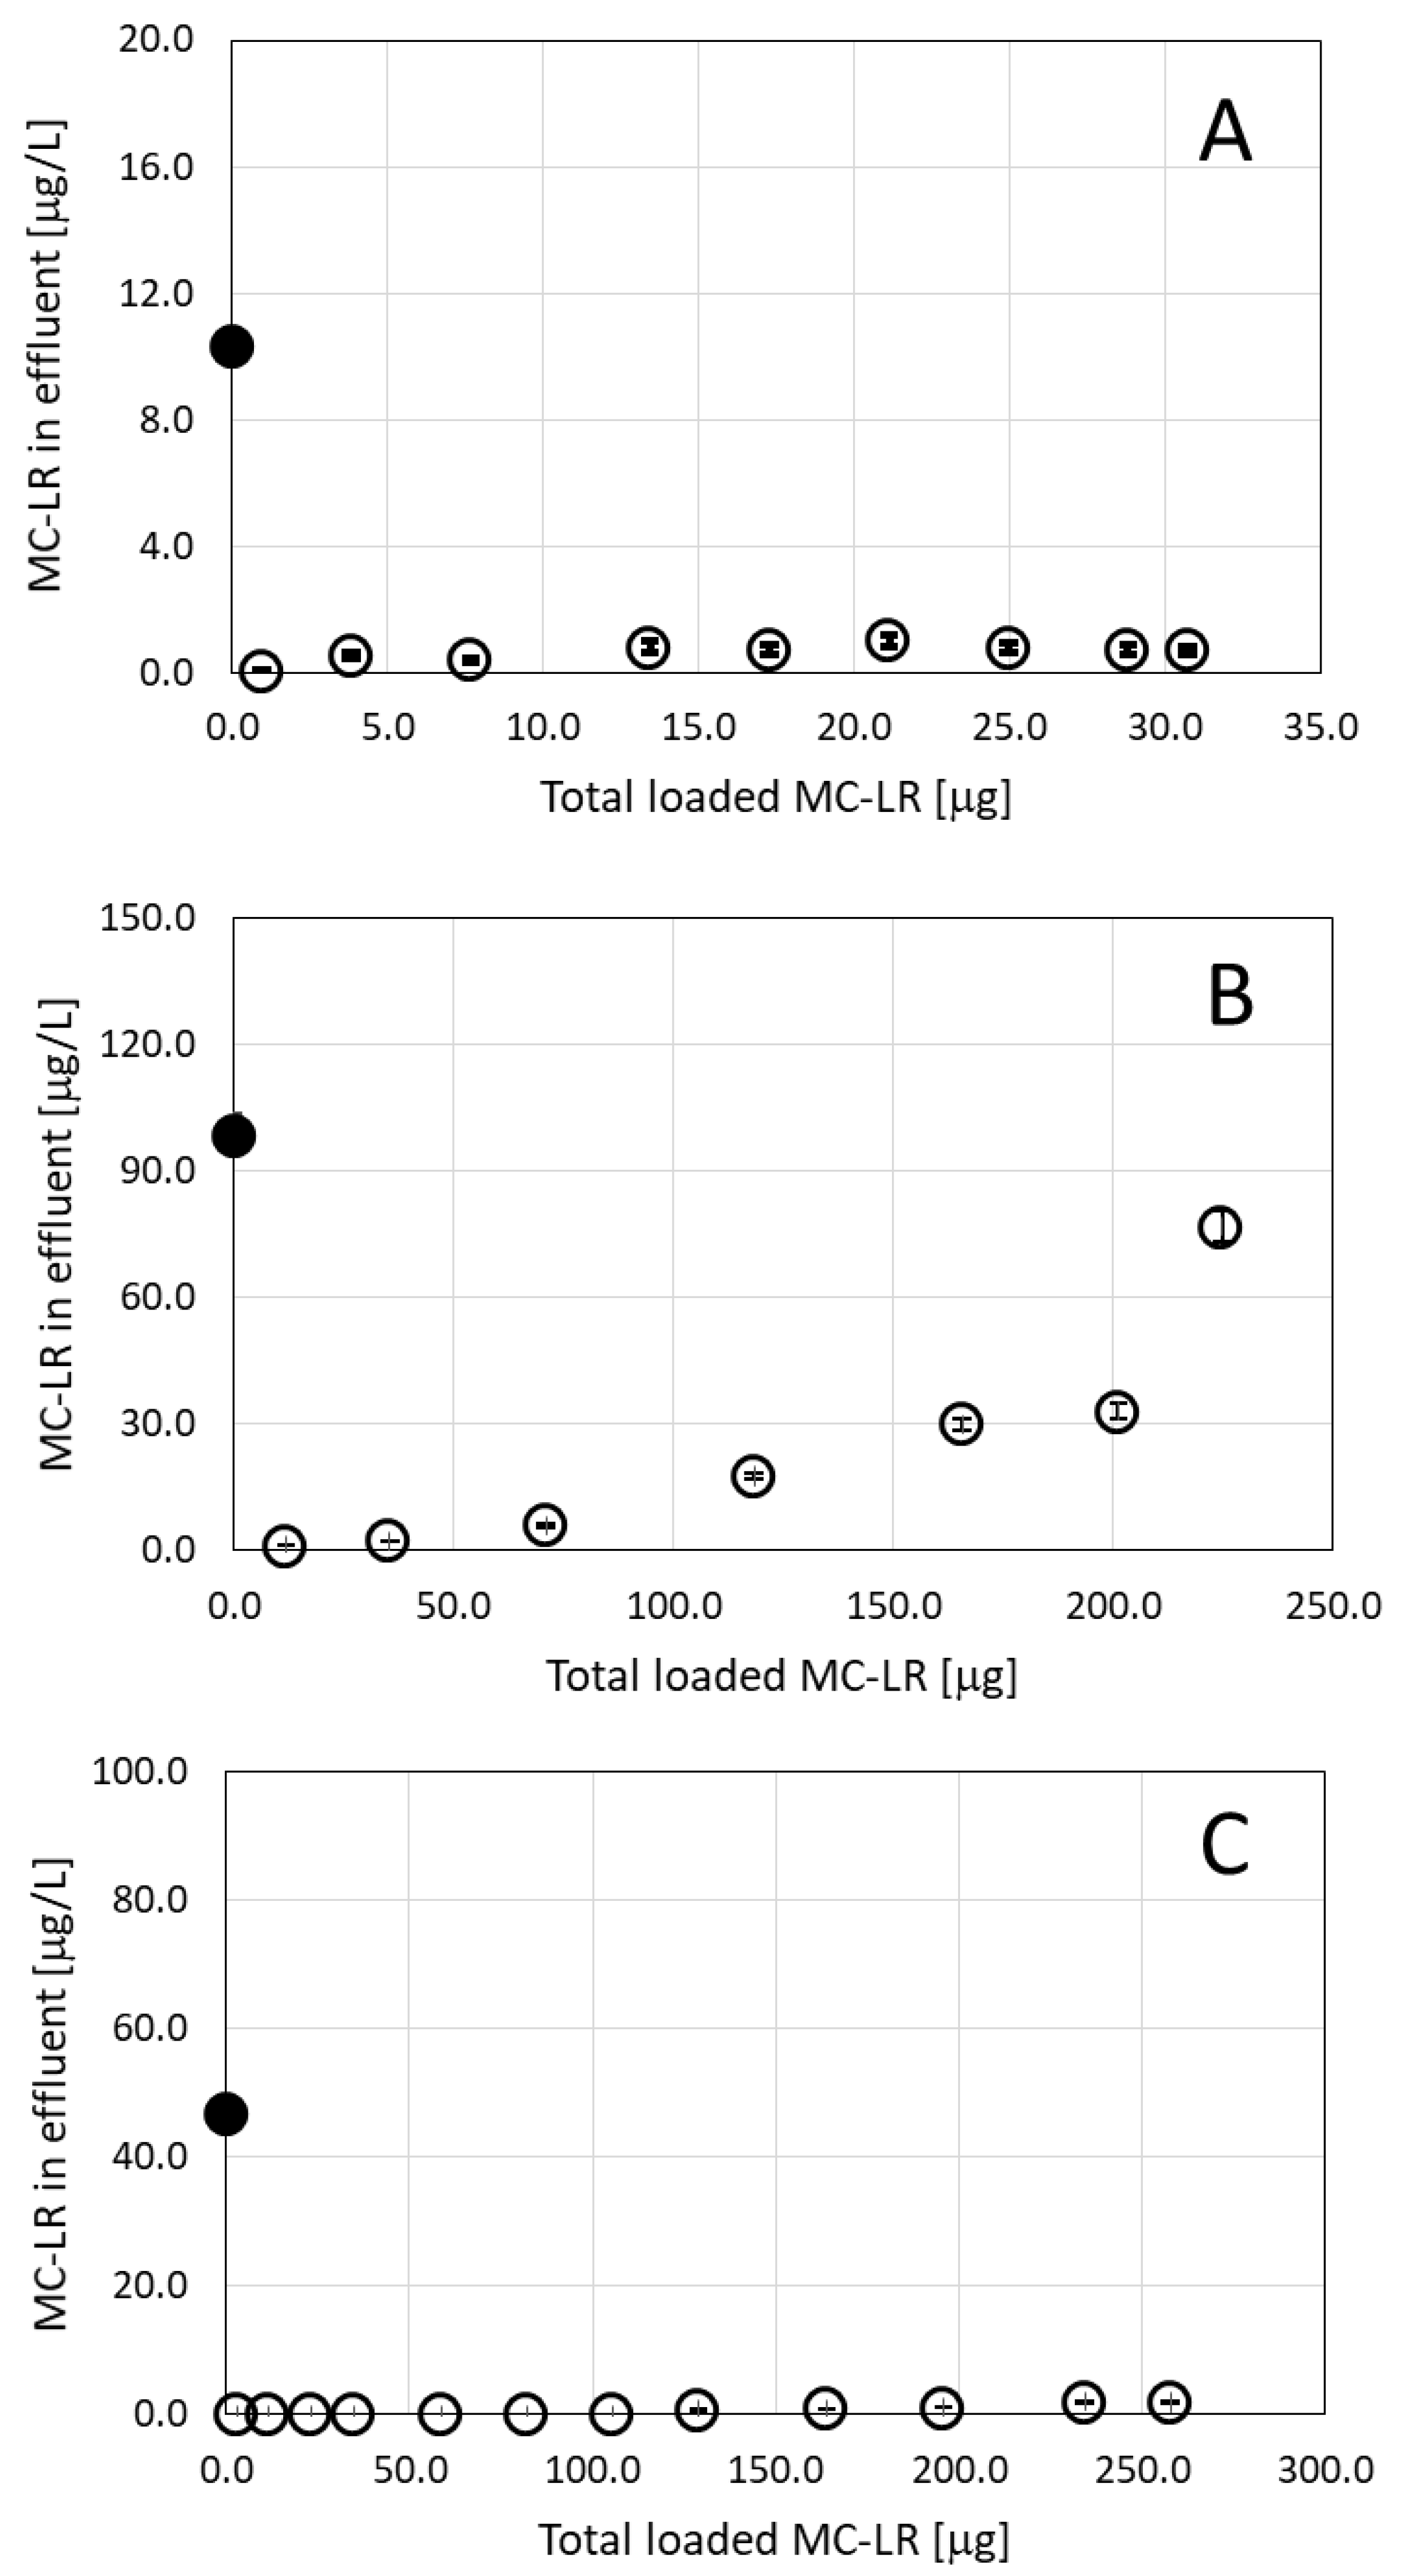
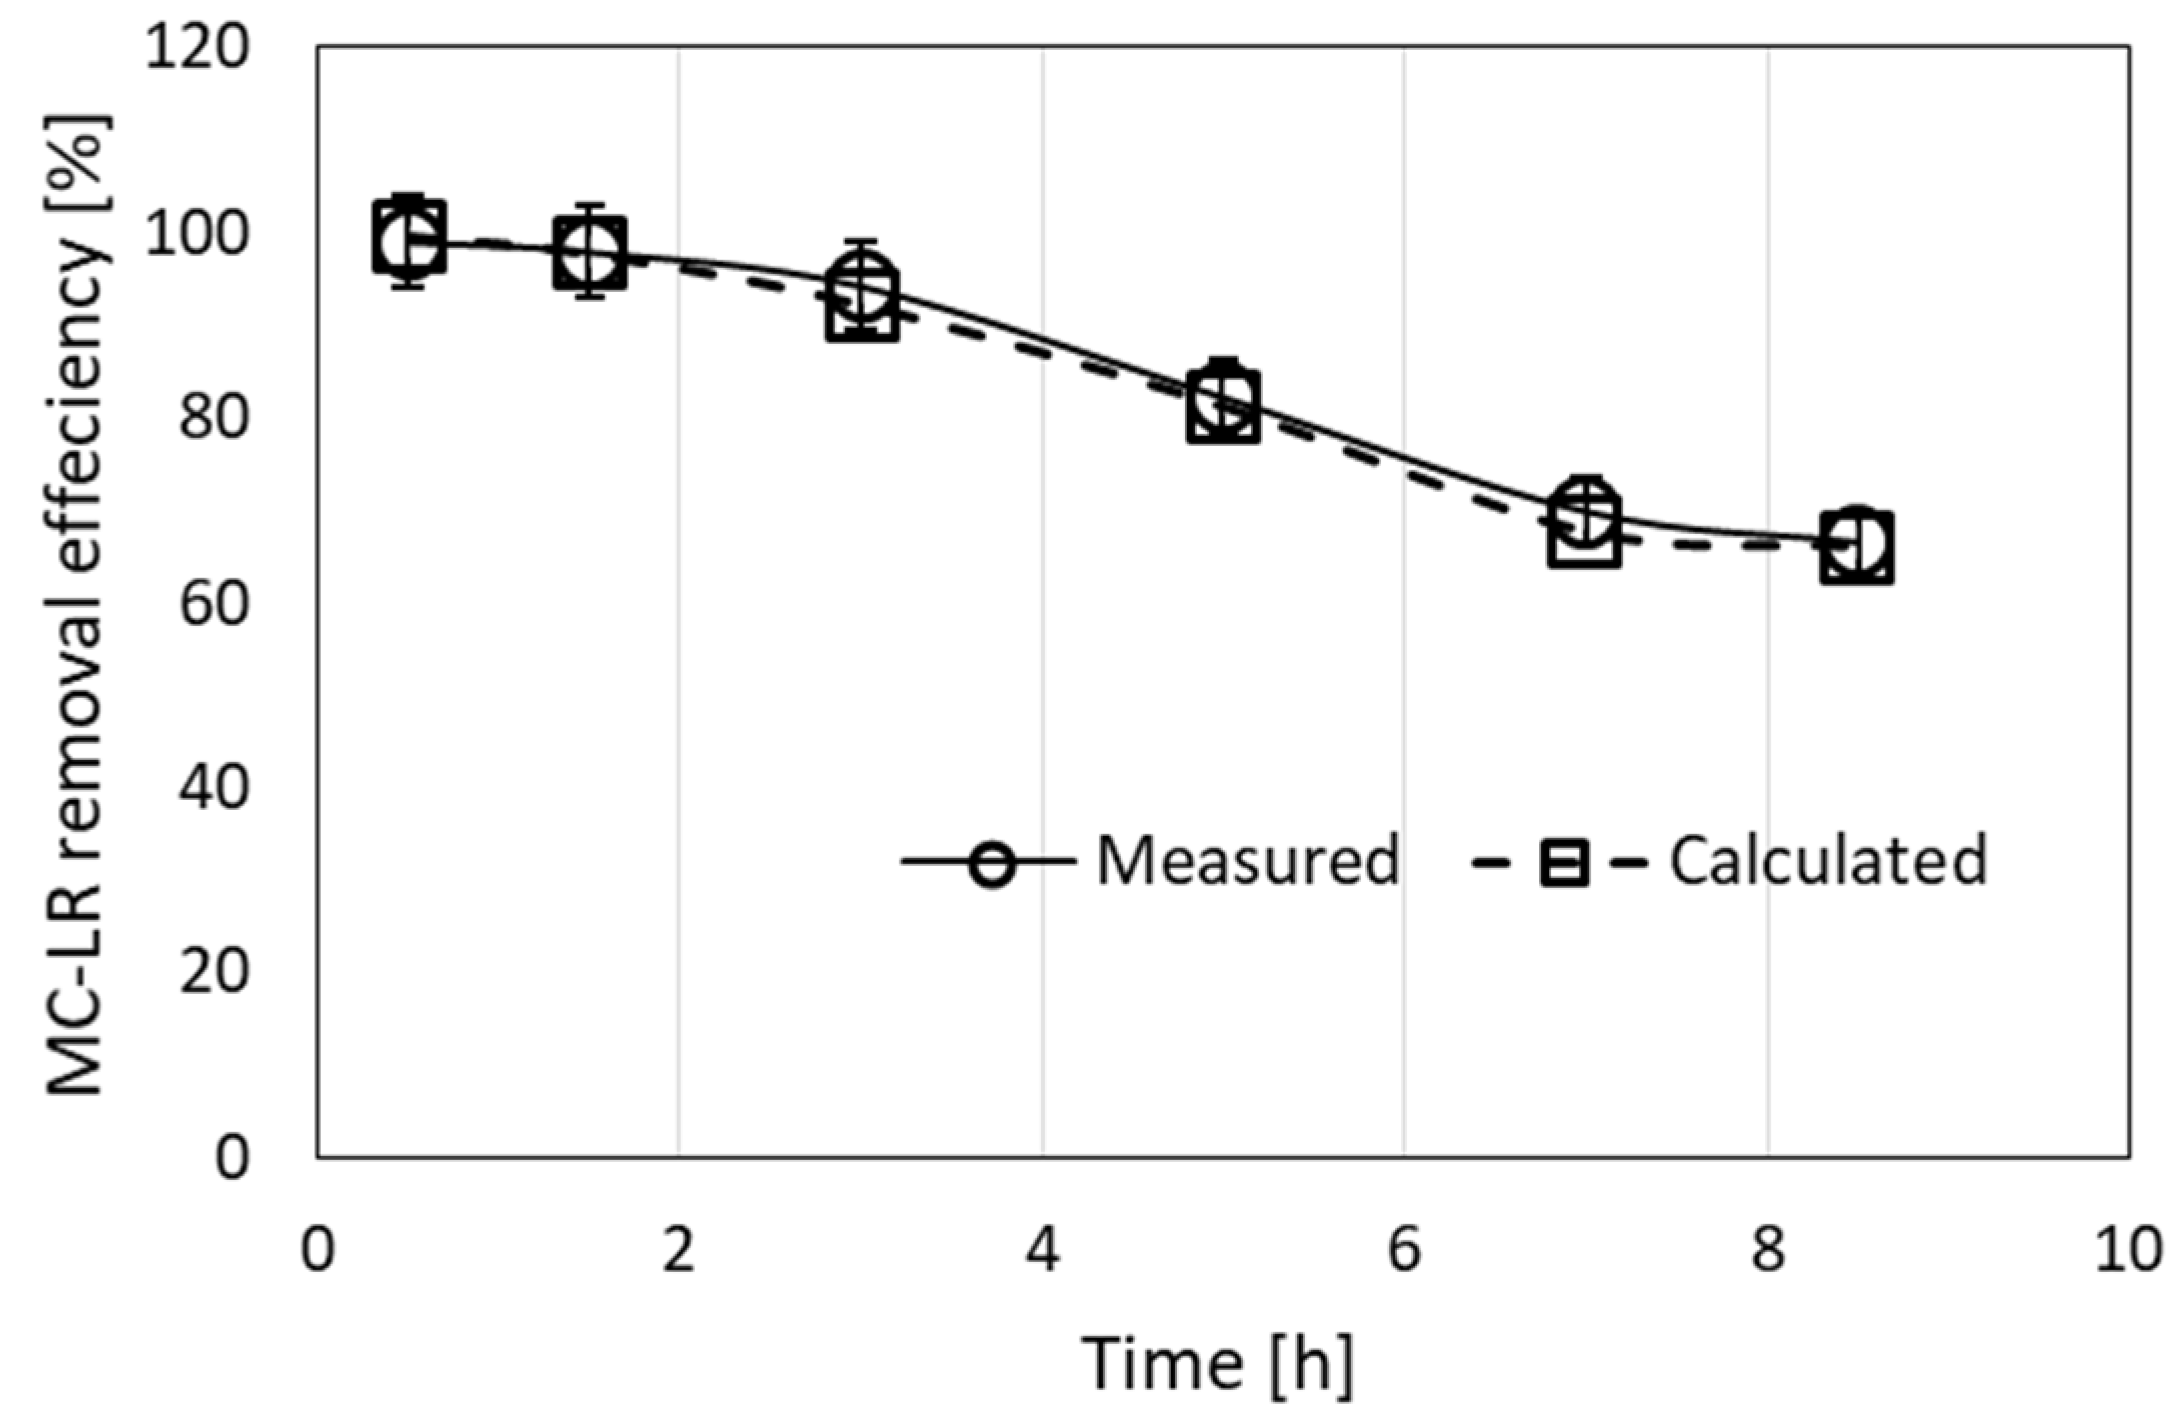
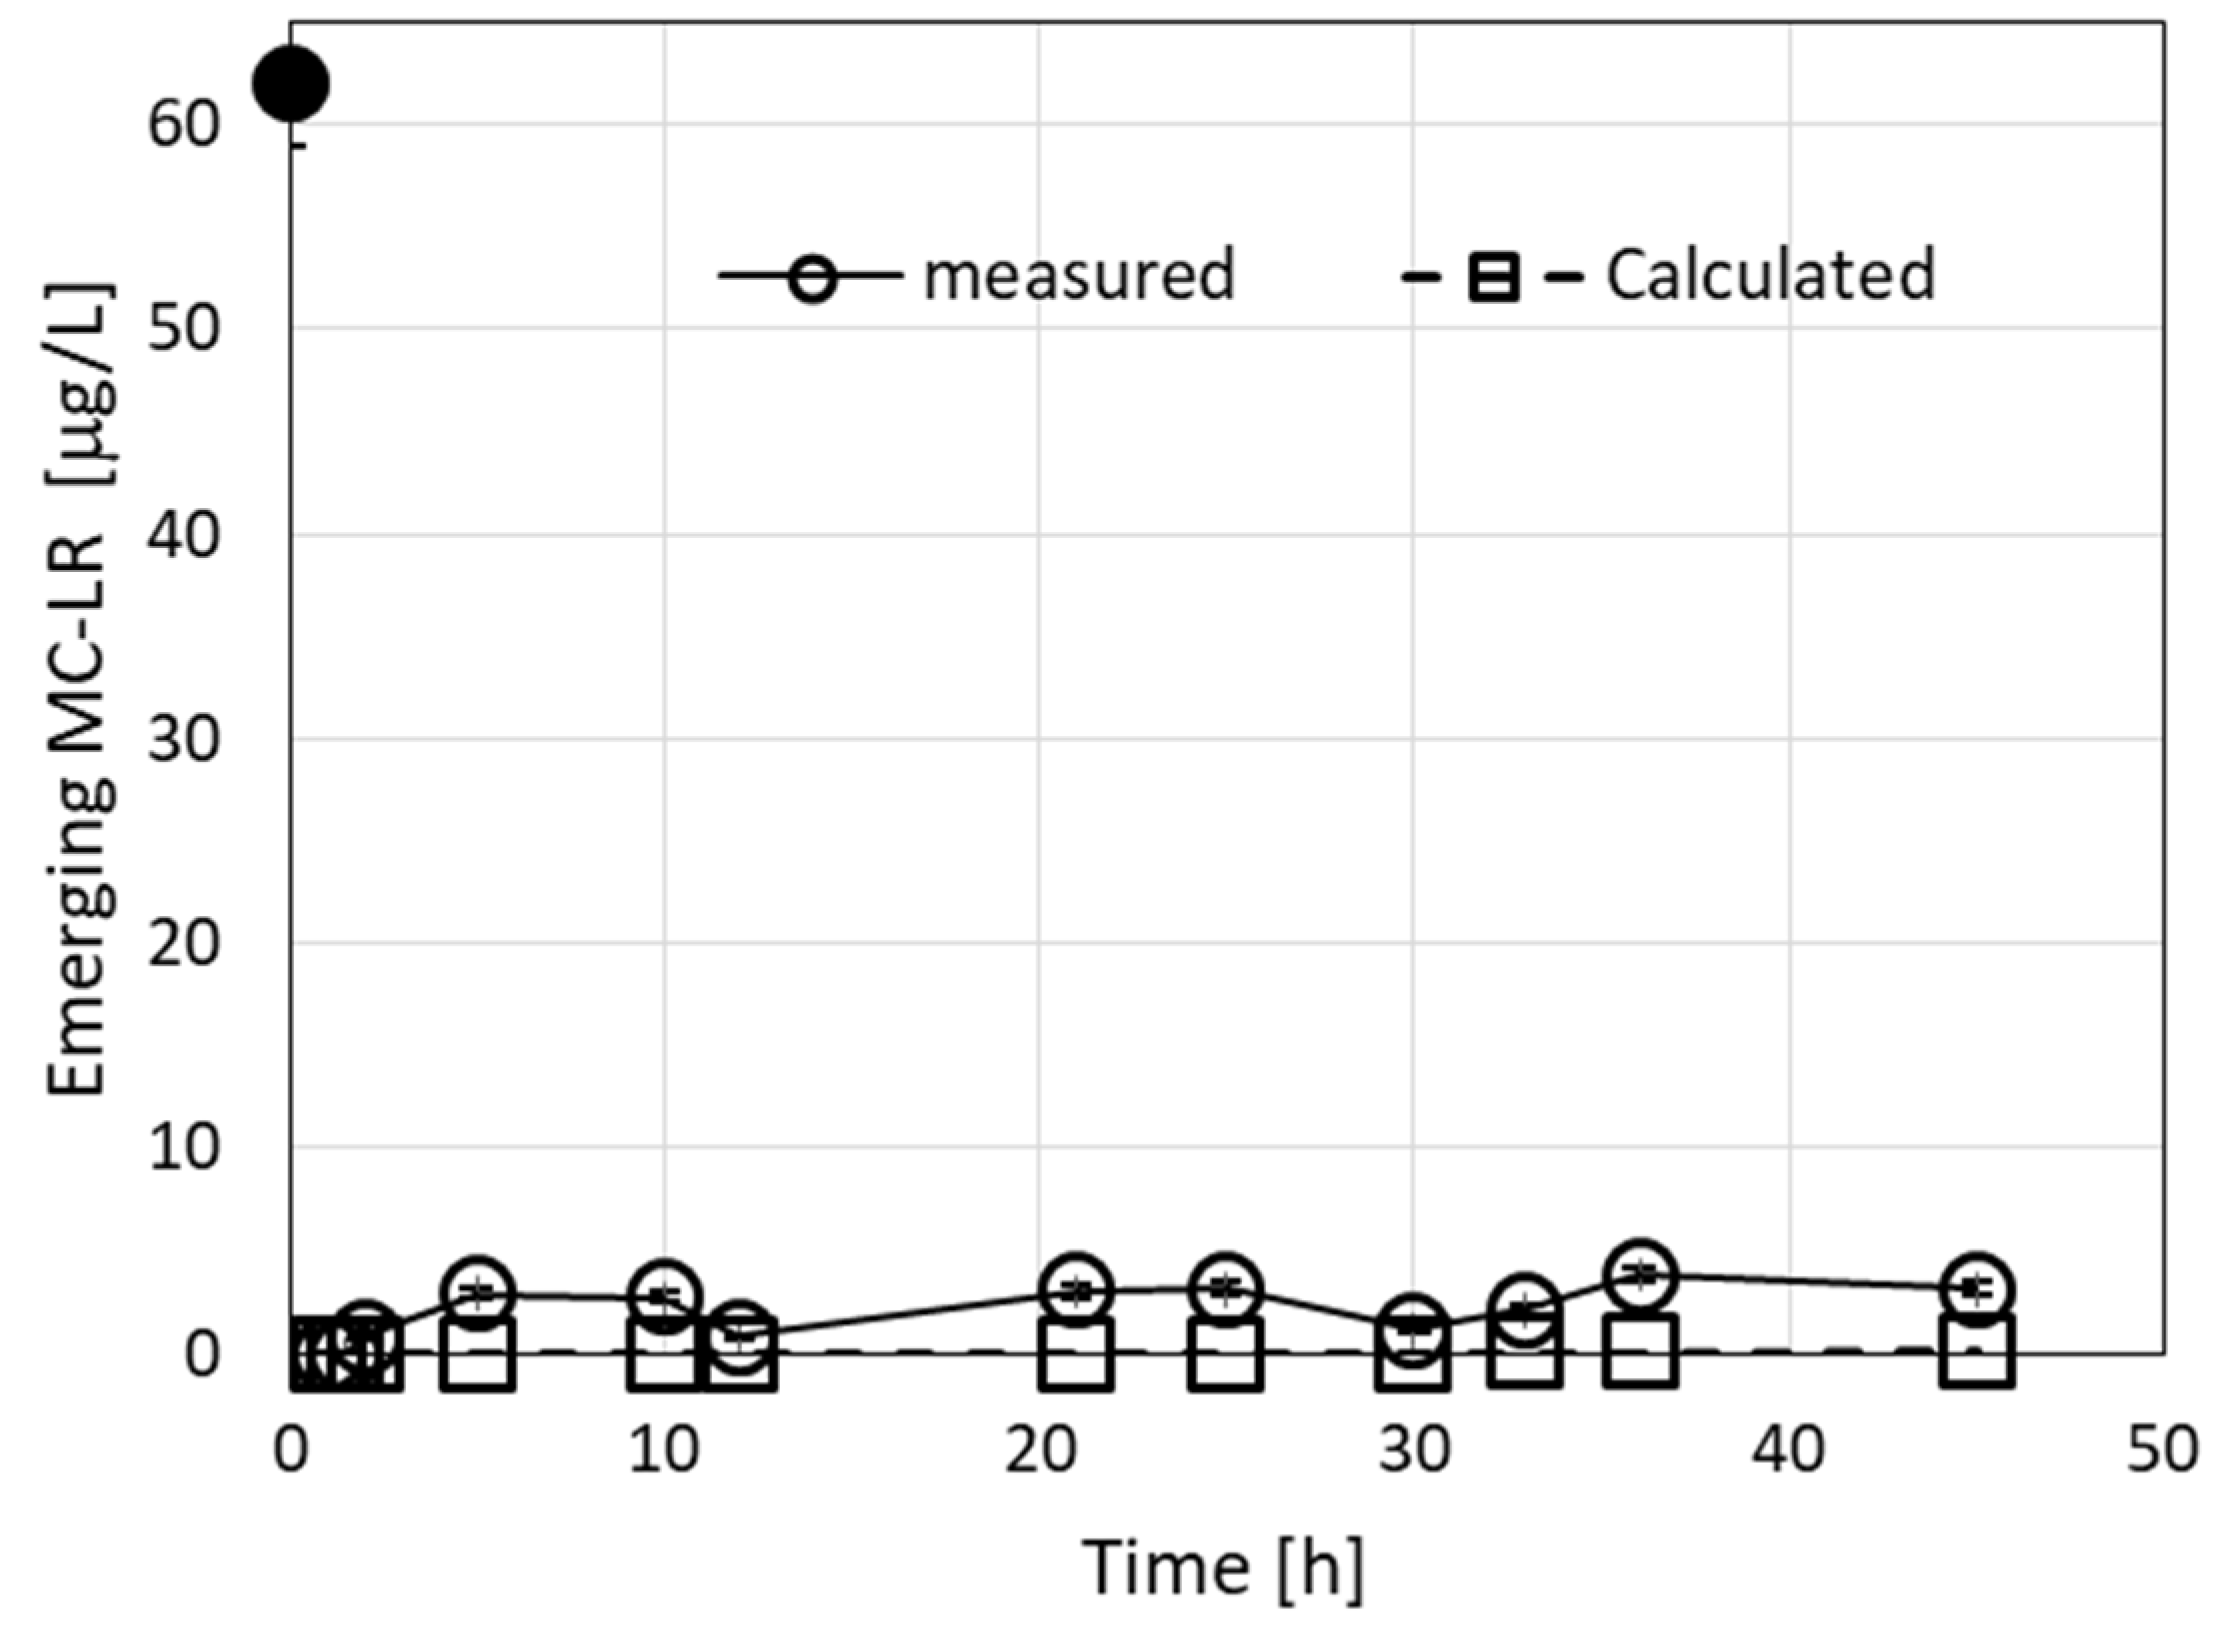
3.1. Removal of MC-LR from Water

Based on our earlier results, where we recorded the high capacity of the ODTMA–clay granulated complex to adsorb microcystins in solution [6], we set up a series of filtration experiments using a single MC congener dissolved in water. For this purpose, we used a commercially available MC-LR to form solutions of different concentrations that were loaded on filtration columns filled with granulated complexes of ODTMA–clay. Initial filtration experiments were run with MC-LR solutions of 10 and 100 μg/L using columns with different quantities of granules. Loading a 10 μg/L MC-LR solution on a column packed with 9 g of granulated complex at a flow rate of 3.2 mL/min indicated high efficiencies of removal of MC-LR (Figure 1A). The toxin concentration below 1 μg/L MC-LR was measured in the effluent as the filtration continued for 16 h with a total load of 30 μg MC-LR (3.0 L of 10 μg/L MC-LR solution). In order to evaluate the full capacity of granulated complexes of ODTMA–clay to retain MC-LR, a filtration column (1.6-cm diameter and 30-cm length) was prepared with 1 g of granules mixed with 52 g of washed quartz sand. The column was loaded with a 100-μg/L MC-LR solution at a flow rate of 4.0 mL/min for 9.5 h (total load of 2.28 L, 200 μg MC-LR). Toxin concentrations of 1 μg/L were measured in the effluent after 30-min operation and gradually increased with time as the toxin load increased (Figure 1B).
In additional filtration experiments, the MC-LR solution originating from Microcystis (strain PCC7806) passed through a column including 9 g of granulated complex of ODTMA–clay. It is important to note that this toxin solution contained inorganic salts of the BG11 medium and dissolved organic matter accumulated during the biomass growth, which further increased due to cell lysis. MC-LR concentration in the solution was 49 μg/L and the effluent was practically free of MC-LR, even after filtration of 7 L at a flow rate of 4 mL/min (Figure 1C).
Based on these results, we estimate that 1 g of granulated complex of ODTMA–clay may adsorb ca. 250 μg of MC-LR, more than 2.5 times the capacity estimated from batch experiments [6]. Additional filtration experiments with various initial concentrations of pure MC-LR in aqueous solution were run to validate the theoretical filtration model, as described below.

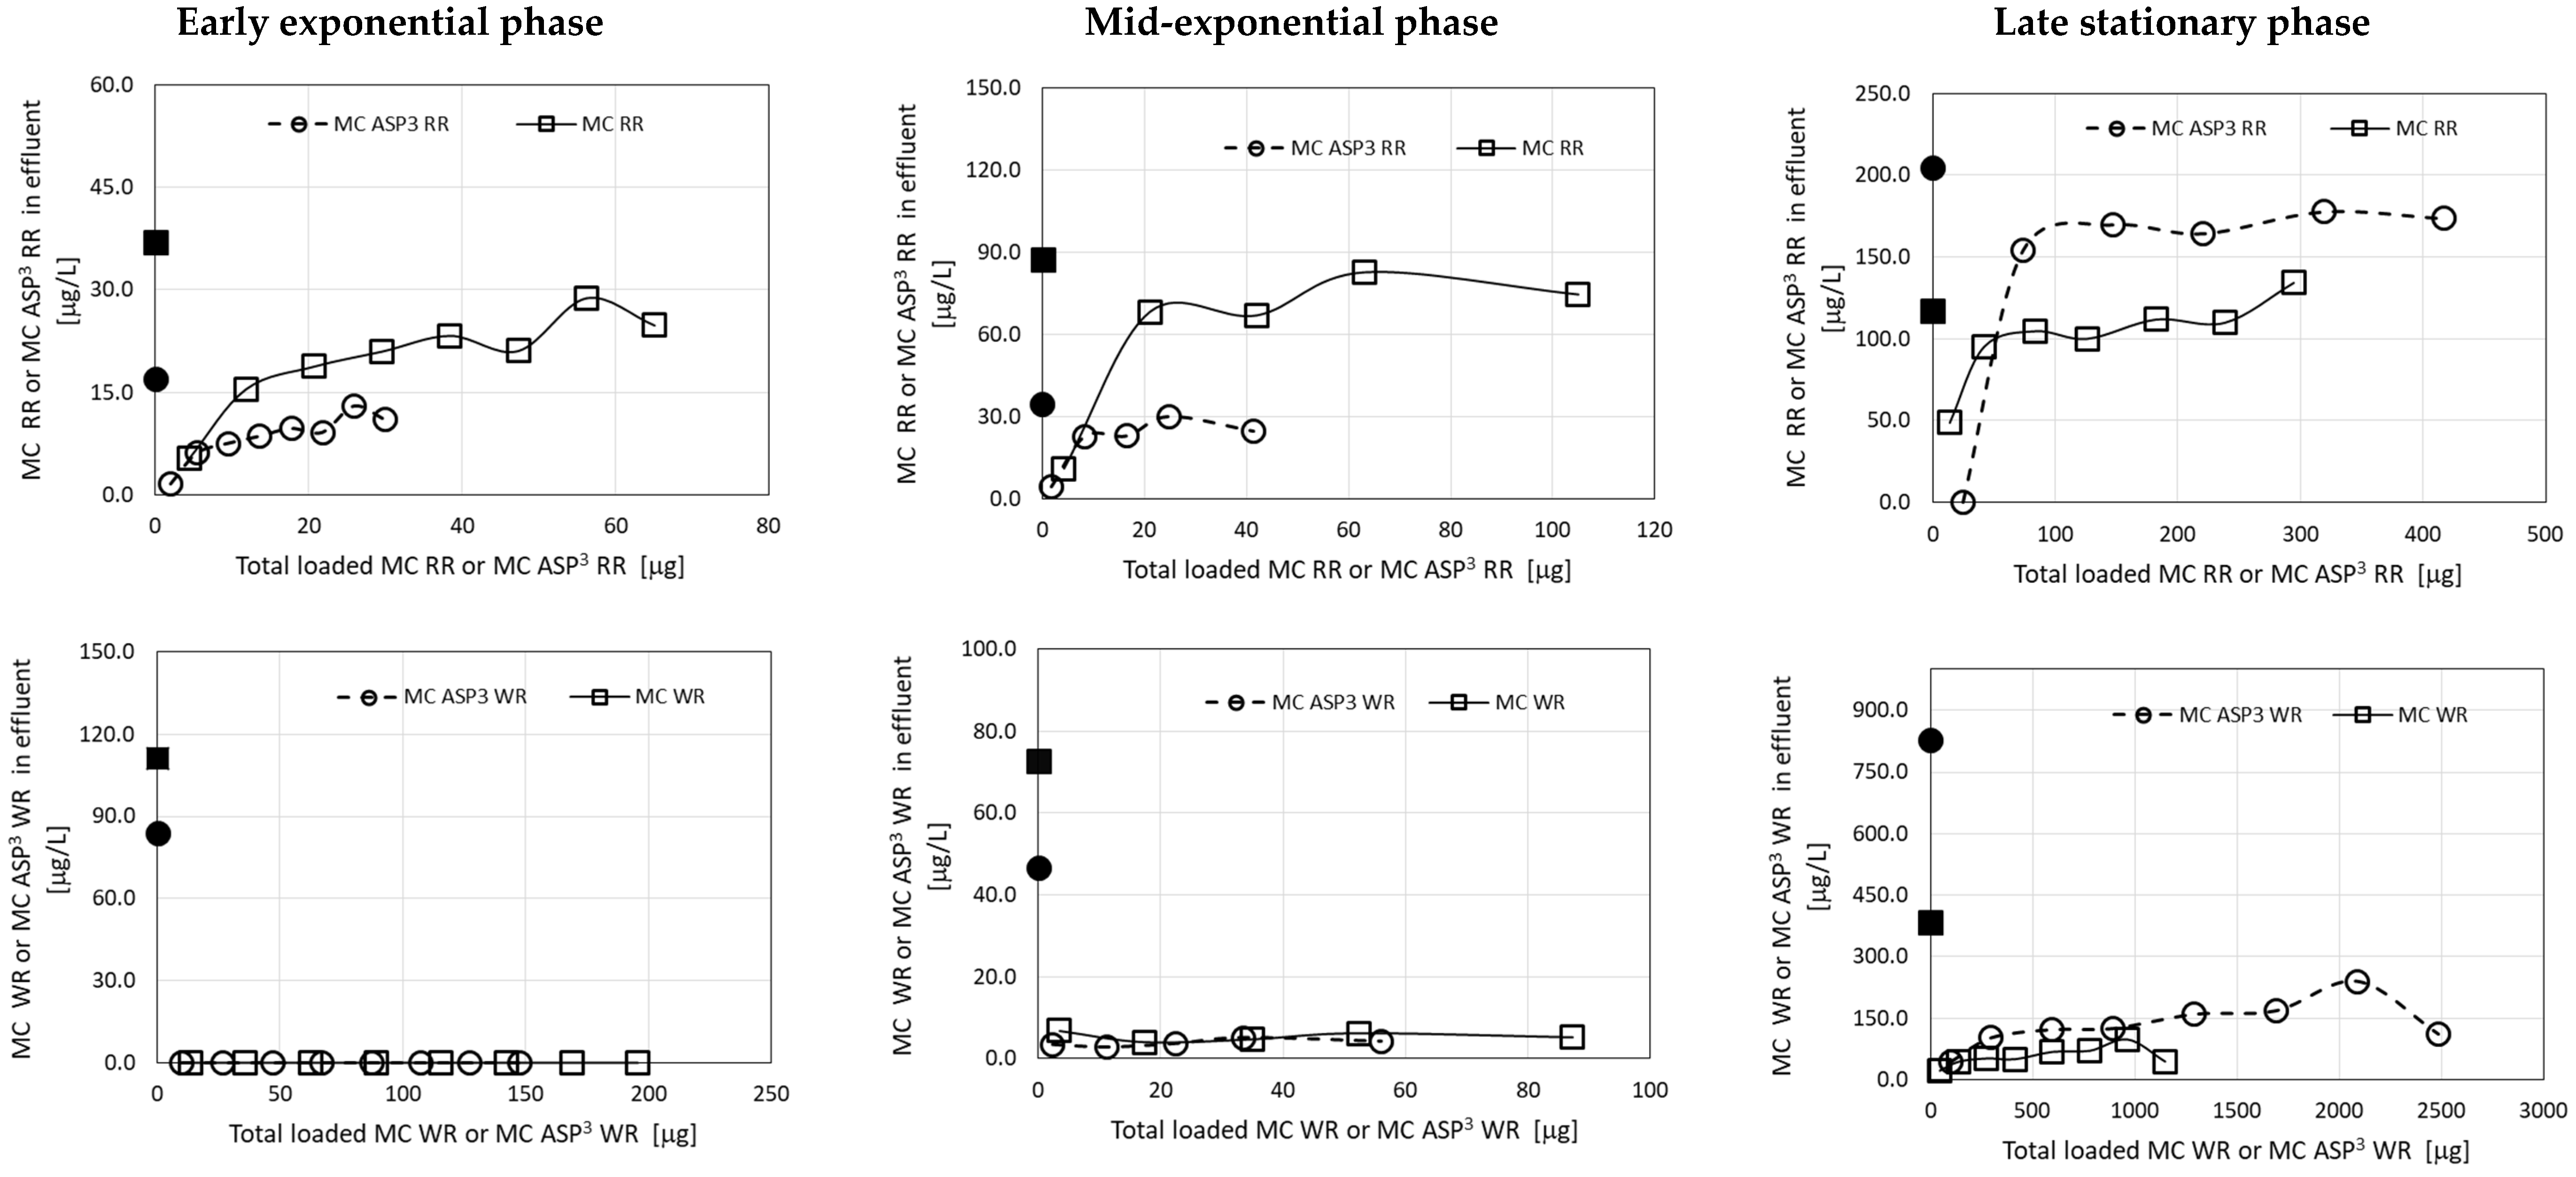
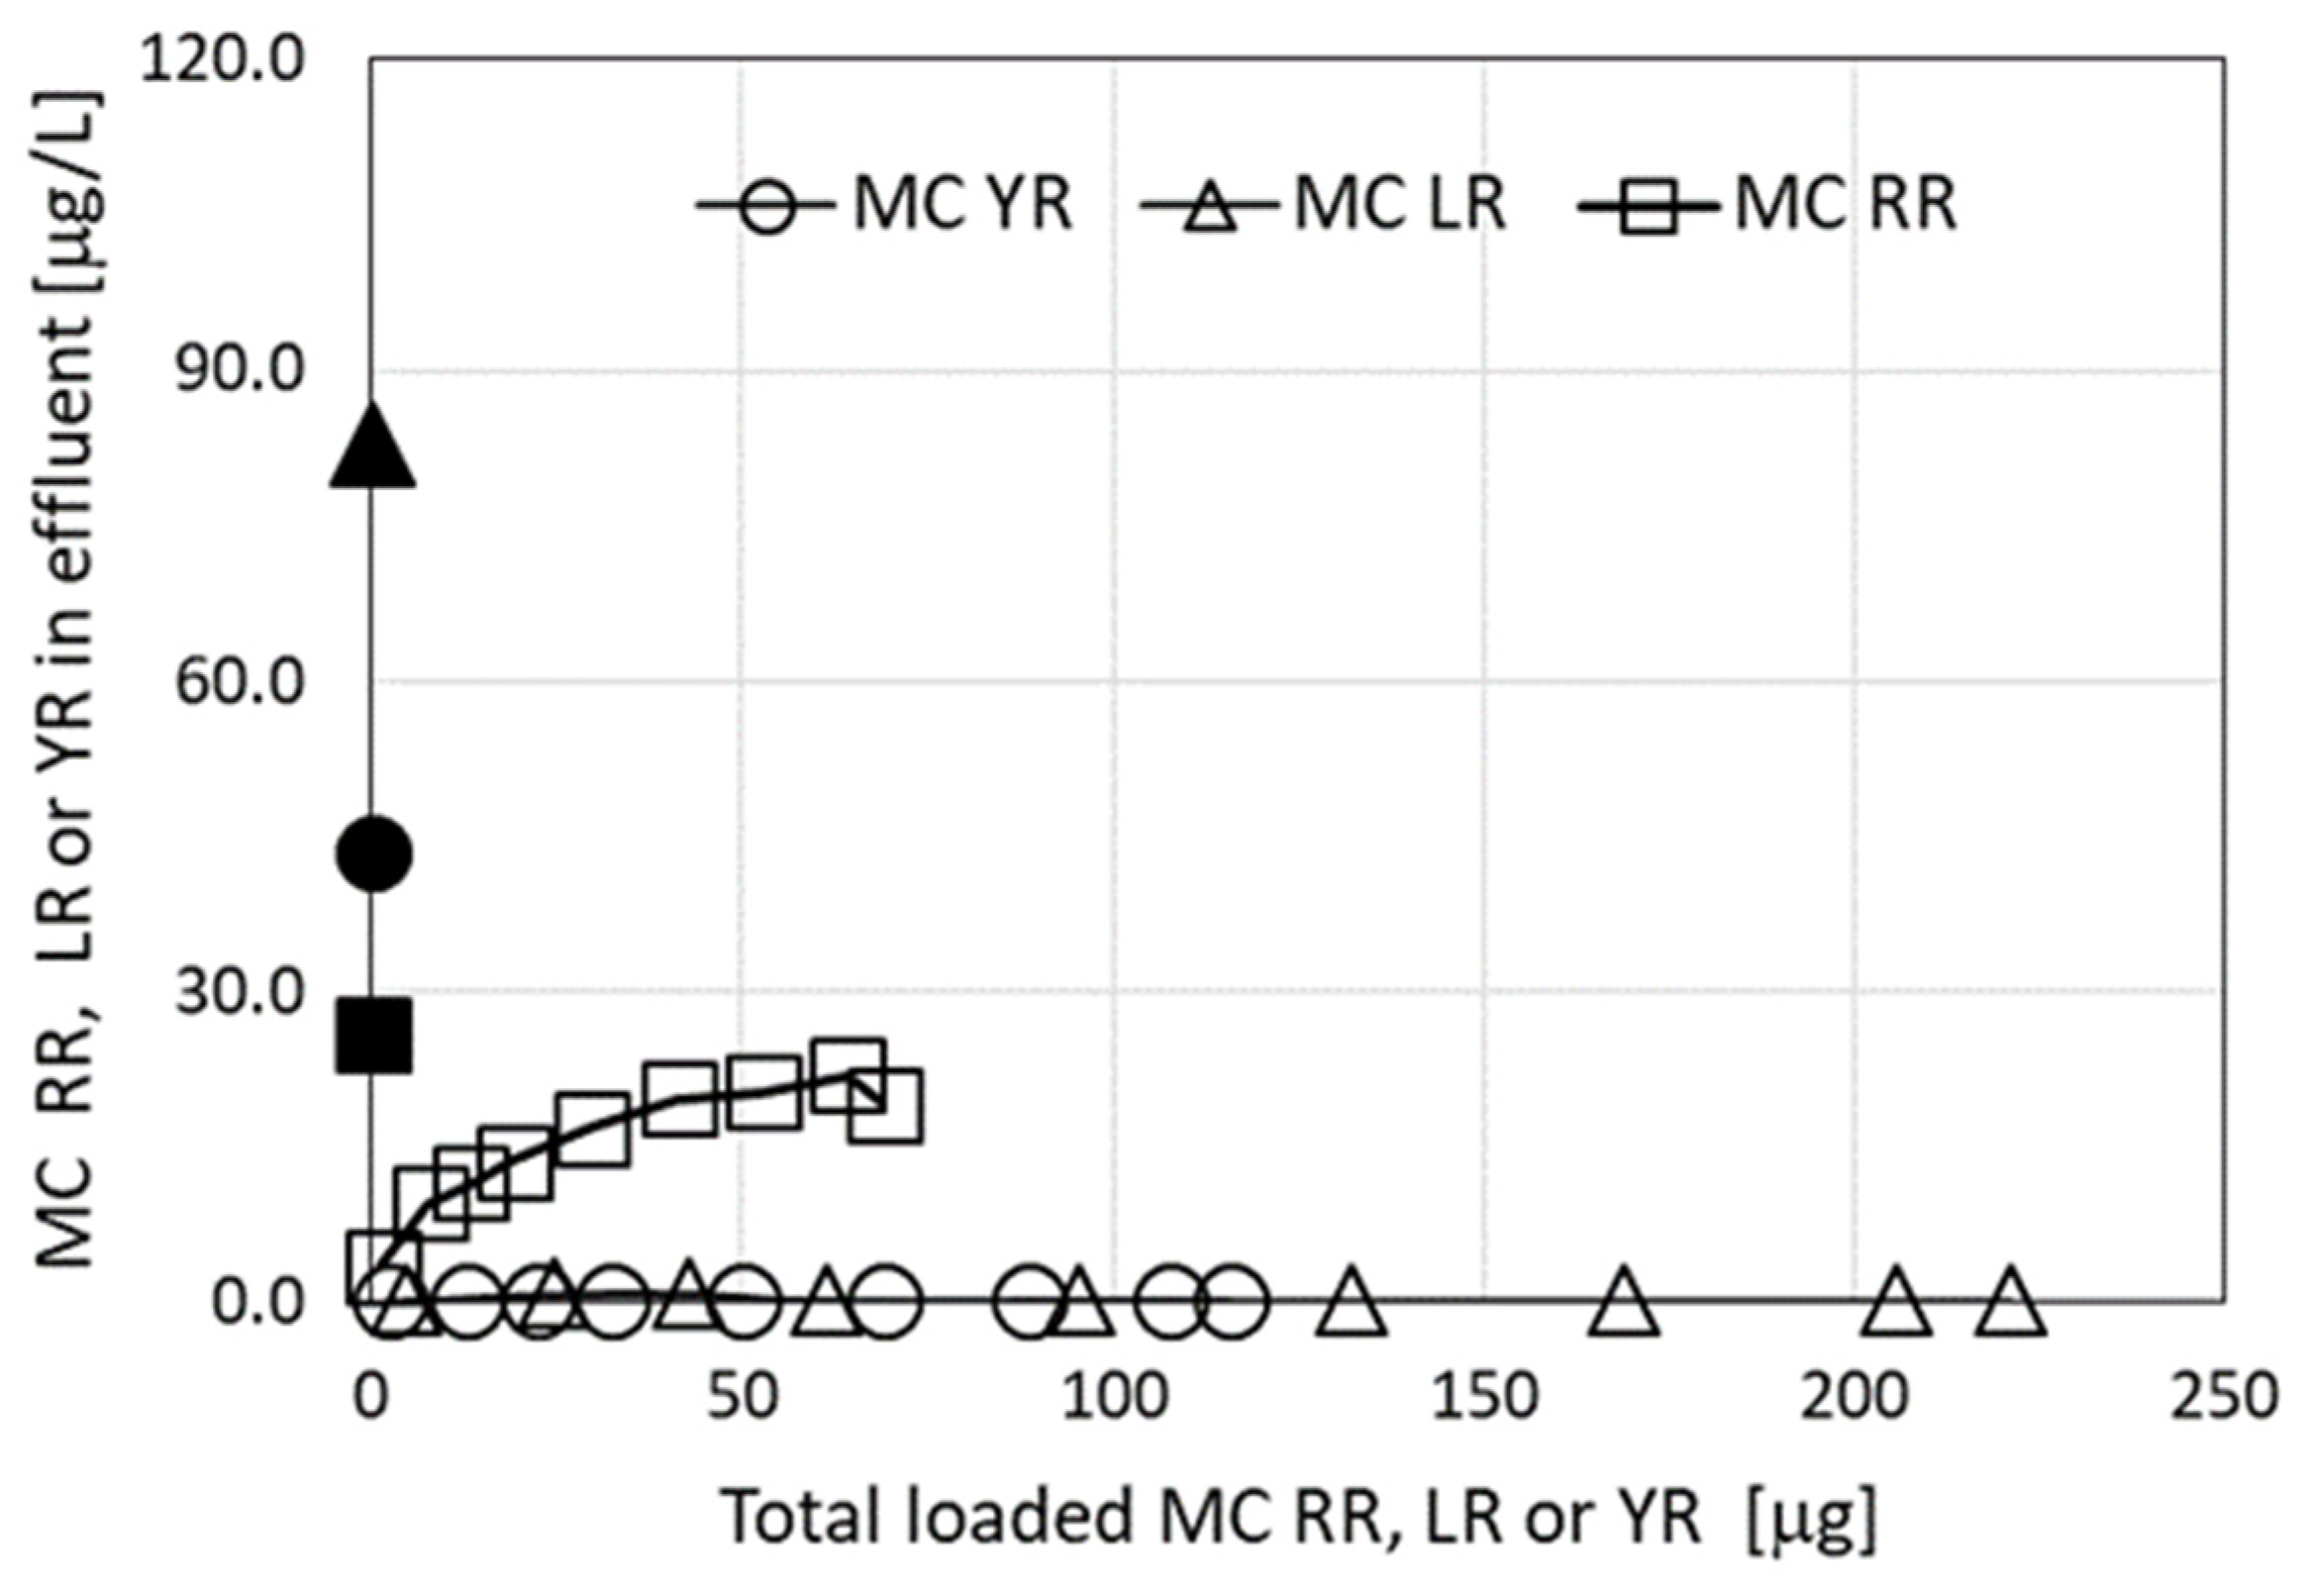
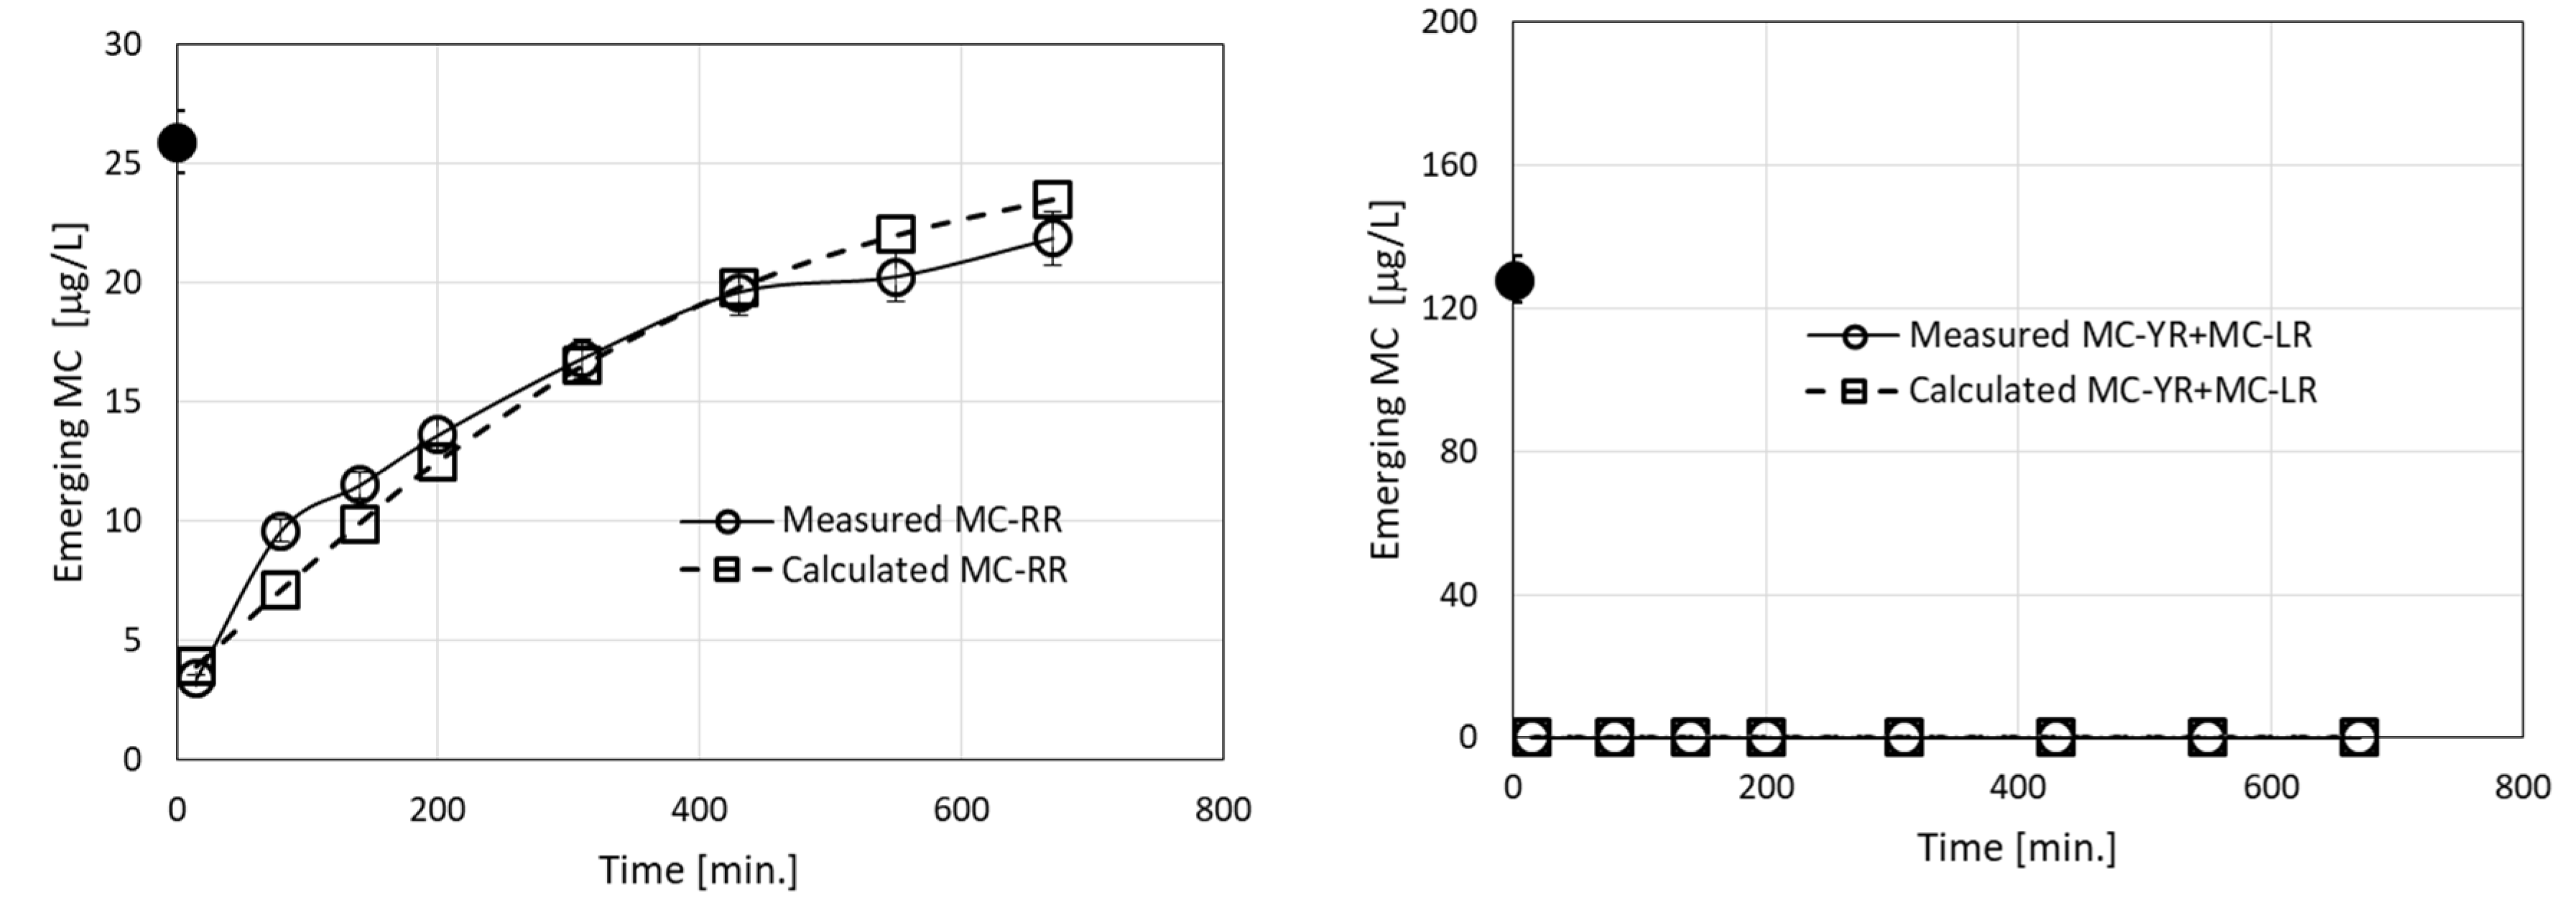
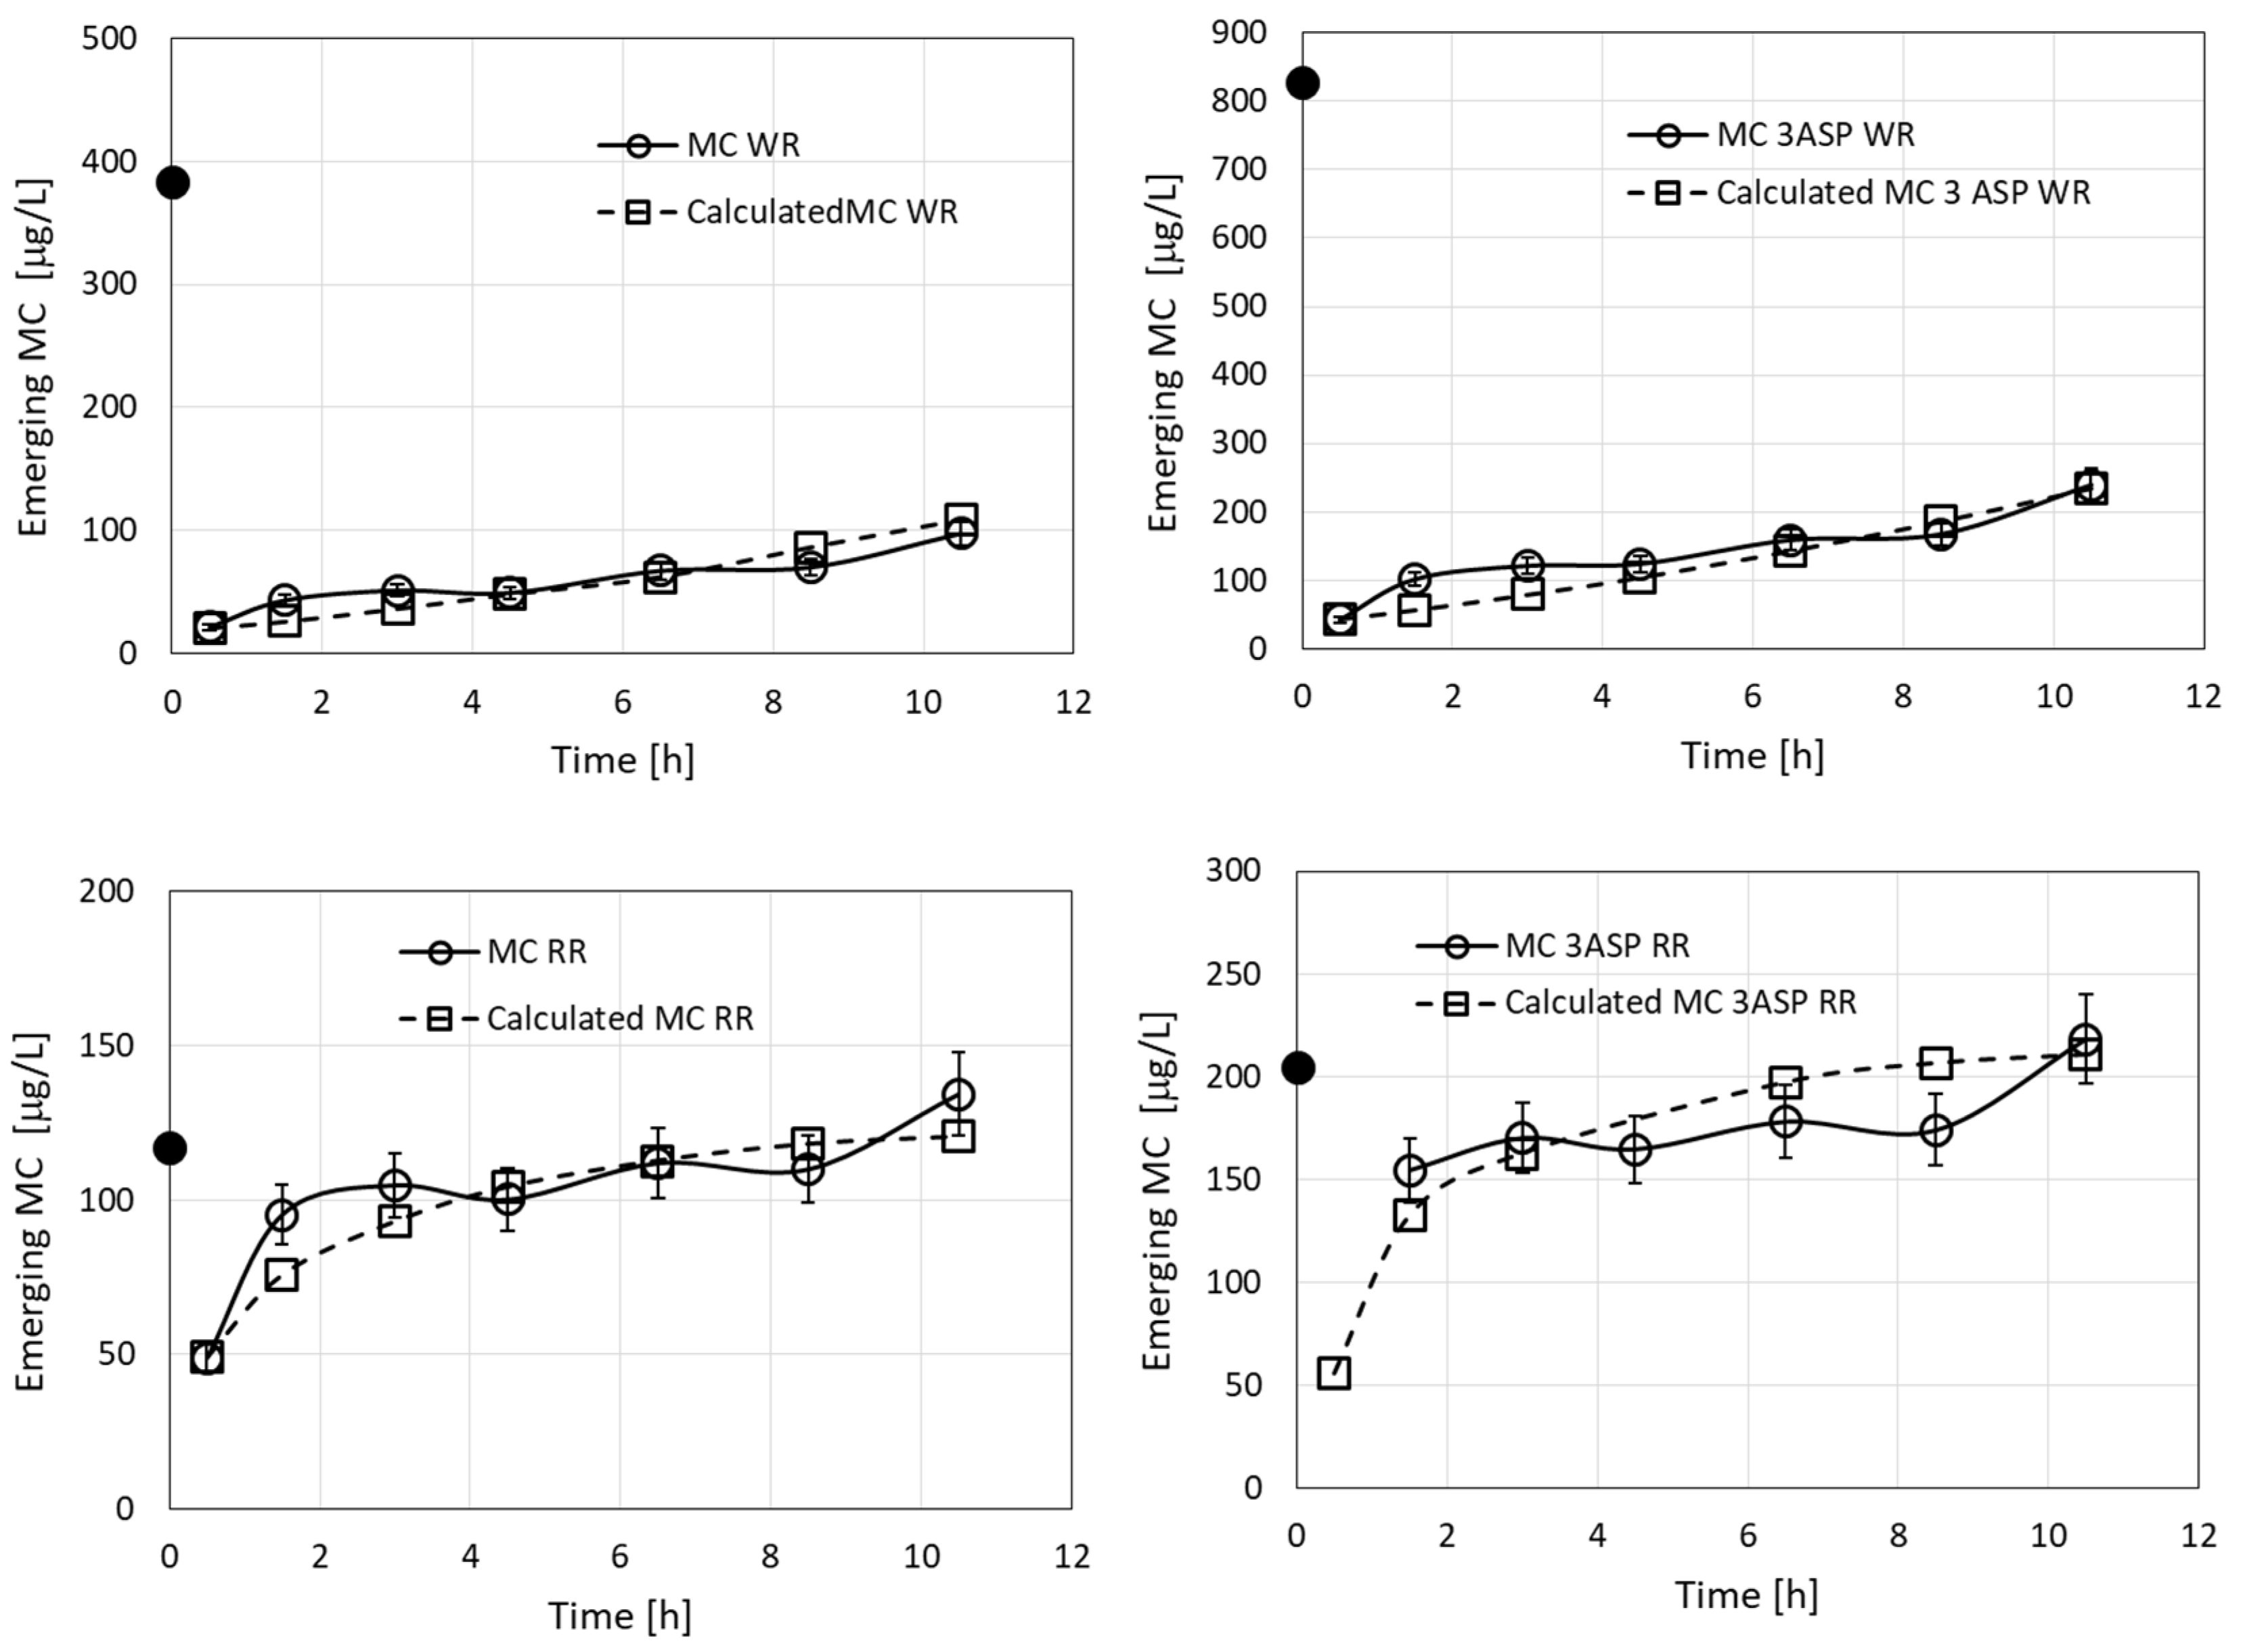
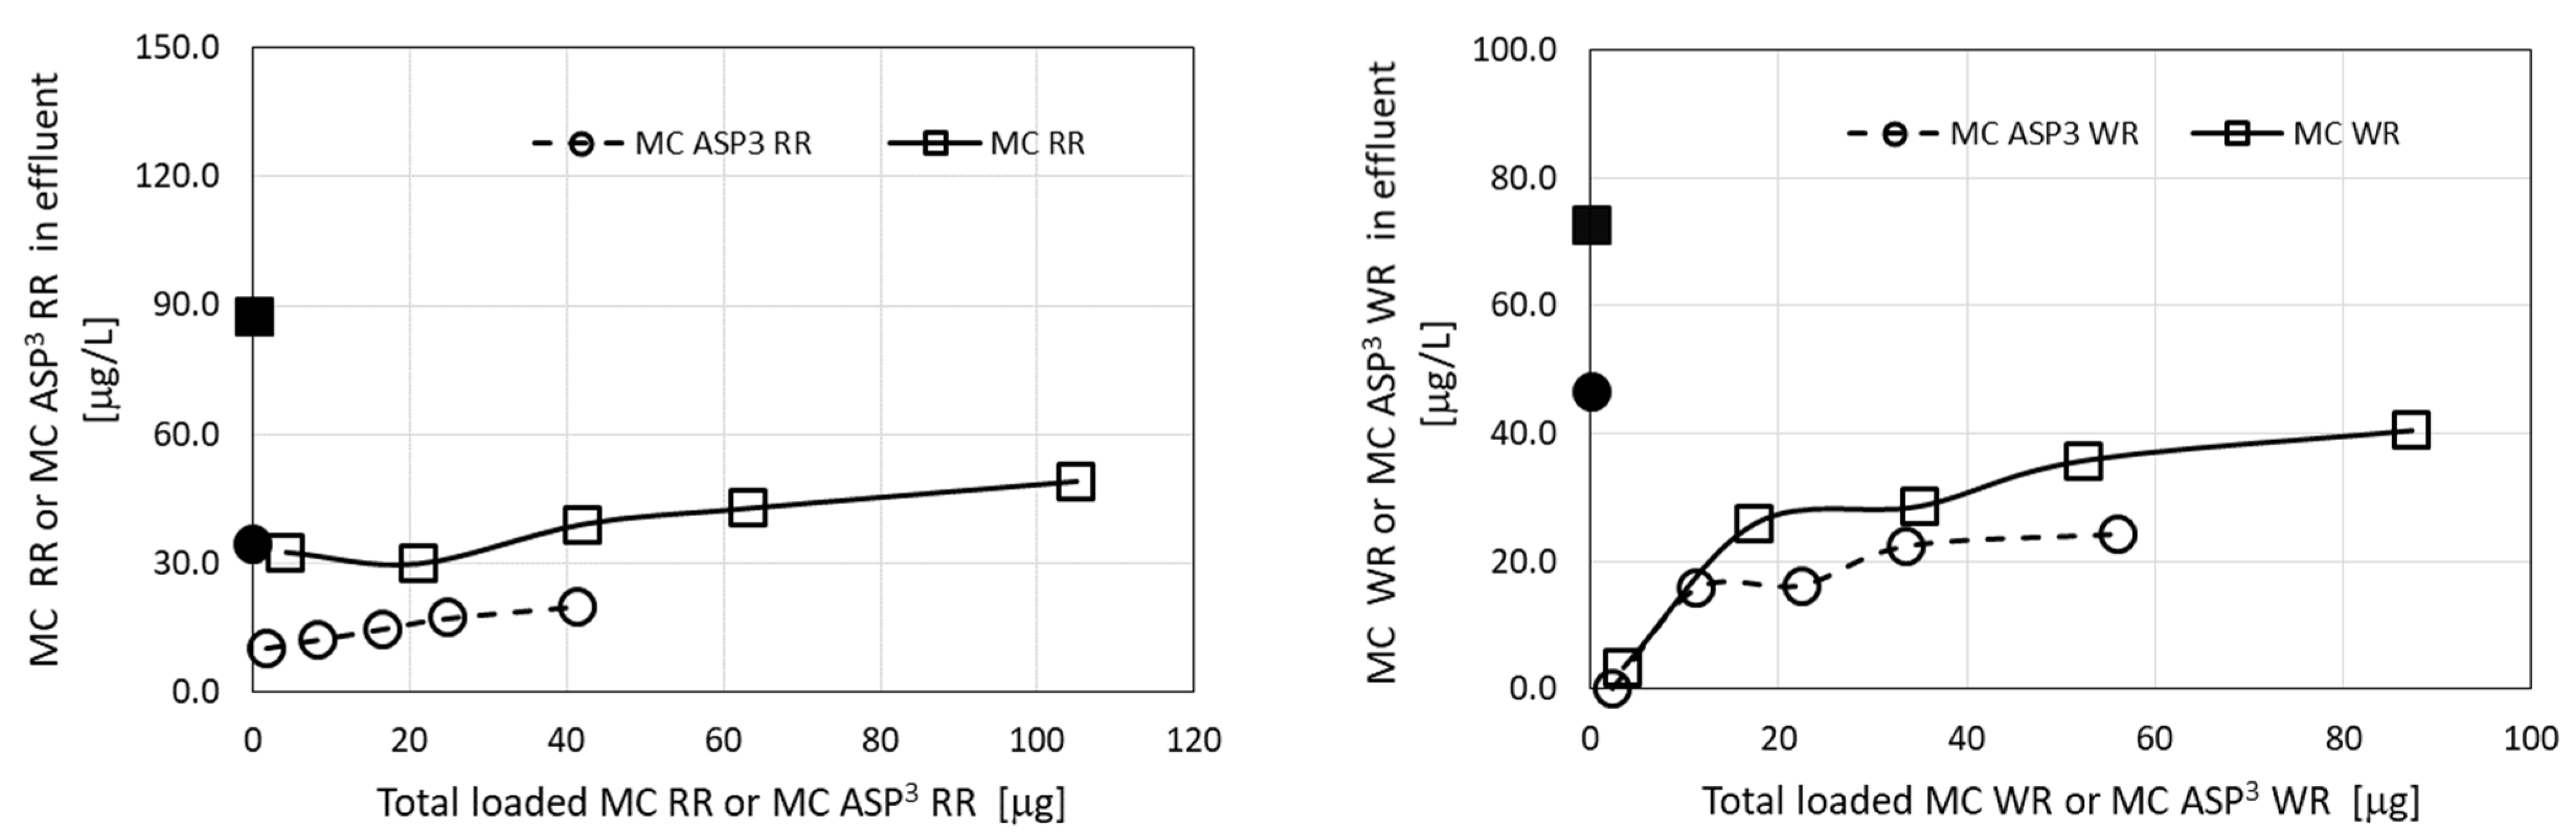
3.2. Co-Removal of MC Congeners Originating from Biological Sources

Laboratory cultures of M. aeruginosa and Microcystis biomass collected from Microcystis surface scum from Lake Kinneret were used as the source for mixtures of MC congeners. In several filtration experiments, 9 g of granulated complexes of ODTMA–clay was packed in a column of 1.5-cm diameter and 12-cm length. More details on these experiments and the concentrations of MCs loaded on granulated complexes of ODTMA–clay columns are presented in Table 1. The three M. aeruginosa experiments represent MC mixtures originating from cultures collected from different growth phases and biomass concentrations (early and mid-exponential phase cultures, and a 3-week-old stationary phase culture) were used. These cultures provided solutions with different concentrations of the major MC congeners (MC-RR, MC [D-Asp3]-RR, MC-WR, and MC [D-Asp3]-WR), and variable ratios among them (Table 1). Furthermore, the MC solutions contained different concentrations of dissolved organic carbon (DOC) originating from the Microcystis cells during the culture growth and MC extraction. Note that the late stationary phase culture yielded MC-YR in addition to high concentrations of the four MC congeners. The Microcystis biomass collected from Lake Kinneret contained three major MCs: MC-LR, MC-YR, and MC-RR.
The results of these filtration experiments clearly show high affinity of the granulated complexes of ODTMA–clay for most MC congeners, with the clear exception of MC-RR and MC [D-Asp3]-RR (Figure 2). Using MC extracts from M. aeruginosa cultures demonstrated high removal efficiency for the two MC-WR congeners, more than 70–80% removal following a load of more than 2 mg MC [ASP3]-WR and 90–99% removal of both congeners, when loads lower than 0.1 mg of both congeners were applied (Figure 2). The removal of both MC-RR congeners demonstrated a different pattern, with relatively high efficiency (75–100%) at the early stage of the filtration (load of 0.005–0.015 mg), but these congeners rapidly leaked from the column and their concentration in the effluent gradually increased to their concentration in the loaded solution (Figure 2).
An additional source for a mixture of MCs applied in this set of filtration experiments was Microcystis biomass collected from Lake Kinneret. The presence of three MC congeners was identified (Table 1). The results of the filtration through a granulated complex of ODTMA–clay column are presented in Figure 3 and demonstrate again high removal efficiency of MC-LR (as in Figure 1), and of MC-YR, but much lower removal efficiency of MC-RR, similar to the results presented in Figure 2.
The observed differences in removal efficiency between MC-RR congeners and the other MC compounds presumably reflect differences in molecular charge, since MC-RR congeners carry two arginine moieties and thus have an excess of positive charge that reduces their affinity to the granulated complexes of ODTMA–clay. These differences are further depicted in the results of the filtration simulation model.

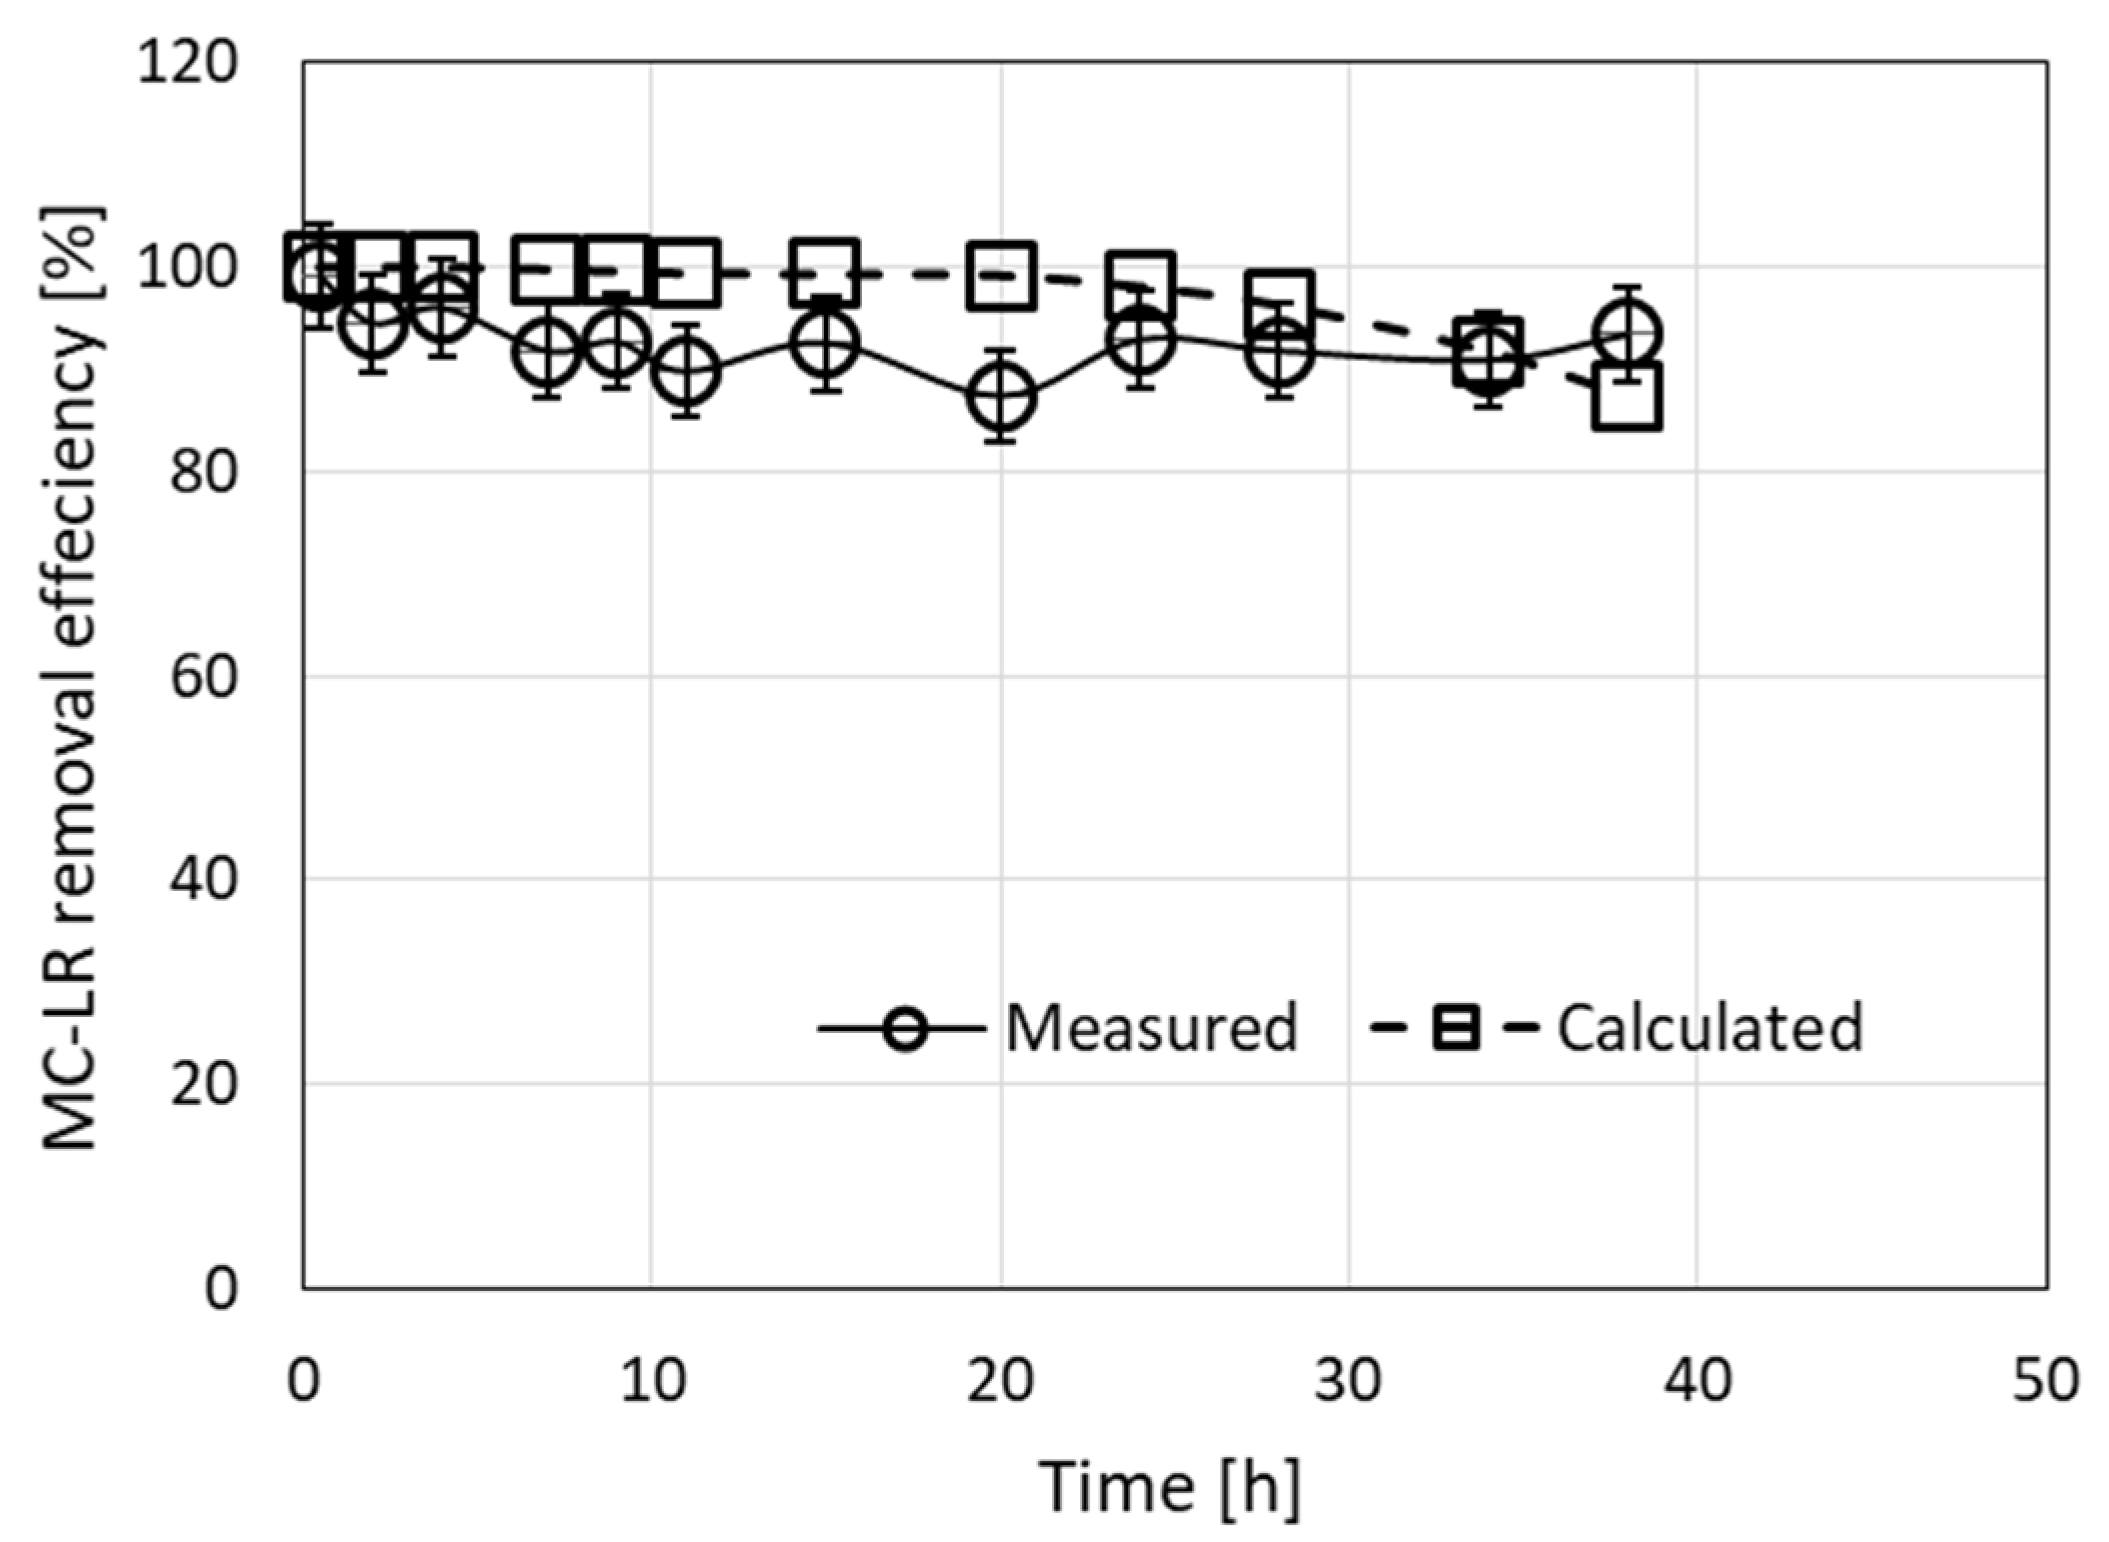
3.3. Fitting the Filtration Model to Experimental Results and Estimation of Adsorption Capacity

Application of the filtration-simulated model for the results presented in Figure 1A is shown in Figure 4. The MC-LR removal efficiency ranged between 87.4 and 99.1%, leaving less than 1 μg/L MC-LR in the effluent (8 out of 10 measurements). The calculated efficiency for this experiment ranged between 87.4 and 100%. The calculated root mean square error (RMSE) between the measured and calculated values was 6.6, indicating acceptable minor differences between the observed and estimated efficiency.
In an additional experiment, we used just 1 g of the complex mixed with excess sand and a 100 µg/L MC-LR solution. The results of this filtration experiment are presented in Figure 1B and the experimental removal efficiency data are compared with model calculations in Figure 5. The model ignored adsorption of the toxin by sand. The calculated results in Figure 5 indicate strong adherence to the experimental values of toxin removal (RMSE = 1.3). Considering the geometrical variations between the filters used for the experimental results shown in Figure 4 and Figure 5 and the fractions of pore volumes (out of total), which were 0.3 and 0.5, respectively, the value of R0 to be used in the calculations in Figure 5 had to be 0.00015 M−1 rather than the 0.0027 M−1 value used in Figure 4.
The viscosity of the medium of the granulated complex in Figure 4 was expected to be larger than that corresponding to Figure 5, where the filter included an excess of sand at a 52:1 w/w ratio. The theory of Smoluchowski [18] and Fuchs [19] treats aggregation and adsorption as a diffusional motion modified by the interaction energy between particles (reviewed in [20,21]). According to this theory, the values of C1 and D1 are inversely proportional to the viscosity of the medium. The values used for C1 and D1 in Figure 4 were 3000 M−1 min−1 and 0.003 min−1, respectively (Table 2), i.e., 3/8 of the values used in Figure 5, but the value of the affinity constant K= C1/D1 = 106 M−1 was the same.
Additional experiments were carried out by using a series of MC-LR solutions (5.5, 26.7, and 62 µg/L). Solutions were passed through column filters, each of 1 cm in diameter, which included a layer (10 cm, 7 g) of granulated ODTMA–bentonite. The 5.5-µg/L solution yielded zero emerging toxin for 100-h (30-L) filtration at a flow rate of 5 mL/min. The 26.7-µg/L solution yielded zero emerging concentrations of the toxin for 83-h (20-L) filtration at a flow rate of 4 mL/min. The experiment with 62 μg/L MC-LR solution yielded zero emerging MC-LR toxin for 50-h (12-L) filtration at a flow rate of 4 mL/min. However, in this case, the emergence of an identified MC congener (MC-like component) was observed for all volumes that passed beyond 0.5 L, as shown in Figure 6. The highest concentration of this compound, 3.8 µg/L, was measured after 36 h, whereas after 50 h, the value was 2.7 µg/L. In all three cases, the values of the concentrations of MC-LR toxin in the emerging water at the end of the filtration were below 1 µg/L. Calculations which employed the same parameters for all three concentrations of the MC-LR toxin could fit all the experimental values. The parameters employed were R0 = 0.005 M, C1 = 8000 M−1 min−1, and D1 = 0.003 min−1. In the case of a solution of 62 µg/L, we used the same value of R0 and C1 as for the other cases, but D1 was slightly enlarged to 0.005 min−1 (Table 2 and Figure 6).

3.4. Model Calculations for Filtration of Solutions with Several MCs

Fitting the filtration model to experiments with three MC congeners (MC-LR, MC-YR, and MC-RR (Figure 3)) predicted the emerging concentrations of LR and YR to be zero, whereas most of the MC-RR molecules were not retained in the filter after 670 min (Figure 7), indicating its smaller affinity to interact with the positively charged granules. Modeling these filtration results requires the use of seven parameters, i.e., R0 and Ci, Di (I = 1–3). A simplification was introduced by assuming that MC-LR and MC-YR are similar, thus using R0 = 0.005 M and the same kinetic rate constants as previously determined for MC-LR solutions (Table 2). This reduced the number of parameters to be determined to just two: CRR and DRR. The model results are presented in Figure 7 together with the measured results. The value of the forward rate constant CRR, 350 M−1 min−1 was almost 23-fold smaller than CLR, and the value of DRR (0.0075 min−1) was 1.5-fold larger than that of DLR. This implies that the affinity constant KRR = CRR/DRR = 4.7 × 10⁴ M−1 is 34-fold smaller than KLR = 1.6 × 10⁶ M−1. It is of interest to note that the use of Lake Kinneret water gave similar efficiency of MC-LR removal as for cell cultures, indicating that the presence of DOC molecules in the lake water had little effect on the adsorption of the toxins by the filter matrix.
Results of an additional filtration experiment, where a solution of four MC congeners originating from Microcystis culture was used (Figure 2), were modeled (Figure 8). The calculations required eight kinetic parameters, but we employed just four parameters by considering parameters for just two groups of toxins, each of which contained a pair of MC congeners, (MC-RR + MC [D-Asp3]-RR and MC-WR + MC [D-Asp3]-WR). The calculations used the values of CRR and DRR as for Figure 7 (Table 2). The value of R0 was reduced to 0.002 M, in order to fit the large emerging concentrations of the WR and RR toxins. The values determined were CWR = 1300 M−1 min−1 and DWR = 0.0012 min−1, which amount to KWR = 1.1 × 10⁶ M−1, 1.45-fold smaller than KLR. However, it should be noted that the value of R0 in the case of LR is 2.5-fold larger than that determined for WR. The results in the four parts of Figure 8 were considered as a combined sample of four competing toxins (2 pairs) for adsorption by the filter sites. The values of the statistical criteria for the fits of the calculated values to the experimental ones were RMSE = 3.6 and R2 = 0.944.
The experimental value of emerging concentration of RR at 630 min (352.4 µg/L) exceeds its initial value (321.3 µg/L) in the provided solution. This effect reflects the lower value of KRR than that of KWR and its corresponding larger rate constant of desorption, which results in a reduction in the adsorbed amounts of RR due to the competition with WR, when the available numbers of unoccupied surface sites of the complex in the filter are reduced. The mechanism is not a direct exchange reaction, but rather a statistical preference of occupying sites of the complex, which become vacant instantaneously due to desorption of RR. This effect was analyzed and shown experimentally for a pair of filtered herbicides [17].

3.5. Simulation and Prediction of Toxin Filtration by the ODTMA–Bentonite Granulated Complex—Summary of Kinetic Parameters

Table 2 presents the parameters deduced for simulation and prediction results of filtration of toxins from solutions of a single toxin or of a mixture of several toxins. The parameters obtained for a given case were used in other calculations, but values of R0, the total molar concentrations of adsorbing sites, vary as they depend on the concentration of the complex and the fraction of pore volume in the filter. The relatively small values (less than 1) are mainly due to the size of the toxin molecules (molecular masses around 1000 Da). The large values of the kinetic parameters of forward adsorption, Ci, and the small values of the dissociation, Di, in the cases of the toxins MC-LR and MC-YR reflect their large affinity of adsorption to the complex in the filter, which is expressed by K = C1/D1.
The analytical standard errors in the determined concentration of the toxins (Table 1, Figure 1, Figure 2, Figure 3 and Figure 9) were less than 5%. The standard errors of quantities in cellular systems are usually larger. In the case of MC-LR in Table 2, the values of the affinity coefficient, K, vary from 1.6 × 10⁶ to 2.7 × 10⁶ M−1 for the same value of R0. The variation in K-values corresponds to around 20% in the capacity of filters with this toxin.

3.6. The Capacity of the ODTMA–Bentonite Complex for Filtration of Microcystin Solutions

The capacity is given by dividing the volume filtered with emerging toxin concentrations below 1 µg/L by the weight of the complex contained in the filter. In the case of the solution of 5.5 µg/L MC-LR, the value of the capacity after the passage of 30 L is 30 L/7 g = 4.3 L/g (or m3/kg). However, the calculations indicate that the concentration of MC-LR in the emerging water after filtration of 30 L is only 0.1 µg/L. Extending the filtration to 110 h, or 33 L, would yield a value of the emerging concentration of the toxin, C = 0.9 µg/L, and the capacity would be 4.7 m3/kg. For the 62 µg/L solution, the corresponding capacity is 2 m3/kg. A calculation tested the possibility to extend the capacity of the ODTMA–clay granulated material by using a large-scale filter. A 1-m-long filter operated at a flow velocity of 6 m/h yielded an increase in capacity to 6 m3/kg for a solution of 5.5 µg/L of toxin. For a solution of 5 µg/L of toxin and a velocity of 1 m/h, the capacity would be 8 m3/kg. Another aspect is the maximal loading of the toxin by the complex during filtration. For a toxin solution of 62 µg/L, the loading is 120 mg/kg. Calculations on the passage of a 1-mg/L solution of MC-LR indicated that a long filter could adsorb up to 1.5 g MC-LR per kg of complex with emerging concentration below 1 µg/L. The total amount of toxin which can be retained in such a filter irrespective of the emerging toxin concentration can reach 3 g per kg of complex. The maximal adsorbed loadings which satisfy emerging concentrations below 1 µg/L were as follows for several other MC congeners: 0.4 g/kg for MC-WR, and a significantly lower value of 0.012 g/kg for MC-RR.

3.7. Granulated Activated Carbon (GAC) to Complement MC Removal by ODTMA–Bentonite Granulated Complex

Removal of MCs from drinking water is widely achieved by adsorption on activated carbon, either powdered or granular activated carbon (GAC). The first is used as a temporary treatment for transient contaminants and the latter in fixed beds [4]. The poor adsorption capacity of the ODTMA–bentonite granulated complex for MC-RR and its derivatives calls for the application of a complementary filtration medium. For this purpose, we evaluate the effectiveness of granulated activated carbon. Using a fresh batch of GAC packed in the same column system described for the ODTMA–bentonite granules, MC congeners were removed from a multi-toxin solution, extracted from M. aeruginosa culture (as described for Figure 2 and Figure 8). The results of these filtration experiments (Figure 9) show improved affinity of GAC for MC-RR congeners. A removal efficiency of around 50% was recorded for both MC-RR congeners, when the total load reached 0.1 mg MC-RR (using 5.15-g GAC column) as opposed to poor efficiency by the ODTMA–bentonite granulated complex column under the same flow conditions (Figure 2). Removal of MC-WR congeners by the GAC column was not as efficient as by the ODTMA–bentonite granulated complex column (Figure 9 vs. Figure 2). Much higher MC removal efficiency was reported for the activated carbon filtration system [22,23].
GAC demonstrated different adsorption efficiencies for different microcystin congeners: MC-RR and MC-WR were the most and least adsorbed congeners, respectively. Based on these complementary results, it is recommended that ODTMA–clay granulated composites should be applied as remediation process together with GAC, presenting a multi-barrier approach [24,25]. Application of a convection and adsorption/desorption model allows the prediction of adsorption capacity for microcystin congeners and might help in the design of large-scale filtration steps to improve potable water quality. GAC filtration has been shown to be effective for the removal of MCs from drinking water, as it is not only an efficient adsorbent but also can support the biodegradation of microcystins via the development of an active biofilm [26].
We compared the adsorption characteristics of MC-LR between the micelle–clay complex and sterile GAC during the early stage of the filtration process. In this comparison, we performed calculations on the removal of MC-LR from a water solution of 5 µg/L by the same filter as in Wang et al. [26], using the same flow velocity and flow rate (flow velocity = 1 cm/min; flow rate = 4.91 mL/min), but filled with the granulated micelle–clay complex. The masses of the sterile GAC and micelle–clay complex used for this estimation were 36.8 and 59 g, respectively. After 20 d, the emerging MC-LR was at a concentration of around 0.5 µg/L. The calculation gives this value of emerging toxin after 64.9 d, or when normalizing the mass to that of the sterile GAC, the time would be 40.4 d, or twice that in the case of sterile GAC. Hence, the sorption capacity during filtration of the micelle–clay complex of the MC-LR toxin is around two-fold larger than that of GAC. On the other hand, the system described in [26] appears to be much more efficient in the removal of the toxin, due to the development of bacterial biofilms that degrade microcystins. Recently, we developed a model that simulates filtration in which a biological degradation component was added to the sorption/desorption processes [27]. For an efficient and reliable procedure of the removal of cyanotoxins, it is suggested to combine two elements in series, a filter with activated carbon followed by the micelle–clay one. The micelle–clay filter will complement the activity of GAC upon the occurrence of unfavorable conditions for the activity of the toxin-degrading bacteria, such as chemicals, or temperatures outside the optimal range. In addition, the micelle–clay filter will capture bacteria which escape the activated carbon filter.

Author Contributions

Conceptualization, S.N. and A.S.; methodology, A.S. and S.N.; formal analysis, Y.V.-M., D.M., I.T. and A.R.B.; writing—original draft preparation, A.S. and S.N.; writing—review and editing, A.S., A.R.B., Y.V.-M. and S.N.; funding acquisition, A.S. and S.N. All authors have read and agreed to the published version of the manuscript.

Funding

This research was supported by a grant from Ministry of Science & Technology, Israel, and the Ministry of Science and Technology of the People’s Republic of China (Research no. 3-15707).

Institutional Review Board Statement

Not applicable.

Informed Consent Statement

Not applicable.

Data Availability Statement

Not applicable.

Conflicts of Interest

The authors declare no conflict of interest. The funders had no role in the design of the study; in the collection, analyses, or interpretation of data; in the writing of the manuscript, or in the decision to publish the results.

References

  1. Harke, M.J.; Steffen, M.M.; Gobler, C.J.; Otten, T.G.; Wilhelm, S.W.; Wood, S.A.; Paerl, H.W. A review of the global ecology, genomics, and biogeography of the toxic cyanobacterium, Microcystis spp. Harmful Algae 2016, 54, 4–20. [Google Scholar] [CrossRef] [Green Version]
  2. Meriluoto, J.; Spoof, L.; Codd, G.A. Handbook of Cyanobacterial Monitoring and Cyanotoxin Analysis; John Wiley & Sons: Hoboken, NJ, USA, 2017. [Google Scholar]
  3. Díez-Quijada, L.; Prieto, A.I.; Guzmán-Guillén, R.; Jos, A.; Cameán, A.M. Occurrence and toxicity of microcystin congeners other than MC-LR and MC-RR: A review. Food Chem. Toxicol. 2019, 125, 106–132. [Google Scholar] [CrossRef]
  4. Westrick, J.A.; Szlag, D.C.; Southwell, B.J.; Sinclair, J. A review of cyanobacteria and cyanotoxins removal/inactivation in drinking water treatment. Anal. Bioanal. Chem. 2010, 397, 1705–1714. [Google Scholar] [CrossRef]
  5. Szlag, D.; Sinclair, J.; Southwell, B.; Westrick, J. Cyanobacteria and cyanotoxins occurrence and removal from five high-risk conventional treatment drinking water plants. Toxins 2015, 7, 2198–2220. [Google Scholar] [CrossRef] [Green Version]
  6. Sukenik, A.; Viner-Mozzini, Y.; Tavassi, M.; Nir, S. Removal of cyanobacteria and cyanotoxins from lake water by composites of bentonite with micelles of the cation octadecyltrimethyl ammonium (ODTMA). Water Res. 2017, 120, 165–173. [Google Scholar] [CrossRef]
  7. Shtarker-Sasi, A.; Castro-Sowinski, S.; Matan, O.; Kagan, T.; Nir, S.; Okon, Y.; Nasser, A.M. Removal of bacteria and Cryptosporidium from water by micelle–montmorillonite complexes. Desalination Water Treat. 2013, 51, 7672–7680. [Google Scholar] [CrossRef]
  8. Nir, S.; Brook, I.; Anavi, Y.; Ryskin, M.; Ben-Ari, J.; Shveky-Huterer, R.; Etkin, H.; Zadaka-Amir, D.; Shuali, U. Water purification from perchlorate by a micelle–clay complex: Laboratory and pilot experiments. Appl. Clay Sci. 2015, 114, 151–156. [Google Scholar] [CrossRef]
  9. Rakovitsky, N.; Brook, I.; Van Rijn, J.; Ryskin, M.; Mkhweli, Z.; Etkin, H.; Nir, S. Purification of greywater by a moving bed reactor followed by a filter including a granulated micelle-clay composite. Appl. Clay Sci. 2016, 132, 267–272. [Google Scholar] [CrossRef]
  10. Kalfa, A.; Rakovitsky, N.; Tavassi, M.; Ryskin, M.; Ben-Ari, J.; Etkin, H.; Shuali, U.; Nir, S. Removal of Escherichia coli and total bacteria from water by granulated micelle-clay complexes: Filter regeneration and modeling of filtration kinetics. Appl. Clay Sci. 2017, 147, 63–68. [Google Scholar] [CrossRef]
  11. Mishael, Y.G.; Undabeytia, T.; Rabinovitz, O.; Rubin, B.; Nir, S. Slow-release formulations of sulfometuron incorporated in micelles adsorbed on montmorillonite. J. Agric. Food Chem. 2002, 50, 2864–2869. [Google Scholar] [CrossRef] [Green Version]
  12. Stanier, R.Y.; Kunisawa, R.; Mandel, M.; Cohen-Bazire, G. Purification and properties of unicellular blue-green algae (order chroococcales). Bacteriol. Rev. 1971, 35, 171–205. [Google Scholar] [CrossRef]
  13. Ninio, S.; Lupu, A.; Viner-Mozzini, Y.; Zohary, T.; Sukenik, A. Multiannual variations in Microcystis bloom episodes—Temperature drives shift in species composition. Harmful Algae 2020, 92, 101710. [Google Scholar] [CrossRef]
  14. Nir, S.; Ryskin, M. Method of Making and Using Granulated Micelle-Clay Complexes for Removal of Pollutants from Water. U.S. Patent 10384959, 20 August 2019. [Google Scholar]
  15. Lawton, L.A.; Edwards, C.; Codd, G.A. Extraction and high-performance liquid chromatographic method for the determination of microcystins in raw and treated waters. Analyst 1994, 119, 1525–1530. [Google Scholar] [CrossRef]
  16. Flores, C.; Caixach, J. Analysis of microcystins by online solid phase extraction–liquid chromatography tandem mass spectrometry. In Handbook of Cyanobacterial Monitoring and Cyanotoxin Analysis; Meriluoto, J., Spoof, L., Codd, G.A., Eds.; John Wiley and Sons: Chichester, UK, 2017; pp. 362–371. [Google Scholar]
  17. Nir, S.; Zadaka-Amir, D.; Kartaginer, A.; Gonen, Y. Simulation of adsorption and flow of pollutants in a column filter: Application to micelle–montmorillonite mixtures with sand. Appl. Clay Sci. 2012, 67, 134–140. [Google Scholar] [CrossRef]
  18. Smoluchowski, M. Mathematical theory of the kinetics of the coagulation of colloidal solutions. Z. Phys. Chem. 1917, 92, 129–168. [Google Scholar]
  19. Fuchs, N. Zur theorie der koagulation. Z. Phys. Chem. 1934, 171, 199–208. [Google Scholar] [CrossRef]
  20. Nir, S.; Bentz, J.; Wilschut, J.; Duzgunes, N. Aggregation and fusion of phospholipid vesicles. Prog. Surf. Sci. 1983, 13, 1–124. [Google Scholar] [CrossRef]
  21. Nir, S.; Shuali, U. Water Purification by Micelle-Clay Nano-Particles; Nova Science Publishers: New York, NY, USA, 2019. [Google Scholar]
  22. Drogui, P.; Daghrir, R.; Simard, M.-C.; Sauvageau, C.; Blais, J.F. Removal of microcystin-LR from spiked water using either activated carbon or anthracite as filter material. Environ. Technol. 2012, 33, 381–391. [Google Scholar] [CrossRef] [PubMed]
  23. Cook, D.; Newcombe, G. Comparison and modeling of the adsorption of two microcystin analogues onto powdered activated carbon. Environ. Technol. 2008, 29, 525–534. [Google Scholar] [CrossRef]
  24. Pham, T.-L.; Dang, T.N. Microcystins in freshwater ecosystems: Occurrence, distribution, and current treatment approaches. In Water and Wastewater Treatment Technologies, Energy, Environment, and Sustainability; Bui, X.-T., Chiemchaisri, C., Fujioka, T., Varjani, S., Eds.; Springer Nature: Singapore, 2019; pp. 15–36. [Google Scholar]
  25. Roegner, A.F.; Brena, B.; González-Sapienza, G.; Puschner, B. Microcystins in potable surface waters: Toxic effects and removal strategies. J. Appl. Toxicol. 2014, 34, 441–457. [Google Scholar] [CrossRef] [PubMed]
  26. Wang, H.; Ho, L.; Lewis, D.M.; Brookes, J.D.; Newcombe, G. Discriminating and assessing adsorption and biodegradation removal mechanisms during granular activated carbon filtration of microcystin toxins. Water Res. 2007, 41, 4262–4270. [Google Scholar] [CrossRef] [PubMed]
  27. Cheriker, H.; Bauer, T.S.; Oren, Y.; Nir, S.; Hayouka, Z. Immobilized random peptide mixtures exhibit broad antimicrobial activity with high selectivity. Chem. Commun. 2020, 56, 11022–11025. [Google Scholar] [CrossRef]
Figure 1. Residual MC-LR in effluents following filtration of toxin solution of (A) 10 μg/L; (B) 100 μg/L and (C) 49 μg/L as a function of the accumulated MC-LR loaded on the column. For A and B, pure MC-LR solutions were used. For C, MC-LR originating from Microcystis aeruginosa strain PCC7806 biomass was used. See the text for more details on the experiments. The column in (A) and (C) contained 9 g of granulated complexes of ODTMA–clay, whereas the column in B contained only 1 g of the granules mixed with washed quartz. The black dots in the graphs represent specific MC concentrations in the loaded solutions. Analytical standard error for MC-LR is less than 5%.
Applnano 02 00006 g001
Figure 2. Residual MC congeners in effluents of filtration experiments, using extracts from M. aeruginosa C1004 cultures from various growth phases, as a function of the accumulated MCs loaded on the columns of granulated complexes of ODTMA–clay. Results for three runs corresponding to different cultures (Table 1) are presented. The upper panels show data for MC-RR and MC [D-Asp3]-RR and lower panels for MC-WR and MC [D-Asp3]-WR. The black dots in the graphs represent specific MC concentrations in the loaded solutions. Analytical standard error for MCs was less than 5%.
Applnano 02 00006 g002
Figure 3. Residual MC congeners in effluents following filtration experiments using extracts from Microcystis biomass collected from Lake Kinneret, as a function of the accumulated MCs loaded on the columns of granulated complexes of ODTMA–clay. The black dots in the graphs represent specific MC concentrations in the loaded solutions. Analytical standard error for MCs was less than 5%.
Applnano 02 00006 g003
Figure 4. Removal of MC-LR from a 10-µg/L solution by filtration through a column filled with a granulated complex of ODTMA–clay at a flow rate of 3.2 mL/min for 38 h. Experimental results are presented along with the results of the simulation model (RMSE = 6.6). The parameters used in the calculations were R0 = 0.0027 M, C1 = 3000 M−1 min−1, D1 = 0.003 min−1.
Applnano 02 00006 g004
Figure 5. Experimental and calculated values of removal efficiency of MC-LR from a 100-µg/L solution filtrated through a column of 30-cm length and 1.6-cm diameter, filled with 1 g of granulated complex of ODTMA–clay mixed with excess sand. A flow rate of 4 mL/min was used. The values of the parameters used in the calculations were R0 = 1.5 × 10⁻⁴ M, C1 = 8000 M−1 min−1, D1 = 0.008 min−1. The fit gave (RMSE = 1.4).
Applnano 02 00006 g005
Figure 6. Emerging concentrations (measured and calculated) of MC congeners during filtration of a 62-µg/L MC solution. The measured emerging concentrations include both MC-LR and MC-like congeners. The calculated root mean square deviation (RMSE) for the measured vs. calculated values was 2.4, considering both MC-LR and MC-like measured congeners. The parameters used in the calculations were R0 = 0.005 M, C1 = 8000 M−1 min−1, and D1 = 0.005 min−1. Using the value D1 = 0.003 min−1 gives calculated emerging values of 0 at all times. The black dots in the graphs represent MC-LR concentrations in the loaded solution.
Applnano 02 00006 g006
Figure 7. Emerging concentrations (measured and calculated) of MC-LR, MC-YR, and MC-RR during filtration of an MC solution originating from Microcystis biomass collected from Lake Kinneret. The black dots in the graphs represent specific MC concentrations in the loaded solutions. The calculated root mean square error (RMSE) for the measured vs. calculated values for MC-RR was 1.4. Measured and calculated emerging concentrations for MC-LR and MC-YR were 0. The fit of all calculated to experimental points yielded R2 = 0.98.
Applnano 02 00006 g007
Figure 8. Emerging concentrations (measured and calculated) of MC-WR, MC [D-Asp3]-WR, MC-RR, and MC [D-Asp3]-RR, during filtration of the MC solution originating from Microcystis culture (Figure 2). The black dots in the graphs represent specific MC concentrations in the loaded solutions. The calculated root mean square error (RMSE) for the measured vs. calculated values for the whole combined dataset was 3.6 and the value of R2 was 0.944.
Applnano 02 00006 g008
Figure 9. Residual MC congeners in effluents of filtration experiments, using extracts from a culture of M. aeruginosa strain C1004 (mid-exponential phase), as a function of the accumulated MCs loaded on a column of granulated activated carbon (GAC). The left panel shows data for MC-RR and MC [D-Asp3]-RR and the right panel for MC-WR and MC [D-Asp3]-WR. The black dots in the graphs represent specific MC concentrations in the loaded solutions. Analytical standard error for MCs was less than 5%.
Applnano 02 00006 g009
Table 1. MC sources, types, and concentrations, in extracts originating from Microcystis cultures and Microcystis biomass collected from Lake Kinneret (LK) and used in filtration experiments using beds of granulated complexes of ODTMA–clay. Analytical standard error for MCs was less than 5%.
MC SourceDOC (μg/L)Total MC (μg/L)Major MC Congeners (μg/L)
MC-LRMC-YRMC-RRMC [D-Asp3]-RRMC-WRMC [D-Asp3]-WR
M. aeruginosa C1004—Early exponential phase5.8250n.f.n.f.371711284
M. aeruginosa C1004—Mid-exponential phase8.0242n.f.n.f.87357347
M. aeruginosa C1004—Late stationary phase38.01553n.f.n.f117204383829
LK population3.3152834326n.f.n.f.n.f.
M. aeruginosa PCC78063.34949n.f.n.f.n.f.n.f.n.f.
n.d.—not determined; n.f.—not found.
Table 2. Kinetic parameters used in simulations and predictions of MC toxin filtration of columns filled with ODTMA– bentonite granulated complex.
MC Type and Conc. (µg/L)R0 (M)C1 (M−1 min−1)D1 (min−1)K (M−1)Data Presented in
MC-LR, 100.002730000.003106Figure 1A/Figure 4, B1
MC-LR, 1000.0001580000.008106Figure 1B/Figure 5, B1
MC-LR, 5.50.00580000.0032.7 × 106Figure 2/Figure 6, B2
MC-LR, 26.70.00580000.0032.7 × 106Figure 2/Figure 6, B2
MC-LR, 620.00580000.005/0.0031.6 × 106/2.7 × 106Figure 2/Figure 6, B2
MC-LR, 83
MC-YR, 43
MC-RR, 25.9
0.0058000
8000
350
0.005
0.005
0.0075
1.6 × 10⁶
1.6 × 10⁶
4.7 × 10⁴
Figure 3/Figure 7
MC-WR
MC-RR
0.0021300
350
0.0012
0.0075
1.1 × 10⁶
4.7 × 10⁴
Figure 8
Publisher’s Note: MDPI stays neutral with regard to jurisdictional claims in published maps and institutional affiliations.

