Agent-Based Modeling of Rumor Propagation Using Expected Integrated Mean Squared Error Optimal Design


1
Department of Business Administration, Chung Yuan Christian University, 200 Chung Pei Road, Chung Li District, Taoyuan City 32023, Taiwan
2
Institute of Industrial Management, National Central University, 300 Zhongda Road, Zhongli District, Taoyuan City 32001, Taiwan
*
Author to whom correspondence should be addressed.
Appl. Syst. Innov. 2020, 3(4), 48; https://0-doi-org.brum.beds.ac.uk/10.3390/asi3040048
Submission received: 26 September 2020
/
Revised: 23 October 2020
/
Accepted: 6 November 2020
/
Published: 10 November 2020
(This article belongs to the Collection Feature Paper Collection in Applied System Innovation)
Abstract
:In the “Age of the Internet”, fake news and rumor-mongering have emerged as some of the most critical factors that affect our online social lives. For example, in the workplace, rumor spreading runs rampant during times when employees may be plagued with uncertainty about the nature and consequences of major changes. Positive information should be widely propagated as much as possible; however, we must limit the spread of rumors in an effort to reduce their inherently harmful effects. The purpose of this research is to explain the mechanisms for controlling rumors and suggest an approach for dispelling the rumor effect in the workplace. In this study, we will present a simple simulation framework of agent-based modeling and apply Social Impact Theory to explain rumor propagation within social networks. Based on our results, we have found that organizations can significantly reduce the spread of the rumors by improving the workplace environment and instituting counseling for those in management positions.
1. Introduction
Scholars have focused on workplace-based research for many years; however, current challenges seem most daunting, such as the spreading of rumors, which is one of the most critical problems that managers encounter. Many have come to realize that a failure to react quickly and effectively to rumors can have devastating consequences [1]. A rumor can be defined as “a proposition for the belief of a topical reference disseminated without official verification” [2]. Throughout our lifetime, we are exposed to countless rumors and positive information. Rumors about crime, tainted food, the possible outbreak of war, etc., can cause serious problems, even threaten our careers, relationships, governmental policies, public officials, democracy, and sometimes even peace itself [3]; however, it seems they are unavoidable. Scholars have researched this fascinating topic for many decades, yet it remains a critical problem today. Furthermore, with the popularity of social media outlets such as Facebook and Twitter, rumors have greater potential to disperse even wider and faster than ever before [4].
Many models, such as the mathematical method [5], agent-based modeling [6], network-based modeling [7], and the stochastic method [8], have been proposed to better understand the mechanisms of rumor spreading. Daley and Kendal [5], who proposed one of the most widely used models for studying such social phenomena, investigated a classic SIR model (DK model), which divides the agents into three groups: those who are susceptible, infected, or recovered. Although the first group is unaware of the rumor, they are vulnerable to becoming infected by it. The second group actively spreads the rumor, and the last group does not believe it or forgets about it. Most researchers in the past [8,9,10] employed differential equations and the SIR model to rumor propagation with the assumption of homogeneity. We now know this not to be the case, since rumor spreading is driven by individual behavior and interactions, and acknowledgment of heterogeneity is necessary to effectively study these complex social interactions. It must be noted that both recognition of homogeneity and heterogeneity are essential for rumor research. By comparing differential equations and agent-based modeling, Rahmandad and Sterman [11] were able to show both the strengths and weaknesses of these two methods in their study of contagious disease. Differential equations do not adequately describe individual behavior and the complexity of interactions between agents [12]. Besides designing a survey method, the computer-simulation method reduces time-cost. It also can explore the general effects of a real-world situation in a wide range of conditions. Since our study focuses more on heterogeneity, we decided to use agent-based modeling to formulate and predict the reactions of agents to the social environment based on Social Impact Theory [13]. Both researchers and practitioners can use the proposed method for examining and countering the rumor propagation.
The objectives of this study are as follows: (1) identify and evaluate the factors that impact the spread of rumors, and (2) propose a strategy to counteract these phenomena using agent-based modeling and Social Impact Theory. This paper is organized as follows. Section 2 describes the process of rumor propagation; Social Impact Theory; and agent-based modeling. In Section 3, we present our proposed model and discuss our simulation and experimental design. The results and conclusion are described in Section 4 and Section 5.
2. Literature Review
2.1. Rumor Propagation
Over the past decade, there has been an increased interest in improving the quality of working environments by studying such hot button topics as bullying, gossip, rumor spreading, and workplace aggression [14,15,16]. Gossiping and spreading rumors, which are common in the workplace, not only affect attitudes and opinions but also work performance and behavior among employees [15,17]. Such rumors may cause hostility, fear, and anxiety. In contrast, positive information may improve cooperation and trust among individual members of a group [18]. People tend to pay more attention to rumors than positive information. In the working environment, rumors often circulate about the management, company operations, and especially other employees. Spreading rumors about colleagues is a form of workplace bullying that can be very harmful to the organization. According to LeBlanc and Barling [19], the most frequent manifestation of insider-initiated aggression is rumor propagation. Therefore, managers must find effective strategies to deal with this unconscionable behavior before it spreads out of control.
Traditionally, rumors are propagated through oral communication. Each person having N elements in the network is in one of the three groups (susceptible, infected, and recovered). The agents who would like to spread a rumor must convince those in the susceptible group to believe it. However, if they are not persuaded, they will move to the recovered group. If those in the susceptible group do believe the rumor, they may begin to spread it to others. According to social psychologists, the most common mechanism for rumor diffusion is social communication [20]. In addition, the internet and telecommunication channels provide easily accessible methods for individuals to interact, and to communicate all kinds of information, including rumor propagation [21].
2.2. Social Impact Theory
Proponents of Social Impact Theory study the effect of an individual on others by considering the strength, immediacy, number of sources, and targets [13]. If the number of members in a group increases, their impact on the target person should also increase as some root of “N” and vice versa. The formula of this theory is described in Equation (1).
where a is the persuasiveness constant, s represents the strength of the agent, and d is the distance between the two agents. Based on Social Impact Theory, Dynamic Social Impact Theory (DSIT) examines the impact of clustering, correlation, consolidation, and continuing diversity characteristics on social influence [22,23]. However, Dynamic Social Impact Theory does not clearly show strength effects as the main factor of social impact. In this study, we extended Social Impact Theory as a dynamic instead of a static model by representing individuals’ impact over time for simulating rumor propagation.
This theory has been applied to a wide variety of phenomena, including language change [24], social loafing [25], student STEM selection [26], and bullying [27]. According to Latané et al. [28] and Nettle [24], the relationship between distance and social impact is critical to the model; however, environmental biases are not considered. Based on the hypothesis that environmental bias can affect the strength of the impact when models are applied in specific situations, Allen and Davis [26] slightly extended Nettle’s [24] model by incorporating the environmental bias parameter. In addition, Tseng, Chen, Yu, and Wang [27] added the element of weight with the agent’s strength to Allen and Davis [26] in order to classify groups of students while studying bullying in school.
2.3. Agent-Based Modeling
Since the 1990s, social scientists have used computer simulations to model, observe, and understand social processes [29]. According to Railsback and Grimm [30], agent-based modeling (ABM) is employed in situations where individuals or agents (e.g., organisms, humans, businesses, institutions, or any other entities) interact with each other and their environment over time. This advantage is distinguishing feature compared to other simulation techniques such as discrete-event simulation and system dynamics [31]. In addition, unlike traditional modeling, ABMs can address complex, multilevel problems even if the user lacks advanced mathematical and statistical skills.
Macy and Willer [32] proposed the following four key assumptions of ABM: agents are autonomous, they are independent, they follow simple rules, and they are adaptive and backward-looking. ABMs have been widely applied in many fields such as the physical sciences, biology, business [33,34], education theory [26,27], and the social sciences [29,35,36]. Liu and Chen [6] examined rumor propagation in a scale-free network via agent-based modeling (NetLogo software) based on the SIR model. Recently, Kaligotla, et al. [37] investigate rumor diffusion through Erdös–Renyi, scale-free, and small-world networks on social media. However, their models failed to consider the interactions of each agent and the effect of distance on the impact of persuasion.
3. Methodology
3.1. The Proposed Model
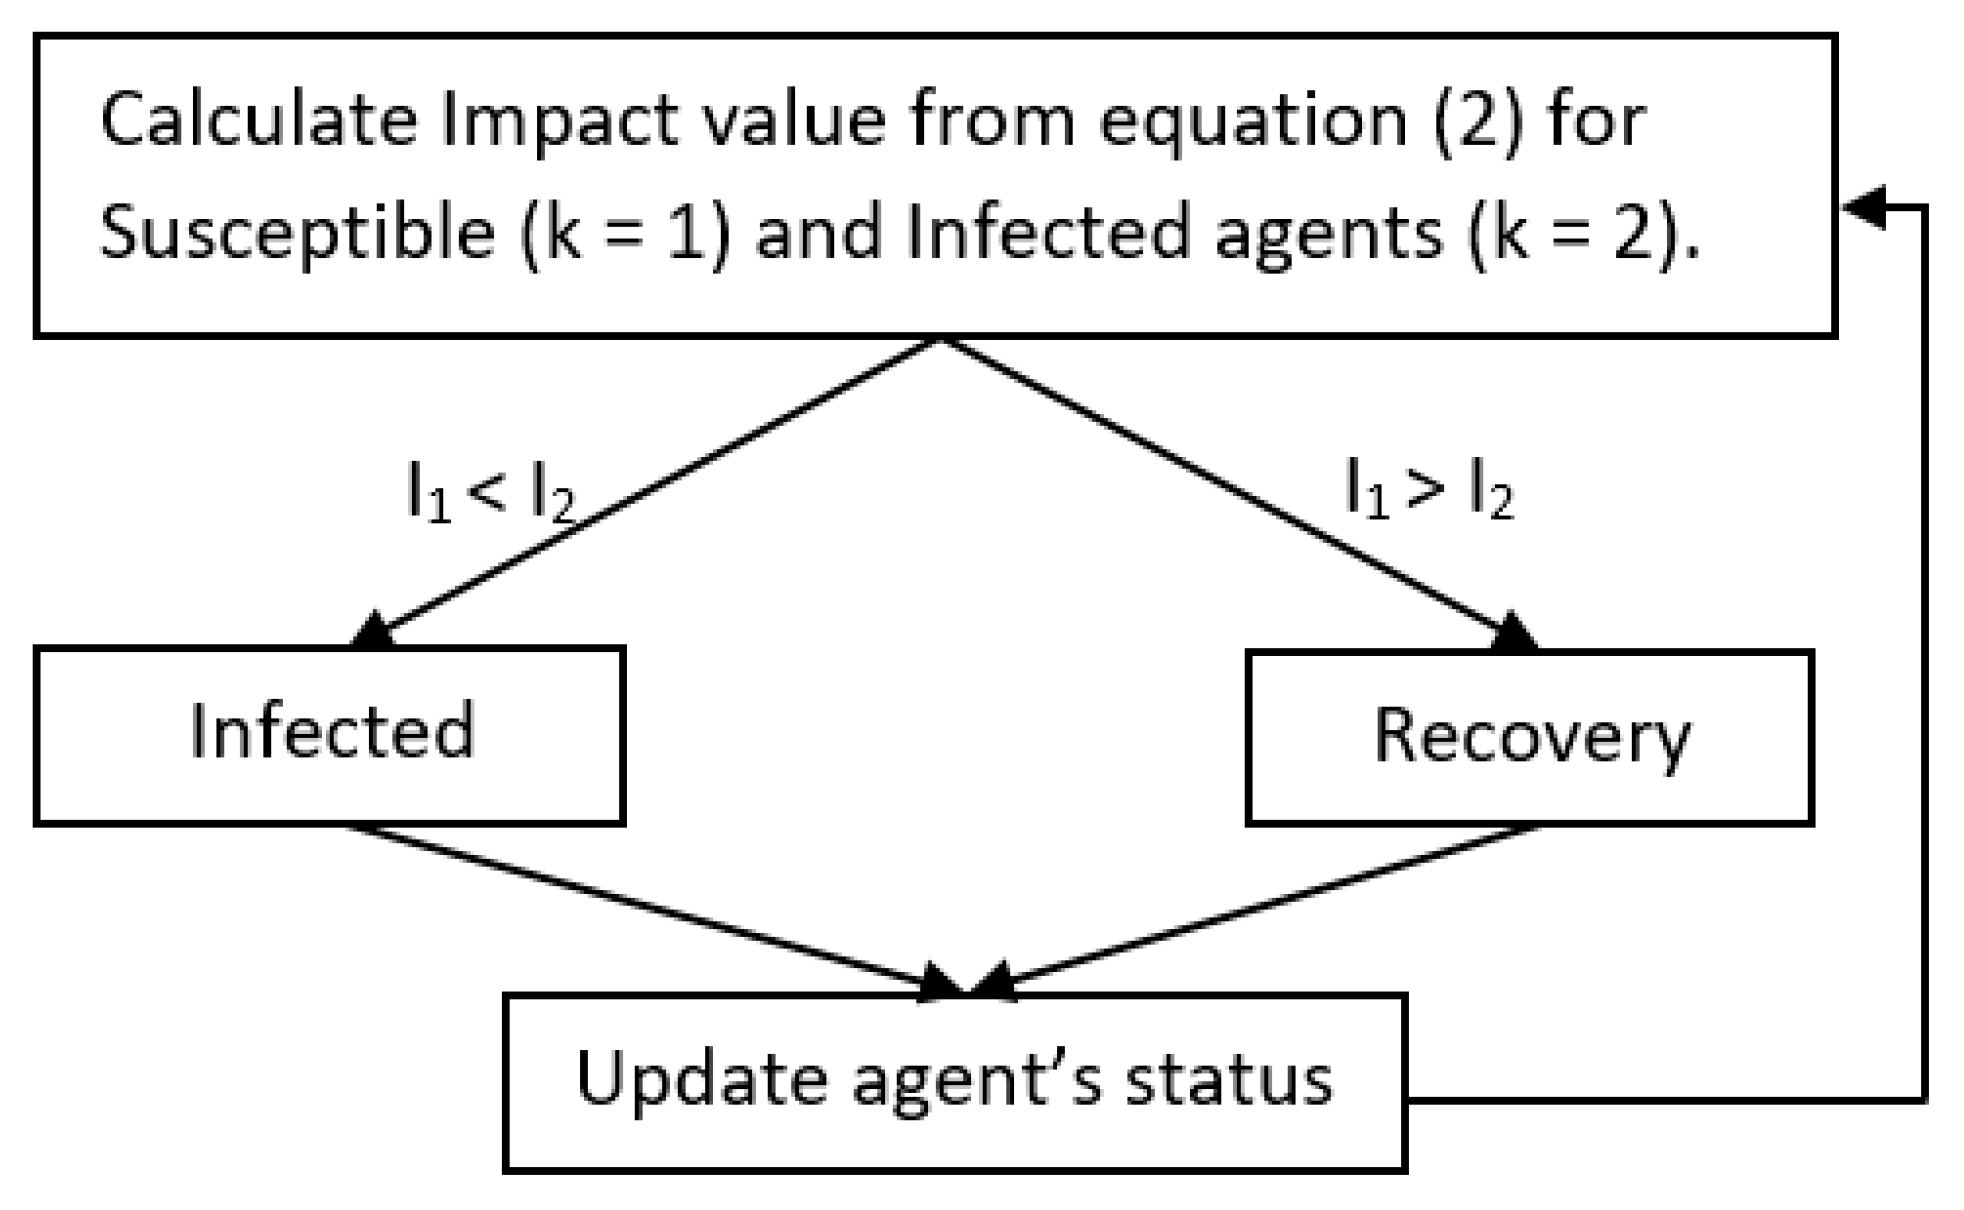
In this section, the proposed model, which was based on our conceptual model presented in the previous section, was implemented with agent-based modeling via NetLogo software version 6.0.4, a free software platform that enabled us to incorporate some of the key conditions observed in real-world observations (e.g., modeling the heterogeneity of agents). According to Wilensky [38], NetLogo is a multi-agent programming language that is particularly well suited for modeling complex system phenomena. It allows researchers to explore the micro and macro-level interactions of many individuals without having to be experts in a programming language [26,30]. The proposed simulation flow chart is shown in Figure 1.
All parameters in this simulation have two levels, as shown in Table 1. Face-to-face discussions have more influence than those from the media or online communication [39]. For this reason, we kept the distance factor and added “”as the online communication parameter to describe the effect of social media networking in the simulation model, which is based on the “SITSIM” model [40] in our research. In the SITSIM model, the impact of a turtle on others is based on Social Impact Theory, while turtles are randomly distributed and assigned with ‘’strength’’. The more distance between two turtles, the less impact to each other. According to Latané [13], people with high levels of knowledge, educational background, and emotional “strength” will have the most influence on the target person. In this study, we proposed to extend Social Impact Theory [24,26,27] to explore rumor spreading. The proposed equation based on Social Impact Theory is as follows:
where “L” is the counseling of leaders or supervisors and “E” represents a bias in the workplace environment. symbolizes the number of agents of variant k with “” as an exponent, which can be referred to as the “persuasiveness constant”; “” is the distance between the two i and j agents; “” is the strength of agent I; and is the percentage of the types of social media users such as email, Facebook, Line, or Skype, for online communication.
In this experiment, the conditions of the model can be changed based on the following parameters: (1) persuasive-constant “a” ranged from 0.5 to 0.75 [26]; (2) environmental bias in the workplace was set between 0.9 and 1.1 to ensure the stability of the model [24]. (3) The leader or supervisor “L” is referred to as a teacher or counselor in [26,27]. (4) We measured social network usage during working hours in a range from 0.1 to 0.9 or 10% to 90% of the total communication in the workplace, and the distance between the two agents “” and “”. (5) The power of influencer can refer to higher strength “” than the normal (with 20 to 40% influencer in group). Therefore, the cohort size can be divided into two groups: the influencers and the followers , with independence identically distributed to determine the effect of influencers on followers in this model. In reality, some individuals in the workplace are more able to convince or influence others, even if they lack a high position in the organization. We assume that the rumor began in a group of 20 people and spread to 40% of the workplace population.
Let us say that an organization has 20 infected people who spread the rumor to 30 of those in the susceptible group (with a = 0.5, E = 0.9, L = 0.75, ). In this scenario, if person A in the infected group meets person B in the susceptible group, A can spread the rumor to B or not based on the impact power score shown in Equation (2) below:
when comparing , A has more impact than B, so he or she can persuade B to believe the rumor. Then, B moves to the infected group in the next step.
In this simulation, all agents have various levels of impact on each other, as shown in Equation (2). If the infected agent has a higher impact value than a susceptible agent, he/she will persuade the former to believe in the rumor, or the infected agent will stop spreading the rumor and move to the recovered group. After each time step, 20 new people from random locations join the company (and the model), so the distance among agents remains random, which mirrors work-contact in reality, until the cohort size reaches 1500 people (with 75 replications). The reason we did not perform the simulation with 1500 people from the beginning was because we were trying to reduce random move bias in the model when the period was not included in this simulation.
The interface of the rumor spreading model is shown in Figure 2 with parameter adjustments and outputs of numbers and plot. On the left side of the simulation in Figure 2, all parameters can be changed easily based on a different range of conditions with green sliders and input variables, while the outputs such as the number of infected and plot are in wheat color. The simulation initializes with the “setup” button and runs by clicking “go once” for running once tick at a time or the “go” button forever until we stop.
3.2. Experimental Design
In order to analyze the major elements, we designed a simulation experiment to generate the criteria of rumor spreading by applying Expected Integrated Mean Squared Error (EIMSE), which was proposed by Allen et al. [41]. According to Allen, Yu, and Schmitz [41], EIMSE optimal design could be more accurate in regard to low prediction errors than alternatives, such as D-optimal design. Thus, EIMSE can minimize the expected meta-model prediction errors while improving the accuracy of prediction. By combining the variance and bias errors in a single criterion, the EIMSE criterion yields a simple interpretation of the expected squared errors, which can be defined in the equation below:
where “”are regression model predictions and “” is the true function value at the prediction point “x”. The experimental design is represented by “”, and “ε” is a vector of the experimental random errors. The symbol “E” represents the statistical estimations of the variables about which the experimenter is uncertain, which include the future random errors “ε”, the points at which predictions will be calculated after the experiment “x”, and via the true model “η(x)”. Moreover, the EIMSE criterion can be expressed as
where
The inputs and outputs of the factorial experimental design are shown in Table 2. All parameters have been adjusted to scale [–1, 1]. The “% of infected” response indicates the percentage of individuals who heard the rumor and still believed it through 75 replications. The analysis of the experimental design was performed using Sagata Regression software.
4. Results and Discussion
4.1. Results
Table 3 shows the analysis of variance to test the differences among group means. The R-square and R-square adjusted values are 99.9% and 99.5%, respectively. This result indicates the model is highly effective for explaining the changes in values. Moreover, the p-value of the ANOVA test also demonstrates a high model fit. In addition, the results of fitting a linear regression model, including the second-order interactions to the response data, are shown in Table 4.
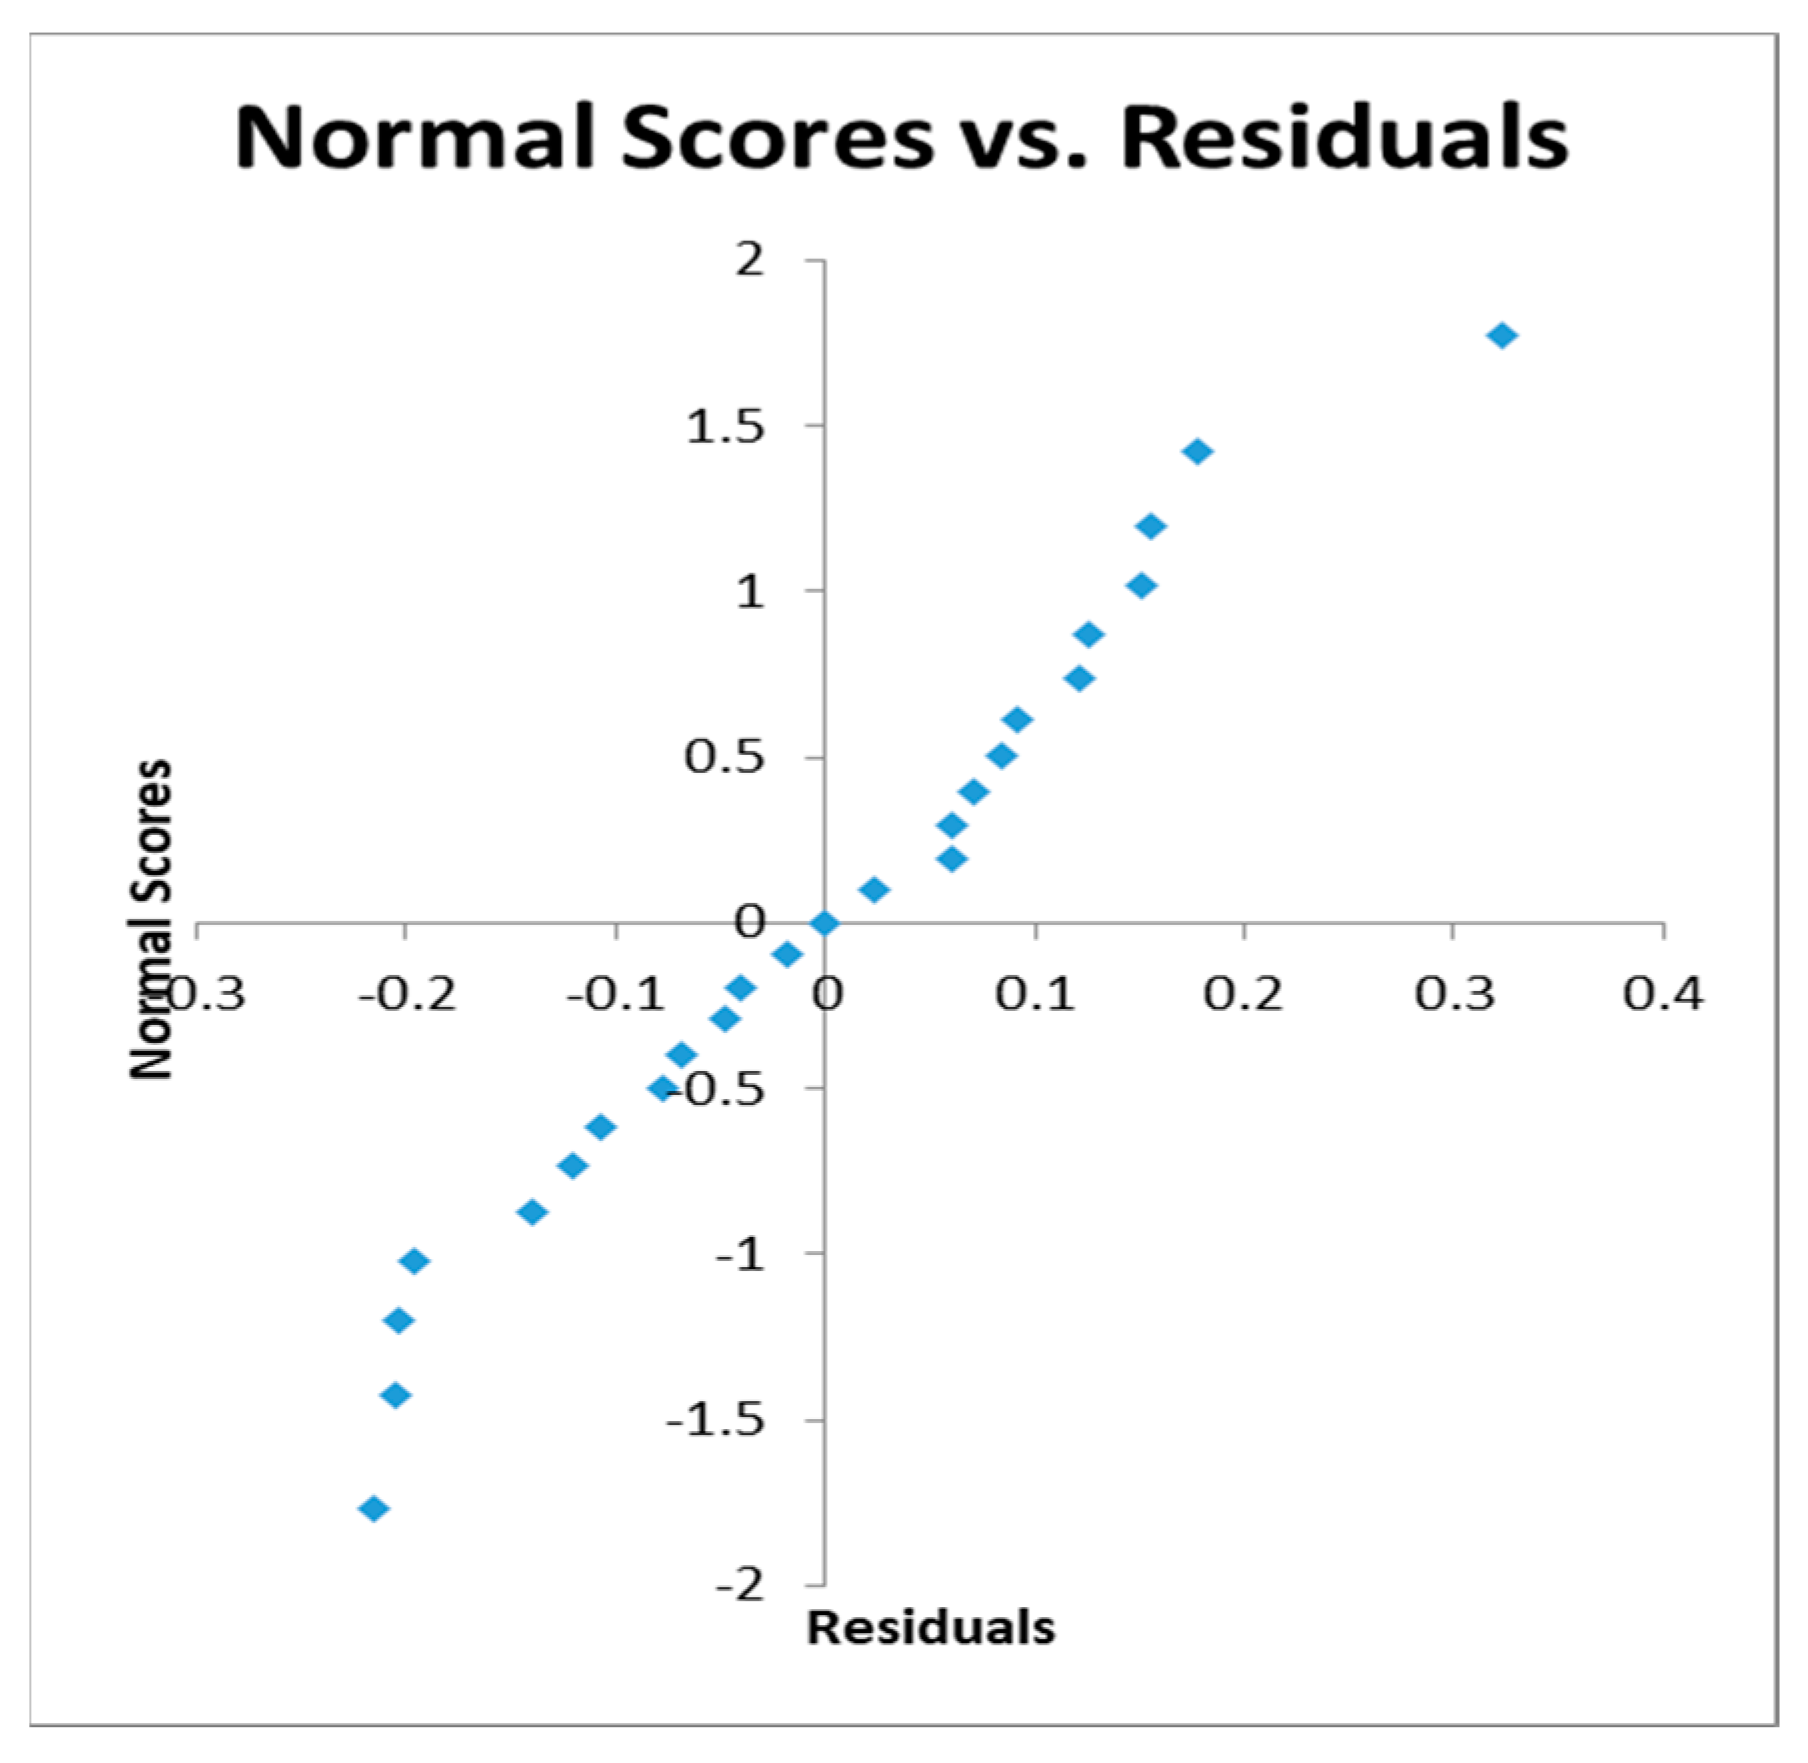
According to the coefficients table, all the main factors were shown to be significant in the rumor spreading model. Additionally, the second-order interactions represent the interactions of environmental bias, including the counseling of leader, and social network usage with power of influencers. All the variance inflation factors (VIF) values were under 10, which means that the multicollinearity problem was not serious [42]. The normal score vs. the residuals plot in Figure 3 showed an approximately linear range, which indicates that the error terms were normally distributed. The result of the normal plot also suggests that our model was accurate and met all assumptions.
The main effects plot in Figure 3 shows the predicting response model of five interactive factors. The slope of factors is referred to as the intensity of the effects of each factor. The results, which are given in Table 4 and Figure 4, indicate that both “environmental bias” and “counseling of leader” have a positive effect on the percentage of infection. The first seems to be the most likely to predict the level of rumor outbreak, while the second follows closely behind. We found that providing leader counseling reduced the spread of rumors by approximately 11 percent during the early stage of the outbreak. However, environmental bias also needs to be considered when attempting to control rumors, because we found it can increase or decrease rumor propagation by 10 percent. On the other hand, the “persuasive constant”, “social network usage”, and “power of influencer” can, to a certain extent, effectively reduce the spread of rumors. A change in the power of influencers was found to only slightly affect the prediction model.
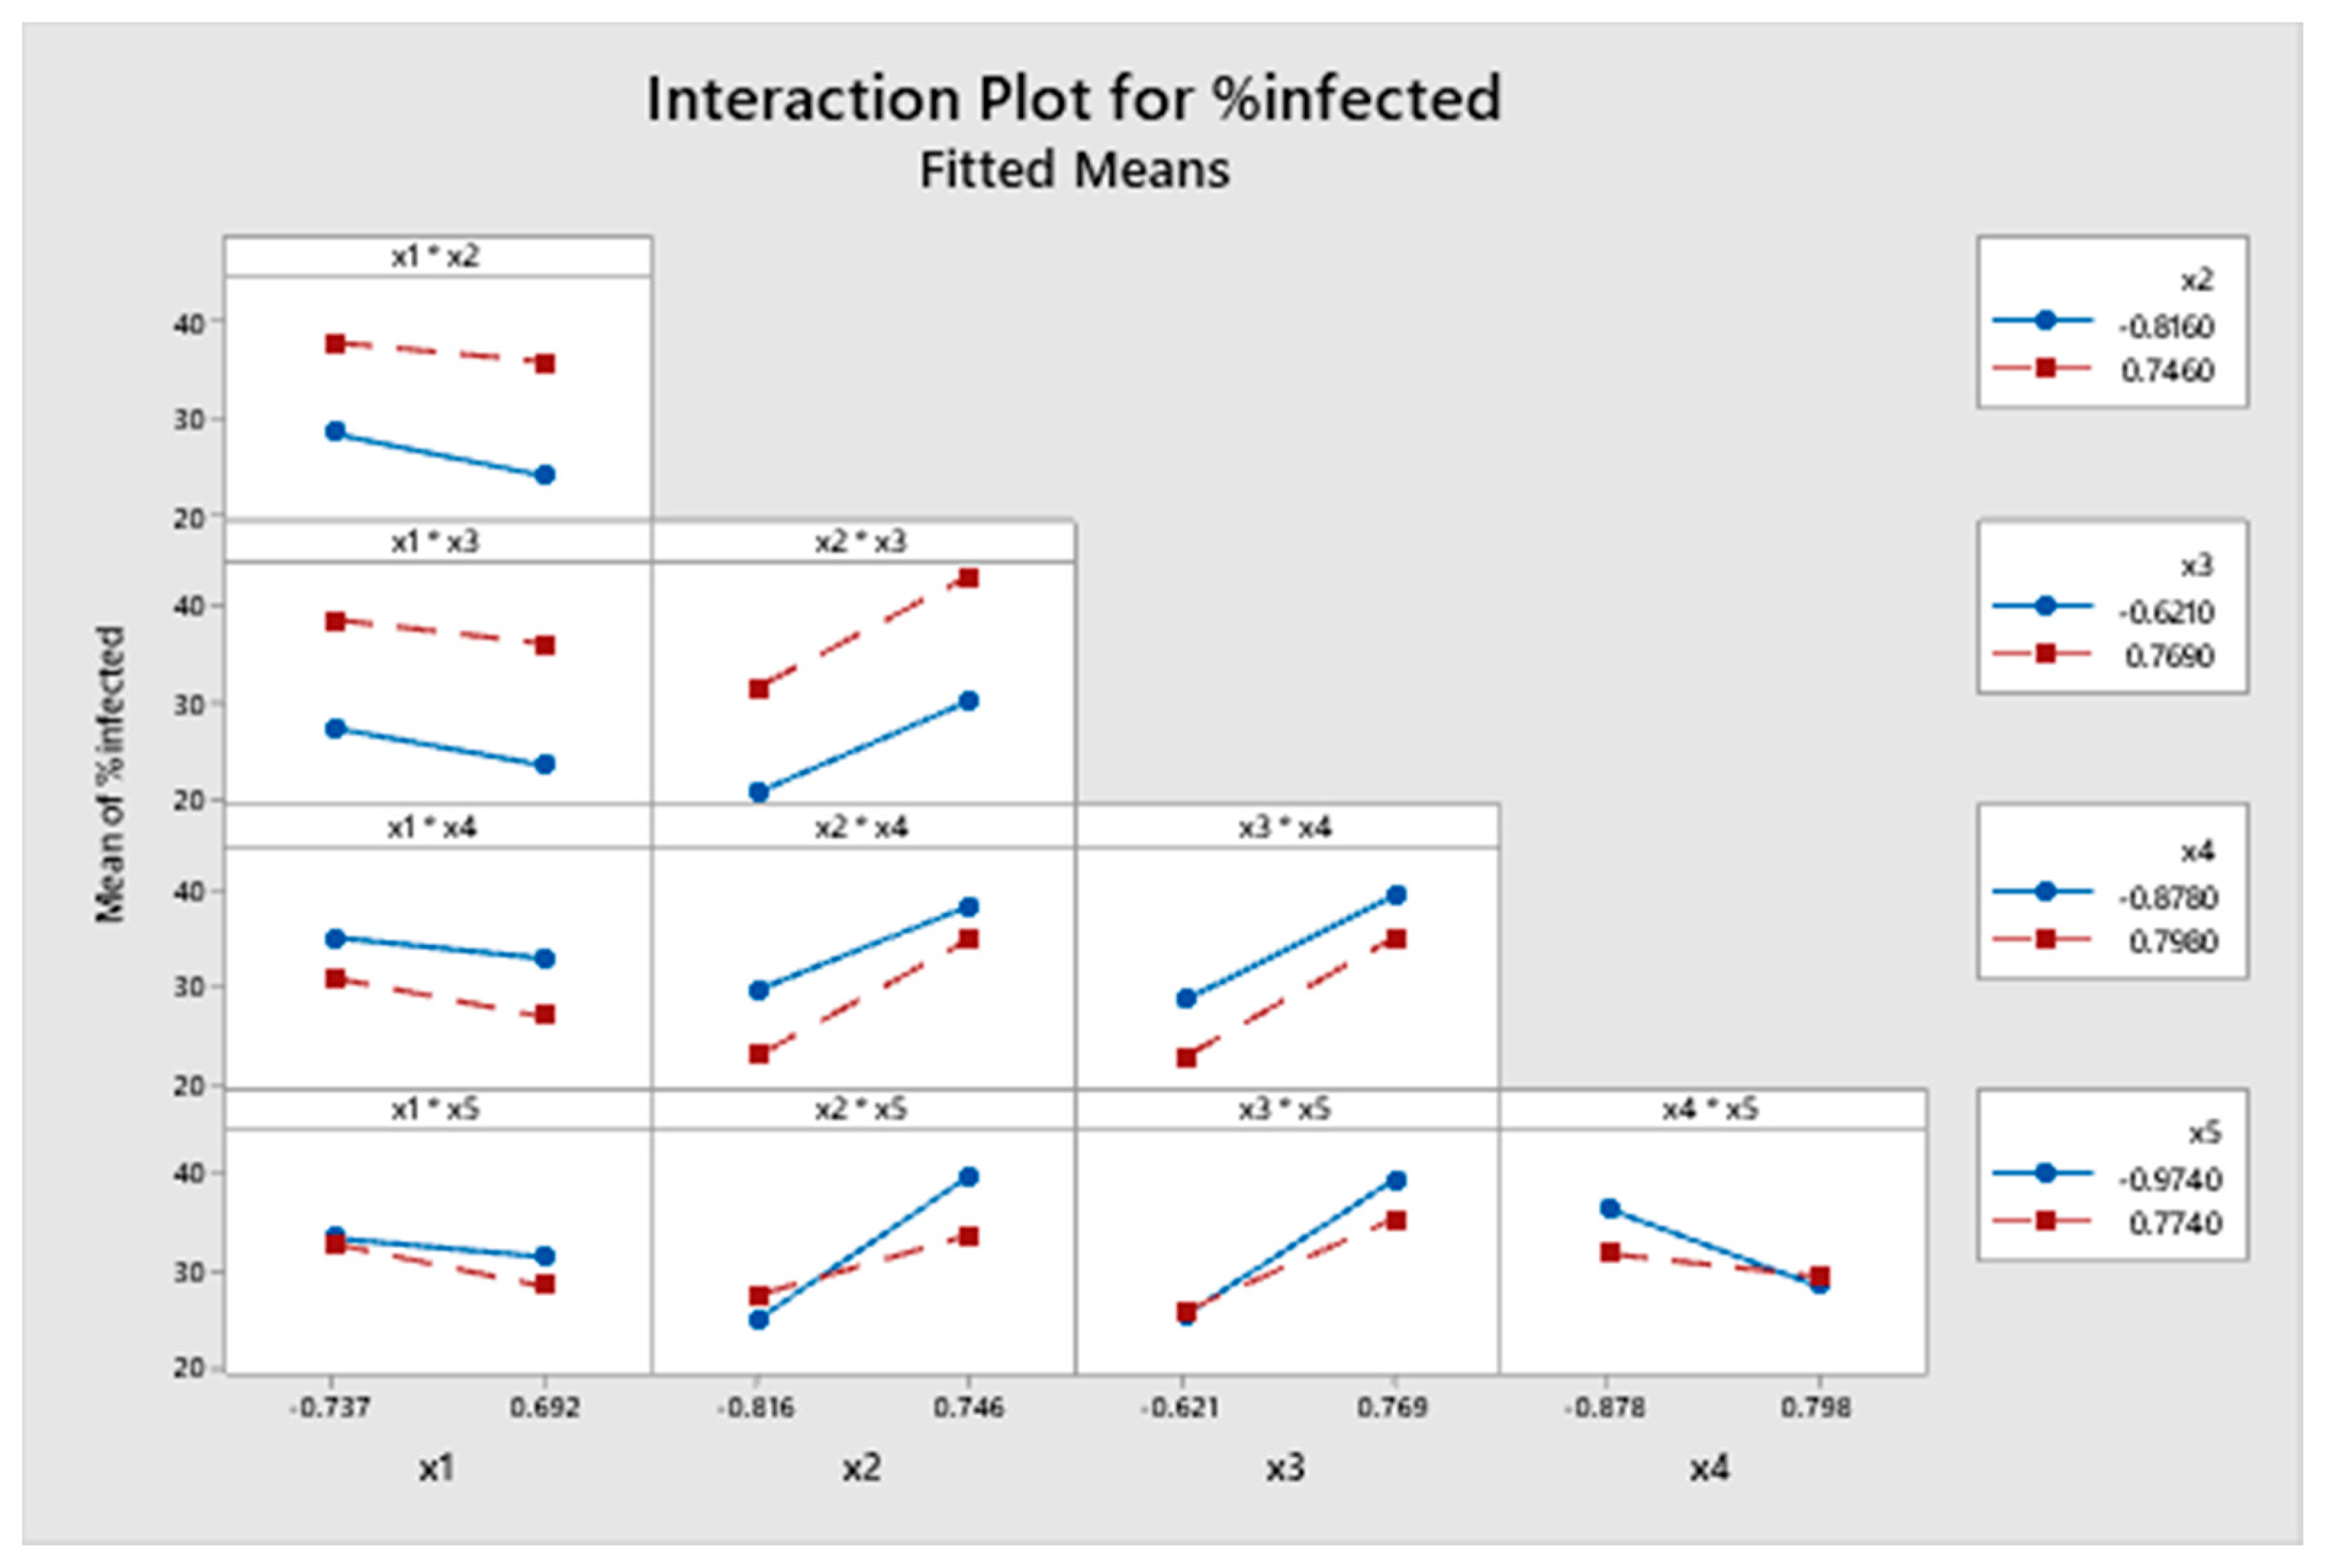
Furthermore, Figure 4 indicates that people tend to be more persuaded by face-to-face interaction than by online communication. Thus, an increase in social network usage for communicating in the workplace could be decreasing the spread of rumors due to exposure to excessive amounts of information. Moreover, distance is still a problem for information transmission, even in the era of the internet. The pressure of the majority also has been shown to affect whether or not an agent decides to believe a rumor that has been spread. In order to more clearly visualize these two-way interactions, Figure 5 represents the strong interaction of the persuasive constant, environmental bias, counseling of leader, and social network usage with the power of influencer. In addition, persuasive constant and environmental bias also was found to have strong interaction with social network usage.
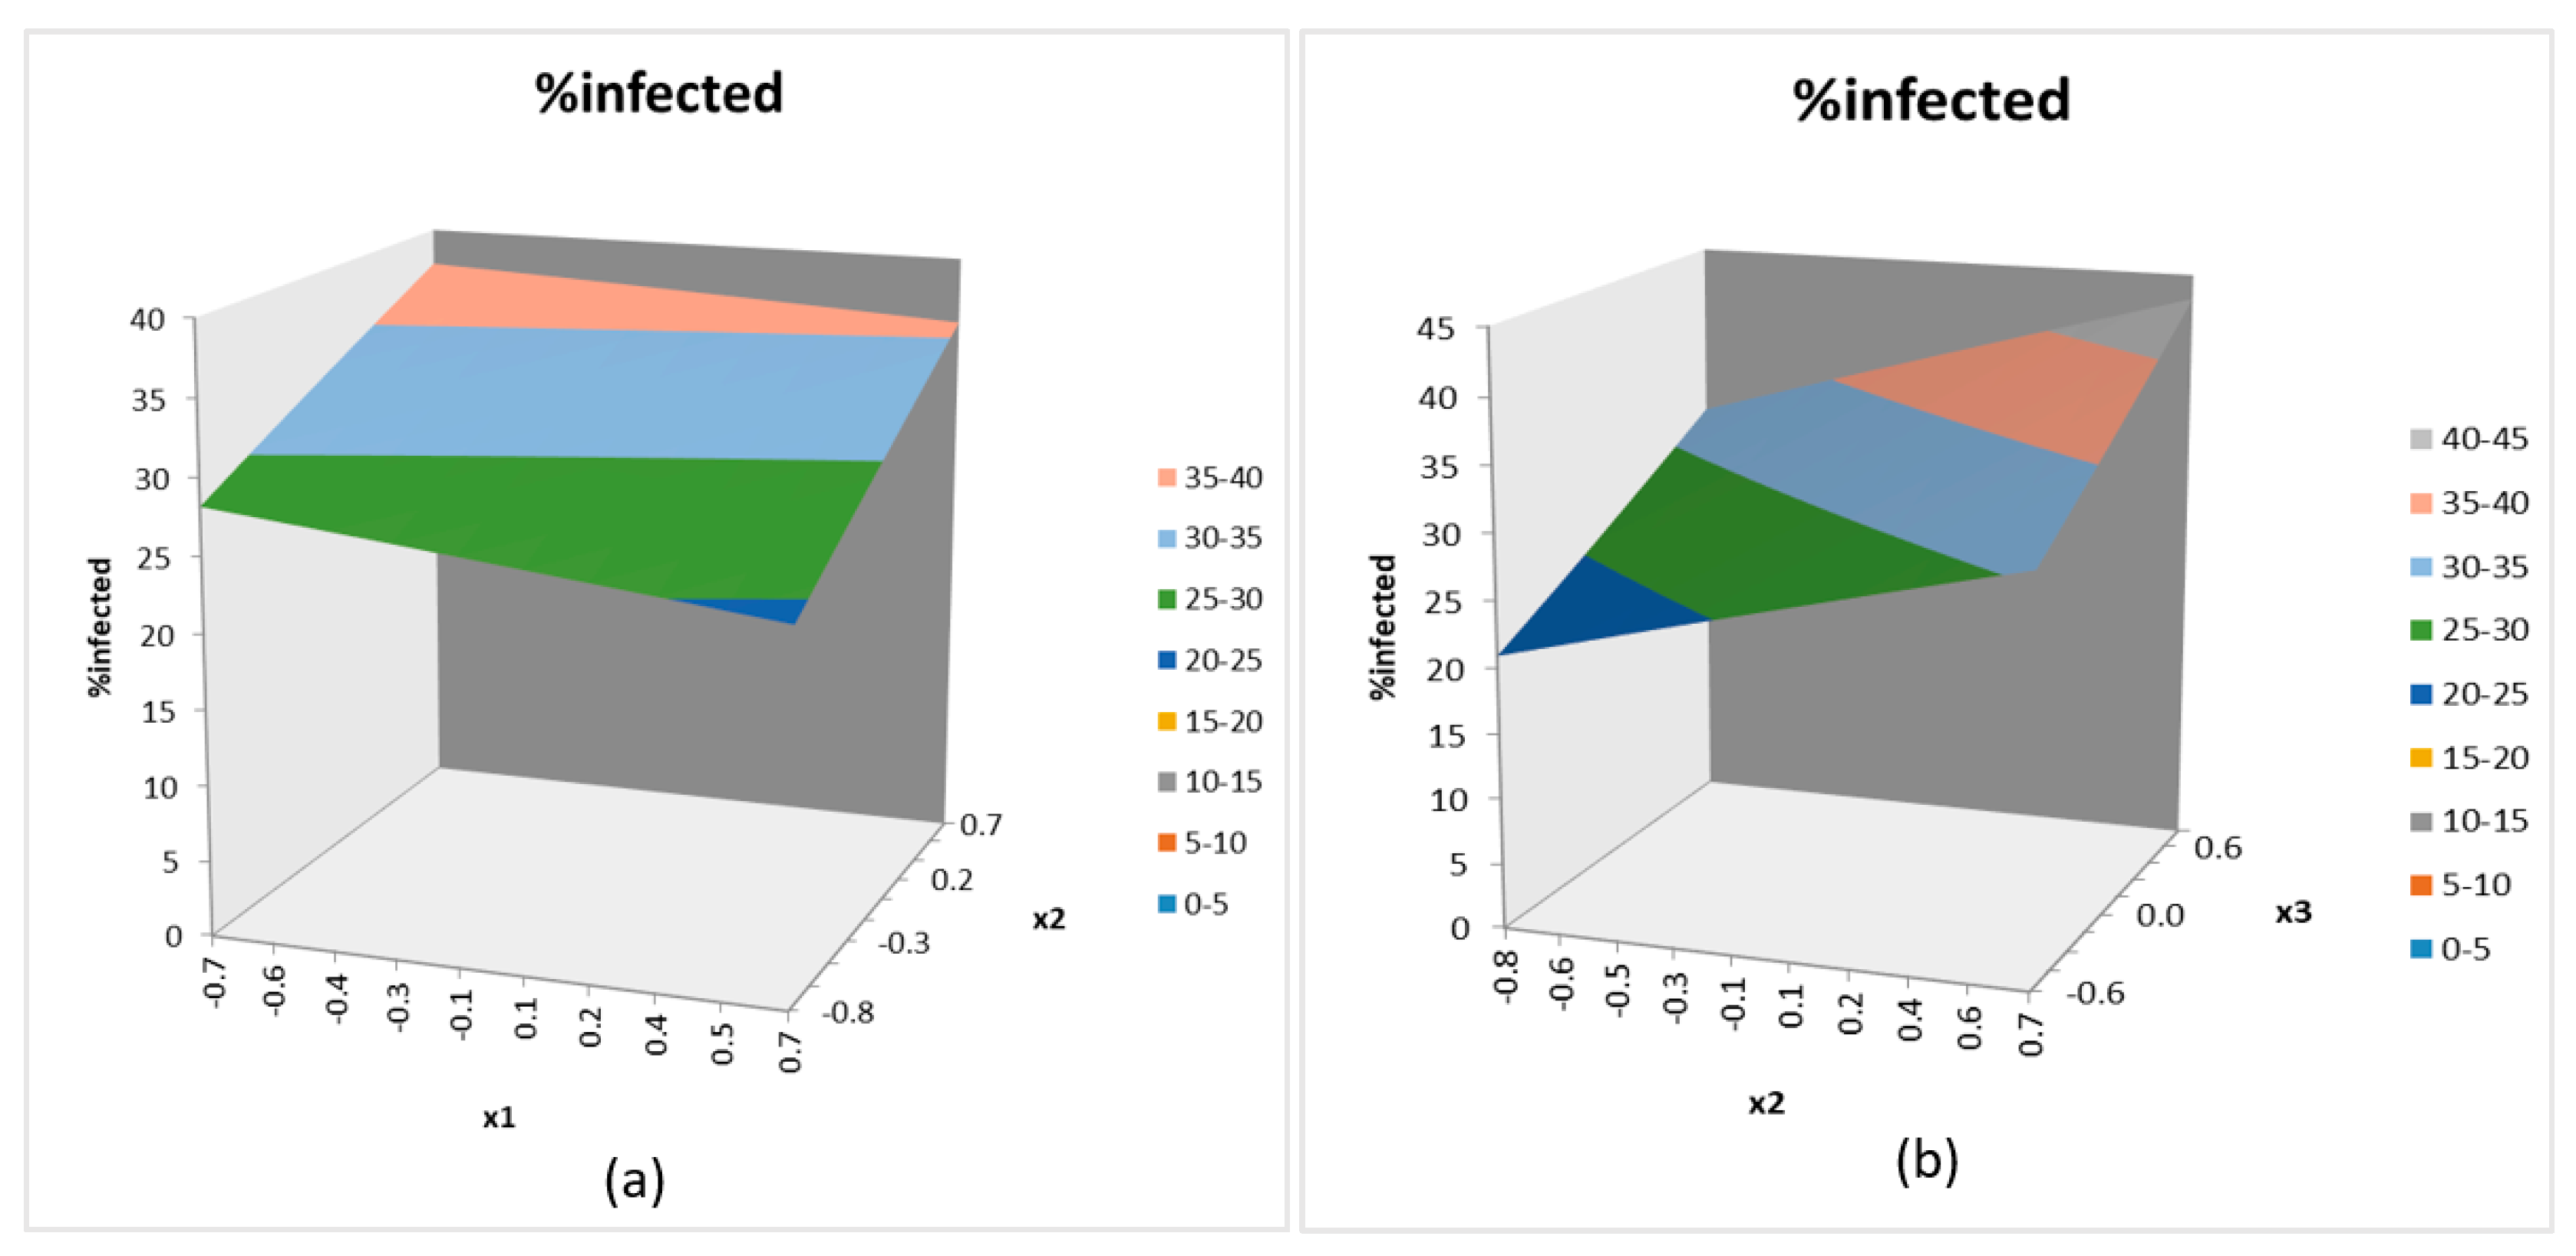
The graph in Figure 6a represents the percentage of people predicted to be infected when the “persuasive-constant” and “environmental bias” factors are changed and all other factors—“leader counseling” (×3 = 0.7974), “social network usage” (×4 = 0.1488), and “power of influencer” (×5 = 0.2026)—remained steady. Clearly, “environmental bias” was found to be more influential than the “persuasive-constant” factor. The near-optimal rumor rate of 24.6% can be achieved with a low level of environmental bias (E = 0.9184) and persuasive-constant (a = 0.5329). The interaction of environmental bias and the counseling of leaders in Figure 6b determines the percentage of infected people when we combined the lowest level of environmental bias and counseling of leader with “E = 0.9184” “L = 0.797375”, respectively. In this way, according to our model results, rumor propagation can be decreased to 21%.
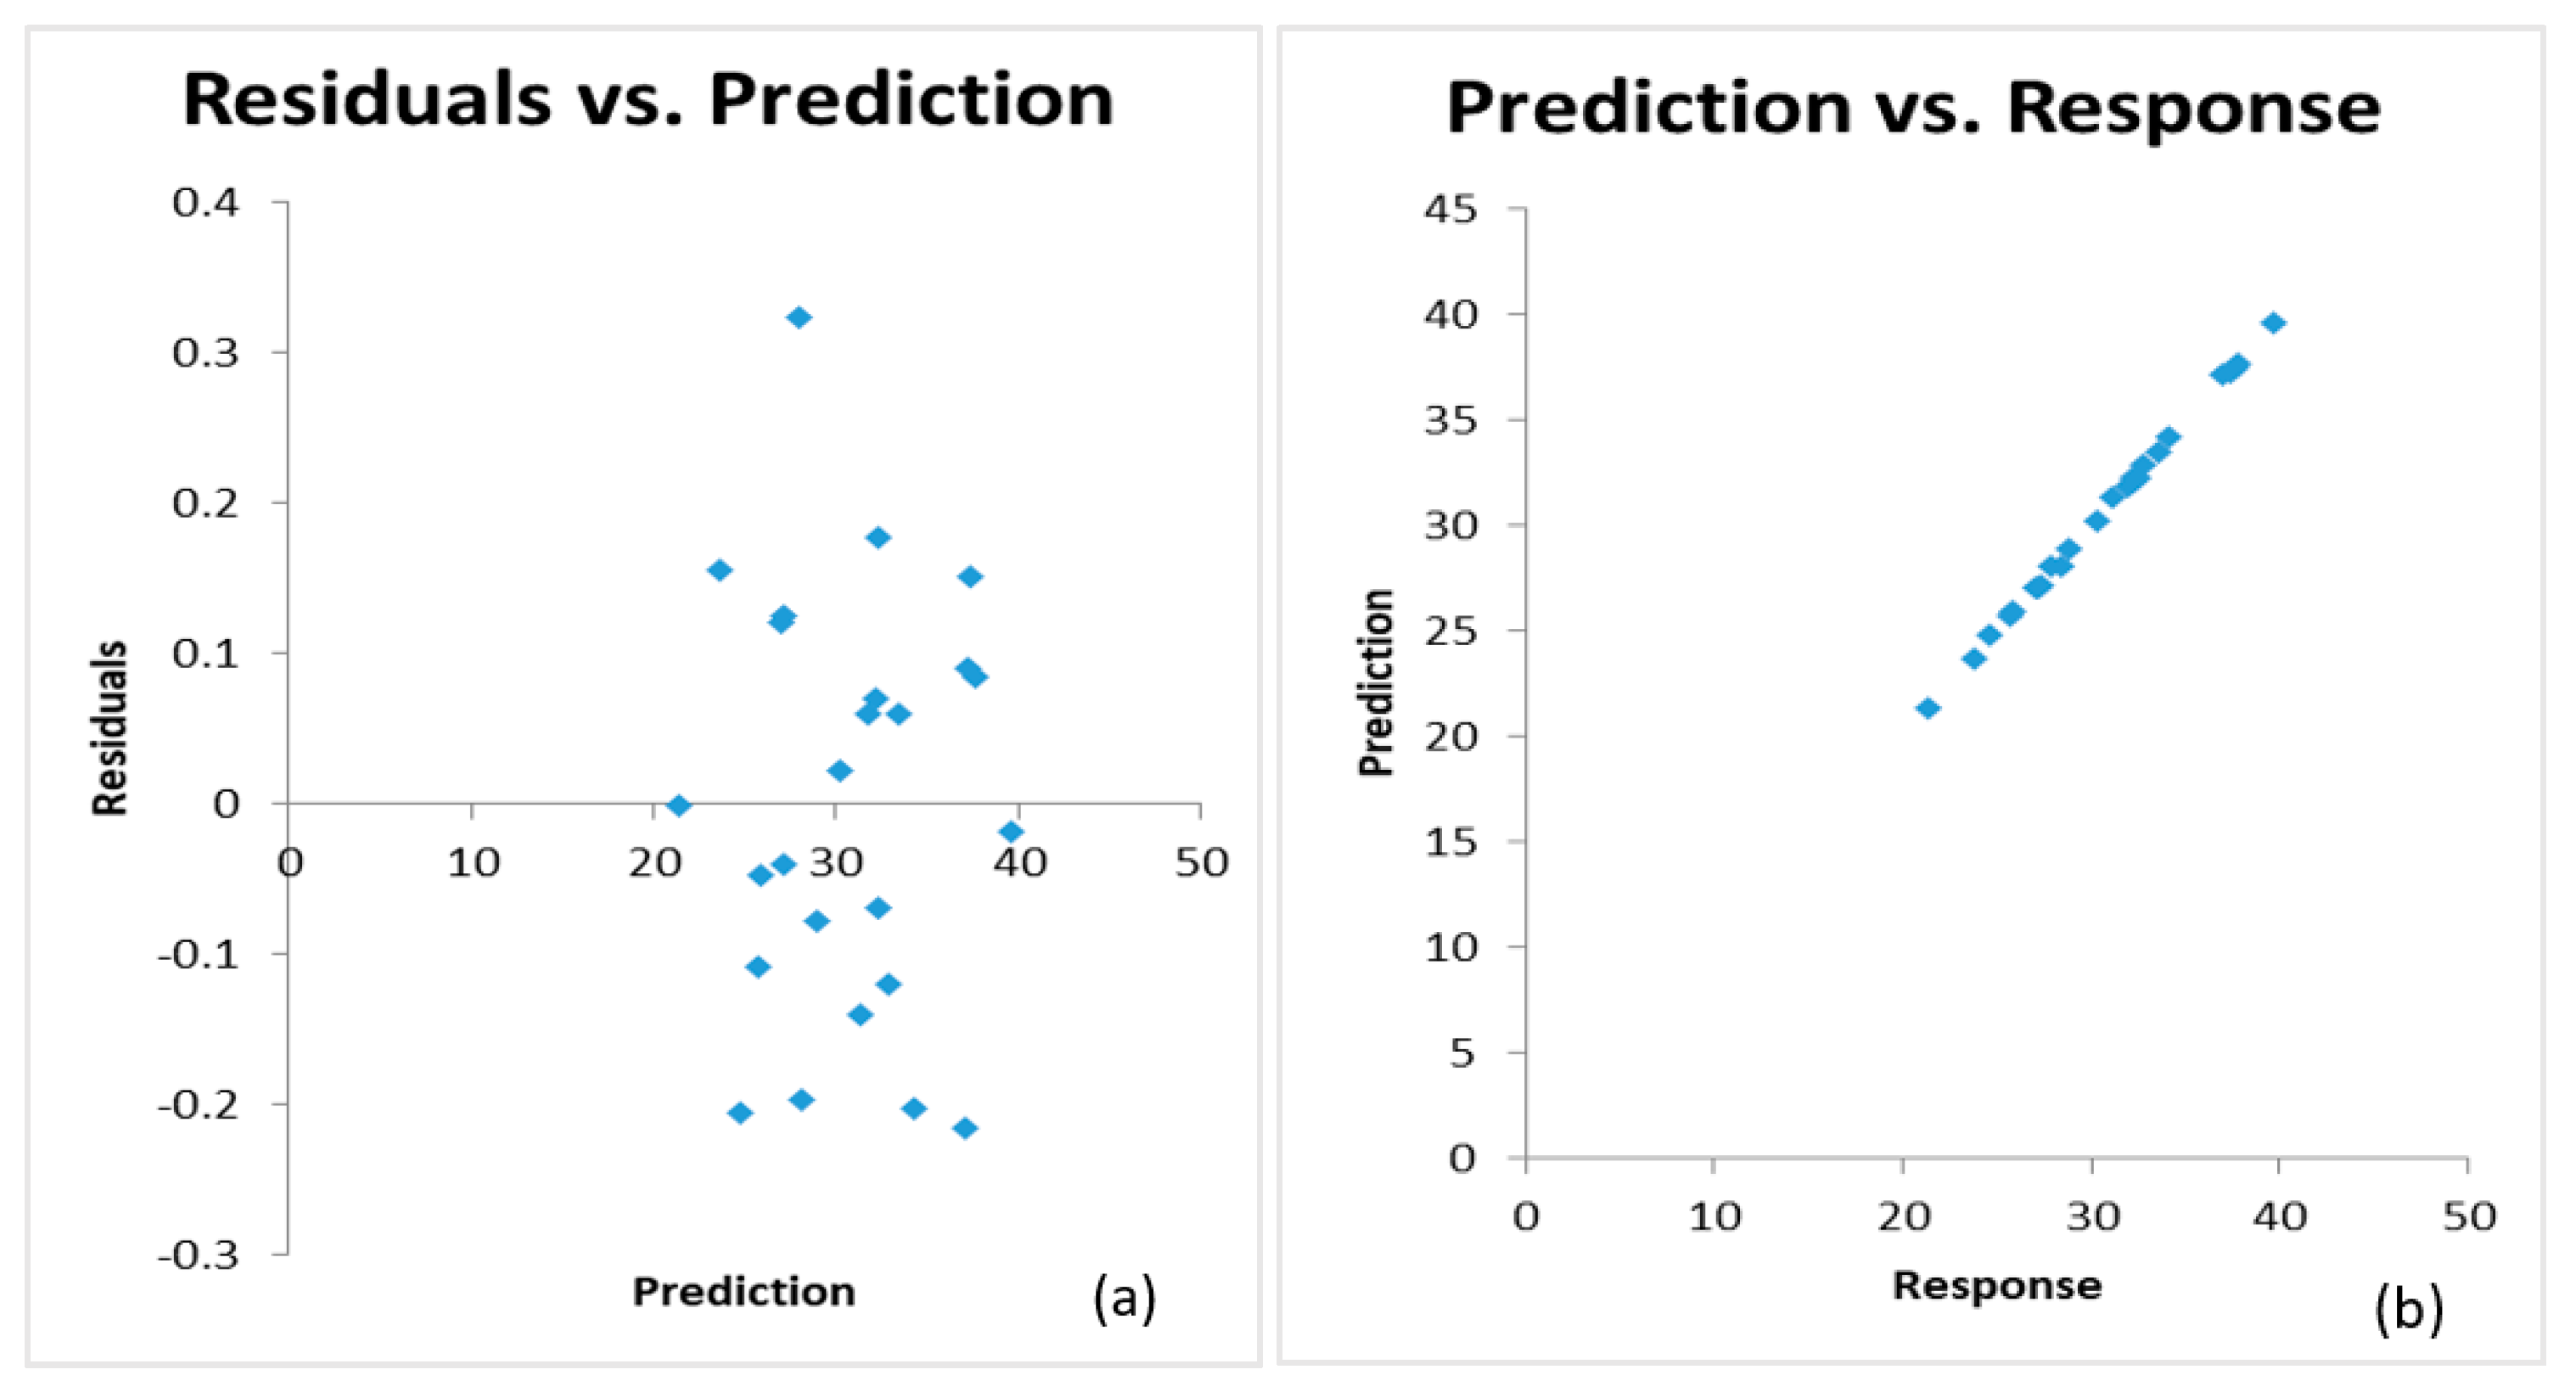
According to Figure 7, the differences between the observed values and predicted values, shown as dots on the plot, indicate the residual vs. prediction differences. Moreover, in Figure 7b, the prediction vs. response plot suggests that our model is highly effective for predicting the number of people that could be infected by rumors.
4.2. Discussion
Based on the results of the experiment, we suggest the following strategies for controlling and reducing rumor propagation in the workplace:
- According to the main effects plot in Figure 4, the persuasive constant implies that the behavior and opinions of the majority are essential for the rumor spreading process. People tend to consider the opinions of their peers when they hear about a new rumor. Thus, the opinions of the majority may change the way we think about new information in society. As shown in the previous section, if the persuasive-constant increases to a = 0.692 (or the converted actual value is ), the percentage of people who are infected by the rumor will actually decrease.
- Besides, environmental bias in the workplace also has a significant impact (10%) on rumor spreading when kept at a low level. Traditional style workplaces, as opposed to open spaces, contribute somewhat to the spread of rumors. Information coming from authority figures within the organization also effectively reduces the spread of rumors.
- Providing counseling of leaders has the strongest effect on employee response to rumors. In other words, leader counseling significantly reduces the spread of rumors. When the value of leader counseling was at a low level (L = −0.621), the percentage of infected people was 25.8%. According to Bhavnani et al. [43], if leaders have strong influence and are highly connected to their employees, they can significantly impact their opinions with rumor propagation or even dominate them [44]. We found that if leaders or supervisors monitor the spread of rumors early on, they can reduce the percentage of those infected to approximately 18% of the cohort size instead of 32%.
- In addition, influencers can inspire potential followers to believe them, so the managers should concentrate on these influencers immediately when they begin to recognize any rumor outbreaks. If the organization has a small percentage of influencers, they can easily be stopped through counseling. In contrast, if the propagator is the leader or influencer, the rumor will likely disperse more quickly throughout the company, which may lead to tragic consequences.
- Previous scholars have found that people are less persuaded by a propagator who is far away from them as opposed to nearby [45]. However, according to our findings, rumors are spread more quickly on social media than via the traditional face-to-face method [46], but this has also led to a decrease in the spreading of rumors.
5. Conclusions
In this study, we utilized simulation modeling to investigate the mechanism of rumor spreading in the workplace and provided some strategies to control and reduce their impact on the organization. In contrast to distributing questionnaires and mathematical models as we have done in many previous studies, we utilized agent-based modeling for rumor study. Our model results indicate that a close relationship between the leader and his or her team members not only enhances workplace productivity, it can also reduce the impact of rumors on the group. The distance and social media usage factors are added in this study to make the model more realistic. An influencer in the workplace also can impact on the spread of rumors because followers sometimes tend to believe information that is shared by their influencers rather than by their manager or leader.
This study contributes useful knowledge for managers and researchers by developing and extending the rumored model via agent-based modeling. Some limitations of this study must be addressed in future research. First, other factors such as the interaction among susceptile, infected and recovery groups; clustering; correlation; and consolidation; and continuing diversity characteristics should be considered to make the simulation more realistic. Second, we must create a hybrid model to analyze the problem comprehensively. Finally, a specific time period was not established in this simulation due to the complexity of various scenarios. However, in the real world, this element is essential for predicting rumor spreading. We hope this problem can be solved in future research.
Author Contributions
Conceptualization, S.-H.T. and T.S.N.; methodology, S.-H.T. and T.S.N.; formal analysis, S.-H.T. and T.S.N.; validation, S.-H.T. and T.S.N.; investigation, S.-H.T. and T.S.N.; supervision, S.-H.T.; writing (original draft preparation), T.S.N.; writing (review and editing), S.-H.T. and T.S.N.; visualization, S.-H.T. and T.S.N. All authors have read and agreed to the published version of the manuscript.
Funding
This research received no external funding.
Conflicts of Interest
The authors declare no conflict of interest.
References
- Kimmel, A.J. A manager’s guide to understanding and combatting rumors. In Rumors and Rumor Control; Routledge: London, UK, 2013. [Google Scholar]
- Knapp, R.H. A psychology of rumor. Public Opin. Q. 1944, 8, 22–37. [Google Scholar] [CrossRef] [Green Version]
- Sunstein, C.R. On Rumors: How Falsehoods Spread, Why We Believe Them, and What Can Be Done; Princeton University Press: Princeton, NJ, USA, 2014. [Google Scholar]
- Doerr, B.; Fouz, M.; Friedrich, T. Why rumors spread fast in social networks. Commun. ACM 2012, 55, 70–75. [Google Scholar] [CrossRef]
- Daley, D.J.; Kendall, D.G. Epidemics and rumours. Nature 1964, 204, 1118. [Google Scholar] [CrossRef] [PubMed]
- Liu, D.; Chen, X. Rumor propagation in online social networks like twitter—A simulation study. In Proceedings of the 2011 Third International Conference on Multimedia Information Networking and Security, Shanghai, China, 4–6 November 2011; pp. 278–282. [Google Scholar]
- Shah, D.; Zaman, T. Rumors in a network: Who’s the culprit? IEEE Trans. Inf. Theory 2011, 57, 5163–5181. [Google Scholar] [CrossRef] [Green Version]
- Moreno, Y.; Nekovee, M.; Pacheco, A.F. Dynamics of rumor spreading in complex networks. Phys. Rev. E 2004, 69, 066130. [Google Scholar] [CrossRef] [Green Version]
- Zhao, L.; Cui, H.; Qiu, X.; Wang, X.; Wang, J. SIR rumor spreading model in the new media age. Phys. A Stat. Mech. Its Appl. 2013, 392, 995–1003. [Google Scholar] [CrossRef]
- Zhao, L.; Wang, J.; Chen, Y.; Wang, Q.; Cheng, J.; Cui, H. SIHR rumor spreading model in social networks. Phys. A Stat. Mech. Its Appl. 2012, 391, 2444–2453. [Google Scholar] [CrossRef]
- Rahmandad, H.; Sterman, J.J.M.S. Heterogeneity and network structure in the dynamics of diffusion: Comparing agent-based and differential equation models. Manag. Sci. 2008, 54, 998–1014. [Google Scholar] [CrossRef] [Green Version]
- Bonabeau, E. In Agent-based modeling: Methods and techniques for simulating human systems. Proc. Natl. Acad. Sci. USA 2002, 99, 7280–7287. [Google Scholar] [CrossRef] [Green Version]
- Latané, B. The psychology of social impact. Am. Psychol. 1981, 36, 343. [Google Scholar] [CrossRef]
- Crothers, L.M.; Lipinski, J.; Minutolo, M.C. Cliques, rumors, and gossip by the water cooler: Female bullying in the workplace. Psychol. Manag. J. 2009, 12, 97–110. [Google Scholar] [CrossRef]
- Kuo, C.-C.; Chang, K.; Quinton, S.; Lu, C.-Y.; Lee, I. Gossip in the workplace and the implications for HR management: A study of gossip and its relationship to employee cynicism. Int. J. Hum. Resour. Manag. 2015, 26, 2288–2307. [Google Scholar] [CrossRef] [Green Version]
- Bordia, P.; Kiazad, K.; Restubog, S.L.D.; DiFonzo, N.; Stenson, N.; Tang, R.L. Rumor as Revenge in the Workplace. Group Organ. Manag. 2014, 39, 363–388. [Google Scholar] [CrossRef]
- Wu, P.C. Student of Self-regulated Learning, What Do Teachers Do? Pulse Educ. 2018, 15, 1–7. [Google Scholar]
- Sommerfeld, R.D.; Krambeck, H.-J.; Milinski, M. Multiple gossip statements and their effect on reputation and trustworthiness. R. Soc. B Biol. Sci. 2008, 275, 2529–2536. [Google Scholar] [CrossRef] [PubMed] [Green Version]
- LeBlanc, M.M.; Barling, J. Workplace aggression. Curr. Dir. Psychol. Sci. 2004, 9–12. [Google Scholar] [CrossRef]
- Starnini, M.; Baronchelli, A.; Pastor-Satorras, R. Modeling human dynamics of face-to-face interaction networks. Phys. Rev. Lett. 2013, 110, 168701. [Google Scholar] [CrossRef] [Green Version]
- Fountoulakis, N.; Panagiotou, K.; Sauerwald, T. Ultra-fast rumor spreading in social networks. In Proceedings of the twenty-third annual ACM-SIAM symposium on Discrete Algorithms, Kyoto, Japan, 17–19 January 2012; pp. 1642–1660. [Google Scholar]
- Latané, B. Dynamic social impact: The creation of culture by communication. J. Commun. 1996, 46, 13–25. [Google Scholar] [CrossRef]
- DiFonzo, N.; Bordia, P. Rumors Influence: Toward A Dynamic Social Impact Theory of Rumor; Psychology Press: Philadelphia, PA, USA, 2007. [Google Scholar]
- Nettle, D. Using social impact theory to simulate language change. Lingua 1999, 108, 95–117. [Google Scholar] [CrossRef] [Green Version]
- Karau, S.J.; Williams, K.D. Social loafing: A meta-analytic review and theoretical integration. J. Personal. Soc. Psychol. 1993, 65, 681–706. [Google Scholar] [CrossRef]
- Allen, T.T.; Davis, N. A simple agent-based social impact theory model of student STEM selection. In Proceedings of the Winter Simulation Conference, Baltimore, MD, USA, 5–8 December 2010; pp. 278–289. [Google Scholar]
- Tseng, S.-H.; Chen, C.-K.; Yu, J.-C.; Wang, Y.-C. Applying the agent-based social impact theory model to the bullying phenomenon in K–12 classrooms. Simulation 2014, 90, 425–437. [Google Scholar] [CrossRef]
- Latané, B.; Liu, J.H.; Nowak, A.; Bonevento, M.; Zheng, L. Distance matters: Physical space and social impact. Personal. Soc. Psychol. Bull. 1995, 21, 795–805. [Google Scholar] [CrossRef]
- Gilbert, N.; Troitzsch, K. Simulation for the Social Scientist; McGraw-Hill Education: Berkshire, UK, 2005. [Google Scholar]
- Railsback, S.F.; Grimm, V. Agent-Based and Individual-Based Modeling: A Practical Introduction; Princeton University Press: Princeton, NJ, USA, 2019. [Google Scholar]
- Macal, C.M.; North, M.J. Tutorial on agent-based modeling and simulation. In Proceedings of the Winter Simulation Conference, Orlando, FL, USA, 4 December 2005; p. 14. [Google Scholar]
- Macy, M.W.; Willer, R. From factors to actors: Computational sociology and agent-based modeling. Annu. Rev. Sociol. 2002, 28, 143–166. [Google Scholar] [CrossRef]
- Tseng, S.-H.; Allen, T.T. A magic number versus trickle down agent-based model of tax policy. In Proceedings of the 2013 Winter Simulations Conference (WSC), Washington, DC, USA, 8–11 December 2013; pp. 1407–1418. [Google Scholar]
- Delre, S.A.; Jager, W.; Bijmolt, T.H.; Janssen, M. Targeting and timing promotional activities: An agent-based model for the takeoff of new products. J. Bus. Res. 2007, 60, 826–835. [Google Scholar] [CrossRef]
- Schelling, T.C. Micromotives and Macrobehavior; WW Norton & Company: New York, NY, USA, 2006. [Google Scholar]
- Epstein, J.M.; Axtell, R. Growing Artificial Societies: Social Science from The Bottom Up; Brookings Institution Press: Washington, DC, USA, 1996. [Google Scholar]
- Kaligotla, C.; Yücesan, E.; Chick, S.E. Diffusion of competing rumours on social media. J. Simul. 2020, 1–21. [Google Scholar] [CrossRef]
- Wilensky, U. Center for Connected Learning and Computer Based Modeling, Northwestern University; NetLogo [Computer software]: Evanston, IL, USA, 1999. [Google Scholar]
- Jowett, G.S.; O’donnell, V. Propaganda & Persuasion; Sage publications: Newbury Park, CA, USA, 2018. [Google Scholar]
- Nowak, A.; Latané, B. Simulating the emergence of social order from individual behaviour. In Simulating Societies; Routledge: London, UK, 2018; pp. 63–84. [Google Scholar]
- Allen, T.T.; Yu, L.; Schmitz, J. An experimental design criterion for minimizing meta-model prediction errors applied to die casting process design. J. R. Stat. Soc. Ser. C Appl. Stat. 2003, 52, 103–117. [Google Scholar] [CrossRef]
- O’brien, R.M. A caution regarding rules of thumb for variance inflation factors. Qual. Quant. 2007, 41, 673–690. [Google Scholar] [CrossRef]
- Bhavnani, R.; Findley, M.G.; Kuklinski, J.H. Rumor dynamics in ethnic violence. J. Politics 2009, 71, 876–892. [Google Scholar] [CrossRef] [Green Version]
- Wu, K.; Yang, S.; Zhu, K.Q. False rumors detection on sina weibo by propagation structures. In Proceedings of the 2015 IEEE 31st International Conference on Data Engineering, Seoul, Korea, 13–17 April 2015; pp. 651–662. [Google Scholar]
- Bradner, E.; Mark, G. Why distance matters: Effects on cooperation, persuasion and deception. In Proceedings of the 2002 ACM Conference on Computer Supported Cooperative Work, New York, NY, USA, 16–20 November 2002; pp. 226–235. [Google Scholar]
- Harton, H.C.; Bullock, M. Dynamic social impact: A theory of the origins and evolution of culture. Soc. Personal. Psychol. Compass 2007, 1, 521–540. [Google Scholar] [CrossRef]
Figure 1.
Rumor spreading flow chart.

Figure 2.
Netlogo interface.

Figure 3.
Normal score plots from the simulation experiment.

Figure 4.
Main effects plot from the simulation experiment.

Figure 5.
Interaction Plot for %infected.

Figure 6.
(a) Contour plot of persuasive-constant and environmental bias; (b) environmental bias and counseling of leader.
Figure 6.
(a) Contour plot of persuasive-constant and environmental bias; (b) environmental bias and counseling of leader.

Figure 7.
(a) Residual vs. prediction; (b) prediction vs. response plot.


Table 1.
Factors and levels for experimental design.
| Factors | Parameters | Low | High |
|---|---|---|---|
| Persuasive-constant | a (×1) | 0.5 | 0.75 |
| Environmental bias | E (×2) | 0.9 | 1.1 |
| Counseling of leader | L (×3) | 0.75 | 1.0 |
| Social network usage | (×4) | 0.1 | 0.9 |
| Power of influencer | Highly strength (×5) | 20 | 40 |
Table 2.
Inputs and outputs of the Expected Integrated Mean Squared Error (EIMSE) experimental design.
Table 2.
Inputs and outputs of the Expected Integrated Mean Squared Error (EIMSE) experimental design.
| Run | a (×1) | E (×2) | L (×3) | Highly Strength (×5) | %Infected | |
|---|---|---|---|---|---|---|
| 1 | −0.2 | 0.285 | 0.259 | −0.878 | 0.053 | 36.93 |
| 2 | 0.019 | −0.232 | 0.082 | 0.798 | 0.316 | 28.38 |
| 3 | −0.319 | −0.279 | −0.586 | −0.511 | −0.311 | 27.05 |
| 4 | −0.299 | −0.219 | −0.541 | 0.424 | −0.414 | 23.82 |
| 5 | −0.706 | −0.18 | 0.479 | 0.383 | −0.142 | 34.07 |
| 6 | −0.38 | 0.704 | −0.384 | −0.315 | 0.329 | 32.45 |
| 7 | 0.369 | 0.746 | 0.418 | 0.089 | −0.217 | 39.62 |
| 8 | 0.249 | 0.26 | −0.55 | −0.272 | −0.554 | 28.87 |
| 9 | 0.692 | −0.099 | 0.187 | −0.304 | −0.335 | 32.20 |
| 10 | −0.18 | 0.474 | 0.044 | 0.372 | 0.774 | 32.20 |
| 11 | −0.053 | −0.061 | −0.621 | 0.36 | 0.584 | 24.60 |
| 12 | −0.176 | −0.047 | 0.208 | −0.048 | −0.062 | 32.78 |
| 13 | −0.227 | 0.6 | −0.33 | 0.583 | −0.147 | 31.18 |
| 14 | −0.686 | −0.305 | −0.12 | −0.088 | 0.481 | 30.29 |
| 15 | −0.153 | −0.314 | 0.579 | −0.147 | 0.566 | 33.53 |
| 16 | 0.442 | −0.35 | 0.09 | 0.539 | −0.549 | 25.64 |
| 17 | 0.012 | 0.101 | −0.065 | −0.112 | −0.974 | 31.89 |
| 18 | −0.031 | −0.816 | 0.099 | −0.019 | −0.34 | 25.87 |
| 19 | 0.621 | −0.404 | 0.359 | 0.315 | 0.38 | 27.93 |
| 20 | 0.416 | −0.43 | −0.155 | −0.498 | 0.373 | 27.27 |
| 21 | 0.212 | 0.008 | 0.769 | 0.229 | −0.361 | 37.40 |
| 22 | 0.556 | 0.276 | −0.355 | 0.234 | 0.275 | 27.20 |
| 23 | −0.497 | −0.184 | 0.599 | −0.539 | −0.243 | 37.60 |
| 24 | 0.367 | −0.5 | −0.615 | −0.026 | −0.319 | 21.36 |
| 25 | −0.737 | 0.569 | 0.239 | 0.096 | −0.029 | 37.73 |
Note: a, E, L, σ and s ∈ [−1, 1].
Table 3.
ANOVA table for the rumor spreading model.
| df | SS | MS | F | p-Value | |
|---|---|---|---|---|---|
| Regression Values | 20 | 567.46 | 28.37 | 241.12 | 0.0000 |
| Residuals | 4 | 0.47 | 0.118 | ||
| Totals | 24 | 567.94 |
Table 4.
The coefficients of the terms in the regression model including interactions up to 2nd order.
Table 4.
The coefficients of the terms in the regression model including interactions up to 2nd order.
| Term | Coefficients | Standard Errors | VIF |
|---|---|---|---|
| constant | 30.89 ** | 0.35 | |
| ×1 | −2.32 ** | 0.19 | 1.24 |
| ×2 | 6.41 ** | 0.19 | 1.27 |
| ×3 | 8.35 ** | 0.19 | 1.25 |
| ×4 | −2.85 ** | 0.19 | 1.16 |
| ×5 | −1.02 ** | 0.18 | 1.29 |
| ×1² | −0.11 | 0.58 | 2.15 |
| ×2² | −0.17 | 0.55 | 2.14 |
| ×3² | 0.34 | 0.58 | 1.81 |
| ×4² | 0.35 | 0.53 | 2.20 |
| ×5² | −0.96 | 0.50 | 2.26 |
| ×1 * ×2 | 0.95 | 0.51 | 1.34 |
| ×1 * ×3 | 0.80 | 0.53 | 1.36 |
| ×2 * ×3 | 0.73 | 0.53 | 1.16 |
| ×1 * ×4 | −0.89 | 0.60 | 1.43 |
| ×2 * ×4 | 1.57 | 0.60 | 1.43 |
| ×3 * ×4 | 0.72 | 0.53 | 1.27 |
| ×1 * ×5 | −1.60 | 0.59 | 1.34 |
| ×2 * ×5 | −3.10 ** | 0.57 | 1.46 |
| ×3 * ×5 | −1.70 * | 0.49 | 1.28 |
| ×4 * ×5 | 2.32 * | 0.58 | 1.39 |
* p < 0.05 ** p < 0.01.
Publisher’s Note: MDPI stays neutral with regard to jurisdictional claims in published maps and institutional affiliations. |
© 2020 by the authors. Licensee MDPI, Basel, Switzerland. This article is an open access article distributed under the terms and conditions of the Creative Commons Attribution (CC BY) license (http://creativecommons.org/licenses/by/4.0/).
Share and Cite
MDPI and ACS Style
Tseng, S.-H.; Son Nguyen, T. Agent-Based Modeling of Rumor Propagation Using Expected Integrated Mean Squared Error Optimal Design. Appl. Syst. Innov. 2020, 3, 48. https://0-doi-org.brum.beds.ac.uk/10.3390/asi3040048
AMA Style
Tseng S-H, Son Nguyen T. Agent-Based Modeling of Rumor Propagation Using Expected Integrated Mean Squared Error Optimal Design. Applied System Innovation. 2020; 3(4):48. https://0-doi-org.brum.beds.ac.uk/10.3390/asi3040048
Chicago/Turabian StyleTseng, Shih-Hsien, and Tien Son Nguyen. 2020. "Agent-Based Modeling of Rumor Propagation Using Expected Integrated Mean Squared Error Optimal Design" Applied System Innovation 3, no. 4: 48. https://0-doi-org.brum.beds.ac.uk/10.3390/asi3040048