Article

Regional Inhaled Deposited Dose of Urban Aerosols in an Eastern Mediterranean City

by
Tareq Hussein
1,2,*,
Shatha Suleiman Ali Saleh
1,
Vanessa N. dos Santos
2,
Brandon E. Boor
3,4,
Antti J. Koivisto
2 and
Jakob Löndahl
5
1
Department of Physics, The University of Jordan, Amman 11942, Jordan
2
Institute for Atmospheric and Earth System Research (INAR), University of Helsinki, PL 64, FI-00014 UHEL Helsinki, Finland
3
Lyles School of Civil Engineering, Purdue University, West Lafayette, IN 47907, USA
4
Ray W. Herrick Laboratories, Center for High Performance Buildings, Purdue University, West Lafayette, IN 47907, USA
5
Department of Design Sciences, Lund University, P.O. Box 118, SE-221 00 Lund, Sweden
*
Author to whom correspondence should be addressed.
Submission received: 21 August 2019 / Revised: 5 September 2019 / Accepted: 5 September 2019 / Published: 9 September 2019
(This article belongs to the Special Issue Exposure Assessment of Air Pollution)

Abstract

:
We calculated the regional deposited dose of inhaled particulate matter based on number/mass concentrations in Amman, Jordan. The dose rate was the highest during exercising but was generally lower for females compared to males. The fine particles dose rate was 1010–1011 particles/h (101–102 µg/h). The PM10 dose rate was 49–439 µg/h for males and 36–381 µg/h for females. While resting, the PM10 deposited in the head airways was 67–77% and 8–12% in the tracheobronchial region. When exercising, the head airways received 37–44% of the PM10, whereas the tracheobronchial region received 31–35%. About 8% (exercise) and 14–16% (rest) of the PM2.5 was received in the head airways, whereas the alveolar received 74–76% (exercise) and 54–62% (rest). Extending the results for common exposure scenarios in the city revealed alarming results for service workers and police officers; they might receive 50 µg/h PM2.5 and 220 µg/h PM10 while doing their duty on main roads adjacent to traffic. This is especially critical for a pregnant police officer. Outdoor athletic activities (e.g., jogging along main roads) are associated with high PM2.5 and PM10 dose rates (100 µg/h and ~425 µg/h, respectively).

1. Introduction

Urban areas are where humans and their activities are most concentrated, leading to high levels of air pollution that are associated with significant environmental impacts and adverse health effects [1]. The uptake of air pollution may occur via several pathways; one of them is deposition in the respiratory tract after inhalation [2,3,4,5,6,7,8]. An American Cancer Society study and a large number of follow-up studies have identified ambient particulate matter (PM) mass concentrations as a health-relevant metric [9,10]. The burden of disease from particulate air pollution is mainly associated with the fine (0.1 to 2.5 µm) and ultrafine (<0.1 µm) fractions [11,12,13,14,15,16]. A range of studies also show that not only particle mass is of importance for determining health outcomes, but also other aerosol metrics, including number concentrations, surface area concentrations, and chemical composition [17,18,19,20].
In general, understanding the health effects of inhaled aerosols follows three steps: (1) evaluation of the exposure level and particle characteristics; (2) calculation of the inhaled deposited dose in the respiratory tract; and (3) toxicity analysis and biological response [21,22,23,24]. In practice, the first step is rather straightforward by performing detailed measurements of aerosol physiochemical properties. As for the second step (i.e., inhaled deposited dose), it is difficult to use experimental methods to address it; and therefore, it is typically estimated by means of mathematical models. The third step, which is response and toxicity analysis, is even more challenging and requires advanced in-vitro and in-situ evaluation.
The behavior of inhaled aerosols in the respiratory tract depends on their physiochemical properties [23,25]. Particle size (e.g., aerodynamic diameter) and hygroscopicity are the most important properties. For example, coarse-mode particles (>2.5 µm) have a higher deposition rate in the head airways compared to deep in the lungs. Vice versa, submicrometer particles typically are primarily deposited in the tracheobronchial and alveolar regions, the latter is where they can be exchanged with the blood stream, translocating to other organs in the human body [26,27].
Several models have been developed to calculate regional deposition rates of aerosols; the most widely used being the International Commission on Radiological Protection (ICRP) model [28] and more recently the Multiple Path Particle Dosimetry (MPPD) model [29]. Such models require detailed information about the exposure time and level, physiochemical properties of inhaled particles, breathing characteristics, respiratory parameters, lung morphology and deposition probabilities of the particles in different parts of the respiratory tract. The inhaled dose of UFPs is increased 4–5 times during exercise as a result of high volumes of breathed air [25,30]. Other factors may also alter deposition and dose, such as age and respiratory disease [31,32,33,34,35]. It is important to recall that for similar deposited mass concentrations, the deposited number and surface area may vary by more than an order of magnitude due to differences in the aerosol size distribution [34]. Further, many studies indicate that for non-soluble particles, surface area is a more important metric for toxicity than mass [27,28,36,37,38,39,40,41,42]. Therefore, it is very important to develop a deeper understanding of the inhaled dose based on surface area and number concentrations, thereby moving beyond just mass concentrations [43,44].
Urban air pollution has been reported extensively in some parts of the world. However, air pollution data is severely limited in Eastern Mediterranean conditions [45,46,47,48,49]. It can be suggested that the main sources were secondary sulfates from coal burning (local and long-range transportation), traffic, crustal and construction dust, and biomass burning. Size-resolved exposure and inhaled dose calculations have been rarely reported for ambient aerosols, and limited data exist for cities in the Eastern Mediterranean.
In this study, we evaluated the regional deposited dose of inhaled particulate matter based on mean particle number size distributions (0.01–25 µm) measured in different environments (urban, urban background, main roads, and rural) in Amman, Jordan. We used effective particle density to calculate the mean particle mass size distributions and calculate the dose rates in terms of mass concentrations (PM2.5 and PM10). The results were then utilized for common exposure scenarios in an Eastern Mediterranean City. This is the first study estimating deposited dose rates for ambient aerosols in a typical Middle Eastern urban area. The results can be extended to estimate deposited doses in respiratory tract in different exposure scenarios.

2. Methodology

2.1. Regional Inhaled Deposited Dose Rate

Both the ICRP and MPPD models divide the respiratory tract into three main regions: head/throat, tracheobronchial (TB), and pulmonary/alveolar (P/Alv). Here we use the ICRP and MPPD models and experimental deposition data to calculate deposited dose as previously described by Hussein, et al. [23,44]. A brief summary is presented here.
The inhaled deposited dose rate for a specific particle diameter range (Dp1Dp2) is calculated for a one-hour exposure period. Accordingly, the dose rate is defined as:
Dose   Rate   =   D P 1 D P 2 V E × D F ( D P ) × n N 0 ( D P ) × f · dlog ( D P )
where VE [m3/h] is the minute ventilation (volume of air breathed), DF(Dp) is the particulate matter deposition fraction in a particular region of the respiratory tract, nN0(Dp) [particles/cm3 or µg/m3] is the particle number size distribution (i.e., dN/dlog(Dp)), and f is a metric conversion for particulate matter concentration (i.e., it is 1 for particle number and for particle mass = ρpDp3π/6, where ρp is the particle density). The deposition fraction (DF) and the particle number size distribution (n) are functions of particle diameter (Dp).
Dose rates were calculated for subjects reflecting different types of occupations: taxi drivers, tourists, students, police officers, and street service workers. The activities used for the dose rate calculations are listed in Table 1: walking, running, yard working, driving/riding a car, sitting, and standing. The combination between subjects and selected activities represents inhabitants exposed to outdoor air pollution in an Eastern Mediterranean City.

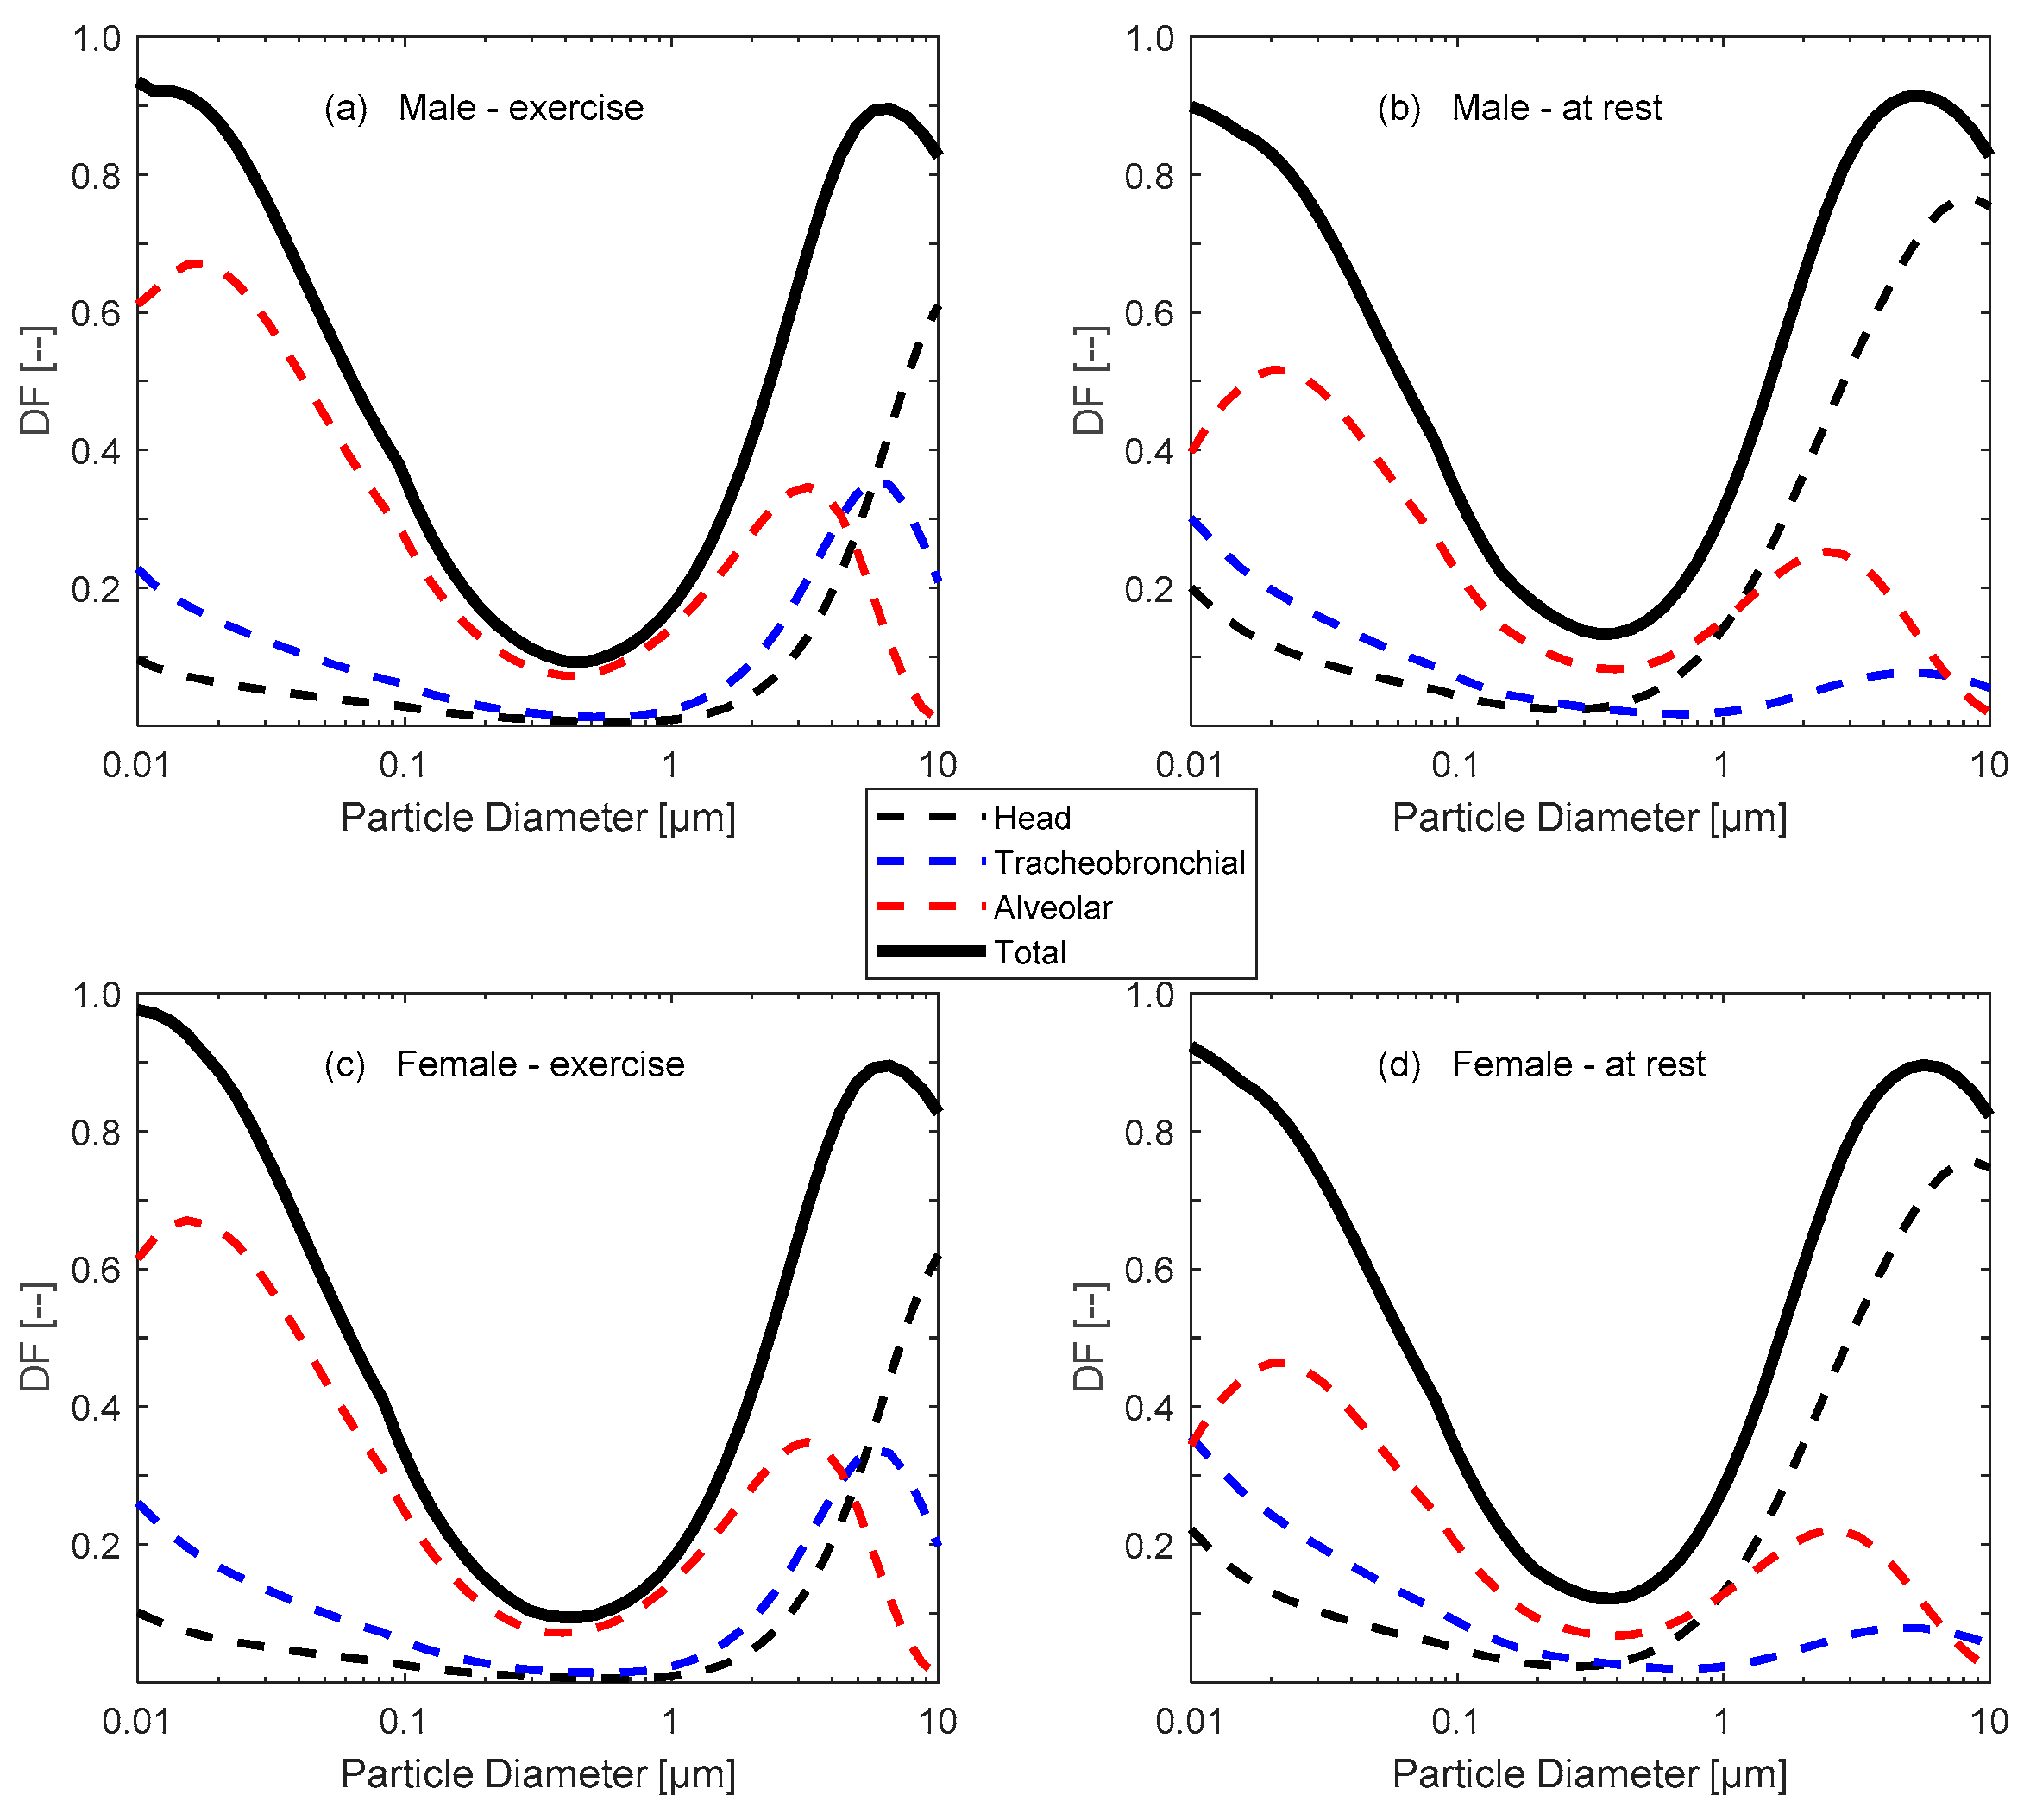
2.2. Respiratory Tract Parameters

Minute ventilation (VE) were adopted from the California Environmental Protection Agency [50]; Table 1. The regional deposition fraction (DF) of particulate matter in the respiratory tract were according to Löndahl et al. [23] and the ICRP/MPPD models; see Figure 1. Therefore, Equation (1) can be applied for different regions of the respiratory tract (i.e., regional inhaled deposited dose): head airways, tracheobronchial (TB), and alveolar/pulmonary (P/Alv).

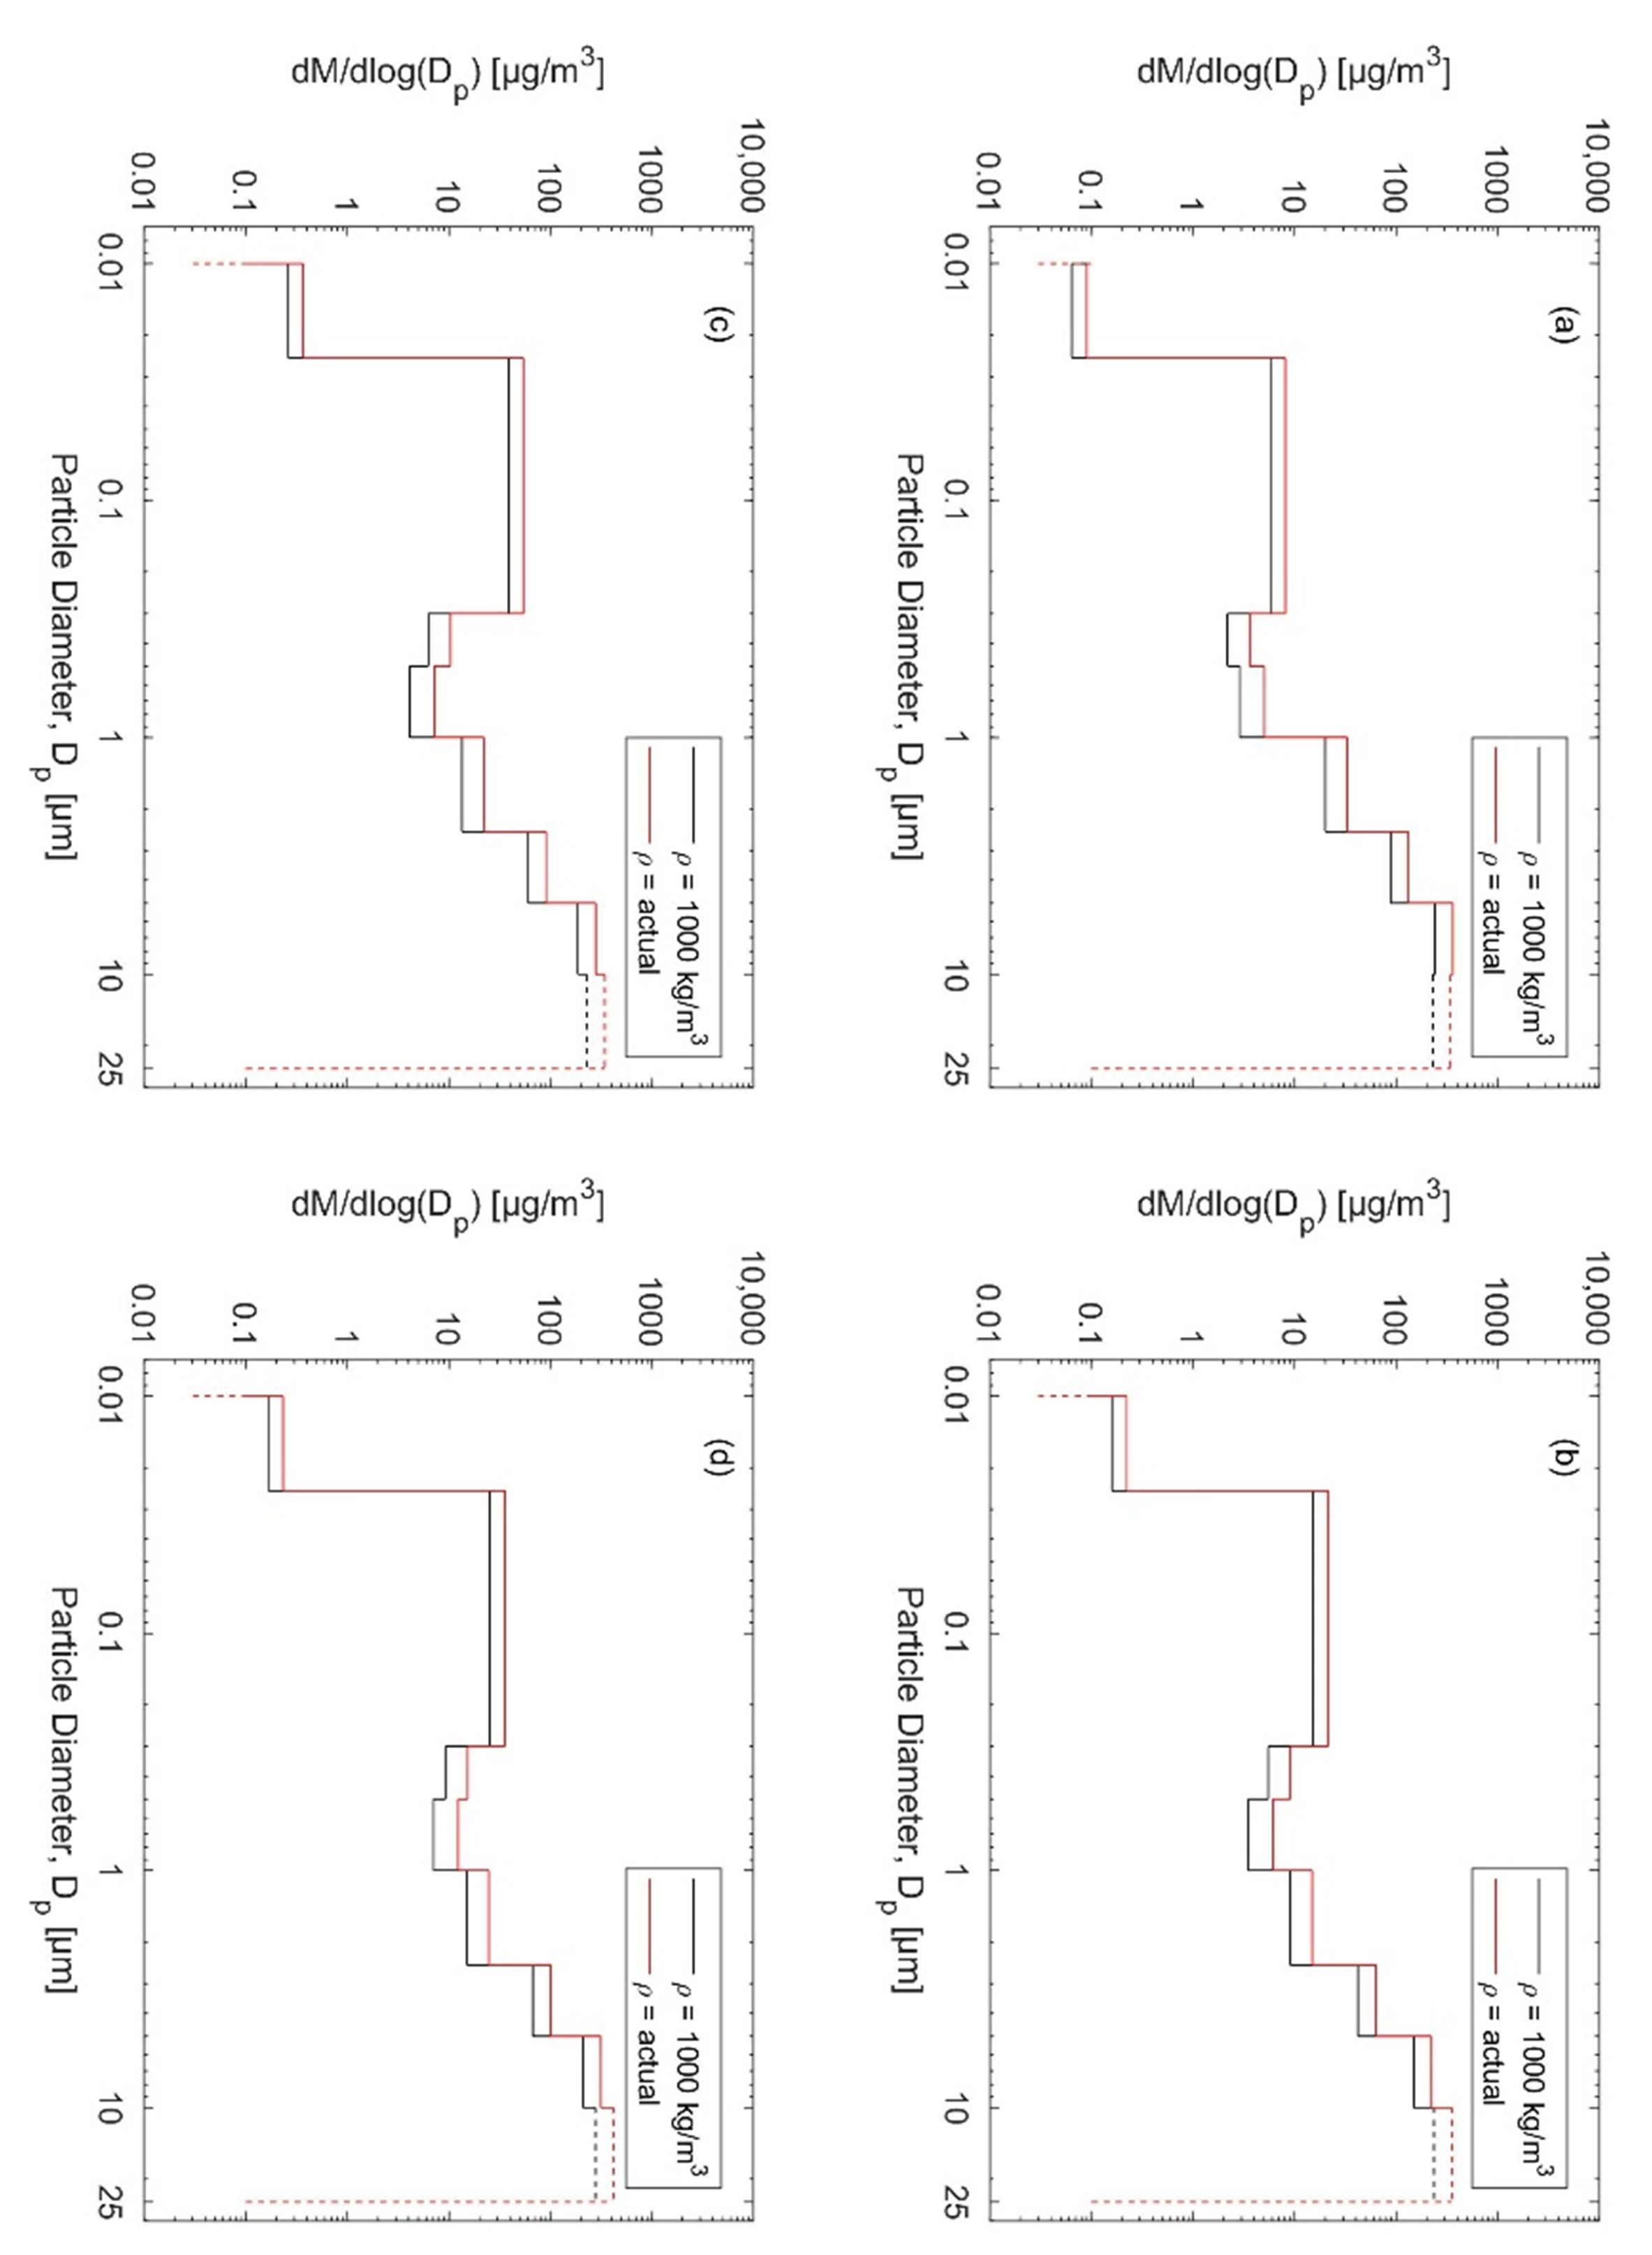
2.3. Particle Size Distributions

An aerosol database of size-fractionated particle number concentrations was adopted from a previous extensive measurement campaign by Hussein et al. [51] for Amman city, Jordan. The database included four environments: (a) rural background—outside the populated areas in the city to be used as a reference site, (b) urban background—University of Jordan campus and nearby areas, (c) main roads—traffic, and (d) city center—urban.
According to Hussein et al. [51], the experimental setup consisted of portable aerosol instruments; here, we took the aerosol data measured with the two portable Condensation Particle Counters (CPC, 3007-2 and P-Trak 8525, TSI, Minnesota, USA) and a handheld optical particle counter (AeroTrak 9306-V2, TSI). The use of portable CPCs (with different cut off sizes: 10 nm for the CPC 3007 and 25 nm for the P-Trak) side-by-side with an AeroTrak (channels as 0.3, 0.5, 1, 2.5, 5, 10, and 25 µm in optical diameter) provides a basis to derive the particle number size distribution (10 nm–25 µm) with 8 channels. As previously mentioned in our previous study (Hussein et al. [51]), we did zero checks for each instrument with a HEPA filter capsule multiple times each day during the measurement campaign. The AeroTrak OPCs were factory-calibrated and the CPCs (lower-cutoff) were calibrated at the University of Helsinki aerosol lab.
While the aerosol measurements were conducted during driving or walking scenarios, we calculated the statistical values (mean, standard deviation, min, 5%, 25%, median, 75%, 95%, and max) of the size-fractionated particle number concentrations for each selected region (Table S1). The corresponding mean particle number size distributions are shown in Figure 2.
The shape of the mean particle size distributions were relatively similar among the four areas we considered in Amman; the only difference was in the total concentration, which was the highest on main roads, followed by the downtown area and then by the urban background location (University of Jordan campus and its surroundings).
If size-resolved particle densities are known, the particle mass size distribution can be calculated by assuming spherical particles. Here, we first assumed spherical particles with unit density (1000 kg/m3; see black distributions in Figure 3). To obtain particle density, also information about chemical composition and agglomeration state (e.g., fractal dimension) is needed. Abdeen et al. [52] estimated that Amman PM2.5 consists mainly of organic matter (12.1%), elemental carbon (2.5%), sulfate (4.9%), nitrate (1.2%), ammonium (2.0%), dust (10.7%), metals (0.8%), and undefined compounds (15.2%), but the size fractioned compositions were not reported. These are typical components in urban air even though the fractions vary significantly depending on the city location.
The particle mass size distributions were also estimated using size-resolved effective densities for aerosols as measured in urban background conditions in Asian cities, as reviewed by Wu and Boor [53] (Table 2). The aerosol effective density can be defined as the ratio of the measured particle mass to the volume calculated from the electrical mobility diameter, assuming spheres. The effective densities range from 1.4 to 1.75 times higher than unit density and hence, increases the calculated mass dose rate. Therefore, we will consider the dose rate calculations by using the effective density assessed by Wu and Boor [53] (i.e., red curves in Figure 3). In practice, the effective density changes between locations [54]. In rural background, coagulated dense particles is expected to be dominant while fresh fractal soot particles prevail in downtown locations. In addition, effective density has a diurnal pattern [55].

3. Results and Discussion

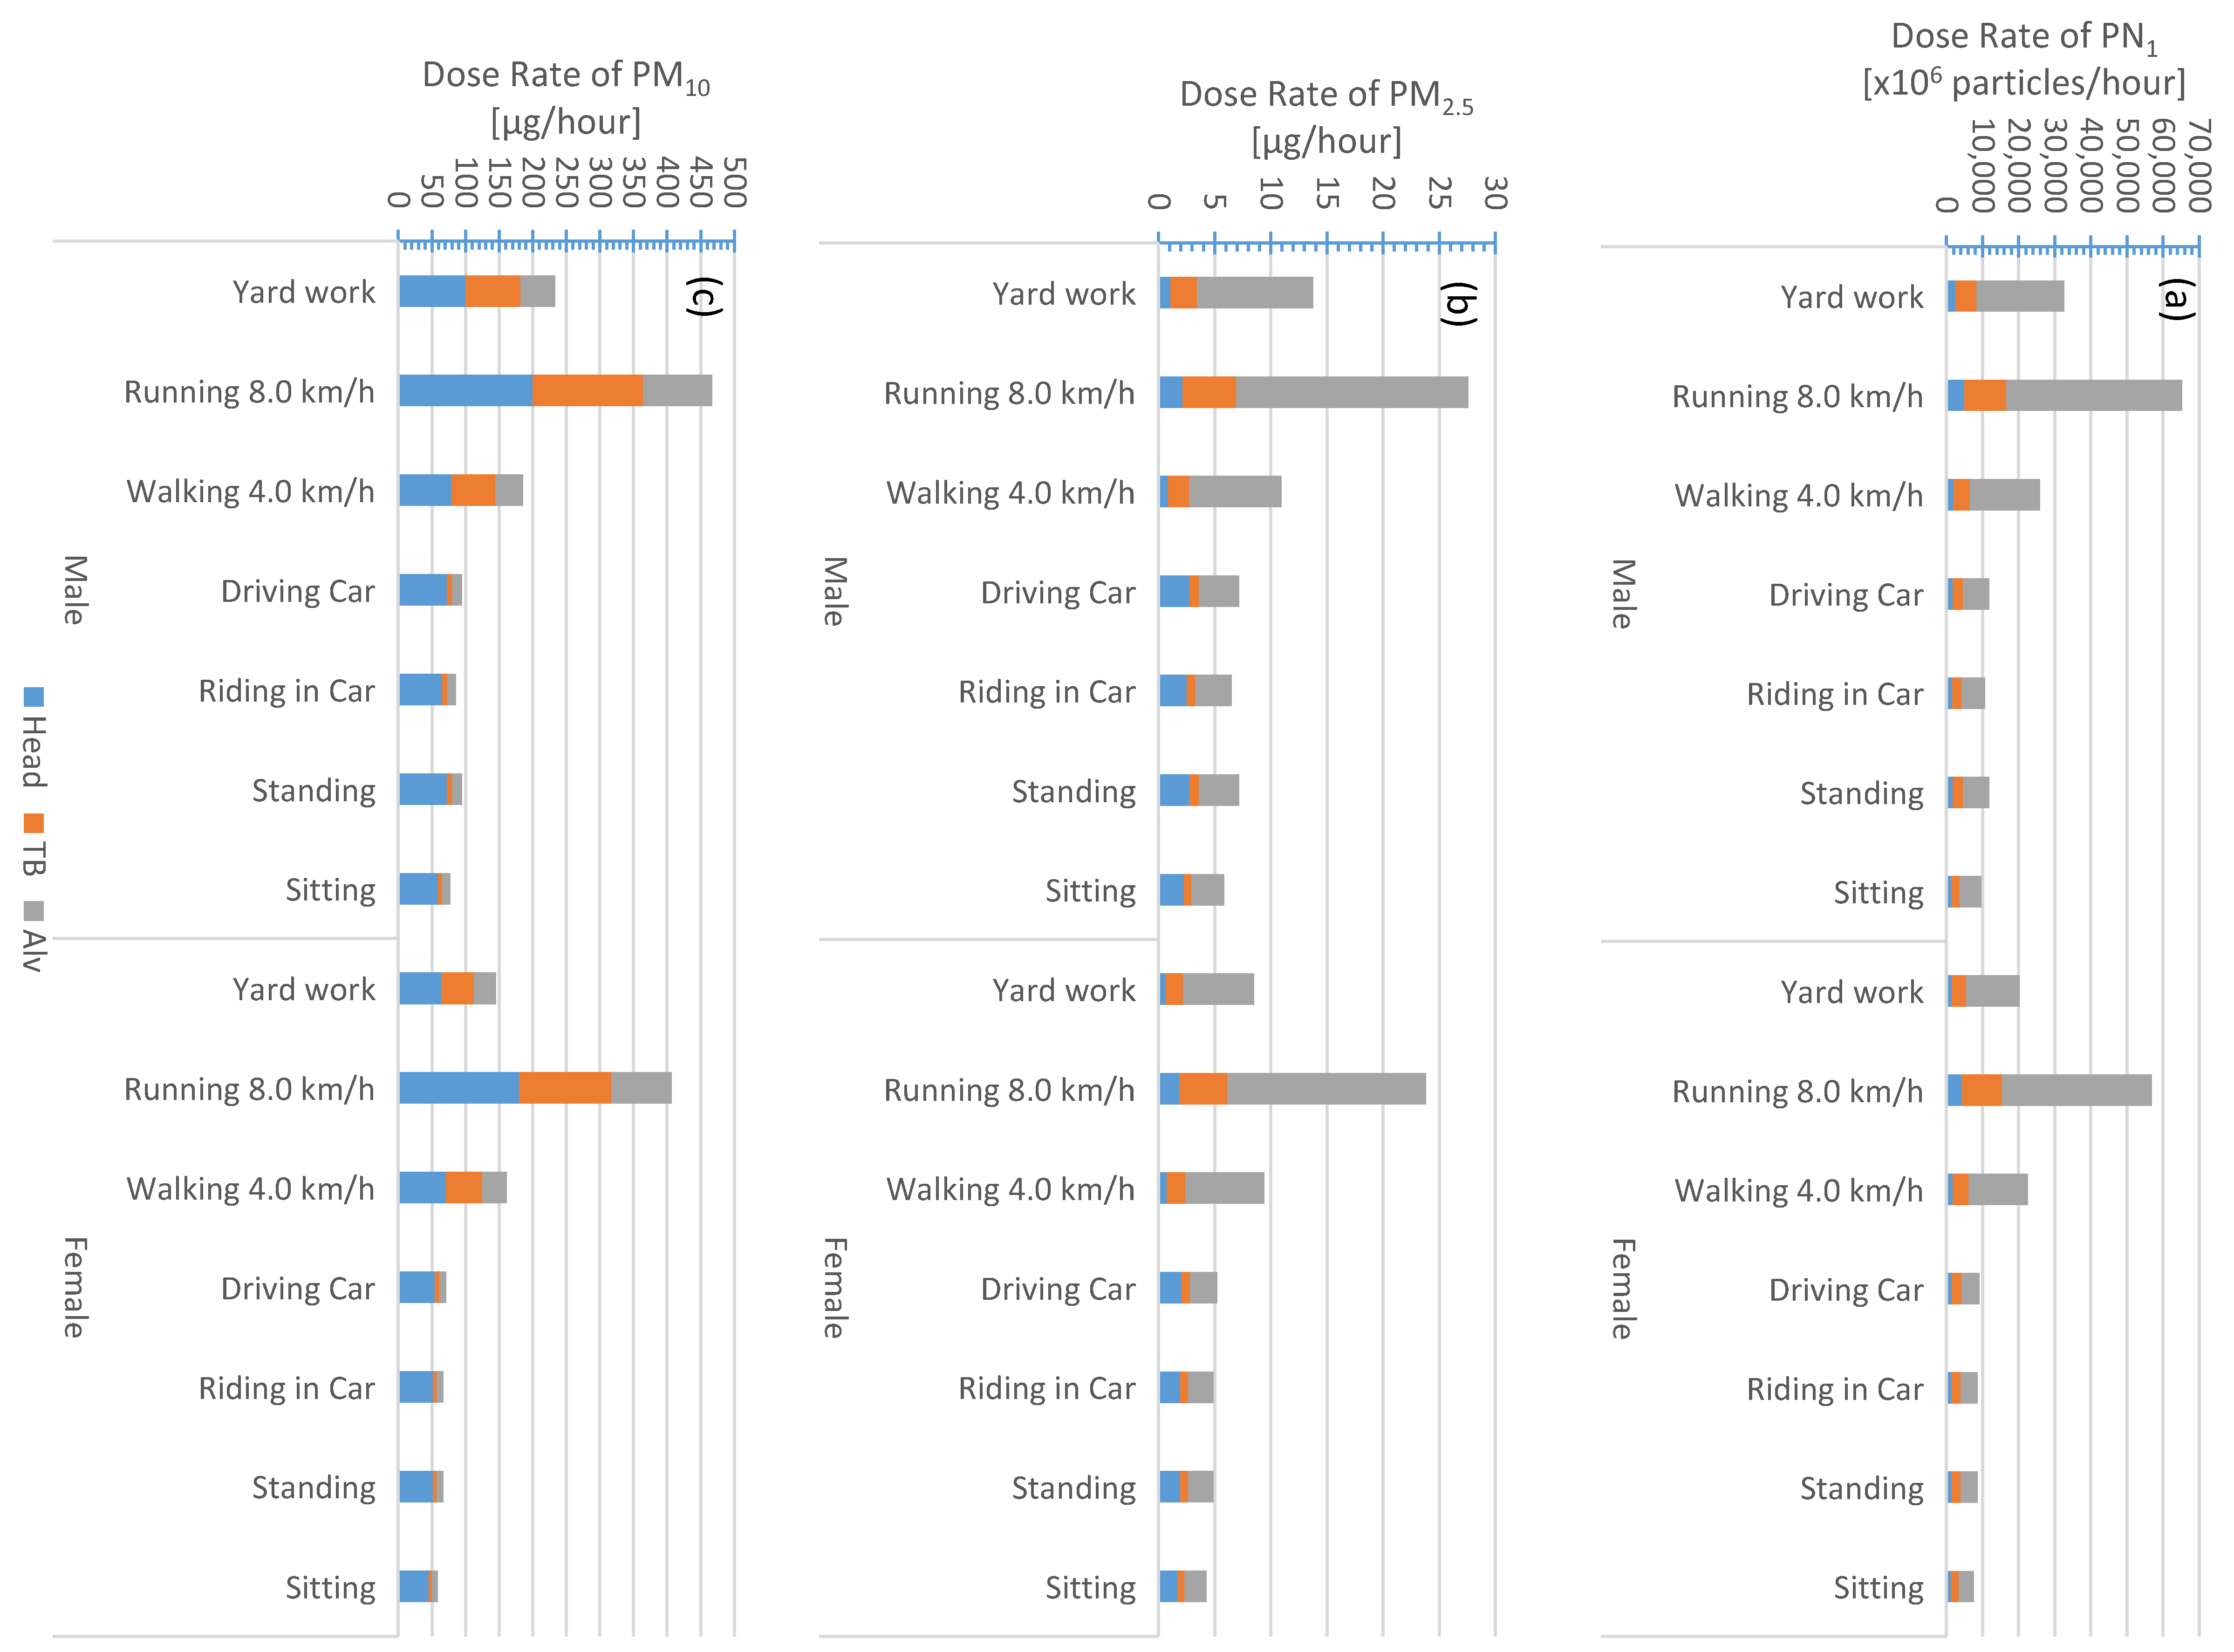
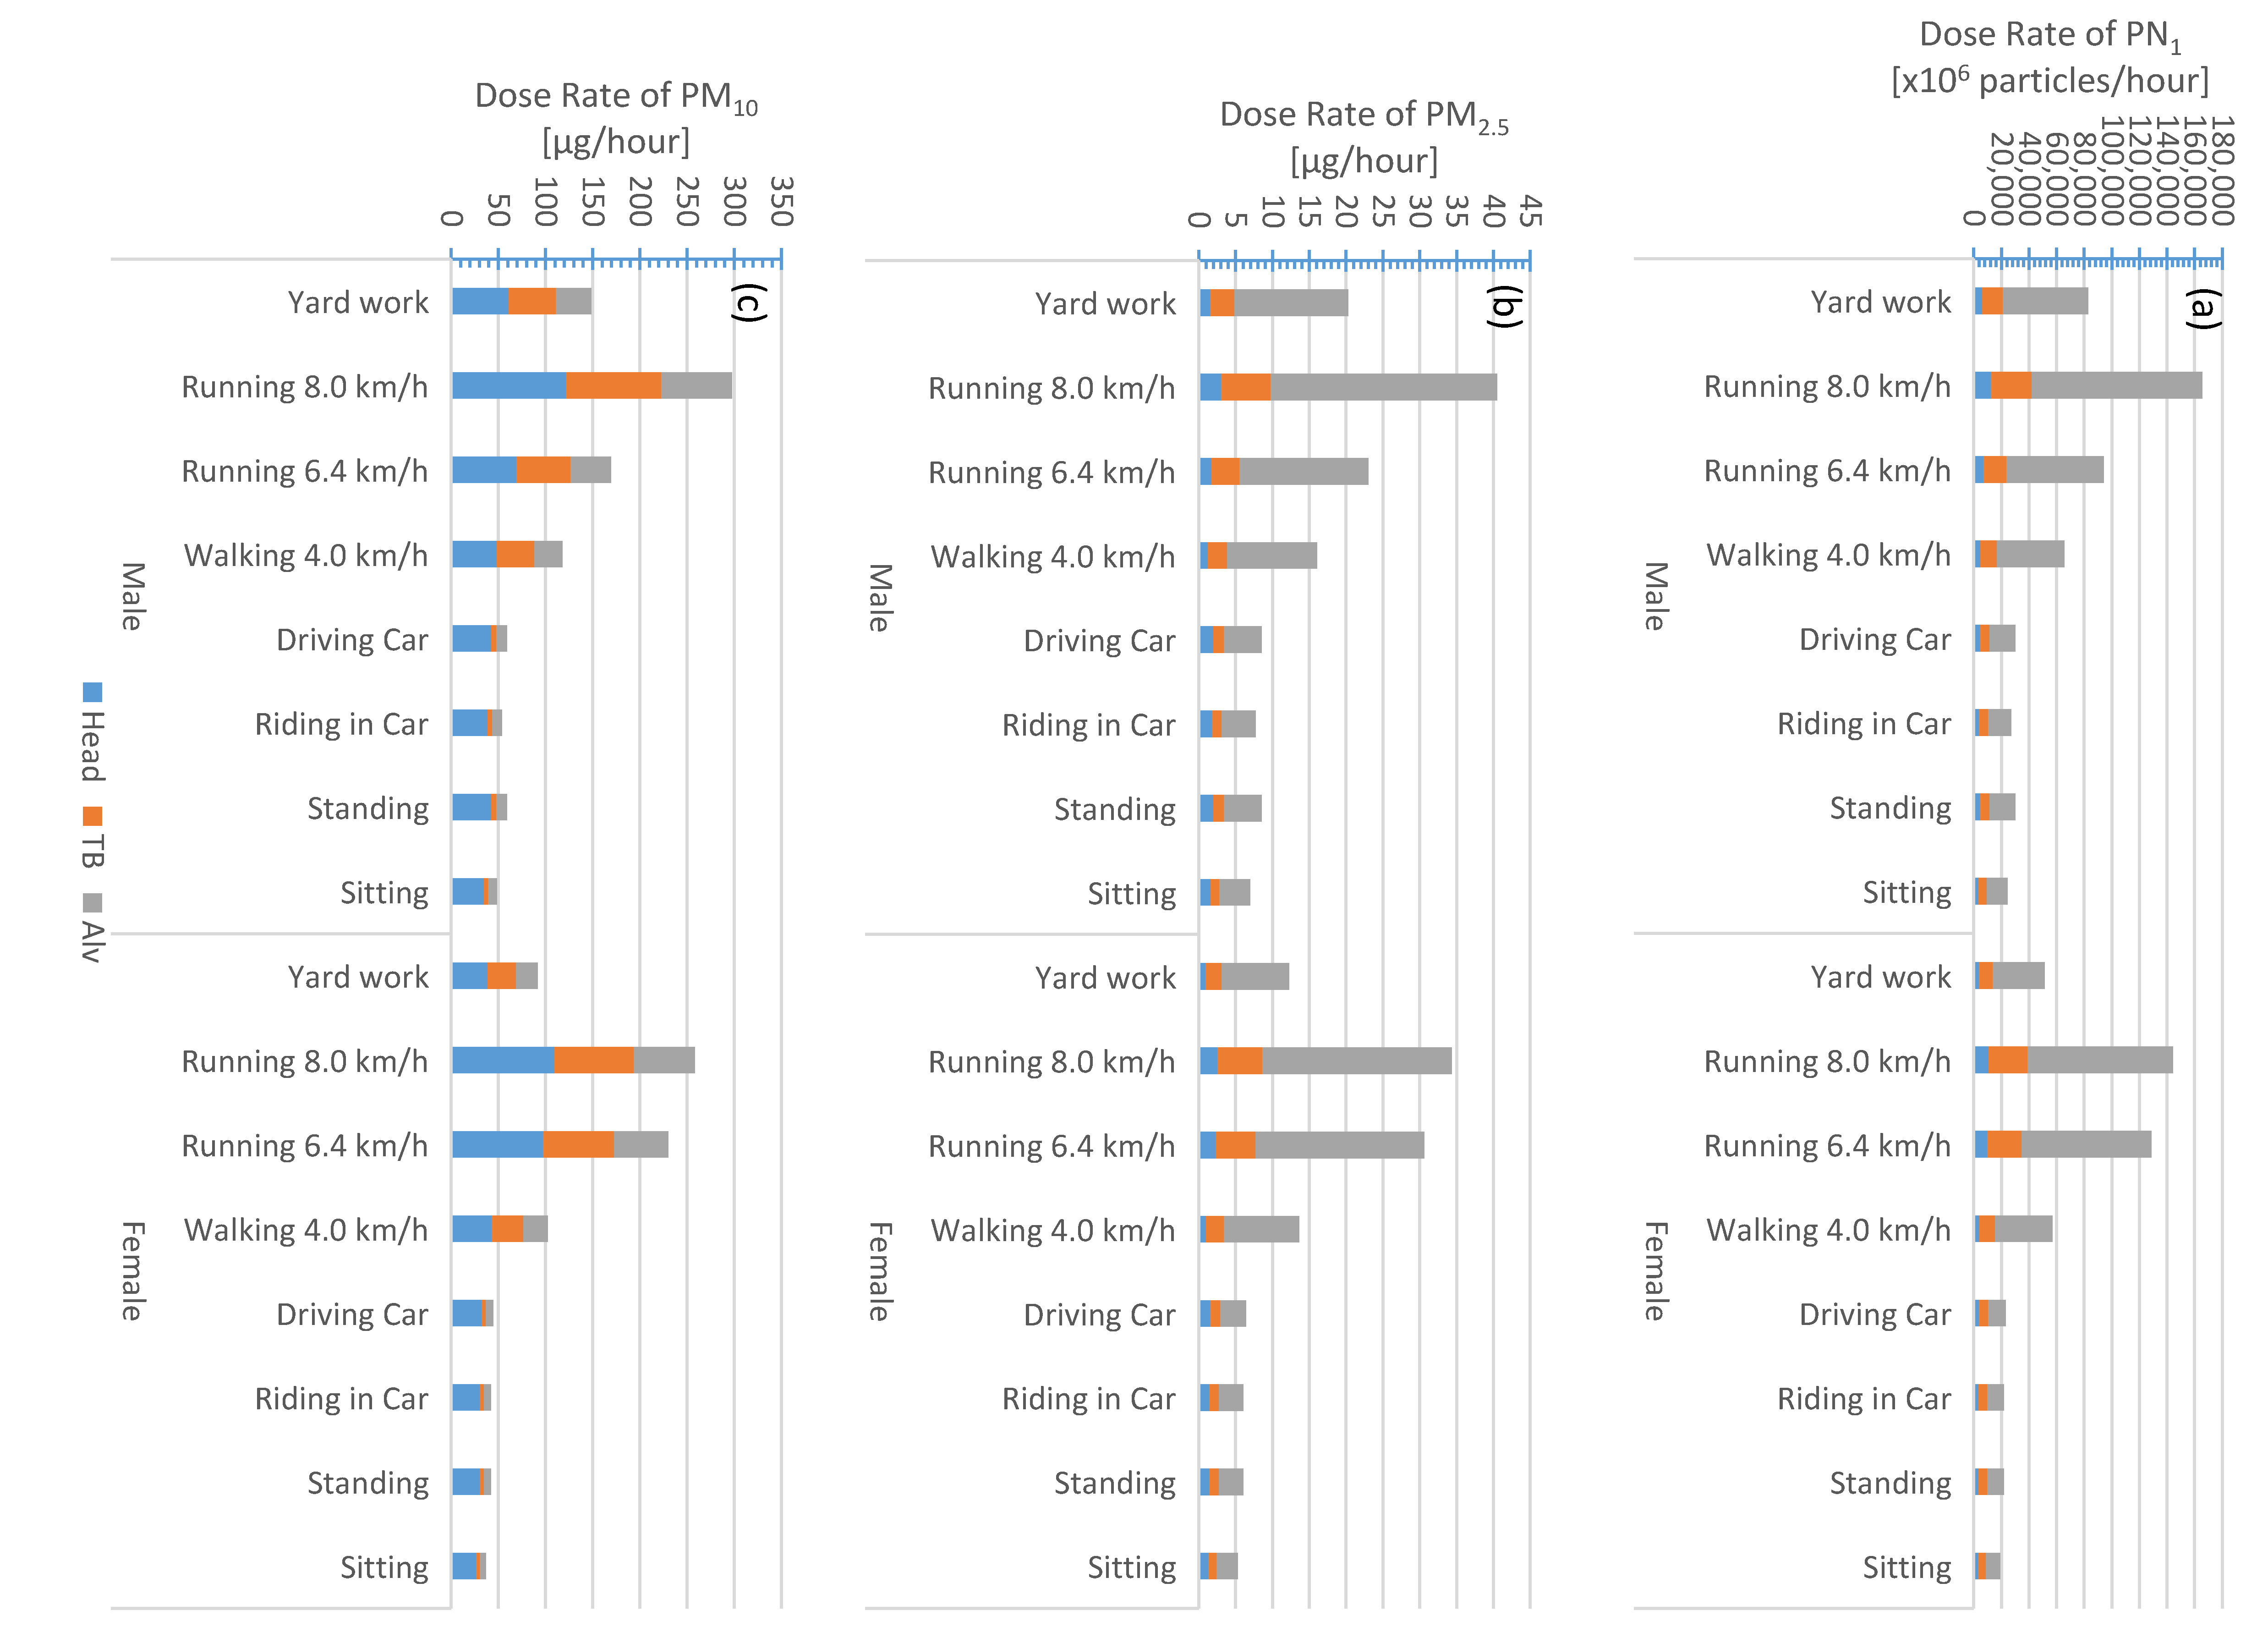
3.1. Regional and Total Inhaled Dose Rate

Calculated regional inhaled deposited dose rates for males and females are shown in Figure 4, Figure 5, Figure 6 and Figure 7 and listed in the Supporting Information, Tables S2 and S3. The maximum total dose rate was higher when exercising (yard work, running, and walking) than being at rest (driving/riding a car, standing, and sitting). This was regardless of gender, metric, and geographical factors.
For adult males (Table S2, Figure 4, Figure 5, Figure 6 and Figure 7), the PN1 total dose rate when running (8 km/h) was about 3.3 × 10¹¹ particles/h (on roads), 2.2 × 10¹¹ particles/h (downtown), 1.7 × 10¹¹ particles/h (urban background), and 6.5 × 10¹⁰ particles/h (rural background). The corresponding PM2.5 total dose rates were about 95, 68, 41, and 28 µg/h, respectively. When sitting, the PN1 (PM2.5) total dose rates were about 5.0 × 10¹⁰ particles/h (16 µg/h), 3.2 × 10¹⁰ particles/h (12 µg/h), 2.5 × 10¹⁰ particles/h (7 µg/h), and 9.7 × 10⁹ particles/h (6 µg/h), respectively for roads, downtown, urban background, and rural background.
Based on adult male activities (exercise versus rest), the PM10 total dose rate order (highest to lowest) was the same as that for PN1 and PM2.5; however, it was different based on the respiratory tract region. For example, the PM10 total dose rate while running (8 km/h) was about 467, 439, 425, and 297 µg/h; respectively for the rural background, downtown, roads, and urban background (Table S2, Figure 4, Figure 5, Figure 6 and Figure 7). While sitting, the adult male PM10 total dose rate was about 77, 72, 69, and 49 µg/h, respectively for the same order. In principle, the particle mass size distribution is dominated by accumulation mode and coarse mode particles (Figure 3); and hence, the PM10 is also dominated by those modes. Dust resuspension at the rural background site is expected to be the highest among all sites as a result of large open areas available for higher wind speeds. As for the downtown and roads, the traffic activity can induce road dust resuspension. At the urban background site (University of Jordan and its surroundings), the landscape was a mixture of residential, roads, and urban forest; the trees can act as a sink for dust loading in the atmosphere.
In general, the total dose rate for females (Table S3, Figure 4, Figure 5, Figure 6 and Figure 7) was lower than that in males (Table S2) for all activities. When an adult female is running (8 km/h) (Table S2, Figure 4, Figure 5, Figure 6 and Figure 7), the PN1 (PM2.5) total dose rates were about 2.9 × 10¹¹ particles/h (80 µg/h), 1.9 × 10¹¹ particles/h (58 µg/h), 1.4 × 10¹¹ particles/h (34 µg/h), and 5.7 × 10¹⁰ particles/h (24 µg/h); respectively for roads, downtown, urban background, and rural background. When sitting, the female PN1 (PM2.5) total doses rate were about 3.9 × 10¹⁰ particles/h (12 µg/h), 7.6 × 10⁹ particles/h (9 µg/h), 1.9 × 10¹⁰ particles/h (5 µg/h), and 7.6 × 10¹⁰ particles/h (2 µg/h); respectively for roads, downtown, urban background, and rural background. As for the PN1 total dose rates, for running (8 km/h) activity it was 407 µg/h (rural background), 381 µg/h (downtown), 368 µg/h (roads), and 64 µg/h (urban background) whereas for sitting it was 9 µg/h (rural background), 55 µg/h (downtown), 53 µg/h (roads), and 37 µg/h (urban background).
We evaluated the fraction of the total inhaled deposited dose rate received by each region of the respiratory tract (Table S5). The PM10 fractions were rather similar for both males and females (regardless to the geographical region). While resting, the PM10 fraction was the most (67–77%) in the head airways and the least (8–12%) in the tracheobronchial region. When exercising, the PM10 fraction in the head was lowered to about 37–44% and slightly increased in the tracheobronchial region to about 31–35%. Regardless to the gender, the PN1 and PM2.5 fractions were the least in the head airways; about 8% when exercising and 14–16% when resting. The PN1 and PM2.5 percentage fractions were the most in the alveolar region; during exercising it was 73–75% (PN1) and 74–76% (PM2.5), whereas during resting it was lowered to 54–62% (PN1) and 46–62% (PM2.5).
According to Equation (1), the regional dose rate is dependent on several main factors: (1) geographical factor, (2) physical characteristics of the particle number size distribution, (3) activity type (exercise versus relax/rest), (4) gender, and (5) concentration metric (number versus mass) and the particle diameter range (PN1 and PM2.5 versus PM10). It should be noticed here that for urban aerosols the particle number size distribution is dominated by ultrafine particles (Dp < 0.1 µm), whereas the particle mass concentration is dominated by accumulation and coarse mode particles. Assuming spherical particles of unit density would underestimate the calculated particle mass size distributions, as compared to using size-resolved effective densities (Figure 3). Consequently, the calculated dose rate will be underestimated by 29–35% and 31–33% for PM2.5 and PM10 (Tables S2–S4), respectively.
It is important to mention that the dose rate was nonlinearly proportional to the exposure level (i.e., total concentration). For example, the mean total particle number concentration was about 1.2 × 10⁵, 8.1 × 10⁴, 4.8 × 10⁴, and 1.9 × 10⁴ particles/cm3 (Table S1) for roads, downtown, urban background, and background, respectively. The corresponding total dose rate in adult males while standing was about 3.9 × 10¹⁰ particles/h (on roads), 3.8 × 10¹⁰ particles/h (downtown), 3.0 × 10¹⁰ particles/h (urban background), and 1.2 × 10¹⁰ particles/h (background). As an example, the particle number concentration ratio between the background site to that on roads was about 1:16, whereas the corresponding total dose rate ratio (adult male) was about 1:31. This means that the relationship between the number concentration and the dose rate is complex and strongly depends on the shape (i.e., modal structure) of the particle number size distribution as it relates to the size-resolved DF curves (Figure 2).
It is also important to mention here that we did not include the hygroscopicity in our calculations, which can increase the diameter of ambient particles by condensation at high humidity in the respiratory tract (about 99.5%) up to five times of their dry size [40,56,57]. A large fraction of a street level aerosol can be assumed to be relatively hydrophobic and the deposition fraction will be close to that for completely hydrophobic particles [40]. For urban background, hygroscopicity is likely to increase due to aging and larger fractions of other sources than fresh combustion, but still growth factors can be assumed to be rather low [56].
As chemical composition of the aerosols in this study is not known, calculation of hygroscopic growth in the respiratory tract is not possible. Hygroscopicity is, however, likely to shift the deposition and dose data: deposition fractions of particles below 0.5 µm would decrease (and hence also dose of these), while deposition fractions of particles in the range 0.5–10 µm would increase (thus increasing dose). For particles larger than 0.5 µm there will also be a shift towards an increased fraction depositing higher up in conducting airways (tracheobronchial and head airways) and a decrease in alveolar deposition.

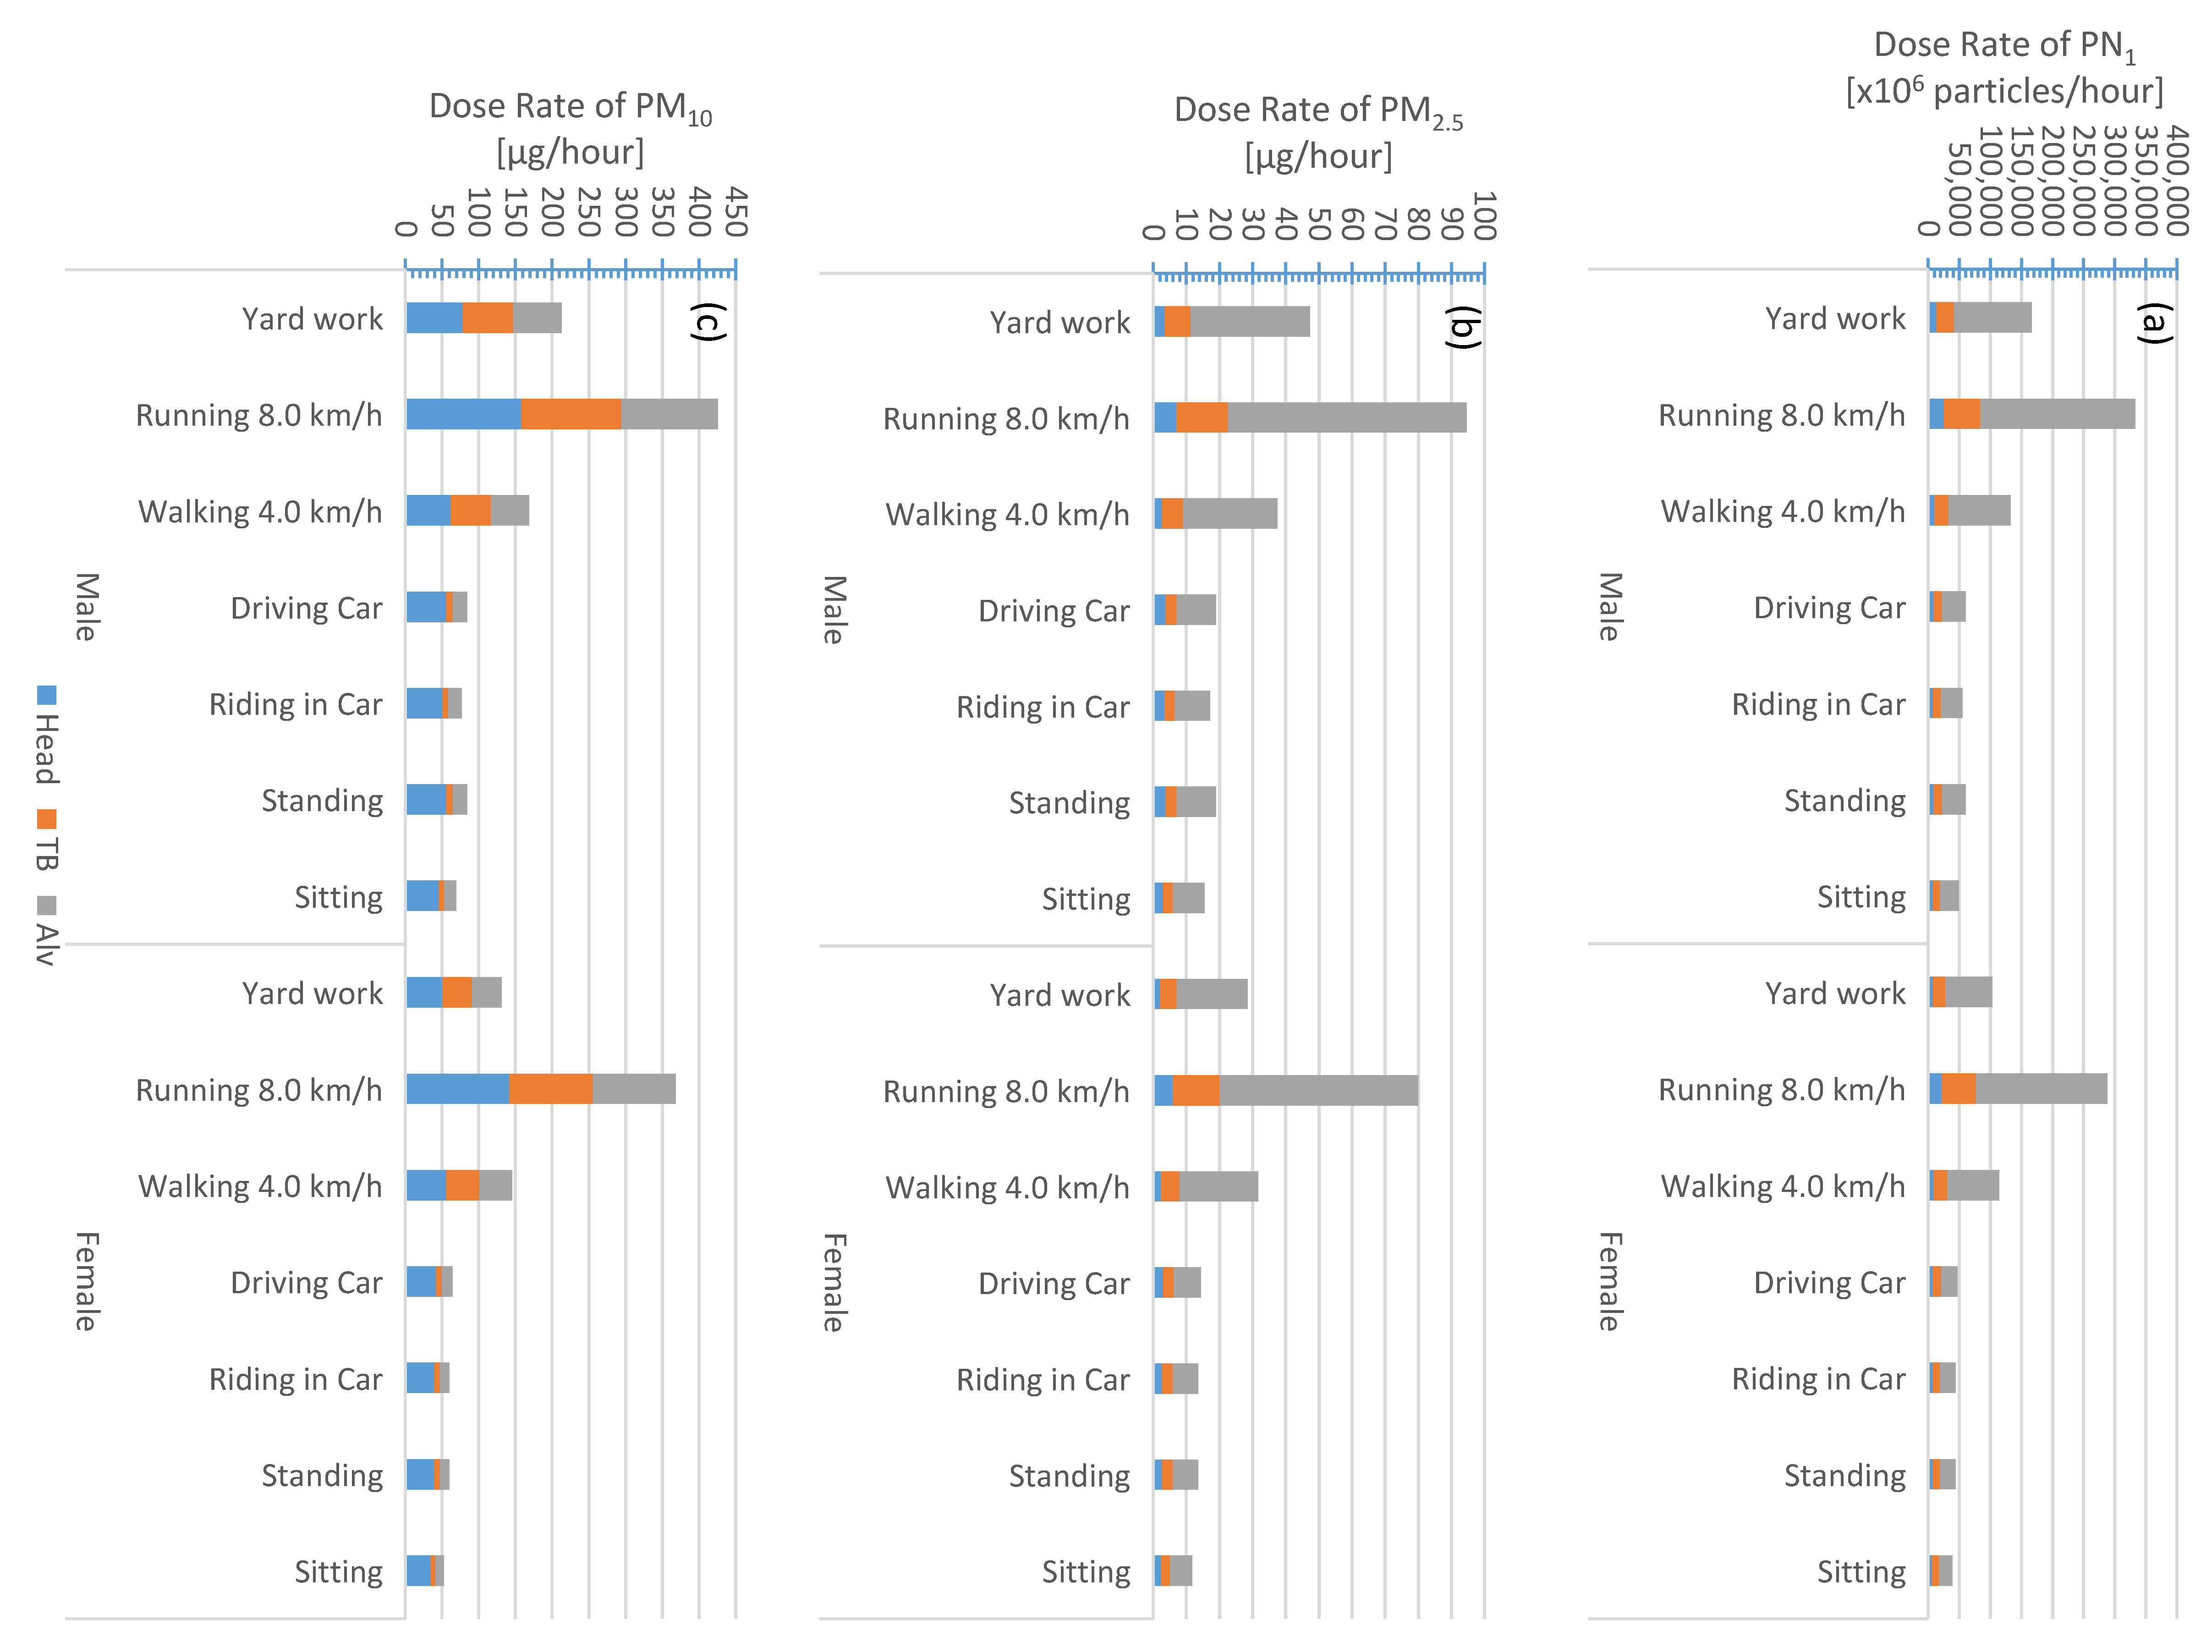
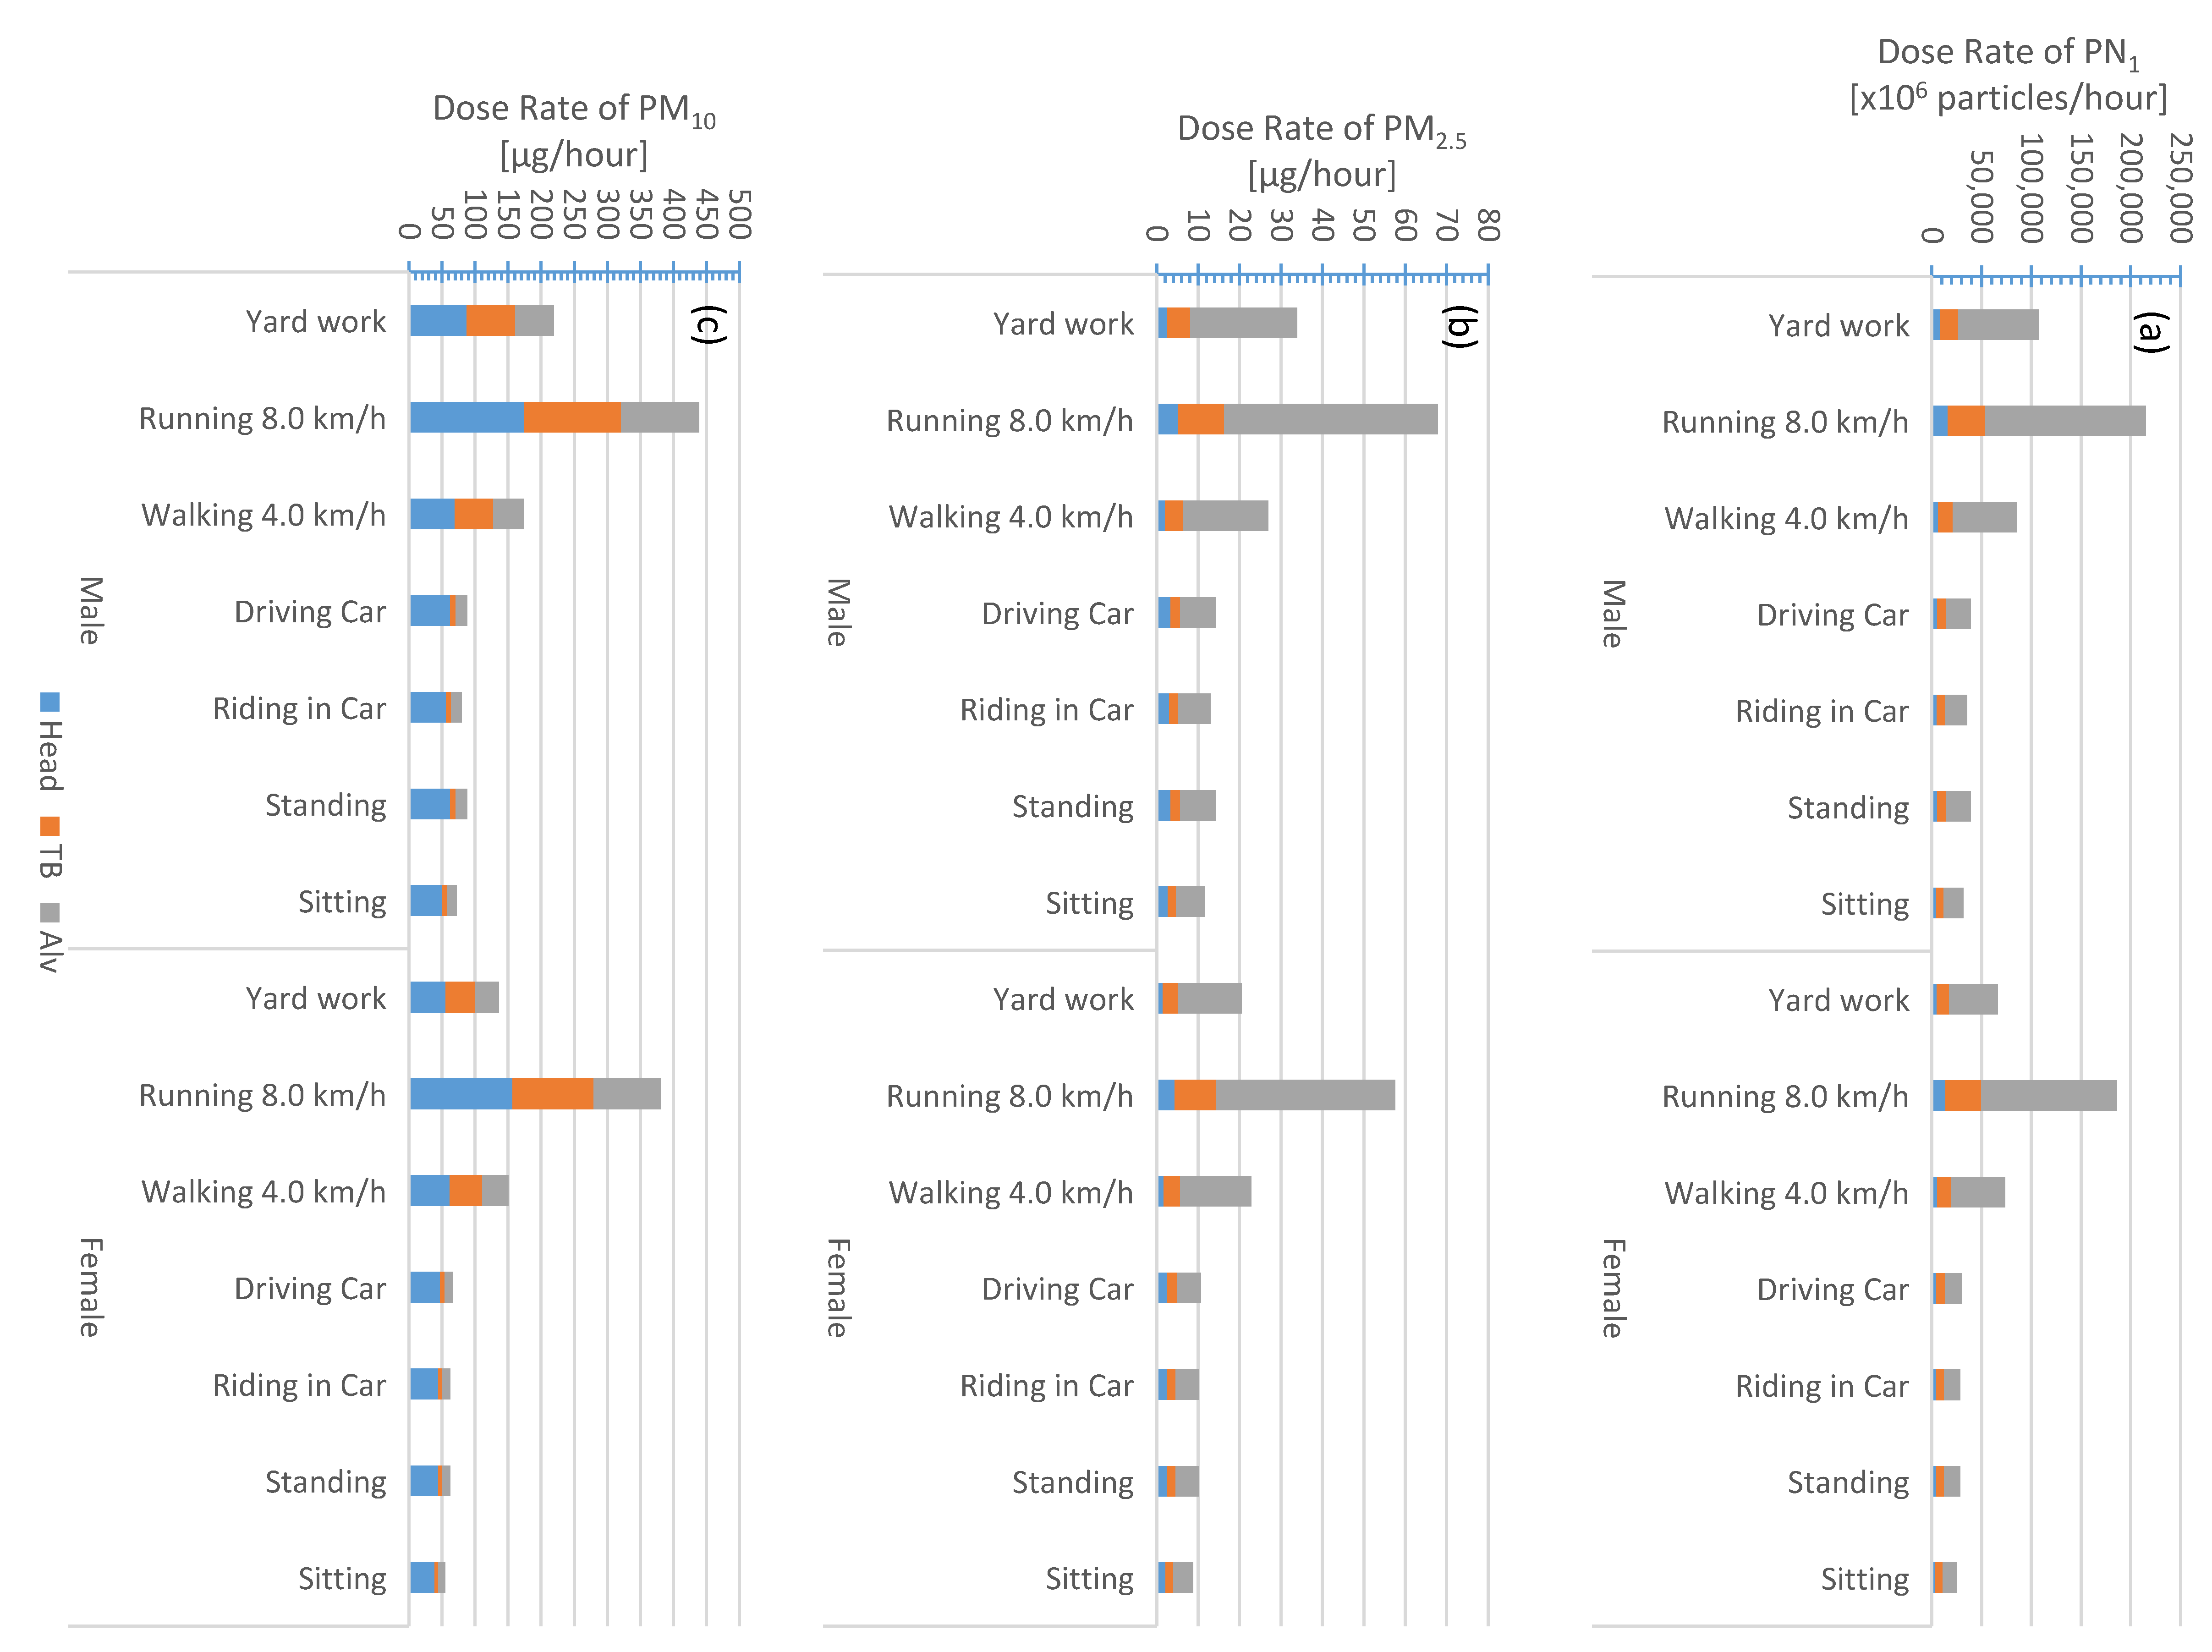
3.2. Scenarios of Exposure and Correspinding Dose Rate

An important outcome of this study is that the dose rates for common exposure scenarios in Amman city can be used to estimate deposited doses for different daily activities occurring over varying lengths of time. Amman city is considered representative of other cities in the Eastern Mediterranean region. The most common exposure scenarios in Amman are listed and described in Table 3. We differentiated the scenarios as being either on road or in-vehicle. The dose rates are then adopted from the corresponding cases provided in the supplementary material in Tables S2 and S3 (also see Figure 4, Figure 5, Figure 6 and Figure 7).
Taxi drivers spend their worktime in-vehicle being exposed to fresh traffic emissions (both tailpipe and none-tailpipe). It is therefore worthwhile to evaluate taxi drivers’ exposure while driving on the main roads, inside the downtown area, and in urban background regions. While driving in the downtown area, the taxi driver total dose rate would be PN1 3.9 × 10¹⁰ particles/h (eq. PM2.5 14 µg/h) and PM10 about 88 µg/h. While driving on the main roads, the dose rate would be a bit higher for PN1 (6.1 × 10¹⁰ particles/h; eq. PM2.5 19 µg/h) but rather similar for PM10 (85 µg/h). While driving in an urban background area, the dose rate would be less for both PN1 (3.0 × 10¹⁰ particles/h; eq. PM2.5 9 µg/h) and PM10 (59 µg/h).
As a tourist spending sometime in the transit (riding a taxi, bus, car rental, etc.), the dose rate would be slightly less than that for the taxi driver (adult male, VE = 0.66 m3/h) by a factor of 9% for an adult male (VE = 0.60 m3/h) and 27% for an adult female (VE = 0.48 m3/h) in each location (downtown, main roads, and urban background). Tourists also gather nearby city attractions, where they stand and walk. During standing in the downtown, the dose rate for an adult male tourist would be PN1 3.9 × 10¹⁰ particles/h (eq. PM2.5 14 µg/h) and PM10 about 88 µg/h whereas for an adult female tourist it would be PN1 2.9 × 10¹⁰ particles/h (eq. PM2.5 10 µg/h) and PM10 about 63 µg/h. Or they can be standing on a main road waiting for a transportation; in that case, the dose rate for an adult male would be PN1 6.1 × 10¹⁰ particles/h (eq. PM2.5 19 µg/h) and PM10 about 85 µg/h, whereas for an adult female it would be PN1 4.4 × 10¹⁰ particles/h (eq. PM2.5 14 µg/h) and PM10 about 60 µg/h. During walking in the downtown, the dose rate for an adult male would be PN1 8.5 × 10¹⁰ particles/h (eq. PM2.5 27 µg/h) and PM10 about 174 µg/h whereas for an adult female tourist it would be PN1 7.4 × 10¹⁰ particles/h (eq. PM2.5 23 µg/h) and PM10 about 151 µg/h.
The in-vehicle scenarios, as well as those presented for the tourists, might apply reasonably well for a police officer. Additionally, police officers spend their worktime in different parts of the city. Standing in an urban background area, the dose rate for a male police officer would be PN1 3.0 × 10¹⁰ particles/h (eq. PM2.5 9 µg/h) and PM10 about 59 µg/h whereas for a female police officer it would be PN1 2.2 × 10¹⁰ particles/h (eq. PM2.5 6 µg/h) and PM10 about 42 µg/h. The critical part of their job, as a female police officer might be pregnant. This leads to premature fetus exposure to significant amounts of harmful urban pollution during the early stage of pregnancy.
The University of Jordan, which is located at an urban background area, is one of the largest educational campuses in Jordan. It accommodates more than 60,000 students and more than 6000 workers. In addition, in the surroundings are found many educational campuses (universities, schools, daycare, etc.), public sector facilities, hotels, hospitals, students’ accommodation, restaurants, and many private sector firms and companies. This suggests that more than 500,000 inhabitants are exposed to air pollution in such an urban background area. The typical activities they might conduct are: standing, walking, and running. Standing in an urban background area, the dose rate for male police officer would be PN1 3.0 × 10¹⁰ particles/h (eq. PM2.5 9 µg/h) and PM10 about 59 µg/h, whereas for a female police officer it would be PN1 2.2 × 10¹⁰ particles/h (eq. PM2.5 6 µg/h) and PM10 about 42 µg/h. Walking (4 km/h) would result in higher dose rates than standing; in this case the dose rate for an adult male would be PN1 6.6 × 10¹⁰ particles/h (eq. PM2.5 16 µg/h) and PM10 about 118 µg/h whereas for an adult female it would be PN1 1.7 × 10¹¹ particles/h (eq. PM2.5 41 µg/h) and PM10 about 158 µg/h. Running (8 km/h) would elevate the dose rate to exceptionally high numbers; PN1 6.6 × 10¹⁰ particles/h (eq. PM2.5 16 µg/h) and PM10 about 118 µg/h whereas for an adult female it would be PN1 1.4 × 10¹¹ particles/h (eq. PM2.5 34 µg/h) and PM10 about 258 µg/h.
Service workers (such as waste service, road construction, etc.), who have their workplace outdoors, are also exposed to harmful urban air pollution that comes from typical urban sources in addition to that might originate from processes related to their work. Therefore, the dose rates presented here are expected to be an underestimate. We presumed the “yard work” is an equivalent activity for such type of work. As a male worker in an urban background area, the dose rate would be PN1 8.3 × 10¹⁰ particles/h (eq. PM2.5 20 µg/h) and PM10 about 149 µg/h. In the downtown area, the dose rate is expected to be higher than that in the urban background area; this would be PN1 1.1 × 10¹¹ particles/h (eq. PM2.5 34 µg/h) and PM10 about 219 µg/h. On main roads, that would be even higher; PN1 1.7 × 10¹¹ particles/h (eq. PM2.5 47 µg/h) and PM10 about 213 µg/h. These numbers are alarming. This exposure scenario might also apply to police officers (males and females); the critical part of this scenario is that for a pregnant police officer receiving such high dose rates at any stage of their pregnancy.
An extreme scenario is to perform outdoor sports. Here we only show the dose rates when jogging (eq. running with a speed 8 km/h) nearby a main road. For an adult male, the dose rate would be PN1 3.3 × 10¹¹ particles/h (eq. PM2.5 95 µg/h) and PM10 about 425 µg/h. For an adult female, that would be PN1 2.9 × 10¹¹ particles/h (eq. PM2.5 80 µg/h) and PM10 about 368 µg/h. recalling that Amman lacks for proper places for outdoor activities, this means that performing outdoor sports nearby main roads is not healthy. No wonder that people tend to go to indoor sports facilities. However, such indoor sports facilities are not usually equipped with proper air ventilation. In general, Health outcomes depend on uptake of pollutant. Typically risk assessment is based on exposure levels, which is independent only on regional concentration levels. However, deposited dose varies significantly depending also on person activity and physiology. For example, the dose rate is 5 times smaller for a person standing nearby a main road than running, even though they are exposed to the same concentration level.

4. Conclusions

In this study we evaluated the regional deposited dose of inhaled particulate matter based on mean particle number size distributions (0.01–25 µm) measured in urban, urban background, main roads, and rural atmosphere in Amman, Jordan. We also calculated the mean particle mass size distributions and calculated the dose rates in terms of PM2.5 and PM10.
The dose rate was dependent on: (1) geographical factor, (2) physical characteristics of the particle number size distribution, (3) activity type (exercise versus relax/rest), (4) gender, and (5) concentration metric (number versus mass) and the particle diameter range (PN1 and PM2.5 versus PM10). Therefore, the dose rate was nonlinearly proportional to the exposure level (i.e., total concentration).
As expected, the total dose rate was the highest when exercising (running at 8 km/h) regardless of gender, metric, and geographical factors. The total dose rate for females was generally lower than that for males during all activities in urban areas, but for both PN1 dose rates were on the order 1010–1011 particles/h (eq. PM2.5 101–102 µg/h). Intuitively, the highest dose rate was during running on main roads, whereas the lowest dose rate was during sitting in the urban background. The corresponding PN10 dose rates was in the range 49–439 µg/h for males whereas 36–381 µg/h for females.
Regardless to the gender, the PM10 dose rate fraction during rest was mostly in the head airways (67–77%) and the least in the tracheobronchial region (8–12%). When exercising, the fraction in the head airways was 37–44% whereas that in the tracheobronchial region was 31–35%. The PM2.5 fractions were the least in the head airways (~8% when exercising and 14–16% when resting) and the most in the alveolar region (exercising was 74–76% and resting was 54–62%).
An important outcome of this study is extending the dose rates calculations for common exposure scenarios (on road or in-vehicle) in Amman city. The alarming dose rate values were obtained for service workers or police officers, who spend a significant amount of time outdoors. They received a total dose rate PN1 8.3 × 10¹⁰ particles/h (eq. PM2.5 20 µg/h) and PM10 149 µg/h in an urban background area. In the downtown area, the dose rate would be PN1 1.1 × 10¹¹ particles/h (eq. PM2.5 34 µg/h) and PM10 about 219 µg/h. On main roads, PN1 1.7 × 10¹¹ particles/h (eq. PM2.5 47 µg/h) and PM10 about 213 µg/h. The critical part of this scenario is that for a pregnant police officer receiving such high dose rates at any stage of pregnancy.
An extreme scenario is to perform outdoor athletic activities; for example, running with a speed 8 km/h nearby a main road. For an adult male, the dose rate would be PN1 3.3 × 10¹¹ particles/h (eq. PM2.5 95 µg/h) and PM10 about 425 µg/h. For an adult female, that would be PN1 2.9 × 10¹¹ particles/h (eq. PM2.5 80 µg/h) and PM10 about 368 µg/h. Amman lacks proper facilities for outdoor activities, this means that performing outdoor sports nearby main roads is not healthy. However, such indoor sports facilities are not usually equipped with proper air ventilation.
While in this study we provided an estimate for the regional inhaled deposited dose rate, which was made for the first time for a city in the eastern Mediterranean, it has some limitations. First, we used aerosols data base measured during an extensive campaign with portable instruments. These instruments are not the state-of-the-art and each one has its own individual limitations related to the setup and accuracy. Second, we derived the particle number size distribution by combining the measured aerosol concentrations in different particle size fractions measured with instruments that operate with different principles; this indeed would not give us cutting edge results but rather provide us with an estimate value. Third, the measurement campaign was made during the summer time, when the number concentrations are expected to be less than in the winter; and thus, our results here are not expected to be representative for the any time of the year. Fourth, we assumed effective particle density, which could be not representative for the conditions in Amman but we presume it is close enough to the actual conditions. Finally, we considered certain scenarios of subjects’ activities that we believe it can be representative to many cases in Amman.

Supplementary Materials

The following are available online at https://0-www-mdpi-com.brum.beds.ac.uk/2073-4433/10/9/530/s1, Tables and figures illustrating the materials required for the calculations of the regional inhaled deposited dose rate, which is also presented in separate tables in the supplementary materials.

Author Contributions

Conceptualization, T.H., and J.L.; methodology, T.H., and J.L.; validation, T.H., J.L., J.K. and B.E.B..; formal analysis, T.H., S.S., and V.N.d.S.; investigation, T.H., and S.S.; resources, T.H., and B.E.B..; data curation, V.N.d.S.; writing—original draft preparation, T.H., and S.S.; writing—review and editing, T.H., J.L., B.E.B.., and J.K.; visualization, T.H.; supervision, T.H.; project administration, T.H.; funding acquisition, T.H.

Funding

This research was funded by the Deanship of Academic Research (DAR, project number 1516) at the University of Jordan. This research was part of a close collaboration between the University of Jordan and the Institute for Atmospheric and Earth System Research (INAR/Physics, University of Helsinki) via ERA-PLANET (www.era-planet.eu), trans-national project SMURBS (www.smurbs.eu) (Grant Agreement n. 689443), funded under the EU Horizon 2020 Framework Programme and Academy of Finland via the Center of Excellence in Atmospheric sciences and NanoBioMass (project number 1307537). Grants also received from the Swedish Research Councils FORMAS (project 2018-00693) and FORTE (2017-00690). This manuscript was written and completed during the sabbatical leave of the first author’s (Tareq Hussein) that was spent at the University of Helsinki and supported by the University of Jordan during 2019.

Acknowledgments

This study and other urban research by the Aerosol Laboratory of the University of Jordan was recommended by the World Health Organization regional office in Amman.

Conflicts of Interest

The authors declare no conflict of interest.

References

  1. Fenger, J. Urban air quality. Atmos. Environ. 1999, 33, 4877–4900. [Google Scholar] [CrossRef]
  2. Anderson, H.R. Air pollution and mortality: A history. Atmos. Environ. 2009, 43, 142–152. [Google Scholar] [CrossRef]
  3. Dockery, D.W.; Luttmann-Gibson, H.; Rich, D.Q.; Link, M.S.; Mittleman, M.A.; Gold, D.R.; Koutrakis, P.; Schwartz, J.D.; Verrier, R.L. Association of Air Pollution with Increased Incidence of Ventricular Tachyarrhythmias Recorded by Implanted Cardioverter Defibrillators. Environ. Health Perspect. 2005, 113, 670–674. [Google Scholar] [CrossRef] [PubMed] [Green Version]
  4. Lohmann, U.; Feichter, J. Global indirect aerosol effects: A review. Atmos. Chem. Phys. 2005, 5, 715–737. [Google Scholar] [CrossRef]
  5. Pope, C.A., III; Burnett, R.T.; Thun, M.J.; Calle, E.E.; Krewski, D.; Ito, K.; Thurston, G.D. Lung cancer, cardiopulmonary mortality, and long-term exposure to fine particulate air pollution. Am. Med. Assoc. 2002, 287, 1132–1140. [Google Scholar] [CrossRef] [PubMed]
  6. Künzli, N.; Kaiser, R.; Medina, S.; Studnicka, M.; Chanel, O.; Filliger, P.; Herry, M.; Horak, F., Jr.; Puybonnieux-Texier, V.; Quénel, P.; et al. Public-health impact of outdoor and traffic-related airpollution: A European assessment. Lancet 2000, 356, 795–801. [Google Scholar]
  7. Jones, A.P. Indoor air quality and health. Atmos. Environ. 1999, 33, 4535–4564. [Google Scholar] [CrossRef]
  8. Pope, C.A.; Dockery, D.W. Health effects of fine particulate air pollution: Lines that connect. J. Air Waste Manag. 2006, 56, 709–742. [Google Scholar] [CrossRef]
  9. Hänninen, O.; Knol, A.; Jantunen, M.; Lim, T.A.; Conrad, A.; Rappolder, M.; Carrer, P.; Fanetti, A.-C.; Kim, R.; Buekers, J.; et al. Environmental burden of disease in Europe: Asessing nine risk factors in six countries. Environ. Health Perspect. 2014, 122, 439–446. [Google Scholar] [CrossRef]
  10. WHO. Preventing Disease through Healthy Environments: A Global Assessment of the Burden of Disease from Environmental Risks; WHO: Geneva, Switzerland, 2018; ISBN 978 92 4 156519 6. [Google Scholar]
  11. Landrigan, P.J.; Fuller, R.; Acosta, N.J.R.; Adeyi, O.; Arnold, R.; Basu, N.N.; Baldé, A.B.; Bertollini, R.; Bose-O’Reilly, S.; Boufford, J.I.; et al. The Lancet commission on pollution and health. Lancet 2018, 391, 462–512. [Google Scholar] [CrossRef]
  12. Downward, G.S.; van Nunen, E.J.H.M.; Kerckhoffs, J.; Vineis, P.; Brunekreef, B.; Boer, J.M.A.; Messier, K.P.; Roy, A.; Monique, W.; Verschuren, M.; et al. Long-Term Exposure to Ultrafine Particles and Incidence of Cardiovascular and Cerebrovascular Disease in a Prospective Study of a Dutch Cohort. Environ. Health Perspect. 2018, 126, 127007. [Google Scholar] [CrossRef] [PubMed] [Green Version]
  13. Rönkkö, T.J.; Jalava, P.I.; Happo, M.S.; Kasurinen, S.; Sippula, O.; Leskinen, A.; Koponen, H.; Kuuspalo, K.; Ruusunen, J.; Väisänen, O.; et al. Emissions and atmospheric processes influence the chemical composition and toxicological properties of urban air particulate matter in Nanjing, China. Sci. Total Environ. 2018, 639, 1290–1310. [Google Scholar] [CrossRef]
  14. Allen, J.L.; Oberdorster, G.; Morris-Schaffer, K.; Wong, C.; Klocke, C.; Sobolewski, M.; Conrad, K.; Mayer-Proschel, M.; Cory-Slechta, D.A. Developmental neurotoxicity of inhaled ambient ultrafine particle air pollution: Parallels with neuropathological and behavioral features of autism and other neurodevelopmental disorders. Neurotoxicology 2017, 59, 140–154. [Google Scholar] [CrossRef] [PubMed]
  15. Pieters, N.; Koppen, G.; Van Poppel, M.; de Prins, S.; Cox, B.; Dons, E.; Nelen, V.; Panis, L.I.; Plusquin, M.; Schoeters, G.; et al. Blood Pressure and Same-Day Exposure to Air Pollution at School: Associations with Nano-Sized to Coarse PM in Children. Environ. Health Perspect. 2015, 123, 0737–0742. [Google Scholar] [CrossRef] [PubMed]
  16. Osunsanya, T.; Prescott, G.; Seaton, A. Acute respiratory effects of ultrafine particles: Mass or number? J. Occup. Environ. Med. 2001, 58, 154–159. [Google Scholar] [CrossRef] [PubMed]
  17. Stoeger, T.; Reinhard, C.; Takenaka, S.; Schroeppel, A.; Karg, E.; Ritter, B.; Heyder, J.; Schulz, H. Instillation of six different ultrafine carbon particles indicates a surface area threshold dose for acute lung inflammation in mice. Environ. Health Perspect. 2005, 114, 328–333. [Google Scholar] [CrossRef] [PubMed]
  18. Cassee, F.R.; Héroux, M.E.; Gerlofs-Nijland, M.E.; Kelly, F.J. Particulate matter beyond mass: Recent health evidence on the role of fractions, chemical constituents and sources of emission. Inhal. Toxicol. 2013, 25, 802–812. [Google Scholar] [CrossRef] [PubMed]
  19. Kelly, F.J.; Fussell, J.C. Size, source and chemical composition as determinants of toxicity attributable to ambient particulate matter. Atmos. Environ. 2012, 60, 504–526. [Google Scholar] [CrossRef]
  20. Nethery, E.; Leckie, S.E.; Teschke, K.; Brauer, M. From measures to models: An evaluation of air pollution exposure assessment for epidemiological studies of pregnant women. J. Occup. Environ. Med. 2008, 65, 579–586. [Google Scholar] [CrossRef]
  21. Gerharz, L.E.; Pebesma, E. Using geostatistical simulation to disaggregate air quality model results for individual exposure estimation on GPS tracks. Stoch. Res. Risk Assess. 2013, 27, 223–234. [Google Scholar] [CrossRef]
  22. Löndahl, J.; Massling, A.; Pagels, J.; Swietlicki, E.; Vaclavik, E.; Loft, S. Size-resolved respiratory-tract deposition of fine and ultrafine hydrophobic and hygroscopic aerosol particles during rest and exercise. Inhal. Toxicol. 2007, 19, 109–116. [Google Scholar] [CrossRef] [PubMed]
  23. Hussein, T.; Wierzbicka, A.; Löndahl, J.; Lazaridis, M.; Hänninen, O. Indoor Aerosol Modeling for Assessment of Exposure and Respiratory Tract Deposited Dose. Atmos. Environ. 2015, 106, 402–411. [Google Scholar] [CrossRef]
  24. Ferron, G.A.; Gebhart, J. Estimation of the lung deposition of aerosol particles produced with medical nebulizers. J. Aerosol Sci. 1988, 19, 1083–1086. [Google Scholar] [CrossRef]
  25. Choi, H.S.; Ashitate, Y.; Lee, J.H.; Kin, S.H.; Matsui, A.; Insin, N.; Bawendi, M.G.; Semmler-Behnke, M.; Frangioni, J.V.; Tsuda, A. Rapid translocation of nanoparticles from the lung airspaces to the body. Nat. Biotechnol. 2010, 28, 1300–1303. [Google Scholar] [CrossRef] [PubMed] [Green Version]
  26. Stone, V.; Miller, M.R.; Clift, M.J.D.; Elder, A.; Mills, N.L.; Møller, P.; Schins, R.P.F.; Vogel, U.; Kreyling, W.G.; Alstrup Jensen, K.; et al. Nanomaterials Versus Ambient Ultrafine Particles: An Opportunity to Exchange Toxicology Knowledge. Environ. Health Perspect. 2017, 125, 106002. [Google Scholar] [CrossRef] [PubMed]
  27. Daigle, C.C.; Chalupa, D.C.; Gibb, F.R.; Morrow, P.E.; Oberdörster, G.; Utell, M.J.; Frampton, M.W. Ultrafine Particle Deposition in Humans During Rest and Exercise. Inhal. Toxicol. 2003, 15, 539–552. [Google Scholar] [CrossRef] [PubMed]
  28. ICRP. Annals of the International Commission on Radiological Protection ICRP Publication 66: Human Respiratory Tract Model for Radiological Protection; International Commission on Radiological Protection: Ottawa, ON, Canada, 1994; Pergamon 1994. [Google Scholar]
  29. Anjilvel, S.; Asgharian, B. A multiple-path model of particle deposition in the rat lung. Fundam. Appl. Toxicol. 1995, 28, 41–50. [Google Scholar] [CrossRef]
  30. Löndahl, J.; Swietlicki, E.; Rissler, J.; Bengtsson, A.; Boman, C.; Blomberg, A.; Sandström, T. Experimental determination of the respiratory tract deposition of diesel combustion particles in patients with chronic obstructive pulmonary disease. Part. Fibre Toxicol. 2012, 9, 1–8. [Google Scholar] [CrossRef]
  31. Chalupa, D.C.; Morrow, P.E.; Oberdörster, G.; Utell, M.J.; Frampton, M.W. Ultrafine Particle Deposition in Subjects with Asthma. Environ. Health Perspect. 2004, 112, 879–882. [Google Scholar] [CrossRef]
  32. Anderson, P.J.; Wilson, J.D.; Hiller, F.C. Respiratory tract deposition of ultrafine particles disease in subjects with obstructive or restrictive lung. Chest 1990, 97, 1115–1120. [Google Scholar] [CrossRef]
  33. Zeman, W.D.B.K.L. Deposition of fine particles in children spontaneously breathing at rest. Inhal. Toxicol. 1998, 10, 831–842. [Google Scholar]
  34. Rissler, J.; Gudmundsson, A.; Nicklasson, H.; Swietlicki, E.; Wollmer, P.; Löndahl, J. Deposition efficiency of inhaled particles (15–5000 nm) related to breathing pattern and lung function: An experimental study in healthy children and adults. Part. Fibre Toxicol. 2017, 14, 10. [Google Scholar] [CrossRef] [PubMed]
  35. Löndahl, J.; Massling, A.; Swietlicki, E.; Bräuner, E.V.; Ketzel, M.; Pagels, J.; Loft, S. Experimentally determined human respiratory tract deposition of airborne particles at a busy street. Environ. Sci. Technol. 2009, 43, 4659–4664. [Google Scholar] [CrossRef] [PubMed]
  36. Oberdörster, G.; Oberdörster, E.; Oberdörster, J. Nanotoxicology: An emerging discipline evolving from studies of ultrafine particles. Environ. Health Perspect. 2005, 113, 823–839. [Google Scholar] [CrossRef] [PubMed]
  37. Stoeger, T.; Schmid, O.; Takenaka, S.; Schulz, H. Inflammatory response to TiO2 and carbonaceous particles scales best with BET surface area. Environ. Health Perspect. 2007, 115, A290–A291. [Google Scholar] [CrossRef] [PubMed]
  38. Stoeger, T.; Takenaka, S.; Frankenberger, B.; Ritter, B.; Karg, E.; Maier, K.; Schulz, H.; Schmid, O. Deducing in vivo toxicity of combustion-derived nanoparticles from a cell-free oxidative potency assay and metabolic activation of organic compounds. Environ. Health Perspect. 2009, 117, 54–60. [Google Scholar] [CrossRef]
  39. Waters, K.M.; Masiello, L.M.; Zangar, R.C.; Tarasevich, B.J.; Karin, N.J.; Quesenberry, R.D.; Bandyopadhyay, S.; Teeguarden, J.G.; Pounds, J.G.; Thrall, B.D. Macrophage responses to silica nanoparticles are highly conserved across particle sizes. Toxicol. Sci. 2009, 107, 553–569. [Google Scholar] [CrossRef]
  40. Braakhuis, H.M.; Cassee, F.R.; Fokkens, P.H.; De La Fonteyne, L.J.; Oomen, A.G.; Krystek, P.; De Jong, W.H.; Van Loveren, H.; Park, M.V. Identification of the appropriate dosemetric for pulmonary inflammation of silver nanoparticles in an inhalation toxicity study. Nanotoxicology 2016, 10, 63–73. [Google Scholar]
  41. Schmid, O.; Stoeger, T. Surface area is the biologicallymost effective dosemetric for acute nanoparticle toxicity in the lung. J. Aerosol Sci. 2016, 99, 133–143. [Google Scholar] [CrossRef]
  42. Fadeel, B.; Bussy, C.; Merino, S.; Vázquez, E.; Flahaut, E.; Mouchet, F.; Evariste, L.; Gauthier, L.; Koivisto, J.; Vogel, U.; et al. Safety Assessment of Graphene-Based Materials: Focus on Human Health and the Environment. ACS Nano 2018, 12, 10582–10620. [Google Scholar] [CrossRef]
  43. Oberdörster, G.; Sharp, Z.; Atudorei, V.; Elder, A.; Gelein, R.; Kreyling, W.; Cox, C. Translocation of Inhaled Ultrafine Particles to the Brain. Inhal. Toxicol. 2004, 16, 437–445. [Google Scholar] [CrossRef] [PubMed]
  44. Hussein, T.; Löndahl, J.; Paasonen, P.; Koivisto, A.J.; Petäjä, T.; Hämeri, K.; Kulmala, M. Modeling Regional Deposited Dose of Submicron Aerosol Particles. Sci. Total Environ. 2013, 458, 140–149. [Google Scholar] [CrossRef] [PubMed]
  45. Hussein, T.; Boor, B.E.; Dos Santos, V.N.; Kangasluoma, J.; Petäjä, T.; Lihavainen, H. Mobile aerosol measurement in the eastern Mediterranean—A utilization of portable instruments. Aerosol Air Qual. Res. 2017, 17, 1775–1786. [Google Scholar] [CrossRef]
  46. Hussein, T.; Juwhari, H.; AlKuisi, M.; Alkattan, H.; Lahlouh, B.; Al-Hunaiti, A. Accumulation and coarse mode aerosol concentrations and carbonaceous contents in the urban background atmosphere in Amman—Jordan. Arab. J. Geosci. 2018, 11, 617. [Google Scholar] [CrossRef]
  47. Hussein, T.; Halayka, M.; Abu Al-Ruz, R.; Abdullah, H.; Mølgaard, B.; Petäjä, T. Fine particle number concentrations in Amman and Zarqa during spring 2014. Jordan J. Phys. 2016, 9, 31–46. [Google Scholar]
  48. Hussein, T.; Rasha, A.; Tuukka, P.; Heikki, J.; Arafah, D.; Kaarle, H.; Markku, K. Local air pollution versus short–range transported dust episodes: A comparative study for submicron particle number concentration. Aerosol Air Qual. Res. 2011, 11, 109–119. [Google Scholar] [CrossRef]
  49. Hussein, T.; Betar, A. Size fractionated number and mass concentrations in the urban background atmosphere during spring 2014 in Amman—Jordan. Jordan J. Phys. 2017, 10, 51–60. [Google Scholar]
  50. Holmes, J.R. How much Air Do We Breath? California Environmental Protection Agency: Sacramento, CA, USA, 1994; Research Note 94–11.
  51. Hussein, T.; Saleh, S.; dos Santos, V.N.; Abdullah, H.; Boor, B.E. Black Carbon and Particulate Matter Concentrations in Eastern Mediterranean Urban Conditions–An Assessment Based on Integrated Stationary and Mobile Observations. Atmosphere 2019, 10, 323. [Google Scholar] [CrossRef]
  52. Abdeen, Z.; Qasrawi, R.; Heo, J.; Wu, B.; Shpund, J.; Vanger, A.; Sharf, G.; Moise, T.; Brenner, S.; Nassar, K.; et al. Spatial and Temporal Variation in Fine Particulate Matter Mass and Chemical Composition: The Middle East Consortium for Aerosol Research Study. Sci. World J. 2014, 878704, 1–16. [Google Scholar] [CrossRef]
  53. Wu, T.; Boor, B.E. Urban Atmos. Aerosol Size Distributions: A Global Perspective. In Preparation.
  54. Rissler, J.; Nordin, E.Z.; Eriksson, A.C.; Nilsson, P.T.; Frosch, M.; Sporre, M.K.; Wierzbicka, A.; Svenningsson, B.; Löndahl, J.; Messing, M.E.; et al. Effective Density and Mixing State of Aerosol Particles in a Near-Traffic Urban Environment. Environ. Sci. Technol. 2014, 48, 6300–6308. [Google Scholar] [CrossRef]
  55. Lin, Y.; Bahreini, R.; Zimmerman, S.; Fofie, E.A.; Asa-Awuku, A.; Park, K.; Lee, S.-B.; Bae, G.-N.; Jung, H.S. Investigation of ambient aerosol effective density with and without using a catalytic stripper. Atmos. Environ. 2018, 187, 84–92. [Google Scholar] [CrossRef] [Green Version]
  56. Swietlicki, E.; Hansson, H.C.; Hämeri, K.; Svenningsson, B.; Massling, A.; McFiggans, G.; McMurry, P.H.; Petäjä, T.; Tunved, P.; Gysel, M.; et al. Hygroscopic properties of submicrometer atmospheric aerosol particles measured with H–TDMA instruments in various environments—A review. Tellus B 2008, 60, 432–469. [Google Scholar] [CrossRef]
  57. Löndahl, J.; Pagels, J.; Boman, C.; Swietlicki, E.; Massling, A.; Rissler, J.; Blomberg, A.; Bohgard, M.; Sandström, T. Deposition of biomass combustion aerosol particles in the human respiratory tract. Inhal. Toxicol. 2008, 20, 923–933. [Google Scholar] [CrossRef] [PubMed]
Figure 1. Size-resolved deposition fraction (DF) curves inside the respiratory tract of adult subjects: (a) males exercising, (b) males at rest, (c) females exercising, and (d) females at rest. Data was adopted from Löndahl et al. [23] and the ICRP and MPPD models.
Atmosphere 10 00530 g001
Figure 2. Particle number size distributions derived from the measured size fractions (Table S1): (a) rural background—outside the populated areas in the city, (b) urban background—University of Jordan campus and nearby areas, (c) main roads—traffic, and (d) city center—urban.
Atmosphere 10 00530 g002
Figure 3. Particle mass size distributions calculated from the measured particle number size distributions (Figure 2): (a) rural background—outside the populated areas in the city, (b) urban background—University of Jordan campus and nearby areas, (c) main roads—traffic, and (d) city center—urban. The black curves were determined by assuming spherical particles of unit density, whereas the red curves were based on effective densities in urban background conditions in Asian cities according to a review by Wu and Boor [53], (Table 2).
Atmosphere 10 00530 g003
Figure 4. The rural background site; regional inhaled deposited dose rates calculated for different activities and genders: (a) submicron particle number concentration and (b,c) particulate matter PM2.5 and PM10. The color legend is: (blue) head airways, (red) tracheobronchial, and (green) alveolar.
Atmosphere 10 00530 g004
Figure 5. University of Jordan campus; regional inhaled deposited dose rates calculated for different activities and genders: (a) submicron particle number concentration and (b,c) particulate matter PM2.5 and PM10. The color legend is: (blue) head airways, (red) tracheobronchial, and (green) alveolar.
Atmosphere 10 00530 g005
Figure 6. Main roads of Amman; regional inhaled deposited dose rates calculated for different activities and genders: (a) submicron particle number concentration and (b,c) particulate matter PM2.5 and PM10. The color legend is: (blue) head airways, (red) tracheobronchial, and (green) alveolar.
Atmosphere 10 00530 g006
Figure 7. Amman city center; regional inhaled deposited dose rates calculated for different activities and genders: (a) submicron particle number concentration and (b,c) particulate matter PM2.5 and PM10. The color legend is: (blue) head airways, (red) tracheobronchial, and (green) alveolar.
Atmosphere 10 00530 g007
Table 1. Minute ventilation (volume of air breathed), VE [m3/h], for adult subjects according to Holmes [50]. The last column indicates the deposition fraction curve used for that activity (Figure 1).
ActivityFemalesMalesDF Curve Type
Yard work1.081.74Exercise
Running (8.0 km/h)3.033.48Exercise
Walking (4.0 km/h)1.201.38Exercise
Driving car0.510.66at rest
Riding in car0.480.60at rest
Standing0.480.66at rest
Sitting0.420.54at rest
Table 2. Urban aerosol effective densities for Asian cities according to review by Wu and Boor [53].
Range of Dp [µm]0.01–0.0250.025–0.30.3–0.50.5–11–2.52.5–55–10
Eff ρp [kg/m3]1400140016501750165015001500
Table 3. Exposure scenarios description.
ScenarioOccupation or Social StatusGenderActivity (s)Location (s)Short Description
In-vehicleTaxi DriverMaleDrivingRoads Downtown Urban BackgroundUrban inhabitants might spend long periods in transit and transportation; this can take several hours per day, especially when traffic congestion is very common in some cities
Urban inhabitant TouristMale FemaleRiding
Police OfficerMale FemaleDriving RidingRoads Downtown Urban BackgroundSome police officers in Amman spend a long time in-vehicle as traffic surveillance
On roadUrban inhabitant TouristMale FemaleStanding WalkingRoads DowntownGather at nearby attraction sites in different places
Police OfficerMale FemaleStanding WalkingRoads Downtown Urban BackgroundSome police officers in Amman spend a long time on road trying to traffic in order and reduce on road congestion
Service WorkerMale(eq.) Yard WorkWaste service workers and road construction spend most of their working time on road
University StudentMale FemaleStanding Walking RunningUrban BackgroundUniversity students spend most of their daytime either on campus or in its surrounding
Outdoor SportsMale FemaleRunningAnywhere in the citySome people enjoy outdoor sports such jogging, walking, biking, etc.

