Article

The Relationship Between Air Pollution and All-Cause Mortality in Singapore

1
SingHealth Duke-NUS Emergency Medicine Academic Clinical Programme, Singapore 169857, Singapore
2
Signature Research Programme in Cardiovascular & Metabolic Disorders, Duke-National University of Singapore Medical School, Singapore 169857, Singapore
3
National Registry of Diseases Office, Health Promotion Board, Singapore 169937, Singapore
4
Science and Math Cluster, Singapore University of Technology and Design, Singapore 487372, Singapore
5
Department of Infectious Diseases, Singapore General Hospital, Singapore 169857, Singapore
6
Health Services and Systems Research, Duke-NUS Medical School, Singapore 169857, Singapore
7
Singapore University of Technology and Design, Singapore 487372, Singapore
8
School of Public Health, Faculty of Medicine and Health, The University of Sydney, Sydney 2006, Australia
9
Department of Epidemiology and Preventive Medicine, School of Public Health and Preventive Medicine, Monash University, Melbourne, VIC 3800, Australia
10
Division of Neurology, Department of Medicine, National University Health System, Singapore 169857, Singapore
11
Emergency Medicine Department, Tan Tock Seng Hospital, Singapore 169857, Singapore
12
National Registry of Diseases Office, Health Promotion Board, Singapore 169857, Singapore
13
Department of Emergency Medicine, Singapore General Hospital, Singapore 169857, Singapore
*
Author to whom correspondence should be addressed.
Joint first author.
Submission received: 11 October 2019 / Revised: 25 November 2019 / Accepted: 5 December 2019 / Published: 20 December 2019
(This article belongs to the Special Issue Bioaerosol Exposure and Risk Assessment)

Abstract

:
Ambient air pollution is a risk factor for both acute and chronic diseases and poses serious health threats to the world population. We aim to study the relationship between air pollution and all-cause mortality in the context of a city-state exposed to the Southeast Asian haze problem. The primary exposure was ambient air pollution, as measured by the Pollutants Standards Index (PSI). The outcome of interest was all-cause mortality from 2010–2015. A time-stratified case-crossover design was performed. A conditional Poisson regression model, including environmental variables such as PSI, temperature, wind speed, and rainfall, was fitted to the daily count of deaths to estimate the incidence rate ratio (IRR) of mortality per unit increase in PSI, accounting for overdispersion and autocorrelation. To account for intermediate exposure effects (maximum lag of 10 days), a distributed lag non-linear model was used. There were 105,504 deaths during the study period. Increment in PSI was significantly associated with an increased risk of mortality. The adjusted IRR of mortality per the 10-unit increase in PSI was 1.01 (95%CI = 1.00–1.01). The lag effect was stronger when PSI was in the unhealthy range compared to the good and moderate ranges. At lag = 7 days, PSI appeared to have an adverse effect on mortality, although the effect was not significant. These findings provide evidence on the general health hazard of exposure to air pollution and can potentially guide public health policies in the region.

1. Introduction

Ambient air pollution, as a risk factor for both acute and chronic diseases such as lung cancer, heart diseases, and acute respiratory infections, poses serious health threats to the world population [1]. It is well established that both long-term [2] and short-term [3,4,5] exposure to ambient air pollution impact mortality, in particular cardiovascular and respiratory mortality. Although the deleterious effects of air pollution have been demonstrated in many Western countries [6,7,8], there are fewer comparable studies conducted in Asia [9,10,11,12,13,14]. Meanwhile, air quality remains a major problem in Asian cities, with effects on cardiovascular and respiratory mortality noted in time-series data [9,15,16], along with significant public health implications [17].
Seasonal exposure to transboundary haze is a major environmental health problem in Singapore, a heavily urbanized South-east Asian city-state [18,19]. The Meteorological Service Singapore (MSS), which operates under the National Environment Agency (NEA), has established a robust system of monitoring stations across the city-state to provide round-the-clock surveillance of air quality. This surveillance capability creates opportunities for researchers to investigate the health effects associated with air pollution. The haze problem in Singapore generally coincides with the dry season from July to September, when the southwest monsoon shifts the haze resulting from forest fires caused by fire-fallow cultivation in neighboring countries toward Singapore [20]. During periods of haze exposure, there is increased atmospheric loading of particulate matter and other aerosolized pollutants [21]. Previous studies in Singapore suggest that during periods of haze, outpatient attendances for haze-related conditions such as respiratory tract illness rise [22,23] and inpatient admissions increase [24]. Time-series studies have demonstrated an association between haze exposure and acute ischemic stroke [25], acute myocardial infarction [19] as well as cardiac arrest [11]. Studies in similar urbanized Asian settings have demonstrated associations between particulate matter air pollution and short-term mortality [15,26]. We were, thus interested in investigating the association between short-term mortality (within 10 days of exposure) and ambient air pollution in our local context.

2. Materials and Methods

2.1. Setting

Singapore is a Southeast Asian city-state with a tropical climate and a multi-ethnic population of 5.6 million people over 722 square kilometers [27]. It has a tropical rainforest climate [28] with stable temperature and pressure, high humidity and rainfall, and an absence of seasonality [28,29]. In this study, we examined the association of air pollution and all-cause mortality during the six-year period of 2010 to 2015 (inclusive).

2.2. Southeast Asian (SEA) Transboundary Haze Situation

Haze pollution has been a recurrent issue in the Southeast Asian region. One of the earliest records of transboundary haze occurred in 1982, and this phenomenon has since been an annual occurrence in the region [30]. The intensity of the haze varies from year to year, and at its worst, it can affect the populations of six neighboring Southeast Asian countries [31]. The haze has been attributed to forest fires due to fire-fallow cultivation practices in the region [31,32].

2.3. Exposure Variables

The primary exposure variable was the daily average Pollutant Standard Index (PSI), which reflects the concentration of pollutants in the air. Pollutant levels are continuously monitored at 22 telemetric air quality monitoring stations across the island. PSI is computed based on six air pollutants: fine particulate matter with a width smaller than 2.5 μm (PM2.5), particulate matter with a width smaller than 10 μm (PM10), sulfur dioxide (SO2), carbon monoxide (CO), ozone (O3) and nitrogen dioxide (NO2). A sub-index is computed for each pollutant based on a piecewise linear function mapping ambient concentrations onto a 0–500 scale; the largest sub-index value is then used to compute the PSI [33]. PSI was based on a scale devised by the United States Environmental Protection Agency to provide a way for news agencies to report daily air quality. PSI has been used in several countries including the United States, Brunei Darussalam, and Singapore. In Singapore, the NEA categorizes 24-h PSI into good (0–50), moderate (51–100), unhealthy (101–200), very unhealthy (201–300), and hazardous (>300) ranges. The confounding variables in this study were daily average temperature, daily average wind speed, and daily total rainfall. Historical 24-h PSI data and other environmental data were extracted (in November 2017) from governmental websites—www.haze.gov.sg and www.weather.gov.sg, respectively, using an application programming interface (API) script and formatted specifically for this study.

2.4. Outcome Variable

As air pollution is linked to a range of acute and chronic diseases [9,15,16], all-cause rather than cause-specific mortality was selected to be the outcome of interest in this study. Mortality data were obtained from the Ministry of Home Affairs’ Registry of Birth and Death through the National Registry of Diseases Office (NRDO). The Registration of Births and Deaths Act mandates that all deaths are to be registered within 24 h of occurrence [34]. Certification of cause of death follows the International Classification of Diseases 9th and 10th Revision codes and is performed by medical practitioners [35].

2.5. Ethics Approval

The SingHealth Centralised Institutional Review Board and the Domain Specific Review Board granted approval for this study with a waiver of patient consent (CIRB reference number: 2017/2380).

2.6. Statistical Analysis

A time-stratified case-crossover approach was used to examine the association between all-cause mortality and PSI. For every death occurring on a day with at least one death, the day of death was considered as a “case” and its “controls” were derived using the same day-of-week in the same month and year [36]. Conditional Poisson regression was used to compare the incidence rate ratio (IRR) of mortality across NEA’s recommended range of PSI (good, moderate, and unhealthy, with cut-offs previously stated), accounting for over-dispersion and autocorrelation. Daily average temperature, daily average wind speed, and daily total rainfall were included in the multivariable Poisson models. Conditional Poisson regression was also used to estimate the IRR of mortality per 10 unit increase in PSI across the PSI ranges.
To account for intermediate exposure effects, a distributed lag non-linear model (generalized linear model with quasi-Poisson family) was used [37]. The model comprises the following components: natural cubic splines with 5 degrees of freedom (df) at equal intervals for daily average PSI; natural cubic splines with 7 df per year to describe the long-term time trends, and indicator variables to represent the day of the week. The effect of PSI was assessed through the choice of two bases to describe the relationship in the space of PSI and lags. The knots were placed at equal intervals in the range of PSI and at equal intervals in the logarithmic scale of lags to allow more flexibility in the first part of the distributed lag curve where more variability is expected [38,39]. The maximum lag was set to 10 days. The number of knots, which defines the df in each dimension, was fixed at five on the grounds of parsimony; studies have shown that the bias in estimates for natural splines does not drop dramatically with each increment of df from five onwards [40]. Data analyses were done using the Stata SE Version 13 and R Version 3.0.2. Statistical significance was set at <0.05.

3. Results

3.1. Study Population

A total of 105,504 deaths was observed during the study period. Over the study period, 16,437 deaths were reported in 2010, 16,850 deaths in 2011, 17,231 deaths in 2012, 17,783 deaths in 2013, 18,243 deaths in 2014 and 18,960 deaths in 2015. Figure 1 shows the time trend of PSI over the years [41,42,43]. The median daily average PSI in each quarter of each year of the study period, as well as the proportions of days with daily average PSI in the good/moderate/unhealthy range, are shown in Figure 1. The PSI level was higher in 2014 and 2015 than earlier years.

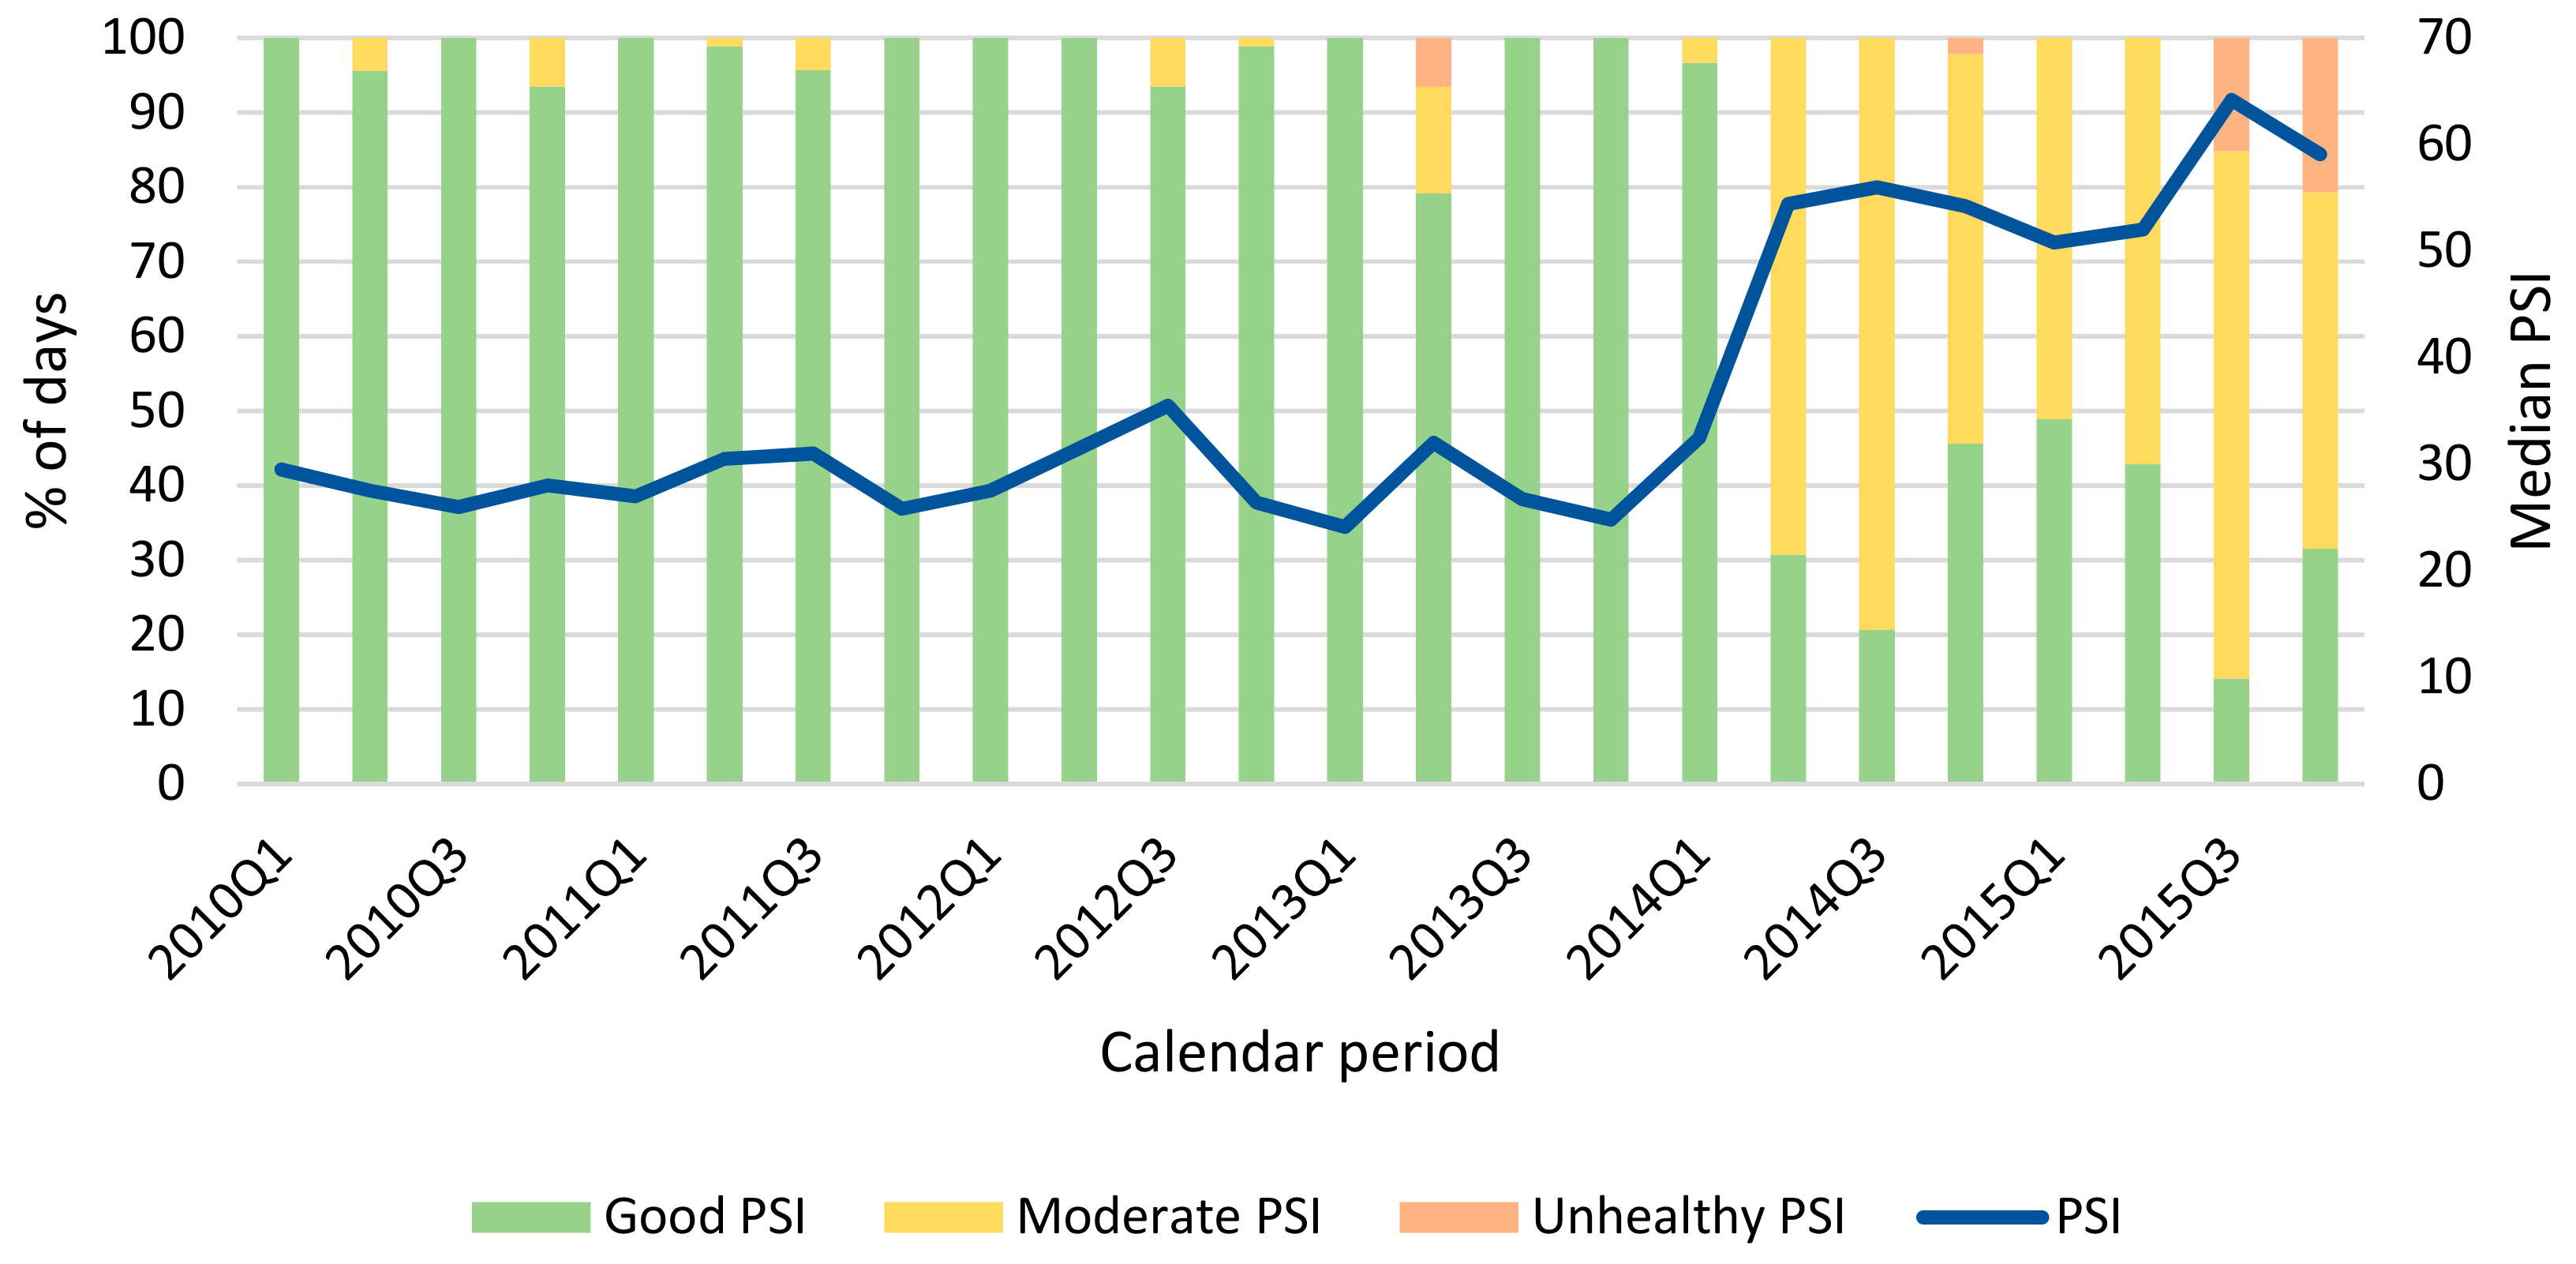
3.2. Description of Environmental Variables

During the study period, the median of daily average PSI was 32.8 with interquartile range (IQR) 25.7–47.0 (Table 1). Comparing the days with PSI in the good, moderate and unhealthy ranges, temperature (p < 0.001) and wind speed (p = 0.020) tended to be higher in the moderate and unhealthy PSI ranges, while rainfall (p < 0.001) tended to be higher in the good PSI range.

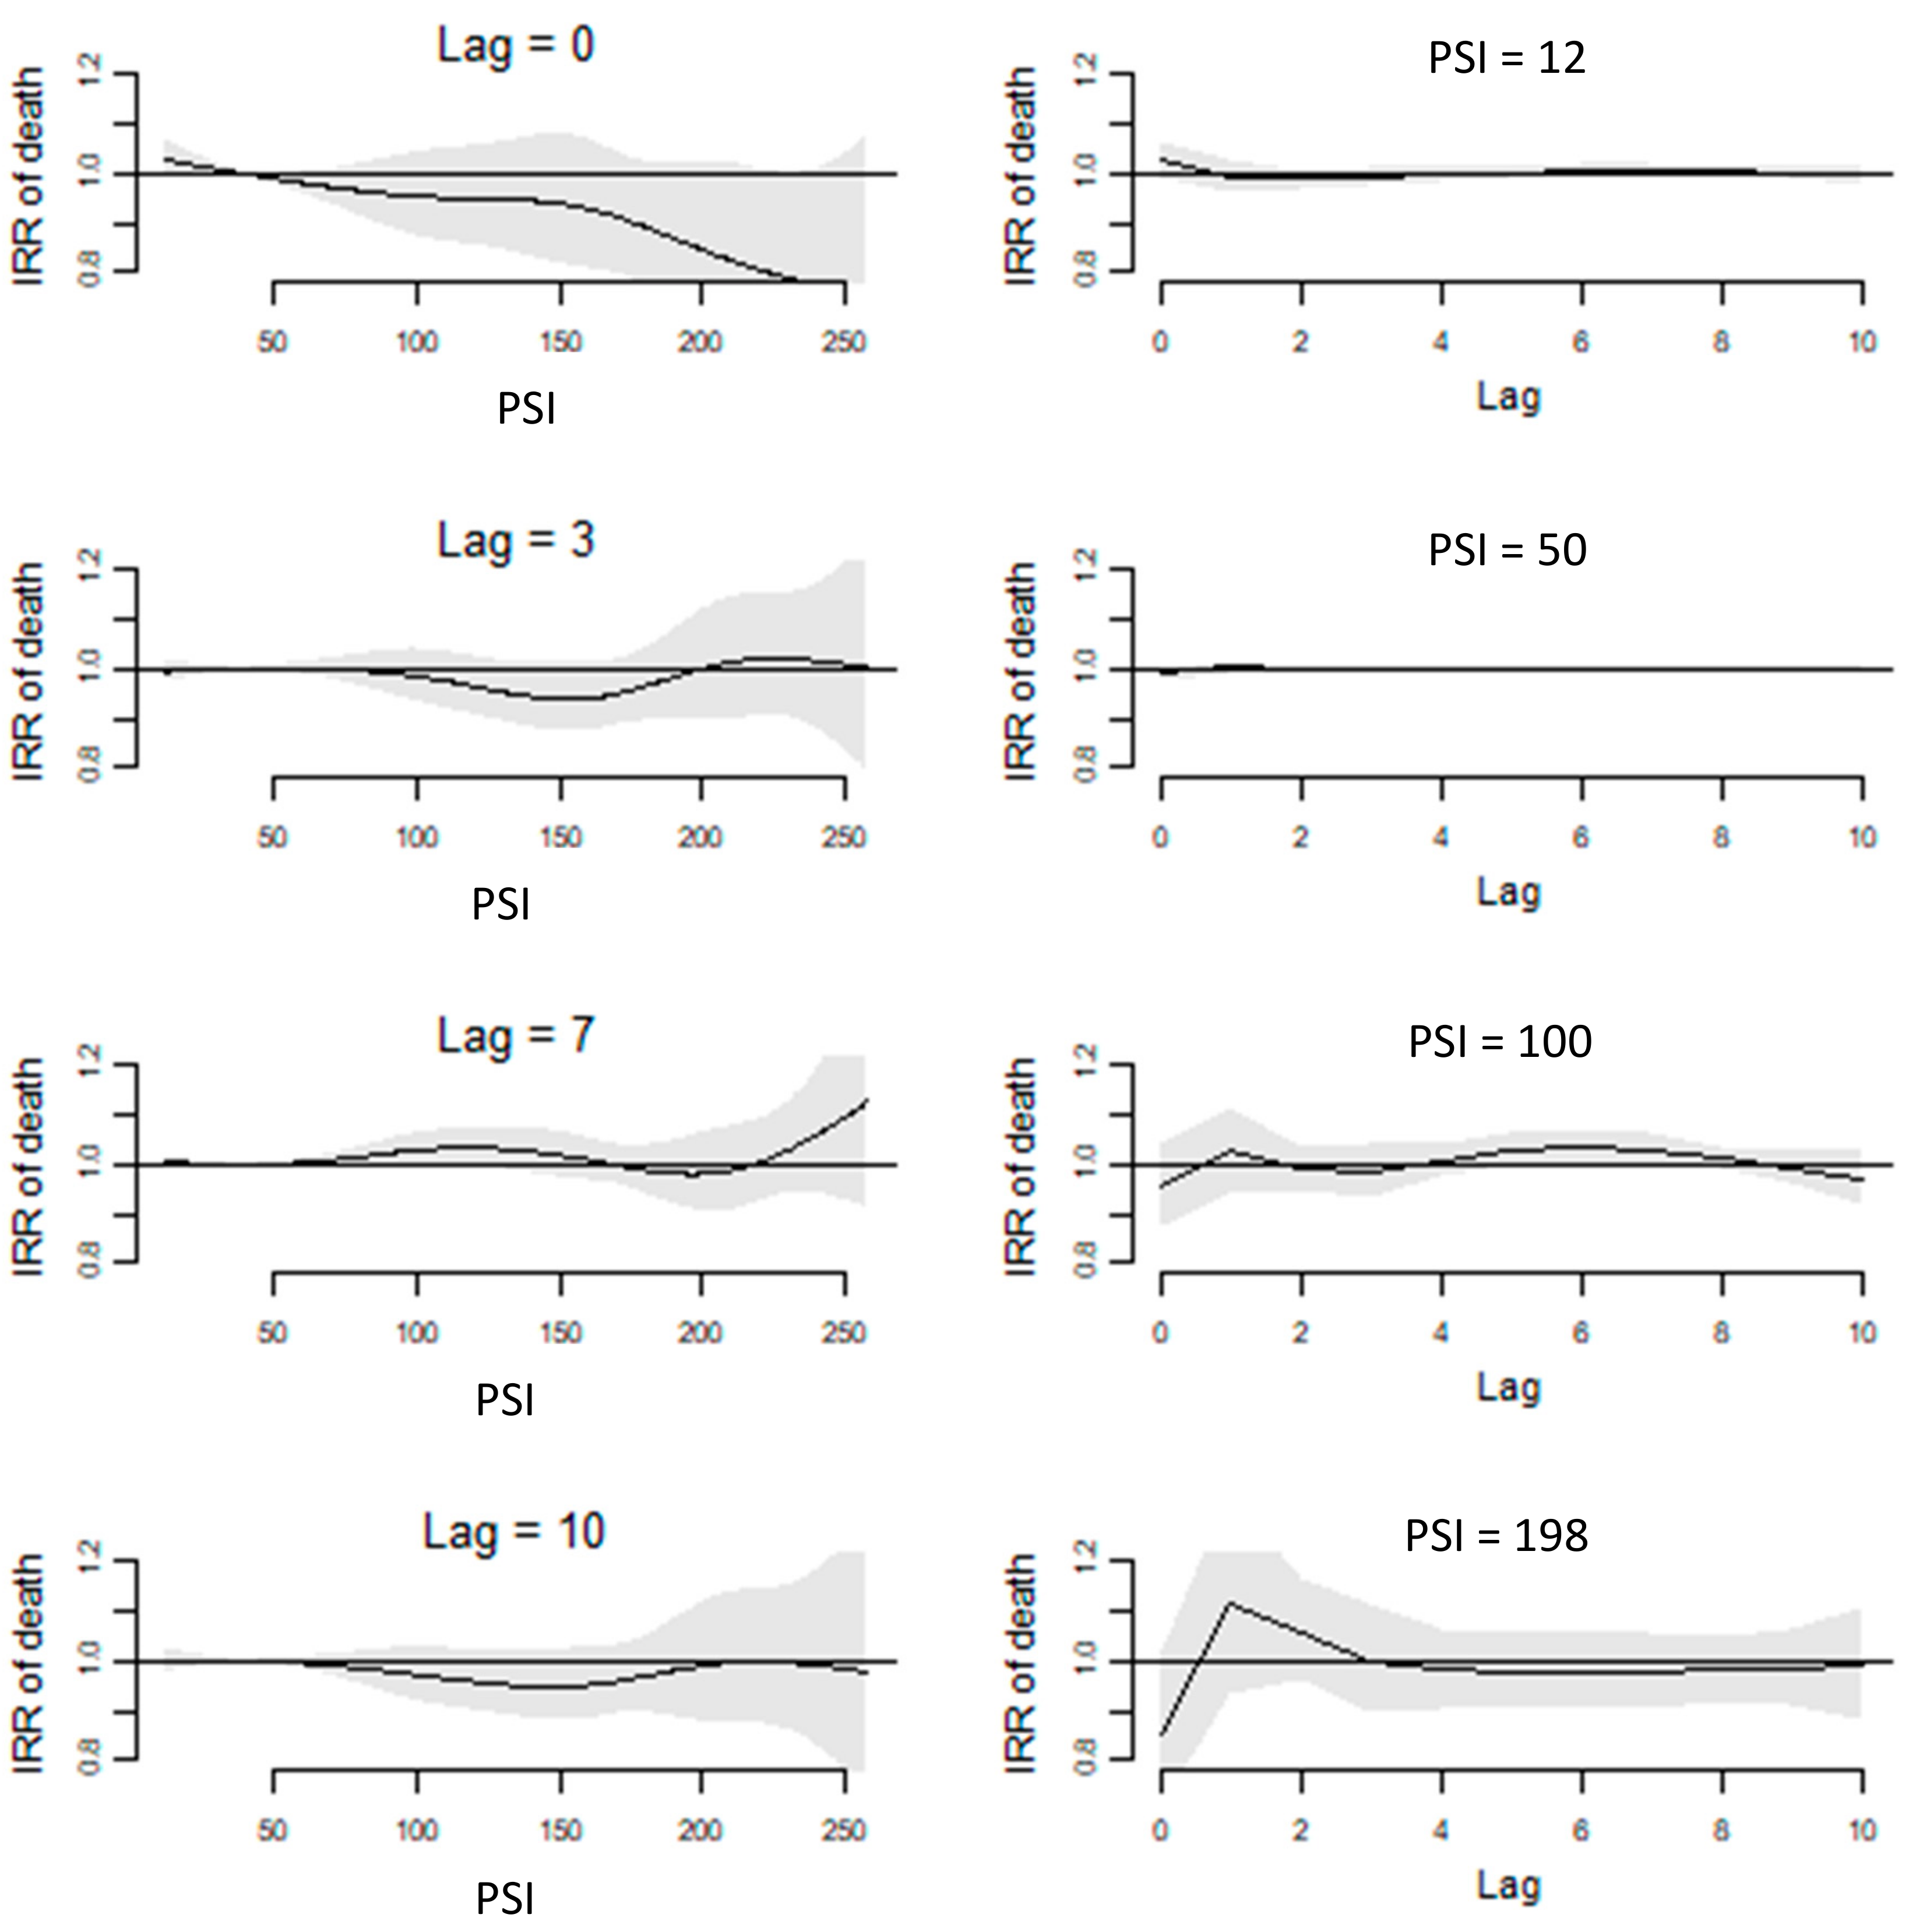
3.3. Short-Term Effects of PSI on Mortality

Compared to good PSI range, moderate (IRR 1.05, 95% CI 1.03–1.07) and unhealthy ranges (IRR 1.08, 95% CI 1.03–1.14) of PSI were associated with a higher risk of mortality (Table 2). Increment in PSI was significantly associated with an increased risk of mortality. The adjusted IRR of mortality per 10-unit increase in PSI was 1.01, with a 95% confidence interval (CI) 1.00–1.01. After stratifying by PSI ranges, the increased risk of mortality for each 10-unit increment of PSI (IRR 1.01, 95% CI 1.00–1.02) remained in the good PSI range but did not have any association in the moderate and unhealthy PSI ranges.

3.4. Intermediate-Term Effects of PSI on Mortality

Figure 2 shows the IRR of mortality by PSI at specific lag 0, 3, 7 and 10 and by lag at specific PSI corresponding to approximately (rounded up to the nearest integer) the 5th (PSI = 12) and 95th (PSI = 198) percentile of the PSI distribution, cut-off between the good and moderate PSI ranges (PSI = 50), and cut-off between the moderate and unhealthy PSI ranges (PSI = 100). The plots of IRR by PSI at specific lag indicated that at lag 7, the IRR of mortality spiked in the very unhealthy range compared to good, moderate, and unhealthy ranges; the association was, however, not significant.

4. Discussion

In this study, we examined the effect of air pollution on mortality in Singapore and demonstrated a significant association between an increase in PSI and mortality. In the short-term (lag = 7 days), PSI in the very unhealthy range appeared to have an adverse effect on mortality, although the effect was not statistically significant. In the longer term (lag >7 days), PSI in the unhealthy range similarly did not appear to have an effect on mortality. This could be attributed to the harvesting effect whereby PSI affected mainly a pool of frail individuals, and the depletion of this pool led to the reduction of potential deaths a few days later, thereby reducing the impact from PSI temporarily [44,45]. On the other hand, the trend towards a reduced IRR at lag = 10 days, rather than a clear protective effect, is only suggestive but not conclusive of harvesting as an explanation. Reactive organizational-level protection measures, such as increased utilization of air filtration devices and more stringent limits on outdoor exposure for employed personnel, may also require time to take effect.
This is, to our knowledge, the first study linking the Southeast Asian haze to mortality in Singapore. While other studies in the region have documented increased morbidity associated with transboundary haze episodes, particularly for cardiovascular and respiratory morbidity, studies focusing on mortality are lacking [46]. One study in neighboring Malaysia [47] also demonstrated adverse associations between all-cause mortality and respiratory-specific mortality, and air pollution encountered during transboundary haze episodes. However, their study did not demonstrate a harvesting effect, perhaps because of the shorter lag times (up to seven days) studied [47].
Our findings of a significant association between air pollution and mortality mostly corroborated the findings of other studies which used different measures of air quality and research designs, conducted in Australia [48,49], Europe [50], and Asia [14]. Interestingly, Yin and colleagues [14] found the highest risk of mortality when the lag was 0 compared to longer lags (up to six days), with no association between air pollution and mortality when lags were > 2 days. This is in contrast to our finding of the higher risk of mortality at lag 7 when PSI was in the very unhealthy range, although the association was similarly not significant.
The association between air pollution and mortality found in our study could possibly be attributed to an intermix of upper and lower respiratory tract infection and inflammation, allergic and hyperimmune reactions, oncologic implications, cardiovascular diseases, and distributed complications throughout the body, as mechanisms contributing to the degradation of health. In our previous studies, we similarly found an elevated risk of stroke [25], acute myocardial infarction [19], and out-of-hospital cardiac arrest [11] after exposure to unhealthy PSI ranges. Notably, airborne particulates are classified as Group 1 carcinogens by the WHO (World Health Organization) and IARC (International Agency for Research on Cancer), due to their ability to penetrate deep into the lungs and bloodstreams unfiltered; while the PM10 and PM2.5 particulates encompassed within the PSI metric are medically dangerous as thoracic and respirable particles, their presence might reasonably be correlated with submicron particles of even greater penetration. While the current study aims to investigate all-cause mortality as a way of providing highly general statistics between airborne pollution and population health, greater specific insights into the roles of these individual potential causes may be gained via a future cause-specific study.

4.1. Study Strengths

The strengths of the present study include high-quality death count data obtained from a national registry, which lends confidence in the complete data capture. Also, exposure data was directly measured by meteorological stations spread across the studied city-state of Singapore (and not obtained via modeling). Additionally, the conditional Poisson regression model used in this study accounted for overdispersion and autocorrelation in the time-dependent count’s data [36], hence suppressing regression inaccuracies [51] and the distributed lag non-linear model accounted for longer-term lag of up to 10 days.

4.2. Future Work

In this ecological study, we have demonstrated an association between PSI and mortality; however, it does not prove a causative relationship. Furthermore, as characteristic of data from death registries, there was no patient-level data available for subgroup analyses to identify susceptible subpopulations. A future cause-specific study with patient-level data can provide greater insights into susceptible subpopulations and the roles of individual potential causes of mortality.
As data of individual pollutant concentrations were not available, this limits the ability to relate the risk of mortality with each pollutant. However, the use of PSI is more pragmatic for the purpose of interpretation, informing policies and formulating public health messages as our results have shown.

5. Conclusions

In this study, we have demonstrated an association between exposure to elevated PSI levels and an increased short-term risk of mortality in Singapore. Air pollution is a tremendous public health issue, and our study has incorporated the Singapore context into the existing and growing body of evidence on the effect of air pollution on health [12,22,52,53,54,55,56].

Author Contributions

Conceptualization—K.H.C., A.F.W.H., and M.E.H.O.; supervision—K.H.C., M.E.H.O. A.F.W.H., H.Z., K.H.C., W.L.E., P.P.P., X.Z., G.G.M., A.E., B.Y.Q.T., Y.Y.N., L.L.F. and M.E.H.O. carried out the research, analyzed the results, and wrote the manuscript. All authors gave final approval for publication. All authors have read and agreed to the published version of the manuscript.

Funding

This study was supported by the Singapore University of Technology and Design (SUTD) Start-up Research Grant (SRG SCI 2019 142).

Conflicts of Interest

The authors declare no conflicts of interest. The funder had no role in the design of the study; in the collection, analyses, or interpretation of data; in the writing of the manuscript; or in the decision to publish the results.

References

  1. Brauer, M. Air pollution, stroke and anxiety. BMJ 2015, 350, h1510. [Google Scholar] [CrossRef] [PubMed]
  2. Brunekreef, B.; Beelen, R.; Hoek, G.; Schouten, L.; Bausch-Goldbohm, S.; Fischer, P.; Armstrong, B.; Hughes, E.; Jerrett, M. Effects of long-term exposure to traffic-related air pollution on respiratory and cardiovascular mortality in the Netherlands: The NLCS-AIR study. Res. Rep. Health Eff. Inst. 2009, 139, 5–71. [Google Scholar]
  3. Achilleos, S.; Kioumourtzoglou, M.; Wu, C.; Schwartz, J.; Koutrakis, P.; Papatheodorou, S. Acute effects of fine particulate matter constituents on mortality: A systematic review and meta-regression analysis. Environ. Int. 2017, 109, 89–100. [Google Scholar] [CrossRef] [PubMed]
  4. Fajersztajn, L.; Saldiva, P.; Pereira, L.; Leite, V.; Buehler, A. Short-term effects of fine particulate matter pollution on daily health events in Latin America: A systematic review and meta-analysis. Int. J. Public Health 2017, 62, 729–738. [Google Scholar] [CrossRef] [PubMed]
  5. Atkinson, R.; Mills, I.; Walton, H.; Anderson, H. Fine particle components and health--a systematic review and meta-analysis of epidemiological time series studies of daily mortality and hospital admissions. J. Expo. Sci. Environ. Epidemiol. 2015, 25, 208–214. [Google Scholar] [CrossRef] [PubMed] [Green Version]
  6. Beelen, R.; Stafoggia, M.; Andersen, Z.J.; Weinmayr, G.; Hoffmann, B.; Wolf, K.; Samoli, E.; Fischer, P.; Nieuwenhuijsen, M.; Vineis, P.; et al. Effects of long-term exposure to air pollution on natural-cause mortality: An analysis of 22 European cohorts within the multicentre ESCAPE project. Lancet 2014, 383, 785–795. [Google Scholar] [CrossRef]
  7. Di, Q.; Zanobetti, A.; Wang, Y.; Koutrakis, P.; Choirat, C.; Dominici, F.; Schwartz, J.D. Air Pollution and Mortality in the Medicare Population. N. Engl. J. Med. 2017, 376, 2513–2522. [Google Scholar] [CrossRef]
  8. Wichmann, J.; Torp-Pedersen, C.; Lippert, F.; Ketzel, M.; Ellermann, T.; Loft, S. Out-of-Hospital Cardiac Arrests and Outdoor Air Pollution Exposure in Copenhagen, Denmark. PLoS ONE 2013, 8, e53684. [Google Scholar] [CrossRef] [Green Version]
  9. Wong, C.; Vichit-Vadakan, N.; Vajanapoom, N.; Ostro, B.; Thach, T.; Chau, P.; Chan, E.K.; Chungn, R.Y.; Ou, C.Q.; Yang, L.; et al. Part 5. Public health and air pollution in Asia (PAPA): A combined analysis of four studies of air pollution and mortality. Res. Rep. Health Eff. Inst. 2010, 154, 377–418. [Google Scholar]
  10. Chen, C.C.; Yang, C.Y. Association between Fine Particulate Air Pollution and Daily Clinic Visits for Migraine in a Subtropical City: Taipei, Taiwan. Int. J. Environ. Res. Public Health 2015, 12, 4697–4708. [Google Scholar] [CrossRef] [Green Version]
  11. Ho, A.; Wah, W.; Earnest, A.; Ng, Y.; Xie, Z.; Shahidah, N.; Yap, S.; Pek, P.P.; Liu, N.; Lam, S.S.W.; et al. Health impacts of the Southeast Asian haze problem—A time-stratified case crossover study of the relationship between ambient air pollution and sudden cardiac deaths in Singapore. Int. J. Cardiol. 2018, 271, 352–358. [Google Scholar] [CrossRef] [PubMed]
  12. Tan, B.Y.; Leow, A.S.; Ngiam, N.J.; Ng, B.S.; Sharma, M.; Yeo, L.L.; Seow, P.A.; Hong, C.S.; Chee, Y.H.; Chen, J.; et al. Psychosomatic symptoms during South East Asian haze crisis are related to changes in cerebral hemodynamics. PLoS ONE 2019, 14, e0208724. [Google Scholar] [CrossRef] [PubMed]
  13. Xiang, H.M.; Arena, V.C.; Brink, L.L.; Xu, X.; Bi, Y.; Talbott, E.O. Estimation of Short-Term Effects of Air Pollution on Stroke Hospital Admissions in Wuhan, China. PLoS ONE 2013, 8, e61168. [Google Scholar] [CrossRef] [PubMed] [Green Version]
  14. Yin, P.H.G.; Fan, M.; Chiu, K.Y.; Fan, M.; Liu, C.; Xue, A.; Liu, T.; Pan, Y.; Mu, Q.; Zhou, M. Particulate air pollution and mortality in 38 of China′s largest cities: Time series analysis. BMJ 2017, 356, j1379. [Google Scholar]
  15. Qiu, H.; Pun, V.; Tian, L. Short-term effects of fine and coarse particles on deaths in Hong Kong elderly population: An analysis of mortality displacement. Environ. Pollut. 2018, 241, 148–154. [Google Scholar] [CrossRef]
  16. Wu, R.; Zhong, L.; Huang, X.; Xu, H.; Liu, S.; Feng, B.; Wang, T.; Song, X.; Bai, Y.; Wu, F.; et al. Temporal variations in ambient particulate matter reduction associated short-term mortality risks in Guangzhou, China: A time-series analysis (2006–2016). Sci. Total Environ. 2018, 645, 491–498. [Google Scholar] [CrossRef]
  17. Maji, K.; Arora, M.; Dikshit, A. Burden of disease attributed to ambient PM2.5 and PM10 exposure in 190 cities in China. Environ. Sci. Pollut. Res. Int. 2017, 24, 11559–11572. [Google Scholar] [CrossRef]
  18. Khoo, K. The haze and health: A blog about the fog. Ann. Acad. Med. Singap. 2006, 35, 909–910. [Google Scholar]
  19. Ho, A.F.W.; Zeng, H.; Earnest, A.; Cheong, K.H.; Pek, P.P.; Sia, C.-H.; Jeon, Y.S.; Tan, B.Y.Q.; Liu, N.; Kwan, Y.H.; et al. A time-stratified case crossover study of the association of outdoor ambient air pollution with the risk of acute myocardial infarction in the context of seasonal exposure to the Southeast Asian Haze problem. J. Am. Heart Assoc. 2019, 8, e011272. [Google Scholar] [CrossRef] [Green Version]
  20. Vadrevu, K.; Lasko, K.; Giglio, L.; Justice, C. Analysis of Southeast Asian pollution episode during June 2013 using satellite remote sensing datasets. Environ. Pollut. 2014, 195, 245–256. [Google Scholar] [CrossRef]
  21. Xu, J.; Tai, X.; Betha, R.; He, J.; Balasubramanian, R. Comparison of physical and chemical properties of ambient aerosols during the 2009 haze and non-haze periods in Southeast Asia. Environ. Geochem. Health 2015, 37, 831–841. [Google Scholar] [CrossRef] [PubMed]
  22. Emmanuel, S.C. Impact to lung health of haze from forest fires: The Singapore experience. Respirology 2000, 5, 175–182. [Google Scholar] [CrossRef]
  23. Yeo, B.; Liew, C.; Oon, H. Clinical experience and impact of a community-led volunteer atmospheric haze clinic in Singapore. Southeast Asian J. Trop. Med. Public. Health 2014, 45, 1448–1453. [Google Scholar] [PubMed]
  24. Chew, R.; Andrea, B.; Mohammad, F.; Mohd, T.; Nurashikin, M.; Tidi, H. Annual Southeast Asia haze increases respiratory admissions:A 2-year large single institution experience. Respirology 2018, 23, 914–920. [Google Scholar]
  25. Ho, A.F.; Zheng, H.; De Silva, D.A.; Wah, W.; Earnest, A.; Pang, Y.H.; Xie, Z.; Pek, P.P.; Liu, N.; Ng, Y.Y.; et al. The Relationship Between Ambient Air Pollution and Acute Ischemic Stroke: A Time-Stratified Case-Crossover Study in a City-State With Seasonal Exposure to the Southeast Asian Haze Problem. Ann. Emerg. Med. 2018, 72, 591–601. [Google Scholar] [CrossRef] [PubMed]
  26. Sun, S.; Tian, L.; Cao, W.; Lai, P.; Wong, P.; Lee, R.S.Y.; Mason, T.G.; Krämer, A.; Wong, C.M. Urban climate modified short-term association of air pollution with pneumonia mortality in Hong Kong. Sci. Total. Environ. 2018, 646, 618–624. [Google Scholar] [CrossRef] [PubMed]
  27. Department of Statistics Singopare. Population and Population Structure, Singapore; Government of Singapore: Singapore, 2018. Available online: https://www.singstat.gov.sg/find-data/search-by-theme/population/population-and-population-structure/latest-data (accessed on 15 December 2018).
  28. CIA. CIA World Factbook—East Asia/Southeast Asia; CIA: Singapore, 2018. Available online: https://www.cia.gov/library/publications/the-world-factbook/geos/sn.html (accessed on 9 December 2018).
  29. Ho, A.F.W.; Chew, D.; Wong, T.H.; Ng, Y.Y.; Pek, P.P.; Lim, S.H.; Anantharaman, V.; Hock Ong, M.E. Prehospital Trauma Care in Singapore. Prehosp. Emerg. Care 2015, 19, 409–415. [Google Scholar] [CrossRef] [PubMed]
  30. Suwarsono, R.; Noviar, H.; Albar, I.; Phonekeo, C.; Song, Y. Influence of climate variation and vegetation greenness on fire occurrence: A case study in Central Kalimantan province. In Technology; Indonesian National Institute of Aeronautics and Space and Geoinformatics Center: Jakarta, Indonesia, 2007. [Google Scholar]
  31. Dennis, R.; Mayer, J.; Applegate, G. Fire, people and pixels: Linking social science and remote sensing to understand underlying causes and impacts of fires in Indonesia. Hum. Ecol. 2005, 33, 465–504. [Google Scholar] [CrossRef]
  32. Tan, A. The ‘haze’ crisis in Southeast Asia: Assessing Singapore′s transboundary haze pollution act 2014. NUS Law Work. Pap. Ser. 2015, 2. [Google Scholar] [CrossRef] [Green Version]
  33. The National Environment Agency. Computation of the Pollutant Standards Index (PSI). In Ministry of Environment and Water Resources; Government of Singapore: Singapore, 2015. [Google Scholar]
  34. Registration of Births and Deaths Act (Chapter 267). Available online: https://sso.agc.gov.sg/Act/RBDA1937 (accessed on 15 January 2019).
  35. Ministry of Health, Singapore. Principal Causes of Death. Available online: https://www.moh.gov.sg/resources-statistics/singapore-health-facts/principal-causes-of-death (accessed on 15 January 2019).
  36. Armstrong, B.; Gasparrini, A.; Tobias, A. Conditional Poisson models: A flexible alternative to conditional logistic case cross-over analysis. BMC Med. Res. Methodol. 2014, 14, 122. [Google Scholar] [CrossRef] [Green Version]
  37. Gasparrini, A.; Armstrong, B.; Kenward, M. Distributed lag non-linear models. Stat. Med. 2010, 29, 2224–2234. [Google Scholar] [CrossRef] [PubMed] [Green Version]
  38. Muggeo, V. Modeling temperature effects on mortality: Multiple segmented relationships with common break points. Biostatistics 2008, 9, 613–620. [Google Scholar] [CrossRef] [PubMed] [Green Version]
  39. Peng, R.; Dominici, F. A Bayesian hierarchical distributed lag model for estimating the time course of risk of hospitalization associated with particulate matter air pollution. J. R. Stat. Soc. Ser. A 2009, 58, 3–24. [Google Scholar] [CrossRef]
  40. Peng, R.; Dominici, F.; Louis, T. Model choice in time series studies of air pollution and mortality. J. R. Stat. Soc. Ser. A 2006, 169, 179–203. [Google Scholar] [CrossRef] [Green Version]
  41. National Environment Agency. Historical PSI Readings. Available online: https://www.haze.gov.sg/resources/historical-readings (accessed on 8 August 2019).
  42. Ministry of the Environment and Water Resources Singapore. Public Consultation on Transboundary Haze Pollution Bill; Ministry of the Environment and Water Resources Singapore: Singapore, 2014. [Google Scholar]
  43. Today. PM2.5 Levels Hit 471 as Haze Situation Worsens. Available online: https://www.todayonline.com/world/asia/pm25-levels-hit-471-haze-situation-worsens (accessed on 15 December 2018).
  44. Schwartz, J. Is there harvesting in the association of airborne particles with daily deaths and hospital admissions. Epidemiology 2001, 12, 55–61. [Google Scholar] [CrossRef]
  45. Rabl, A. Air pollution mortality: Harvesting and loss of life expectancy. J. Toxicol. Environ. Health Part A 2005, 68, 1175–1180. [Google Scholar] [CrossRef]
  46. Ramakreshnan, L.; Aghamohammadi, N.; Fong, C.; Bulgiba, A.; Zaki, R.; Wong, L.; Sulaiman, N.M. Haze and health impacts in ASEAN countries: A systematic review. Environ. Sci. Pollut. Res. Int. 2018, 25, 2096–2111. [Google Scholar] [CrossRef]
  47. Sahani, M.; Zainon, N.; Wan Mahiyuddin, W.; Latif, M.; Hod, R.; Khan, M.; Tahir, N.M.; Chan, C.-C. A case-crossover analysis of forest fire haze events and mortality in Malaysia. Atmos. Environ. 2014, 96, 257–265. [Google Scholar] [CrossRef]
  48. Johnston, F.; Henderson, S.; Morgan, G.; Bowman, D. Extreme air pollution events from bushfires and dust storms and their association with mortality in Sydney, Australia 1994–2007. Environ. Res. 2011, 111, 811–816. [Google Scholar] [CrossRef]
  49. Morgan, G.; Corbett, S.; Wlodarczyk, J.; Lewis, P. Air pollution and daily mortality in Sydney, Australia, 1989 through 1993. Am. J. Public Health 1998, 88, 759–764. [Google Scholar] [CrossRef] [Green Version]
  50. Fischer, P.H.; Ameling, C.B.; Hoek, G.; Beelen, R.; de Hoogh, K.; Breugelmans, O.; Kruize, H.; Janssen, N.A.; Houthuijs, D. Air Pollution and Mortality in Seven Million Adults: The Dutch Environmental Longitudinal Study(DUELS). Environ. Health Perspect. 2015, 123, 697–704. [Google Scholar] [CrossRef] [PubMed] [Green Version]
  51. Mohebbi, M.; Wolfe, R.; Forbes, A. Disease Mapping and Regression with Count Data in the Presence of Overdispersion and Spatial Autocorrelation: A Bayesian Model Averaging Approach. Int. J. Environ. Res. Public Health 2014, 11, 883–902. [Google Scholar] [CrossRef] [PubMed]
  52. Andersen, Z.J.; Kristiansen, L.C.; Andersen, K.K.; Olsen, T.S.; Hvidberg, M.; Jensen, S.S.; Ketzel, M.; Loft, S.; Sørensen, M.; Tjønneland, A.; et al. Stroke and long-term exposure to outdoor air pollution from nitrogen dioxide: A cohort study. Stroke 2012, 43, 320–325. [Google Scholar] [CrossRef] [PubMed] [Green Version]
  53. Morgan, G.; Khalaj, B.; Ayyar, A.; Lincoln, D.; Jalaludin, B.; Beard, J.; Corbett, S.; Lumley, T. Effects of bushfire smoke on daily mortality and hospital admissions in Sydney, Australia. Epidemiology 2010, 21, 47–55. [Google Scholar] [CrossRef]
  54. Reid, C.E.; Johnston, F.H.; Jerrett, M.; Balmes, J.R.; Elliott, C.T. Critical Review of Health Impacts of Wildfire Smoke Exposure. Environ. Health Perspect. 2016, 124, 1334–1343. [Google Scholar] [CrossRef] [Green Version]
  55. Nadarajan, G.D.; Tiah, L.; Ho, A.F.W.; Azazh, A.; Castren, M.K.; Chong, S.L.; El Sayed, M.J.; Hara, T.; Leong, B.S.; Lippert, F.K.; et al. Global Resuscitation Alliance Utstein Recommendations for Developing Emergency Care Systems to improve Cardiac Arrest Survival. Resuscitation 2018, 132, 85–89. [Google Scholar] [CrossRef]
  56. Cheong, K.H.; Ngiam, N.J.; Morgan, G.G.; Pek, P.P.; Tan, B.Y.Q.; Lai, J.W.; Koh, J.M.; Ong, M.E.H.; Ho, A.F.W. Acute Health Impacts of the Southeast Asian Transboundary Haze Problem—A Review. Int. J. Environ. Res. Public Health 2019, 16, 3286. [Google Scholar]
Figure 1. Time trend of Pollutant Standards Index (PSI).
Atmosphere 11 00009 g001
Figure 2. Incidence rate ratio (IRR) of mortality by the Pollutant Standard Index (PSI) at specific lags (left) and IRR of the mortality by a lag at specific PSI (right).
Atmosphere 11 00009 g002
Table 1. Characteristics of Pollutant Standards Index (PSI), temperature, wind speed, and rainfall in the study period by PSI ranges specified by the National Environment Agency.
Overall (n = 2191)Good PSI (n = 1721)Moderate PSI (n = 429)Unhealthy PSI (n = 41)p-Value
Daily average PSI, median (IQR)32.829.558.4130.3-
(25.7–47.0)(24.5–36.0)(54.5–65.6)(109.2–150.4)
Daily average temperature in °C, median (IQR)27.927.728.528.9<0.001
(27.0–28.7)(26.9–28.5)(27.8–29.0)(28.4–29.2)
Daily average wind speed in km/h, median (IQR)7.87.78.58.10.020
(6.4–10.5)(6.3–10.3)(6.4–11.1)(6.7–11.0)
Daily total rainfall in mm, median (IQR)0.00.20.00.0<0.001
(0.0–4.0)(0.0–4.8)(0.0–2.2)(0.0–0.2)
Number of days with rain, n (%)1051 (48.0)874 (50.8)166 (38.7)11 (26.8)<0.001
Table 2. Incidence rate ratio (IRR) of mortality associated with each Pollutant Standards Index (PSI) range specified by the National Environment Agency and each 10-unit increment in the daily average PSI within each PSI range.
Risk Associated with Each PSI Range Compared to Good PSIRisk Associated with Each 10-Unit Increase in PSI
Unadjusted IRR (95% CI)Adjusted IRR (95% CI) ^Unadjusted IRR (95% CI)Adjusted IRR (95% CI) ^
OverallNot applicableNot applicable1.011.01
(1.01–1.02) *(1.00–1.01) *
Good PSI1.001.001.021.01
(reference)(reference)(1.01–1.03) *(1.00–1.02) *
Moderate PSI1.061.050.980.98
(1.04–1.08) *(1.03–1.07) *(0.95–1.02)(0.94–1.02)
Unhealthy PSI1.101.080.990.99
(1.05–1.16) *(1.03–1.14) *(0.87–1.14)(0.85–1.16)
* statistical significance with p < 0.05. ^ adjusted for daily average temperature, daily average wind speed, and daily total rainfall.

