
Analysis on the Characteristics of Air Pollution in China during the COVID-19 Outbreak


1
College of Atmospheric Sciences, Lanzhou University, Lanzhou 730000, China
2
Gansu Seed General Station, Lanzhou 730030, China
*
Author to whom correspondence should be addressed.
Atmosphere 2021, 12(2), 205; https://0-doi-org.brum.beds.ac.uk/10.3390/atmos12020205
Submission received: 23 December 2020
/
Revised: 19 January 2021
/
Accepted: 29 January 2021
/
Published: 3 February 2021
(This article belongs to the Special Issue Coronavirus Pandemic Shutdown Effects on Urban Air Quality)
Abstract
:The COVID-19 pandemic poses a serious global threat to human health. In China, the government immediately implemented lockdown measures to curb the spread of this virus. These measures severely affected transportation and industrial production across the country, resulting in a significant change in the concentration of air pollutants. In this study, the Euclidean distance method was used to select the most similar meteorological field during the COVID-19 lockdown period. Changes in the concentration of air pollutants in China were analyzed under similar meteorological background conditions. Results indicate that, compared with data from 2015–2019, air quality in China significantly improved; with the exception of ozone (O3), the concentration of major air pollutants declined. Compared with baseline conditions, the reduction of air pollutants in China from 25 January to 22 February 2020 (Period 2) was the most significant. In particular, NO2 decreased by 41.7% in the Yangtze River Delta. In Period 2, the reduction of air pollutants in areas other than Hubei gradually decreased, but the reduction of NO2 in Wuhan reached 61.92%, and the reduction of air pollutants in various regions after February 23 was significantly reduced. By excluding the influence of meteorological factors and calculating the contribution of human activities to atmospheric pollutants by linear fitting, in Period 2 the effect of artificial controls on NO2 in Wuhan attained 30.66%, and reached 48.17% from 23 February to 23 March (Period 3). Results from this investigation provides effective theoretical support for pollution prevention and control in China.
1. Introduction
Recent economic expansion and development in China has resulted in a rapid promotion of industrial production. An increase in urbanization has resulted in an increase in motor vehicle use, leading to a continued increase in air pollution emissions in some cities [1,2], resulting in severe levels of air pollution. This has not only caused difficulties for development, it also poses a threat to human health [3,4,5]. According to a World Health Organization (WHO) report, more than 800,000 people die from air pollution each year, and particulate matter (PM) is the pollutant that has the greatest impact on human health [6]. Studies have found that a 10 μg·m−3 increase in PM2.5 is associated with an increase in respiratory mortality of 1.01% and a 1.04% increase in cardiovascular diseases, and the hospitalization rate for respiratory diseases and cardiovascular diseases increased by 0.48% and 0.60% respectively [7,8]. If PM2.5 concentrations do not exceed 10 μg·m−3, around 900–1000 premature deaths for ischemic heart disease caused by long term PM2.5 exposure could be avoided each year [9]. In addition to particulate matter, there is a significant correlation between average weekly sulfur dioxide (SO2) concentrations and asthma related emergency visits [10], and nitrogen dioxide (NO2) and tropospheric ozone (O3) can cause respiratory and cardiovascular diseases and death [11,12].
Air pollution is affected by many factors, such as pollution sources, meteorological conditions [13,14,15], geographical location [16,17,18,19], human activities [20,21], and industrial production [22,23]. Some scholars developed a consumption-based emission inventory for air pollutants in the years 2007 and 2012 [24]. At present, the main pollutants affecting atmospheric air quality include total suspended particulate matter and inhalable particulate matter [25], the content of which is relatively high in urban areas in China. Based on the collection of twelve-hour PM10 and PM2.5 samples at Ordos, China, scholars found the major source categories were crustal dust, vehicle exhaust, and secondary sulfate and nitrate [26]. Spring/autumn dust in North China and western cities contributes to primary particulate matter [27]. Emissions from coal-burning and high-tech manufacturing were suggested to be the main pollution sources of both PM2.5 and PM10 in Hefei City, China [28]. In the “Provence Alpes-Côte d’Azur’’ region, 51% of NOx and 28% of CO of NMVOC emissions have been attributed to road traffic [29]. In general, China has a large dependency on coal, and coal combustion is a major source of pollution throughout the year. It has been previously reported that 90% of sulfur dioxide (SO2) and 67% of nitrogen oxides (NOx) in China are emitted by coal combustion, and on-road mobile sources contribute to emissions of NOx [30,31,32,33]. The presence of NOx in the air is important for the formation of O3, and O3 concentrations in China have increased since 2013 [34]. Changes in urbanization and economic levels have a non-negligible impact on air pollution [35]. The increase in the population and urbanization levels in eastern China promotes the production of SO2 and NOx, but reduces that of PM2.5 [36]. The empirical results tend to confirm the inverse U-shaped relationship, and the N-shaped relationship, between income and pollution [37].
The distribution characteristics of air pollution in China have been previously analyzed, having a general trend of being higher in the south than in the north, with air pollution in the North China Plain, and the central and western cities in Xinjiang, being the most serious [38]. The spatial dependence of urban air pollution is high, and surrounding cities are affected by the concentration of atmospheric pollutants. Particulate and SO2 pollutants have obvious seasonal changes; air pollution is the most serious during the winter, and remains relatively high in spring. Air pollution concentrations during the summer and autumn are generally lower. The long-term spatial temporal distribution of NO2 and SO2 are closely related to human activities [39], with the exception of ozone (O3) [40]. During the winter and spring, the difference in pollution between north and south China is particularly obvious, especially during the heating period when a sharp increase in coal consumption results in a deterioration of air quality in the north [41,42,43]. Some scholars have shown that air pollutants and GHGs have the same root causes, and they have possible co-emission and co-transport of atmospheric pollutants. The relationship between the two in the emission reduction process can be called the “synergistic effect” [44].
According to a recent report, the Chinese government has implemented various measures to control air pollution over the past two decades [45]. In 2014, China implemented new air quality standards, however, only 16 cities have achieved these standards [36]. The Air Pollution Prevention and Control Action Plan was issued to alleviate China’s current air pollution problem. Under the strict control of air pollution, China aims to achieve peak air quality in 2030 [46].
Towards the end of 2019, COVID-19 was first recorded in China [47]. The disease attracted the attention of the government and people. To take account of the impact of the Chinese New Year holiday on the pollutant changes caused by the pandemic situation, in this study we used a research period corresponding to the pandemic situation from the past 5 years and 2020 (Table 1). To control the spread of COVID-19 and to protect lives, various countries have implemented a range of measures. Many provinces in China implemented various measures in January 2020 (Table 2). During the Spring Festival and early stages of spring, a large proportion of industrial and commercial production is suspended or significantly reduced, and the flow of public vehicles is noticeably reduced, resulting in a reduction in conventional pollution source emissions [48]. However, previous investigations have shown that the discharge of fireworks during the Spring Festival increases the concentration of PM2.5, PM10, and SO2, causing serious short-term air pollution [49,50,51,52,53]. Strict traffic control, restrictions on people’s movement, the suspension of industrial and commercial production activities, and the postponement of schools played a significant role in controlling the spread of COVID-19. These lockdown measures caused the number of new cases to decline by 73.6% by the 16–30 days after lockdown [54]. As the situation regarding COVID-19 improved by the end of February, provinces (apart from Hubei) gradually resumed normal life by lifting lockdown restrictions. During the lockdown period, emissions from personnel activities, transportation, and industrial emissions were reduced. The main pollutants of SO2, NOx and PM2.5 in the Yangtze River Delta were reduced by 26%, 47%, and 46% [55], respectively. In addition to China, where the population is large, air pollutants in other areas have also been significantly reduced due to pandemic closures; for example, the NO2 in Alexandria, Egypt, dropped by 33% [56]. Korea’s PM2.5, PM10, NO2, and CO were reduced by 45.45%, 35.56%, 20.41%, and 17.33%, respectively, compared with the previous year’s average concentration [57]. During the blockade in Graz, Austria, the city’s average concentration of NO2 and PM10 decreased by 36.9–41.6% and 6.6–14.2%, respectively [58]. During the control period in the United States, due to a decrease in the median traffic flow of 37%, the road occupancy rate fell by 52%, the median value of BC and PM2.5 fell by 25% and 33%, respectively, and NO, NO2, NOx, and CO decreased by 33%, 29%, 30%, and 17%, respectively. [59]. During the same period, the reduction of nitrogen oxides resulted in an increase in O3. The O3 levels in Cairo and Alexandria provinces, Egypt, rose by about 2%, and South Korea’s O3 was estimated to have increased by 33.8% [56,57], which was due to a promotion in the formation of secondary aerosols [60]. Air pollutant emissions are also related to the mortality rate of the pandemic. There is a positive correlation between NOX concentration and COVID-19 mortality and infectivity. The incidence of COVID-19 increases 5.58% when long-term exposure to NO2 increases 1 μg·m−3. An increase in the long-term exposure to NO2 of 1 μg·m−3 leads to a rise of 5.58% in the incidence of COVID-19 [61]. In the UK, each increase of 1 m3 in the average PM2.5 increases the number of COVID-19 cases by 12% [62].
In this investigation, we examined the characteristics of recent changes in air pollution in China and the effects of government control measures during the pandemic. We analyzed the characteristics of changes in air pollution in China from 26 December 2019 to 22 May 2020. Euclidean distance (ED) was used to calculate the degree of similarity between meteorological data during the COVID-19 pandemic and the same period in the previous five years. ED and linear fitting methods were used to eliminate the impact of meteorological fields and government measures on air pollutants, and the contribution of man-made control measures to air pollution during the study period was determined. The results provide a theoretical basis and support for future environmental protection and pollution control in China.
2. Experiments
2.1. Data
2.1.1. Air Quality Data
The air quality data used in this study was the hourly monitoring data of Air Quality Index (AQI) and the mass concentration of conventional pollutants (PM10, PM2.5, NO2, SO2, CO, O3) provided by the State Environmental Protection Administration from 2015 to 2020.
2.1.2. Meteorological Data
Meteorological data was taken from the NCEP/NCAR reanalysis dataset produced by the National Centers for Environmental Prediction and National Center for Atmospheric Research, from January 2015 to May 2020. The elements include: 500 hPa geopotential height, 500 hPa air temperature, 500 hPa u and v wind, relative humidity (850 hPa), sea level pressure, surface temperature, and surface u and v wind speed.
2.1.3. Government Control Measures
All government prevention and control measures implemented during COVID-19 were taken from the local government network.
2.2. Methods
Euclidean Distance
Euclidean distance (ED) was used to quantitatively describe the degree of similarity between two weather processes, approximately eliminating the impact of meteorological fields on air pollutants. This method enables the impact of government activities on pollutants during the COVID-19 pandemic to be more clearly identified. ED is a distance coefficient, used to describe sample similarity from the perspective of “value similarity”, providing an intuitive reflection of the value difference between sample fields. A key for similarity analysis is the selection of appropriate factor fields as feature statistics. We selected 500 hPa geopotential height, 500 hPa air temperature, 500 hPa u and v wind, relative humidity (850 hPa), sea level pressure, surface temperature, and surface u and v wind speed as the factor fields for similar analysis. These are element fields noted to have important effects on pollution development. Smaller ED coefficient results indicate higher similarities between the real-time field and the historical sample field. The equation used to calculate ED was:
where i is the number of grid points in the selected area (i = 1,2…n), is the historical sample field, and is the selected real-time field.
Baseline conditions for this analysis spanned 2015 to 2019; the study period selected was the same as the 2020 pandemic research period (Table 1). Each study period was divided into the upper, middle, and lower ten-day periods using the nine element fields, and the ED between each ten-day period and the same period for the previous five years was calculated. For two element fields, a lower ED coefficient value indicates higher similarity. Then, a show-of-hands voting method was adopted, with the most frequent being selected for analysis.
3. Results
3.1. Characteristics of Pollutants in China during Study Period 2015–2020
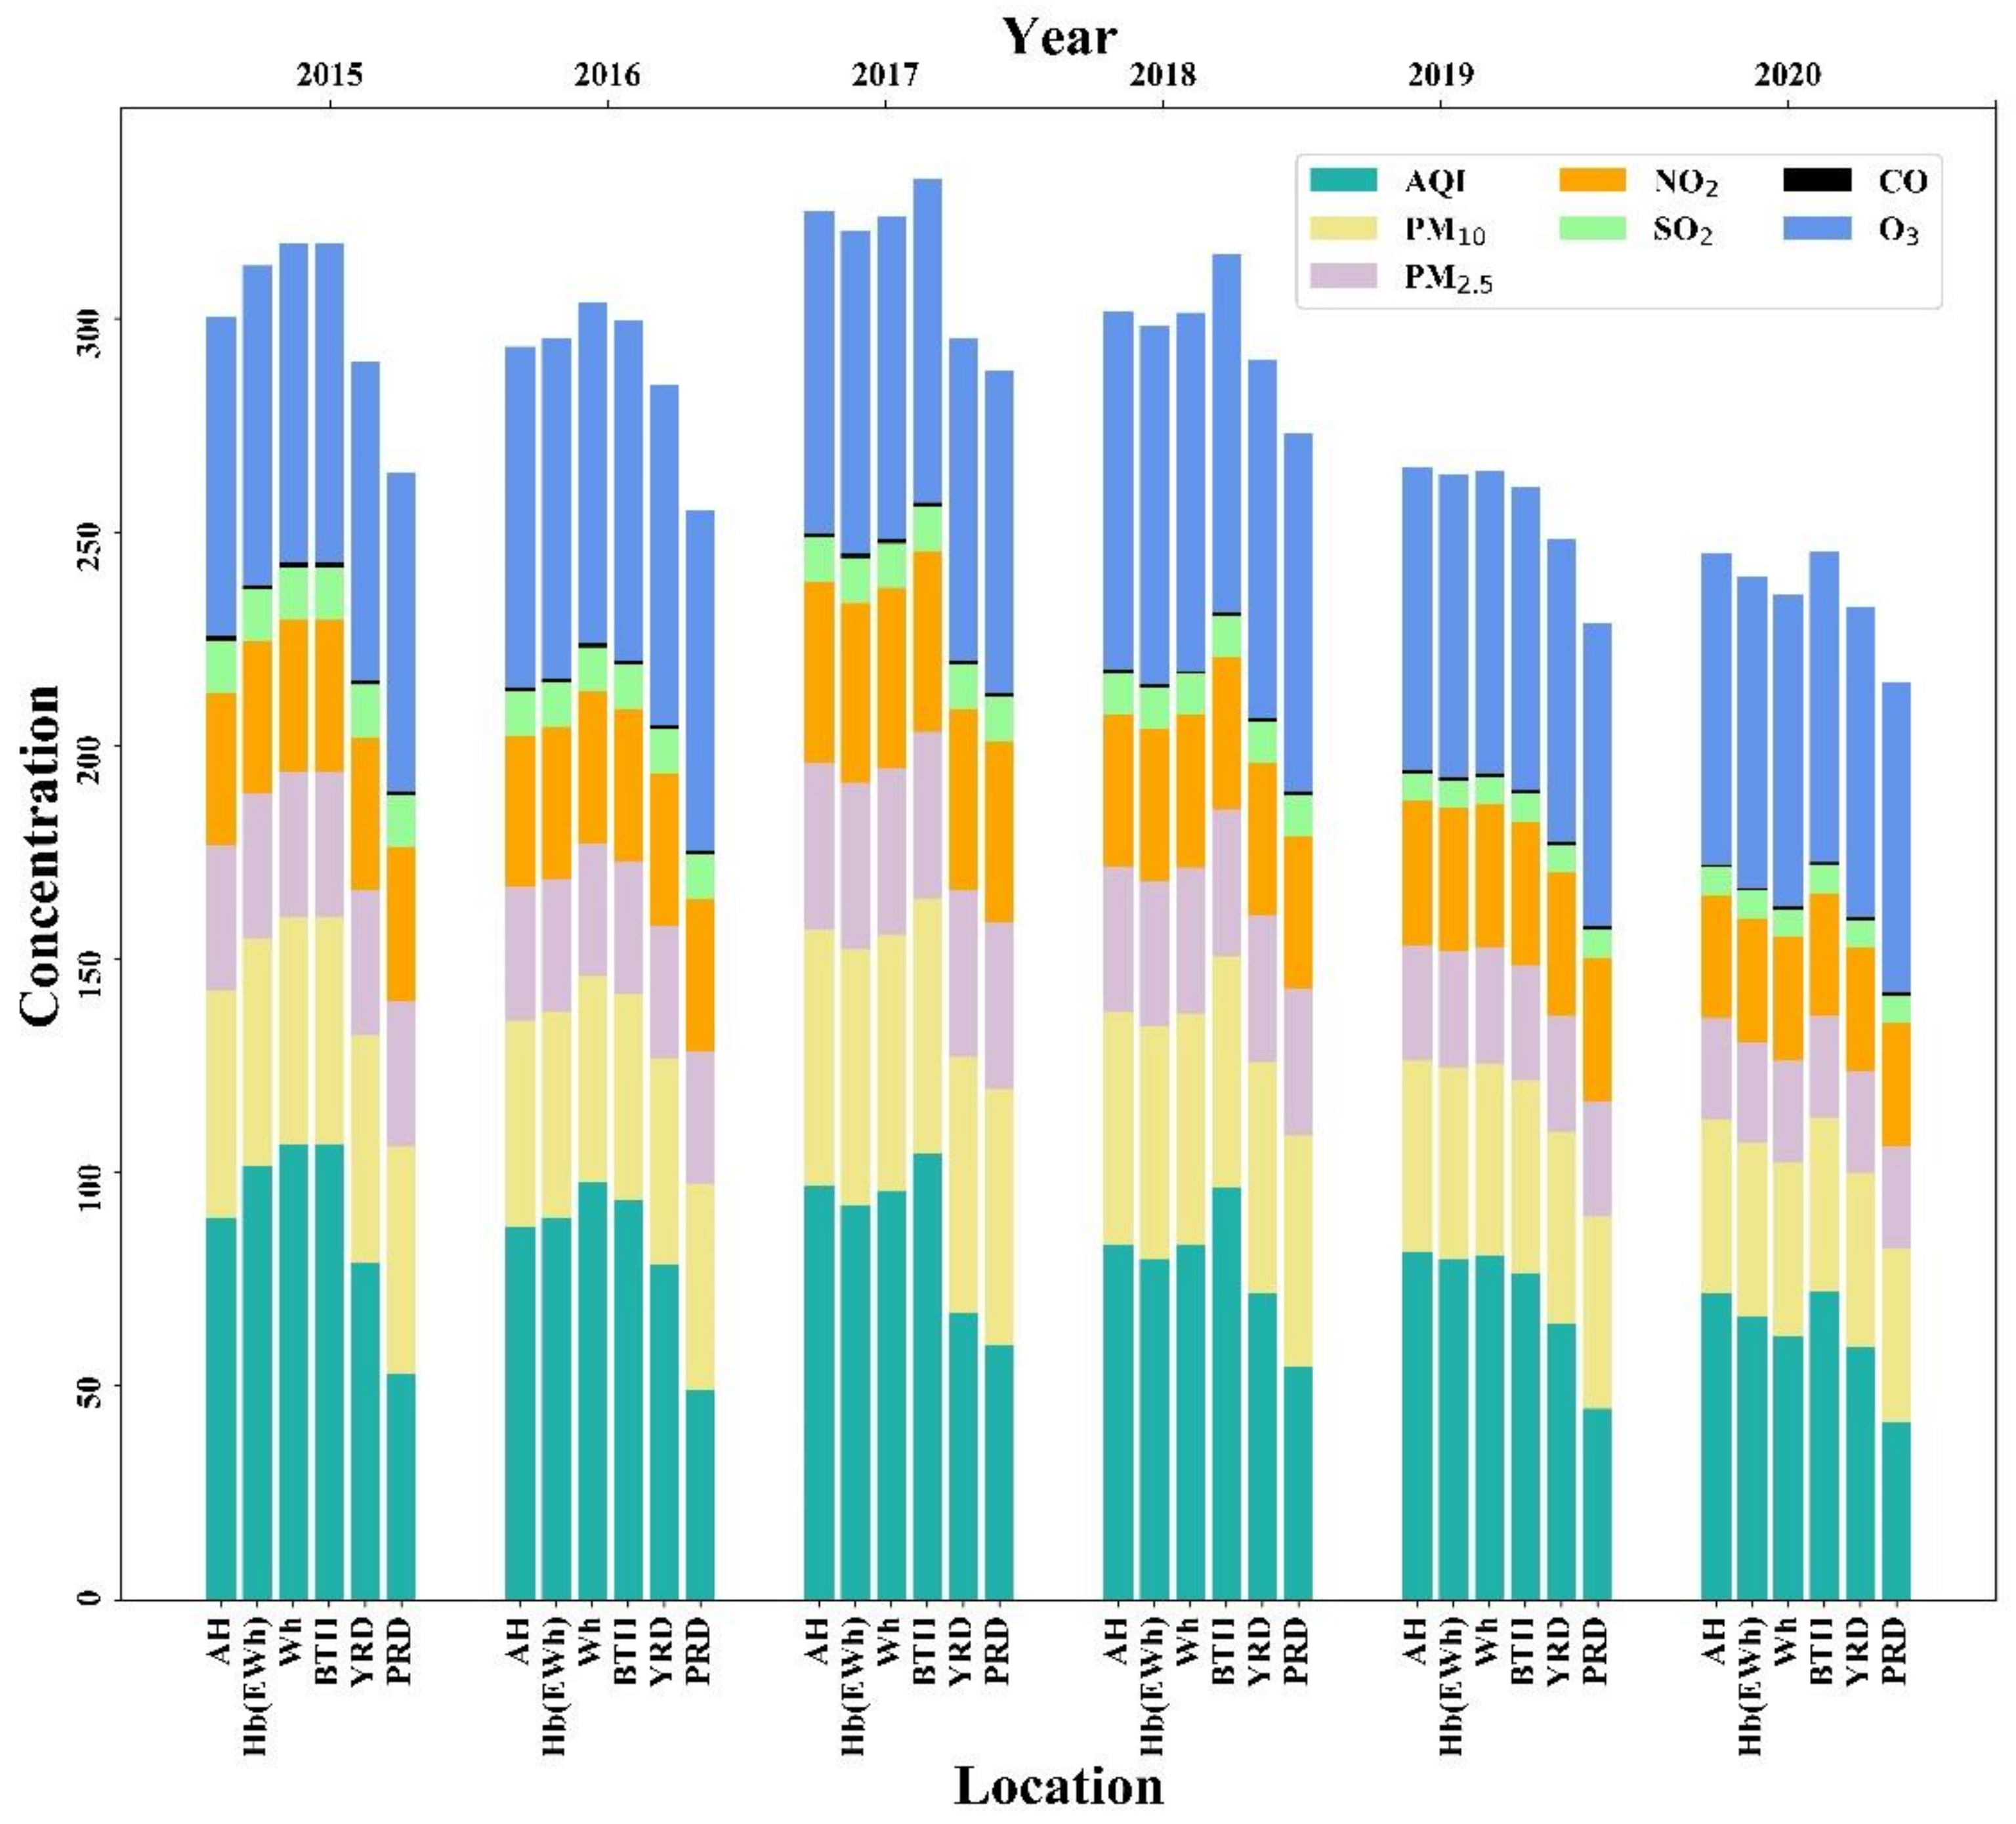
In recent years, pollution concentrations and AQI in China have decreased annually, and there are obvious temporal and spatial characteristics of low concentrations in the south and high concentrations in the north. Air pollutants undergo significant changes under the influence of climatic conditions and human activities. Average air pollution and air quality values during the study period of 2015–2020 (Figure 1) indicate that air pollution levels have declined annually in Beijing, Tianjin, Hebei, the Yangtze River Delta, the Pearl River Delta, and Hubei and its surrounding provinces. The highest (lowest) average AQI concentrations in the six regions during this period were: 106.50 (52.99), 97.78 (49.18), 104.29 (59.51), 96.48 (54.52), 81.27 (44.71), and 72.21 (41.64) μg·m−3, respectively. In addition, highest average concentrations of AQI were recorded numerous times during the last five years in northern China (Wuhan and Beijing); the Pearl River Delta recorded the lowest value area, reflecting the spatial characteristics of China’s air pollution, with high values in the north and low values in the south.
Similar to AQI, the spatial distribution of atmospheric particulate pollutants in these six regions also showed a downward annual trend; spatial distribution recorded a trend of high values in the north and low values in the south. Average maximum PM10 in each region during the study period of 2015 to 2020 was 114.19, 107.51, 112.86, 103.49, 88, 44, and 70.56 μg·m−3, respectively. PM10 in Beijing attained the highest level in the past three years, and PM10 in the Pearl River Delta had the lowest level over the past six years, with a concentration value below 60 μg·m−3. As an important part of PM10, PM2.5 recorded the same trend and distribution characteristics as PM10.
With the exception of O3, major gaseous pollutants also recorded a significant decreasing annual trend. The average multi-month concentration of NO2 in the six different regions (2015–2020) was: 51.04–30.45, 45.66–30.04, 51.37–33.78, 46.40–30.24, 45.15–28.74, and 37.20–21.41 μg·m−3, respectively, recording the lowest values in Hubei and highest values in Wuhan and the Yangtze River Delta. The area of high concentration was located in Hubei and its surrounding provinces, and the area of low concentration was located in the Beijing-Tianjin-Hebei region and the Pearl River Delta region. Unlike the air quality index and atmospheric particulate matter, the distribution of gaseous pollutants had no obvious characteristics between south and north China. CO also recorded an obvious annual downward trend, having significant differences between north and south China from 2015 to 2017. Beijing, Tianjin, Hebei, and Hubei and its surrounding areas recorded high values; the Yangtze River Delta and the Pearl River Delta recorded low values. Six-year average O3 values in the Yangtze River Delta were also high.
From 2015 to 2020, in addition to the monthly average, AQI concentrations changed in Beijing, Tianjin, Hebei, the Yangtze River Delta, the Pearl River Delta, and Hubei and surrounding provinces (Figure 2a). Monthly average AQI concentrations also recorded seasonal variations, with winter having higher concentrations than spring. Over the study period, lowest monthly average AQI concentrations occurred in Period 4 and Period 5, and highest concentrations occurred in Period 1. With the exception of 2017, the Beijing-Tianjin-Hebei region recorded the highest AQI value in Period 2; the lowest values occurred in Period 1, Period 4, and Period 5. Air quality in the Yangtze River Delta and the Pearl River Delta areas was optimal in Period 5 and poor during Period 1.
Average minimum particulate concentrations during the study period were recorded in Period 2 and in Period 5 in each region (Figure 2b,c). Our results indicate that the distribution of particulate pollution was the worst during the winter and better in spring, depicting obvious seasonal changes. Differences in monthly average concentrations of particulate pollutants in the south were lower than those in the north, largely related to winter heating in the north during the first month and obvious climate differences between the north and the south. With the exception of the Beijing-Tianjin-Hebei region, the concentration of particulate pollutants in Period 2 in the remainder of the region was significantly reduced. PM10 and PM2.5 concentrations in the Pearl River Delta, the Yangtze River Delta, and Hubei and surrounding areas decreased by 13.51–32.05 and 14.15–25.35 μg·m−3, respectively. Monthly average PM10 and PM2.5 concentrations in the Beijing-Tianjin-Hebei region increased by 10.76 and 34.01 μg·m−3, respectively.
Seasonal differences were also recorded in the distribution of gaseous pollutants. During the study period, NO2, SO2, and CO average monthly concentrations were highest in Period 1 (Figure 2d,f,g); changes for O3 differed (Figure 2e). From Period 1 to Period 2, NO2 average monthly concentrations significantly declined. The greatest declines over the study period were recorded in 2020, with declines of 59.95% (Pearl River Delta, Hubei), 37.11% (Pearl River Delta), 31.59% (Beijing-Tianjin-Hebei), 28.83% (Beijing-Tianjin-Hebei), 18.44% (Yangtze River Delta), and 39.22% (Pearl River Delta). Notably, the decline in monthly average NO2 concentrations in Hubei and its surrounding areas was relatively small during the first five study years; in 2020, NO2 declined from 53.14% in Period 1 to 59.11% in Period 2. After Period 2, NO2 concentrations in various places increased by varying degrees before gradually decreasing with seasonal changes. Average monthly SO2 and CO concentrations from 2015 to 2019 were consistent with NO2 results, having maximum values in Period 1, followed by sharp decreases in Period 2, an increase in Period 3, and then a gradual decrease with changing seasons. However, the trend in 2020 differed. The Yangtze River Delta, and Hubei and its surrounding areas, continued to increase after the Period 2 decline, and the maximum average monthly SO2 concentration in the Yangtze River Delta, Hubei and its surrounding areas occurred in Period 5. The distribution of O3 recorded differences compared to the other gaseous pollutants. Although O3 was obviously present in the six study regions, O3 concentrations in spring were greater than those in winter. Over the study period, high value areas (Beijing-Tianjin-Hebei and Yangtze River Delta regions) recorded highest concentrations in Period 4 and Period 5.
3.2. Changes in AQI and Air Pollutants during COVID-19 after the eliMination of Meteorological Field
3.2.1. Meteorological Similarity
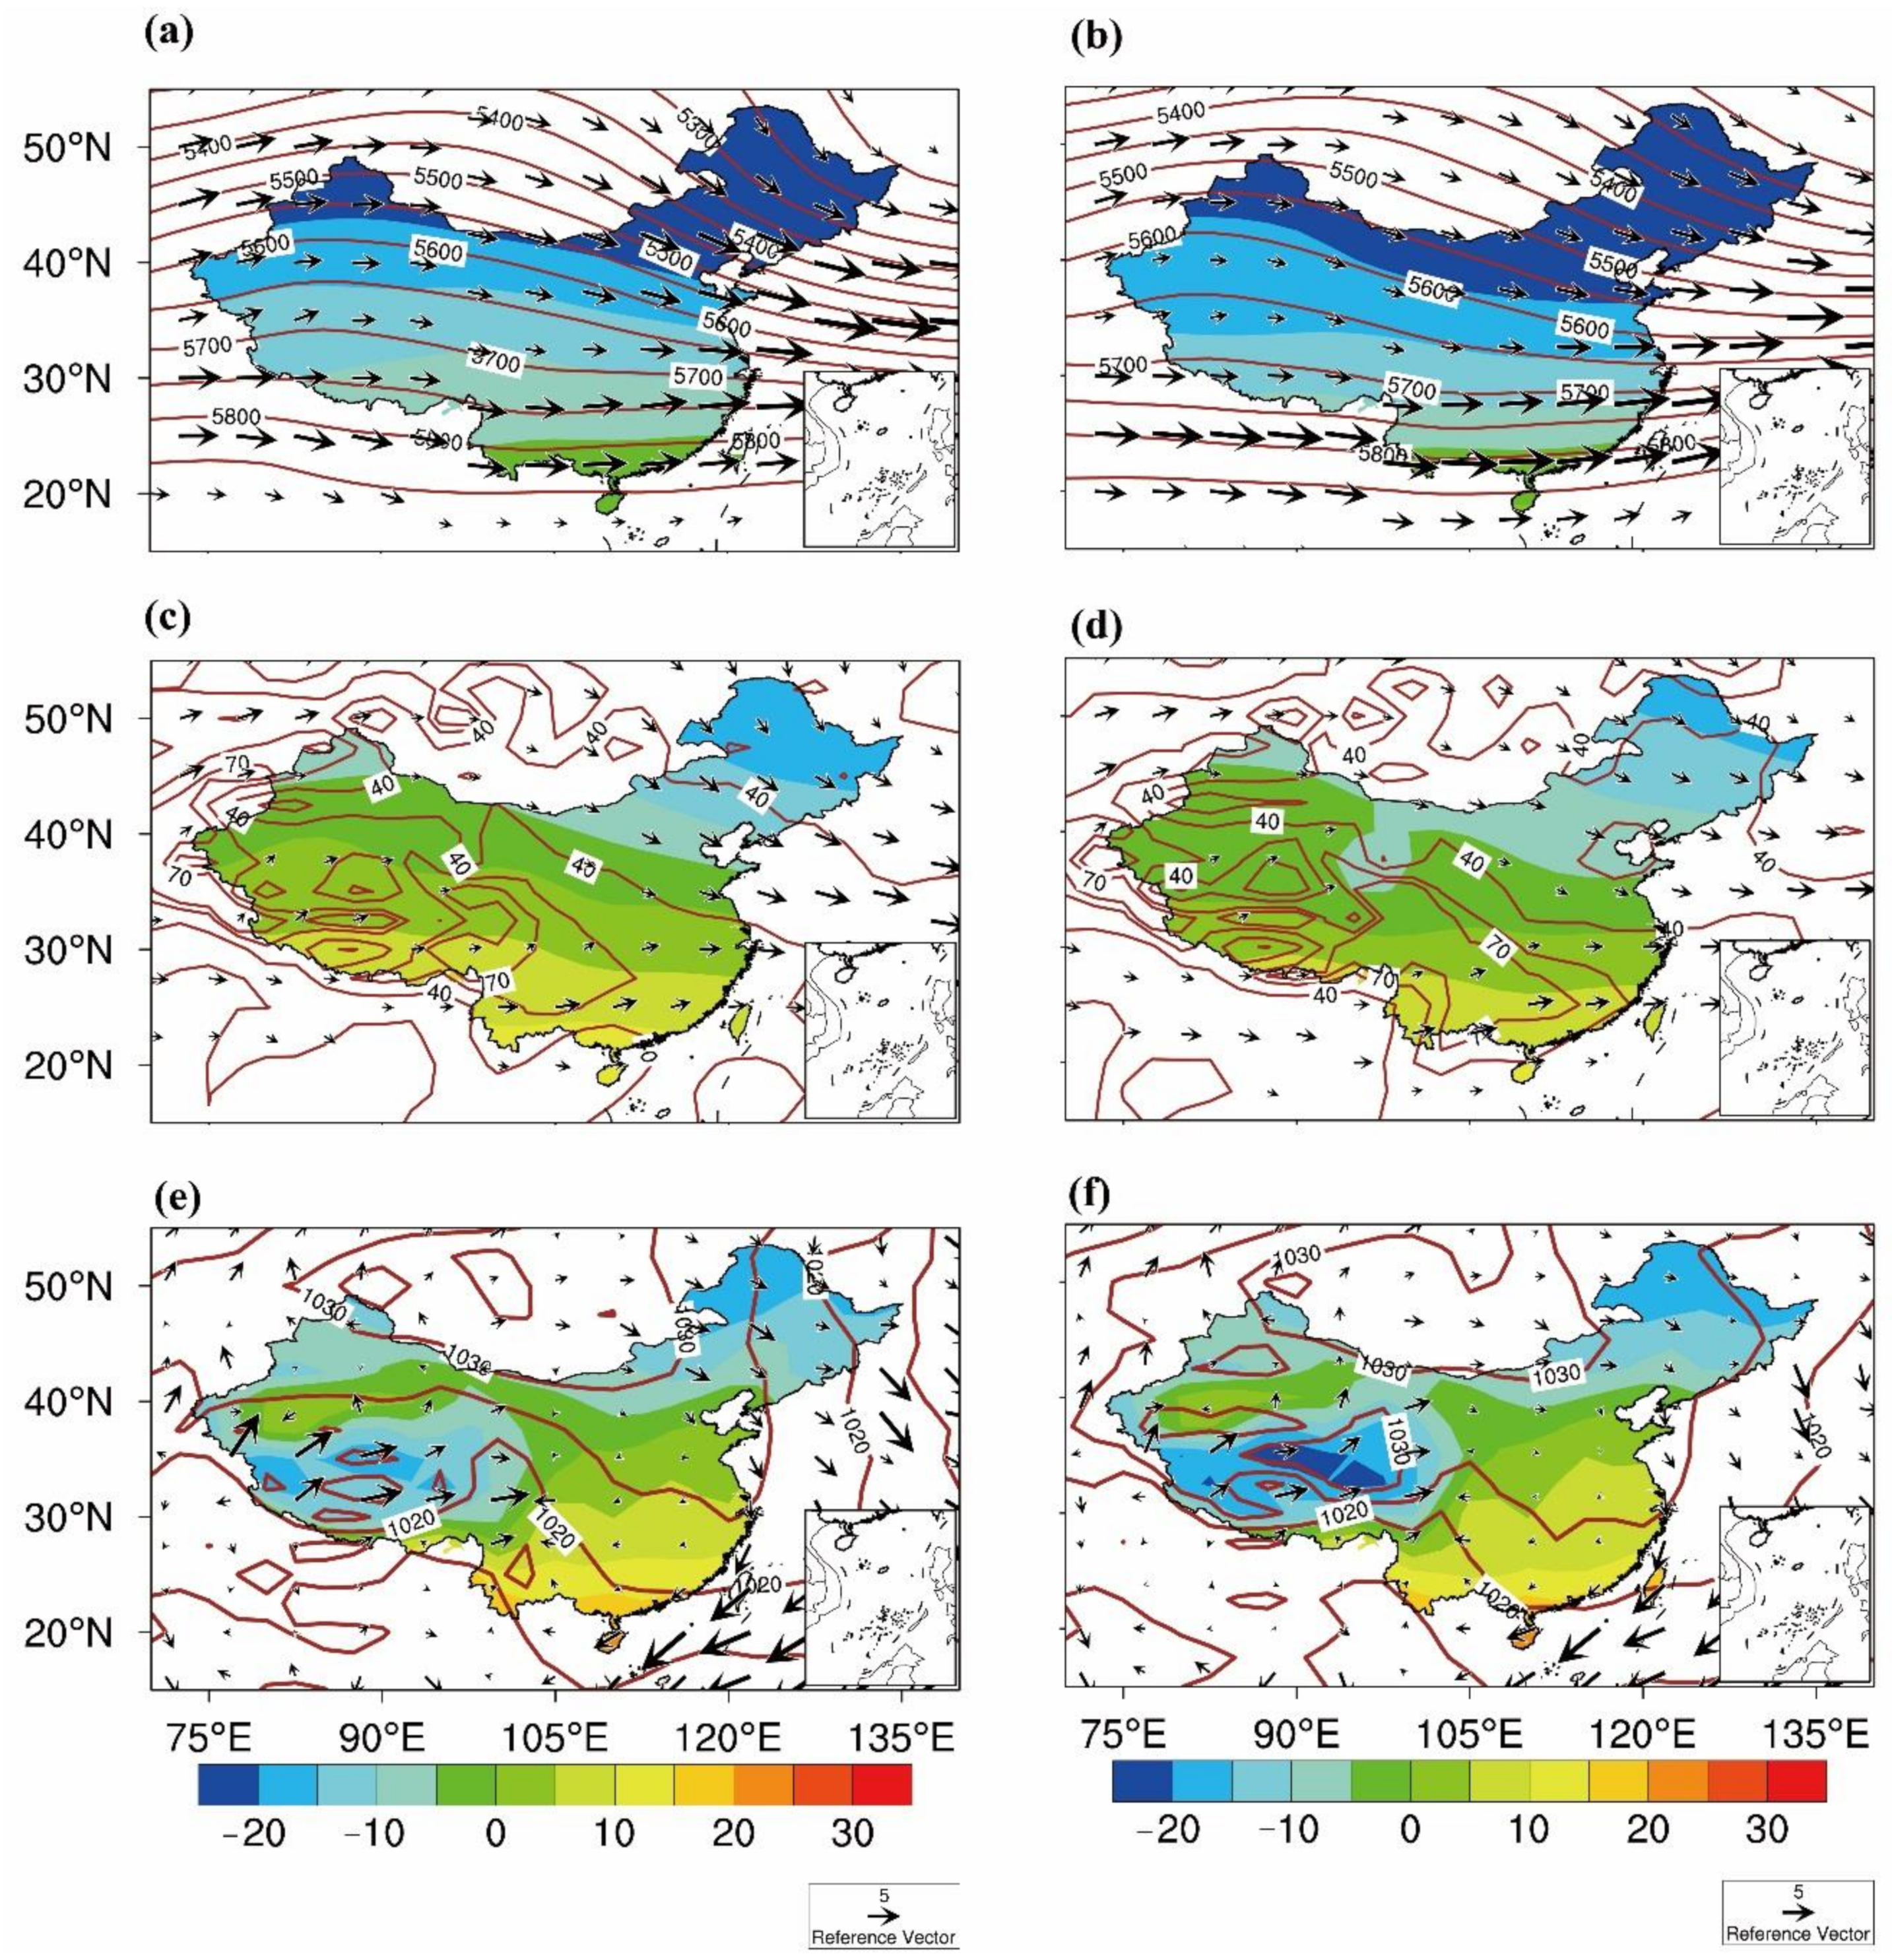
Taking Period 1 as an example, we divided data for this period into upper, middle, and lower ten-day periods. Air Temperatures of 500 hPa in the first ten days of Period 1 2020 and the first ten days of Period 1 between 2015 and 2019 were calculated using ED from the same weather field. Results from this process resulted in five fields (da11, da12, …, da15). Next, we selected the year corresponding to the smallest da1min. The middle and last ten days of Period 1 were then calculated in turn, providing three years corresponding to daimin. By calculating the remaining eight meteorological elements in the same way, 27 results were obtained for the first half of Period 1. The most similar case in Period 1 2020 was that with the highest repetition rate. Results from this analysis (Table 3) indicate that Period 1 2019 had similar characteristics to weather fields in Period 1 2020. This process was undertaken for Period 2 to Period 5, and we identify that the meteorological fields in 2017 were similar to these.
The most stringent period of China’s pandemic lockdown was mainly in Period 2. From Figure 3, it can be concluded that the similarity between Period 2, 2017 and 2020, is relatively high. The 500 hPa circulation patterns in 2017 and Period 2 2020 have the same trend. The temperature decreases with increasing latitude, and the geopotential height decreases with increasing latitude. There is a high-pressure ridge over West Siberia and a low-pressure trough in the Sea of Okhotsk (Figure 3a,b). The relative humidity of 750 hPa increases from north to south, and the relative humidity in the south reaches about 70%. The Pearl River Delta is located in an area with a high relative humidity, which can reach 60%. Furthermore, the water vapor transport is good and it is easy to transport water vapor from the Bay of Bengal and other places. In Hubei and the Yangtze River Delta, the relative humidity of Beijing-Tianjin-Hebei is around 40%, and there is a relatively strong northwesterly wind. Relative humidity and pollutants have a negative correlation, which also shows that the Pearl River Delta region is relatively lighter than the country overall (Figure 3c,d). The distribution of sea level high and low pressure in the past two years is also similar. The pressure decreases from north to south. The low-pressure area corresponds to the low temperature area (Figure 3e,f). The temperature in the northwest region is the lowest in the two years. However, compared with 2017, the lowest temperature in 2020 is stronger. The wind speed in the west is relatively high, showing a southwest wind, and there is a relatively strong westerly wind in the southwest, which may transport pollutants from the west to the vicinity of the southwest. Northwest winds are present in the Beijing-Tianjin-Hebei and Yangtze River Delta regions, whereas in Hubei and Pearl River Delta regions, wind speeds are relatively low and winds are easterly.
3.2.2. Changes in Pollutants during the Pandemiccovid-19 Compared with the Background Field
Using monthly average data during the study period of 2015–2019 as historical background field data, the changes of air pollutants in China in 2020 in a year similar to its meteorological field were compared and analyzed. Air quality in China was found to have notably improved (Figure 4). From Period 1 to Period 5 (Figure 4b,d,f,h,j), AQI was significantly lower than the average over the previous five years. The biggest decline in AQI was recorded in Period 2 and Period 3 in each region; AQI values declined in Period 2 by 26.36% (Hubei), 32.37% (Hubei, (except Wuhan), 40.44% (Wuhan), 4.95% (Beijing-Tianjin-Hebei), 21.52% (Yangtze River Delta), and 33.33% (Pearl River Delta). Not only did the Wuhan area experience a large decline in Period 2, it also decreased by 33.68% and 34.33% in Period 1 and Period 3, respectively. This result is related to Wuhan being the area with relatively strict and long-lasting control measures. However, in Period 1 2019 and Periods 2–5, 2017, the trend was higher than the five-year average (Figure 4a,c,e,g,i).
The trend of atmospheric particulate pollutants was similar to that of AQI, with the degree of pollution decreasing annually. In 2020, atmospheric particulate pollutants fell in Beijing-Tianjin-Hebei, Pearl River Delta, Yangtze River Delta, and Hubei and its surrounding areas, and PM10 concentrations decreased by 33.58–50.55% in Period 2. PM2.5 concentrations experienced the highest decrease in Wuhan (42.07%). Although the reduction of atmospheric particulate matter in various regions in Period 3 was significantly smaller than that in Period 2, the declines in PM10 in Periods 3 and 4 in Wuhan were 44.55% and 46.04% respectively. In Period 5, the decline of particulate pollutants in the various regions gradually reduced.
Over the study period, major gaseous pollutants in Beijing-Tianjin-Hebei, the Pearl River Delta, the Yangtze River Delta, and Hubei and surrounding areas were significantly reduced, with the exception of O3 (Figure 4). However, the gaseous pollutants in similar years in the meteorological field showed an increasing trend. In 2020, NO2, SO2, and CO gaseous pollutants recorded the greatest decrease in concentration values in Periods 2 and 3 in different regions, with NO2 recording the most obvious change during the COVID-19 lockdown period. The COVID-19 lockdown period in the majority of areas in China was concentrated in Period 2, coinciding with a decline of NO2 concentrations in each region by more than 41.67%. Due to working/leisure restrictions implemented during the lockdown period, this change in concentrations can be used as an indicator of lockdown. From Period 2 to Period 3, NO2 concentrations in Hubei significantly declined compared to those in other areas. In Wuhan, the level of decrease peaked at 61.92% in Period 3, with other areas recording declines of 27.53–33.54%. SO2 declines in some regions were more than 33.14% during Period 2 in 2019, especially in the Beijing-Tianjin-Hebei region (56.63%). From Period 2 to Period 3, the SO2 decline in the Beijing-Tianjin-Hebei and Yangtze River Delta regions was more than 65.96%. In 2020, due to the impact of COVID-19 related lockdowns, the monthly average CO concentration in Period 2 decreased the most. Around Hubei, the decrease in the Beijing-Tianjin-Hebei region was also the most obvious. As previously highlighted, O3 concentrations recorded contrary results. In Period 2, 2020, monthly average O3 concentrations in Beijing-Tianjin-Hebei, the Pearl River Delta, the Yangtze River Delta, and Hubei and surrounding areas increased, being related to changes in NO2 concentrations. This result indicates that NOx emissions may effectively inhibit O3 production.
3.3. Anthropogenic Control of Contributions to Atmospheric Pollutants
The results from our study indicate that if the impact of meteorological fields over the past five years (2015–2019) are not considered, AQI recorded the largest decline in Period 2 (40.44%), and declines in PM10 and PM2.5 reach 50.56% and 42.07%, respectively. For gaseous pollutants, NO2 decreased by 54.61%, showing that human control has a strong influence on the concentration of air pollutants. To determine the influence of human-made control on air pollutants, ED was used to obtain a similar meteorological field to that of 2020, thereby eliminating the interference of meteorological factors. Linear fitting was used to obtain the concentrations of pollutants estimated at baseline conditions in 2020 and similar years to the meteorological field, comparing and analyzing the anthropogenic contribution of atmospheric pollutants. The formula is as follows:
where is the meteorological field for a year similar to 2020 that has a pollutant concentration value of environmental treatment; is the concentration value of pollutants under the influence of environmental governance in 2020 and pandemic control; simulates when there is no pandemic control, but there are pollutant concentration values under the influence of environmental governance in 2020; indicates there is pandemic control and a difference in pollutant concentration caused by environmental governance in different years; is the difference in pollutant concentration under different environmental treatments in years similar to 2020 and its meteorological field; is the contribution of environmental governance and pandemic control to the concentration of pollutants; is the contribution of environmental treatment to pollutant concentration in different years; and , after excluding the impact of meteorological fields and environmental governance, is the contribution of pandemic control measures to the concentration of air pollutants.
We calculated the contribution of atmospheric pollutants to the COVID-19 control measures (M) before and after the pandemic based on the change trend over the years and the similarity of the weather field. In Period 2020, most AQI and air pollutants are affected by human-made declines, and pollutants in some areas increased. AQI and particulate pollutants in Beijing-Tianjin-Hebei, and Hubei and its surrounding areas dropped significantly in Periods 1 and 2. The Yangtze River Delta and the Pearl River Delta dropped significantly in Periods 2 and 3. The average drops in AQI and atmospheric particulates in each region in Period 2 were 6.52% and 10.05%, respectively. In Period 5, the areas surrounding Hubei and the Pearl River Delta gradually changed from a decrease to an increase. By Period 5, AQI and particulate pollutants in all regions except the Yangtze River Delta were affected by human influence. Section 3.2.2 states that NO2 is the most sensitive pollutant for pandemic control. Figure 5 displays the common trend through which NO2 is affected by human activities. In Period 2, the average reduction in NO2 due to the impact of pandemic control measures was 30.66%; the Yangtze River Delta and Hubei (excluding Wuhan), in particular, suffered a decline of more than 36%. Beginning in Period 3, except for Hubei, the decline in NO2 continued to decrease due to human-made influences, and even increased in Periods 4 and 5. This is in line with the gradual lifting of control in Period 3 and the beginning of resumption of work in various regions, and full resumption of work and production after Period 4. However, in Hubei (except Wuhan), NO2 dropped by 31.17% in Period 3 and reached 48.17% in Wuhan. This is because Hubei’s deregulation was relatively late, especially in Wuhan, which only began to deregulate traffic in Period 4. The overall impact of CO was relatively small, with a slight increase in northerly areas in Periods 2 and 3, a decrease in most areas in Period 4, and an increase in Period 5. The effects on O3 and NO2 were almost the opposite of these. In Periods 1 and 2, NO2 was affected by human-made influences, and most O3 increased. In particular, in Wuhan, the human-influenced O3 increased by 35.78% in Period 2. In Period 3, O3 and NO2 in Wuhan still showed an obvious opposite trend. Subsequently, O3 began to decline or slightly increased.
4. Discussion and Conclusions
We systematically analyzed the changes in AQI and air pollutants in major urban agglomerations in China before and after the pandemic and the hardest-hit area (Hubei), and eliminated the influence of meteorological fields and proximity based on Euclidean distance and linear fitting. In recent years, the environmental governance has impacted air pollutants in China.
Results from this investigation indicate that, compared with pollution emission concentrations over the past five years, air quality in China has notably improved. With the exception of O3, the concentration of major air pollutants decreased annually during the study period of 2015–2020. These changes reflect effective environmental protection measures that have been undertaken nationally in China. Particulate pollutants and some gaseous pollutants (NO2 and SO2) present a spatial distribution characteristic of being low in the south and high in the north, with distribution greater in winter than in spring. These changes may be affected by the frequent occurrence of sand and dust weather in the north, and heating in the north during the winter months. Strict COVID-19-related control measures implemented in Period 2 2020 were found to have significant impacts on air pollutants.
In Period 2 2020, air pollutants in various regions recorded significant declines; in particular, NO2 in the Yangtze River Delta fell 41.7%. In Period 3, the decline in air pollution in regions other than Hubei gradually decreased, however, the NO2 drop in Wuhan area reached 61.92%. This was possibly related to the severity of the pandemic in Hubei and its extended lockdown conditions, whereas control measures were relaxed across the remainder of China in Period 3. From Period 4 to Period 5, the air pollutants in various regions were significantly reduced, gradually returning to levels recorded in the previous year. O3 was found to increase during the lockdown period, contrary to changes in NO2 concentrations, possibly indicating NOx emissions have an effective inhibitory action on O3 production.
We described the contribution of human-made control on air pollutants during the pandemic. China’s pandemic control strongly impacted changes in air pollutants: the restrictions on industrial and commercial production, mass activities, and traffic and road operations led to a reduction in air pollutants. Among the air pollutants studied, NO2 was the most sensitive pollutant to control measures. AQI and atmospheric particulate matter were reduced 6.52%, 10.05% and NO2 fell by 30.66% by human-made impacts in Period 2 which was strictly controlled. As the resumption of work progressed and the decline of most pollutants in various regions slowed. However, the reduction in NO2 in Wuhan area was 48.17% due to artificial control.
Following the implementation of blockade measures in many places, the concentration of local air pollutants decreased significantly, however, such temporary and strong emission reduction measures cannot be used as a solution to the current air quality problems. This special control not only affects air quality, but also produces important changes in the economy and climate. The closure measures during the pandemic caused damage to domestic and foreign economies. The pandemic-related slowdown was the most serious economic contraction since 1929, and the economic impact of the pandemic will last longer than the health crisis [63]. Traffic control has caused significant economic losses in the transportation sector and has directly negatively impacted energy demand, affecting global oil prices, which have fallen to historical lows. Following the impact on the energy sector, most energy investment activities faced disruption due to flow restrictions [64]. In addition, the restrictions on tourism caused serious damage to the economies of countries where tourism plays a significant role in terms of GDP [63,65,66]. The United Nations Trade and Development Organization estimates that the global economy shrank by 4.3% in 2020, and 130 million people will fall into extreme poverty in two years. In the first quarter of 2020, China’s GDP fell by 6.8% year-on-year, and the GDP of Hubei region fell by 39.2% year-on-year (http://data.stats.gov.cn). Even countries that were not directly affected by the virus have suffered, and continue to suffer, economic damage, particularly low- and middle-income countries [67]. As the pandemic continues, many countries continue to implement blockade measures to protect people’s safety.
In addition, the prevention and control measures of the pandemic have had various impacts on climate change. The impact of the pandemic on the climate system and the role of climate in regulating the COVID-19 pandemic have been the foci of previous scientific research [68]. The implementation of strict blockade measures reduces NOx emissions more than VOCs emissions, resulting in a higher VOCs–NOx ratio, thereby increasing O3 production. The reduction in PM2.5 and PM10 also leads to an increase in the concentration of O3 on the surface. Due to the lower PM emissions during the blockade, higher solar radiation is conducive to the formation of O3. During the lockdown period, the increase in O3 precursor emissions, such as CO and volatile organic compounds from household activities (such as barbecuing, etc.), may also have been the reason for the increase in O3 [69,70]. The substantial reduction in NO2, increased O3 and nighttime NO3 radical formation, and the increase in atmospheric oxidation capacity promote the formation of secondary particulate matter, causing serious haze in some areas [71]. Reductions in NOx and SO2 emissions can control the concentration of aerosols [72]. During the pandemic control period, the reduction in aerosol emissions led to a rise in the continental surface temperature of the Northern Hemisphere [73]. In the context of global warming, increasingly frequent extreme weather may aggravate the emergence and spread of various infectious diseases. In the case of climate warming, the incidence of infectious diseases will increase through changing precipitation patterns and temperature [74,75]. However, some studies showed that rising temperatures will inhibit the spread of pandemic [76]. Future investigations should examine the indirect effects of climate on changes in air pollutants indirectly related to the COVID-19 pandemic.
The blockade measures have affected the climate and air quality, which, in turn, may affect the spread of the virus [68]. Climate disasters damage material assets, natural capital, and human life, leading to a loss in production capacity, which leads to a reduction in output and GDP [63]. The risks of the mixed impact of the COVID-19 pandemic on the social economy, finances, and people’s safety cannot be ignored. How COVID-19 interacts with the social structure remains to be studied.
Author Contributions
Design and conception, B.C.; methodology, L.D., B.C., Y.H., and Z.S.; calculation, L.D.; formal analysis, L.D. and Y.H.; writing—original draft preparation, L.D., B.C., and Y.H.; writing—review and editing, L.D., B.C., and T.Y. All authors have read and agreed to the published version of the manuscript.
Funding
The National Key Research and Development Program of China (Grant number 2019YFA0606801), Supported by the National Natural Science Foundation of China (Grant 41775021), The Fundamental Research Funds for the Central Universities (Grant lzujbky-2019-43).
Institutional Review Board Statement
Not applicable.
Informed Consent Statement
Not applicable.
Data Availability Statement
The air quality data used in this study was provided by the State Environmental Protection Administration, this data can be found here: http://www.mee.gov.cn/hjzl/. Meteorological data was taken from the NCEP/NCAR reanalysis dataset, this dataset can be found here: http://psl.noaa.gov/data. All government prevention and control measures implemented during COVID-19 were taken from the local government network, for example, Beijing, http://www.beijing.gov.cn/.
Acknowledgments
The authors would like to express their gratitude to the State Environmental Protection Administration for the air quality data, the NCEP/NCAR reanalysis dataset produced by the National Centers for Environmental Prediction and National Center for Atmospheric Research (https://psl.noaa.gov/data).
Conflicts of Interest
The authors declare no conflict of interest.
References
- Chan, C.K.; Yao, X. Air Pollution in Mega Cities in China. Atmos. Environ. 2008, 42, 1–42. [Google Scholar] [CrossRef]
- Wang, S.; Hao, J. Air Quality Management in China: Issues, Challenges, and Options. J. Environ. Sci. 2012, 24, 2–13. [Google Scholar] [CrossRef]
- Gui, K.; Che, H.; Wang, Y.; Wang, H.; Zhang, L.; Zhao, H.; Zheng, Y.; Sun, T.; Zhang, X. Satellite-Derived Pm2.5 Concentration Trends over Eastern China from 1998 to 2016: Relationships to Emissions and Meteorological Parameters. Environ. Pollut. 2019, 247, 1125–1133. [Google Scholar] [CrossRef]
- Qiao, X.; Guo, H.; Tang, Y.; Wang, P.; Deng, W.; Zhao, X.; Hu, J.; Ying, Q.; Zhang, H. Local and Regional Contributions to Fine Particulate Matter in the 18 Cities of Sichuan Basin, Southwestern China. Atmos. Chem. Phys. 2019, 19, 5791–5803. [Google Scholar] [CrossRef] [Green Version]
- Brunekreef, B.; Holgate, S.T. Air Pollution and Health. Lancet 2002, 360, 1233–1242. [Google Scholar] [CrossRef]
- Schwartz, J.; Slater, D.; Larson, T.V.; Pierson, W.E.; Koenig, J.Q. Particulate Air Pollution and Hospital Emergency Room Visits for Asthma in Seattle. Am. Rev. Respir. Dis. 1993, 147, 826–831. [Google Scholar] [CrossRef]
- Cesaroni, G.; Badaloni, C.; Gariazzo, C.; Stafoggia, M.; Sozzi, R.; Davoli, M.; Forastiere, F. Long-Term Exposure to Urban Air Pollution and Mortality in a Cohort of More Than a Million Adults in Rome. Environ. Health Perspect. 2013, 121, 324–331. [Google Scholar] [CrossRef] [Green Version]
- Goudarzi, G.; Daryanoosh, S.M.; Godini, H.; Hopke, P.K.; Sicard, P.; de Marco, A.; Rad, H.D.; Harbizadeh, A.; Jahedi, F.; Mohammadi, M.J.; et al. Health Risk Assessment of Exposure to the Middle-Eastern Dust Storms in the Iranian Megacity of Kermanshah. Public Health 2017, 148, 109–116. [Google Scholar] [CrossRef]
- De Marco, A.; Amoatey, P.; Khaniabadi, Y.O.; Sicard, P.; Hopke, P.K. Mortality and Morbidity for Cardiopulmonary Diseases Attributed to Pm2.5 Exposure in the Metropolis of Rome, Italy. Eur. J. Intern. Med. 2018, 57, 49–57. [Google Scholar] [CrossRef]
- Berktas, B.M.; Bircan, A. Effects of Atmospheric Sulphur Dioxide and Particulate Matter Concentrations on Emergency Room Admissions Due to Asthma in Ankara. Tuberk. Toraks 2003, 51, 231–238. [Google Scholar]
- Weinmayr, G.; Romeo, E.; de Sario, M.; Weiland, S.K.; Forastiere, F. Short-Term Effects of Pm10 and No2 on Respiratory Health among Children with Asthma or Asthma-Like Symptoms: A Systematic Review and Meta-Analysis. Environ. Health Perspect. 2010, 118, 449–457. [Google Scholar] [CrossRef] [PubMed] [Green Version]
- Nuvolone, D.; Petri, D.; Voller, F. The Effects of Ozone on Human Health. Environ. Sci. Pollut. Res. 2017, 25, 8074–8088. [Google Scholar] [CrossRef] [PubMed]
- Akyuz, M.; Cabuk, H. Meteorological Variations of Pm2.5/Pm10 Concentrations and Particle-Associated Polycyclic Aromatic Hydrocarbons in the Atmospheric Environment of Zonguldak, Turkey. J. Hazard. Mater. 2009, 170, 13–21. [Google Scholar] [CrossRef] [PubMed]
- Tian, Y.Z.; Shi, G.L.; Huang-Fu, Y.Q.; Song, D.L.; Liu, J.Y.; Zhou, L.D.; Feng, Y.C. Seasonal and Regional Variations of Source Contributions for Pm10 and Pm2.5 in Urban Environment. Sci. Total Environ. 2016, 557–558, 697–704. [Google Scholar] [CrossRef] [PubMed]
- Wu, M.; Wu, D.; Fan, Q.; Wang, B.M.; Li, H.W.; Fan, S.J. Observational Studies of the Meteorological Characteristics Associated with Poor Air Quality over the Pearl River Delta in China. Atmos. Chem. Phys. 2013, 13, 10755–10766. [Google Scholar] [CrossRef] [Green Version]
- Guan, Q.; Cai, A.; Wang, F.; Yang, L.; Xu, C.; Liu, Z. Spatio-Temporal Variability of Particulate Matter in the Key Part of Gansu Province, Western China. Environ. Pollut. 2017, 230, 189–198. [Google Scholar] [CrossRef]
- Li, R.; Wang, Z.; Cui, L.; Fu, H.; Zhang, L.; Kong, L.; Chen, W.; Chen, J. Air Pollution Characteristics in China During 2015-2016: Spatiotemporal Variations and Key Meteorological Factors. Sci. Total Environ. 2019, 648, 902–915. [Google Scholar] [CrossRef]
- Wang, F.; Sun, Y.; Tao, Y.; Guo, Y.; Li, Z.; Zhao, X.; Zhou, S. Pollution Characteristics in a Dusty Season Based on Highly Time-Resolved Online Measurements in Northwest China. Sci. Total Environ. 2019, 650, 2545–2558. [Google Scholar] [CrossRef]
- Yang, F.; Zhong, K.; Chen, Y.; Kang, Y. Simulations of the Impacts of Building Height Layout on Air Quality in Natural-Ventilated Rooms around Street Canyons. Environ. Sci. Pollut. Res. Int. 2017, 24, 23620–23635. [Google Scholar] [CrossRef]
- Ma, J.; Simonich, S.; Tao, S. New Discoveries to Old Problems: A Virtual Issue on Air Pollution in Rapidly Industrializing Countries. Environ. Sci. Technol. 2017, 51, 11497–11501. [Google Scholar] [CrossRef]
- Yu, H.L.; Yang, C.H.; Chien, L.C. Spatial Vulnerability under Extreme Events: A Case of Asian Dust Storm’s Effects on Children’s Respiratory Health. Environ. Int. 2013, 54, 35–44. [Google Scholar] [CrossRef] [PubMed]
- Chen, J.; Zhou, C.; Wang, S.; Hu, J. Identifying the Socioeconomic Determinants of Population Exposure to Particulate Matter (Pm2.5) in China Using Geographically Weighted Regression Modeling. Environ. Pollut. 2018, 241, 494–503. [Google Scholar] [CrossRef] [PubMed]
- Krotkov, N.A.; McLinden, C.A.; Li, C.; Lamsal, L.N.; Celarier, E.A.; Marchenko, S.V.; Swartz, W.H.; Bucsela, E.J.; Joiner, J.; Duncan, B.N.; et al. Streets. Aura Omi Observations of Regional So2 and No2 Pollution Changes from 2005 to 2015. Atmos. Chem. Phys. 2016, 16, 4605–4629. [Google Scholar] [CrossRef] [Green Version]
- Ou, J.; Meng, J.; Zheng, J.; Mi, Z.; Bian, Y.; Yu, X.; Liu, J.; Guan, D. Demand-Driven Air Pollutant Emissions for a Fast-Developing Region in China. Appl. Energy 2017, 204, 131–142. [Google Scholar] [CrossRef] [Green Version]
- Luo, H.; Guan, Q.; Lin, J.; Wang, Q.; Yang, L.; Tan, Z.; Wang, N. Air Pollution Characteristics and Human Health Risks in Key Cities of Northwest China. J. Environ. Manage. 2020, 269, 110791. [Google Scholar] [CrossRef]
- Wang, Z.-S.; Wu, T.; Shi, G.-L.; Fu, X.; Tian, Y.-Z.; Feng, Y.-C.; Wu, X.-F.; Wu, G.; Bai, Z.-P.; Zhang, W.-J. Potential Source Analysis for Pm10 and Pm2.5 in Autumn in a Northern City in China. Aerosol Air Qual. Res. 2012, 12, 39–48. [Google Scholar] [CrossRef] [Green Version]
- Hu, J.; Wu, L.; Zheng, B.; Zhang, Q.; He, K.; Chang, Q.; Li, X.; Yang, F.; Ying, Q.; Zhang, H. Source Contributions and Regional Transport of Primary Particulate Matter in China. Environ. Pollut. 2015, 207, 31–42. [Google Scholar] [CrossRef]
- Xue, H.; Liu, G.; Zhang, H.; Hu, R.; Wang, X. Similarities and Differences in Pm10 and Pm2.5 Concentrations, Chemical Compositions and Sources in Hefei City, China. Chemosphere 2019, 220, 760–765. [Google Scholar] [CrossRef]
- Sicard, P.; Lesne, O.; Alexandre, N.; Mangin, A.; Collomp, R. Air Quality Trends and Potential Health Effects—Development of an Aggregate Risk Index. Atmos. Environ. 2011, 45, 1145–1153. [Google Scholar] [CrossRef]
- Cao, G.; Zhang, X.; Gong, S.; An, X.; Wang, Y. Emission Inventories of Primary Particles and Pollutant Gases for China. Chin. Sci. Bull. 2011, 56, 781–788. [Google Scholar] [CrossRef] [Green Version]
- Cao, J.; Shen, Z.; Chow, J.C.; Qi, G.; Watson, J.G. Seasonal Variations and Sources of Mass and Chemical Composition for Pm10 Aerosol in Hangzhou, China. Particuology 2009, 7, 161–168. [Google Scholar] [CrossRef]
- Fu, B.J.; Zhuang, X.L.; Jiang, G.B.; Shi, J.B.; Lu, Y.H. Environmental Problems and Challenge in China. Environ. Sci. Technol. 2007, 41, 7597–7602. [Google Scholar] [CrossRef] [PubMed] [Green Version]
- Lu, Q.; Zheng, J.; Ye, S.; Shen, X.; Yuan, Z.; Yin, S. Emission Trends and Source Characteristics of So2, Nox, Pm10 and Vocs in the Pearl River Delta Region from 2000 to 2009. Atmos. Environ. 2013, 76, 11–20. [Google Scholar] [CrossRef]
- Erickson, L.E.; Newmark, G.L.; Higgins, M.J.; Wang, Z. Nitrogen Oxides and Ozone in Urban Air: A Review of 50 Plus Years of Progress. Environ. Prog. Sustain. Energy 2020, 39, e13484. [Google Scholar] [CrossRef]
- Brahmasrene, T.; Lee, J.W. Assessing the Dynamic Impact of Tourism, Industrialization, Urbanization, and Globalization on Growth and Environment in Southeast Asia. Int. J. Sustain. Dev. World Ecol. 2016, 24, 362–371. [Google Scholar] [CrossRef]
- Xu, S.C.; Miao, Y.M.; Gao, C.; Long, R.Y.; Chen, H.; Zhao, B.; Wang, S.X. Regional Differences in Impacts of Economic Growth and Urbanization on Air Pollutants in China Based on Provincial Panel Estimation. J. Clean. Prod. 2019, 208, 340–352. [Google Scholar] [CrossRef]
- Lee, S.; Oh, D.-W. Economic Growth and the Environment in China: Empirical Evidence Using Prefecture Level Data. China Econ. Rev. 2015, 36, 73–85. [Google Scholar] [CrossRef]
- Fan, H.; Zhao, C.; Yang, Y. A Comprehensive Analysis of the Spatio-Temporal Variation of Urban Air Pollution in China During 2014–2018. Atmos. Environ. 2020, 220, 117066. [Google Scholar] [CrossRef]
- Zheng, C.; Zhao, C.; Li, Y.; Wu, X.; Zhang, K.; Gao, J.; Qiao, Q.; Ren, Y.; Zhang, X.; Chai, F. Spatial and Temporal Distribution of No2 and So2 in Inner Mongolia Urban Agglomeration Obtained from Satellite Remote Sensing and Ground Observations. Atmos. Environ. 2018, 188, 50–59. [Google Scholar] [CrossRef] [Green Version]
- Guo, J.; Zhao, M.; Xue, P.; Liang, X.; Fan, G.; Ding, B.; Liu, J.; Liu, J. New Indicators for Air Quality and Distribution Characteristics of Pollutants in China. Build. Environ. 2020, 172, 106723. [Google Scholar] [CrossRef]
- Liang, D.; Wang, Y.Q.; Wang, Y.J.; Ma, C. National Air Pollution Distribution in China and Related Geographic, Gaseous Pollutant, and Socio-Economic Factors. Environ. Pollut. 2019, 250, 998–1009. [Google Scholar] [CrossRef] [PubMed]
- Luo, J.; Du, P.; Samat, A.; Xia, J.; Che, M.; Xue, Z. Spatiotemporal Pattern of Pm2.5 Concentrations in Mainland China and Analysis of Its Influencing Factors Using Geographically Weighted Regression. Sci. Rep. 2017, 7, 40607. [Google Scholar] [CrossRef] [PubMed]
- Shen, Y.; Zhang, L.; Fang, X.; Ji, H.; Li, X.; Zhao, Z. Spatiotemporal Patterns of Recent Pm2.5 Concentrations over Typical Urban Agglomerations in China. Sci. Total Environ. 2019, 655, 13–26. [Google Scholar] [CrossRef] [PubMed]
- Li, H.; Yang, S.; Zhang, J.; Qian, Y. Coal-Based Synthetic Natural Gas (Sng) for Municipal Heating in China: Analysis of Haze Pollutants and Greenhouse Gases (Ghgs) Emissions. J. Clean. Prod. 2016, 112, 1350–1359. [Google Scholar] [CrossRef]
- Wang, G.; Deng, J.; Zhang, Y.; Zhang, Q.; Duan, L.; Hao, J.; Jiang, J. Air Pollutant Emissions from Coal-Fired Power Plants in China over the Past Two Decades. Sci. Total Environ. 2020, 741, 140326. [Google Scholar] [CrossRef] [PubMed]
- Yang, X.; Teng, F. Air Quality Benefit of China’s Mitigation Target to Peak Its Emission by 2030. Clim. Policy 2018, 18, 99–110. [Google Scholar] [CrossRef]
- Wu, Z.Y.; McGoogan, J.M. Characteristics of and Important Lessons from the Coronavirus Disease 2019 (Covid-19) Outbreak in China Summary of a Report of 72,314 Cases from the Chinese Center for Disease Control and Prevention. JAMA J. Am. Med. Assoc. 2020, 323, 1239–1242. [Google Scholar] [CrossRef]
- Wang, S.; Yu, R.; Shen, H.; Wang, S.; Hu, Q.; Cui, J.; Yan, Y.; Huang, H.; Hu, G. Chemical Characteristics, Sources, and Formation Mechanisms of Pm2.5 before and During the Spring Festival in a Coastal City in Southeast China. Environ. Pollut. 2019, 251, 442–452. [Google Scholar] [CrossRef]
- Feng, J.; Sun, P.; Hu, X.; Zhao, W.; Wu, M.; Fu, J. The Chemical Composition and Sources of Pm2.5 During the 2009 Chinese New Year’s Holiday in Shanghai. Atmos. Res. 2012, 118, 435–444. [Google Scholar] [CrossRef]
- Singh, A.; Pant, P.; Pope, F.D. Air Quality During and after Festivals: Aerosol Concentrations, Composition and Health Effects. Atmos. Res. 2019, 227, 220–232. [Google Scholar] [CrossRef]
- Song, Y.; Wan, X.; Bai, S.; Guo, D.; Ren, C.; Zeng, Y.; Li, Y.; Li, X. The Characteristics of Air Pollutants During Two Distinct Episodes of Fireworks Burning in a Valley City of North China. PLoS ONE 2017, 12, e0168297. [Google Scholar] [CrossRef]
- Wang, Y.; Zhuang, G.; Xu, C.; An, Z. The Air Pollution Caused by the Burning of Fireworks During the Lantern Festival in Beijing. Atmos. Environ. 2007, 41, 417–431. [Google Scholar] [CrossRef]
- Yao, L.; Wang, D.; Fu, Q.; Qiao, L.; Wang, H.; Li, L.; Sun, W.; Li, Q.; Wang, L.; Yang, X.; et al. The Effects of Firework Regulation on Air Quality and Public Health During the Chinese Spring Festival from 2013 to 2017 in a Chinese Megacity. Environ. Int. 2019, 126, 96–106. [Google Scholar] [CrossRef]
- Xu, H.; Yan, C.; Fu, Q.; Xiao, K.; Yu, Y.; Han, D.; Wang, W.; Cheng, J. Possible Environmental Effects on the Spread of Covid-19 in China. Sci. Total Environ. 2020, 731, 139211. [Google Scholar] [CrossRef] [PubMed]
- Li, L.; Li, Q.; Huang, L.; Wang, Q.; Zhu, A.; Xu, J.; Liu, Z.; Li, H.; Shi, L.; Li, R.; et al. Air Quality Changes During the Covid-19 Lockdown over the Yangtze River Delta Region: An Insight into the Impact of Human Activity Pattern Changes on Air Pollution Variation. Sci. Total Environ. 2020, 732, 139282. [Google Scholar] [CrossRef] [PubMed]
- Mostafa, M.K.; Gamal, G.; Wafiq, A. The Impact of Covid 19 on Air Pollution Levels and Other Environmental Indicators—A Case Study of Egypt. J. Environ. Manag. 2021, 277, 111496. [Google Scholar] [CrossRef] [PubMed]
- Ju, M.J.; Oh, J.; Choi, Y.-H. Changes in Air Pollution Levels after Covid-19 Outbreak in Korea. Sci. Total Environ. 2021, 750, 141521. [Google Scholar] [CrossRef] [PubMed]
- Lovrić, M.; Pavlović, K.; Vuković, M.; Grange, S.K.; Haberl, M.; Kern, R. Understanding the True Effects of the Covid-19 Lockdown on Air Pollution by Means of Machine Learning. Environ. Pollut. 2020, in press. [Google Scholar]
- Xiang, J.; Austin, E.; Gould, T.; Larson, T.; Shirai, J.; Liu, Y.; Marshall, J.; Seto, E. Impacts of the Covid-19 Responses on Traffic-Related Air Pollution in a Northwestern US City. Sci. Total Environ. 2020, 747, 141325. [Google Scholar] [CrossRef]
- Le, T.H.; Wang, Y.; Liu, L.; Yang, J.N.; Yung, Y.L.; Li, G.H.; Seinfeld, J.H. Unexpected Air Pollution with Marked Emission Reductions During the Covid-19 Outbreak in China. Science 2020, 369, 702–706. [Google Scholar] [CrossRef]
- Huang, G.; Brown, P.E. Population-Weighted Exposure to Air Pollution and Covid-19 Incidence in Germany. Spat. Stat. 2021, 41, 100480. [Google Scholar] [CrossRef] [PubMed]
- Travaglio, M.; Yu, Y.; Popovic, R.; Selley, L.; Leal, N.S.; Martins, L.M. Links between Air Pollution and Covid-19 in England. Environ. Pollut. 2021, 268, 115859. [Google Scholar] [CrossRef] [PubMed]
- Monasterolo, I.; Billio, M.; Battiston, S. The Importance of Compound Risk in the Nexus of Covid-19, Climate Change and Finance; Working Papers No. 2020; Ca’ Foscari University of Venice: Venice, Italy, 2020; p. 15. [Google Scholar]
- Mofijur, M.; Fattah, I.M.R.; Alam, M.A.; Islam, A.B.M.S.; Ong, H.C.; Rahman, S.M.A.; Najafi, G.; Ahmed, S.F.; Uddin, M.A.; Mahlia, T.M.I. Impact of Covid-19 on the Social, Economic, Environmental and Energy Domains: Lessons Learnt from a Global Pandemic. Sustain. Prod. Consum. 2021, 26, 343–359. [Google Scholar] [CrossRef]
- Van Dam, Y.K.; Webbink, J.F. Reflecting on Reflections on Covid-19. Cent. Eur. Rev. Econ. Manag. 2020, 4, 7–19. [Google Scholar]
- Leal Filho, W.; Brandli, L.L.; Salvia, A.L.; Rayman-Bacchus, L.; Platje, J. Covid-19 and the Un Sustainable Development Goals: Threat to Solidarity or an Opportunity? Sustainability 2020, 12, 5343. [Google Scholar] [CrossRef]
- Asare Vitenu-Sackey, P.; Barfi, R. The Impact of Covid-19 Pandemic on the Global Economy: Emphasis on Poverty Alleviation and Economic Growth. Econ. Financ. Lett. 2021, 8, 32–43. [Google Scholar] [CrossRef]
- Ching, J.; Kajino, M. Rethinking Air Quality and Climate Change after Covid-19. Int. J. Environ. Res. Public Health 2020, 17, 5167. [Google Scholar] [CrossRef]
- Sicard, P.; de Marco, A.; Agathokleous, E.; Feng, Z.; Xu, X.; Paoletti, E.; Rodriguez, J.J.D.; Calatayud, V. Amplified Ozone Pollution in Cities During the Covid-19 Lockdown. Sci. Total Environ. 2020, 735, 139542. [Google Scholar] [CrossRef]
- Wolff, G.T.; Kahlbaum, D.F.; Heuss, J.M. The Vanishing Ozone Weekday/Weekend Effect. J. Air Waste Manag. Assoc. 2013, 63, 292–299. [Google Scholar] [CrossRef] [Green Version]
- Huang, X.; Ding, A.; Gao, J.; Zheng, B.; Zhou, D.; Qi, X.; Tang, R.; Wang, J.; Ren, C.; Nie, W.; et al. Enhanced Secondary Pollution Offset Reduction of Primary Emissions During Covid-19 Lockdown in China. Natl. Sci. Rev. 2020. [Google Scholar] [CrossRef]
- Zhang, H.; Xie, B.; Zhao, S.-Y.; Chen, Q. Pm2.5 and Tropospheric O3 in China and an Analysis of the Impact of Pollutant Emission Control. Adv. Clim. Chang. Res. 2014, 5, 136–141. [Google Scholar] [CrossRef]
- Yang, Y.; Ren, L.; Li, H.; Wang, H.; Wang, P.; Chen, L.; Yue, X.; Liao, H. Fast Climate Responses to Aerosol Emission Reductions During the Covid-19 Pandemic. Geophys. Res. Lett. 2020, 47, e2020GL089788. [Google Scholar] [CrossRef]
- Colwell, R. Global Climate Change and Infectious Diseases. Emerg. Infect. Dis. 1998, 4, 451–452. [Google Scholar] [CrossRef] [PubMed] [Green Version]
- Khasnis, A.A.; Nettleman, M.D. Global Warming and Infectious Disease. Arch. Med. Res. 2005, 36, 689–696. [Google Scholar] [CrossRef] [PubMed]
- O’Reilly, K.M.; Auzenbergs, M.; Jafari, Y.; Liu, Y.; Flasche, S.; Lowe, R. Effective Transmission across the Globe: The Role of Climate in Covid-19 Mitigation Strategies. Lancet Planet. Health 2020, 4, e172. [Google Scholar] [CrossRef]
Figure 1.
The average concentration of Air Quality Index (AQI) and the concentration of major air pollutants in Beijing–Tianjin–Hebei (BTH), Yangtze River Delta (YRD), Pearl River Delta (PRD), Hubei except Wuhan (Hb (EWh)), Wuhan (Wh) and Around Hubei (AH) during the study period of 2015 to 2020. (The unit of CO concentration is mg·m−3, and the unit of other air pollutants is μg·m−3.).

Figure 2.
According to the Chinese lunar month division time period, the monthly average concentration data are shown for AQI (a), PM10 (b), PM2.5 (c), CO (d), O3 (e), NO2 (f) and SO2 (g) for the five study periods from 2015 to 2020, in Beijing, Tianjin, Hebei, Yangtze River Delta, Pearl River Delta, and Hubei and surrounding provinces (Same unit as Figure 1). Dotted lines separate the periods of successive years.

Figure 3.
Distribution of circulation: (a,c,e) 2017 on Period 2, (b,d,f) 2020 on Period 2. Circulation at 500 hPa (a,b), geopotential height (contours; m), air temperature (shaded; °C) and wind (vectors; m/s). Relative humidity at 750 hPa (c,d), distribution of sea level pressure (e,f), pressure (contours; hPa), air temperature (shaded; °C), and wind (vectors; m/s).

Figure 4.
The percentage change of the monthly average of AQI from Period 1 2019 to Periods 2–5 2017 (a,c,e,g,i) and 2020 (b,d,f,h,j) compared to the 5-year average for the same period of 2015–2020. A positive value indicates an increase in percentage, and a negative value shows the opposite.
Figure 4.
The percentage change of the monthly average of AQI from Period 1 2019 to Periods 2–5 2017 (a,c,e,g,i) and 2020 (b,d,f,h,j) compared to the 5-year average for the same period of 2015–2020. A positive value indicates an increase in percentage, and a negative value shows the opposite.

Figure 5.
The contribution of pandemic control measures to the concentration of air pollutants (M) of the AQI and air pollutants before and after the 2020 pandemic. If M > 0, pandemic control measures led to the reduction of air pollutants; if M < 0, on the contrary, the greater the absolute value of M, the greater the contribution.


Table 1.
The 2020 pandemic occurred near the time of the Spring Festival. To take account of the impact of the Chinese New Year holiday on the changes in pollutants caused by the pandemic, we extracted the research period corresponding to the outbreak stage of the pandemic in the past 5 years and 2020. We used five pandemic research stages according to the lunar month. The first month is referred to as Period 1, the second month is referred to as Period 2, and the fifth month is referred to as Period 5. The second column in the table shows the specific date of each period in the occurrence stage of Covid-19.
| Study Period | Date |
|---|---|
| Period 1 | 26 December 2019–24 January 2020 |
| Period 2 | 25 January 2020–22 February 2020 |
| Period 3 | 23 February 2020–23 March 2020 |
| Period 4 | 24 March 2020–22 April 2020 |
| Period 5 | 23 April 2020–22 May 2020 |
Table 2.
Control measures taken by local governments during COVID-19. Data were taken from local government networks (for example, Beijing, http://www.beijing.gov.cn/).
Table 2.
Control measures taken by local governments during COVID-19. Data were taken from local government networks (for example, Beijing, http://www.beijing.gov.cn/).
| Study Period | Period 1 | Period 2 | Period 3 | Period 4 | Period 5 | |
|---|---|---|---|---|---|---|
| Location | ||||||
| Around Hubei | None | Traffic suspension; Delay the resumption of work; No school; Village isolation. | Traffic resumption; To promote the resumption of work and production; Part of scenic spots open. | The normal life order was restored in an orderly manner, and work was resumed in an all-round way; Schools open in batches. | Restore full order to life. | |
| Hubei | None | All buses, trains and flights were stopped; Industrial was suspended; The community takes lockdown measures. | Key projects to promote the resumption of work; community, village closed control. | Enterprises have gradually resumed work; Traffic was restored in different regions; School extension; Some communities and villages have been closed off. | The living order was restored in an orderly manner; Schools open in batches. | |
| Beijing-Tianjin-Hebei | None | Traffic control; some communities are closed; Resumption of work was delayed. | Return to work and production; part of the park open; part of the community, village closed management. | Current limit management in scenic spots to increase an operating rate; All kinds of schools are postponed. | Restore the order of life in an all-round way. | |
| Yangtze River Delta | None | Some traffic has been suspended; some communities have closed management; and the resumption of work has been postponed. | Enterprises have gradually resumed work; traffic has been partially restored; some communities have been closed off. | Comprehensively promote the resumption of work in enterprises; promote normal life order. | Life order was fully restored, and schools opened in batches. | |
| Pearl River Delta | None | Traffic control; Some production was suspended; some communities and villages were closed for management. | Promote the resumption of work and production; Enterprises in low-risk areas return to working; Community and villages are strictly controlled in and out. | Full resumption of work; Control overseas import. | Restore life order in an all-round way; Schools open in batches. | |
Table 3.
The year corresponding to the minimum Euclidean distance of 500 hPa, 750 hPa, and surface meteorological elements during the study period of 2020 and the same period of the previous five years. The 500 hPa meteorological elements include pressure, temperature, u, v wind field; 750 hPa is relative humidity. Surface meteorological elements include sea level pressure, temperature, u, v wind speed.
| Elements | 500 hPa | 750 hPa | Surface | |
|---|---|---|---|---|
| Date | ||||
| Per 1.F | 2019 | 2017 | 2016 | |
| Per 1.M | 2019 | 2017 | 2019 | |
| Per 1.L | 2015 | 2017 | 2019 | |
| Per 2.F | 2019 | 2016 | 2019 | |
| Per 2.M | 2019 | 2017 | 2015 | |
| Per 2.L | 2018 | 2017 | 2017 | |
| Per 3.F | 2016 | 2016 | 2017 | |
| Per 3.M | 2019 | 2015 | 2017 | |
| Per 3.L | 2017 | 2018 | 2017 | |
| Per 4.F | 2016 | 2016 | 2017 | |
| Per 4.M | 2017 | 2018 | 2018 | |
| Per 4.L | 2017 | 2015 | 2017 | |
| Per 5.F | 2019 | 2015 | 2017 | |
| Per 5.N | 2019 | 2015 | 2017 | |
| Per 5.L | 2019 | 2016 | 2017 | |
Publisher’s Note: MDPI stays neutral with regard to jurisdictional claims in published maps and institutional affiliations. |
© 2021 by the authors. Licensee MDPI, Basel, Switzerland. This article is an open access article distributed under the terms and conditions of the Creative Commons Attribution (CC BY) license (http://creativecommons.org/licenses/by/4.0/).
Share and Cite
MDPI and ACS Style
Dong, L.; Chen, B.; Huang, Y.; Song, Z.; Yang, T. Analysis on the Characteristics of Air Pollution in China during the COVID-19 Outbreak. Atmosphere 2021, 12, 205. https://0-doi-org.brum.beds.ac.uk/10.3390/atmos12020205
AMA Style
Dong L, Chen B, Huang Y, Song Z, Yang T. Analysis on the Characteristics of Air Pollution in China during the COVID-19 Outbreak. Atmosphere. 2021; 12(2):205. https://0-doi-org.brum.beds.ac.uk/10.3390/atmos12020205
Chicago/Turabian StyleDong, Li, Bin Chen, Yue Huang, Zhihao Song, and Tingting Yang. 2021. "Analysis on the Characteristics of Air Pollution in China during the COVID-19 Outbreak" Atmosphere 12, no. 2: 205. https://0-doi-org.brum.beds.ac.uk/10.3390/atmos12020205
Note that from the first issue of 2016, this journal uses article numbers instead of page numbers. See further details here.