Article

Evolution of Gaseous and Particulate Pollutants in the Air: What Changed after Five Lockdown Weeks at a Southwest Atlantic European Region (Northwest of Spain) Due to the SARS-CoV-2 Pandemic?

by
Jorge Moreda-Piñeiro
1,*,
Joel Sánchez-Piñero
1,
María Fernández-Amado
1,
Paula Costa-Tomé
2,
Nuria Gallego-Fernández
2,
María Piñeiro-Iglesias
1,
Purificación López-Mahía
1 and
Soledad Muniategui-Lorenzo
1
1
Grupo Química Analítica Aplicada (QANAP), Department of Chemistry, Faculty of Sciences, Instituto Universitario de Medio Ambiente (IUMA), Centro de Investigaciones Científicas Avanzadas (CICA), University of A Coruña, Campus de A Coruña, s/n, 15071 A Coruña, Spain
2
Rede de Calidade do Aire de Galicia, MeteoGalicia, Subdirección Xeral de Meteoroloxía e Cambio Climático, Dirección Xeral de Calidade Ambiental e Cambio Climático, Consellería de Medio Ambiente, Territorio e Vivenda, Xunta de Galicia, Edificio Administrativo de San Lázaro, 15781 Santiago de Compostela, Spain
*
Author to whom correspondence should be addressed.
Submission received: 7 April 2021 / Revised: 22 April 2021 / Accepted: 22 April 2021 / Published: 27 April 2021
(This article belongs to the Special Issue Coronavirus Pandemic Shutdown Effects on Urban Air Quality)

Abstract

:
Due to the exponential growth of the SARS-CoV-2 pandemic in Spain (2020), the Spanish Government adopted lockdown measures as mitigating strategies to reduce the spread of the pandemic from 14 March. In this paper, we report the results of the change in air quality at two Atlantic Coastal European cities (Northwest Spain) during five lockdown weeks. The temporal evolution of gaseous (nitrogen oxides, comprising NOx, NO, and NO2; sulfur dioxide, SO2; carbon monoxide, CO; and ozone, O3) and particulate matter (PM10; PM2.5; and equivalent black carbon, eBC) pollutants were recorded before (7 February to 13 March 2020) and during the first five lockdown weeks (14 March to 20 April 2020) at seven air quality monitoring stations (urban background, traffic, and industrial) in the cities of A Coruña and Vigo. The influences of the backward trajectories and meteorological parameters on air pollutant concentrations were considered during the studied period. The temporal trends indicate that the concentrations of almost all species steadily decreased during the lockdown period with statistical significance, with respect to the pre-lockdown period. In this context, great reductions were observed for pollutants related mainly to fossil fuel combustion, road traffic, and shipping emissions (−38 to −78% for NO, −22 to −69% for NO2, −26 to −75% for NOx, −3 to −77% for SO2, −21% for CO, −25 to −49% for PM10, −10 to −38% for PM2.5, and −29 to −51% for eBC). Conversely, O3 concentrations increased from +5 to +16%. Finally, pollutant concentration data for 14 March to 20 April of 2020 were compared with those of the previous two years. The results show that the overall air pollutants levels were higher during 2018–2019 than during the lockdown period.

1. Introduction

After the SARS-CoV-2 pandemic spread worldwide in 2020 [1], several European Governments implemented mitigation strategies (mainly citizen mobility restrictions and the closure of several industries). The Spanish Government imposed a lockdown on 14 March, restricting social interactions, citizen mobility, and nonessential industrial activities, to avoid the high risk of saturating the Spanish national health system [2] Two weeks later, on 30 March, a more restrictive lockdown (except for essential services such as hospitals and supply chains) was implemented until 9 April due to the growth rate of new infections (both days included) [3,4]. Since that day, measures have been softened, returning to the same restrictions as implemented in the first stage. During lockdown, citizens were only able to access public spaces to carry out essential activities (such as food and pharmaceuticals acquisition, assistance to health centers, services, and establishments). Likewise, private vehicles were only allowed access to public roads to carry out the abovementioned activities and for refueling at gas stations or service stations. Face-to-face educational activity, and the opening of museums, archives, libraries, monuments, hotel and catering, and sports and leisure activities, were suspended. Finally, the total supply of public transport was reduced by at least 50%. Nevertheless, lockdown and restrictions would be extended successively depending on the spread of the virus. These measures have had good impacts on the air quality of cities around the world, alleviating air pollutants and improving air quality during the lockdown weeks as a consequence of reductions in road traffic, shipping, and industrial activities. The effect of the SARS-CoV-2 pandemic on the air quality of several cities of Spain confirmed these findings [5,6,7,8,9,10,11,12,13,14,15]. Similar positive impacts on air quality have been reported around several European cities [11,16,17,18,19].
Despite the increasing concerns about the effect of COVID-19 on the air quality around the world (including Spain), there are no data on urban regions of the Southwest Atlantic coastal European region (northwest of Iberian Peninsula). The present study aimed to evaluate the air quality in coastal urban areas of Southwest Atlantic Europe by comparing the pre-lockdown period (7 February to 13 March) with the first five weeks of lockdown measures (Lockdowns I–III: 14 March to 20 April) adopted by the Spanish Government to mitigate the SARS-CoV-2 pandemic. Moreover, the effects of the more restrictive lockdown stage (Lockdown II: 30 March to 9 April) and the weeks before (Lockdown I: 14 March to 29 March) and after that (Lockdown III: 10 April to 20 April) restrictive lockdown stage on the air quality were also studied.

2. Materials and Methods

2.1. Sampling Site Details

The evolutions of levels of gaseous (nitrogen monoxide, NO; nitrogen dioxide, NO2; nitrogen oxides, NOx; sulfur dioxide, SO2; carbon monoxide, CO; and ozone, O3) and particulate matter (PM10; PM2.5; and equivalent black carbon, eBC) air pollutants were studied from 7 February to 20 April 2020. Data were collected at several coastal urban backgrounds, and traffic and industrial air quality monitoring stations in the cities of A Coruña and Vigo (northwestern part of the Iberian Peninsula). The populations of A Coruña and Vigo were 245711 and 295364 inhabitants, respectively [20]. The climate of coastal sites is humid oceanic (low thermal oscillation and abundant rainfall). North-westerly winds are dominant and generally carry relatively clean air from the sea, but other wind directions are also recorded, with a significant contribution to air pollution levels at this site (see Section 2.3).
Two traffic air quality monitoring stations in Vigo (Vigo-Coia, V-C; and Vigo-Lope, V-L), two urban background air quality monitoring stations in A Coruña (A Coruña-Torre, AC-T; and A Coruña-Liáns, AC-L), and three industrial air quality monitoring stations (A Coruña-Grela, AC-G; Vigo-PSA East, V-PSAE; and Vigo-PSA West, V-PSAW) are shown in Figure S1. Coordinates and pollutants monitored at each air monitoring station are summarized in Table 1.

2.2. Monitoring Techniques and Data Quality

Concentrations of NO, NO2, NOx, SO2, CO, O3, PM2.5, and PM10 were monitored according to the existing European standards or equivalent ones: EN 14211 for NO, NO2, and NOx, based on chemiluminescence detection [21]; EN 14212 for SO2, based on an ultraviolet fluorescence spectrophotometer [22]; EN 14626 for CO, based on an infrared spectrophotometer [23] and EN 14625 for O3, based on ultraviolet spectrophotometry [24], were used. The methods used for PM10 and PM2.5 monitoring were based on real-time beta ray attenuation in the traffic and urban background stations, whereas tapered element oscillating microbalances (TEOM) were used in the industrial sites [25,26].
Optical attenuation techniques, based on light absorption by atmospheric aerosols deposited on a filter tape, have been successfully applied for black carbon (BC) measurements [27,28,29,30]. In addition, the term equivalent black carbon (eBC) is used in the present study as recommended for quantitative BC measurements using optical attenuation methods [31]. In this research, eBC total mass concentrations (eBCT) were monitored using a multi-wavelength aethalometer based on light attenuation by the aerosol particles measured at 880 nm. Moreover, light attenuation measurements at 950 and 470 nm were also used to monitor the eBC concentration derived from fossil fuel emissions (eBCF) and biomass burning (eBCB), respectively [32].
Equipment maintenances and periodic verifications and calibrations were strictly followed in the monitoring networks under study. All the data were carefully checked for measurement errors, and missing data were not taken into the calculation of averages.

2.3. Meteorological Data, Air Mass Trajectories, Wind Roses, and Biomass Burning Episodes

Due to the unavailability of meteorological data at air quality monitoring stations, meteorological data used to characterize the studied period were provided by the nearest suitable meteorological databases available at: Castrillón (43°20′54″ N, 08°23′50″ W), belonging to the air quality monitoring network of the Council of A Coruña [33] and Vigo-Campus (42°10′12″ N, 08°41′10″ W), belonging to the air quality monitoring network of the Xunta de Galicia [34]. Daily data of air temperature, relative humidity, solar radiation, pressure, amount of precipitation, and wind speed at Castrillón and Vigo-Campus before (7 February to 13 March) and during (14 March to 20 April) the lockdown period are shown in Table S1 and Figure S2 Although several statistically significant differences (at a 95% confidence level; p-values < 0.05; Table S1) were found for temperature and atmospheric pressure at A Coruña; and for temperature, relative humidity, and atmospheric pressure at Vigo, a low variation in those variables before and during the lockdown period in the cities of A Coruña and Vigo was found; thus, a weak influence on pollutants levels could be expected due to temperature, relative humidity, and atmospheric pressure changes during the studied period. Large wind speed, rainfall, and solar radiation variations during the pre-lockdown period were observed (Table S1), which could explain the high variations in NOx and SO2 concentration during the pre-lockdown period (Figure 1a–c). Wind speed, rainfall amount, and solar radiation showed relevant differences at both meteorological observatories before and during the lockdown period. The average wind speed and rainfall were reduced up to −44 and −12% at Castrillón observatory during the lockdown period, while solar radiation increased up to +39%. At Vigo-Campus observatory, wind speed and rainfall also decreased, up to −8 and −26%, respectively, whereas solar radiation increased up to +46% during the lockdown period. Additionally, fluctuations for most meteorological parameters were registered at both observatories (Table S1 and Figure S2).
The characteristics of air masses during the sampling period were calculated at 750, 1500, and 2500 m above mean sea level (AMSL), 120 h before the arrival time to the studied sites by using the NOAA Hybrid Single-particle Langrangian Integrated Trajectory Model (HYSPLIT) model [35,36] Air mass trajectories data were provided by the Spanish Ministry for the Ecological Transition and the Demographic challenge [37]. According to this model, air mass samples were classified into five groups according to the trajectory of the air masses: class AO contains air masses transported from the Atlantic Ocean (North Atlantic, NA; Northwest Atlantic, NWA; Southwest Atlantic, SWA; West Atlantic, WA); class EU represents air masses with origins in central and northern parts of Europe; class MED refers to air masses transported from the Mediterranean; class NAF refers to air masses transported from North Africa; and class RE refers to local air masses. Due to the geographic position northwest of Spain, and the presence of the semi-permanent Azores high-pressure and the Icelandic low-pressure systems over the North Atlantic Ocean, major air masses from the Atlantic Ocean were observed before (86%) and during the lockdown (42%) period (Figure S3). However, the regional contribution was greater during (24%) compared to before (8%) the lockdown period. In addition, EU and MED contributions (11% EU plus 13% MED) were important during the lockdown period. The prevalence of Atlantic Ocean air masses (NWA, SWA, and WA air masses) can also be observed in the wind roses (Figure S4) during the pre-lockdown and lockdown periods. Data of Saharan dust intrusion (27–28 February and 18–24 March) and biomass burning (22 February, 24–25 February, 15 March, and 4 April) episodes were provided by the Spanish Ministry for the Ecological Transition and the Demographic challenge [37].

2.4. Data Processing

The Openair package [38] in the R statistical software environment [39] with the RStudio interface [40] was used for the treatment of data. Daily (24 h) mean concentrations were calculated for all pollutants except for CO and O3 (maximum daily 8 h rolling mean), according to European Directive 2008/50/EC [40]. Daily mean and maximum daily 8 h rolling mean values were plotted using the Timeplot function (plus smoothing) of OpenAir package for R. The ANOVA test was performed (statistical significance assessment of the differences between pollutant means before and during the lockdown period and between the different lockdown stages studied) by using the statistical package IBM SPSS Statistics 26. Levene’s test was used to evaluate the homogeneity/nonhomogeneity of variance. When the variances in the parameters were homogenous, Fisher’s F was used, whereas for nonhomogeneous variances, the Brown–Forsythe statistic (robust test of equality of means) was applied. A p-value <0.05 was considered significant at the 95% confidence level. Pearson’s coefficients (statistical package IBM SPSS Statistics 26) were calculated in order to investigate the statistically significant relationship between target pollutants and meteorological parameters.

3. Results and Discussion

As mentioned before, the effects of the lockdown period (14 March to 20 April) with respect to the pre-lockdown period (7 February to 13 March) on the air quality at several sites of the Northwest of Spain were studied. Moreover, different lockdown stages were considered in the study: (i) lockdown I (14 March to 29 March), encompassing the first two lockdown weeks; (ii) lockdown II (30 March to 9 April), including the most restrictive lockdown stage; and (iii) lockdown III (10 April to 20 April), which encompasses the following days after the most restrictive lockdown (same restrictions as lockdown I). Pollutant time plots are shown in Figure 1, Figure 2 and Figure 3, and the statistical summaries during the pre-lockdown and lockdown periods, as well as between the different lockdown stages, are shown in Tables S2 and S3 Finally, a comparison of NO, NO2, NOx, SO2, CO, O3, PM10, PM2.5, eBCT, eBCF, and eBCB levels before and during the lockdown period at several air monitoring stations is shown in Figure 4.

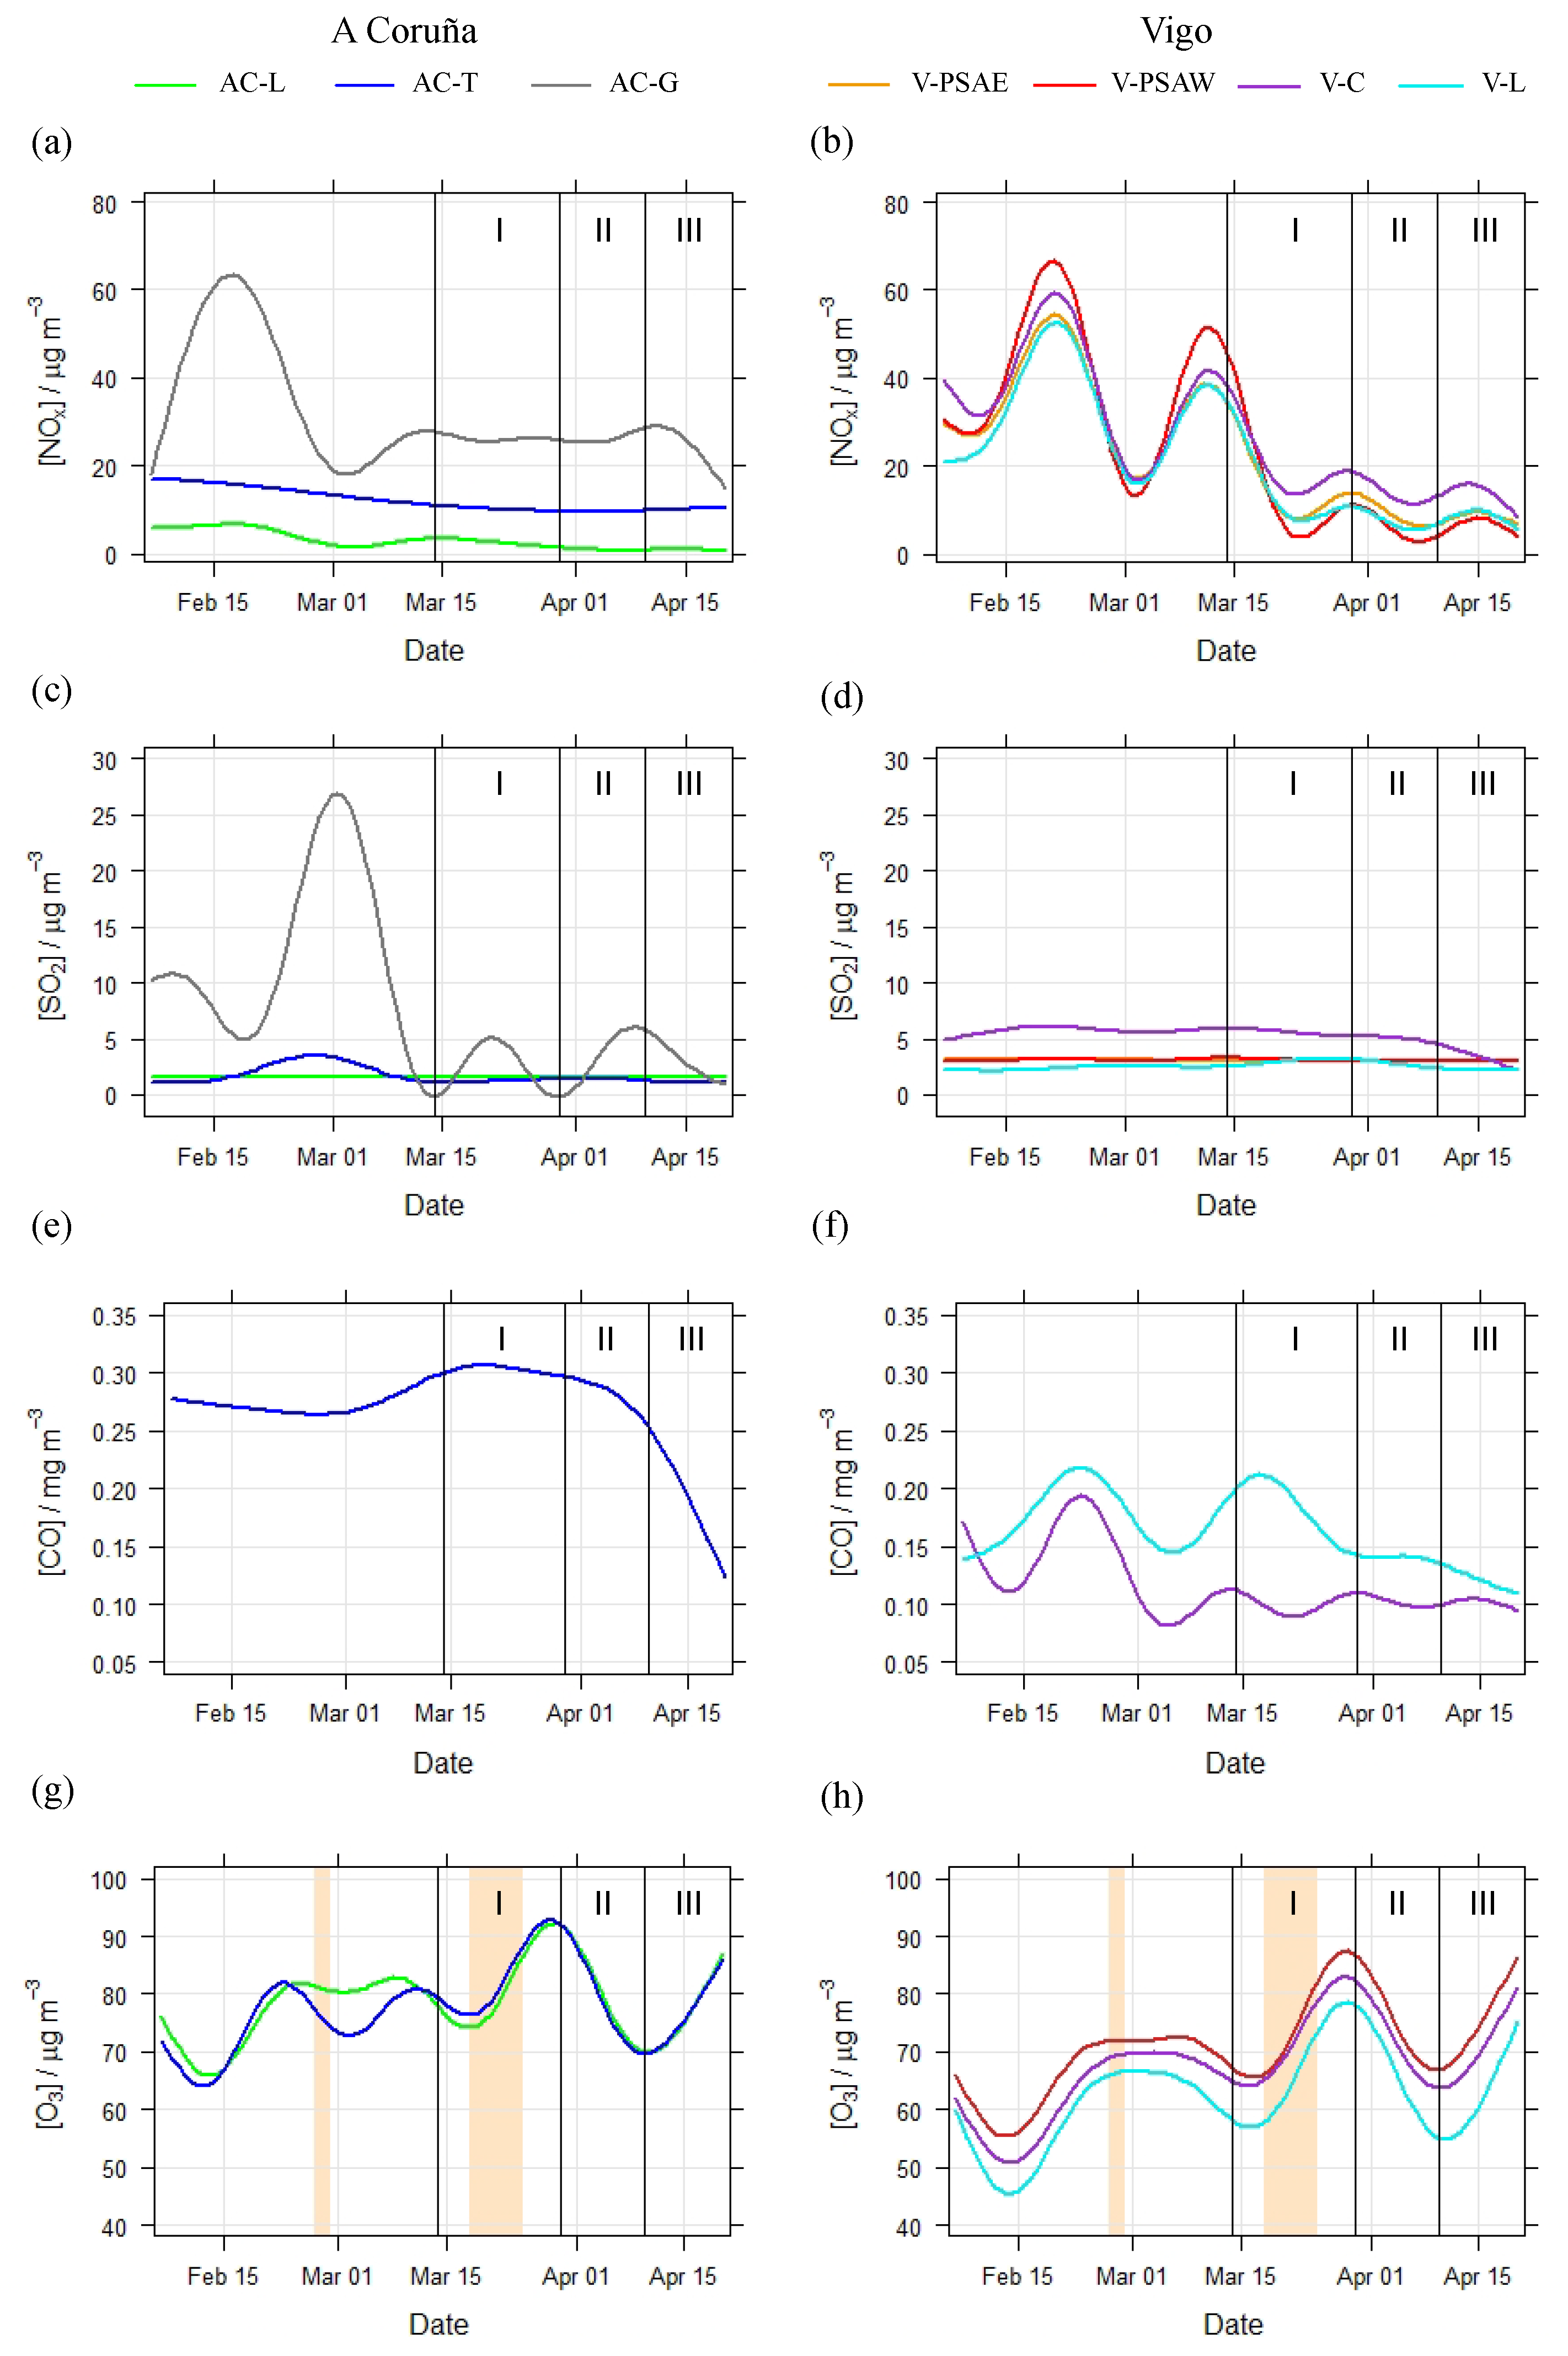
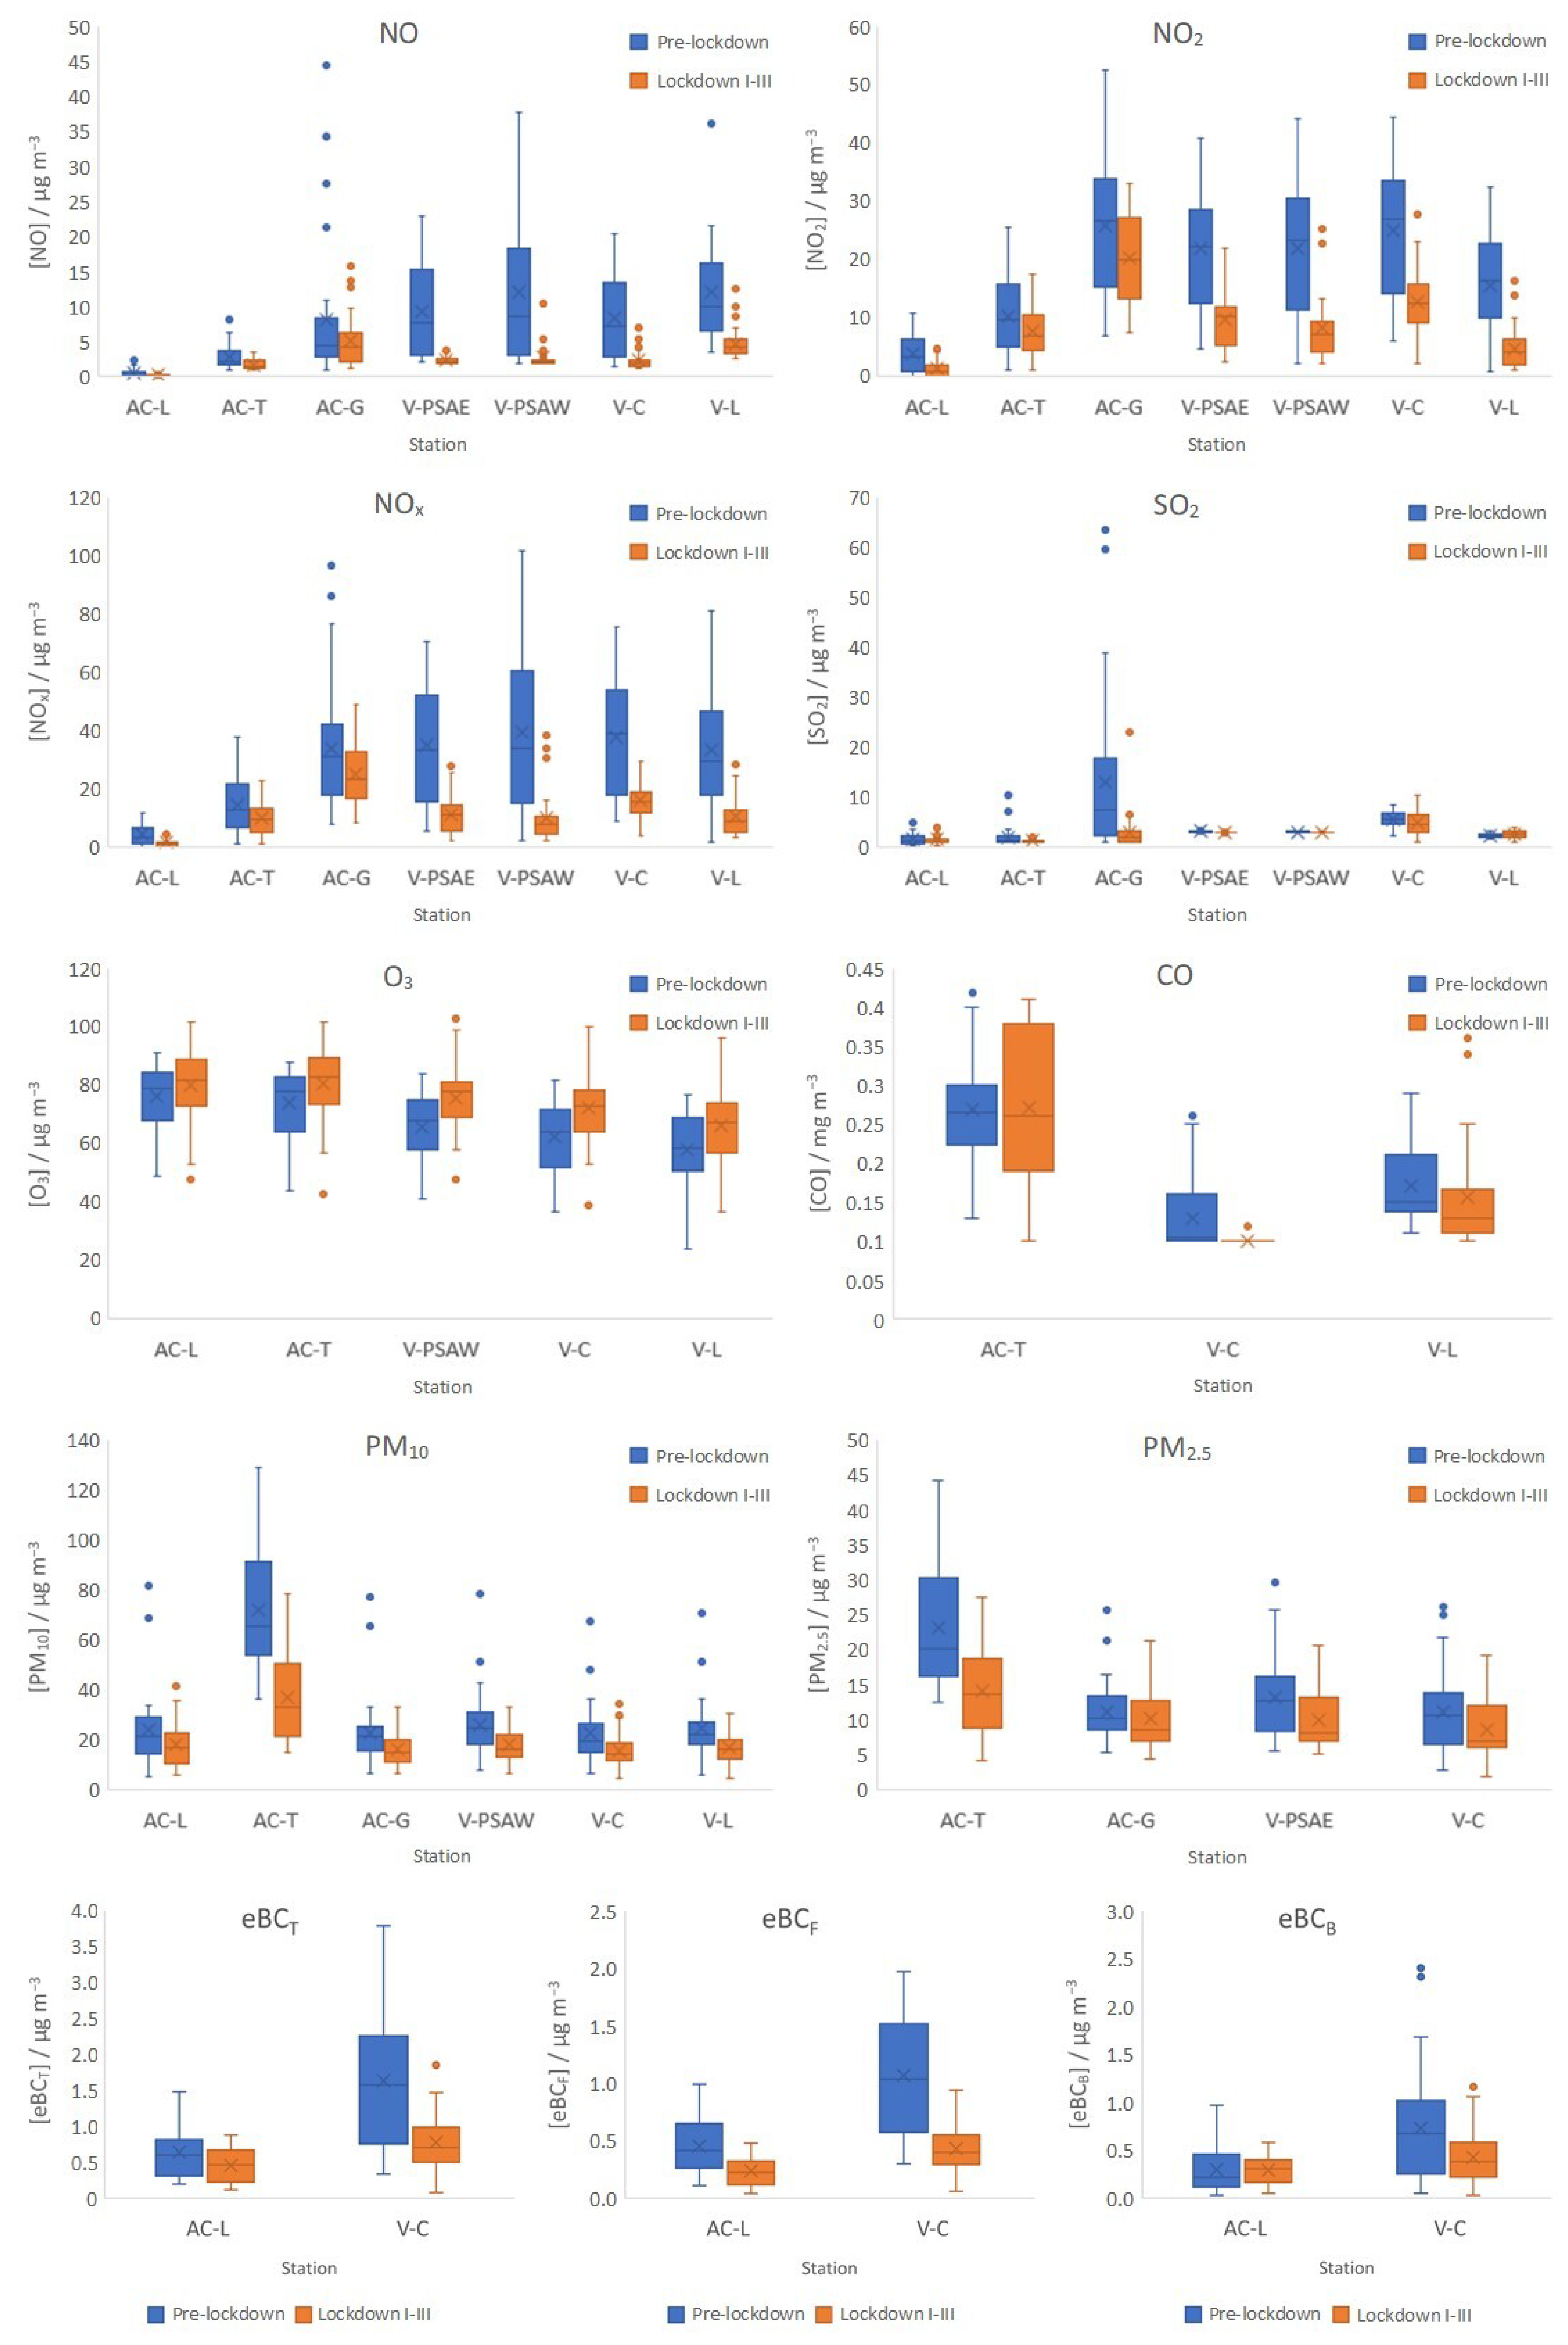
3.1. Decrease in NOx Levels during Lockdown Period

NOx levels showed a clear decrease during the lockdown period in the urban air of A Coruña (AC-T and AC-L stations) and Vigo (V-C and V-L stations), with maximum NOx levels before 14th March (pre-lockdown period) (Figure 1a,b). According to this, NOx averaged concentrations decreased by −31%, −57%, −66%, and −68% in the AC-T, V-C, AC-L, and V-L stations, respectively (Figure 4). Despite the low NOx levels measured at AC-L and AC-T (urban background stations) with respect to V-C and V-L (urban stations) (Figure 1a,b), a decreasing trend evolution was also observed (Figure 4). The road traffic/transport restrictions (diesel and gasoline combustion) because of lockdown might explain this trend. In addition, NOx concentrations recorded at AC-G, V-PSAE, and V-PSAW industrial stations showed a clear decrease (−26%, −68%, and −75% in the AC-G, PSA-E, and PSAE-W stations, respectively) as well, most likely due to reductions in combustion processes in industries and also due to reductions in road traffic/transport (Figure 1a,b). Similar reduction trends and conclusions were observed for NO and NO2 levels (Figure 4 and Figure S5) during lockdown with respect to the pre-lockdown stage.
During lockdown II, NOx decreasing trends were also observed at AC-L, V-L, V-PSAE, and V-PSAW (Figure 1a,b), with statistically significant reductions of −58%, −38%, −32%, and −56%, respectively, with respect to lockdown I (Table S2). Regarding NO, nonstatistically significant differences were found at AC-T, AC-L, V-C, AC-G, and VPSAE, but statistically significant reductions were only accounted for at V-L and V-PSAW (−30% and −38%, respectively). In addition, statistically significant reductions in NO2 levels were only accounted for at AC-L, V-PSAE, and VPSAW (−59%, −28%, and −48%, respectively), when comparing lockdowns I and II (Table S2).
Moreover, regarding the graphs (Figure 1a,b and Figure S5), no variations were observed between lockdowns II and III in all the studied areas for nitrogen oxides (NOx, NO, and NO2) (Table S3).
NOx, NO2, and NO concentrations for the lockdown period (14 March to 20 April of 2020) were compared with those of the previous two years. The results showed that the concentrations of nitrogen oxides were lower in 2020 compared with 2018–2019 (Figure 5). As can be seen, the reduction in road traffic and industrial activities during lockdown shows a direct relationship with the concentrations of nitrogen oxides.

3.2. Decrease in SO2 and CO Levels during Lockdown Period

Although the SO2 levels monitored before and during the lockdown period were lower than the daily limit value of 125 μg m−3 set in the European Directive 2008/50/EC [41] the SO2 levels showed a great reduction during the lockdown period at the traffic and industrial air quality monitoring stations of A Coruña (−77% and −38% at AC-G and AC-T, respectively) (Figure 4), while a slight decrease (Figure 1d and Figure 4) was achieved at V-PSAE (−3%). Negligible trends were found at the AC-L, V-C, V-L, and V-PSAW stations during the studied period (Figure 1c,d), probably due to the low SO2 levels recorded (daily averages < 5.6 μg m−3).
During lockdown II, the same decreasing trends were observed (Figure 1c,d). However, statistically significant differences were observed only at AC-L and V-PSAW stations (−35% and −6%, respectively) in comparison with lockdown I (Table S2). Although an increase in SO2 levels was accounted for at AC-T during lockdown II (+8%) in comparison with the lockdown I period, nonstatistically significant differences between SO2 levels were found during lockdowns I and II (Table S2). Reductions in SO2 levels (with statistical significance) were observed at AC-T and V-C (−21% and −38%, respectively) despite going back to a less restrictive scenario. Finally, the large variation in SO2 concentrations at AC-G (industrial site) before and during the lockdown period (Figure 1c) could be attributed to the start-up or shutdown of certain industries, in addition to changes in meteorological conditions.
Figure 1f shows that CO levels slightly decreased at the V-C and V-L stations during the lockdown period, but a more significant decrease could be observed at AC-T during lockdown III (Figure 1e). Nevertheless, a statistically significant difference was only found at V-C station before and during lockdown periods (reduction of −21%), according to Figure 4. A decrease of −44% was observed for CO levels at AC-T station when comparing lockdowns II and III, with statistically significant differences (Table S3). However, no more differences were appreciated when comparing lockdowns II and III.
SO2 and CO concentrations during the lockdown period (14 March to 20 April of 2020) were also compared with those of 2018–2019. As can be seen in Figure 5, low SO2 and CO concentrations were measured when lockdown measures were applied in 2020, except at V-C (for SO2) and at AC-T (for CO) for which a slight increase could be observed.

3.3. Increase in O3 Levels during Lockdown Period

Regarding O3 concentrations registered in this study, a moderate increasing trend (maximum daily 8 h rolling mean) was detected at AC-T, V-C, V-L, and V-PSAW (+9%, +16%, +14%, and +15%, respectively) (Figure 1g,h) during the lockdown period (Figure 4). This agrees with the progressive reduction in road traffic, shipping, and industrial activities (low O3 consumption by NOx oxidation); however, the increase in solar radiation (favoring the photochemical ozone formation) might have also contributed to this increase. A relationship between NOx and O3 can be observed in Figure S6 with opposite trends for the concentrations of both pollutants. In addition, it shows the influence of the meteorological parameters (temperature and relative humidity) over the observed fluctuations in the pollutant’s concentrations.
This O3 trend was not observed at the AC-L suburban background site during the studied period (Figure 1g). Despite the high reduction in NOx percentage during the lockdown period (66%) at AC-L (suburban background monitoring station), the low NOx daily-averaged concentrations (<4.4 μg m−3) involve a low reduction in NOx concentration (to 1.5 μg m−3), resulting in a negligible effect on O3 concentration (Figure 4). The same reason could be attributed to the decrease in O3 levels (between −5 to −9%) at all monitoring stations during lockdown II with respect to lockdown I (Table S2)and the low variations (between −1 to +5%) during lockdown III with respect to lockdown II (Table S3)
Finally, Figure 5 shows a decrease in O3 concentrations during the lockdown compared with 2018–2019, which is likely related to weather conditions.

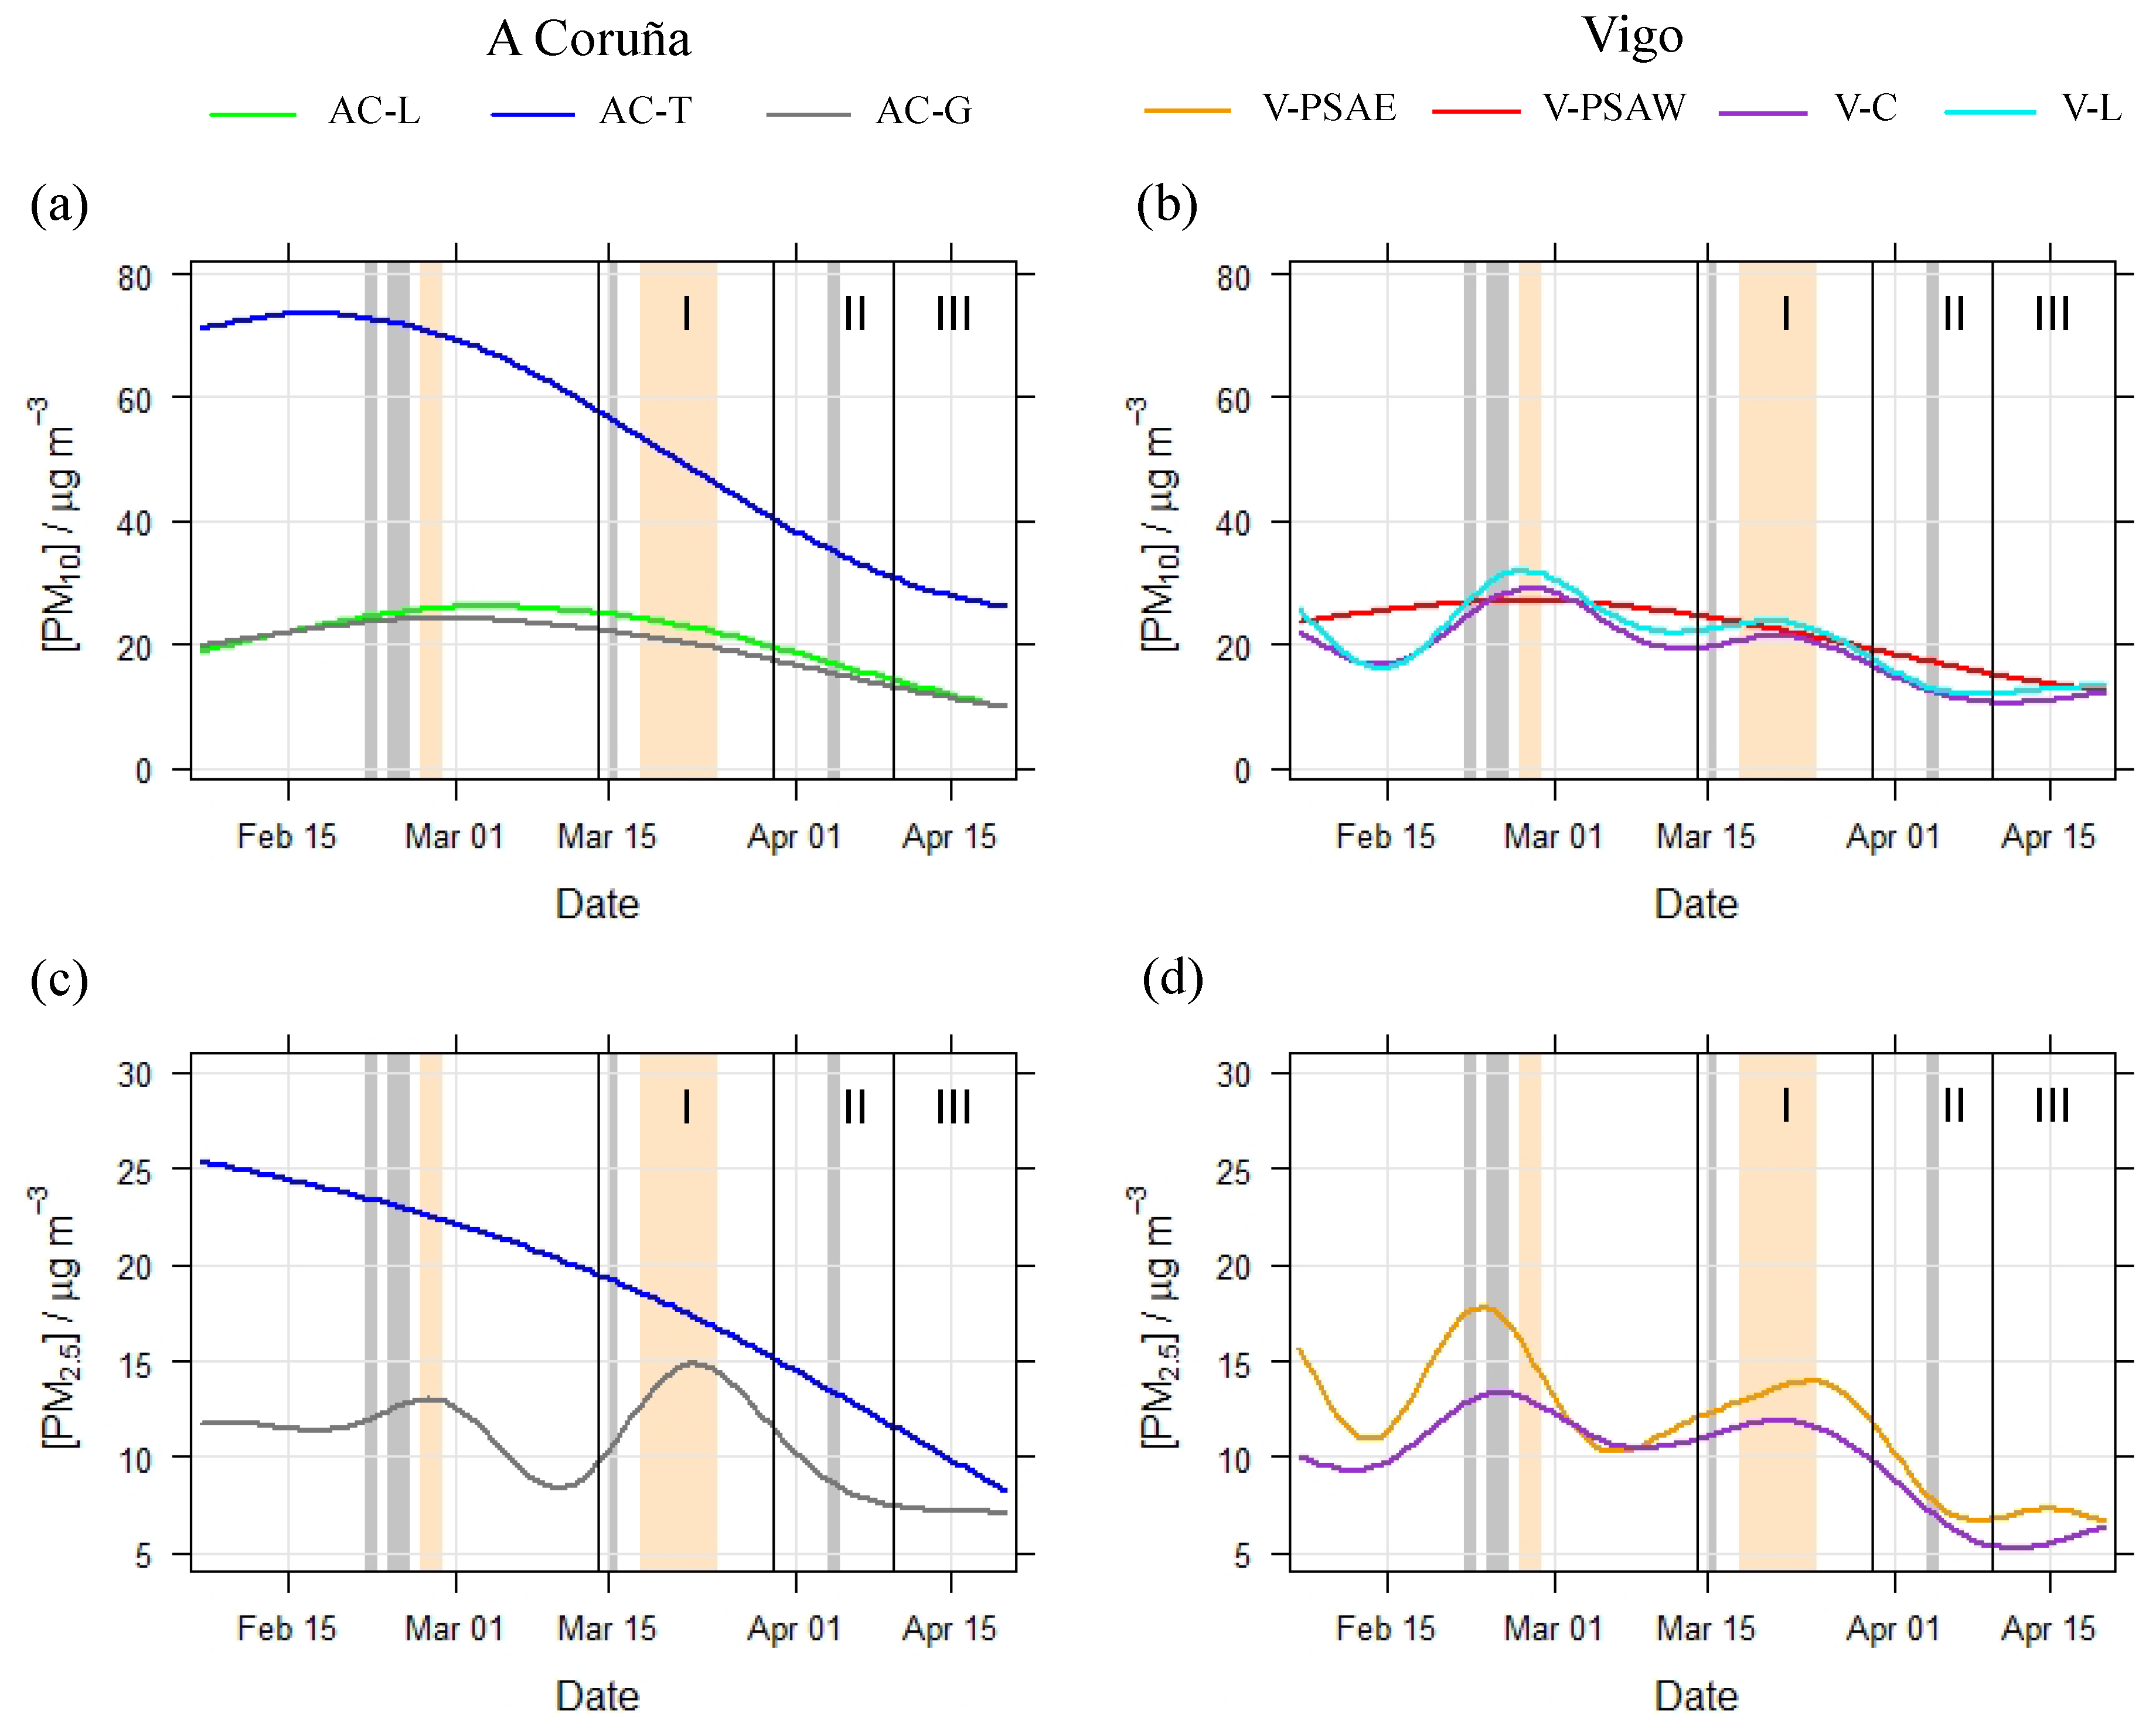
3.4. Decrease in PM10 and PM2.5 Levels during Lockdown Period

Despite the contribution of Saharan dust incursion (18–24 March), biomass burning episodes (15 March and 4 April), and regional air masses contributions (Figure S3) during the lockdown period, PM10 and PM2.5 daily-averaged concentrations showed a statistical diminution (p-values < 0.05) at all traffic, urban background, and industrial monitoring stations during the lockdown period, except for PM2.5 at AC-G (Figure 2 and Figure 4). Decreases up to −49%, −25%, −32%, −31%, −30%, and −31% in PM10 levels were recorded for AC-T, AC-L, V-C, V-L, AC-G, and V-PSAW, respectively, whereas for PM2.5 concentrations, reductions of −38%, −23%, and −24% (for AC-T, V-C, and V-PSAE respectively) were observed. During the studied period, the daily limit value of 50 μg m−3 of PM10, set by the European Directive 2008/50/EC [41], was exceeded in AC-T. In addition, 28 exceedances were detected at AC-T during the pre-lockdown period and 10 during the lockdown (7, 2, and 1 during lockdown periods I, II, and III respectively). Only a few of those exceedances could be explained by Saharan dust intrusion (2 days in the pre-lockdown period and 5 days in lockdown I) and biomass burning episodes (2 in the pre-lockdown period). Despite the decreasing trend of PM10 levels during the lockdown, PM10 exceedances at AC-T suggested that a nonanthropogenic source (not affected by the lockdown) highly contributed to the PM10 levels in the site. The important contribution of marine aerosols due to the proximity to the Atlantic Ocean at this site could explain those exceedances [42].
Regarding PM2.5 levels, there is only an annual value of 20 μg m−3 set by the European Commission’s daily reference value [41] Thus, the daily reference value of 25 μg m−3 set by the World Health Organization (WHO) was considered in this study [43]. AC-T is also the only station where this WHO reference value was exceeded during the lockdown period. There were four exceedances during the lockdown I period, corresponding to a Saharan dust intrusion episode and the day following the episode. During the pre-lockdown period, the WHO Air Quality Guidelines for PM2.5 were exceeded in the four stations where PM2.5 measurements were accomplished. As for PM10, exceedances recorded at AC-G and V-C corresponded to the Saharan dust intrusion episode (one exceedance per station). At V-PSAE, two exceedances were recorded, corresponding to a biomass burning episode (22 February) and the following day. Likewise, AC-T showed the highest number of exceedances.
Although the reduction in the number of exceedances after the lockdown cannot be used as a marker, due to the influence of the Saharan dust intrusion episode of February, the overall reduction in PM10 and PM2.5 levels might be attributed to the lockdown, explained by the high decrease in road traffic and shipping and industrial sources.
During lockdown II, the same decreasing trends were observed (Figure 2), achieving statistically significant differences between PM10 (−32%, −35%, −37%, −39%, −32%, and −38% for AC-T, AC-L, V-C, V-L, AC-G, and V-PSAW, respectively) and PM2.5 (−33%, −41%, −34%, and −40% for AC-T, V-C, AC-G, and V-PSAE, respectively) concentrations during lockdown II with respect to lockdown I (Table S2). Furthermore, PM10 and PM2.5 levels continued to decrease during lockdown III (Figure 2), especially in A Coruña, with significant differences with respect to the lockdown II period for AC-G (both PM10 and PM2.5, −34% and −24%, respectively), AC-L (PM10, −38%), and AC-T (PM2.5, −36%) (Table S3). Despite the ending of the most restrictive stage, the reduction might be explained by the absence of episodes of biomass burning or Saharan dust intrusion during lockdown III.
Regarding PM10 and PM2.5 levels during lockdown in 2020 compared with 2018–2019 (Figure 5), overall, we can observe a decrease in PM10 and PM2.5 concentrations during the lockdown.

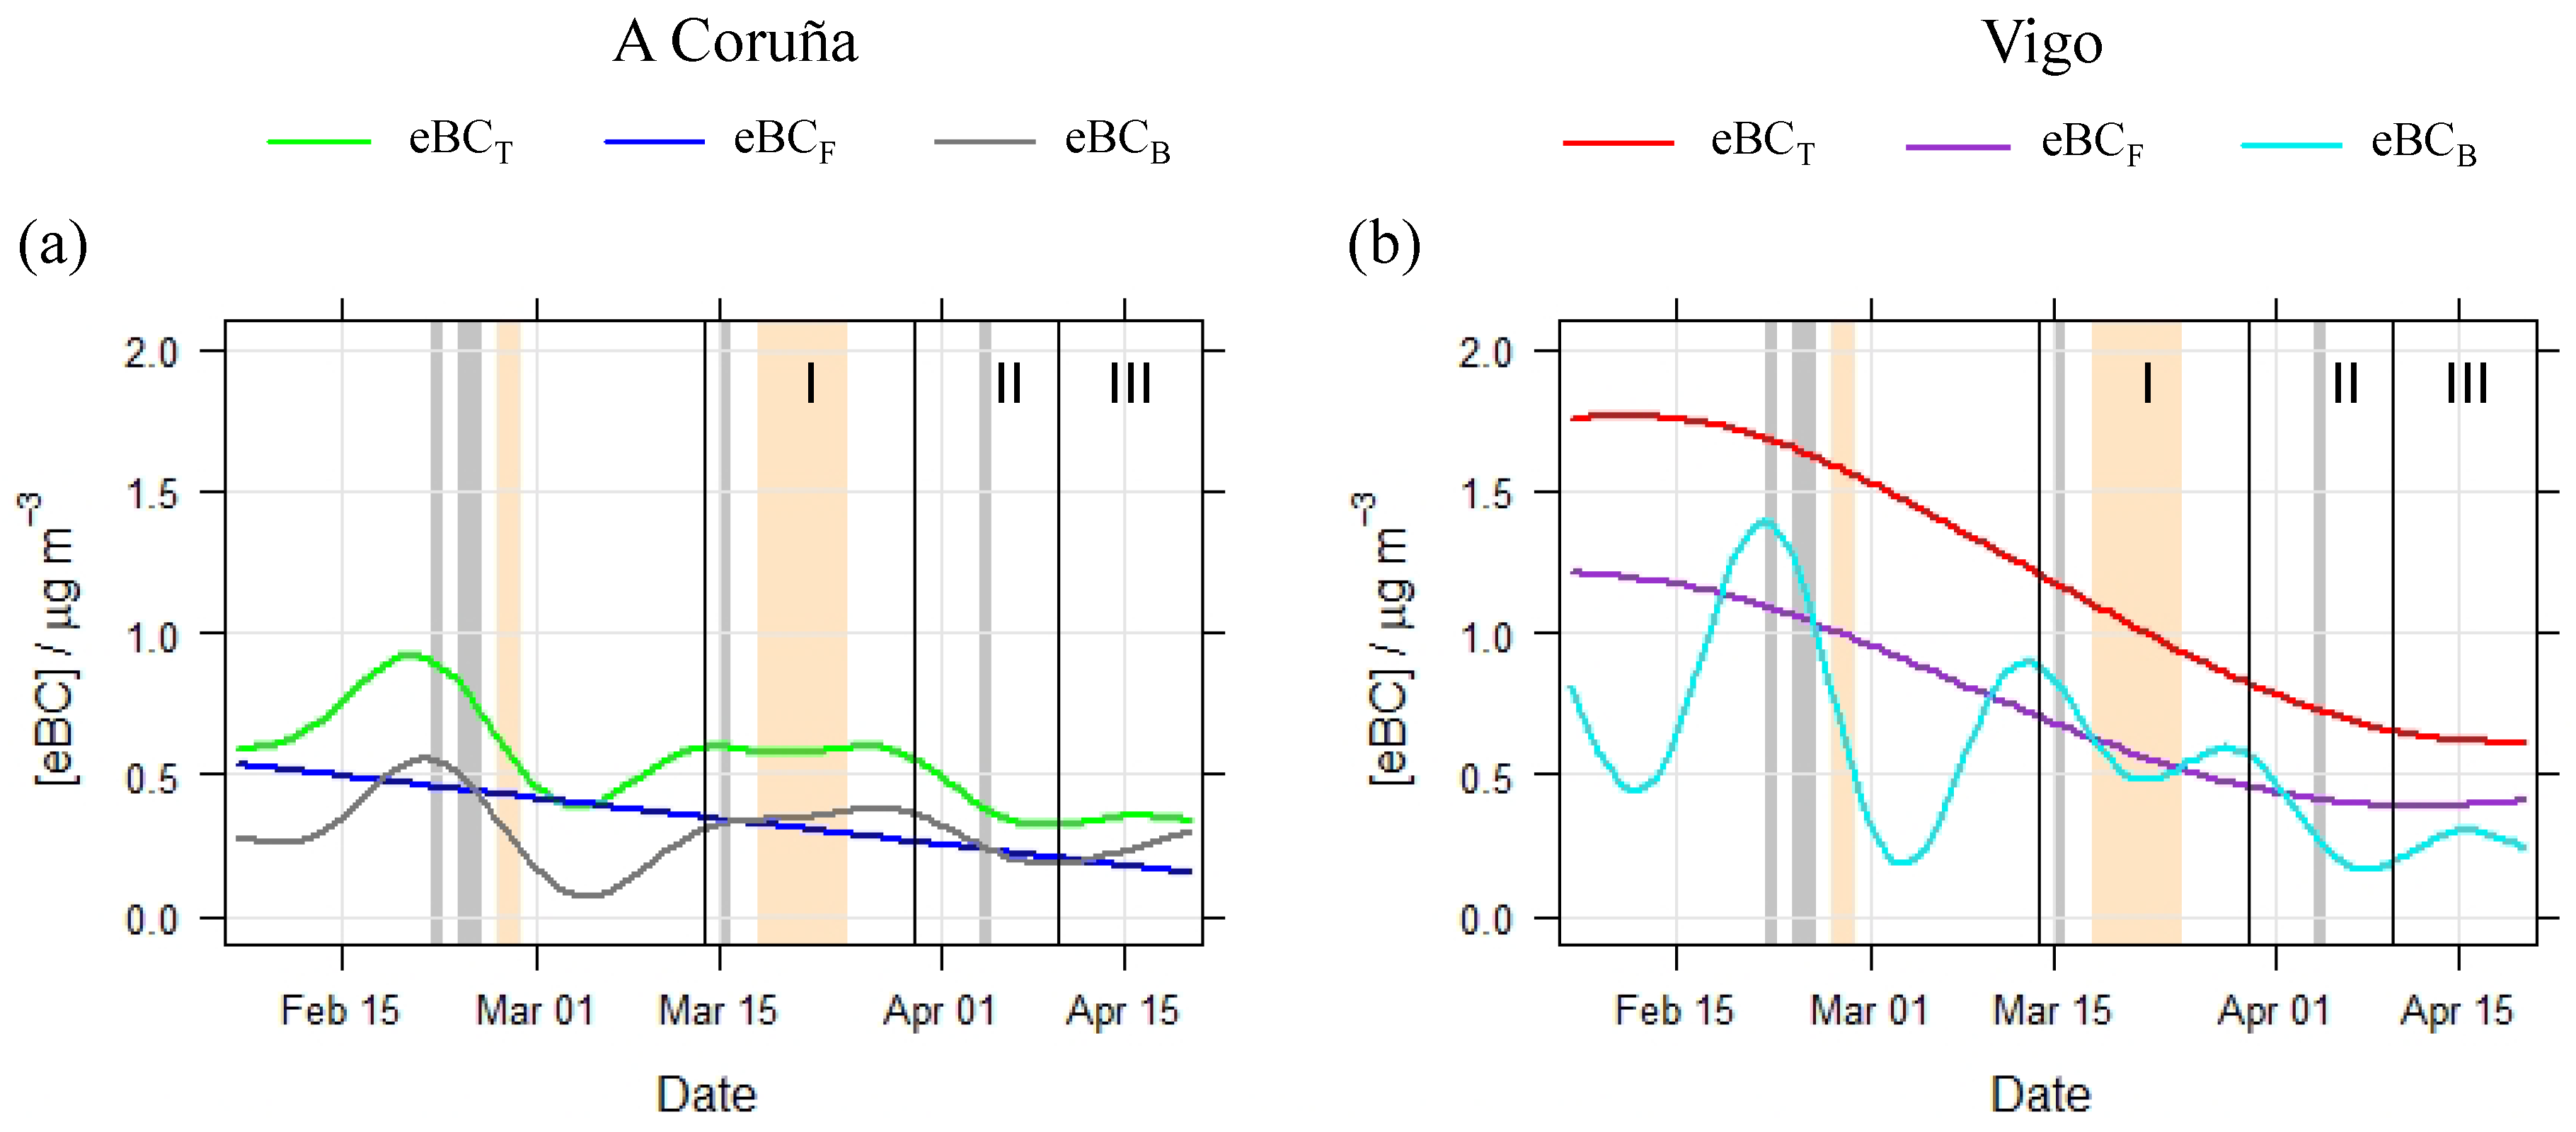
3.5. Decrease in eBC Levels during Lockdown Period

Despite the contribution due to biomass burning episodes on 15 March and 4 April, eBCT, eBCF, and eBCB levels strongly decreased up to −51%, −60%, and −41% (for eBCT, eBCF, and eBCB, respectively) at the V-C station (Figure 3b and Figure 4) during the lockdown period. Similar trends were observed at AC-L for eBCT (−29%) and eBCF (−48%) (Figure 3a). The biomass burning during pre-lockdown and lockdown periods might be attributed to the low eBCB reduction (−3%) at AC-L (background air quality station). Moreover, a nonstatistically significant difference was found between eBCB levels before (0.31 ± 0.25 μg m−3) and during the lockdown period (0.30 ± 0.16 μg m−3) (p-value = 0.8496).
During the lockdown II period, eBC levels also decreased at AC-L and V-C (compared to lockdown I, Table S2).
eBC concentrations during the lockdown period were finally compared with those of 2019 at the AC-L station (station with available data). A negligible difference for eBCT levels during the lockdown period and 2019 was found (Figure 5). However, we could observe a decrease in eBCf concentration due to the road traffic reduction.

3.6. Meteorological Factors Affecting Pollutants Levels

Meteorological conditions might have influenced the changes in pollutants during the studied period. Thus, the statistically significant relationship between target pollutants and meteorological parameters was investigated. The relationships of NOx, SO2, CO, O3, PM10, PM2.5, and eBC with meteorological parameters was examined using Pearson’s product moment correlation analysis, and the results are reported in Table S4.
Due to the low variations in temperature, relativity humidity, and atmospheric pressure before and during the lockdown period at A Coruña and Vigo (Table S1), those meteorological parameters were not statistically significant (p > 0.05) with target pollutants, and they followed no special patterns. On the contrary, and due to the tendency of the concentrations of pollutants decreasing with wind velocity, some negative correlations between certain pollutants and wind speed were statistically significant at several sites (Table S4). However, and despite the decrease in the wind speed (−44 and −8% at A Coruña and Vigo, respectively), pollutants concentrations decreased during the lockdown period. Similarly, and despite rainfall decreasing up to −12 and −26% (at A Coruña and Vigo, respectively) during the lockdown period, pollutants concentrations showed a decreasing pattern, and some statistically significant negative correlation (p < 0.05) between NOx and eBC and rainfall was found (Table S4). Solar radiation displayed a positive correlation vs. O3 (Table S4), which could be attributable to the increase in solar radiation (+39 and +46% at A Coruña and Vigo, respectively) during the lockdown period. Thus, the increase in O3 concentrations during lockdown is not only attributable to the decrease in O3 consumption in NOx oxidation processes. Finally, the decrease in particulate matter concentration during the lockdown period greatly increased the amount of solar radiation; thus, certain positive correlations between PM2.5 concentration and solar radiation were found (Table S4).

4. Conclusions

Temporal variations in NOx, NO, NO2, SO2, CO, O3, PM10, PM2.5, and eBC concentrations were monitored at traffic, background, and industrial locations in a Southwest Atlantic European region to study the impact of lockdown measurements during the SARS-CoV-2 pandemic. Improvements in air quality during the lockdown period were observed with respect to the pre-lockdown period at all studied sites, as expected. Significant reductions were observed for NO (−38 to −78%), NO2 (−22 to −69%), NOx (−26 to −75%), SO2 (−3 to −77%), CO (−21%), PM10 (−25 to −49%), PM2.5 (−10 to −38%), and eBC (−29 to −51%). There was also a dispersion of meteorologically favored pollutants during the pre-lockdown period (only 8% of stagnation days in contrast to 24% during the lockdown). This reaffirms the results obtained, which could have been greater if similar advections were observed during the lockdown. On the other hand, an increase in O3 levels (from +5 to +16%), most likely due to the low O3 consumption by NOx oxidation, was accounted for after lockdown implementation. Similar reductions in pollutants levels (i.e., NOx, SO2, CO, O3, PM10, PM2.5, and BC) were reported in several cities of Spain during the lockdown period [5,6,7,8,9,10,11,12,13,14,15] Due to the increases in agricultural and domestic biomass burning during the lockdown, PM2.5 and CO levels were also reduced less than expected, in agreement with results from other Spanish cities [5].
No exceedances in the limit values set by the European Directive 2008/50/EC [401] were observed for NO2, SO2, CO, and O3 during the studied period. Regarding PM, exceedances were recorded in all stations before the lockdown, and only in AC-T (highly ocean-influenced) after the lockdown. Nevertheless, apart from the AC-T station, this reduction in the number of exceedances was clearly influenced by Saharan dust intrusion and biomass burning episodes. In addition, significant differences in pollutant levels were mainly accounted for during lockdown I and II stages. However, few significant differences were observed during lockdown III (with respect to lockdown II), suggesting that the levels reached before lockdown II were maintained despite the softening of restrictions. This might indicate that not all the (industrial and social) activity during lockdown I was recovered in lockdown III, in addition to the possible influence of changes in meteorological conditions and the short lockdown III period considered (11 days).
Although the EU (central and northern Europe air masses) and MED (Mediterranean air masses) contributions were important during the lockdown period, the decreases in pollutants levels during the lockdown period suggested a negligible effect on pollutant levels due to EU and MED air masses. The decrease in the wind speed and rainfall during the lockdown period did not reflect increases in pollutant levels. Otherwise, the increase in O3 levels during lockdown could not be only attribute to the decrease in NOx due to the increase in solar radiation during the lockdown period.
Finally, overall air pollutants levels were higher during 2018–2019 than during the lockdown period. However, O3 levels decreased during the lockdown period, although this phenomenon could be more closely related to weather conditions.

Supplementary Materials

The following are available online at https://0-www-mdpi-com.brum.beds.ac.uk/article/10.3390/atmos12050562/s1. Table S1. Meteorological conditions (average ± SD values) before and during the lockdown period at A Coruña and Vigo cities; Table S2. Average ± SD (µg m−3, except for CO: mg m−3) values of pollutants during the lockdown stages I and II at studied stations; Table S3. Average ± SD (µg m−3, except for CO: mg m−3) values of pollutants during the lockdown stages II and III at studied stations; Table S4. Pearson’s correlations of NOx, SO2, CO, O3, PM10, PM2.5, and eBC concentrations with meteorological parameters (wind speed, rainfall and solar radiation) at studied stations. Significant correlations at p < 0.05 are in italic; Figure S1. Localization of A Coruña and Vigo cities air quality monitoring stations in Spain. Source: Google Maps (satellite maps, without annotations) and Mapchart.net (https://mapchart.net/spain.html); Figure S2. Daily mean values of meteorological conditions at A Coruña and Vigo cities, without smoothing; Figure S3. Air mass origin during pre-lockdown period (7 February–13 March) and lockdown period (14 March–20 April). NA North Atlantic, NWA Northwest Atlantic, SWA Southwest Atlantic, WA West At-lantic, EU Europe, MED Mediterranean, NAF North Africa, RE regional; Figure S4. Wind roses for pre-lockdown period (7 February–13 March) and lockdown I-III period (14 March–20 April).The plots show the proportion of time that the wind is from a certain angle and wind speed range; Figure S5. Concentration evolutionof NO (a,b) and NO2 (c,d) (24 h mean) beforeand during the lockdown period. The left and right panels correspond with data obtained for air quality monitoring stations of A Coruña and Vigo cities, respectively. Time periods of lockdown stages (I, II and III) are also delimited by vertical black lines; Figure S6. Concentration evolution of Nox and O3 concentrations (μg m−3),temperature and relativehumidity (smoothed hourly data),before and during the lockdown period at air quality monitoring stations of A Coruña and Vigo cities. Highlighted gray and yellow shadows show days with biomass combustion and Saharan dust intrusion, respectively. Time periods of lockdown stages (I, II and III) are also delimited by vertical black lines.

Author Contributions

Conceptualization, M.P.-I., P.C.-T. and N.G.-F.; methodology, P.C.-T., N.G.-F., M.F.-A. and J.S.-P.; software, M.P.-I., M.F.-A. and J.S.-P.; validation, J.M.-P., P.L.-M. and S.M.-L.; formal analysis, J.S.-P., M.F.-A. and M.P.-I.; investigation, P.L.-M., S.M.-L. and J.M.-P.; resources, J.S.-P., M.F.-A. and J.M.-P.; data curation, J.S.-P., M.F.-A. and M.P.-I.; writing J.M.-P., J.S.-P. and M.F.-A.; writing—review and editing, J.M.-P.; visualization, J.S.-P., M.P.-I. and M.F.-A.; supervision, J.M.-P., P.L.-M. and S.M.-L.; project administration, P.L.-M. and S.M.-L.; funding acquisition, P.L.-M. and S.M.-L. All authors have read and agreed to the published version of the manuscript.

Funding

This work was supported by Ministerio de Ciencia, Innovación y Universidades (MCIU), Agencia Estatal de Investigación (AEI) and Fondo Europeo de Desarrollo Regional (FEDER) (Programa Estatal de I+D+i Orientada a los Retos de la Sociedad, ref: RTI 2018-101116-B-I00), Xunta de Galicia (Programa de Consolidación y Estructuración de Unidades de Investigación Competitivas ref: ED431C 2017/28-2017-2020) and FEDER-MINECO (UNLC15-DE-3097, financed together (80/20%) with Xunta de Galicia). Joel Sánchez-Piñero acknowledges the Xunta de Galicia and the European Union (European Social Fund-ESF) for a predoctoral grant (ED481A-2018/164). María Fernández-Amado acknowledges the Ministerio de Ciencia, Innovación y Universidades (PTA2017-13607-I).

Institutional Review Board Statement

Not applicable.

Informed Consent Statement

Not applicable.

Acknowledgments

The authors would like to thank P. Esperón (PTA2018-016005-I). The authors would also like to acknowledge the Management of the UDC for the help provided to facilitate access for the equipment calibration and data collection during the lockdown period.

Conflicts of Interest

The authors declare that they have no competing interests.

References

  1. World Health Organization (WHO). Virtual Press Conference on COVID-19. 11 March 2020. Available online: https://www.who.int/docs/default-source/coronaviruse/transcripts/who-audio-emergencies-coronavirus-press-conference-full-and-final-11mar2020.pdf?sfvrsn=cb432bb3_2 (accessed on 22 May 2020).
  2. Ministerio de la Presidencia, Relaciones con las Cortes y Memoria Democrática (MPRCMD). Real Decreto 463/2020 de 14 de marzo, por el que se Declara el Estado de Alarma para la Gestión de la Situación de Crisis Sanitaria Ocasionada por el COVID-19. Available online: https://www.boe.es/eli/es/rd/2020/03/14/463/con (accessed on 22 May 2020).
  3. Ministerio de la Presidencia, Relaciones con las Cortes y Memoria Democrática (MPRCMD). Real Decreto-ley 10/2020, de 29 de marzo, por el que se Regula un Permiso Retribuido Recuperable para las Personas Trabajadoras por Cuenta Ajena que no Presten Servicios Esenciales, con el fin de Reducir la Movilidad de la Población en el Contexto de la Lucha Contra el COVID-19. Available online: https://www.boe.es/buscar/doc.php?id=BOE-A-2020-4166 (accessed on 22 May 2020).
  4. Mitjà, O.; Arenas, À.; Rodó, X.; Tobias, A.; Brew, J.; Benlloch, J.M. Experts’ request to the Spanish Government: Move Spain towards complete lockdown. Lancet 2020, 395, 1193–1194. [Google Scholar] [CrossRef]
  5. Querol, X.; Massagué, J.; Alastuey, A.; Moreno, T.; Gangoiti, G.; Mantilla, E.; Duéguez, J.J.; Escudero, M.; Monfort, E.; Pérez García-Pando, C.; et al. Lessons from the COVID-19 air pollution decrease in Spain: Now what? Sci. Total Environ. 2021, 779, 146380. [Google Scholar] [CrossRef]
  6. Cárcel-Carrasco, J.; Pascual-Guillamón, M.; Langa-Sanchis, J. Analysis of the effect of COVID-19 on air pollution: Perspective of the Spanish case. Environ. Sci. Pollut. Res. 2021, 12, 1–14. [Google Scholar]
  7. Donzelli, G.; Cioni, L.; Cancellieri, M.; Llopis-Morales, A.; Morales-Suárez-Varela, M. Relations between Air Quality and Covid-19 Lockdown Measures in Valencia, Spain. Int. J. Environ. Res. Public Health 2021, 18, 2296. [Google Scholar] [CrossRef]
  8. Briz-Redon, A.; Belenguer-Sapina, C.; Serrano-Aroca, A. Changes in air pollution during COVID-19 lockdown in Spain: A multi-city study. J. Environ. Sci. 2021, 101, 16–26. [Google Scholar] [CrossRef] [PubMed]
  9. Viteri, G.; Díaz de Mera, Y.; Rodríguez, A.; Rodríguez, D.; Tajuelo, M.; Escalona, A.; Aranda, A. Impact of SARS-CoV-2 lockdown and de-escalation on air-quality parameters. Chemosphere 2021, 265, 129027. [Google Scholar] [CrossRef]
  10. Martorell-Marugán, J.; Villatoro-García, J.A.; García-Moreno, A.; López-Domínguez, R.; Requena, F.; Merelo, J.J.; Lacasaña, M.; de Dios Luna, J.; Díaz-Mochón, J.J.; Lorente, J.A.; et al. DatAC: A visual analytics platform to explore climate and air quality indicators associated with the COVID-19 pandemic in Spain. Sci. Total Environ. 2021, 750, 141424. [Google Scholar] [CrossRef]
  11. Evangeliou, N.; Platt, S.M.; Eckhardt, S.; Myhre, C.L.; Laj, P.; Alados-Arboledas, L.; Backman, J.; Brem, B.T.; Fiebig, M.; Flentje, H.; et al. Changes in black carbon emissions over Europe due to COVID-19 lockdowns. Atmos. Chem. Phys. 2021, 21, 2675–2692. [Google Scholar] [CrossRef]
  12. Baldasano, J.M. COVID-19 lockdown effects on air quality by NO2 in the cities of Barcelona and Madrid (Spain). Sci. Total Environ. 2020, 741, 140353. [Google Scholar] [CrossRef] [PubMed]
  13. Tobías, A.; Carnerero, C.; Reche, C.; Massagué, J.; Via, M.; Minguillón, M.C.; Alastuey, A.; Querol, X. Changes in air quality during the lockdown in Barcelona (Spain) one month into the SARS-CoV-2 epidemic. Sci. Total Environ. 2020, 726, 138540. [Google Scholar] [CrossRef]
  14. Shahzad, K.; Shahzad, U.; Iqbal, N.; Shahzad, F.; Fareed, Z. Effects of climatological parameters on the outbreak spread of COVID-19 in highly affected regions of Spain. Environ. Sci. Pollut. Res. 2020, 27, 39657–39666. [Google Scholar] [CrossRef]
  15. Zambrano-Monserrate, M.A.; Ruano, M.A.; Sanchez-Alcalde, L. Indirect effects of COVID-19 on the environment. Sci. Total Environ. 2020, 728, 138813. [Google Scholar] [CrossRef]
  16. Marinello, S.; Lolli, F.; Gamberini, R. The Impact of the COVID-19 Emergency on Local Vehicular Traffic and It1s Consequences for the Environment: The Case of the City of Reggio Emilia (Italy). Sustainability 2021, 13, 118. [Google Scholar] [CrossRef]
  17. Skiriene, A.F.; Stasiskiene, Z. COVID-19 and Air Pollution: Measuring Pandemic Impact to Air Quality in Five European Countries. Atmosphere 2021, 12, 290. [Google Scholar] [CrossRef]
  18. Bhat, S.A.; Bashir, O.; Bilal, M.; Ishaq, A.; Dar, M.U.D.; Kumar, R.; Bhat, R.A.; Sher, F. Impact of COVID-related lockdowns on environmental and climate change scenarios. Environ. Res. 2021, 195, 110839. [Google Scholar] [CrossRef]
  19. Grange, S.K.; Lee, J.D.; Drysdale, W.S.; Lewis, A.C.; Hueglin, C.; Emmenegger, L.; Carslaw, D.C. COVID-19 lockdowns highlight a risk of increasing ozone pollution in European urban areas. Atmos. Chem. Phys. 2021, 21, 4169–4185. [Google Scholar] [CrossRef]
  20. National Statistics Institute (Spain) (INE). Available online: https://www.ine.es/index.htm (accessed on 22 May 2020).
  21. EN 14211:2013. Ambient Air—Standard Method for the Measurement of the Concentration of Nitrogen Dioxide and Nitrogen Monoxide by Chemiluminescence; The British Standards Institution: London, UK, 2013. [Google Scholar]
  22. EN 14212:2013. Ambient Air—Standard Method for the Measurement of the Concentration of Sulphur Dioxide by Ultraviolet Fluorescence; The British Standards Institution: London, UK, 2013. [Google Scholar]
  23. EN 14626:2013. Ambient Air—Standard Method for the Measurement of the Concentration of Carbon Monoxide by Non-Dispersive Infrared Spectroscopy; The British Standards Institution: London, UK, 2013. [Google Scholar]
  24. EN 14625:2013. Ambient Air—Standard Method for the Measurement of the Concentration of Ozone by Ultraviolet Photometry; The British Standards Institution: London, UK, 2013. [Google Scholar]
  25. EN 16450:2017. Ambient Air—Automated Measuring Systems for the Measurement of the Concentration of Particulate Matter (PM10; PM2.5); The British Standards Institution: London, UK, 2017. [Google Scholar]
  26. United States Environmental Protection Agency (USEPA). List of Designated Reference and Equivalent Methods. Available online: https://www.epa.gov/sites/production/files/2019-08/documents/designated_reference_and-equivalent_methods.pdf (accessed on 22 May 2020).
  27. Petzold, A.; Schönlinner, M. Multi-angle absorption photometry—A new method for the measurement of aerosol light absorption and atmospheric black carbon. J. Aerosol Sci. 2004, 35, 421–441. [Google Scholar] [CrossRef]
  28. Virkkula, A.; Ahlquist, N.C.; Covert, D.S.; Arnott, W.P.; Sheridan, P.J.; Quinn, P.K.; Coffman, D.J. Modification, Calibration and a Field Test of an Instrument for Measuring Light Absorption by Particles. Aerosol Sci. Technol. 2005, 39, 68–83. [Google Scholar] [CrossRef]
  29. Davy, P.M.; Tremper, A.H.; Nicolosi, E.M.G.; Quincey, P.; Fuller, G.W. Estimating particulate black carbon concentrations using two offline light absorption methods applied to four types of filter media. Atmos. Environ. 2017, 152, 24–33. [Google Scholar] [CrossRef]
  30. Greilinger, M.; Drinovec, L.; Močnik, G.; Kasper-Giebl, A. Evaluation of measurements of light transmission for the determination of black carbon on filters from different station types. Atmos. Environ. 2019, 198, 1–11. [Google Scholar] [CrossRef]
  31. Petzold, A.; Ogren, J.A.; Fiebig, M.; Laj, P.; Li, S.M.; Baltensperger, U.; Holzer-Popp, T.; Kinne, S.; Pappalardo, G.; Sugimoto, N.; et al. Recommendations for reporting black carbon measurements. Atmos. Chem. Phys. 2013, 13, 8365–8379. [Google Scholar] [CrossRef] [Green Version]
  32. Ealo, M.; Alastuey, A.; Ripoll, A.; Pérez, N.; Minguillón, M.C.; Querol, X.; Pandolfi, M. Detection of Saharan dust and biomass burning events using near real-time intensive aerosol optical properties in the northwestern Mediterranean. Atmos. Chem. Phys. Discuss. 2016, 16, 12567–12586. [Google Scholar] [CrossRef] [Green Version]
  33. Concello da Coruña. Concello Sostenible, Calidad del Aire y Ruido en A Coruña. Available online: http://coruna.es/infoambiental/ (accessed on 22 May 2020).
  34. Meteogalicia. Red Meteorológica de la Xunta de Galicia, Consellería de medio Ambiente, Territorio e Vivenda. Available online: https://www.meteogalicia.gal/observacion/estacions/estacions.action?request_locale=es# (accessed on 22 May 2020).
  35. Stein, A.F.; Draxler, R.R.; Rolph, G.D.; Stunder, B.J.B.; Cohen, M.D. NOAA’s HYSPLIT atmospheric transport and dispersion modeling system. Bull. Am. Meteorol. Soc. 2015, 96, 2059–2077. [Google Scholar] [CrossRef]
  36. Rolph, G.; Stein, A.; Stunder, B. Real-time Environmental Applications and Display sYstem: READY. Environ. Model. Softw. 2017, 95, 210–228. [Google Scholar] [CrossRef]
  37. Ministerio para la Transición Ecológica y el Reto Demográfico (MTERD). Detección de Episodios Naturales de Aportes Transfronterizos de Partículas y Otras Fuentes de Contaminación de Material Particulado, y de Formación de Ozono Troposférico. Available online: https://www.miteco.gob.es/es/calidad-y-evaluacion-ambiental/temas/atmosfera-y-calidad-del-aire/calidad-del-aire/evaluacion-datos/fuentes-naturales/Prediccion_episodios_2020.aspx (accessed on 22 May 2020).
  38. Carslaw, D.C.; Ropkins, K. Openair—An r package for air quality data analysis. Environ. Model. Softw. 2012, 27, 52–61. [Google Scholar] [CrossRef]
  39. R Core Team. R: A Language and Environment for Statistical Computing; R Foundation for Statistical Computing: Vienna, Austria, 2019. [Google Scholar]
  40. RStudio Team. RStudio: Integrated Development for R; RStudio, Inc.: Boston, MA, USA, 2016. [Google Scholar]
  41. European Environment Agency. EU Directive 2008/50/EC of the European Parliament and of the Council of 21 May 2008 on Ambient Air Quality and Cleaner Air for Europe; European Environment Agency: København, Denmark, 2008; Available online: https:/www.eur-lrx.europa.eu/legal-content/en/ALL/?uri=CELEX:32008L0050 (accessed on 26 May 2020).
  42. Xunta de Galicia. PM10 y PM2,5 en ES1219: Área Metropolitana de A Coruña en 2016 y la Influencia del Aerosol Marino. Available online: https://www.miteco.gob.es/images/es/informe_aerosol_marino_coruna_2016_tcm30-481954.pdf (accessed on 26 May 2020).
  43. World Health Organization (WHO). Air Quality Guidelines for Particulate Matter, Ozone, Nitrogen Dioxide and Sulfur Dioxide—Global Update 2005. Available online: https://www.euro.who.int/en/health-topics/environment-and-health/air-quality/publications/pre2009/air-quality-guidelines.-global-update-2005.-particulate-matter,-ozone,-nitrogen-dioxide-and-sulfur-dioxide (accessed on 22 May 2020).
Figure 1. Concentration evolution of NOx (a,b) and SO2 (c,d) (24 h mean), and CO (e,f) and O3 (g,h) (maximum daily 8 h rolling mean) before and during the lockdown period. The left and right panels correspond to data obtained for air quality monitoring stations in the cities of A Coruña and Vigo, respectively. The areas highlighted in yellow show days with Saharan dust intrusion. The time periods of lockdown stages (I, II, and III) are also delimited by vertical black lines.
Atmosphere 12 00562 g001
Figure 2. Concentration evolution of PM10 (a,b) and PM2.5 (c,d) (24 h mean) before and during the lockdown period. The left and right panels correspond to data obtained for air quality monitoring stations in the cities of A Coruña and Vigo, respectively. The areas highlighted in gray and yellow show days with biomass combustion and Saharan dust intrusion, respectively. Time periods of lockdown stages (I, II, and III) are also delimited by vertical black lines.
Atmosphere 12 00562 g002
Figure 3. Concentration evolution of eBCT, eBCF, and eBCB (24 h mean) before and during the lockdown period. The left and right panels correspond to data obtained for air quality monitoring stations in the cities of A Coruña (a) and Vigo (b). The areas highlighted in gray and yellow show days with biomass combustion and Saharan dust intrusion, respectively. Time periods of lockdown stages (I, II, and III) are also delimited by vertical black lines.
Atmosphere 12 00562 g003
Figure 4. The comparison of NO, NO2, NOx, SO2, CO, O3, PM10, PM2.5, eBCT, eBCF, and eBCB levels before and during the lockdown period at several air monitoring stations. The upper and lower boundaries of the boxes indicate the 75th and 25th percentiles, respectively; the line within the box marks the median; the X marks the mean; the whiskers above and below the boxes indicate the largest and smallest nonoutlier values, respectively. Outliers (dots) refer to values further than 1.5 times the box length from either end of the box.
Atmosphere 12 00562 g004
Figure 5. The comparison of NO, NO2, NOx, SO2, CO, O3, PM10, PM2.5, eBCT, eBCF, and eBCB levels during the lockdown (2020) and the same period in the previous two years (2018–2019). The upper and lower boundaries of boxes indicate the 75th and 25th percentiles, respectively; the line within the box marks the median; the X marks the mean; the whiskers above and below the boxes indicate the largest and smallest nonoutlier values, respectively. Outliers (dots) refer to values further than 1.5 times the box length from either end of the box. * Only 2019 data available.
Atmosphere 12 00562 g005
Table 1. Air quality monitoring stations by longitude and latitude.
SiteCodeLongitudeLatitudeMonitored Pollutants
Urban Background and Traffic Monitoring Stations
A Coruña-TorreAC-T08°24′33″ W43°22′58″ NNO, NO2, NOx, SO2, CO, O3, PM10, PM2.5
A Coruña-LiánsAC-L08°21′09″ W43°20′12″ NNO, NO2, NOx, SO2, O3, PM10, eBC
Vigo-CoiaV-C08°44′31″ W42°13′08″ NNO, NO2, NOx, SO2, CO, O3, PM10, PM2.5, eBC
Vigo-Lope V-L08°42′40″ W42°13′21″ NNO, NO2, NOx, SO2, CO, O3, PM10
Industrial Monitoring Stations
A Coruña-GrelaAC-G08°26′03″ W43°20′43″ NNO, NO2, NOx, SO2, PM10, PM2.5
Vigo-PSAEV-PSAE08°44′13″ W42°12′37″ NNO, NO2, NOx, SO2, PM2.5
Vigo-PSAWV-PSAW08°44′49″ W42°12′10″ NNO, NO2, NOx, SO2, O3, PM10
Publisher’s Note: MDPI stays neutral with regard to jurisdictional claims in published maps and institutional affiliations.

