Article

Characteristics and Source Apportionment of Black Carbon (BC) in a Suburban Area of Klang Valley, Malaysia

1
Department of Environmental and Occupational Health, Faculty of Medicine and Health Sciences, Universiti Putra Malaysia (UPM), Serdang 43400, Selangor, Malaysia
2
Council on Energy, Environment and Water, New Delhi 110067, India
3
School of Chemistry, University of Edinburgh, David Brewster Road, Edinburgh EH9 3FJ, UK
4
Department of Chemistry, Faculty of Science, University of Malaya, Kuala Lumpur 50603, Federal Territory, Malaysia
5
Department of Environment, Faculty of Forestry and Environment, Universiti Putra Malaysia, Serdang 43400, Selangor, Malaysia
*
Author to whom correspondence should be addressed.
Submission received: 30 April 2021 / Revised: 1 June 2021 / Accepted: 2 June 2021 / Published: 18 June 2021

Abstract

:
Black carbon (BC) is of concern due to its contribution to poor air quality and its adverse effects human health. We carried out the first real-time monitoring of BC in Malaysia using an AE33 Aethalometer. Measurements were conducted between 1 January and 31 May 2020 in a university area in a suburban location of the Klang Valley. The measurement period coincided with the implementation of a movement control order (MCO) in response to COVID-19. The mean concentration of BC before the MCO was 2.34 µg/m3 which decreased by 38% to 1.45 µg/m3 during the MCO. The BC is dominated by fossil-fuel sources (mean proportion BCff = 79%). During the MCO, the BCff concentration decreased by more than the BCbb concentration derived from biomass burning. BC and BCff show very strong diurnal cycles, which also show some weekday–weekend differences, with maxima during the night and just before noon, and minima in the afternoon. These patterns indicate strong influences on concentrations from both traffic emissions and boundary layer depth. BC was strongly correlated with NO2 (R = 0.71), another marker of traffic emission, but less strongly with PM2.5 (R = 0.52). The BC absorption Ångström exponent (AAE) ranged between 1.1 and 1.6. We observed pronounced diurnal cycles of lower AAE in daytime, corresponding to BCff contributions from traffic. Average AAE also showed a pronounced increase during the MCO. Our data provides a new reference for BC in suburban Malaysia for the public and policy-makers, and a baseline for future measurements.

Graphical Abstract

1. Introduction

The rapid development of economies in middle–upper income countries has resulted in expanded transport, industrial and agricultural activities, and consequently to increased levels of air pollutants. Black carbon (BC) is a critical light-absorbing carbonaceous aerosol component in the atmosphere [1,2] with impacts on air pollution haze [3,4], human health [5] and radiative forcing [6]. BC can penetrate the lungs because of its small size (<100 nm) and thereby increase the risk of cardiovascular and respiratory diseases [7]. It is also a carrier of co-emitted harmful organic compounds (e.g., polycyclic aromatic hydrocarbons (PAHs) and their derivatives) [7,8,9,10]. BC sources in urban areas are dominated by combustion processes, such as transportation, industry, and residential combustion [1,11]. It has been assessed that, globally, 24% and 60% of anthropogenic BC emissions are from transportation and residential combustion fuels, respectively in sub-urban areas [12].
Many countries worldwide use criteria pollutants such as particulate matter (PM), carbon monoxide (CO), nitrogen dioxide (NO2), sulphur dioxide (SO2), and ozone (O3) to provide information regarding on air quality status. However, carbonaceous particles, such as BC, currently lack ambient quality standards and monitoring, especially in emerging economic countries [13,14]. Southeast Asia is a significant source of BC due to a large population (approximately 650 million) and associated anthropogenic activities in the region, as well as biomass burning emissions (wild forest, transboundary haze pollution and peat fires, crop residue open burning and indoor cooking using biofuels) [15,16,17]. There has been growing interest in measuring BC in Southeast Asian countries, including to investigating diurnal effects in Bangkok [18], personal exposure assessment in Singapore [19], emissions from the busiest street in Manila [20], and evaluation of local sources contribution in Jakarta [21]. However, such measurements are still lacking in Malaysia. Given the dynamic physical and social conditions of Malaysia’s urban and rural environments, understanding the carbonaceous particle profiles and their distribution is a pressing challenge to address. This study set out to measure BC in the Klang Valley, south of Kuala Lumpur, in the Southern Peninsula of Malaysia. Malaysia has been experiencing local traffic air pollution [22]. The metropolitan area in the Klang Valley had a high growth rate of transportation per year, which estimated the number of private vehicles to reach 7 million by the year 2020 [23]. It was also estimated that public and private transportation on the roads completed between 1.24 and 6 million trips per day.
BC is defined through measurement by optical absorption techniques [24,25,26]. The spectral dependence of BC emitted from fossil fuel and biomass burning sources has made methods utilizing multi-wavelength light absorption instruments a useful approach to apportioning BC from these source categories. For example, the multi-wavelength Aethalometer measures aerosol light absorption in the wavelength range of 370–950 nm and has been used to assess the contribution of BC from fossil fuel and biomass burning sources [27,28,29,30]. The optical methods also provide very high time resolution that can be used to explore sub-diurnal patterns and high temporal correlations.
The aim of this work was to characterize concentrations and diurnal profiles of BC and its source apportionment in a suburban area of Klang Valley (Malaysia) from January to May 2020. By chance, our study coincided with the implementation on 18 March of a movement control order (MCO) for COVID-19, which remained in place for the rest of the measurements reported here. We explored the concentrations and contributing fractions to BC, and their diurnal variations, before and during the MCO. We also investigated associations of BC with other air pollutants (NO2 and PM2.5), traffic mobility data and meteorological variables. To our knowledge, this is the first study of BC and its source apportionment in Malaysia.

2. Materials and Methods

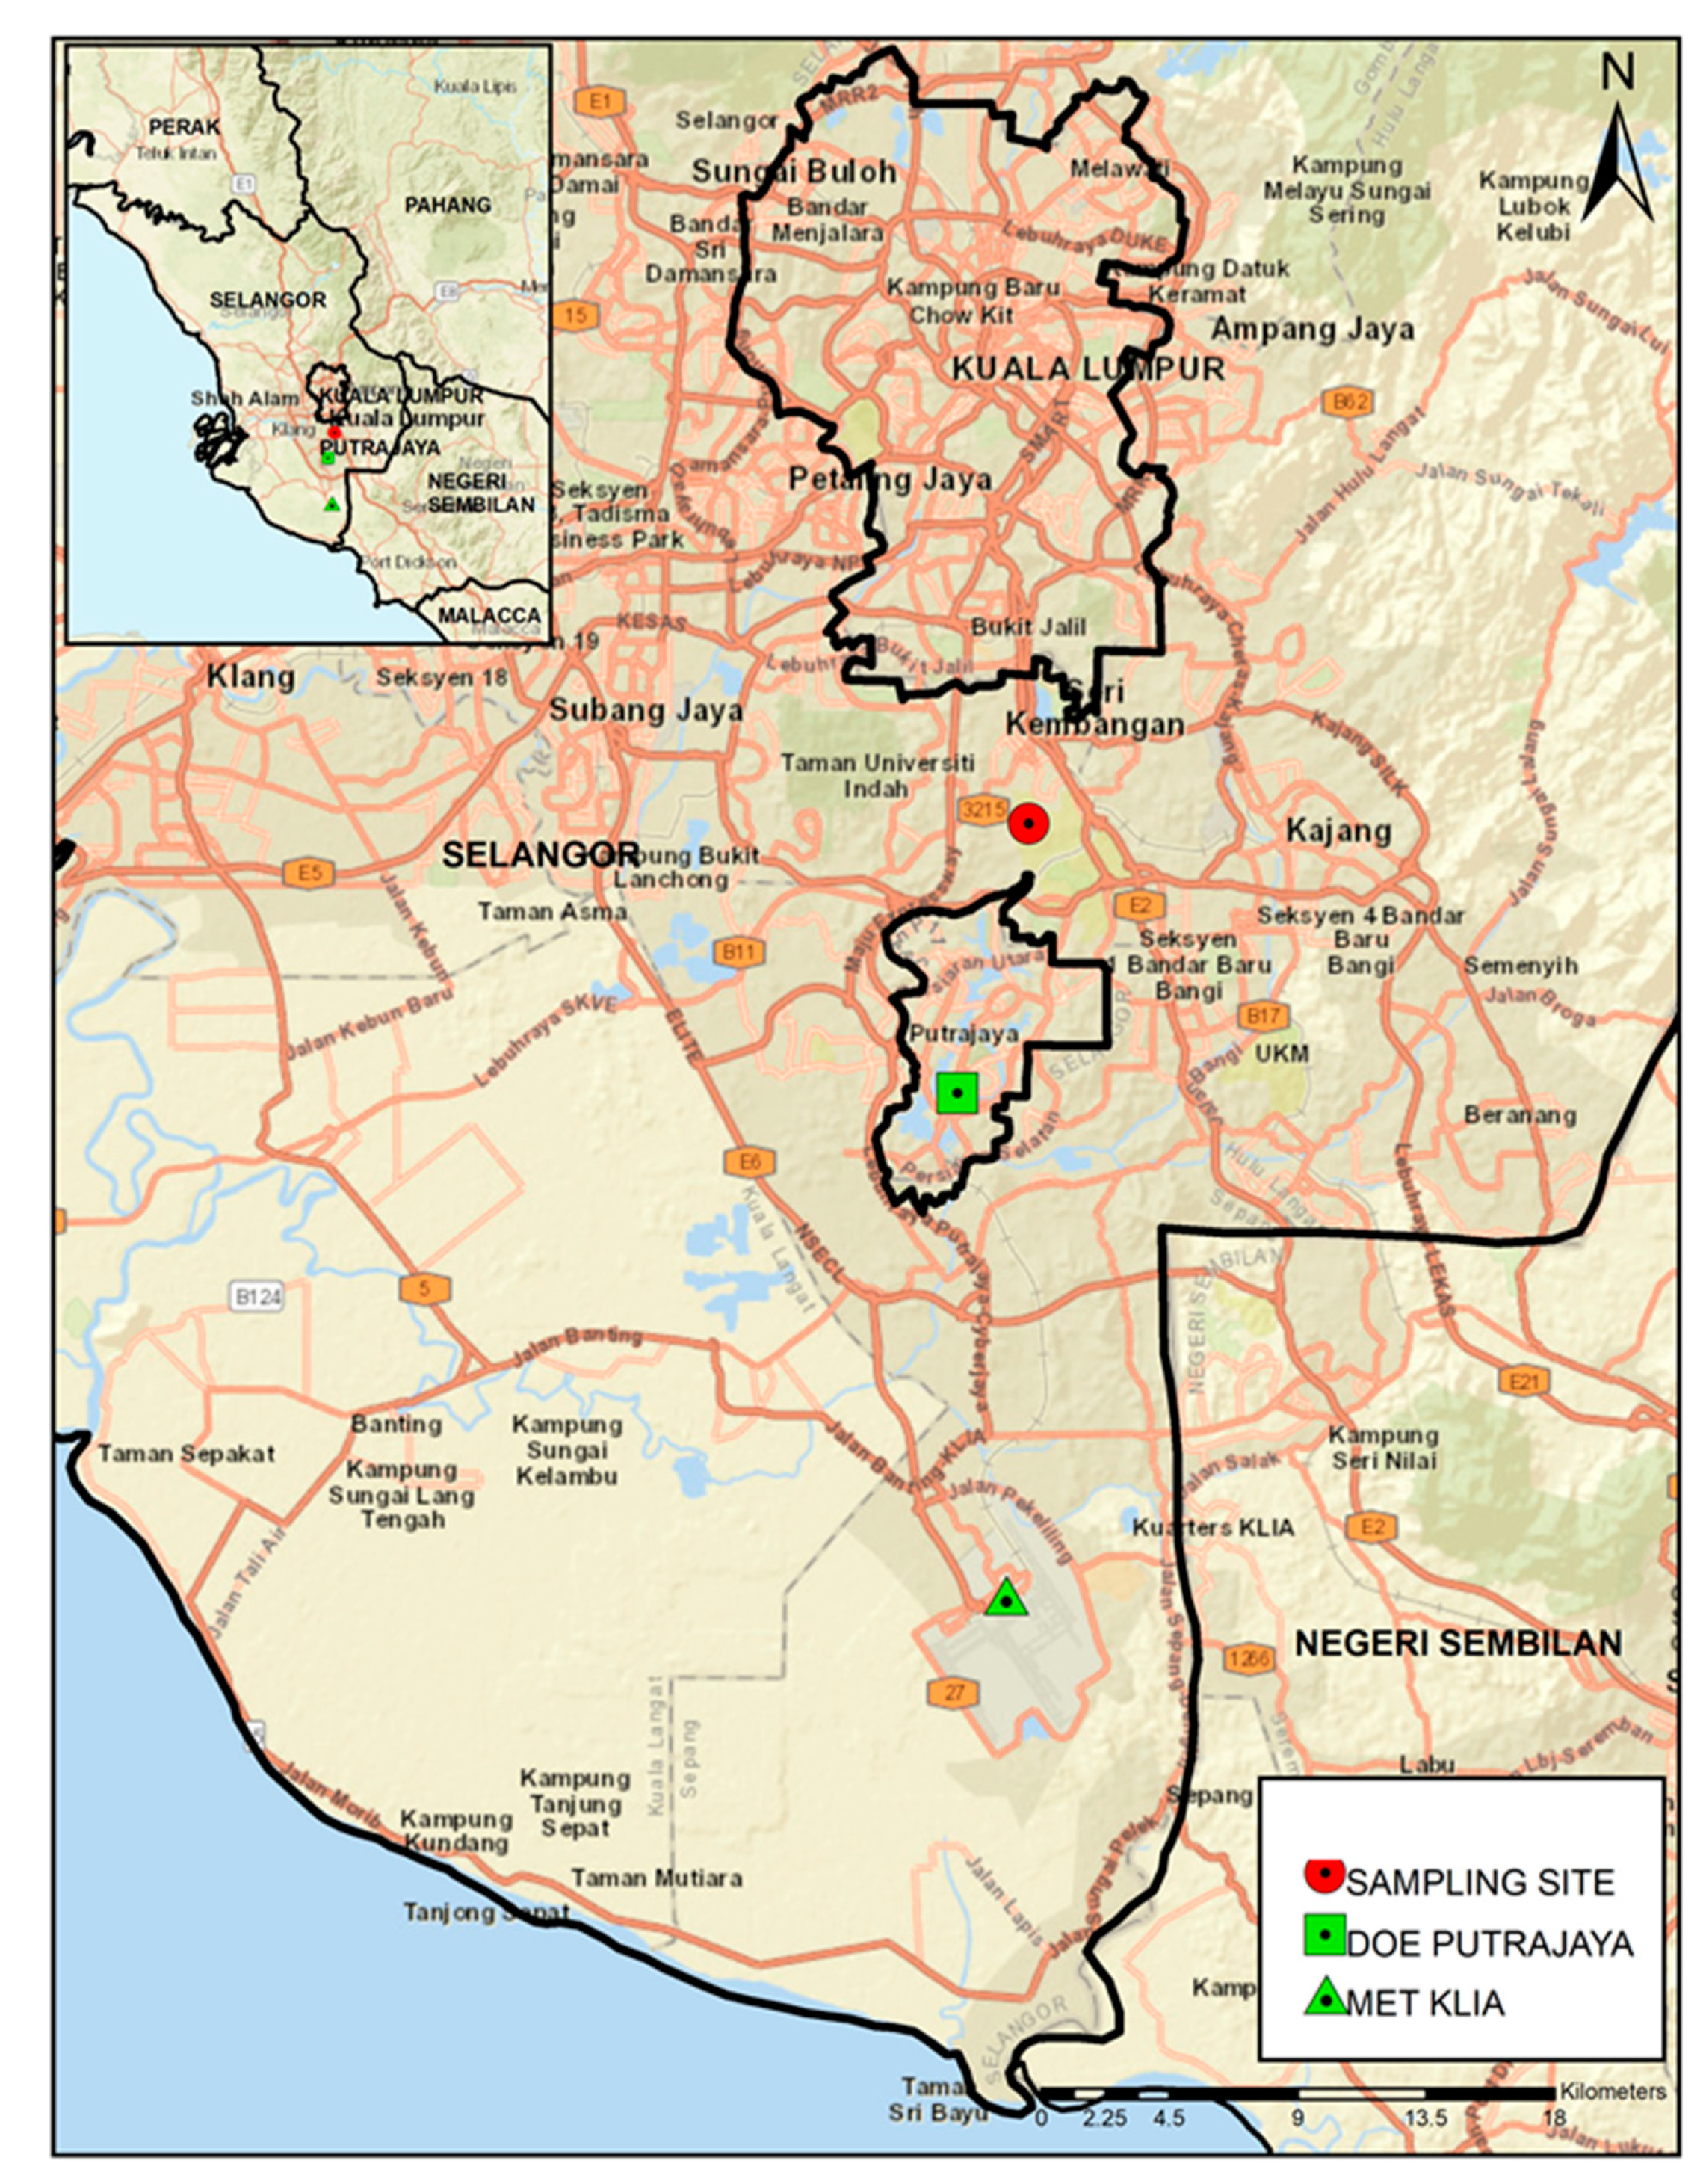
2.1. Monitoring Site

The BC measurements were carried out at the campus of the Faculty of Medicine and Health Science, Universiti Putra Malaysia (UPM) (2.9998° N, 101.7121° E) from 1 January to 31 May 2020. This campus is located at a suburban site in the Serdang town of Klang Valley (Figure 1). It is surrounded by private forest property of UPM, agriculture park and a hospital. There are also commercial buildings such as malls, hotels, offices, and research institutes nearby. Local background activities that are a source of BC include road traffic and may include burning garden waste from the agriculture park. The campus is located 500 m to the west of the South Klang Valley Expressway (SKVE) via Hospital Serdang interchanges. The campus sampling site is located approximately 28 km southeast from the Kuala Lumpur City Centre. Another highway, the Maju Expressway E20/16, is located 6 km northwest of the campus, and carries a greater annual vehicle flow of trucks, cars, and two-wheelers. Serdang is regarded as the southern gateway into Kuala Lumpur for motorists traveling from southern Selangor, Negeri Sembilan, Malacca, or Johor. The Expressways will be major sources of BC. The Klang Valley experiences a tropical climate characterized by relatively uniform high temperatures (22–34 °C), high relative humidity (60–90%), high annual rainfall (2500 mm), and moderate monthly average wind speeds (2.7 m/s) throughout the year.

2.2. Determination of BC Concentrations

Concentrations of BC were measured using the AE33 7-wavelength Aethalometer (Magee Scientific, Berkeley, CA, USA). The AE33 instrument has been widely used to measure light-absorbing aerosols in city, industrial, rural, and remote areas, globally [29,31,32]. The AE33 in our study was set to operate at a flow rate of 5 L/min with a sampling time base of 1 min.
The AE33 instrument collects two aerosol samples simultaneously with differing accumulation rates combined to eliminate nonlinearity. The BC concentration is calculated from optical attenuation (absorption) changes at the near-infrared 880 nm wavelength and the corresponding mass absorption cross-section of 7.77 m2/g [33]. To evaluate the contributions of BC from fossil fuel (BCff) and biomass burning (BCbb) we used the source apportionment model developed by Sandradewi et al. [29]. This is based on different sources of BC aerosols absorbing differently at different wavelengths [34]; specifically, that aerosols from biomass burning absorb effectively in the UV-blue region whilst those from traffic emissions (fossil fuel) do not [33]. In the model, total sample light absorption babs(BCtotal) is the sum of the absorptions by particles from fossil fuel (ff) and biomass burning (bb) (Equation (1)).
babs(BCtotal) = babs(BCff) + babs(BCbb).
The wavelength dependence of the absorption is expressed through the absorption Ångström exponent (AAE) (Equation (2)),
AAE = ln(babs1/babs2)/ln(λ1/λ2),
where babs1, babs2 are the absorption coefficients at wavelengths λ1 and λ2, respectively. Although the AAE can be derived from fitting an exponential curve through the absorption coefficients at several wavelengths, in practice, it is usually determined using two absorptions at 950 nm and 470 nm [33]. We followed the practice of determining AAE as the negative slope of a double logarithmic plot of Equation (2) [34]. The absorption coefficients babs are determined from compensated BC values at the two distinct wavelengths via Equation (3),
b abs ( M / m ) = BC   ( ng / m 3 ) × σ   ( m 2 / g ) / 1000
where σ, the specific mass absorption coefficient, has the values 14.54 m2/g and 7.19 m2/g at 470 nm and 950 nm, respectively. The AE33 instrument’s in-built ‘Aethalometer model’ computes the concentrations of the BCff and BCbb components using default AAE values of 1.0 for the former and 2.0 for the latter [33,35]. The percent biomass burning (BB%) is computed via Equation (4) [29,35].
BB% = babs(950 nm)(BB)/babs(950 nm).

2.3. Data Processing and Analysis

The AE33 instrument used in this study was factory-calibrated and used directly when received from the manufacturer [35]. Previous studies have shown that the Aethalometer is subject to errors associated with scattering and shadowing effects of particles embedded in the filter. These artifacts lead to uncertainties in light-absorbing aerosol mass concentration measurements [36,37] and have been estimated to be ±20%, overall [31,32,38]. In this study, the AE33 filter strip was changed every month to avoid dysfunction in the in-built compensation process for filter-loading effects [35]. All raw measurement data were checked for anomalous values. Negative and zero values were regarded as invalid and discarded, as were occasional single extreme values.
Statistical analyses were performed using the R software [39] and the Openair R package [40,41].

2.4. PM2.5, NO2, Meteorological and Mobility Data

Hourly mean PM2.5 and NO2 concentrations were obtained from the nearest govern-ment monitoring station, located in Putrajaya, 12 km from the BC monitoring site (these data were available for 1 February to 16 May 2020). The private company, Transwater API Sdn Bhd (Selangor Darul Ehsan, Malaysia), operates a Thermo Scientific TEOM 1405-DF and Thermo Scientific Models 42i for the Department of Environment Malaysia, which maintains the readings of PM2.5 and NO2 respectively. Hourly mean temperature, relative humidity, precipitation, and wind speed were obtained from the Department of Meteorology for Kuala Lumpur International Airport (KLIA), situated 20 km away (Figure 1). Both the pollutant and meteorological data are collected under national or international data assurance procedures for these sorts of measurements. Monthly calibration was performed on each instrument to ensure the accuracy and precision. Every data point has gone through pre-processing treatment, which includes the detection of errors and missing values.
We also obtained Apple’s mobility data, which is based on counting number of direction requests by Apple Maps users and is classified into driving, walking, and public transit [42,43]. The mobility parameter from public transit was selected due to its potential impact on outdoor air quality. The mobility trend is expressed as a relative percentage.

3. Results and Discussion

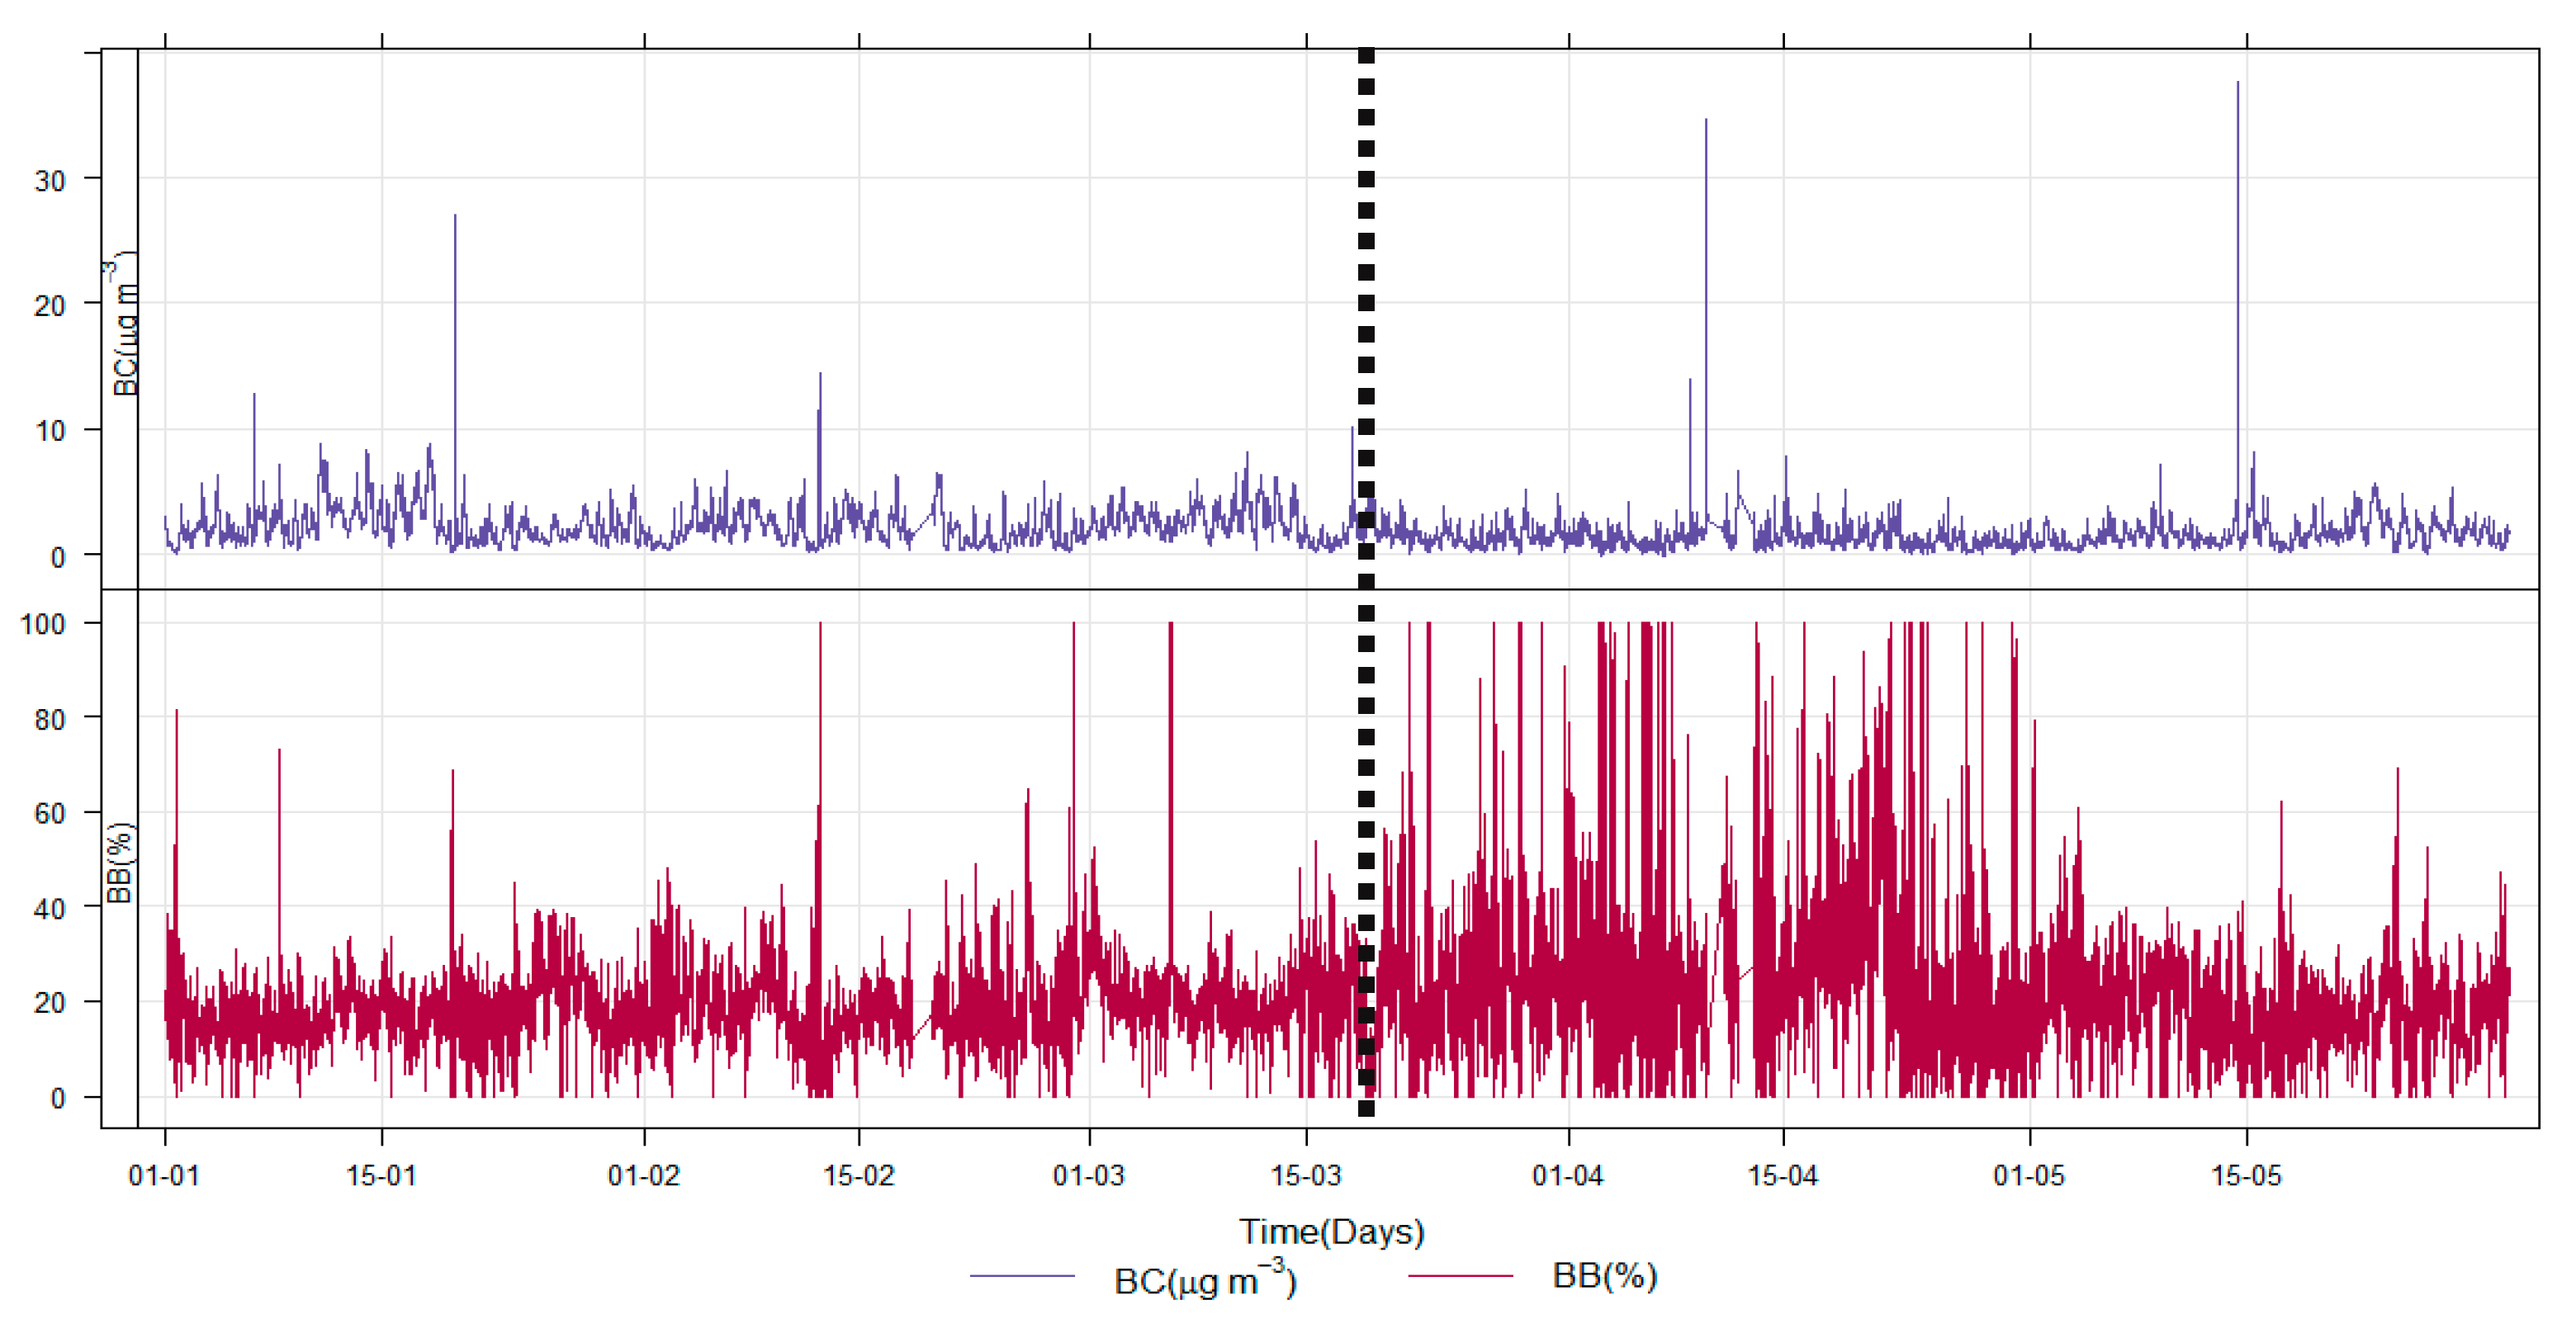
3.1. Summary and Time Series of BC Concentrations

Table 1 summarizes the distributions of the measured concentrations of BC and its BCff and BCbb components. The mean (±1 standard deviation of 1-min values) BC for the full period 1 January to 31 May 2020 was 1.90 ± 0.70 μg/m3 (5th to 95th percentile range 0.84–3.56 μg/m3). The mean concentrations from biomass burning (BCbb) and fossil fuels (BCff) were 0.38 ± 0.06 μg/m3 and 1.52 ± 0.32 μg/m3, respectively. The mean percentage of biomass burning (BB%) was 20.9 ± 9.9, but 1-min values of BB% ranged from 0.1% (completely fossil fuel) to 99.9% (completely biomass burning. The source apportionment shows that BC in the Klang Valley is dominated by fossil-fuel sources, which other evidence presented indicates is associated with traffic.
The data in Table 1 show that mean BC concentrations and BB% were significantly different before and during the movement control order (MCO) imposed for COVID-19 lockdown in Malaysia. Mean BC concentrations before and during the MCO were 2.34 ± 0.18 and 1.45 ± 0.52 μg/m3, respectively, which is a decline in BC of 38% following the introduction of the MCO. The mean proportion of biomass in the BC during the MCO period increased to 22.9 ± 4.0% from its pre-MCO proportion of 18.6 ± 4.8%, which is a 23% increase in the proportion of BC derived from biomass burning.
In the Supplementary Material, Table S1 we compare our measurements of BC concentrations in Malaysia with a selection of BC studies in other suburban areas globally from the last five years. The mean BC concentration in this study is similar to those reported in Italy [44], India [45], Nanjing [46], Beijing (when not in a haze period) [47] and Xianghe (noting that this is an older study) [26], but greater than those in Londrina, Brazil [48]; the latter location is, however, a much smaller urban area than the Klang Valley Malaysia. As in our study, it has been reported that fossil-fuel combustion activities are the predominant sources of BC, which mainly include transportation sources, coal combustion in power plants and cooking sources; for example in the suburban areas of Beijing and Milan. In rural areas of India, however, the dominant source of BC was agricultural stubble burning.
Figure 2 shows the 1-min temporal variations of equivalent BC and BB% for the full period January to May 2020. The 1-min BC concentrations ranged from 0.02 to 37.6 μg/m3, with a mean of 1.90 μg/m3 as presented in Table 1. The 1-min average BC concentrations apportioned to fossil fuels varied from zero to 33.6 μg/m3, with a mean of 1.52 μg/m3. The biomass burning BCbb varied from zero to 9.75 μg/m3, with a mean of 0.38 μg/m3. As Table 1 shows, all of BC, BCff and Bbb concentrations were, on average, greater in January to March, before the MCO, and lower during April and May. Since the MCO had focus on reducing movement, and hence traffic flow, it is not surprising to observe that fossil-fuel derived BC decreased relatively more than the biomass-burning BC, by 41% for BCff and by 26% for BCbb. The increase in BB% at the end of April was affected by local burning activities from the nearby agricultural park (https://www.maeps.com.my/, accessed on 3 June 2021).
The nature of the variability in the BC at our monitoring site is captured in the frequency histogram of the AAE values presented in Figure 3. The AAE for 470 and 950 nm is commonly used for evaluating the BC source [49,50,51]. It is regarded that AAE in the range 0.8 to 1.3 shows fossil fuel-related aerosols from traffic emissions and domestic/industrial fuel combustion [49,52]. An AAE of 1.8–3.5 suggests the contributions of light-absorbing particles from wood and agricultural waste burning [51,53,54]. In our study, we observed AAE predominantly within the range 1.1–1.6, indicating the predominance of soot-like BC from traffic and other fossil-fuel emissions, mixed to a lesser or greater difference with biomass-burning particles which can include proportions of both BC and UV-absorbing brown carbon [55].

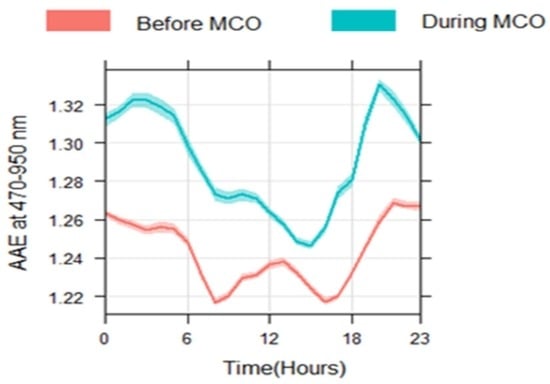
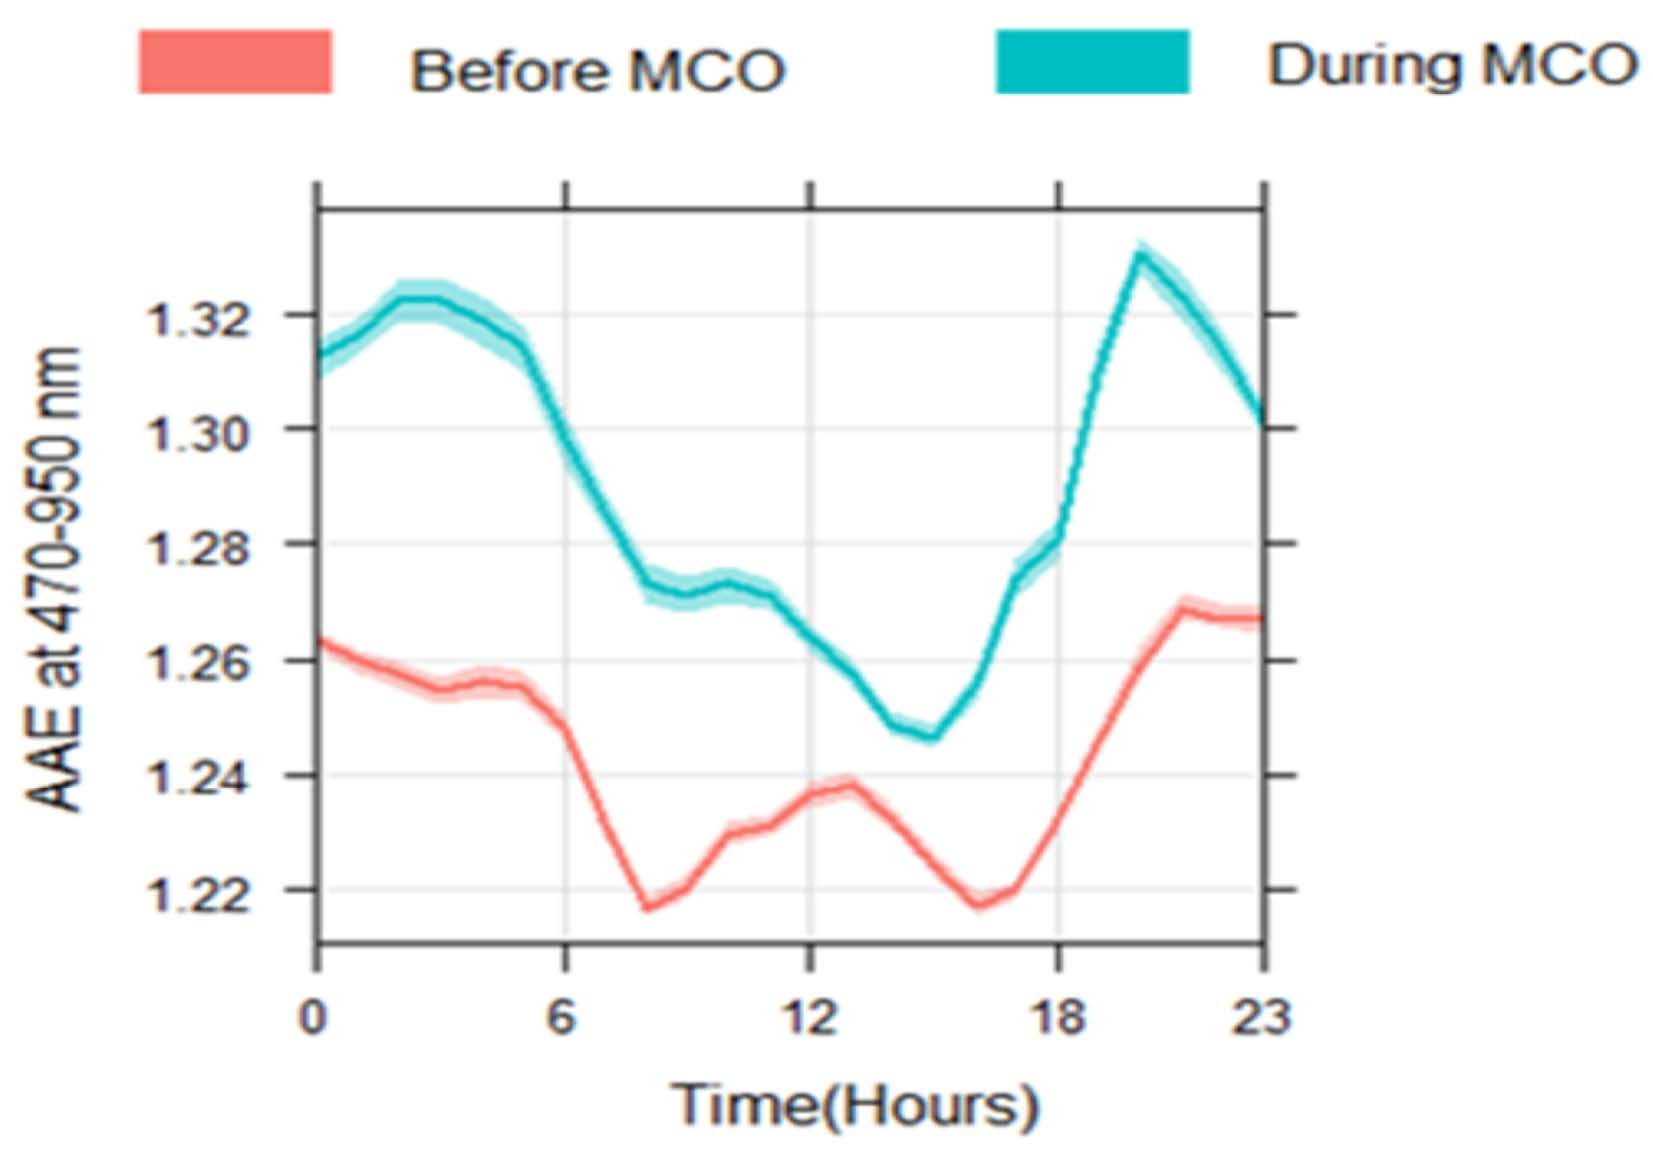
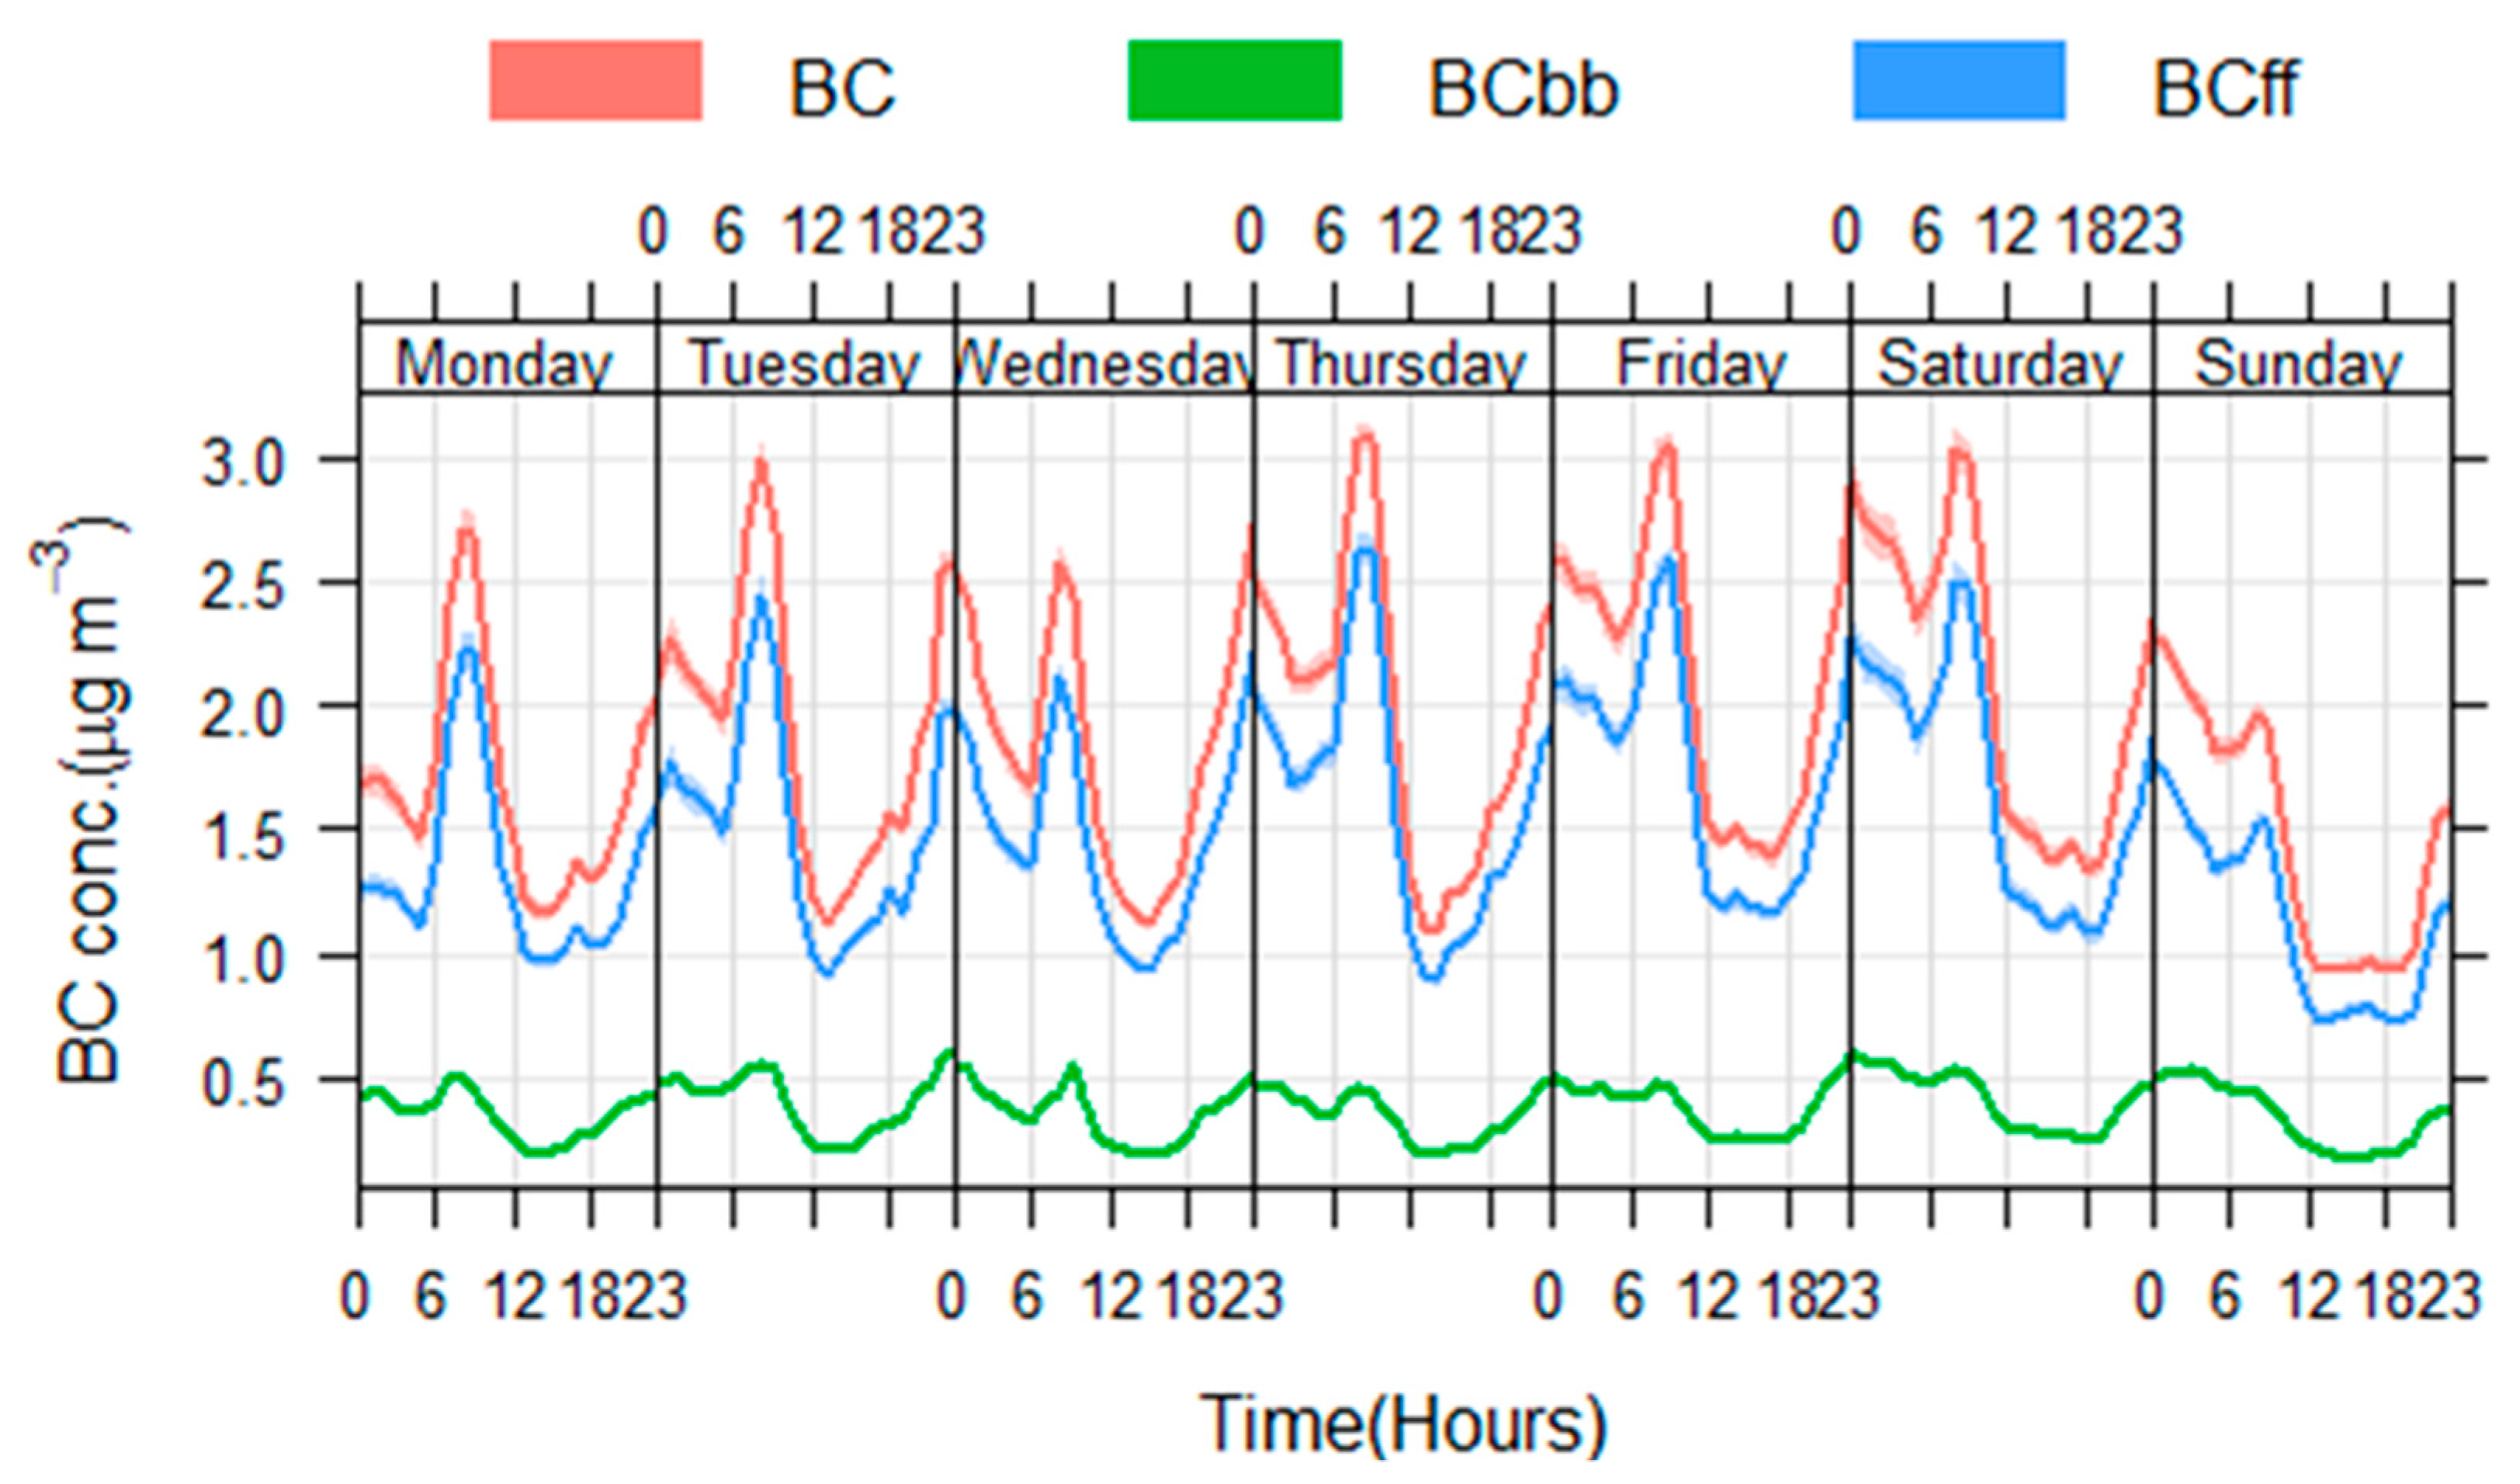
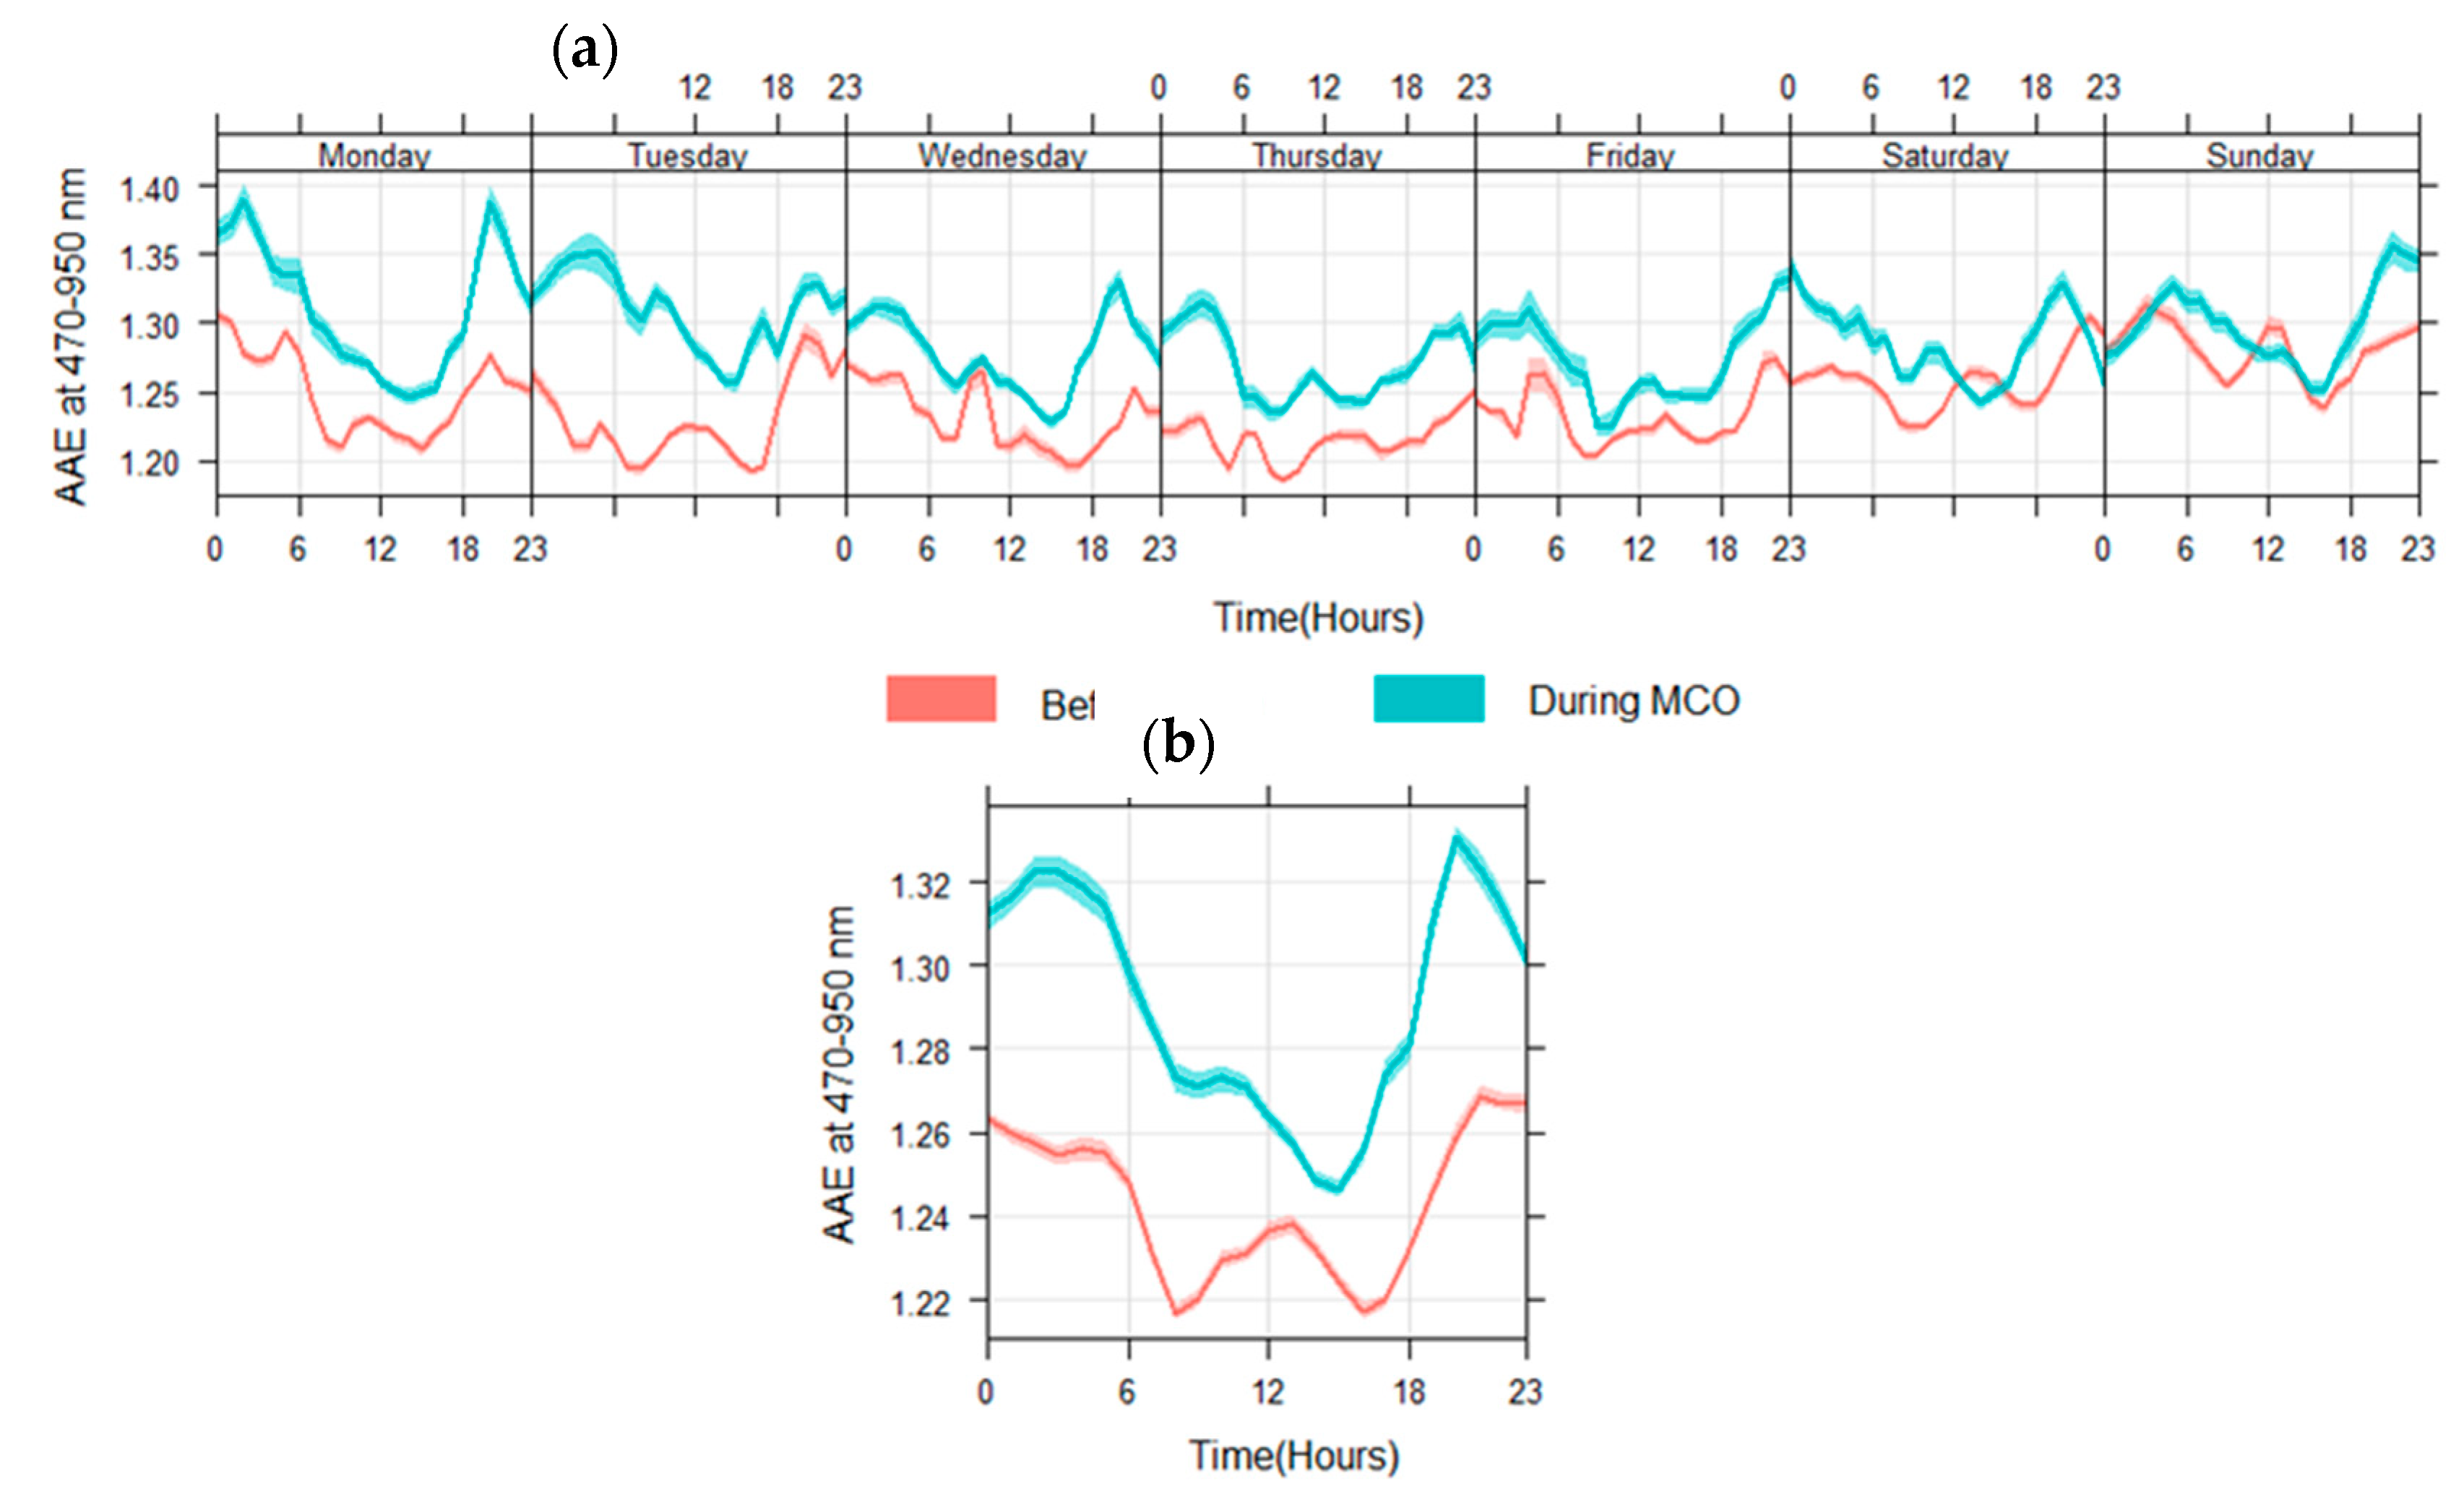
3.2. Diurnal Variations of BC Concentrations and AAE

The concentrations of BC and of its BCbb and BCff components have substantial diurnal variations, as revealed in Figure 4. Each day of the week has a similar diurnal cycle in BC concentrations with two maxima, one around 03:00 and the other around 11:00, and a minimum for a few hours at around 13:00 to 15:00. The diurnal pattern in BCff follows the same relative trend, driven by the finding noted above, that BCff is the dominant component of BC.
On most days the maximum that occurs before noon is the greatest of the two maxima in BC and BCff concentrations. This is due to more BC emitted into the air during the daytime because of enhanced fossil-fuel combustion activities (particularly vehicle emissions) [56]. On Sundays, the daytime peak is substantially lower than the daytime peak on the other days, again reflecting that traffic is the dominant source of BCff and BC at this location and that traffic activity, particularly of diesel-fuelled trucks, is lower on Sundays than the other days. This is supported by the fact that both BC and BCff are also lower throughout the whole diurnal cycle on Sunday than on the other days of the week. Furthermore, we can observe that the reduced BC emissions from traffic at the weekend also lead to slightly lower BC and BCff concentrations on Mondays compared with the other weekdays, particularly for the early part of Mondays. The reason that BC and BCff are still high on Saturdays, even though traffic (particularly truck traffic) is also lower on a Saturday compared with weekdays, is because emissions from the end of the ‘working’ week still persist within the boundary layer overnight into Saturday.
The range in the diurnal variation of BC is large, at around 1.7 µg/m3. The average diurnal maximum in BC concentration is around 3.0 µg/m3, whilst the diurnal minimum in BC concentration is around 1.3 µg/m3. The consequence is that the concentrations of BC, and hence human exposure to it, vary by more than a factor 2 on average each day. The average diurnal maximum and minimum concentrations of BCff are around 2.5 µg/m3 and 1.0 µg/m3, respectively, meaning a slightly greater diurnal factor range for BCff than for total BC. The diurnal trend for BCbb does not show the dominance of a peak around noon. As a broad pattern, BCbb is highest between midnight and noon, falling to a minimum at around 18:00 before rising again in the late evening. It is also relevant to note that the BCbb concentrations do not show strong weekday versus weekend differences in magnitude, in contrast to the BC and BCff concentrations that are strongly influenced by the weekday versus weekend differences in their sources.
The diurnal patterns in BC are driven by the combination of emissions and boundary layer depth. The substantial diurnal range in BC indicates substantial sensitivity to meteorology [57]. Overnight, the boundary layer becomes shallower than during the day so the concentration of pollutants remaining in the boundary layer increases, particularly for non-reactive pollutants such as BC. Lower dispersion at night is also caused by lower wind speed at night. A similar observation of higher PM2.5 levels in the morning in southern Peninsular Malaysia was found by Dahari et al. [58].
In the equatorial region of this study location, sunrise (and sunset) are rapid and the strong insolation leads to the rapid increase in boundary layer height at sunrise. This leads to the decrease in BC concentrations in the earliest part of the morning. However, since most BC is derived from anthropogenic activities, from traffic in particular, the initial decline in BC during the day from increasing boundary layer depth is more than offset by the increased BC emissions in the morning. The boundary layer height, and boundary layer ventilation, reach a maximum during the early afternoon, which explains the rapid decrease in BC concentrations at this time. At sunset, the boundary layer decreases, and atmospheric stability increases, so BC concentrations increase again. The BCbb component is less impacted by diurnal cycles in its emissions than the BCff component, so the diurnal pattern of BCbb is even more strongly coupled to the diurnal pattern in boundary layer depth than BCff and BC. The biomass burning BCbb concentration is consistently in the range 0.21–0.49 μg/m3 on all seven days.
Figure 5 shows the diurnal variation of AAE values before and during MCO by day of week, and for all days together. Some striking observations emerge. Both before and during the MCO the AAE is lower during the daytime and higher during the night-time. For the pre-MCO period the AAE decreases from about 1.26 at night to 1.22 during the day. Since AAE is independent of concentration (and hence of boundary layer depth) this further supports the interpretation above that emissions of fossil-fuel derived BC, which has lower AAE than biomass burning BC, are greater during the day than at night. The highest AAE peak (~1.27) occurs at 21:00 to 03:00, coinciding with the least traffic on the Expressways and elsewhere. The AAE values decrease sharply at about 06:00 and then increase sharply again at 18:00, corresponding to the start and end of the major traffic periods. This interpretation is also consistent with the slightly higher AAE values on Sundays compared with other days of the week, reflecting the somewhat lower contribution of traffic-derived fossil-fuel BC on Sundays, compared with weekdays.
Another clear feature of Figure 5 is the persistently higher AAE values during the MCO compared with before. This confirms that BC during the MCO was less influenced by traffic-related fossil-fuel combustion BC and consequently more influenced by biomass-burning BC than before. The AAE during MCO is higher, on average, by about 0.04–0.05. This finding is in line with recent studies on the impact of Athens lockdown on carbonaceous particle concentrations [59]. Interestingly, the difference in AAE during MCO compared with before MCO is least on Sunday. This is because traffic was already a less important source on Sundays pre-MCO so the implementation of the MCO has lowest relative impact on Sundays thereafter.

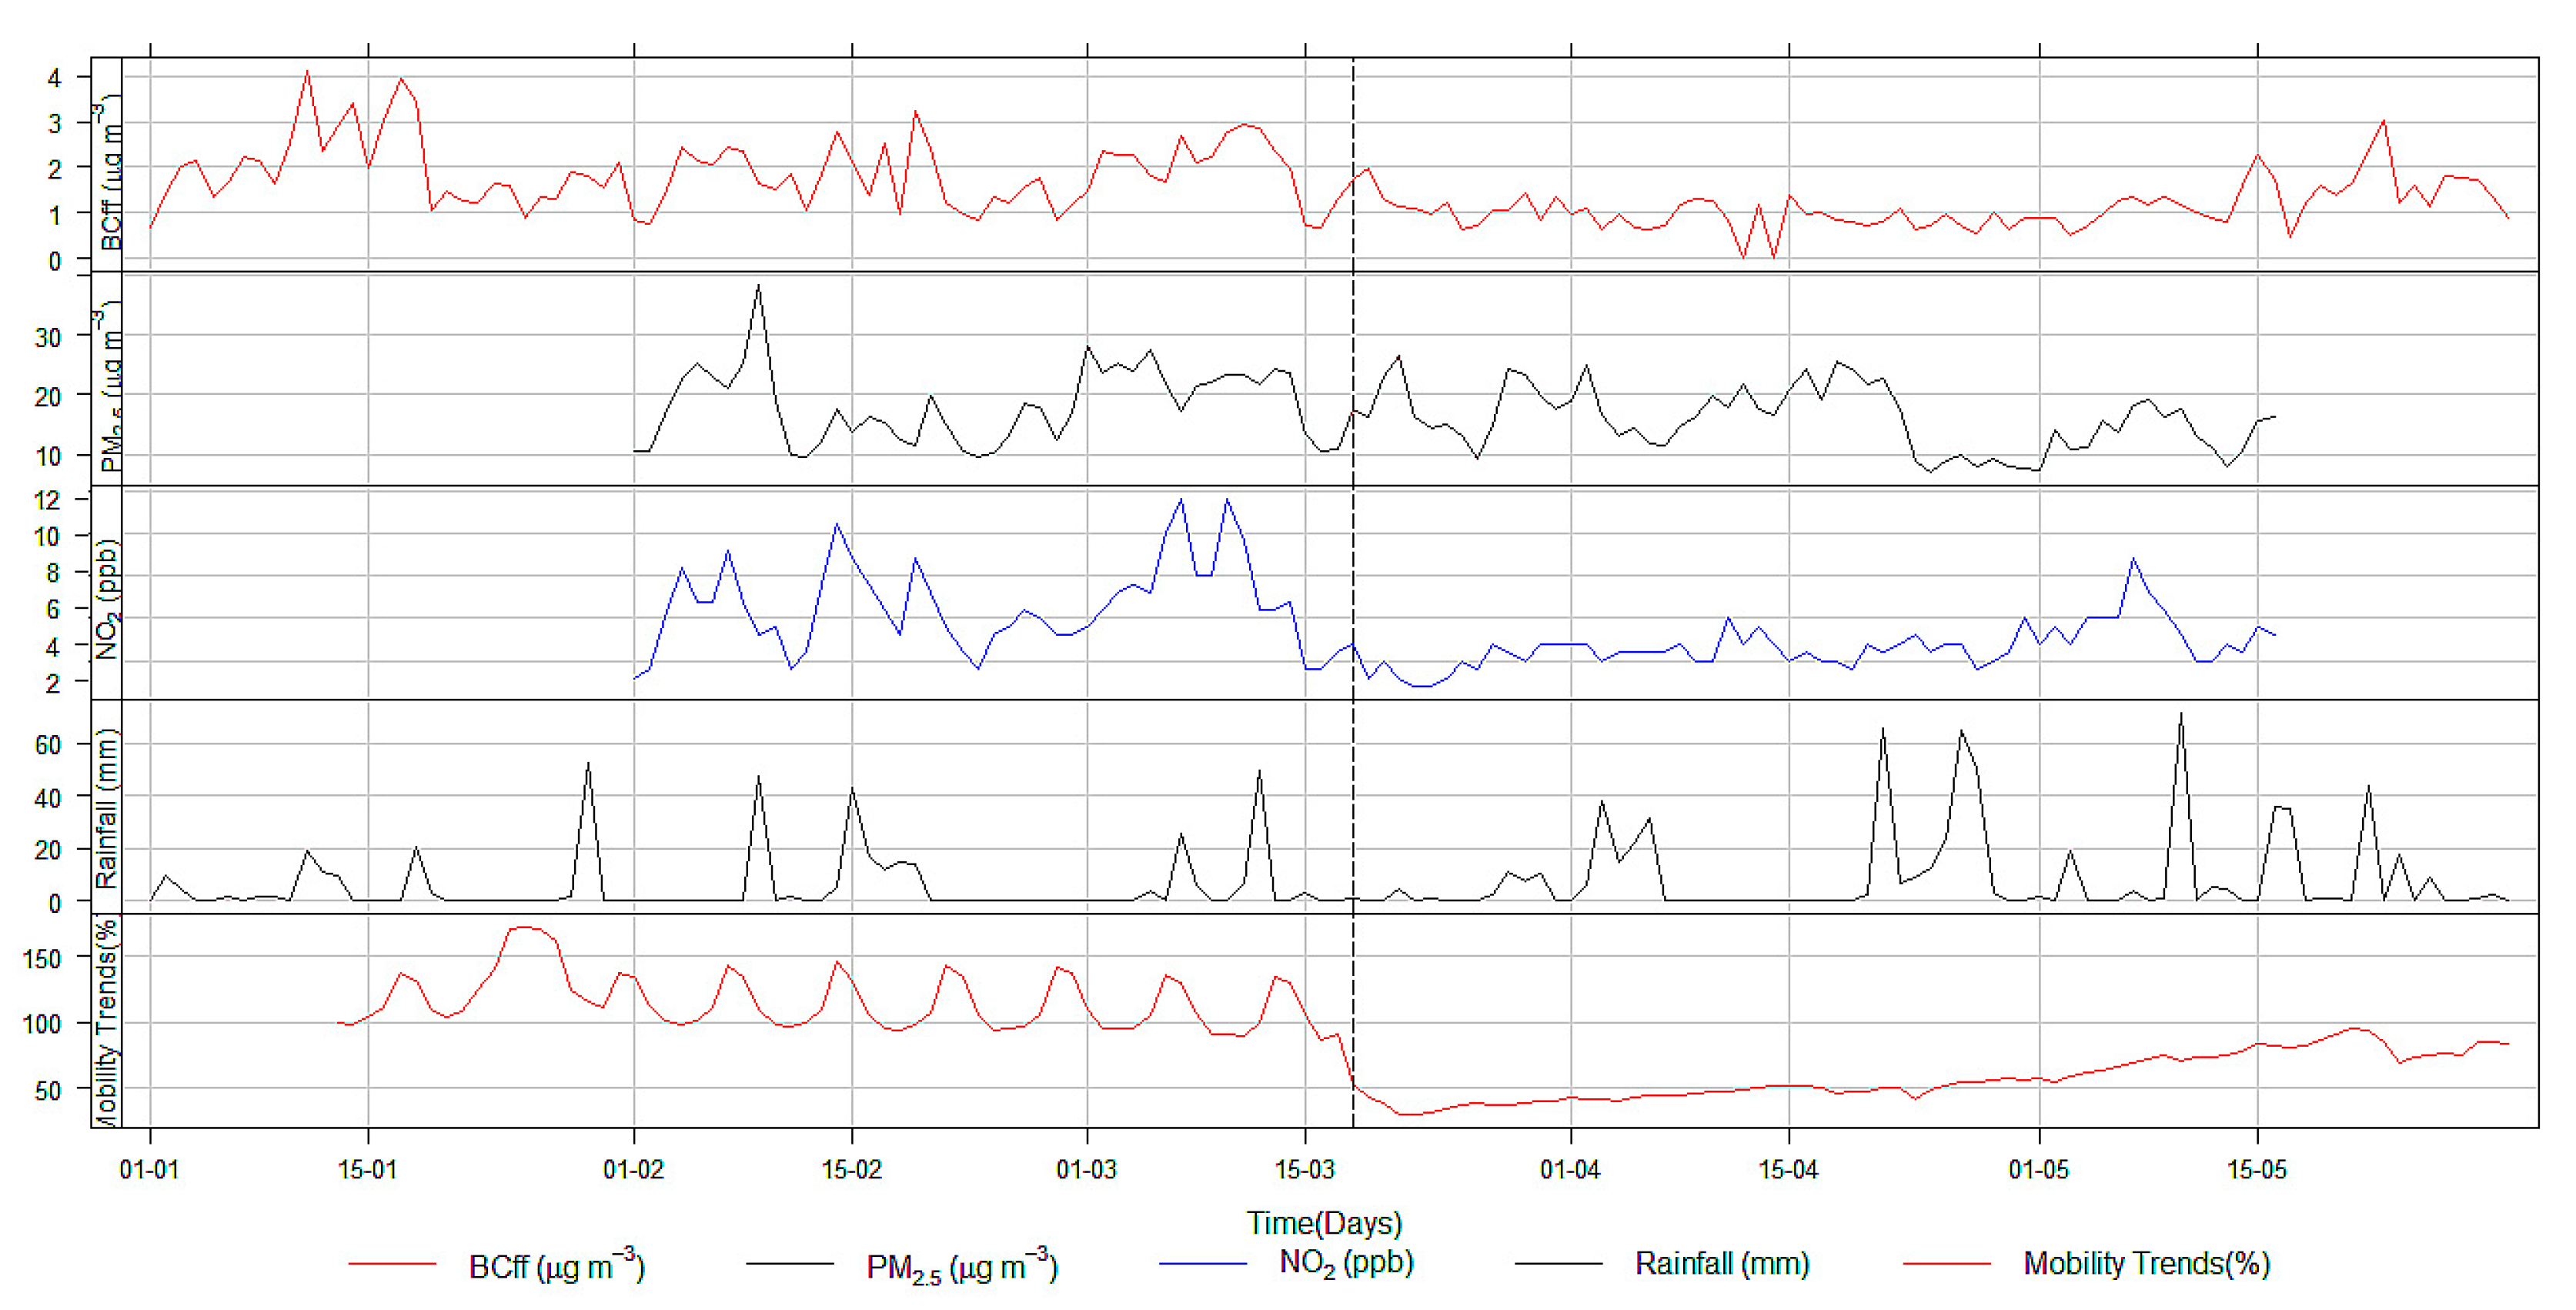
3.3. Relationship with Mobility Data, NO2, PM2.5 and Meteorological Variables

The daily concentrations of BCff, NO2, PM2.5 and mobility trend (%) are shown in Figure 6. During this study, an increase of 30–50% in mobility on the road is associated with an increase of 0.3 μg/m3 BCff concentrations, 8–10 μg/m3 PM2.5 concentrations and 2.5 ppb NO2 mixing ratio before the MCO, and a reduction of 40–50% in mobility during the MCO is associated with a decrease of 1.2 μg/m3 BCff concentrations, 6–9 μg/m3 PM2.5 concentrations and a 3.25 ppb NO2 mixing ratio. The transit on the Klang Valley roads was drastically reduced during MCO and the changes in the air pollutant concentrations indicate the influence of vehicle emissions. The results are in line with similar observations made by Cárcel-Carrasco et al. (2021) in a number of European countries during their lockdown periods [60]. Their study also utilized Apple’s mobility data [43] to illustrate the vehicle movements and the reduction of PM2.5. It is noted that different vehicles have different engine types and exhibit varying BC emission factors, so changes in mobility trends have to be viewed as an indirect measure of changes in BC concentrations.
Concentrations of BC were positively correlated with NO2 (R = 0.71) and PM2.5 (R = 0.52). The full correlation matrix is shown in SI Figure S1. The stronger correlation of BC with NO2 than with PM2.5 is consistent with combustion, and particularly traffic emissions, being a common source for these two pollutants. Whilst a proportion of PM2.5 also derives from primary anthropogenic emissions (and BC is itself a component of PM2.5), the secondary components of PM2.5 will not be linked so strongly to the same primary sources of combustion emission which explains the somewhat weaker correlation of BC (and NO2) with PM2.5.
Some correlation between the air pollutants is also driven by the strong effect of diurnal boundary layer depth on pollutant concentrations (as discussed above) and synoptic-scale meteorology. The pollutants are, however, only very weakly correlated, if at all, with the meteorological variables. Although there is a low correlation between BC concentration and amount of rainfall (R = 0.04), precipitation can contribute to the washing process on particulate matter, which includes BC. There are small, negative correlations with wind speed (R in the range −0.08 to −0.20). Whilst higher wind speed enhances dilution of air pollutants [61], the moderate range of wind speed at this tropical monitor location means the wind effect is not strong. The general lack of correlation with all meteorological variables similarly reflects the relatively moderate range of variation in these variables in the tropics.

4. Conclusions

We present the first time series of continuous measurements of black carbon (BC) for Malaysia. Our measurements coincided with the implementation of a Movement Control Order (MCO) in Malaysia in response to COVID-19, providing us with an unexpected opportunity to analyze the impact of the MCO on BC.
The mean concentration of BC before the MCO was 2.34 µg/m3 which decreased by 38% to 1.45 µg/m3 during the MCO. From analysis of the absorption Ångström exponent (AAE) we show that BC at our suburban location in the Klang Valley near Kuala Lumpur is dominated by fossil-fuel BC, which, supporting evidence suggests, is associated with traffic. The BC and BCff show very strong diurnal cycles, which also show some weekday-weekend differences, with maxima during the night and just before noon and minima in the afternoon. These patterns indicate strong influences from both traffic emissions and boundary layer depth on the concentrations. The BC was strongly correlated with NO2 (R = 0.71), another marker of traffic emission, but less strongly with PM2.5 (R = 0.52). The diurnal range in BC concentration exceeded 1.5 µg/m3 or approximately a factor of 2 range in exposure to BC. Although BC was correlated with other air pollutants, pollutants were not strongly correlated with standard meteorological variables (a weak positive and negative association with precipitation and wind speed respectively).
During the MCO the concentration of BCff decreased by more than the concentration derived from biomass burning (BCbb). Before the MCO the average proportion BCbb was 18.6% (0.43 µg/m3), whilst during the MCO the proportion increased to 22.9% (0.32 µg/m3).
The AAE values ranged from 1.1 to 1.6. Pronounced diurnal variations of AAE values were observed, with higher values during night-time and rapid decreases/increases at around 06:00/18:00, respectively, corresponding to emissions of BC from traffic during the day which has lower AAE. The average AAE also showed pronounced increase during the MCO compared with before, again emphasizing the lower contribution from fossil fuel (traffic) in the latter period.
Although measurements were made at only one site, these first measurements of light-absorbing carbon concentration in Malaysia act as a baseline reference against which future studies can be compared. The knowledge gained from characterizing BC sources in our study will provide tools for better decision-making, such as source emission restrictions, particularly from vehicles, and will aid in better planning for low-carbon city projects in Malaysia. Given that BC emissions are linked to nearby anthropogenic activities, future research should focus on how spatial and temporal variations from combustion-related emissions (traffic and biomass burning) can cause health effects.

Supplementary Materials

The following are available online at https://0-www-mdpi-com.brum.beds.ac.uk/article/10.3390/atmos12060784/s1, Figure S1: Correlation coefficient matrix between hourly BC, PM2.5, NO2 concentrations and the meteorological variables temperature, wind speed, relative humidity and rainfall. Table S1: Mean BC concentrations (μg/m3) measured in this and other recent studies.

Author Contributions

Conceptualization, E.E. and S.D.; methodology, E.E.; investigation, E.E. and Z.T.A.R.; formal analysis, E.E., M.R.H. and S.D.; data curation; E.E. and S.D.; original draft preparation, E.E. and S.D.; writing—review, and editing, E.E., S.D., M.R.H., S.M.P., Z.T.A.R. and M.F.K.; visualization, E.E. and S.D.; supervision, E.E.; project administration, E.E.; funding acquisition, E.E. All authors have read and agreed to the published version of the manuscript.

Funding

This research is supported by the Geran Inisiatif Putra Muda, Universiti Putra Malaysia (GP-IPM/2020/9683000).

Institutional Review Board Statement

Not applicable.

Informed Consent Statement

Not applicable.

Data Availability Statement

The Aethalometer data are available on request from the corresponding author.

Acknowledgments

We sincerely acknowledge the Department of Environment (DOE) and Department of Meteorology Malaysia for providing us the observation data on air quality and meteorology. We would like to thank Munirah Yaman for assisting in the data collection. We also would like to acknowledge Ivan Iskra and Asta Gregoric for providing us technical guidance on the AE33 instrument. We would like to thank the technician of the Faculty of Medicine and Health Sciences, Universiti Putra, Malaysia, for giving us access to the site sampling.

Conflicts of Interest

The authors declare no conflict of interest.

References

  1. UNEP/WMO. UNEP/WMO: Integrated Assessment of Black Carbon and Tropospheric Ozone, United Nations Environment Programme and World Meteorological Organisation. Available online: https://www.ccacoalition.org/en/resources/integrated-assessment-black-carbon-and-tropospheric-ozone (accessed on 2 April 2021).
  2. Highwood, E.J.; Kinnersley, R.P. When smoke gets in our eyes: The multiple impacts of atmospheric black carbon on climate, air quality and health. Environ. Int. 2006, 32, 560–566. [Google Scholar] [CrossRef]
  3. Santoso, M.; Dwiana Lestiani, D.; Hopke, P.K. Atmospheric black carbon in PM2.5 in Indonesian cities. J. Air Waste Manag. Assoc. 2013, 63, 1022–1025. [Google Scholar] [CrossRef] [PubMed] [Green Version]
  4. Liu, Q.; Ma, T.; Olson, M.R.; Liu, Y.; Zhang, T.; Wu, Y.; Schauer, J.J. Temporal variations of black carbon during haze and non-haze days in Beijing. Sci. Rep. 2016, 6, 33331. [Google Scholar] [CrossRef]
  5. Bové, H.; Bongaerts, E.; Slenders, E.; Bijnens, E.M.; Saenen, N.D.; Gyselaers, W.; Van Eyken, P.; Plusquin, M.; Roeffaers, M.B.J.; Ameloot, M.; et al. Ambient black carbon particles reach the fetal side of human placenta. Nat. Commun. 2019, 10, 3866. [Google Scholar] [CrossRef]
  6. Bond, T.C.; Doherty, S.J.; Fahey, D.W.; Forster, P.M.; Berntsen, T.; DeAngelo, B.J.; Flanner, M.G.; Ghan, S.; Kärcher, B.; Koch, D.; et al. Bounding the role of black carbon in the climate system: A scientific assessment. J. Geophys. Res. Atmos. 2013, 118, 5380–5552. [Google Scholar] [CrossRef]
  7. Janssen, N.A.; Gerlofs-Nijland, M.E.; Lanki, T.; Salonen, R.O.; Cassee, F. Health Effects of Black Carbon; WHO Regional Office for Europe: Copenhagen, Denmark, 2012; ISBN 978-92-89002653. [Google Scholar]
  8. Badarinath, K.V.S.; Kumar Kharol, S.; Kiran Chand, T.R.; Parvathi, Y.G.; Anasuya, T.; Jyothsna, A.N. Variations in black carbon aerosol, carbon monoxide and ozone over an urban area of Hyderabad, India, during the forest fire season. Atmos. Res. 2007, 85, 18–26. [Google Scholar] [CrossRef]
  9. Mauderly, J.L.; Chow, J.C. Health effects of organic aerosols. Inhal. Toxicol. 2008, 20, 257–288. [Google Scholar] [CrossRef]
  10. Pope, C.A., 3rd; Dockery, D.W. Health effects of fine particulate air pollution: Lines that connect. J. Air Waste Manag. Assoc. 2006, 56, 709–742. [Google Scholar] [CrossRef] [PubMed]
  11. Briggs, N.L.; Long, C.M. Critical review of black carbon and elemental carbon source apportionment in Europe and the United States. Atmos. Environ. 2016, 144, 409–427. [Google Scholar] [CrossRef]
  12. Klimont, Z.; Kupiainen, K.; Heyes, C.; Purohit, P.; Cofala, J.; Rafaj, P.; Borken-Kleefeld, J.; Schöpp, W. Global anthropogenic emissions of particulate matter including black carbon. Atmos. Chem. Phys. 2017, 17, 8681–8723. [Google Scholar] [CrossRef] [Green Version]
  13. Huang, R.-J.; Zhang, Y.; Bozzetti, C.; Ho, K.-F.; Cao, J.-J.; Han, Y.; Daellenbach, K.R.; Slowik, J.G.; Platt, S.M.; Canonaco, F.; et al. High secondary aerosol contribution to particulate pollution during haze events in China. Nature 2014, 514, 218–222. [Google Scholar] [CrossRef] [Green Version]
  14. Guo, B.; Wang, Y.; Zhang, X.; Che, H.; Ming, J.; Yi, Z. Long-Term Variation of Black Carbon Aerosol in China Based on Revised Aethalometer Monitoring Data. Atmosphere 2020, 11, 684. [Google Scholar] [CrossRef]
  15. Streets, D.G.; Yarber, K.F.; Woo, J.-H.; Carmichael, G.R. Biomass burning in Asia: Annual and seasonal estimates and atmospheric emissions. Glob. Biogeochem. Cycles 2003, 17. [Google Scholar] [CrossRef] [Green Version]
  16. Budisulistiorini, S.H.; Riva, M.; Williams, M.; Chen, J.; Itoh, M.; Surratt, J.D.; Kuwata, M. Light-Absorbing Brown Carbon Aerosol Constituents from Combustion of Indonesian Peat and Biomass. Environ. Sci. Technol. 2017, 51, 4415–4423. [Google Scholar] [CrossRef]
  17. Kim Oanh, N.T.; Permadi, D.A.; Hopke, P.K.; Smith, K.R.; Dong, N.P.; Dang, A.N. Annual emissions of air toxics emitted from crop residue open burning in Southeast Asia over the period of 2010–2015. Atmos. Environ. 2018, 187, 163–173. [Google Scholar] [CrossRef]
  18. Sahu, L.K.; Kondo, Y.; Miyazaki, Y.; Pongkiatkul, P.; Kim Oanh, N.T. Seasonal and diurnal variations of black carbon and organic carbon aerosols in Bangkok. J. Geophys. Res. Atmos. 2011, 116. [Google Scholar] [CrossRef]
  19. Zhang, D.Z.; Grigg, J.; George, S.; Teoh, O.H.; Chay, O.M.; Pugalenthi, A.; Goh, A.; Wong, P.; Thomas, B. Environmental black carbon exposure in Singapore school children. Eur. Respir. J. 2015, 46, PA3409. [Google Scholar] [CrossRef]
  20. Alas, H.D.; Müller, T.; Birmili, W.; Kecorius, S.; Cambaliza, M.O.; Simpas, J.B.B.; Cayetano, M.; Weinhold, K.; Vallar, E.; Galvez, M.C.; et al. Spatial Characterization of Black Carbon Mass Concentration in the Atmosphere of a Southeast Asian Megacity: An Air Quality Case Study for Metro Manila, Philippines. Aerosol Air Qual. Res. 2018, 18, 2301–2317. [Google Scholar] [CrossRef] [Green Version]
  21. Santoso, M.; Lestiani, D.D.; Markwitz, A. Characterization of airborne particulate matter collected at Jakarta roadside of an arterial road. J. Radioanal. Nucl. Chem. 2013, 297, 165–169. [Google Scholar] [CrossRef]
  22. Abdul Halim, N.D.; Latif, M.T.; Ahamad, F.; Dominick, D.; Chung, J.X.; Juneng, L.; Khan, M.F. The long-term assessment of air quality on an island in Malaysia. Heliyon 2018, 4, e01054. [Google Scholar] [CrossRef] [Green Version]
  23. DBKL. Draft Kuala Lumpur Structure Plan. 2020. Available online: http://www.dbkl.gov.my/pskl2020/english/international_and_national_context_of_growth/index.htm (accessed on 2 June 2021).
  24. Yan, B.; Kennedy, D.; Miller, R.L.; Cowin, J.P.; Jung, K.-h.; Perzanowski, M.; Balletta, M.; Perera, F.P.; Kinney, P.L.; Chillrud, S.N. Validating a nondestructive optical method for apportioning colored particulate matter into black carbon and additional components. Atmos. Environ. 2011, 45, 7478–7486. [Google Scholar] [CrossRef] [Green Version]
  25. Sharma, S.; Brook, J.R.; Cachier, H.; Chow, J.; Gaudenzi, A.; Lu, G. Light absorption and thermal measurements of black carbon in different regions of Canada. J. Geophys. Res. Atmos. 2002, 107, AAC 11-1–AAC 11-11. [Google Scholar] [CrossRef]
  26. Ran, L.; Deng, Z.Z.; Wang, P.C.; Xia, X.A. Black carbon and wavelength-dependent aerosol absorption in the North China Plain based on two-year aethalometer measurements. Atmos. Environ. 2016, 142, 132–144. [Google Scholar] [CrossRef]
  27. Wang, Y.; Hopke, P.K.; Rattigan, O.V.; Xia, X.; Chalupa, D.C.; Utell, M.J. Characterization of Residential Wood Combustion Particles Using the Two-Wavelength Aethalometer. Environ. Sci. Technol. 2011, 45, 7387–7393. [Google Scholar] [CrossRef] [PubMed]
  28. Wang, Y.; Hopke, P.K.; Rattigan, O.V.; Zhu, Y. Characterization of ambient black carbon and wood burning particles in two urban areas. J. Environ. Monit. JEM 2011, 13, 1919–1926. [Google Scholar] [CrossRef]
  29. Sandradewi, J.; Prévôt, A.S.H.; Szidat, S.; Perron, N.; Alfarra, M.R.; Lanz, V.A.; Weingartner, E.; Baltensperger, U. Using Aerosol Light Absorption Measurements for the Quantitative Determination of Wood Burning and Traffic Emission Contributions to Particulate Matter. Environ. Sci. Technol. 2008, 42, 3316–3323. [Google Scholar] [CrossRef]
  30. Herich, H.; Hueglin, C.; Buchmann, B. A 2.5 year’s source apportionment study of black carbon from wood burning and fossil fuel combustion at urban and rural sites in Switzerland. Atmos. Meas. Tech. 2011, 4, 1409–1420. [Google Scholar] [CrossRef] [Green Version]
  31. Favez, O.; El Haddad, I.; Piot, C.; Boréave, A.; Abidi, E.; Marchand, N.; Jaffrezo, J.L.; Besombes, J.L.; Personnaz, M.B.; Sciare, J.; et al. Inter-comparison of source apportionment models for the estimation of wood burning aerosols during wintertime in an Alpine city (Grenoble, France). Atmos. Chem. Phys. 2010, 10, 5295–5314. [Google Scholar] [CrossRef] [Green Version]
  32. Segura, S.; Estellés, V.; Titos, G.; Lyamani, H.; Utrillas, M.P.; Zotter, P.; Prévôt, A.S.H.; Močnik, G.; Alados-Arboledas, L.; Martínez-Lozano, J.A. Determination and analysis of in situ spectral aerosol optical properties by a multi-instrumental approach. Atmos. Meas. Tech. 2014, 7, 2373–2387. [Google Scholar] [CrossRef] [Green Version]
  33. Drinovec, L.; Močnik, G.; Zotter, P.; Prévôt, A.S.H.; Ruckstuhl, C.; Coz, E.; Rupakheti, M.; Sciare, J.; Müller, T.; Wiedensohler, A.; et al. The “dual-spot” Aethalometer: An improved measurement of aerosol black carbon with real-time loading compensation. Atmos. Meas. Tech. 2015, 8, 1965–1979. [Google Scholar] [CrossRef] [Green Version]
  34. Backman, J.; Virkkula, A.; Vakkari, V.; Beukes, J.P.; Van Zyl, P.G.; Josipovic, M.; Piketh, S.; Tiitta, P.; Chiloane, K.; Petäjä, T.; et al. Differences in aerosol absorption Ångström exponents between correction algorithms for a particle soot absorption photometer measured on the South African Highveld. Atmos. Meas. Tech. 2014, 7, 4285–4298. [Google Scholar] [CrossRef] [Green Version]
  35. Scientific, M. Aethalometer® Model AE33 User Manual-Version 1.56. Available online: https://mageesci.com/dpack/Magee_Scientific_AE33_UsersManual_Rev156_letter.pdf (accessed on 20 February 2020).
  36. Weingartner, E.; Saathoff, H.; Schnaiter, M.; Streit, N.; Bitnar, B.; Baltensperger, U. Absorption of light by soot particles: Determination of the absorption coefficient by means of aethalometers. J. Aerosol Sci. 2003, 34, 1445–1463. [Google Scholar] [CrossRef]
  37. Arnott, W.P.; Hamasha, K.; Moosmüller, H.; Sheridan, P.J.; Ogren, J.A. Towards Aerosol Light-Absorption Measurements with a 7-Wavelength Aethalometer: Evaluation with a Photoacoustic Instrument and 3-Wavelength Nephelometer. Aerosol Sci. Technol. 2005, 39, 17–29. [Google Scholar] [CrossRef]
  38. Moorthy, K.K.; Babu, S.S.; Satheesh, S.K.; Srinivasan, J.; Dutt, C.B.S. Dust absorption over the “Great Indian Desert” inferred using ground-based and satellite remote sensing. J. Geophys. Res. Atmos. 2007, 112. [Google Scholar] [CrossRef] [Green Version]
  39. RCoreTeam. R: A Language and Environment for Statistical Computing. Available online: https://www.r-project.org (accessed on 4 June 2020).
  40. Carslaw, D.C.; Ropkins, K. Openair—An R package for air quality data analysis. Environ. Model. Softw. 2012, 27–28, 52–61. [Google Scholar] [CrossRef]
  41. Carslaw, D.C.; Ropkins, K. Openair: Open-Source Tools for the Analysis of Air Pollution Data; King’s College: London, UK, 2015. [Google Scholar]
  42. Apple Inc. Apple Mobility Data. Available online: https://covid19.apple.com/mobility (accessed on 8 November 2020).
  43. Kurita, J.; Sugishita, Y.; Sugawara, T.; Ohkusa, Y. Evaluating Apple Inc Mobility Trend Data Related to the COVID-19 Outbreak in Japan: Statistical Analysis. JMIR Public Health Surveill. 2021, 7, e20335. [Google Scholar] [CrossRef]
  44. Mousavi, A.; Sowlat, M.H.; Lovett, C.; Rauber, M.; Szidat, S.; Boffi, R.; Borgini, A.; De Marco, C.; Ruprecht, A.A.; Sioutas, C. Source apportionment of black carbon (BC) from fossil fuel and biomass burning in metropolitan Milan, Italy. Atmos. Environ. 2019, 203, 252–261. [Google Scholar] [CrossRef]
  45. Kiran, V.R.; Talukdar, S.; Ratnam, M.V.; Jayaraman, A. Long-term observations of black carbon aerosol over a rural location in southern peninsular India: Role of dynamics and meteorology. Atmos. Environ. 2018, 189, 264–274. [Google Scholar] [CrossRef]
  46. Xiao, S.; Yu, X.; Zhu, B.; Kumar, K.R.; Li, M.; Li, L. Characterization and source apportionment of black carbon aerosol in the Nanjing Jiangbei New Area based on two years of measurements from Aethalometer. J. Aerosol Sci. 2020, 139, 105461. [Google Scholar] [CrossRef]
  47. Liu, Y.; Yan, C.; Zheng, M. Source apportionment of black carbon during winter in Beijing. Sci. Total Environ. 2018, 618, 531–541. [Google Scholar] [CrossRef]
  48. Targino, A.C.; Gibson, M.D.; Krecl, P.; Rodrigues, M.V.C.; dos Santos, M.M.; de Paula Corrêa, M. Hotspots of black carbon and PM2.5 in an urban area and relationships to traffic characteristics. Environ. Pollut. 2016, 218, 475–486. [Google Scholar] [CrossRef]
  49. Gyawali, M.; Arnott, W.P.; Lewis, K.; Moosmüller, H. In situ aerosol optics in Reno, NV, USA during and after the summer 2008 California wildfires and the influence of absorbing and non-absorbing organic coatings on spectral light absorption. Atmos. Chem. Phys. 2009, 9, 8007–8015. [Google Scholar] [CrossRef] [Green Version]
  50. Lim, S.; Lee, M.; Kim, S.W.; Yoon, S.C.; Lee, G.; Lee, Y.J. Absorption and scattering properties of organic carbon versus sulfate dominant aerosols at Gosan climate observatory in Northeast Asia. Atmos. Chem. Phys. 2014, 14, 7781–7793. [Google Scholar] [CrossRef] [Green Version]
  51. Dumka, U.C.; Kaskaoutis, D.G.; Tiwari, S.; Safai, P.D.; Attri, S.D.; Soni, V.K.; Singh, N.; Mihalopoulos, N. Assessment of biomass burning and fossil fuel contribution to black carbon concentrations in Delhi during winter. Atmos. Environ. 2018, 194, 93–109. [Google Scholar] [CrossRef] [Green Version]
  52. Bergstrom, R.W.; Pilewskie, P.; Russell, P.B.; Redemann, J.; Bond, T.C.; Quinn, P.K.; Sierau, B. Spectral absorption properties of atmospheric aerosols. Atmos. Chem. Phys. 2007, 7, 5937–5943. [Google Scholar] [CrossRef] [Green Version]
  53. Stockwell, C.E.; Christian, T.J.; Goetz, J.D.; Jayarathne, T.; Bhave, P.V.; Praveen, P.S.; Adhikari, S.; Maharjan, R.; DeCarlo, P.F.; Stone, E.A.; et al. Nepal Ambient Monitoring and Source Testing Experiment (NAMaSTE): Emissions of trace gases and light-absorbing carbon from wood and dung cooking fires, garbage and crop residue burning, brick kilns, and other sources. Atmos. Chem. Phys. 2016, 16, 11043–11081. [Google Scholar] [CrossRef] [Green Version]
  54. Liakakou, E.; Kaskaoutis, D.G.; Grivas, G.; Stavroulas, I.; Tsagkaraki, M.; Paraskevopoulou, D.; Bougiatioti, A.; Dumka, U.C.; Gerasopoulos, E.; Mihalopoulos, N. Long-term brown carbon spectral characteristics in a Mediterranean city (Athens). Sci. Total Environ. 2020, 708, 135019. [Google Scholar] [CrossRef] [PubMed]
  55. Wan, X.; Kang, S.; Li, Q.; Rupakheti, D.; Zhang, Q.; Guo, J.; Chen, P.; Tripathee, L.; Rupakheti, M.; Panday, A.K.; et al. Organic molecular tracers in the atmospheric aerosols from Lumbini, Nepal, in the northern Indo-Gangetic Plain: Influence of biomass burning. Atmos. Chem. Phys. 2017, 17, 8867–8885. [Google Scholar] [CrossRef] [Green Version]
  56. Latif, M.T.; Dominick, D.; Hawari, N.S.S.L.; Mohtar, A.A.A.; Othman, M. The concentration of major air pollutants during the movement control order due to the COVID-19 pandemic in the Klang Valley, Malaysia. Sustain. Cities Soc. 2021, 66, 102660. [Google Scholar] [CrossRef]
  57. Chen, L.W.A.; Chow, J.C.; Wang, X.L.; Robles, J.A.; Sumlin, B.J.; Lowenthal, D.H.; Zimmermann, R.; Watson, J.G. Multi-wavelength optical measurement to enhance thermal/optical analysis for carbonaceous aerosol. Atmos. Meas. Tech. 2015, 8, 451–461. [Google Scholar] [CrossRef] [Green Version]
  58. Dahari, N.; Latif, M.T.; Muda, K.; Hussein, N. Influence of Meteorological Variables on Suburban Atmospheric PM2.5 in the Southern Region of Peninsular Malaysia. Aerosol Air Qual. Res. 2020, 20, 14–25. [Google Scholar] [CrossRef]
  59. Kaskaoutis, D.G.; Grivas, G.; Liakakou, E.; Kalivitis, N.; Kouvarakis, G.; Stavroulas, I.; Kalkavouras, P.; Zarmpas, P.; Dumka, U.C.; Gerasopoulos, E.; et al. Assessment of the COVID-19 Lockdown Effects on Spectral Aerosol Scattering and Absorption Properties in Athens, Greece. Atmosphere 2021, 12, 231. [Google Scholar] [CrossRef]
  60. Cárcel-Carrasco, J.; Pascual-Guillamón, M.; Salas-Vicente, F. Analysis on the Effect of the Mobility of Combustion Vehicles in the Environment of Cities and the Improvement in Air Pollution in Europe: A Vision for the Awareness of Citizens and Policy Makers. Land 2021, 10, 184. [Google Scholar] [CrossRef]
  61. Gupta, P.; Singh, S.P.; Jangid, A.; Kumar, R. Characterization of black carbon in the ambient air of Agra, India: Seasonal variation and meteorological influence. Adv. Atmos. Sci. 2017, 34, 1082–1094. [Google Scholar] [CrossRef]
Figure 1. Location of the monitoring site, marked as a red circle, in the Klang Valley, 28 km southeast of central Kuala Lumpur, Malaysia. The government air monitoring station for PM2.5 and NO2 (DOE PUTRAJAYA) and meteorology station (MET KLIA) are respectively marked as a green rectangle and a green triangle. (Source: ESRI).
Atmosphere 12 00784 g001
Figure 2. Time series of 1-min BC concentrations (μg/m3) (upper panel) and BB% (lower panel) between 1 January and 31 May 2020. The MCO for COVID-19 lockdown came into force on 18 March (shown by the vertical dotted line) and remained in place for the remainder of the time series.
Atmosphere 12 00784 g002
Figure 3. Frequency distribution of the aerosol absorption Ångström exponent (AAE) derived from absorptions at 470 nm and 950 nm.
Atmosphere 12 00784 g003
Figure 4. Mean day-of-the-week diurnal variations in concentrations of BC (red line), BCbb (green line), and BCff (blue line).
Atmosphere 12 00784 g004
Figure 5. Mean diurnal variations of aerosol absorption Ångström exponent (AAE) derived from absorptions at 470 and 950 nm before (red line) and during (blue line) the movement control order (MCO) for (a) each day of the week and (b) all days together.
Atmosphere 12 00784 g005
Figure 6. Time series of concentrations of daily mean BCff (μg/m3), PM2.5 (μg/m3), NO2 (ppb), rainfall (mm) and relative mobility trends (%). The MCO for COVID-19 lockdown came into force on 18 March (shown by the vertical dotted line) and remained in place for the remainder of the time series.
Atmosphere 12 00784 g006
Table 1. Summary of the mean (± standard deviation), 5th and 95th percentiles, and maximum (max) concentrations of 1-min BC (i.e., total BC), BCff (fossil-fuel BC) and BCbb, (biomass burning BC), and of percentage biomass burning (BB%), between 1 January 2020 and 31 May 2020 (150 days, 216,000 min). Summary data are also subdivided into measurements before the Movement Control Order (MCO) and during the MCO that was imposed on 18 March 2020.
PollutantsMean ± S.D.5th
Percentie
95th
Percentile
Max ***
Entire period:
BC (μg/m3)1.90 ± 0.700.973.5637.6
BCff (μg/m3)1.52 ± 0.321.082.0933.6
BCbb (μg/m3)0.38 ± 0.060.290.489.75
BB (%)20.9 ± 9.915.124.299.9
Before MCO:
BC (μg/m3)2.34 ± 0.181.283.1114.4
BCff (μg/m3)1.90 ± 0.101.022.527.71
BCbb (μg/m3)0.43 ± 0.020.220.589.75
BB (%)18.6 ± 4.814.621.698.7
During MCO:
BC (μg/m3)1.45 ± 0.520.841.8437.6
BCff (μg/m3)1.13 ± 0.210.641.4033.6
BCbb (μg/m3)0.32 ± 0.051.160.418.15
BB (%)22.9 ± 4.015.927.099.9
*** All minimum values are ≤ 0.1.
Publisher’s Note: MDPI stays neutral with regard to jurisdictional claims in published maps and institutional affiliations.

