1. Introduction
Large-scale human activities have led to drastic changes in the frequency of strong winds over the land surface, considerably endangering the safety of inland navigation and sustainable regional socio-economic development [
1,
2]. The cargo throughput of Yangtze River inland waterway transport accounts for approximately 55% of total cargo transport in China. Strong winds and associated secondary disasters (e.g., power disruption, bridge damage, ship accidents, etc.) have become the main destructive weather- and climate-related events along the Yangtze River inland waterway transportation [
3]. For example, in June 2015, a tornado caused the sinking of the "Eastern Star" passenger ship [
4]. The traditional view is that wind speeds in the Yangtze River basin have generally been decreasing over the past 50 years [
5], which may be related to the rising Arctic Oscillation (AO) index, urbanization, and large-scale climate change [
6,
7]. However, a new study found a rebounding trend in global surface wind speeds from 2010 to 2017, with a 17±2% increase in potential wind energy [
8]. Climate change has significantly affected the frequency, intensity, and magnitude of variability in global wind speeds [
9]. Land use/land cover changes (e.g., urbanization) can affect the surface roughness and cause small-scale wind disturbances [
10]; spatiotemporal variation in wind speed at large scales is further influenced by wind speed perturbations [
11]. Although the spatiotemporal variation relationships of wind speed at regional–global scales are well understood, characterizing multi-scale maximum wind speed variation due to urbanization and other surface processes in the Yangtze River inland waterway remains problematic.
Wind speed data for inland waterways are mainly derived from river-shore meteorological stations, 80–100 m meteorological observation towers, and climate data; the meteorological observations are often limited to monitoring environments, with missing data and low estimation [
12]. European Center for Medium-Range Weather Forecast (ECWMF) reanalysis data can be used to characterize long time series and large-scale climate changes caused by atmospheric circulation and greenhouse gas emissions, which are also a source of data for analyzing the spatiotemporal characteristics of wind speeds at regional scales [
13]. However, ECWMF reanalysis data do not sufficiently consider land surface processes during assimilation, resulting in low estimates of wind speed and low sensitivity to land use change [
14].
To address these issues, scale-down methods are generally used to downscale coarse-grid reanalysis data to local values. For example, statistical downscaling methods have been used to extrapolate and interpolate riverbank observations to obtain river surface wind speeds [
15], dynamic downscaling methods such as numerical simulations of weather forecasts have been adopted to obtain accurate data [
16], and coupled dynamic-statistical downscaling methods (e.g., the Wind Atlas Analysis and Application program) can also be used [
17,
18]. These methods can effectively reduce prediction-observation errors due to missing local features in climate models [
19]. Specifically, dynamic downscaling methods are numerical weather prediction models get their initial and boundary conditions from a low-resolution global forecast system and are interpolated into the model domain of interest [
20], which are sensitive to the boundary conditions, often lack assimilation in the initialization of mesoscale models, require a large computational volume, and have the uncertainty of interpolation methods and large systematic spatial errors. [
21,
22]; traditional statistical methods are based on modeling meteorological observation factors and do not consider the influence of geographical elements such as land use and topographic environment on wind speed; coupled dynamic-statistical downscaling methods are limited by the computational capacity of computational fluid dynamics models and cannot provide large-scale and long time series products. Among them, improved statistical downscaling methods can be used to consider the effects of surface processes and effectively reduce reanalysis data errors [
23], with good reliability and applicability [
24], such as the wind multiplier method that integrates the effects of land use and topography [
25,
26]. Therefore, this method can be developed for complex geographical environments; in the case of this study, we used it to provide a high-precision wind speed dataset for the Yangtze River inland waterway.
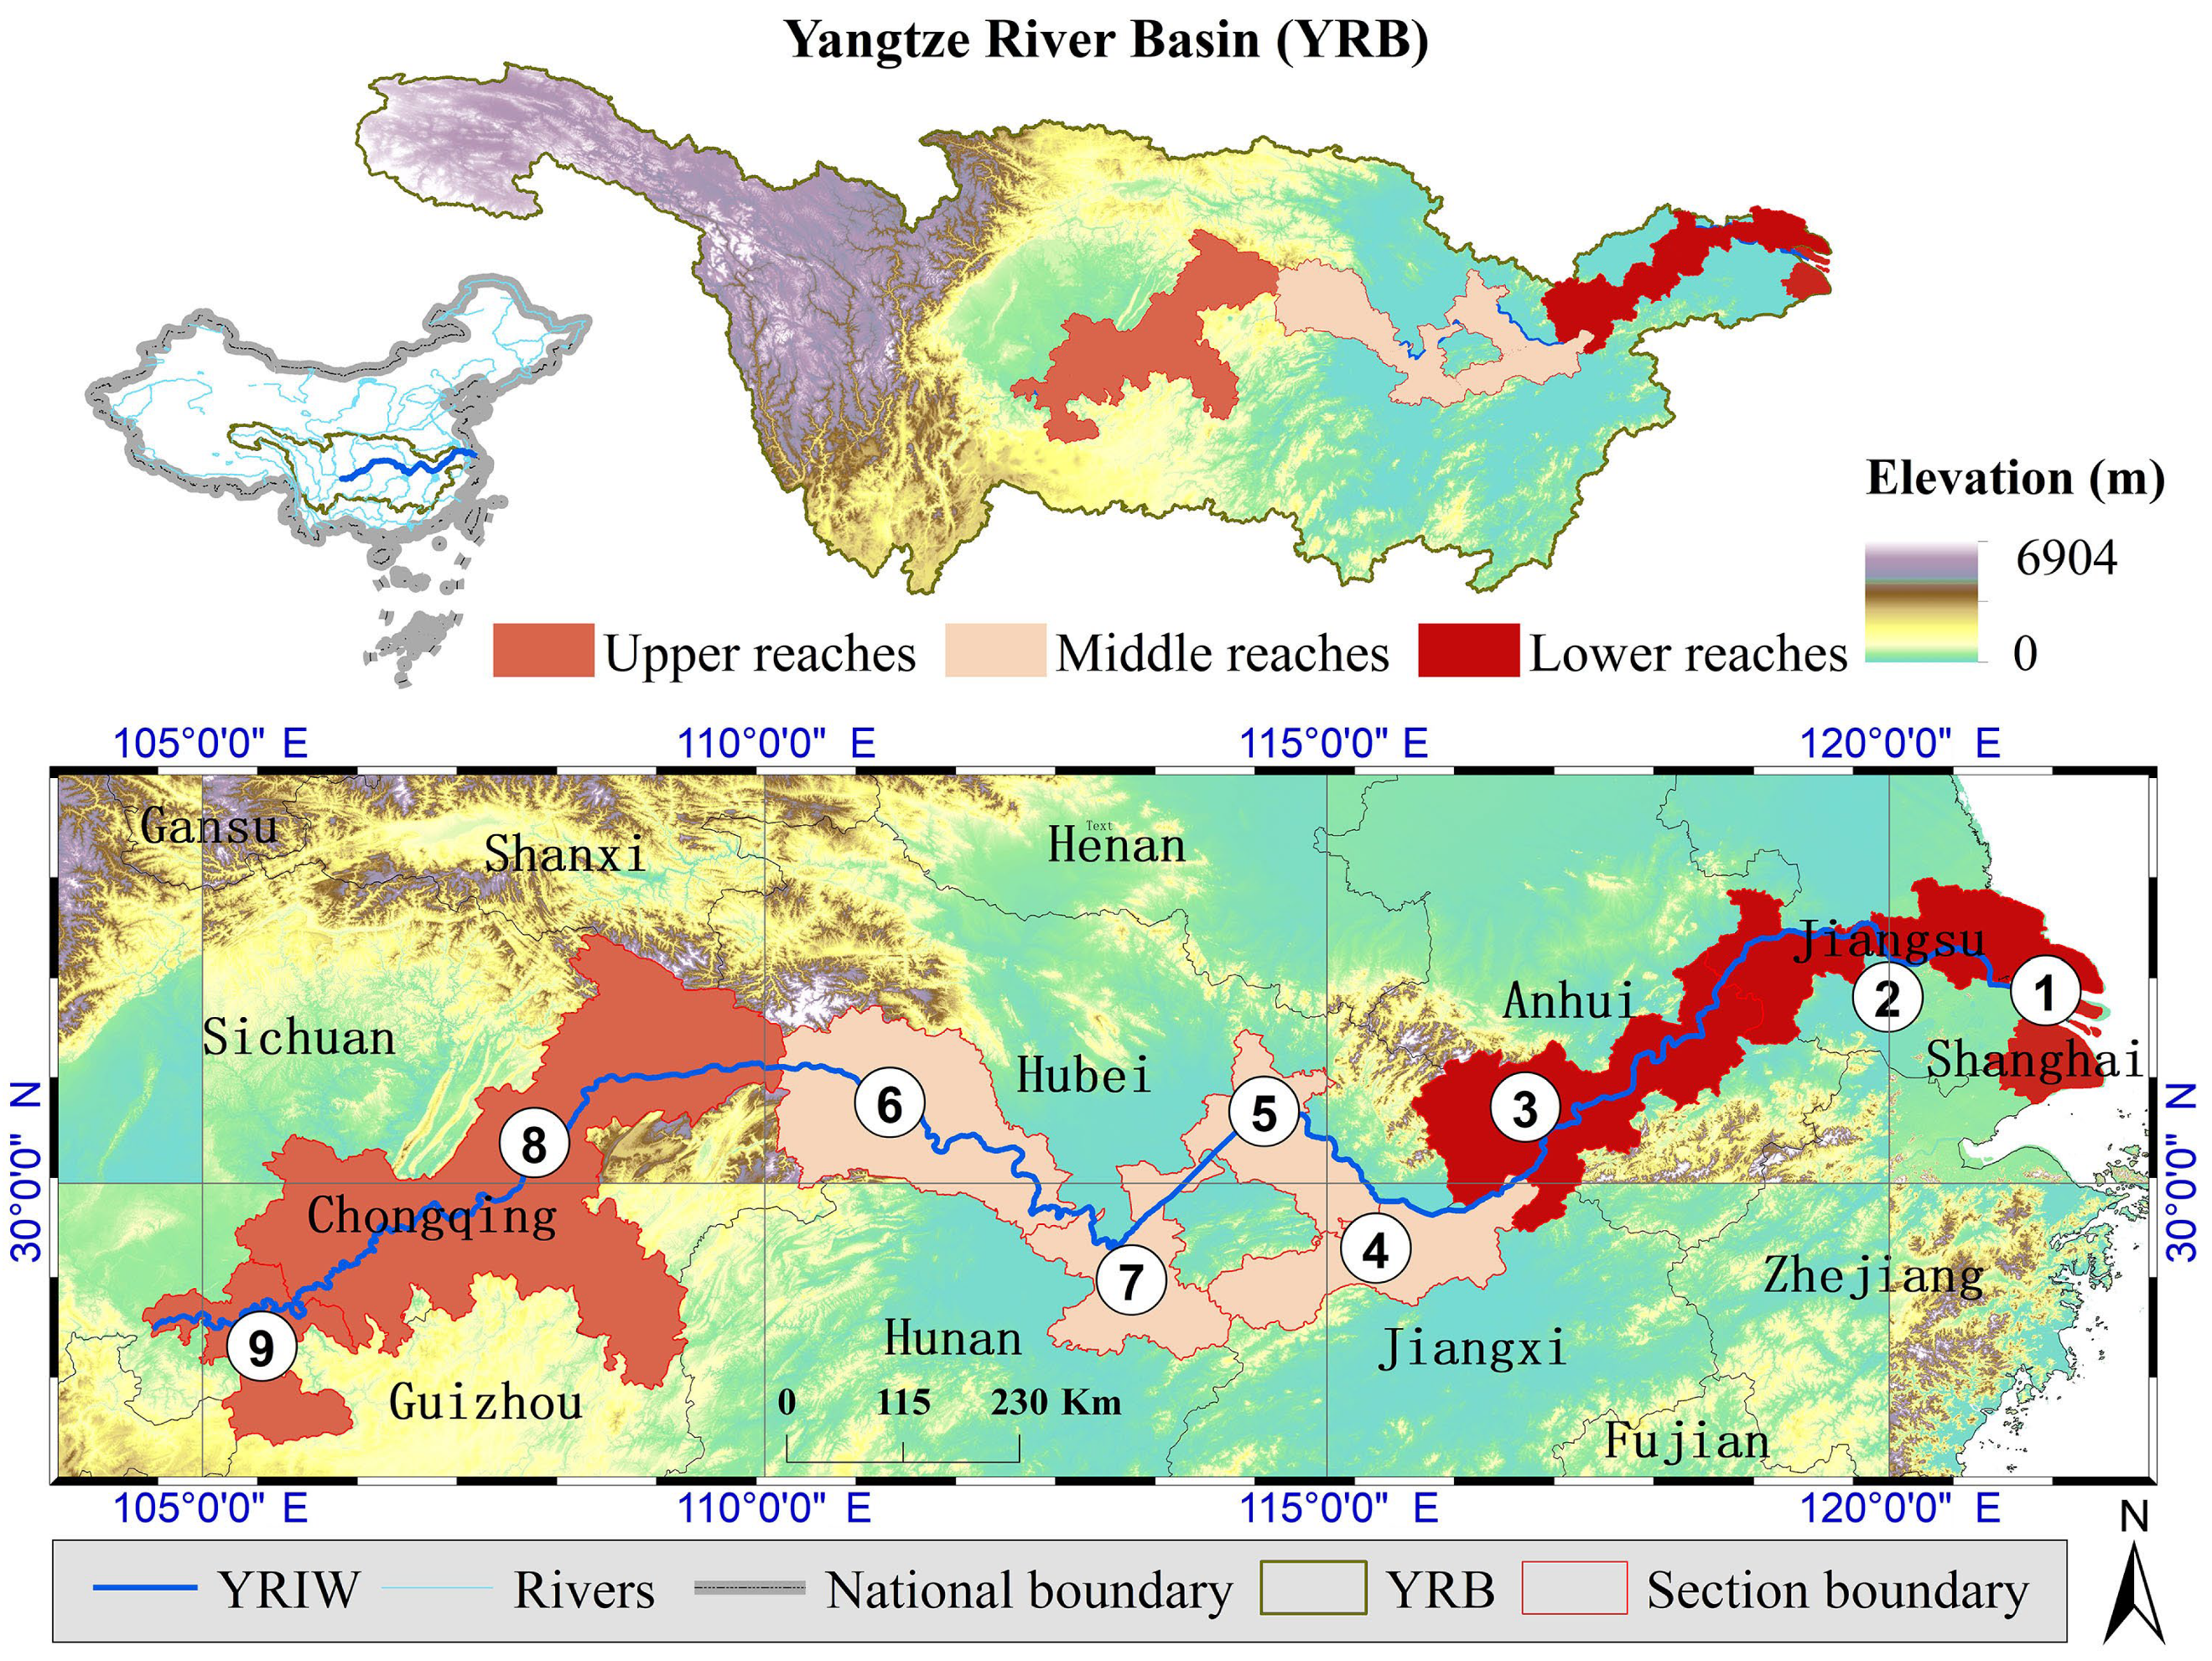
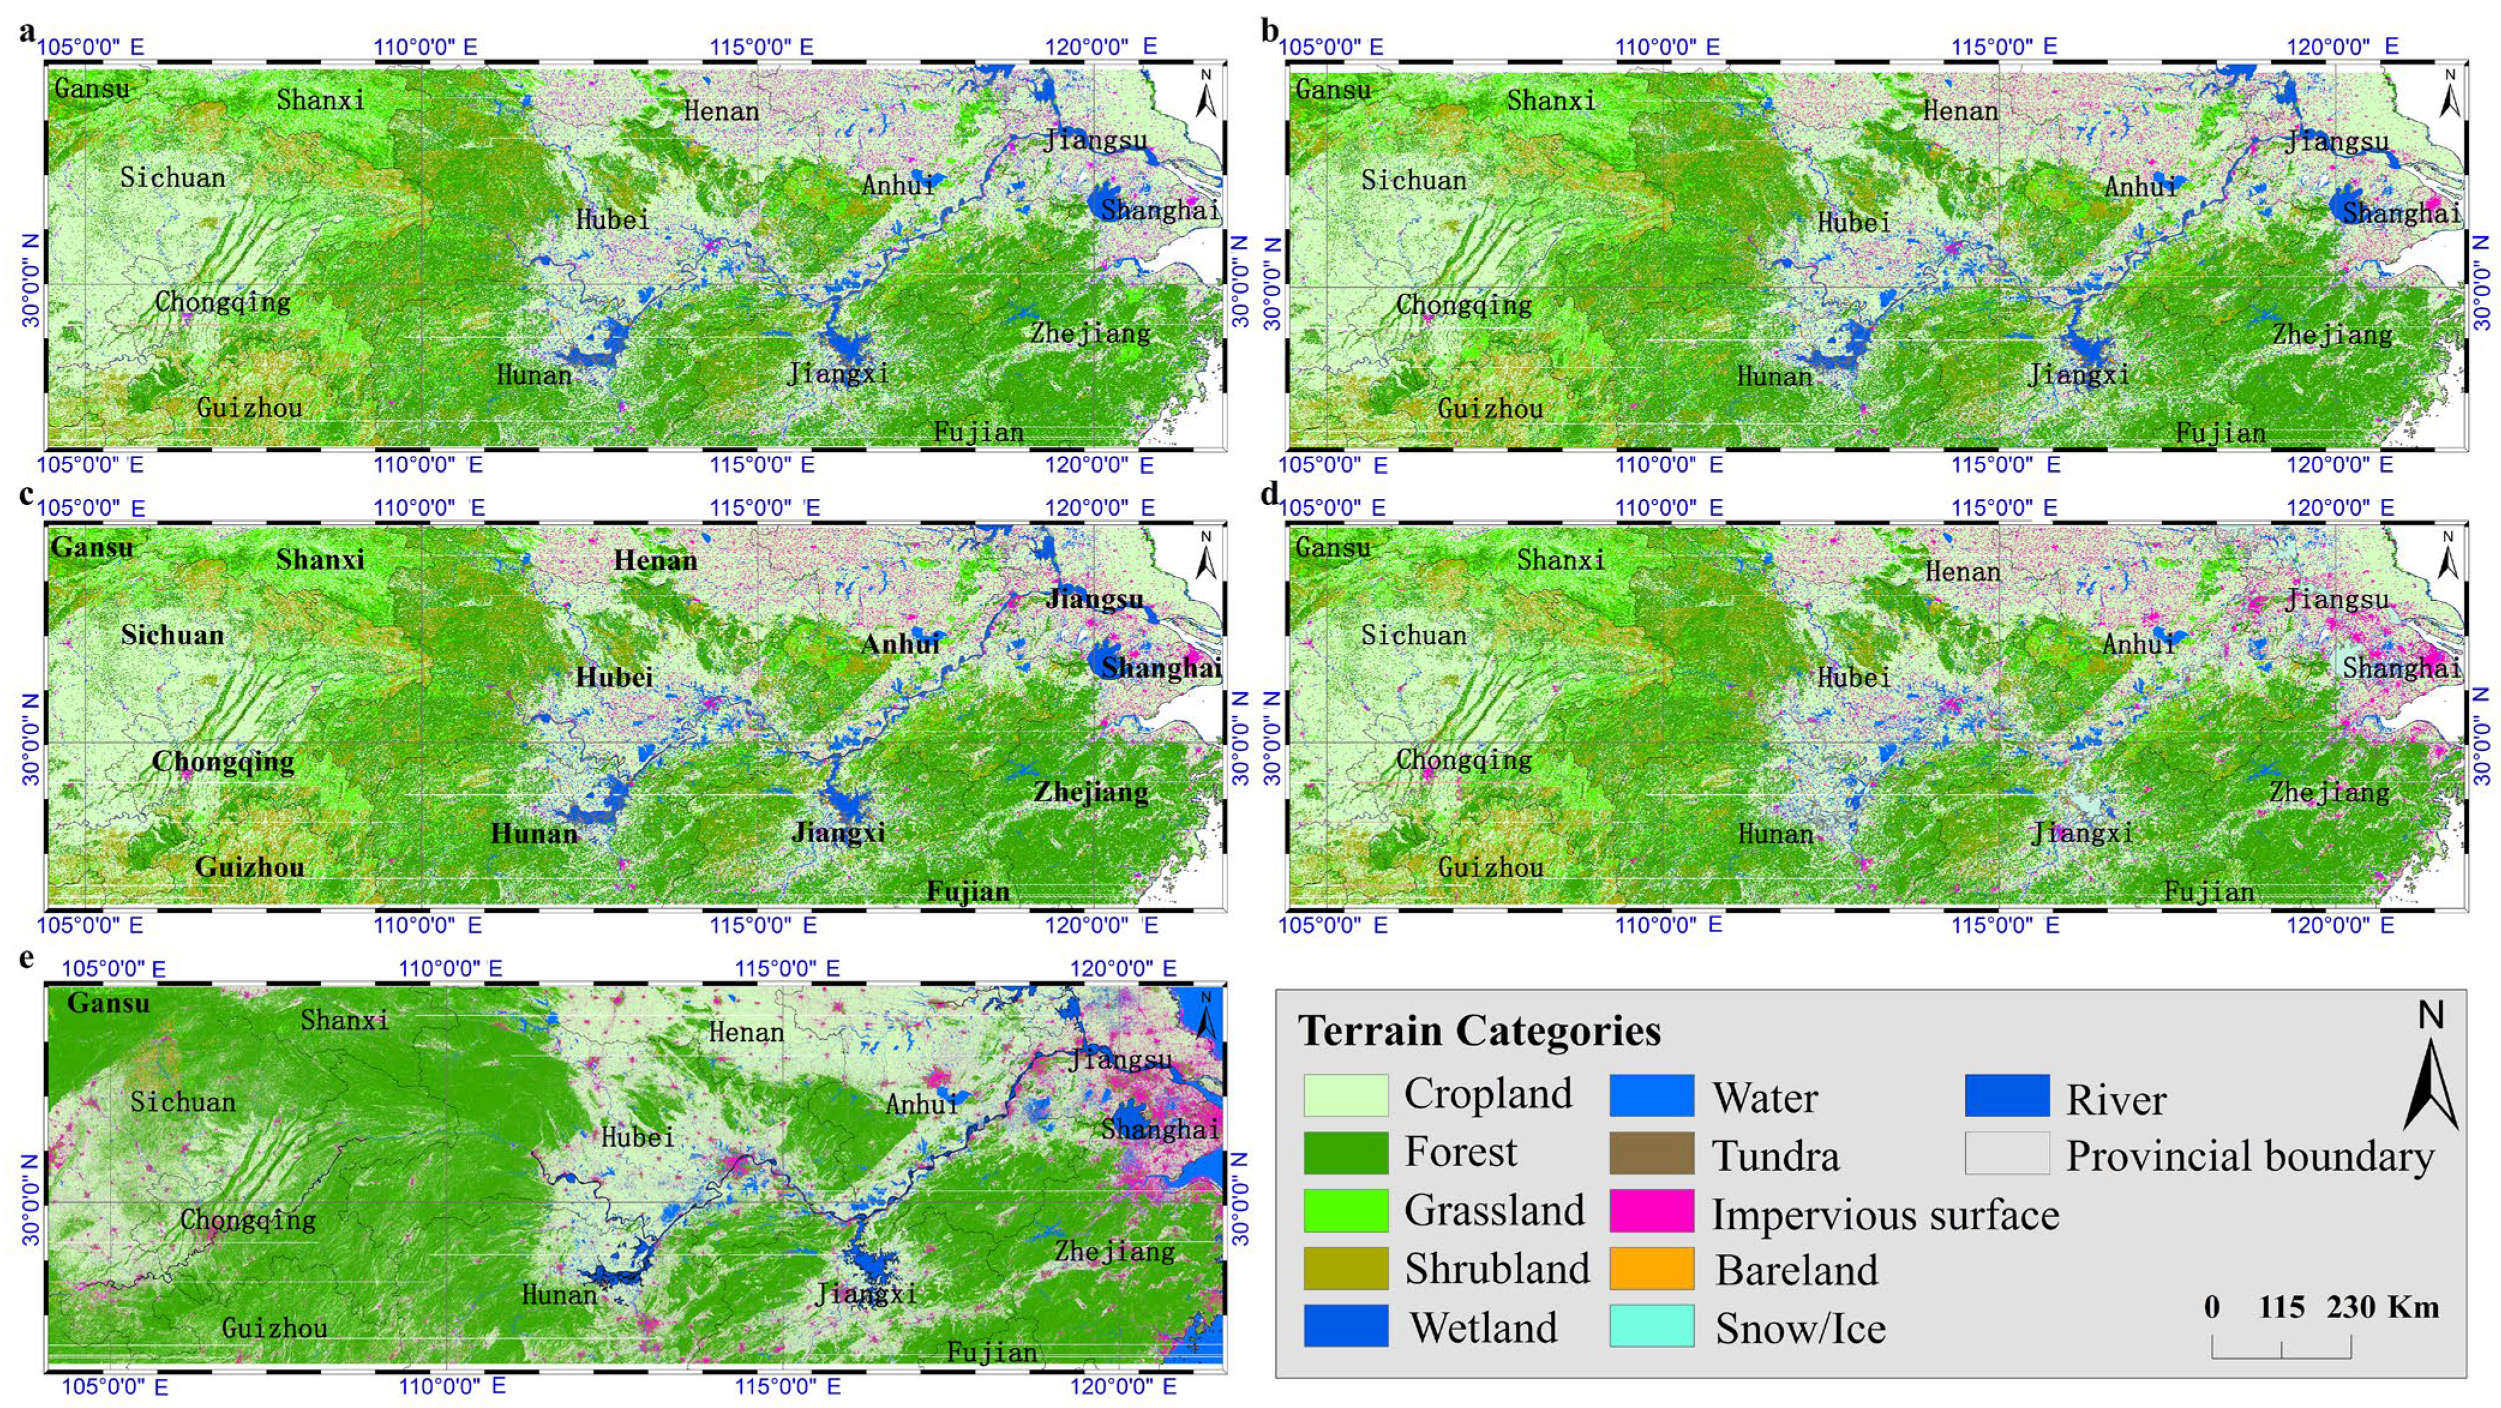
To highlight the above key scientific issues and knowledge gaps, a regional wind multiplier downscaling method integrating high-precision land cover and topographic local effects was proposed. Using this method, reanalysis wind speed data for 1980, 1990, 2000, 2010, and 2017 at 0.7° × 0.7° resolution was downscaled from a coarse grid to high spatial resolution data (1 km × 1 km: 1980–2010; 10 m × 10 m: 2017), and the spatiotemporal characteristics of the downscaled maximum wind speed we determined. We focused on assessing wind speed heterogeneity in the water-land area. The results provide scientific reference and data support for navigation management and disaster prevention and mitigation in the Yangtze River inland waterway. Specifically, (1) the land use and elevation datasets were integrated to obtain the surface roughness parameter Mz and the slope parameter Mh, respectively, and the wind multiplier downscaling method was used to obtain a high-resolution wind speed dataset, which is applicable to the navigable environment of the Yangtze River inland waterway; (2) the observed and downscaled wind speed data were compared and analyzed using spatial mapping methods, and the accuracy of downscaled products was assessed using three error test metrics (the Kolmogorov–Smirnov two-sample test, mean difference, and R2) based on comparison to 51 meteorological stations in the study area; (3) the spatiotemporal characteristics of the downscaled maximum wind speed data under different land use types were analyzed, and the applicability and potential improvement of the wind multiplier downscaling method was considered.
3. Results
3.1. Evaluation of Downscaling Effect of Maximum Wind Speed
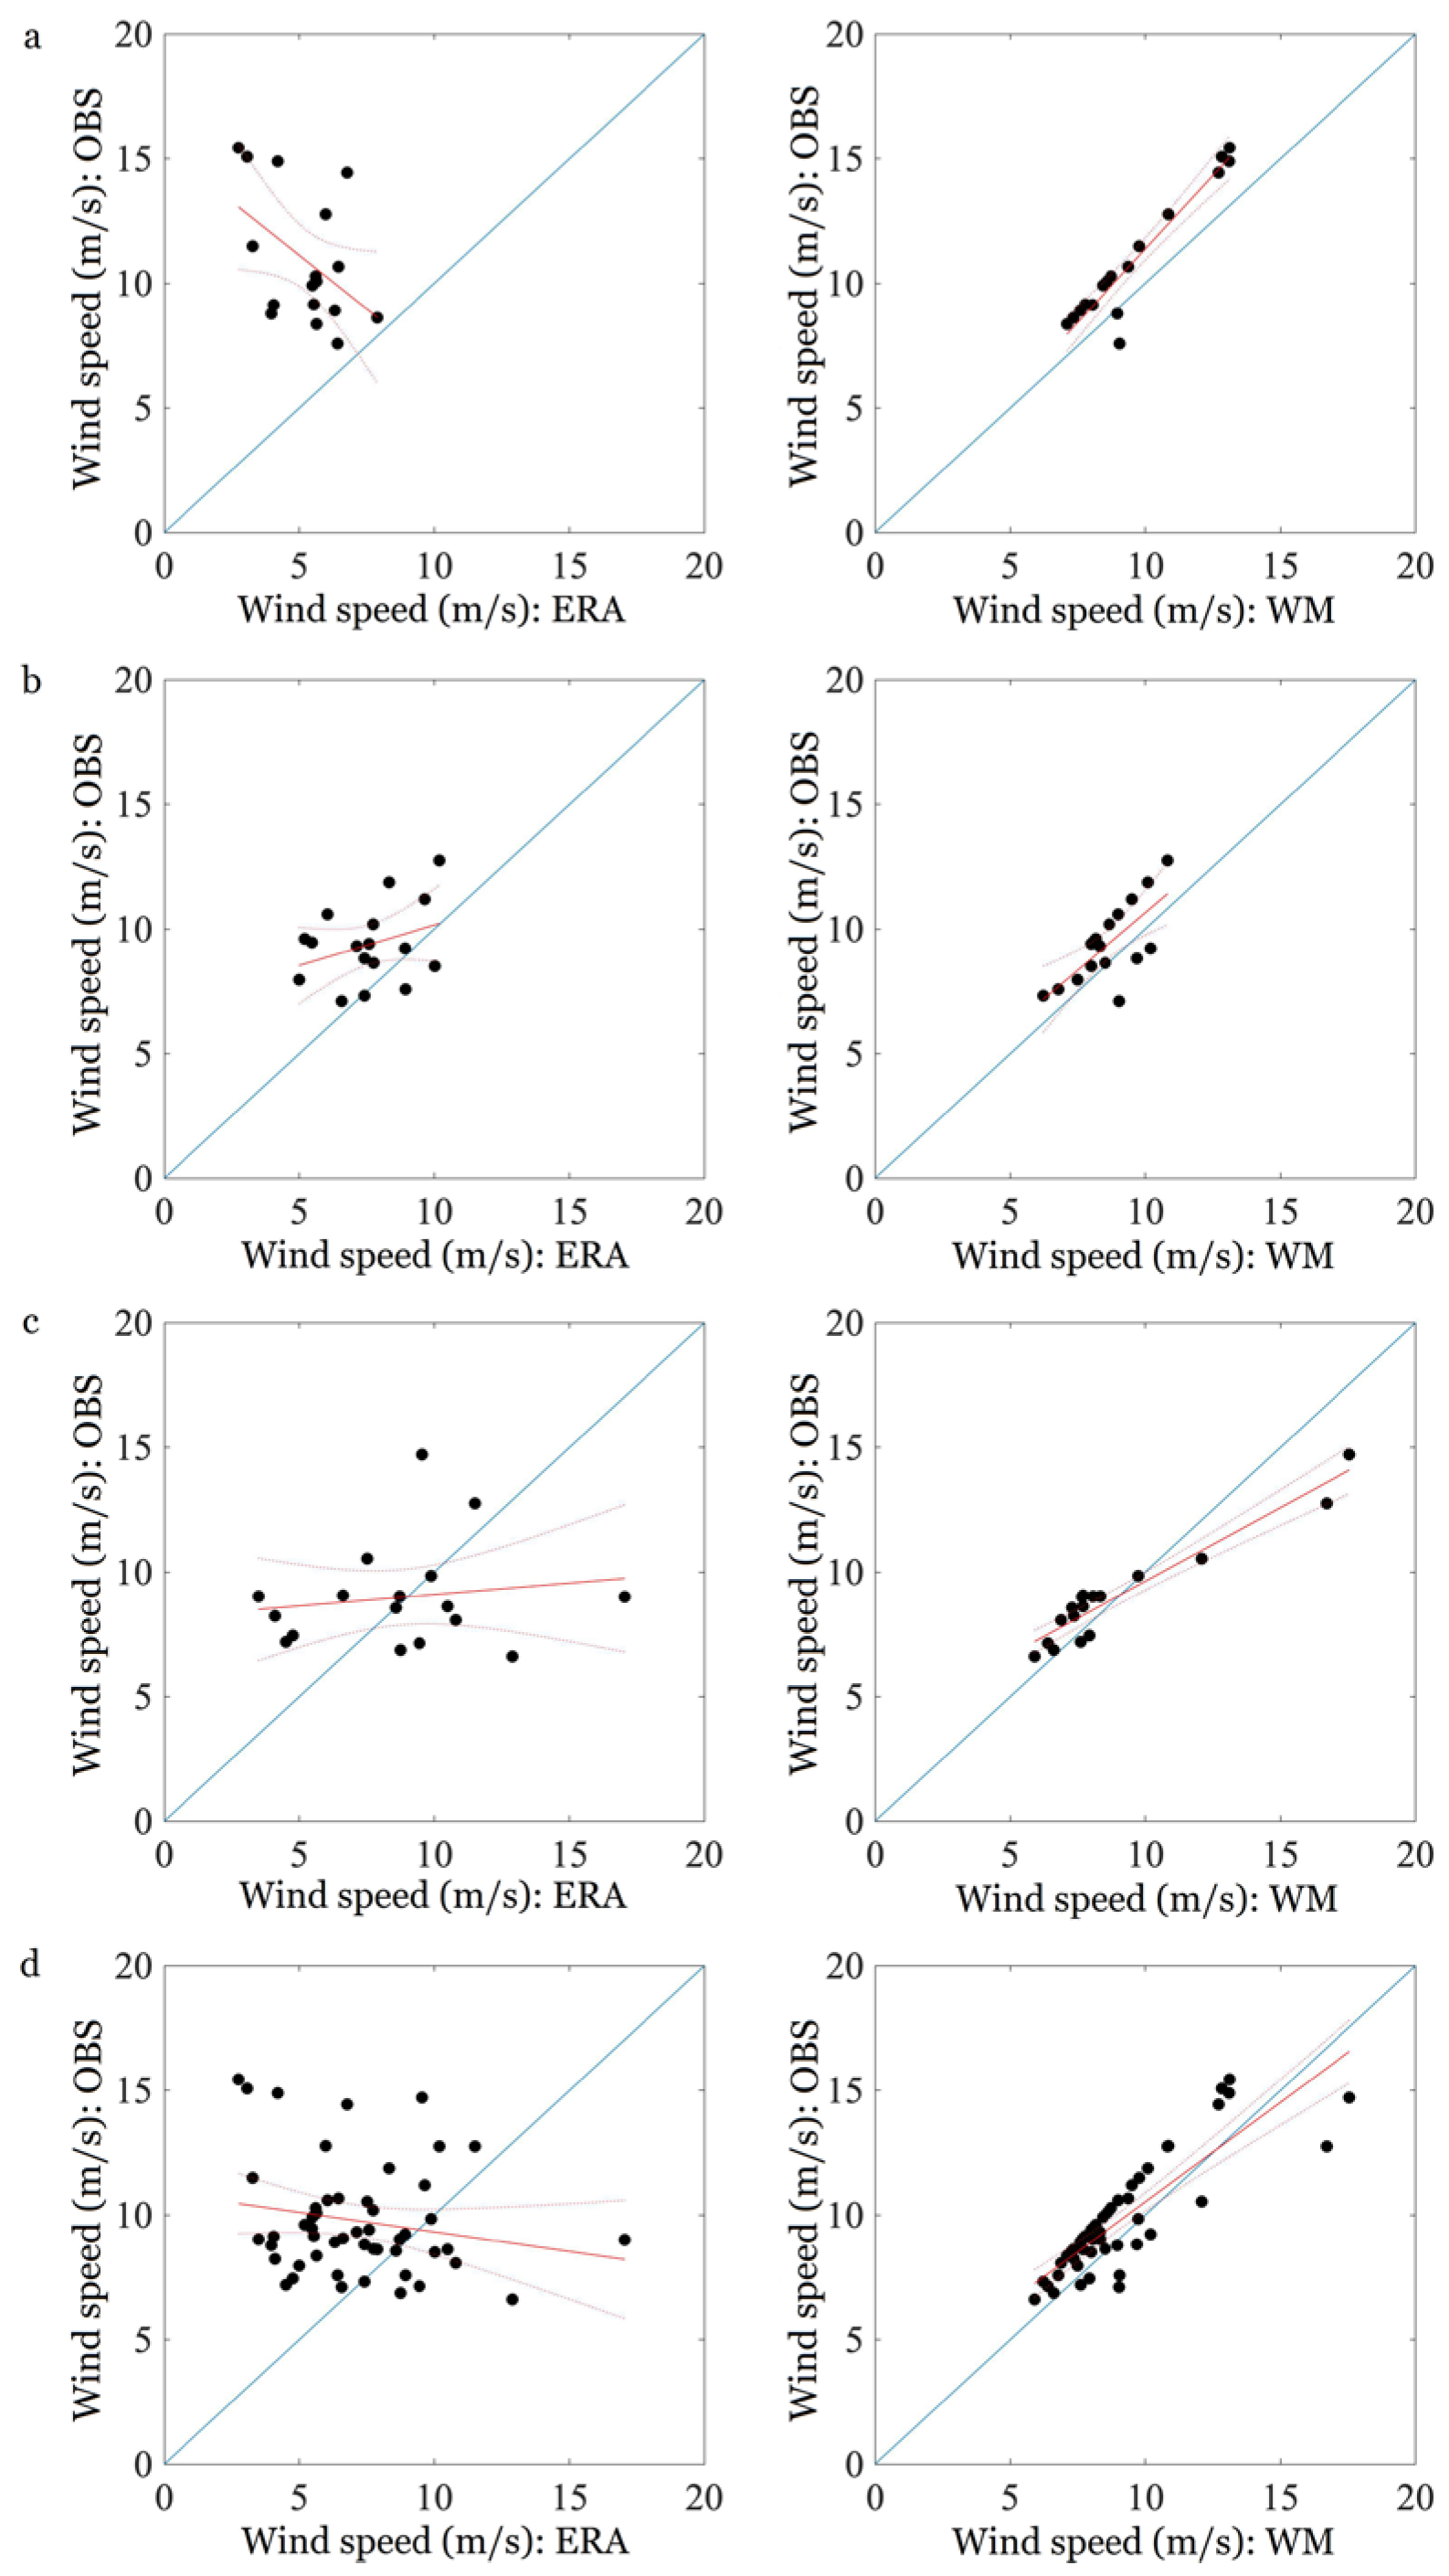
The downscaled annual maximum wind speed (
Vmax_WM) was calculated using ERA-Interim data and Equation (1) in the study area from 1980 to 2017, and it was used to evaluate the similarity of
Vmax_OBS in comparison with
Vmax_ERA (
Figure 4). The scatterplot of wind speed shows that the majority of the
Vmax_OBS (7.58–15.44 m/s) and
Vmax_ERA (2.76–7.88 m/s) comparisons are perpendicular to the 45° line in the upstream area, with
Vmax_ERA being underestimated compared with the observation value at most stations; the majority of the
Vmax_OBS and
Vmax_WM (7.1–13.12 m/s) comparisons are closer to the 45° line with underestimation at a few stations. The majority of the
Vmax_OBS (7.11–12.75 m/s) and
Vmax_ERA (4.99–10.19 m/s) comparisons are closer to the 45° line in the midstream area than the upstream area, and
Vmax_ERA values still show underestimations; the majority of the
Vmax_OBS and
Vmax_WM (6.22–10.83 m/s) comparisons are closer to the 45° line with smaller underestimation. Difference in the regression line slope between
Vmax_ERA (4.49–17.04 m/s) and
Vmax_OBS (6.61–14.7 m/s) are at a greater angles to the 45° line in the downstream area, and the
Vmax_ERA values are higher than the
Vmax_OBS values at most stations; the linear regression line of
Vmax_WM (5.9–17.55 m/s) and
Vmax_OBS is close to the 45° line, and only a few stations still have overestimations (e.g., 17.55 m/s at Anqing station and 16.7 m/s at Lushan station). The linear regression line of
Vmax_ERA (2.76–17.04 m/s) and
Vmax_OBS (6.61–15.44 m/s) is close to the 45° line at major stations in the Yangtze River inland waterway, and the
Vmax_OBS values are > 10 m/s, corresponding to
Vmax_ERA values of < 5 m/s at most stations. The linear regression line of
Vmax_WM (5.9–17.55 m/s) and
Vmax_OBS has a small angle to the 45° line, and
Vmax_WM values are overestimated at a few stations.
Figure 4 shows that the
Vmax_WM values are closer to the
Vmax_OBS values at most stations, with a good performance from 5 to 10 m/s, indicating that the accuracy of the downscaled data is significantly improved.
Boxplots of the three statistics show comparisons of maximum wind speed between
Vmax_OBS and
Vmax_ERA and between
Vmax_OBS and
Vmax_WM (
Figure 5): the downscaled D-statistic value decreases from 0.941 to 0.294 in the upstream, from 0.471 to 0.294 in the midstream, and from 0.235 to 0.412 in the downstream, indicating that the difference between the upstream and midstream samples is small and the performance is optimal in high-altitude upstream areas where the terrain is more complex; the difference between the downstream data increases and the effect is averaged. The D-statistic value of the Yangtze River inland waterway decreased from 0.49 to 0.27, indicating that the accuracy of the downscaled product is generally better than that of
Vmax_ERA. The
MAE value after downscaling decreased from 2.34 to 1.73 in the upstream, from 0.91 to 0.82 in the midstream, and from 1.34 to 1.00 in the downstream; the
MAE value of the Yangtze River inland waterway changed from 2.34 to 0.745, although the change was not obvious in the downstream. The downscaled data scales tend to be concentrated, with only individual stations susceptible to extreme values. The downscaled
R2 values increased from 0.199 to 0.905 in the upper reaches, from 0.082 to 0.494 in the middle reaches, and from −0.009 to 0.898 in the lower reaches (the most significant increase); the overall
R2 value of the Yangtze River inland waterway changed from 0.026 to 0.72, indicating a significant improvement in the goodness of fit of
Vmax_WM after downscaling.
The above statistical analysis shows that the upstream downscaled data have the smallest differences compared to the observed values and the best fit, but there are extreme values resulting in large differences and low concentration; the midstream downscaled data have small differences compared to the observed values and the highest concentration, but the fit is average; the downstream data have good concentration and fit, but the individual data are substantially different, resulting in lower sample quality. Despite the local variability and bias in the indicator analysis, the products obtained by the wind multiplier downscaling method are more suitable for characterizing the spatiotemporal variability of maximum wind speeds in the study area as compared with the ERA-Interim reanalysis data.
3.2. Spatiotemporal Characteristics of Maximum Wind Speed
The maximum wind speed values for the 14 stations in the Yangtze River channel, including
Vmax_OBS,
Vmax_ERA, and
Vmax_WM, were extracted from downscaled wind-speed products. Temporal trend analysis shows (
Figure 6) that
Vmax_WM (10.01 m/s) is closer to the interannual mean value of
Vmax_OBS (10.45 m/s) than
Vmax_ERA (8.78 m/s) for the Yangtze River inland waterway; the interannual mean of
Vmax_WM in the upper–middle section (8.15–11.8 m/s) is also closer to the interannual mean of
Vmax_OBS (8.58–11.64 m/s), while downstream the interannual means of
Vmax_WM (10.74 m/s) and
Vmax_OBS (11.34 m/s) are both lower than those of
Vmax_ERA (12.24 m/s).
From the interannual variation tendency rate of the Yangtze River inland waterway, Vmax_WM was −0.1 m·s−1·10a−1, Vmax_OBS was −0.14 m·s−1·10a−1, and Vmax_ERA was −0.27 m·s−1·10a−1, all with a weakly decreasing trend and three phases of significant change from 1980 to 2017: Vmax_WM (0.91 m·s−1·10a−1) and Vmax_OBS (0.44 m·s−1·10a−1) both showed an increasing trend, and Vmax_ERA (−0.89 m·s−1·10a−1) showed a decreasing trend during 1980–1990; Vmax_WM (−0.30 m·s−1·10a−1), Vmax_ERA (−0.32 m·s−1·10a−1), and Vmax_OBS (−0.13 m·s−1·10a−1) all showed a weakly decreasing trend during 1990–2010; subsequently Vmax_WM (−0.71 m·s−1·10a−1) and Vmax_OBS (−1.07 m·s−1·10a−1) showed a significant decrease and Vmax_ERA (0.92 m·s−1·10a−1) showed an increasing trend. Overall, Vmax_WM was closer to the interannual variation pattern of Vmax_OBS than Vmax_ERA. In terms of the upper–middle–downstream of the Yangtze River: Vmax_WM had a weak upward trend (0.15 m·s−1·10a−1), opposite to the trend to the Vmax_OBS (−0.2 m·s−1·10a−1) and Vmax_ERA (−0.22 m·s−1·10a−1) in the upstream; Vmax_WM (−0.12 m·s−1·10a−1) and Vmax_ERA (−0.17 m·s−1·10a−1) both showed weak downward trends, slightly different from the weak upward trend of Vmax_OBS (0.11 m·s−1·10a−1) in the midstream; the interannual variabilities of Vmax_WM, Vmax_OBS, and Vmax_ERA all showed weakly decreasing trends (−0.44 m·s−1·10a−1, −0.73 m·s−1·10a−1, and −0.45 m·s−1·10a−1, respectively) in the downstream. The difference in the tendency rate between the downscaled wind speed values and the observed values is less than 0.5 m·s−1·10a−1, indicating that interannual variation in maximum wind speed along the Yangtze mainline and along different sections of the river is not significant.
The spatial distribution of
Vmax_WM from 1980 to 2017 reflects the spatial characteristics of large nearshore, small inland, and undulating topographical areas (
Figure 7). For example, the
Vmax_WM values in the upstream Yibin-Chongqing section are clearly distributed in a continuous dense mountainous and hilly pattern (14–37 m/s) with topographic variation, while the Yichang Three Gorges reservoir section is a low-value wind speed zone (<10 m/s). The midstream Yueyang and Jiujiang sections both have high-value wind speed centers (11–20 m/s), and the Wuhan and Anqing sections show a sparse hill-like wind speed distribution pattern (14–26 m/s). The downstream sections of Shanghai and Nanjing have a wide range of high-value wind speed zones (11–20 m/s). In comparison with
Vmax_ERA,
Vmax_WM increased significantly after downscaling in the hilly sections (Yibin, Chongqing, Wuhan, and Anqing), with the range extending westward and showing wind speeds of >37 m/s; the range of high-value centers narrows and decreases in the Yueyang and Jiujiang sections, and the range of high-value centers in the offshore sections (Nanjing and Shanghai) narrows toward the northeast.
The spatial distribution range of wind speeds on the Yangtze River inland waterway from 1980 to 1990 increased significantly, with Vmax_WM reaching over 20 m/s in the northeast direction in the Shanghai section and wind speed variation on a downscale significantly higher than the corresponding ERA-Interim data. The spatial maximum wind speed decreased by less than 16 m/s m/s downstream of the Yangtze River inland waterway from 1990 to 2000, but the spatial variation was not significant in the mid-upper stream.
3.3. Nexus Relationship between Downscaling Wind Speed and Land Use
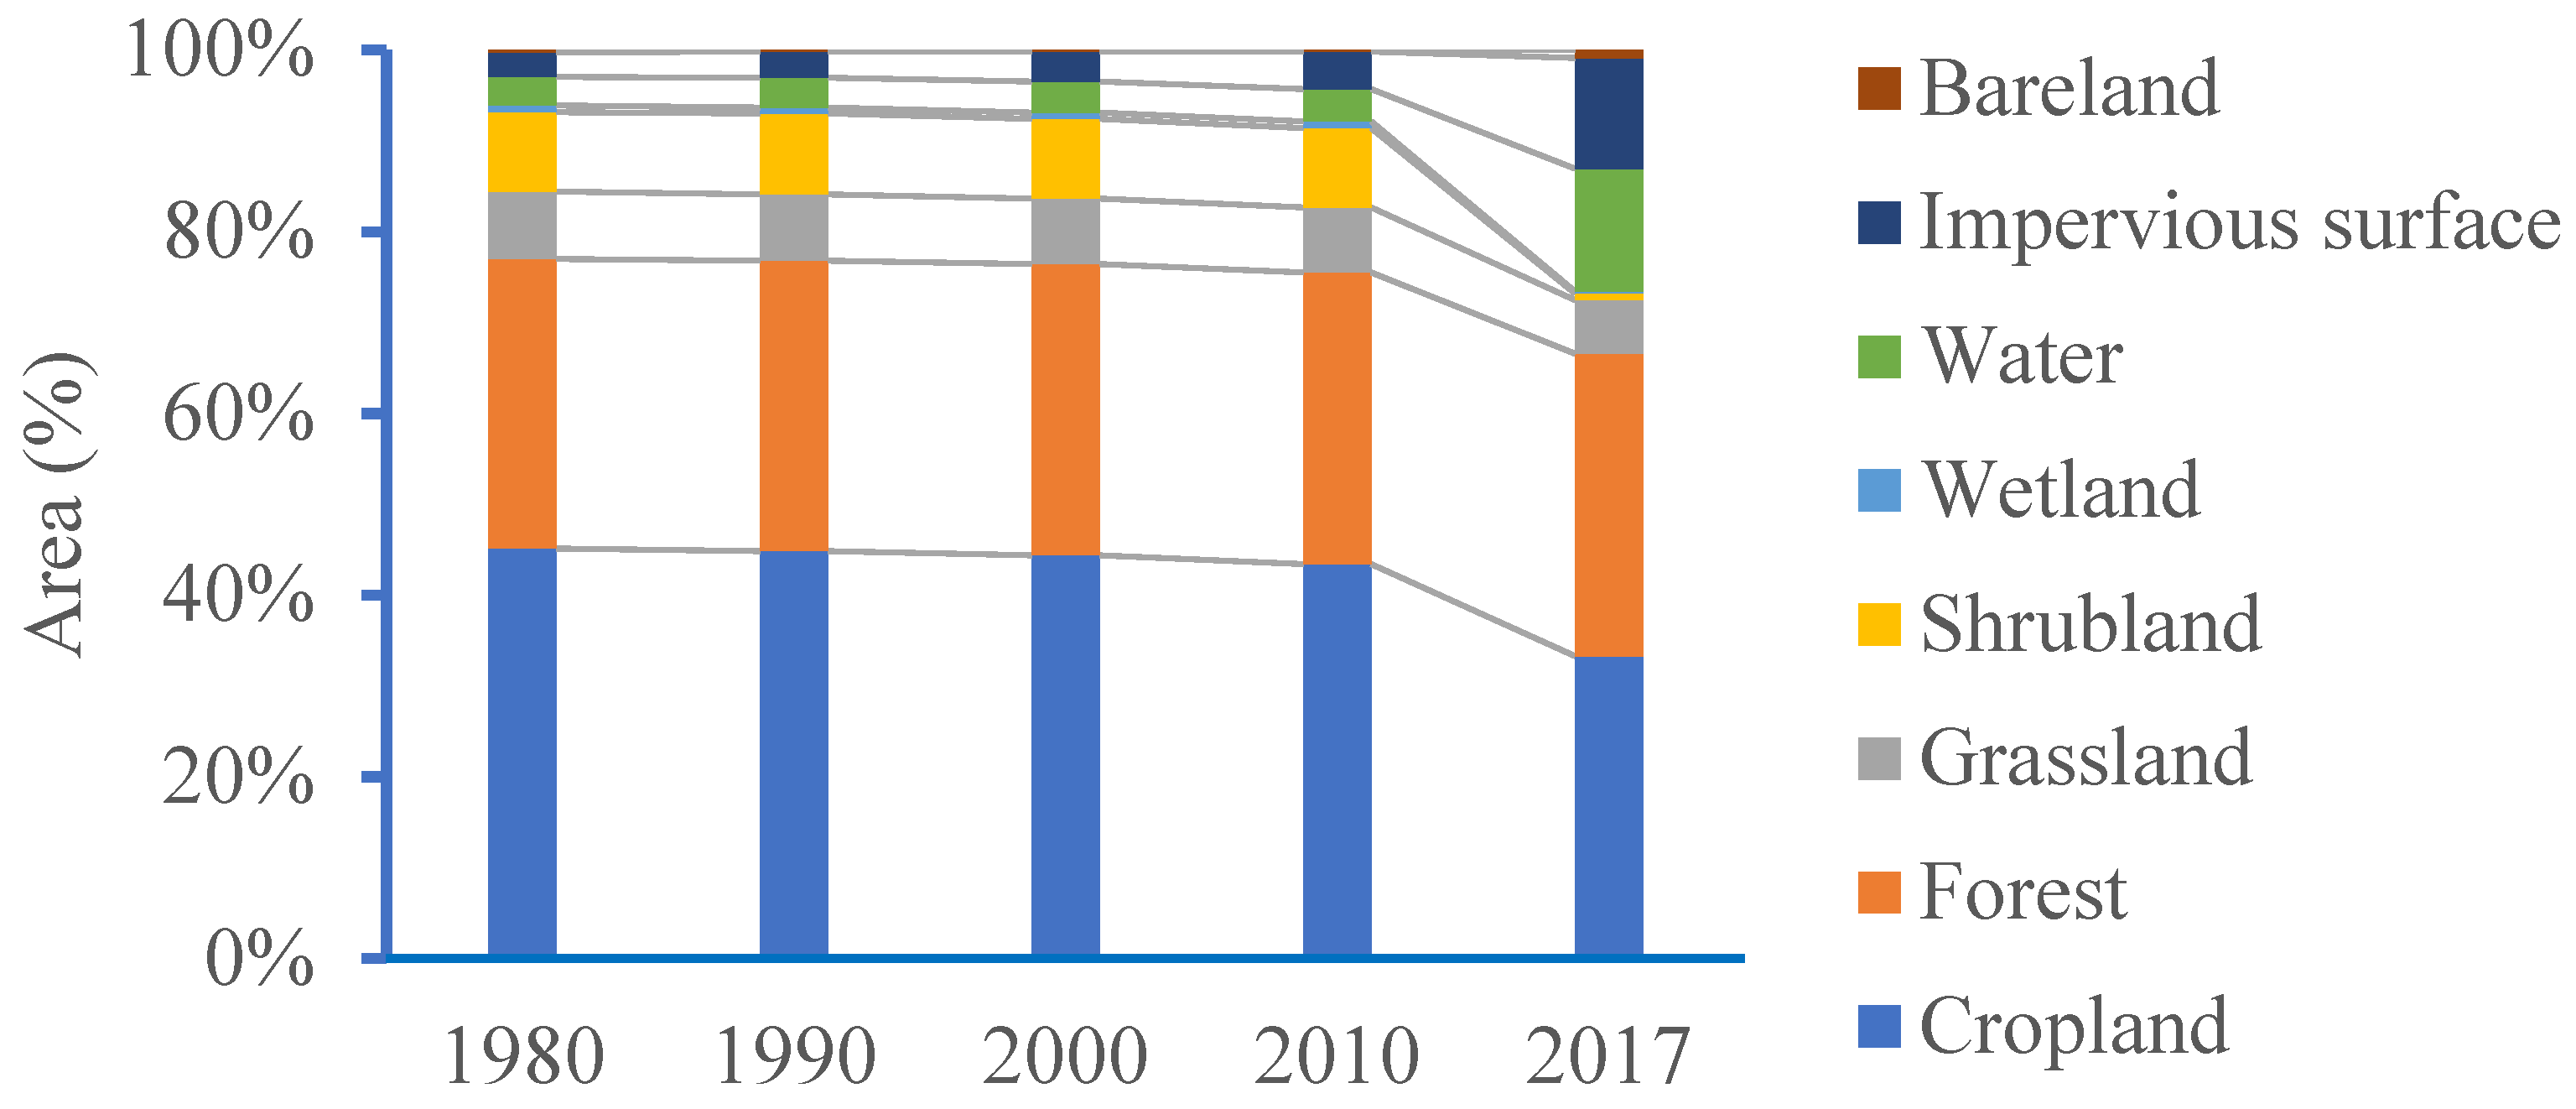
Changes in area by land use type were found (
Figure 8): the proportion of cropland area has been decreasing year by year, accelerating from 43.39% before 2010 to 33.28% in 2017, a significant decrease of ~10.11% in 8 years. Forestland increased steadily from 31.86% in 1980 to 33.28% in 2017; the proportions of grassland, shrubland, wetland, and water area remained largely unchanged. The proportion of impervious surfaces has increased annually from 1980 and accelerated after 2010, from 2.75% in 1980 to 12.18% in 2017, an increase of approximately 9.43%, indicating continued urbanization and an accelerating trend in recent years. The proportion of tundra and snow area is approximately 0, but a very small amount of glacier is present in the study area, and its effect on local wind speed variation remains to be studied.
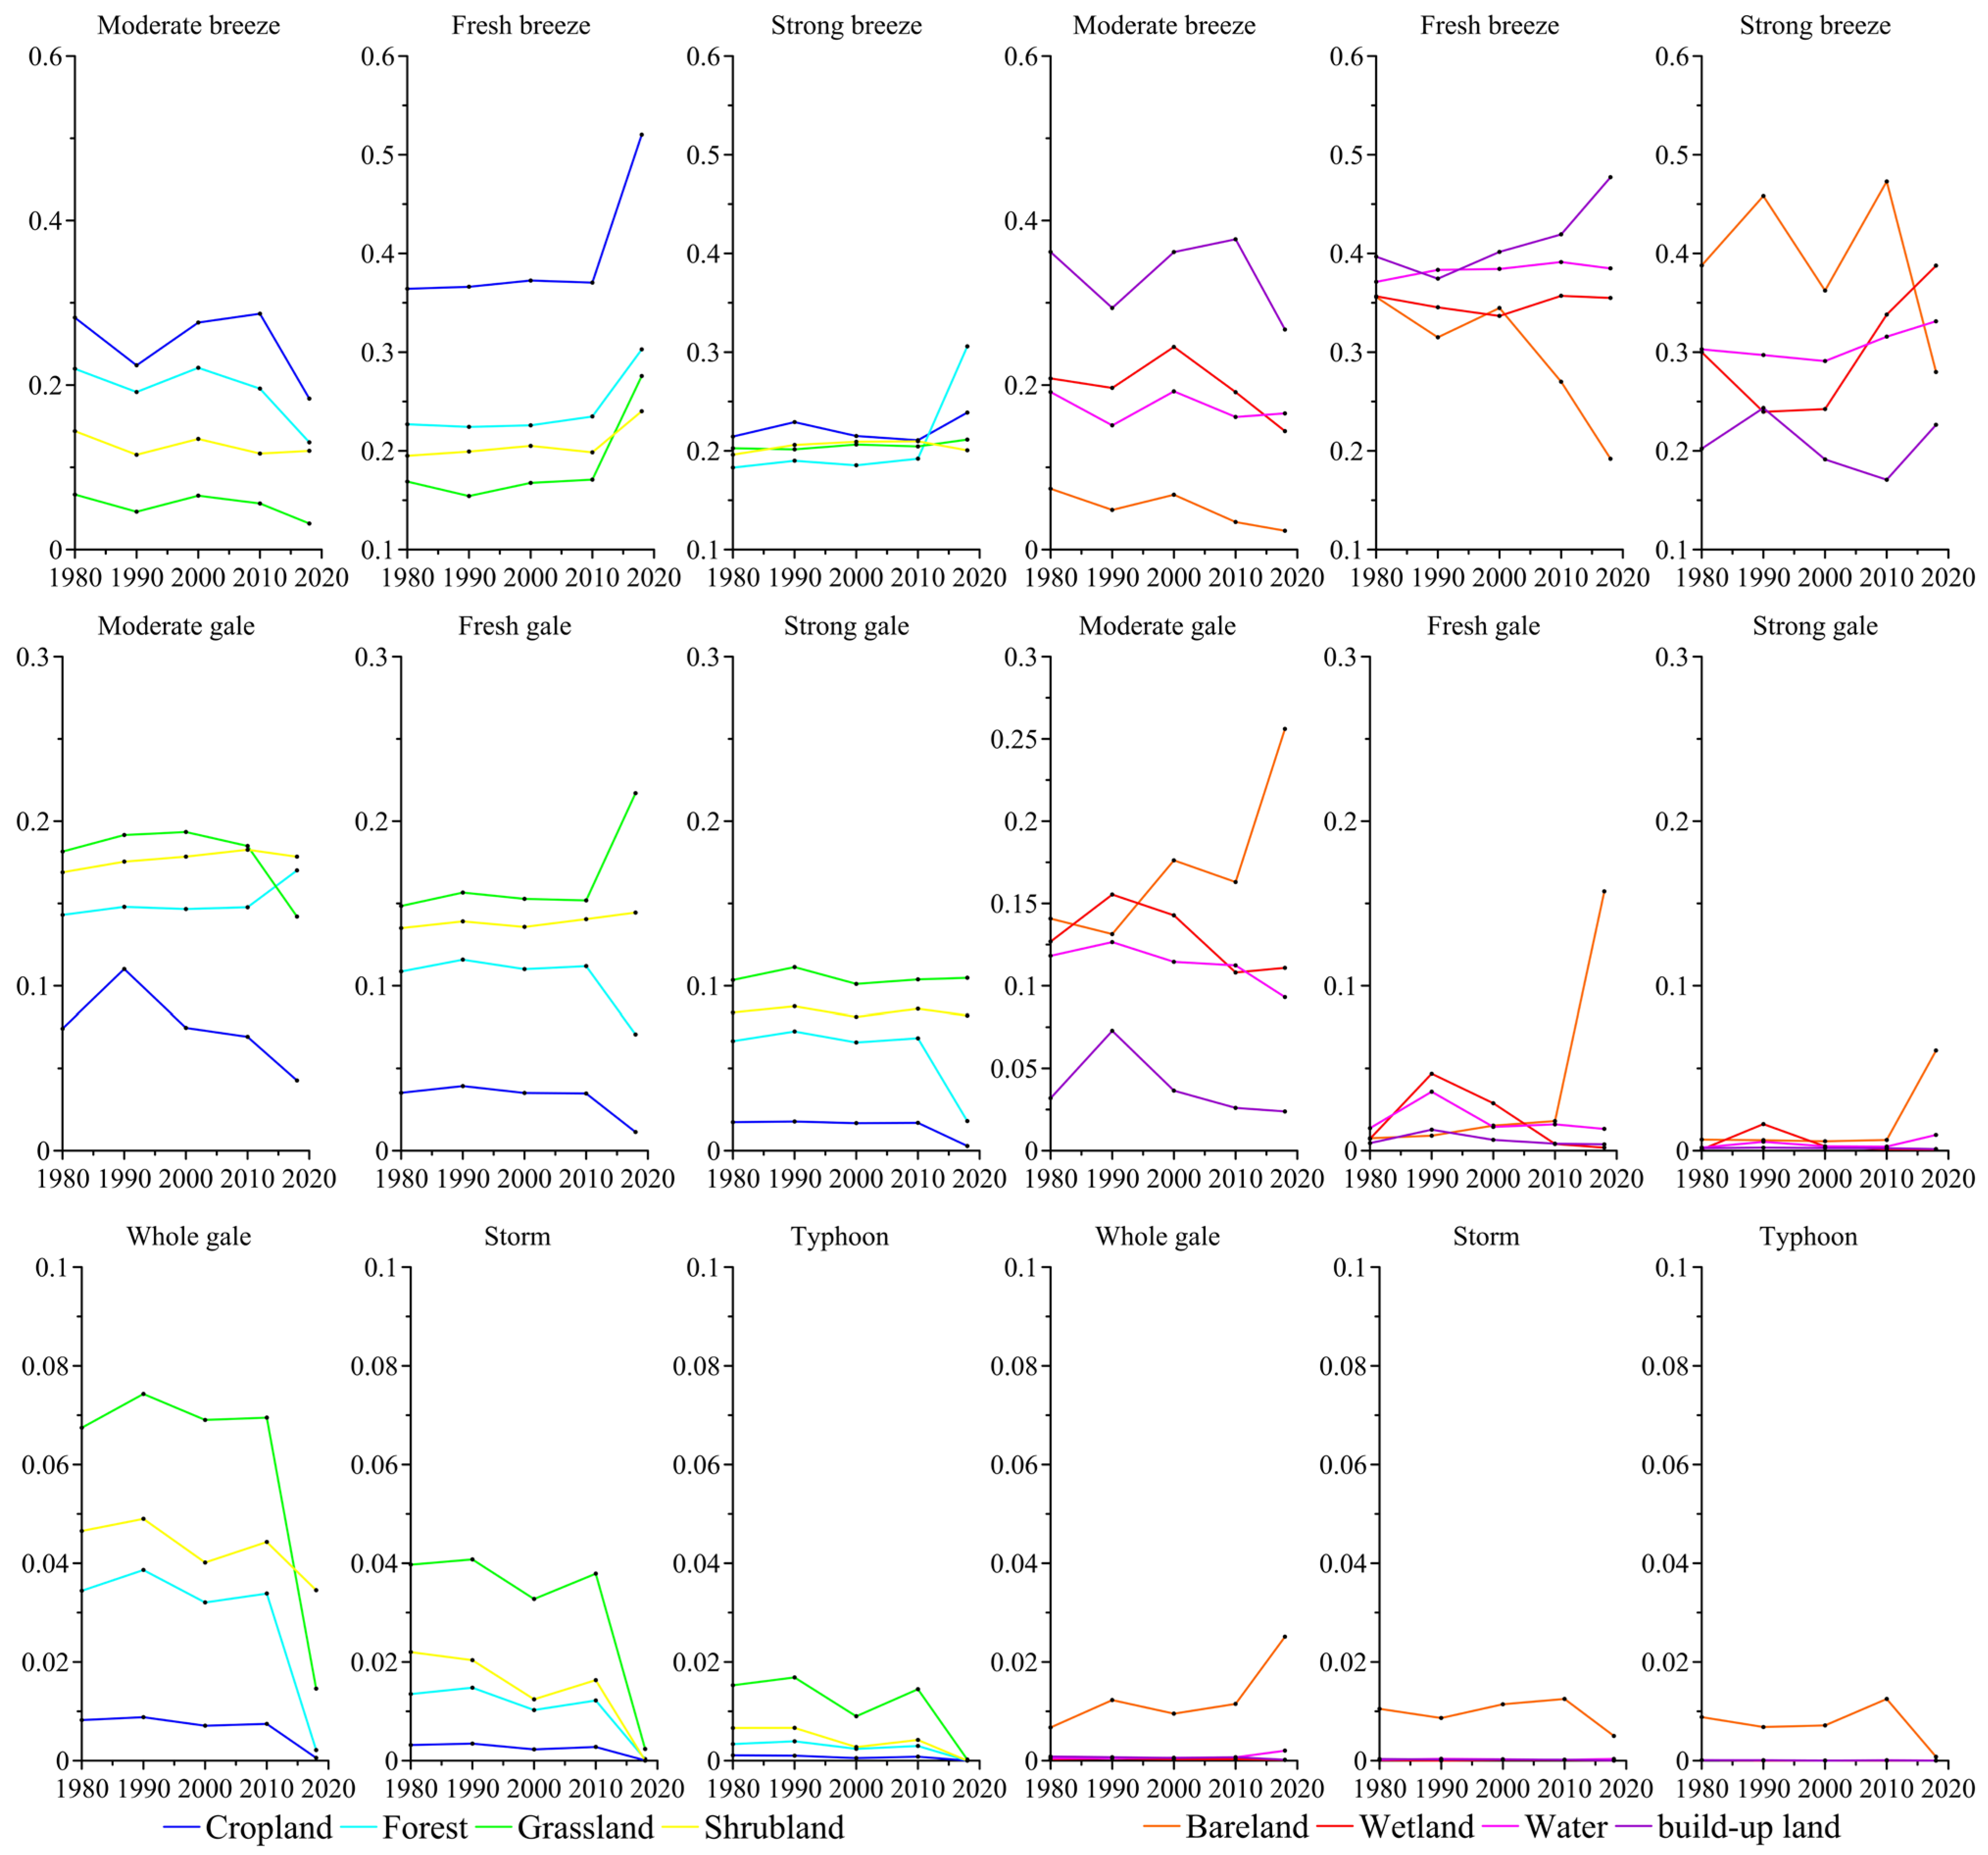
Nexus relationship analysis shows (
Figure 9) that arable
Ak values increase with wind speed and then decrease; the proportion of grade 4 wind speed is 0.18–0.28, the proportion of grade 5 wind speed is the largest (0.36–0.52), the proportion of grade 6 wind speed is 0.21–0.24, the proportion of grade 7 wind speed is 0.04–0.11, the proportion of grade 8 wind speed is 0.01–0.04, the proportion of grade 9 wind speed is 0–0.02. Wind speed of grade 10 or above accounts for 0.02–0.24, grade 7 for 0.04–0.11, grade 8 for 0.01–0.04, grade 9 for 0–0.02, and grade 10 or above for <0.02. The rate of change for 2010–2017 was significantly higher than that for 1980–2010; for example, the wind speed of grade 4 accelerated from 0.29 to 0.18, the wind speed of grade 5 accelerated from 0.37 to 0.52, the wind speed of grade 6 increased from 0.21 to 0.24, and the wind speed of grade 7 and above decreased year by year. The pattern of change for forestland is similar to that of cropland, with the proportion of grade 4 wind speeds ranging from 0.13 to 0.22, grade 5 wind speed ranging from 0.22 to 0.30, and grade 6 wind speed ranging from 0.18 to 0.31. From 2010 to 2017 grade 6 wind speed accelerated down from 0.20 to 0.13, grade 5 wind speed accelerated up from 0.23 to 0.30, and grade 6 wind speed accelerated down from 0.19 to 0.31; the proportion of grade 5–7 wind speed increased year by year, of which the proportion of grade 6–7 wind speed increased significantly. The proportion of wind speeds for the remaining land use types (especially above grade 8) declined significantly from 2010 to 2017, even reaching a value of 0. The proportion of grade 7 wind speed and above for grassland, shrubland, and wetland was higher than that for cropland and woodland, and the proportion of grade 5–7 wind speed increased slightly, while the proportion of wind speed in the remaining types (especially gale force 9 and above) decreased significantly, or even to 0. The proportion of grade 4–6 wind speed in the bare land decreased year by year, but the proportion of grade 7–10 wind speed increased more significantly, by approximately one order of magnitude. The proportion of wind speed above grade 11 decreased significantly, even to 0, indicating that the areas where these land types exist are prone to gale force weather. The proportion of grade 4–8 wind speed in water areas was the opposite of and does not change significantly from land, with the remaining classes increasing slightly, especially the proportion of grade 9–10 wind speeds appearing from 0 to 0.01 from 2010 to 2017. The proportion of force 4–5 gales increased on construction land and decreased for the remaining types, while the proportion of force 8 gales and above declined significantly.
4. Discussion
4.1. Main Findings
Large-scale spatiotemporal variations in wind speed are perturbed by hourly and spatial-scale wind events in different underlayers, and there are pronounced regional differences in economic development and urbanization in the areas surrounding the Yangtze River inland waterway. For example, the rapid socio-economic development of the mid-downstream of the Yangtze River inland waterway and offshore areas can increase the uncertainty of wind speed frequency changes. We also found a significant underestimation of wind speeds in upstream areas in the reanalysis data, which may be a reflection of errors in the reanalysis data assimilation system itself. For example, the model may not correctly describe local topography, climate, and surface parameters; in addition, there may be missing meteorological data and low-resolution input data. The reanalysis data represent large-scale climate changes caused by atmospheric circulation, greenhouse gases, etc. However, this is not sensitive to changes in land use type, and the results of this study confirm this limitation. However, ERA-Interim reanalysis data can be significantly improved by the wind multiplier downscaling method, and this more accurate wind speed data can be used for refined analysis of the maximum wind speed characteristics of the waterway. The wind multiplier downscaling method better integrates the combined effects of land use and topography on wind speed, and the evaluation of statistical indicators shows that the downscaling products have significantly improved accuracy and can more accurately reflect the spatial and temporal distribution characteristics of maximum wind speed in the study area.
Land use has a greater impact on overland winds than overwater winds in the study area. The maximum wind speed measured by the weather stations tends to decrease with increasing roughness of the subsurface owing to the increase in the number of buildings along with accelerated urbanization; the roughness of the water is smaller and the increase in the number of buildings around river banks and seawalls tends to form a river valley effect, resulting in a continuous decrease in the wind speed difference between water and land. Correlation analysis between land use and maximum wind speed shows that, except for bare land, the proportions of wind speed over the different land types increase and then decrease with rising wind speed, especially for grade 9 wind speed or above; the proportion was smallest in 2017. Bare land shows a trend of increasing wind speed in grade 9–10 wind speed, while the proportion of wind speed over water grade 4–8 is the opposite of that on land. The proportion is opposite to that of land, with no significant change in trend, and the rest of the classes are slightly increased, especially grade 9–10, which showed an increasing trend from 2010 to 2017. This study also demonstrates that although the risk of strong winds over water has weakened, the risk of extreme wind speeds has increased, and so the risk of damage to navigation and the region from extreme wind speeds along the Yangtze River inland waterway under climate change continues to increase.
4.2. Limitations of Study Approach
Anthropogenic activity substantially affects surface roughness, which has become a major cause of variation in the maximum wind speed in the study area. However, there are uncertainties in the analysis of the effects of land use on the maximum wind speed. For example, land use can lead to an increase in canopy resistance, which has a blocking effect on surface maximum wind speed and can change the thermodynamic properties of the surface, which in turn causes changes in surface maximum wind speed by altering local circulation and turbulent fluxes. Moreover, there is a lack of reliable data methods and assessment techniques, and the development of relevant models should be enhanced. Many stations in the Yangtze River inland waterway area are located within the transition zone between urban and suburban areas, and urban expansion not only increases surface roughness, but also leads to heat island circulation and turbulent flux perturbations, which have an important impact on the monitoring results of local wind fields.
When analyzing the impact of land use on the maximum surface wind speed based on station observations, the above thermodynamic effects should be taken into account, and existing reanalysis data should be corrected for cross-scale thermodynamic information to improve the accuracy of the observations. Moreover, the spatiotemporal resolution of wind speed products should be further strengthened, and higher resolution wind speed downscaling techniques should be developed through integration with high precision and long time series of geographical elements (e.g., land use, impermeable layer). Finally, wind speed event changes are significantly influenced by climate change, and wind speed change predictions under different climate change scenarios should be further developed to obtain more complete spatiotemporal characteristics of wind speed and its potential change trends in the study area.
5. Conclusions
This study proposes an integrated analysis method for wind multiplier downscaling and accuracy assessment, and a comprehensive assessment of the acquired downscaled maximum wind speed spatiotemporal characteristics. The modeling approach is generally applicable to the study area, with good accuracy and spatiotemporal representation of downscaled products, and the main conclusions obtained are as follows. (1) The trends of the site downscaled Vmax_WM (5.9–17.55 m/s) and observed Vmax_OBS (6.61–15.44 m/s) are better fitted (especially 5–10 m/s), and the downscaled accuracy is significantly improved; the upstream statistic D drops from 0.941 to 0.294 and R2 rises to 0.905, but there are extreme values leading to large differences in maximum wind speed and low concentration (MAE decreasing from 2.34 to 1.73); midstream D drops from 0.471 to 0.294 and has the highest concentration (MAE decreasing from 0.91 to 0.82), but the fit is average (R2 rises to 0.494); downstream data concentration (MAE decreasing to 1) and fit (R2 from −0.009 to 0.898) are better, but individual data are too different resulting in lower sample quality (D increasing to 0.412). (2) Downscaled products and interannual rates of variability at the stations (−0.01 and −0.014 m·s−1·10a−1) are much closer, with both showing increasing trends from 1980 to 1990 (0.91 and 0.44 m·s−1·10a−1), weakening by 2010 (−0.30 and −0.13 m·s−1·10a−1), followed by significant decreases (−0.71 and −1.07 m·s−1·10a−1). Wind speeds at both mid- and down-stream stations increased significantly from 1980 to 1990 and decreased significantly from 2010 to 2017. (3) Vmax_WM shows spatial characteristics of large nearshore wind speed (14–37 m/s), small inland wind speed (11–20 m/s), and wind speed over undulating topography. The Vmax_WM value in the hilly terrain section (Yibin and Chongqing) increases significantly and expands westward, the center of high-value region of the Yueyang and Jiujiang section narrows and decreases, and the center of the high-value region in the Nanjing and Shanghai section narrows to the northeast. The spatial distribution range of wind speed increased from 1980 to 1990, with Vmax_WM values reaching >20 m/s in the Shanghai section. The maximum wind speed in the downstream region decreased below 16 m/s from 1990 to 2000, with insignificant changes in the middle and upstream regions from 2000 to 2010. The overall changes were insignificant from 2010 to 2017. The most significant differences were found in the upstream region in 2017, with Vmax_WM values reaching 20 m/s or more, and a significant decrease in the mid and downstream regions. This suggests that the wind multiplier downscaling method effectively integrates the effects of surface processes on wind speed, which is missing in the reanalysis data, resulting in better interannual variability characteristics.
Research on extreme weather and climate events such as maximum wind speed can improve disaster prevention and management, and the design of shipping on the Yangtze River inland waterway. For the navigable environment of the Yangtze River inland waterway, the basin environment is complex, and the Yangtze River crosses three major geomorphic terrains with large topographic drop-offs and significant differences in climatic and meteorological conditions, with an increasing trend in the frequency of extreme events [
37,
38]. The natural rate of climate variability in the monsoon region has a significant impact on the Yangtze River inland waterway, such as the large-scale atmospheric circulation changes caused by the East Asian monsoon fluctuations, The El Niño-Southern Oscillation (ENSO) and the Pacific Ocean interdecadal oscillation [
39]. It is worth noting that the wind speed changes in the Yangtze River may be a sensitive indicator of global climate change. It should also be noted that the Yangtze River inland waterway is highly exposed and vulnerable and is also affected by transport policy, and socio-economic and technological developments. Our study provides valuable data and knowledge support for navigational risk management, identification of local areas at high wind speed risk, and wind emergency management in the Yangtze River. Research on the trends of extreme weather events on the Yangtze River inland waterway under the combined influence of climate change and human activities should be strengthened in the future, and high-precision regional model data and spatial analysis methods should be used to clarify the different influencing factors of disaster-causing risks in each section of Yangtze River inland waterway.


