Article

Atmospheric Deposition on the Southwest Coast of the Southern Basin of Lake Baikal

Limnological Institute Siberian Branch of the Russian Academy of Sciences, 664033 Irkutsk, Russia
*
Authors to whom correspondence should be addressed.
Submission received: 14 September 2021 / Revised: 8 October 2021 / Accepted: 14 October 2021 / Published: 17 October 2021
(This article belongs to the Section Climatology)

Abstract

:
A precipitation monitoring station in Listvyanka was set up to determine the potential impact of the coastal area on the state of the adjacent air environment above Lake Baikal on its southwest coast. This article presents the results of studying the chemical composition of atmospheric deposition (aerosols and precipitation) at this station in 2020, and of their comparison with the data from previous years (from 2000 to 2019). In 2020, the ionic composition of atmospheric aerosols and precipitation had changed compared to previous years. In the modern period, the total amount of ions in aerosols, accounting for 0.46 ± 0.40 μg∙m−3, was lower by an order of magnitude than between 2000 and 2004. The average annual total amount of ions in precipitation in Listvyanka was almost unchanged from the average values in 2000–2010 and was 10% lower than that from 2011 to 2019 (7.3 mg/L). The ratio of major ions of sulphates and ammonium changed in the aerosol composition: compared to the period from 2000 to 2004, in 2020, the contribution of ammonium ions had decreased significantly, from 32% to 24%; the contribution of sulphates had increased to 43%, and the contribution of calcium had increased from 8 to 13%. Since 2010, the contribution of K+ ions has increased to 8–10%, indicating the effect of smoke aerosols from wildfires. In precipitation, despite the dominance of sulphates (26%) and calcium (18%) throughout the year, the contribution of nitrates increases to 19% during the cold season (from October to March), while the contribution of ammonium ions and hydrogen ions increases to 13% and 17%, respectively, in the warm season (from April to September). In 2020, as in previous research years, the acidity of precipitation at the Listvyanka station was elevated (pH 5.1 ± 0.5); 50% of precipitation in 2020 had pH ˂ 5. We quantified ions in atmospheric aerosols and precipitation on the underlying surface of the coastal southwestern part of Lake Baikal. Ion fluxes with precipitation were the highest in the warm season, which corresponds to the annual maximum precipitation. Unlike previous years (from 2000 to 2010 and from 2011 to 2019), wet deposition of most ions—especially calcium, ammonium and nitrates—had decreased in 2020. There was a 35-fold decrease in nitrogen fluxes and a 5-fold decrease in sulphur fluxes in aerosols, as well as 1.6-fold and 1.3-fold decreases, respectively, in precipitation.

1. Introduction

The environmental protection of Lake Baikal—a World Heritage Site located in the centre of the Asian part of Russia—is receiving more and more attention. The atmosphere is an important component of the lake’s natural environment. Atmospheric aerosols have a significant effect on the atmospheric spectral transparency and the processes of radiation interactions [1,2]. Particles can scatter and absorb sunlight owing to their optical properties which, in turn, depend on the size, shape, and nature of the particles [3,4,5,6]. The origin of the aerosols and the chain of various transformations during air transport determine their chemical composition, size, shape, and other parameters. Anthropogenic aerosols have the most negative impact on the environment.
In the Baikal region, anthropogenic impact on the atmosphere increases not only with the development of the industries in the region, but also with the expansion of the infrastructure of tourist and recreational areas in the coastal zone, consequently increasing the number of vehicles there. Natural and climatic factors that prevent the dispersion of technogenic emissions significantly affect the levels of air pollution [7]. Emissions of smoke aerosols and trace gases from the increased number of wildfires have become significant sources of air pollution in the Baikal natural territory (BNT) [8,9]. Control over the pollution entering the ecosystem of Lake Baikal through the atmosphere is becoming increasingly important.
Ecological zonation of the BNT was carried out to preserve the unique ecological system of Lake Baikal and prevent negative impacts of economic and other activities on its condition. Lake Baikal is located in the central ecological zone; this area includes Lake Baikal itself, with islands, a water protection zone adjacent to the lake, and specially protected natural areas (Figure 1) [10]. The transport of anthropogenic air pollutants to Lake Baikal occurs mainly in the form of poorly dispersed plumes during jet streams at altitudes from 300 to 1000 m [11,12].
According to Shikhovtsev and Molozhnikova [13], the proportion of the transport of air masses from westerly and northwesterly directions towards Lake Baikal is approximately 69%. These air masses are formed above the industrial areas of West Siberia and East Siberia. Thereby, the prevailing transport of air pollution to the southern basin of Lake Baikal comes from the Irkutsk–Angarsk industrial hub located in the ecological zone of atmospheric influence of Lake Baikal. The ecological zone of atmospheric influence extends up to 200 km to the west and northwest of the lake [10].
To trace the impact of the transport of air pollution to the southern basin of Lake Baikal, an atmospheric deposition monitoring station in Listvyanka was set up on its southwest coast (51.90 N, 104.70 E). The station is situated 70 km from Irkutsk, a large industrial centre in East Siberia. The station is allocated at an altitude of ~200 m above the lake level and 670 m above sea level on the dominant route of the transport of air pollutants. On the lake’s coast, there is a settlement of the same name, Listvyanka. Here, there are localized sources of air pollution in the form of boiler houses and stove heating. In recent years, the settlement has become a tourist centre of Lake Baikal. Thus, the traffic of land and water vehicles is increasing there. The high-altitude location of the Listvyanka station protects it from the influence of life in the settlement and it traces only regional and global alpine transport of pollution.
The frequency of transport of air masses to Lake Baikal from easterly and northeasterly directions is 8%. Air masses of this direction are formed above the Arctic Ocean and Yakutia. The influence of long-range transport from these areas has little effect on the chemical composition of the atmosphere above Lake Baikal. The transport from southeasterly directions more often represents cases of “local circulation”, accounting for 5% [13]. According to Obolkin et al. [11], the influence of the sources located in this direction (the towns of Slyudyanka and Baikalsk) is limited to the adjacent areas, and does not effectively cover the water area of the southern basin of Lake Baikal. Moreover, during the entire existence of the Listvyanka station, the transport of sulphur oxides and nitrogen oxides from Buryatia to the area of the station was not recorded. In this regard, we can assume that they do not reach the west coast of the lake. However, pollutants may enter the areas of the lake’s east coast [11].
This study aims to trace the current state of the coastal atmosphere at the Listvyanka station based on the chemical composition of various types of atmospheric deposition (aerosols, rain, and snow), and to assess the quantitative input of substances to the underlying surface of the southwestern part of Lake Baikal in 2020 compared to long-term data.

2. Materials and Methods

Samples of atmospheric aerosols and precipitation (rain and snow) were taken at the Listvyanka atmospheric deposition monitoring station. The results of observations carried out from January to December 2020 were used in this study. The current chemical composition of various types of atmospheric deposition was compared with the data from previous years (2000–2019).
Air samples were taken using a sampler from Andersen Instruments Inc. (New York, NY, USA) with four types of filters, at a pumping rate of 2 L/min, for seven days of exposure. The filters were sequentially fixed in a block that was tightly connected to a pump and a gas meter. Aerosols were collected on the first Teflon (PTFE) filter with a pore size of 0.8 μm [9]. In the warm season (May–October), precipitation (rain) was sampled automatically in a mode of continuous monitoring with a US-320 wet-only precipitation collector (Japan). In November–April, precipitation (snow) was collected in plastic containers and stored in a freezer [14]. The falling snow was deposited in a container of a known volume, which was installed at the special sampling site for discrete samples. The sampling duration corresponded to the snowfall period. During 2020, 48 aerosol samples and 59 precipitation samples—including 25 samples of fresh snow and 34 samples of rain—were collected.
Sample preparation is an important factor in chemical analysis. To determine the chemical composition of atmospheric aerosols, the exposed filter or a part of it with a known area (cm2) were placed in a polypropylene test tube, and 10–15 mL of double-distilled water was added. The exact amount of added water was determined from the difference in weight between the empty test tube and the one filled with water, using an Explorer EO 01140 electronic balance (Ohaus Corporation, Persippani, NJ, USA). The test tube was placed in an ultrasound bath. The resulting solution was filtered through a membrane filter with a pore size of 0.2 µm; the filtrate was used to determine Ca2+, Mg2+, Na+, K+, NH4+, NO3, Cl, and SO42− ions, and to measure the pH value. The ionic composition of aerosols was determined using an ICS-3000 ionic system (Dionex, Sunnyvale, CA, USA). An IonPac AS19 analytical column (2 × 250 mm) was used to determine anions, and an IonPac CS12A (2 × 250 mm) for cations [9].
In precipitation, pH, specific electrical conductance, and bicarbonate ions were determined; after filtration through a membrane filter, the concentrations of major ions were measured. Cations in precipitation were determined using an atomic absorption spectrophotometer from VEB Carl Zeiss Jena (Jena, Germany), and anions were determined using the Dionex ICS-3000 Ion Chromatography System (Dionex, Sunnyvale, CA, USA) [14]. The methods used to determine the chemical composition of atmospheric aerosols and precipitation are recommended by the atmospheric monitoring networks of the international programmes EMEP (European Monitoring and Evaluation Programme) and EANET (Acid Deposition Monitoring Network in East Asia). Modern methods of analysis ensured high accuracy of the measurement results—up to 4%, with a confidence level of p = 0.95. We analysed the chemical composition of the atmospheric aerosols and precipitation using the median and mean values of the ionic concentrations measured for every month and year.

3. Results and Discussion

3.1. Atmospheric Aerosol

Particles suspended in the atmosphere have a significant impact on the air quality, climate, and occurrence of heterogeneous chemical reactions [1,2,15,16,17,18]. Their properties, including their chemical composition, vary widely over time and space. A detailed study of the properties and patterns of variability in the chemical composition of atmospheric aerosols is possible with continuous monitoring of the environment at fixed stations. This provides estimates of the accumulation and transit of anthropogenic pollutants in the atmosphere.
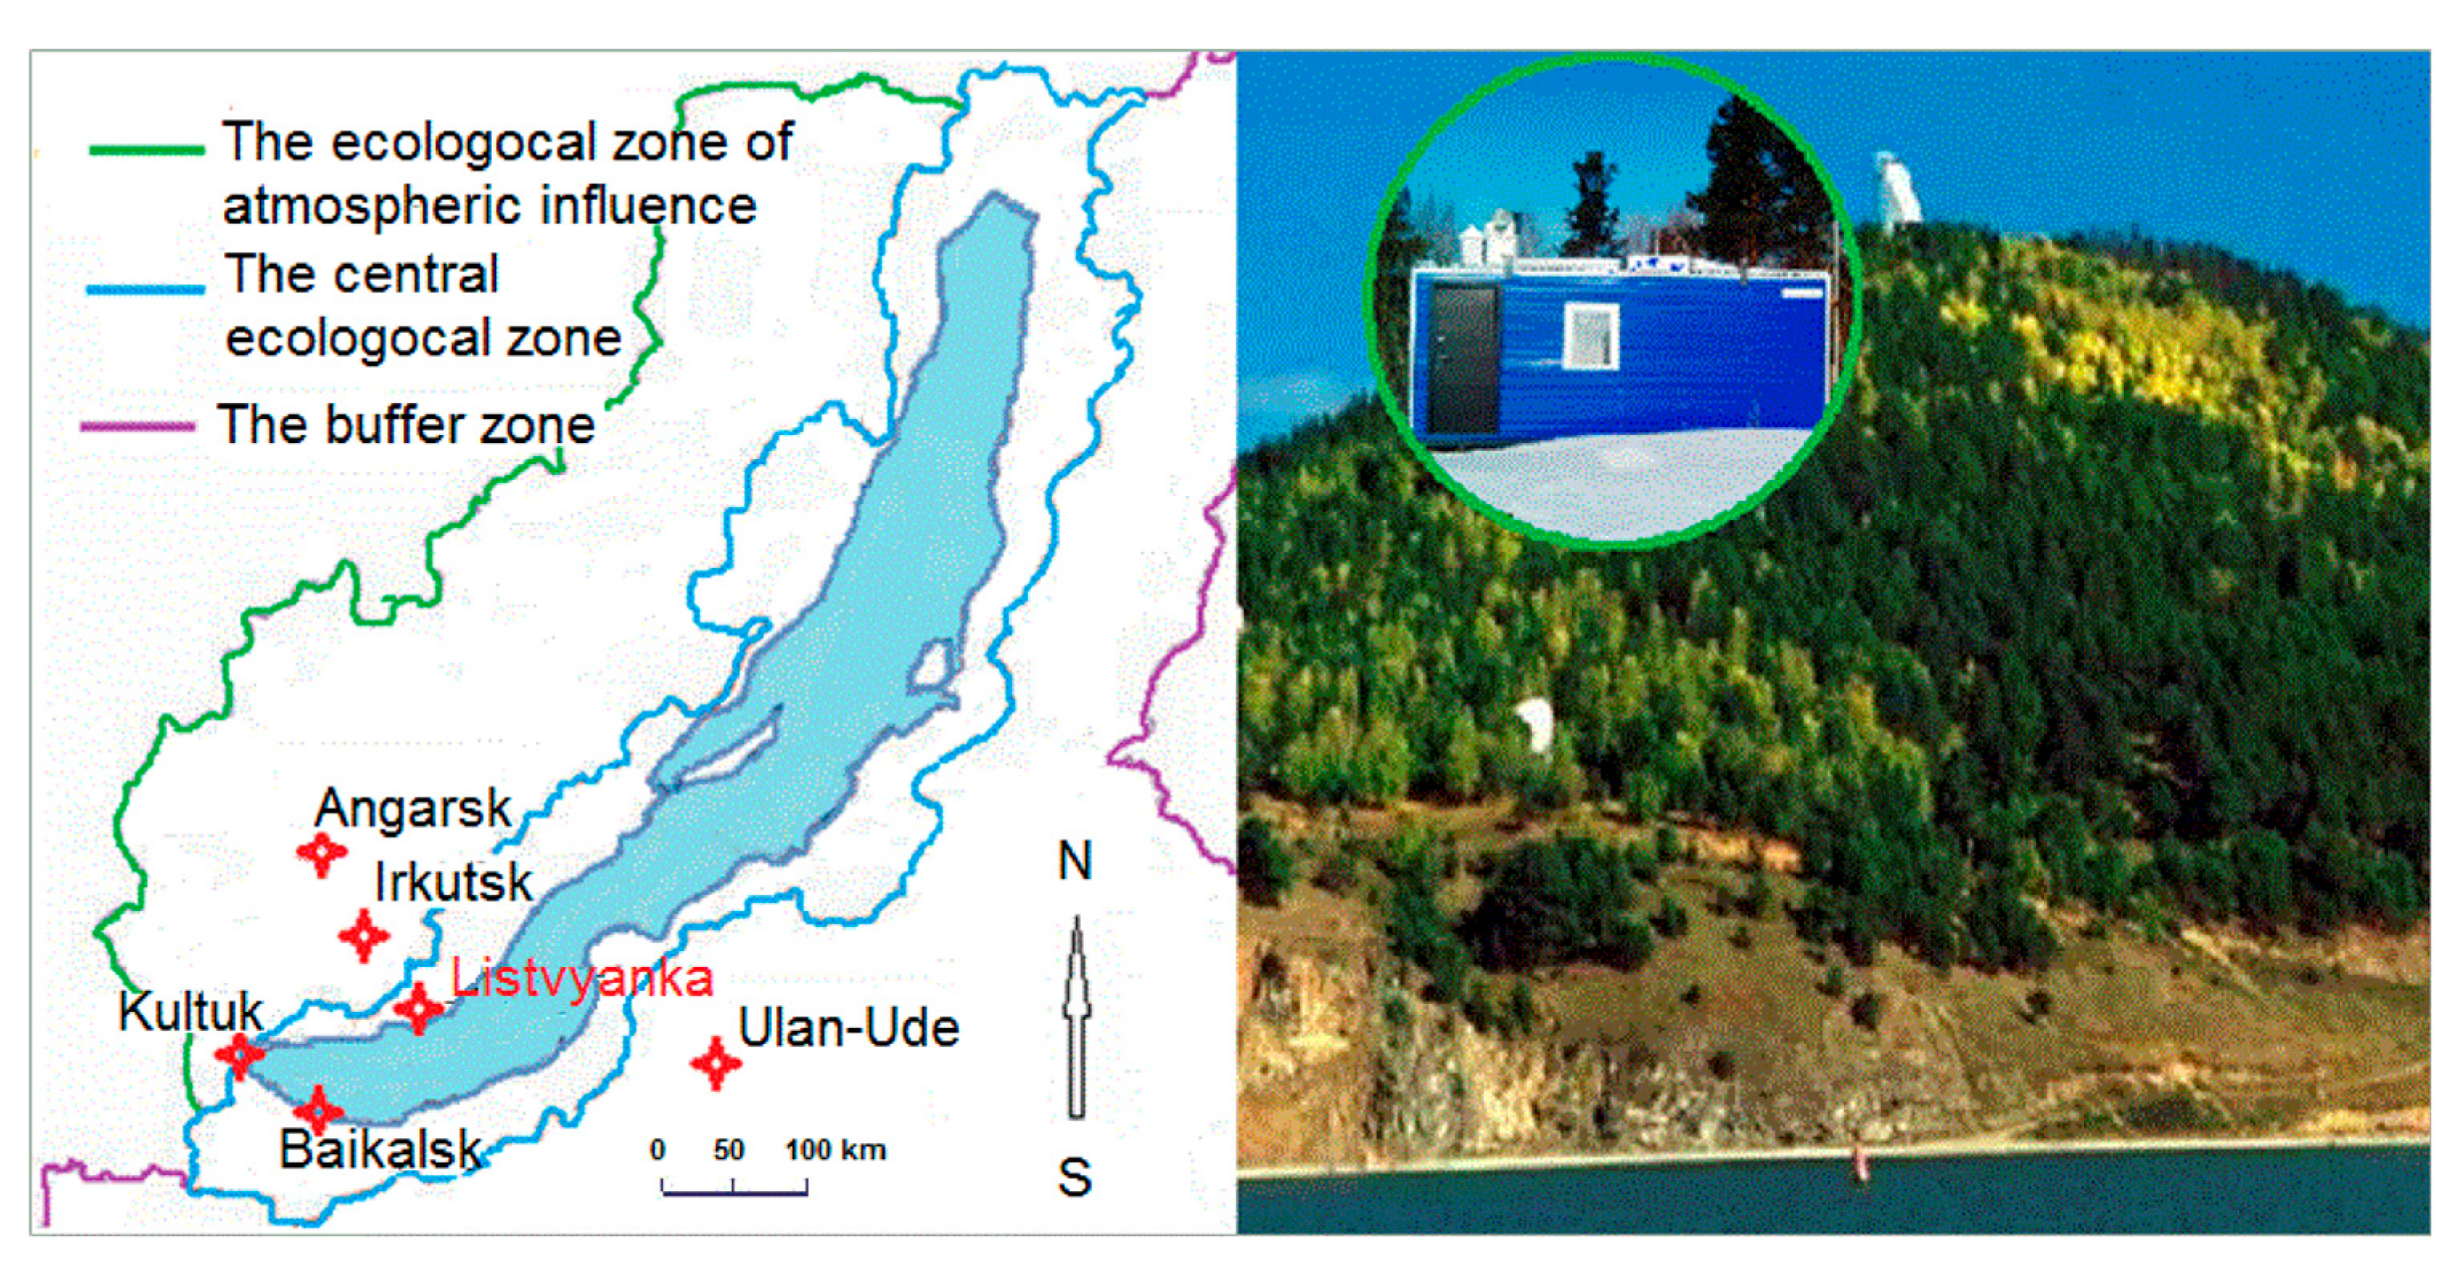
The Listvyanka station and the Listvyanka settlement are part of the Irkutsk region. Taking into account that the station is situated on the route of the dominant transport of air masses from the industrial zone of the Irkutsk region, air emissions from stationary sources are the main cause of air pollution. Vehicles also contribute significantly to air pollution [19]. In recent years, the intensity and duration of wildfires have increased [20]. Figure 2 shows the interannual variability in median values of the concentrations of the sum of ions in the aerosols measured at the Listvyanka station from 2000 to 2020, with gross emissions of pollutants into the atmosphere of the Irkutsk region from stationary and mobile sources, as well as with the average area of one wildfire [19,21,22]. With a relatively stable gross flow of substances into the atmosphere from stationary and mobile sources, and growth in the average areas of burned-out forests from 2014 to 2020, the median values of the total concentrations of ions decreased in the aerosol composition.
The high median value of the sum of ions in the aerosols was observed between 2000 and 2004 (4.73 ± 0.84 μg·m−3). The greatest variability in the concentrations of the sum of ions was observed from 2005 to 2009 (1.97 ± 0.67 μg·m−3), as evidenced by the high standard deviation. During this period, there was almost a 2.4-fold decrease in the median value of the sum of ions in comparison with the initial period of the study. One of the causes of this was the change in climate indicators in the southern part of the Irkutsk region. The thermal regime also changed, with an increase in the amounts of precipitation, humidity, and wind speed in the region. Annual air temperature changed two times faster than the global average, and the annual amount of precipitation increased by 80 mm [23]. Moreover, in 2005, 70 km from the station, a project was implemented in Irkutsk to merge the branches of thermal power plants—the main sources of air pollution in large cities—into a single heating substation [24]. The sum of ions was the most stable between 2010 and 2017 (1.45 ± 0.23 μg·m−3); nevertheless, it was 3.3 times lower than in the initial period. In 2020, the median concentration of the sum of ions in the aerosol composition corresponded to 0.46 ± 0.40 μg·m−3, and was already an order of magnitude lower than from 2000 to 2004. Such values of the sum of ions are close to the similar data from the Mondy background station located at an altitude of 2000 m above sea level [25]. A high standard deviation indicates a significant seasonal variability in the ionic concentrations in the aerosol composition.
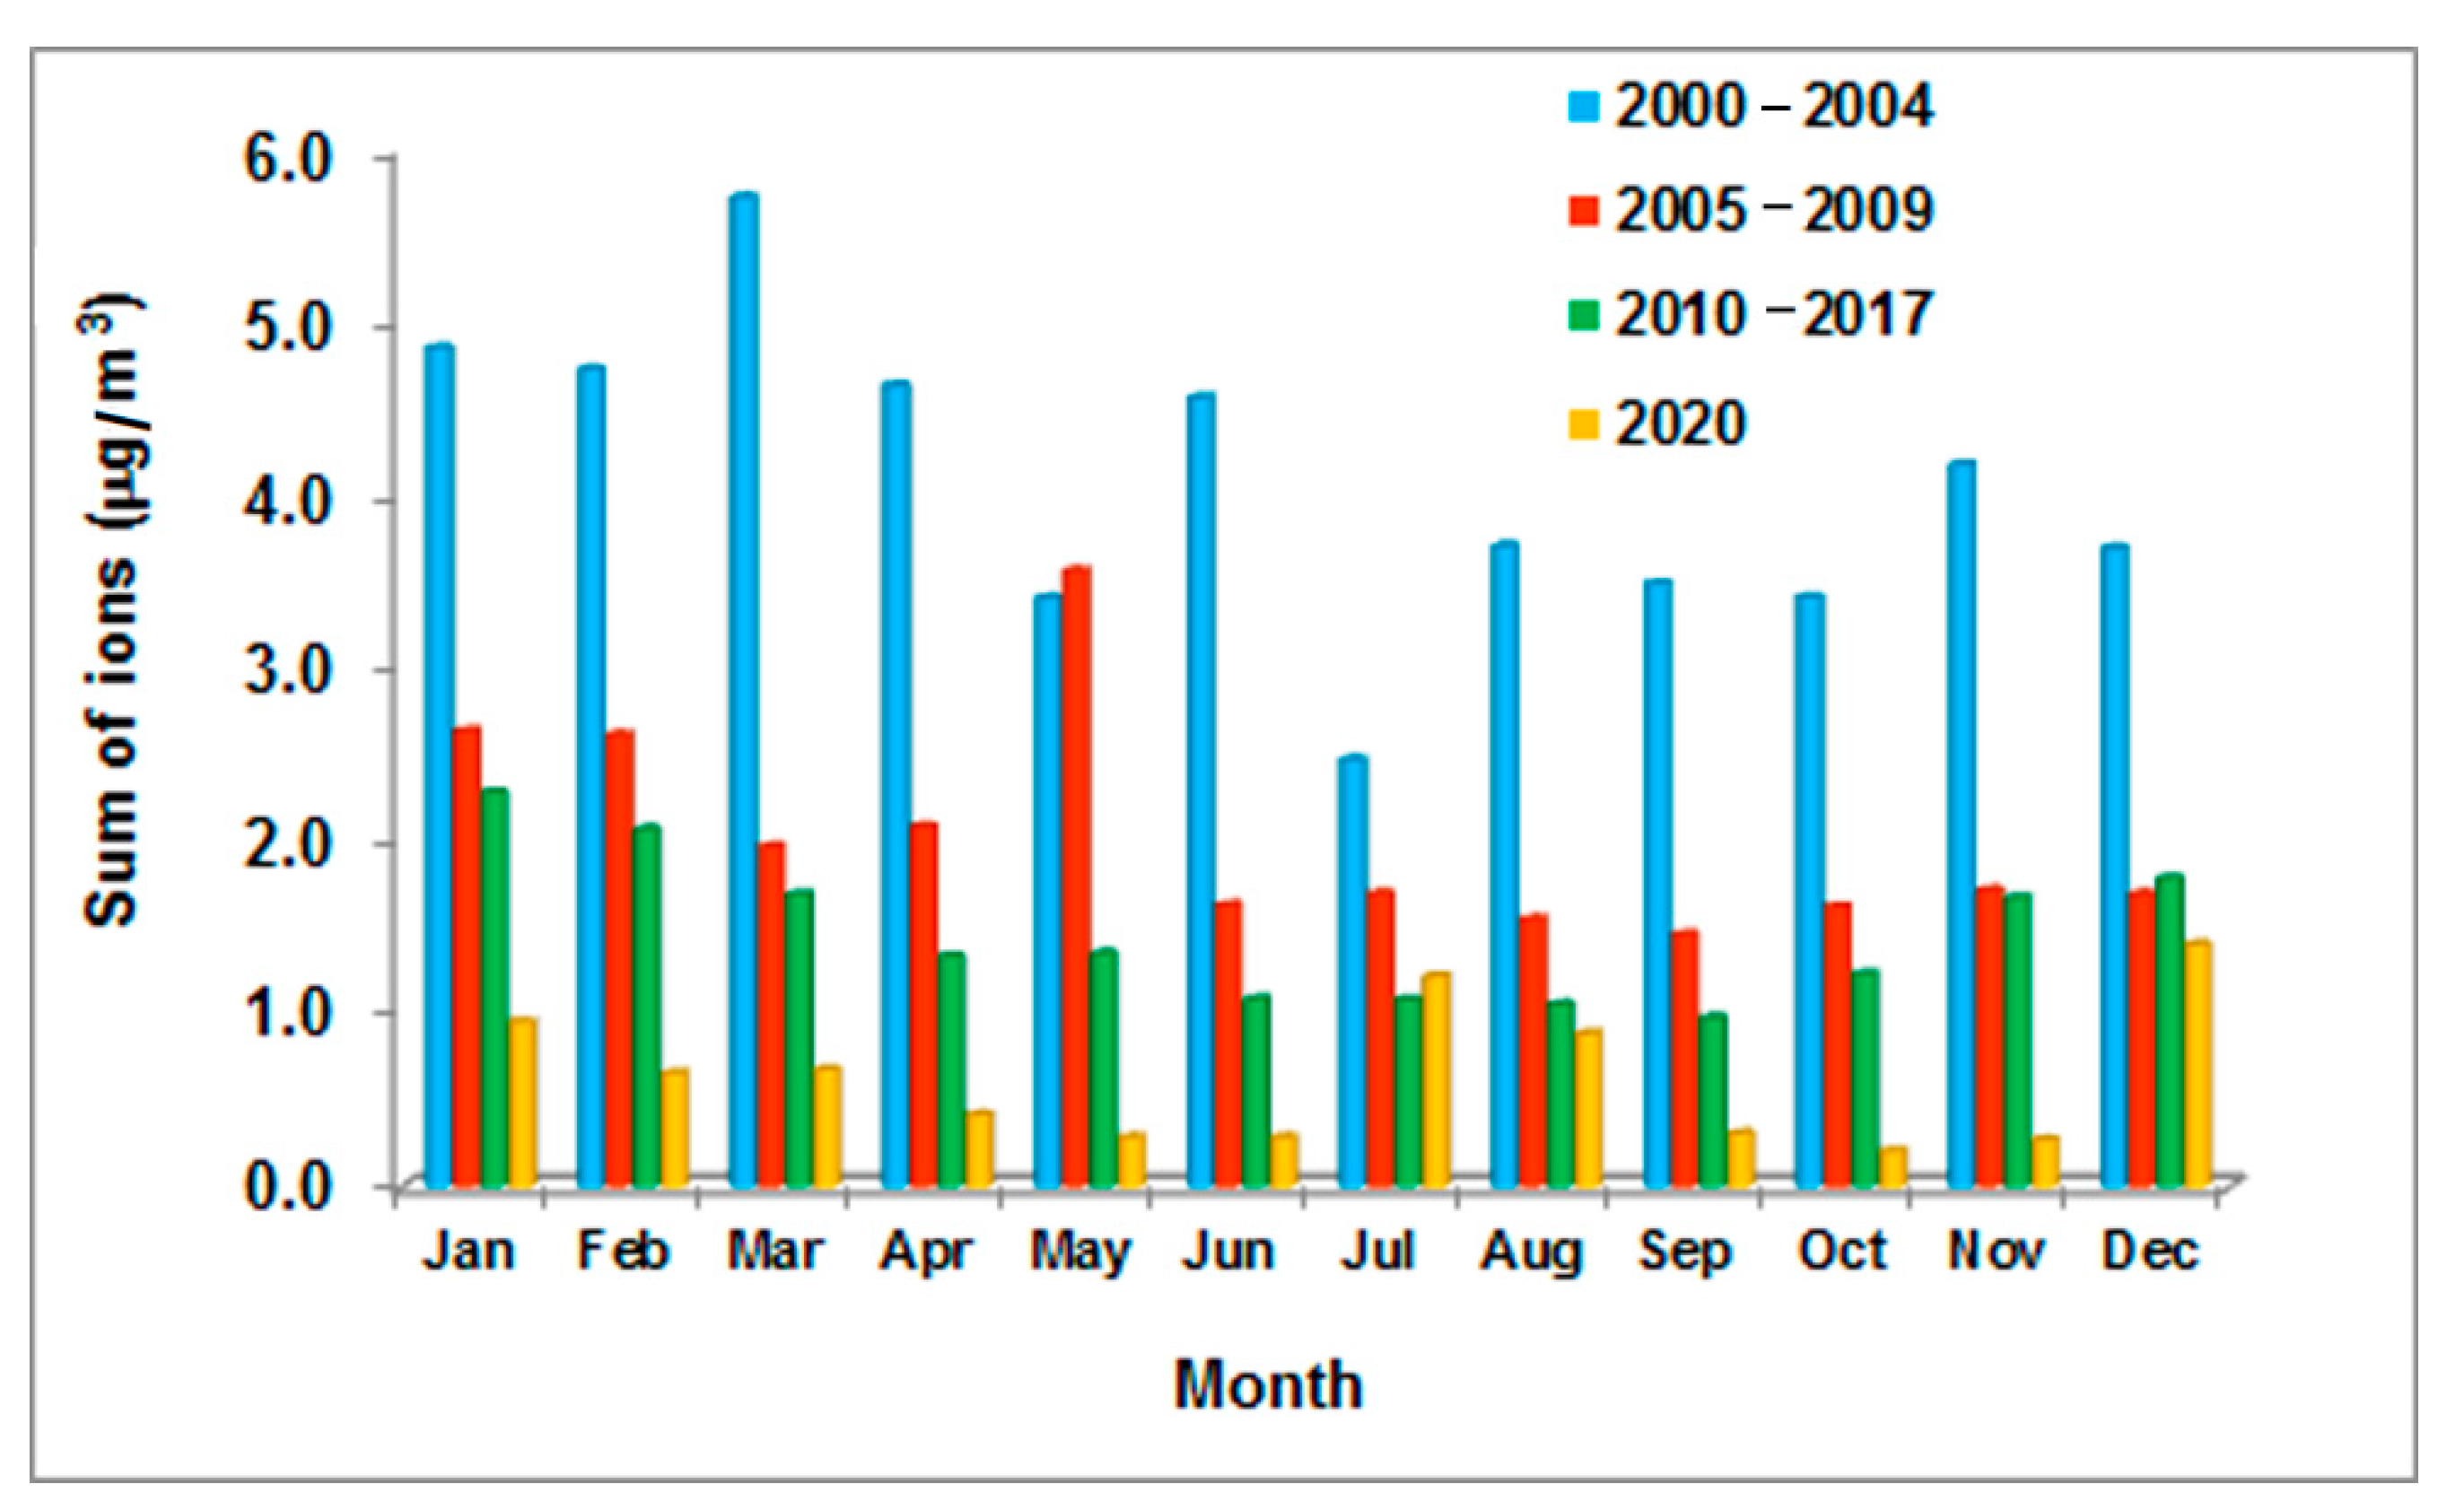
Figure 3 shows seasonal dynamics of ionic concentrations in the aerosol composition at the Listvyanka station in 2020. Seasonal distribution of mean monthly ionic concentrations, with a decrease in the warm season and an increase in the cold season, is typical of continental stations [26,27].
However, no substantial seasonal variation in the total amount of ions was observed at the Listvyanka station. This is due to the absence of large sources of air pollution and the constant purification of the atmosphere near a large body of water from aerosol particles by precipitation during dry deposition. In some observation periods, the ionic concentrations increased in the warm season. The main source of air pollution in the warm season is wildfires, especially in combination with extreme weather events [9,28]. For example, in July and August 2020, the ion concentration in aerosols increased. The peak of wildfires that year took place during the same months (Figure 3) [22,29].
In 2020, NH4+, Ca2+, and SO42− predominated in the aerosol composition. The ionic concentrations, in ascending order, were as follows: NH4+ > Ca2+ > Na+ > K+ > H+ > Mg2+ and SO42− > Cl > NO3. The mean monthly ionic concentrations in the aerosol composition are shown in Table 1. It is obvious from the table that in some periods the concentrations of NO3 were below the detection limits. In July and August, the mean concentrations of K+, Na+, Cl, Mg2+, and SO
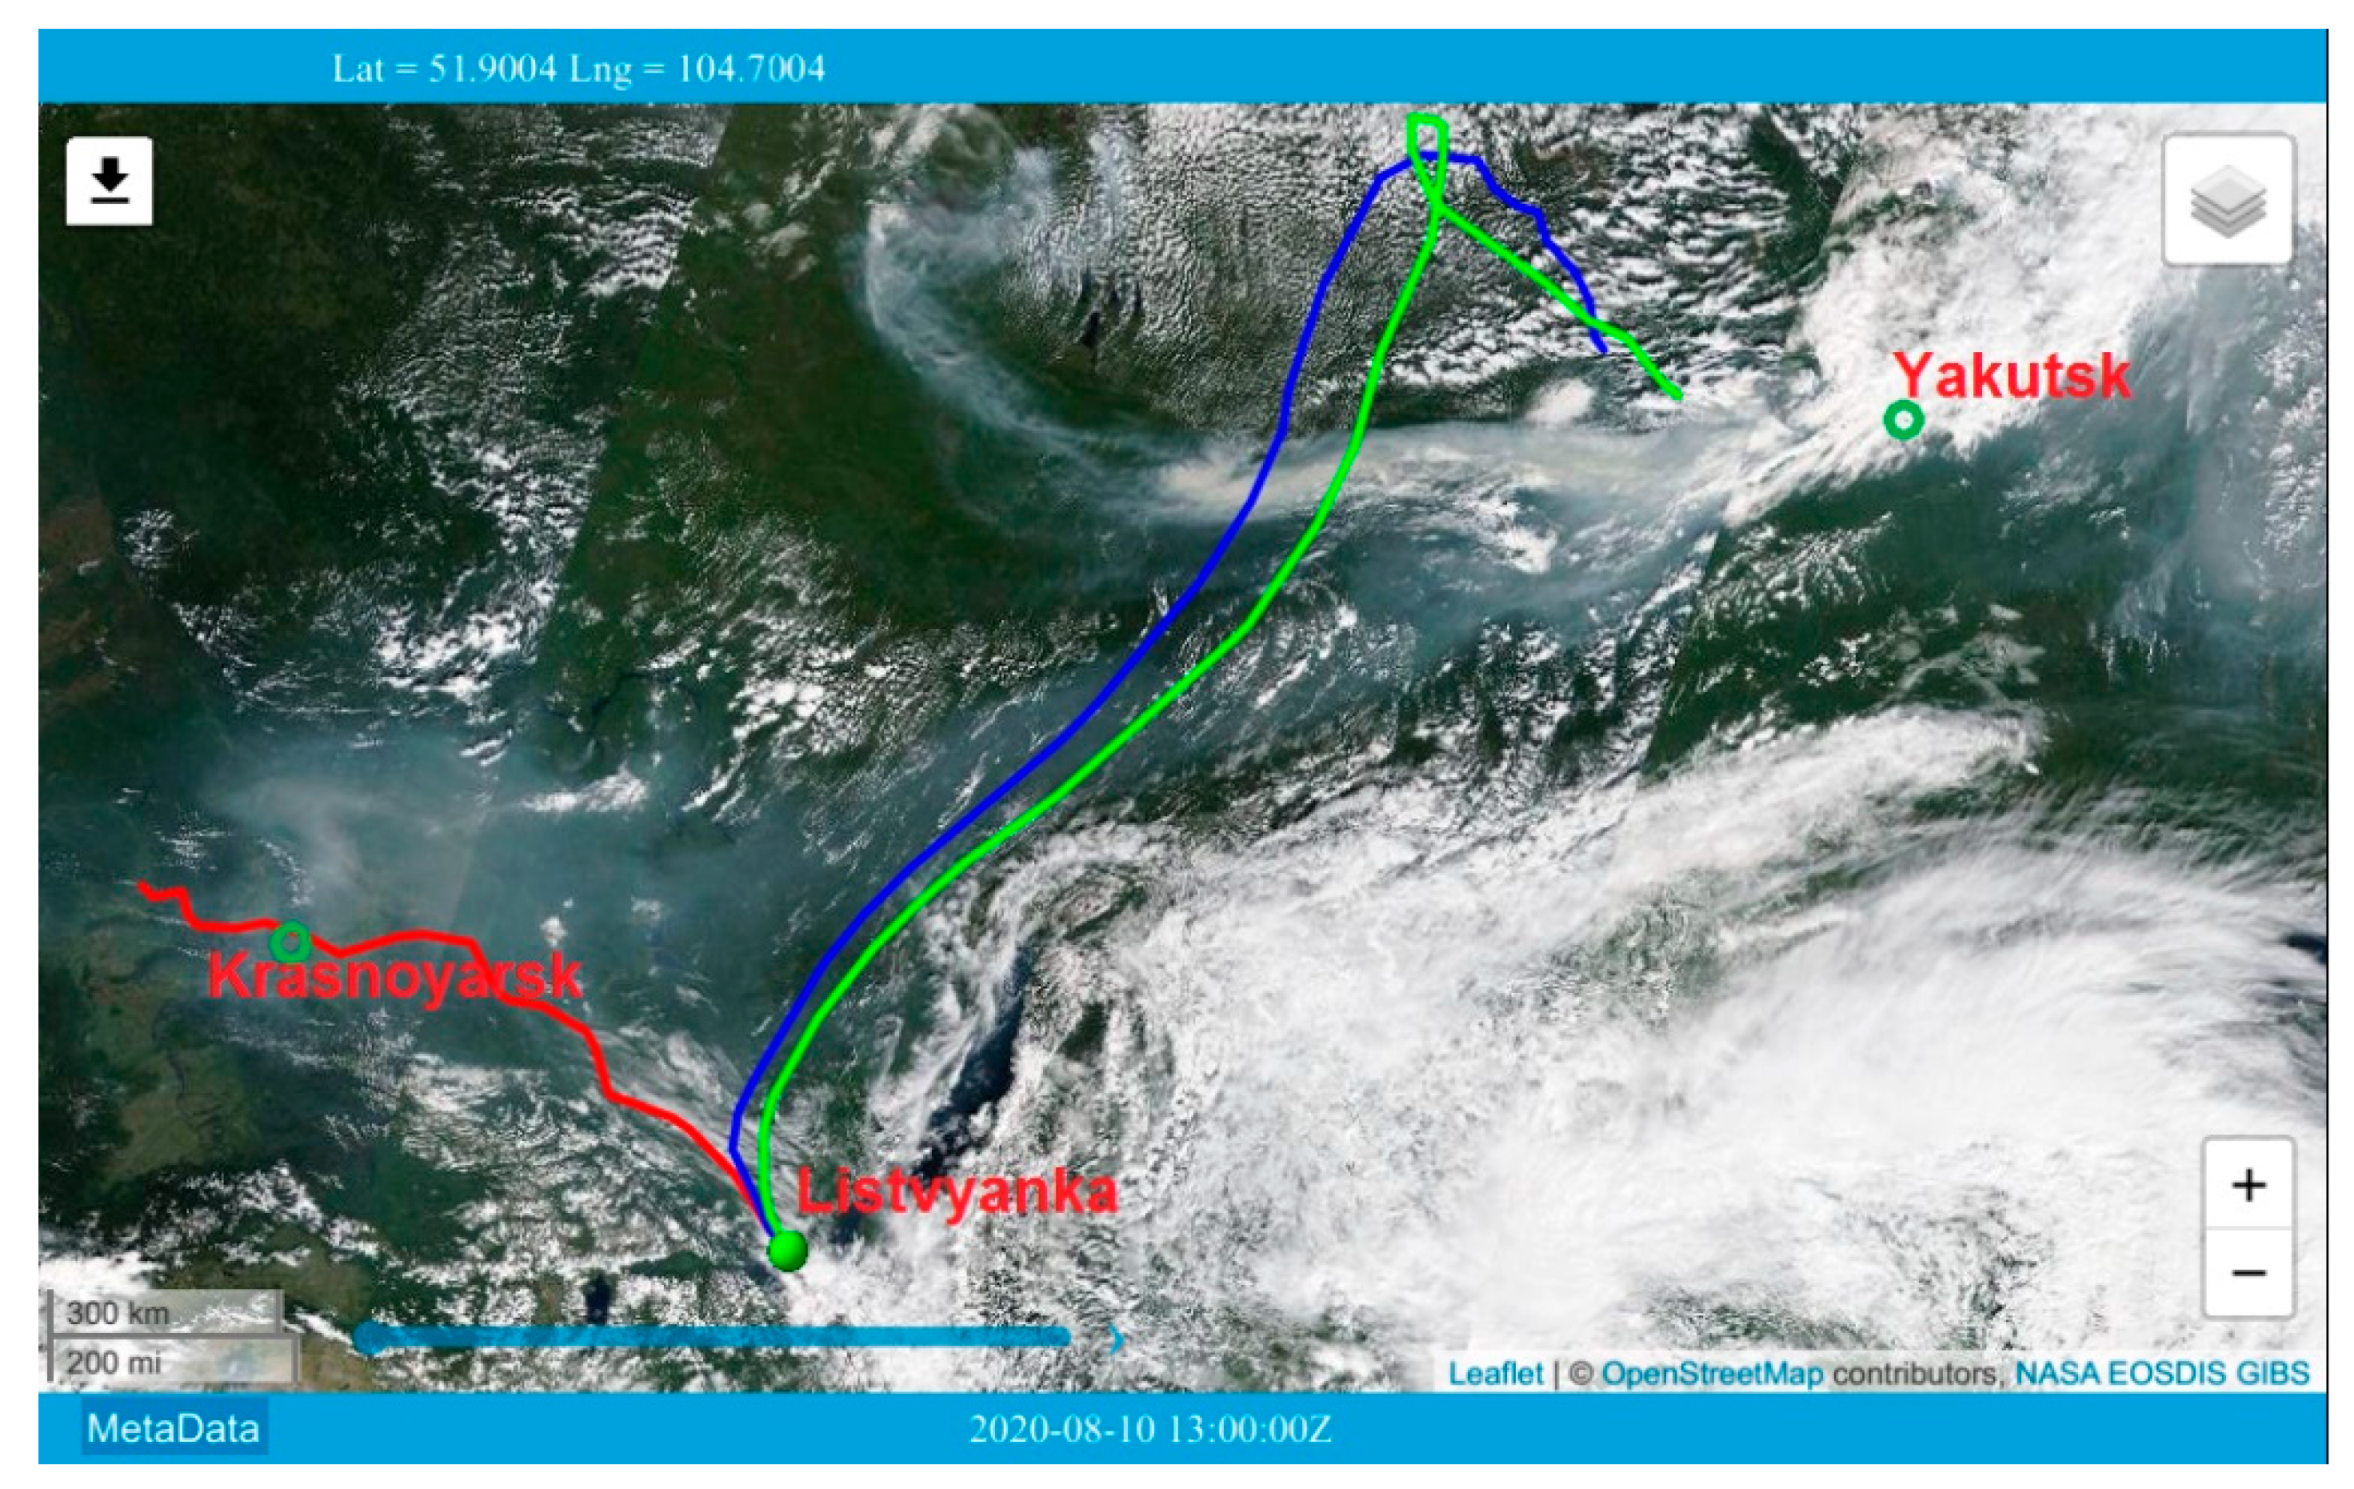
42− increased in the aerosol composition. The analysis of the back trajectories of air masses—which was carried out for each day from 1 June to 30 August 2020—and satellite images revealed that from 26 July to 16 August, smoke from wildfires came from the northern areas of the Irkutsk region and southern areas of Yakutia (Figure 4) [29]. Depending on the type of biomass burned, Si, Ca, S, K, Al, Fe, Mg, and Cl are inorganic components of ash, while among gases, there are ammonia, and oxides of carbon, nitrogen, and sulphur. In Figure 4, there are obvious smoke plumes from wildfires entering the area of the Listvyanka station [29].
During aging, volatile inorganic components are condensed as chlorides and sulphates into a group of particles enriched in potassium [30,31,32,33]. Chlorides and potassium serve as markers in modelling the transport of plumes from wildfires [34].
Correlation analysis was carried out to identify the relationships between the ionic concentrations. There was a high positive correlation (r > 0.9) between the concentrations of NH4+, Ca2+, and Mg2+ ions with SO42−, Cl, and NO3 anions. Moreover, the concentrations of NH4+, Ca2+, and Mg2+ were closely related to one another (r > 0.9). This indicates a single source of intake of the substances adsorbed on aerosol particles. In winter, the anthropogenic factor (coal ash) is such a source. In the absence of industrial pollution sources in the Listvyanka settlement, it is important to take into account dominant directions associated with the transport of pollutants with air masses. In the warm season of the year, a high degree of correlation between the concentrations of SO42 and NO3 (r = 0.9) testifies to their formation during photochemical reactions in the atmosphere. Na+, K+, Ca2+, and Mg2+ do not have volatile forms; therefore, their precursors are aerosol particles carried into the atmosphere from the ground surface. Notably, there was no positive correlation between the concentrations of Na+/K+ and other ions, despite a relationship between them (r > 0.8). Smoke plumes can be a likely source of these ions. Previously [9], we have shown that during the transport of smoke plumes with air masses, K+ ions are adsorbed mainly on submicron aerosol particles of 0.3–1.0 μm.
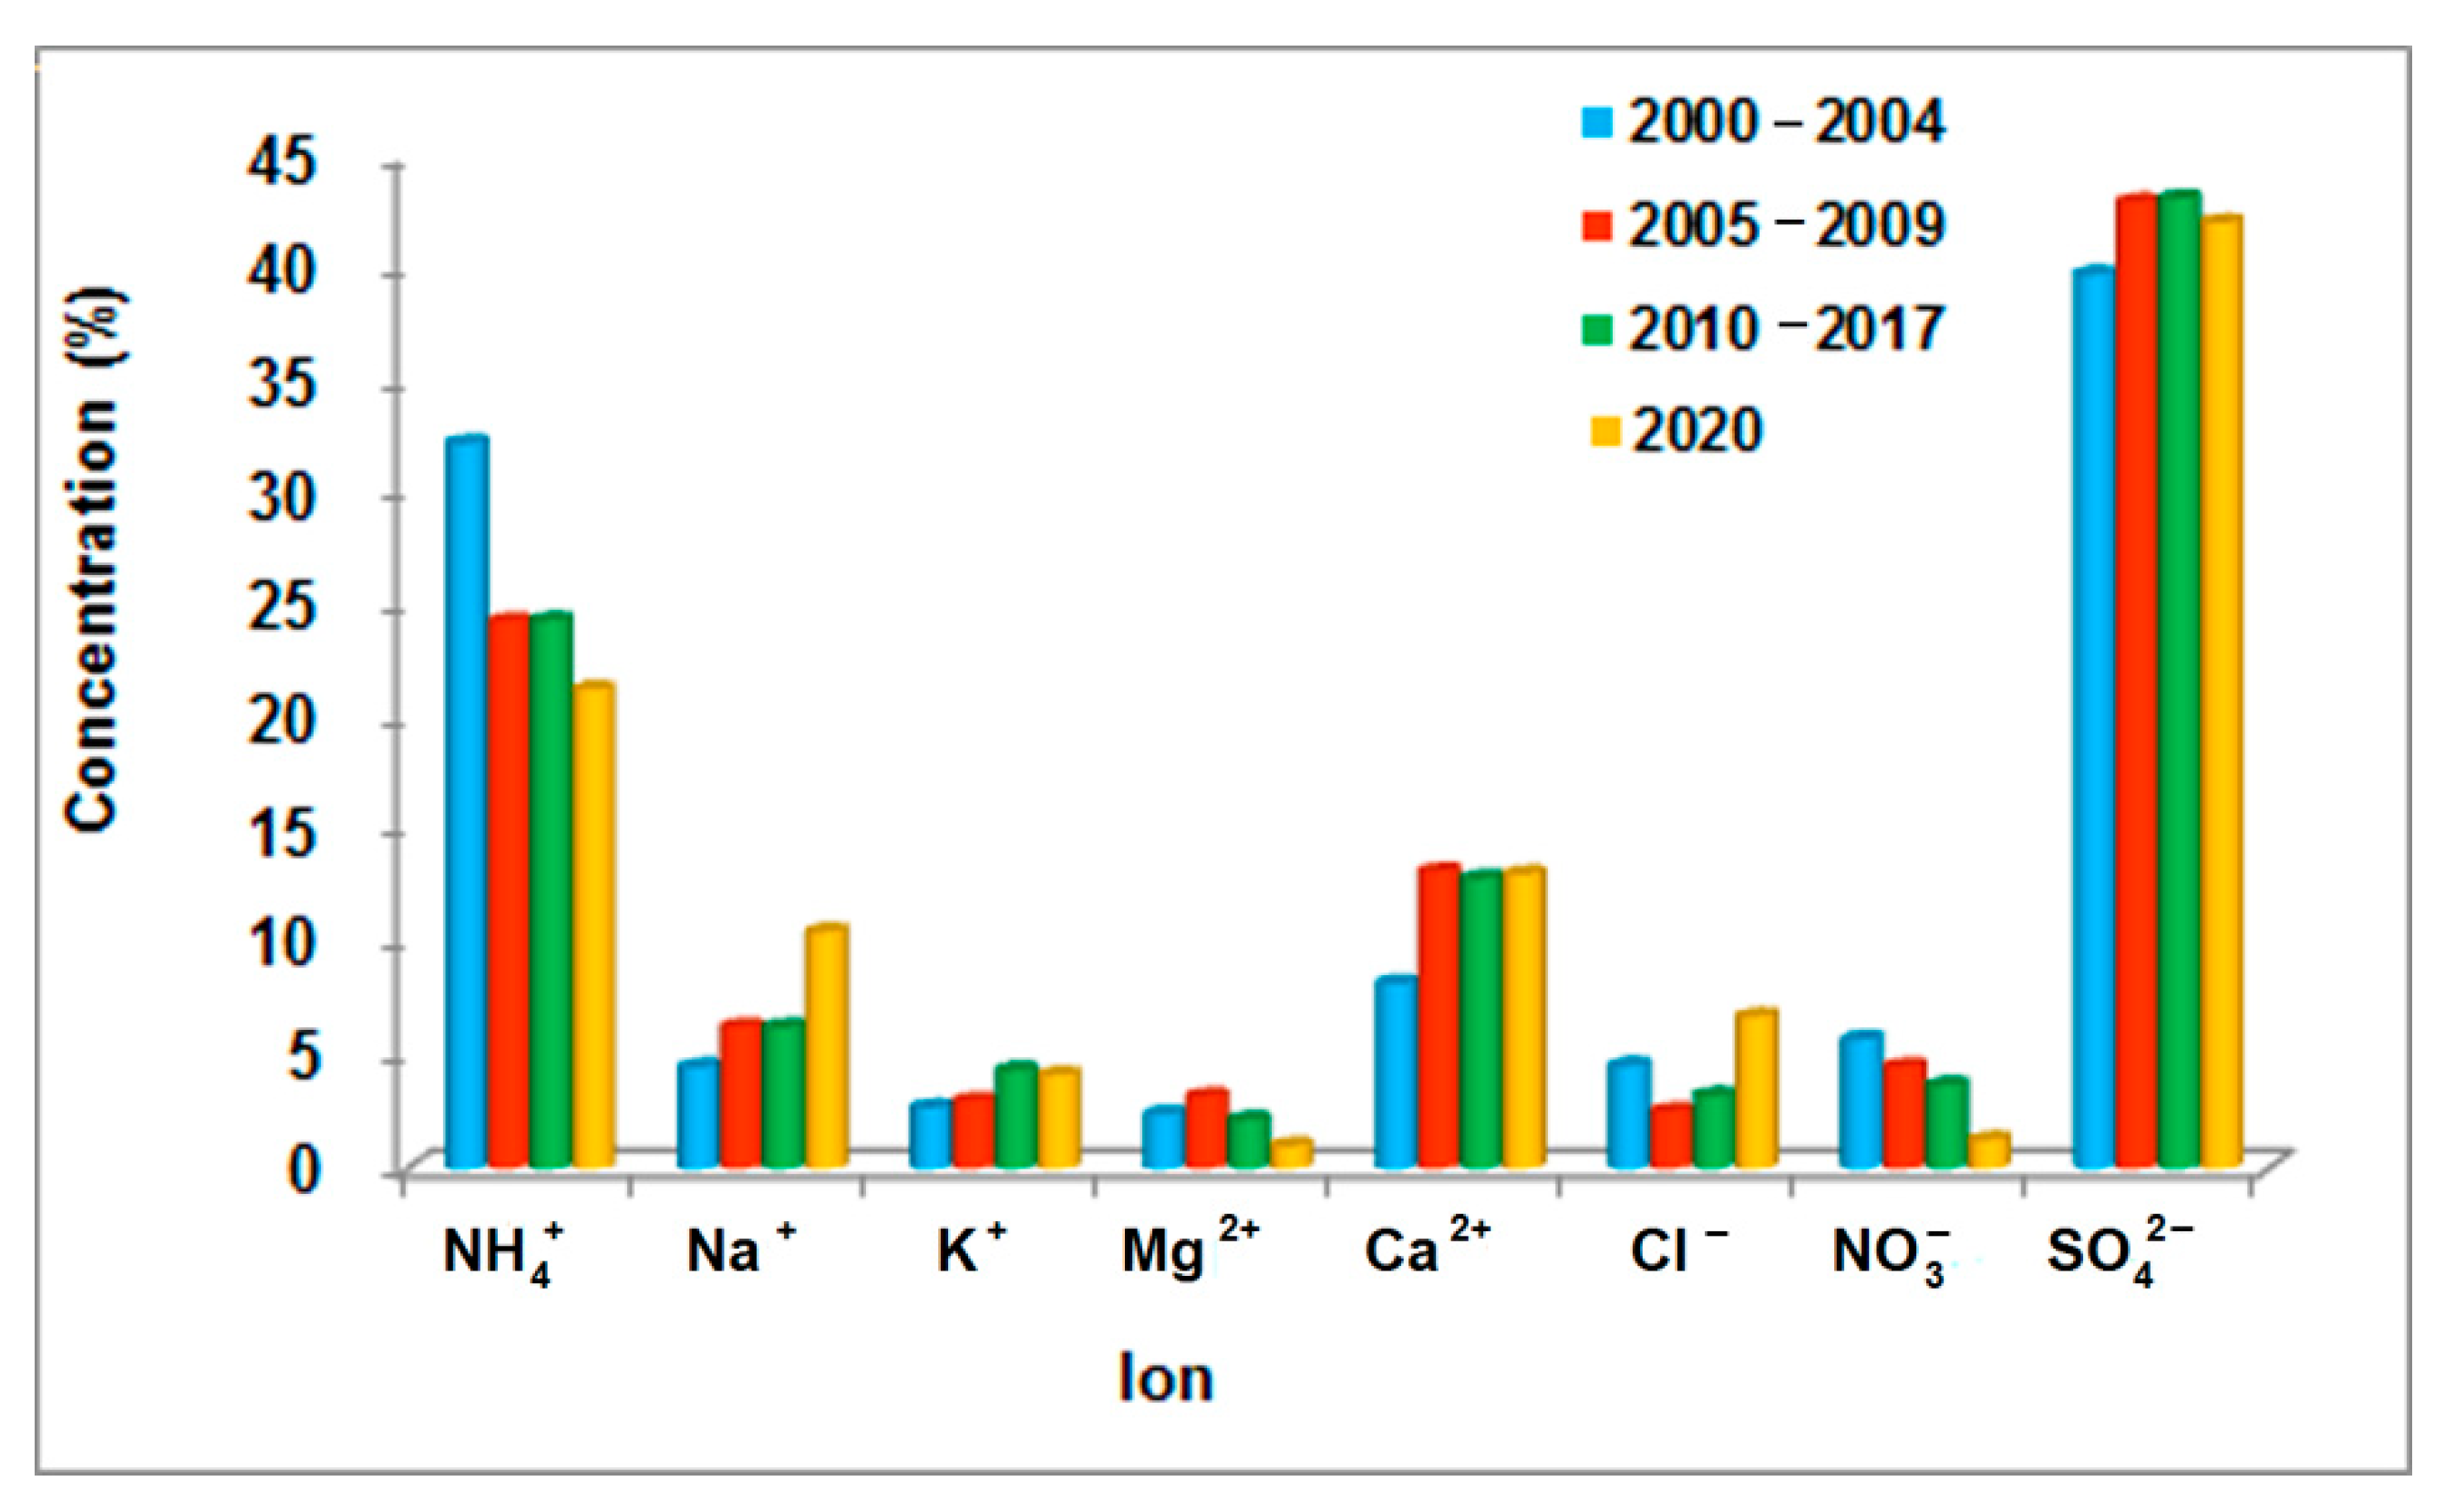
A comparison of the ionic composition of aerosols in 2020, involving similar data from previous years, revealed that NH4+, Ca2+, and SO42 were the dominant ions in the composition of the atmospheric aerosols at the Listvyanka station throughout the entire study period. However, the ratios of their concentrations have changed over the years (Figure 5). While during the initial period of the study NH4+ and SO42− were major ions—with contributions of 32% and 40%, respectively—in subsequent years, the contribution of NH4+ reduced to 24%, and that of SO42− increased to 43%. The role of Ca2+ increased significantly, from 8.0% between 2000 and 2004 to 13% in subsequent periods. The greatest contribution of this ion to the aerosol composition at the Listvyanka station was noted during the cold season of the year. This may indicate an increased local emission of alkaline earth elements into the atmosphere, which is associated with the expansion of infrastructure in tourist and recreational areas. In the aerosols of 2020, there was an increase in ions such as Na+ and Cl—up to 10.0% and 7.0%, respectively. Since 2010, the contribution of K+ ions has increased, which is likely due to the deterioration of fire hazards in the region in spring and summer. Under the influence of smoke plumes from wildfires, the contribution from the average monthly concentrations of K+ increased to 8–20%.

3.2. Precipitation

Precipitation is one of the most important climatic characteristics. Long-term changes in the chemical composition of precipitation are an important element of information for environmental control. In particular, in the Baikal region, they form the river runoff of most of the rivers in the southern part of the region, which are among the main sources of dissolved substances contributing to the chemical mass balance of Lake Baikal. According to the 2005 data, the proportion of the atmospheric component in the influx of dissolved substances to Baikal water ranged from 2 to 6% [35].
A study of the chemical composition of precipitation collected at the Listvyanka station in 2020 revealed that the total concentrations of ions in precipitation throughout the year varied within the range of 0.6–30.0 mg/L, with a mean value of 6.6 ± 4.7 mg/L. The minimum concentrations of soluble impurities of 0.6 mg/L were determined in rainwater collected on 12 and 13 September. During this period, ~70% of the monthly precipitation (60 mm) fell [36]. Snow that fell on 6 and 7 April had the maximum concentrations of all investigated elements. The sum of ions within the range of 10–15 mg/L was observed in 15% of the total precipitation. As a rule, such precipitation occurred in the driest spring period (March and April), characterized by an increased concentration of aerosol particles in the atmosphere. Precipitation with the sum of ions ranging from 5 to 10 mg/L was the most common, making up 46% of cases. Precipitation with the sum of ions less than 5 mg/L fell in ~37% of cases.
In 2020, the average annual sum of ions in wet deposition at the Listvyanka station (6.6 mg/L) was close to the same value as between 2000 and 2010 (6.7 mg/L). From 2011 to 2019, the average annual sum of ions was 7.3 mg/L, which was 10% higher than in 2020. The decrease in the sum of ions in precipitation in 2020 compared to the period from 2011 to 2019 is likely due to an increase in the amount of wet deposition in recent years, and improvement of the ecological conditions in the region resulting from COVID-19 restrictions. According to [36], an increase in the amount of precipitation in the Listvyanka settlement has been observed since 2019, and in 2020, it increased by 34% in comparison with the average interannual value in the period 2011 to 2019.
There is a relationship between the average monthly sum of ions in precipitation and the amount of precipitation (Figure 6). For example, the maximum precipitation in 2020 at the Listvyanka station was recorded in August and September; the lowest concentrations of the average monthly sums of ions were also found during this period. The highest sum of ions was observed in April, with the smallest amount of precipitation (4 mm).
Seasonal variability of the sum of ions in precipitation at the Listvyanka station is more obvious than that in atmospheric aerosols. In November–April, the sum of ions was twice as high as that in the warm period (May–October). This is primarily due to the greater air pollution in the cold season, associated with the transport of emissions from the thermal power industry of the Irkutsk region. However, in some years, seasonal differences in the chemical composition of precipitation at the station were less obvious [37].
Table 2 shows the ionic composition of precipitation sampled in 2020. Large values of root-mean-square deviations, as with aerosols, indicate significant variability in the ionic concentrations in the precipitation composition.
The comparison of the average annual concentrations of ions in precipitation in 2020, involving the same data from previous years, is shown in Table 3. In precipitation, the concentrations of Na+, K+, Mg2+, and Cl increased with a simultaneous decrease in the concentrations of Ca2+, NH4+, SO42−, NO3, and HCO3. Interestingly, a comparison of interannual ionic concentrations in the aerosol composition of 2020 also revealed an increase in the concentrations of Na+, K+, and Cl, as well as a decrease in NH4+, SO42−, and NO3.
SO42− and Ca2+ were major ions that made the greatest contribution to the mineralisation of wet depositions at the Listvyanka station in 2020. The average annual relative concentrations of ions in snow can be arranged in descending order as follows: Ca2+ > NH4+ > Mg2+ > Na+ > H+ > K+ and SO42− > NO3 > Cl > HCO3.
In rainfall at the station, the fractional contribution from calcium ions decreased significantly, and the contributions from ammonium ions and hydrogen ions increased. Hydrogen ions were major cations in precipitation during the warm season. This was facilitated by an eight-fold excess of precipitation in the warm season compared to the cold season, as well as by a decrease in ash components in the atmosphere due to the termination of the heating season. The arrangement of ions according to the ratio of their fractional contributions to the composition of rainwater was as follows: H+ > NH4+ > Ca2+ > Mg2+ > K+ > Na+ and SO42− > NO3 > Cl > HCO3.
Correlational analysis revealed a good relationship of the SO42− concentrations with all other ions (r = 0.6–0.8), except for K+ and H+. NO3 ions were most correlated with Ca2+ (r = 0.9), Na+ (r = 0.8), and Mg2+ (r = 0.7), while Clions were most correlated with Na+ (r = 0.8). There was also a close relationship between the concentrations of Ca2+, Mg2+, and Na+, indicating a common source—most likely soil erosion—of their input in precipitation (r = 0.7–0.9). There was no relationship between hydrogen ions and strong acid anions.
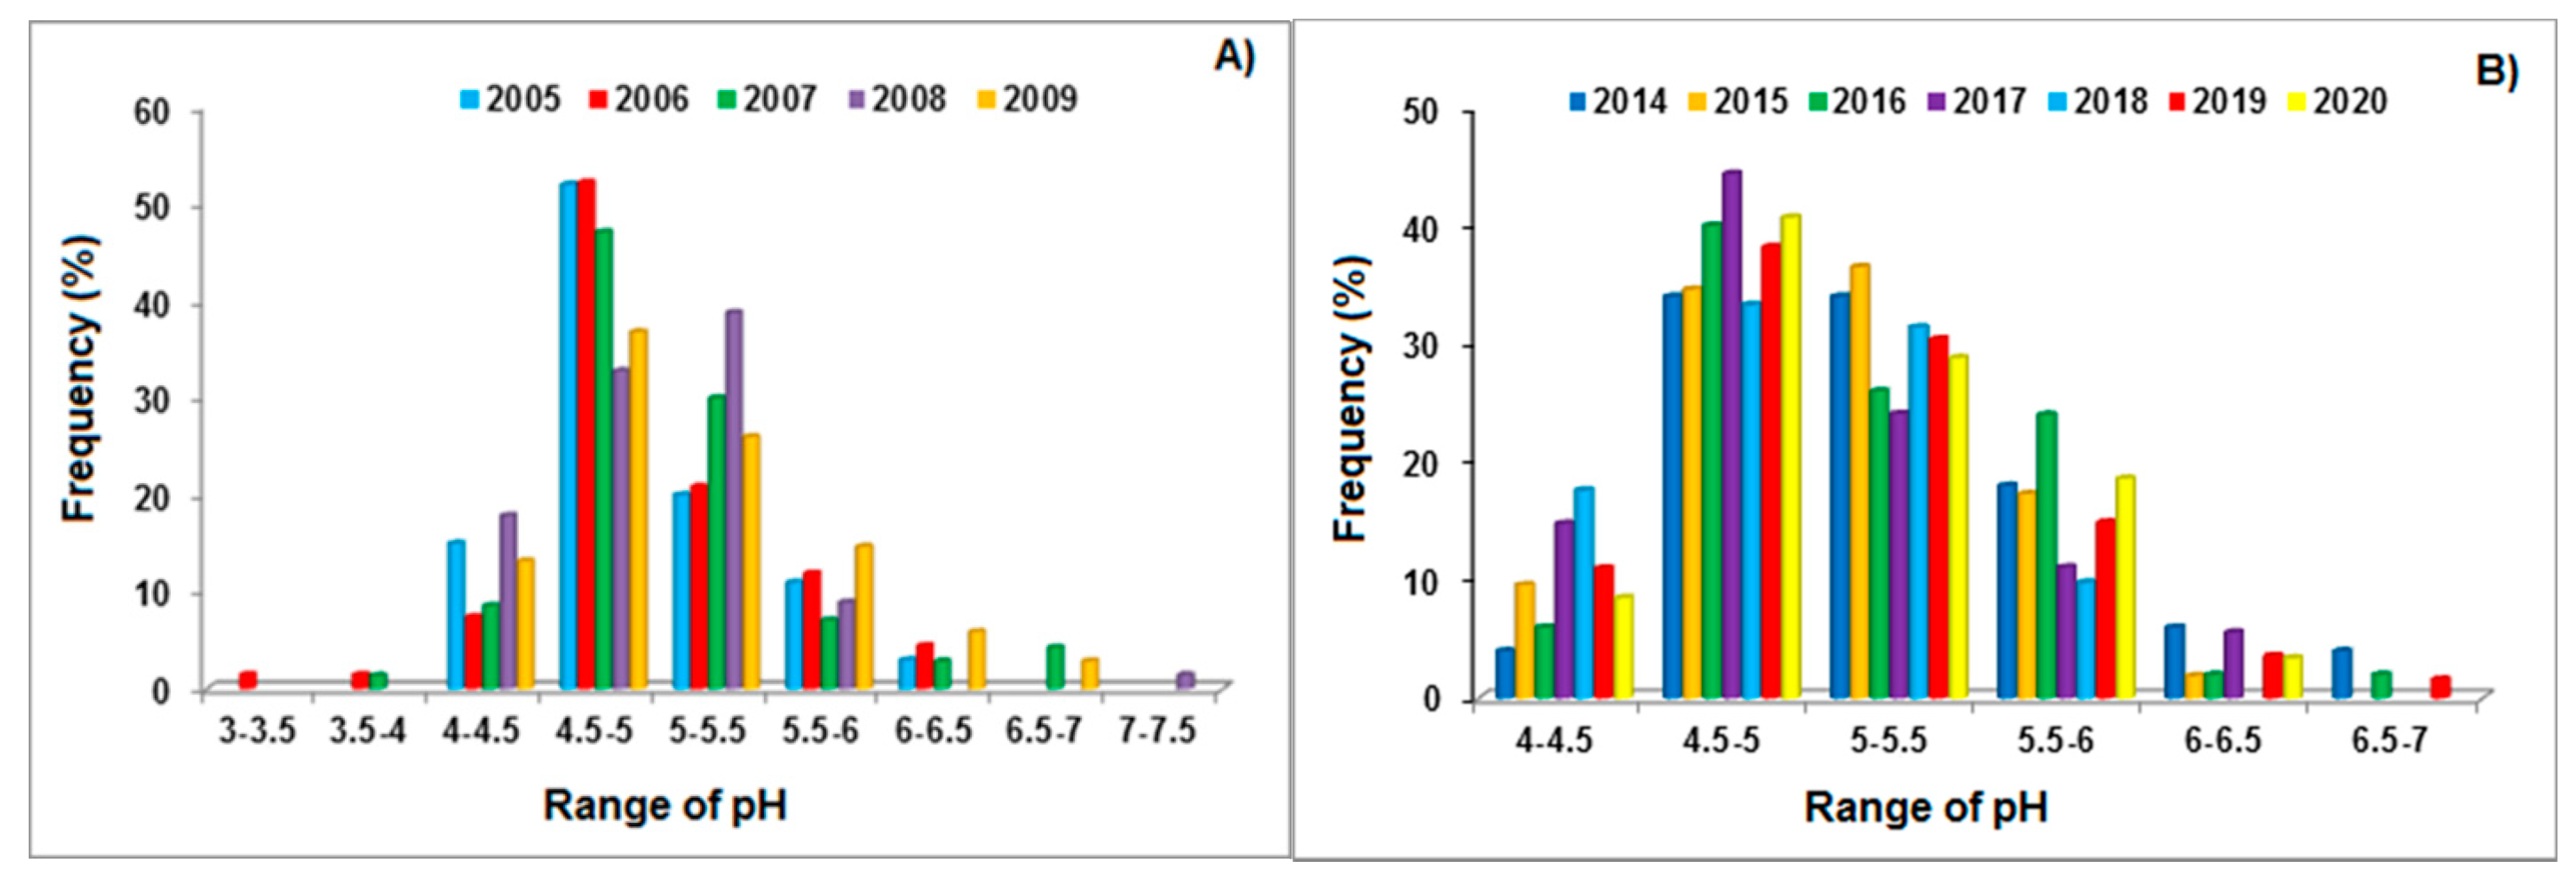
An elevated acidity and the absence of bicarbonate ions in most of the discrete samples are typical of precipitation at the Listvyanka station. The average annual pH value in 2020 was 5.10 ± 0.49, varying within the range of 4.21 to 6.44. Half of the wet depositions had a pH < 5, which testifies to the periodic effect of acid-forming gases (nitrogen oxide and sulphur oxide) on their chemical composition. The maximum frequency of acid precipitation at the Listvyanka station accounted for 67%, which was recorded in 2005 (Figure 7A). In 2020, as in most of the observed period, pH values of 4.5–5.0 were the most frequent. In 2020, the most acid precipitation with pH < 4.5 fell in summer, with SO42− concentrations that were elevated relative to the average annual values, as well as decreased concentrations of Ca2+ and NH4+. Over the past three years (from 2018 to 2020), the maximum acid precipitation (4.0–4.5), as well as precipitation within the pH range of 5.0–5.5, have decreased. At the same time, the amount of precipitation with pH 4.5–5.0 and 5.5–6.0 has increased. No extremely acidic precipitation with pH < 4.0—as recorded in 2006 and 2007—is currently observed at the station (Figure 7A,B).
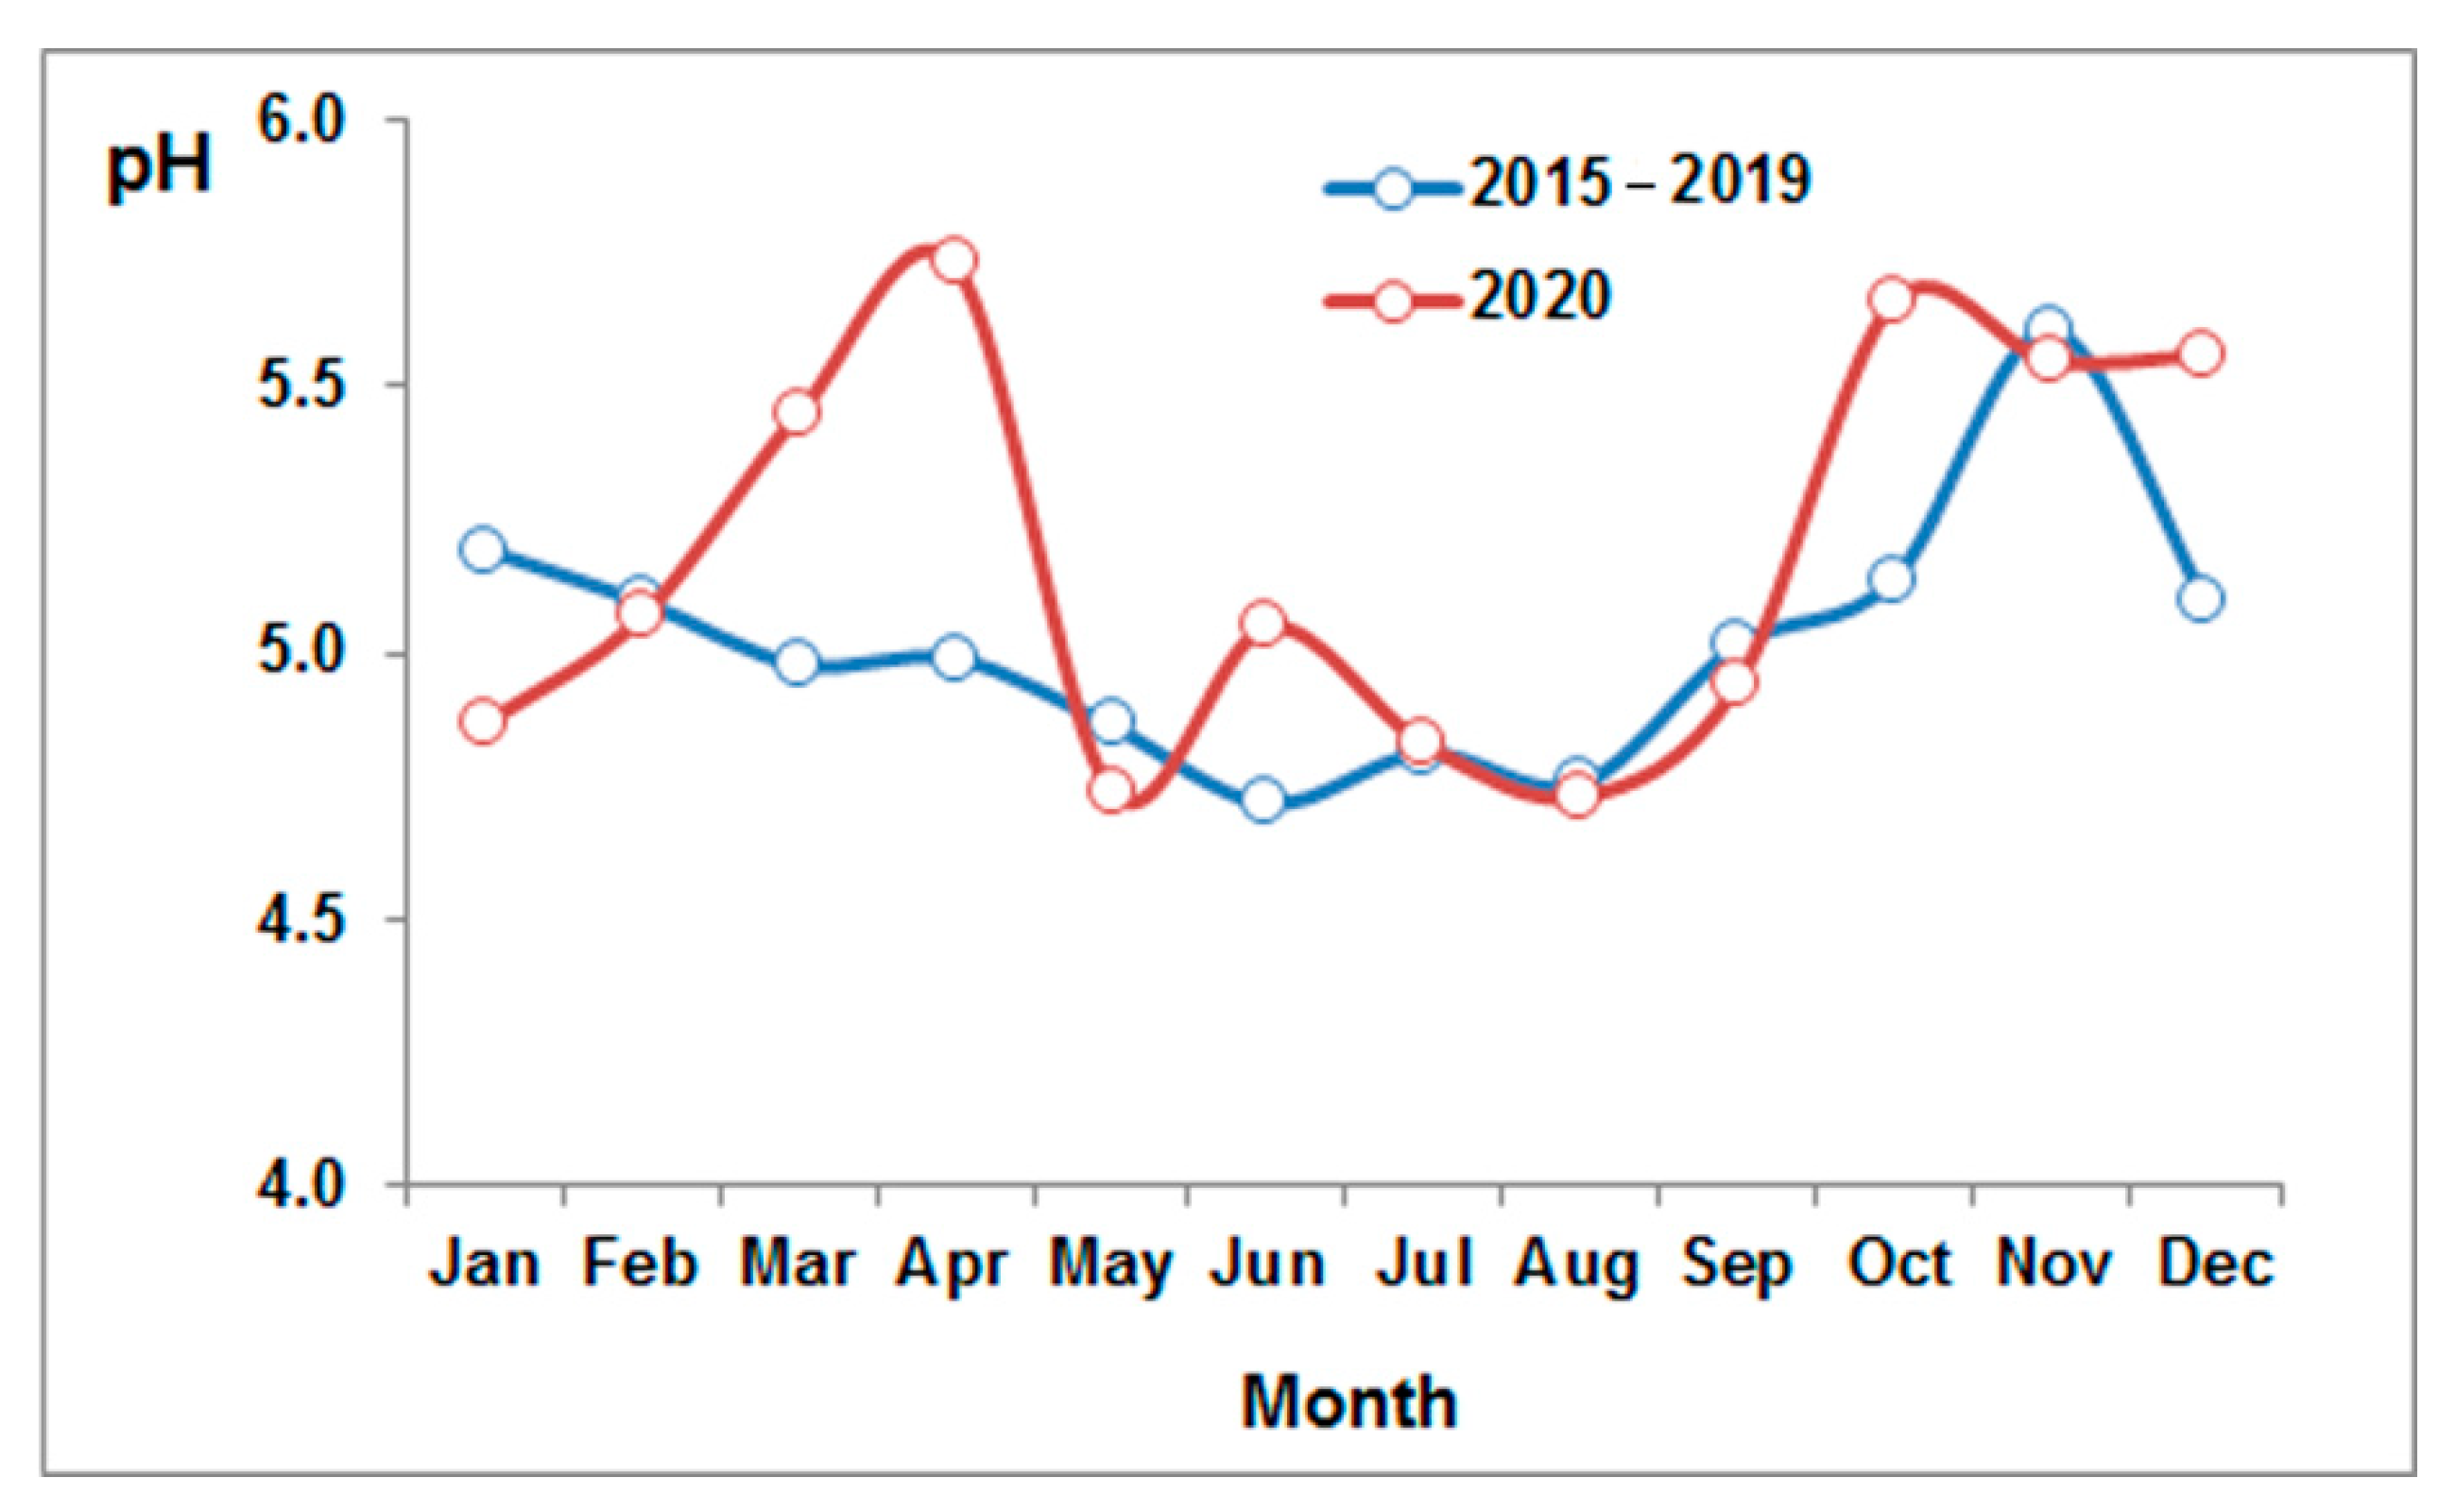
We studied the seasonal variability of the pH value of precipitation at the station. In 2020, unlike the previous five-year period, there were two pH peaks: in April and October (Figure 8). Both peaks were caused by low precipitation levels (Figure 6). The lowest pH values were observed in May and August 2020, whereas from 2015 to 2019 they were observed in June (see Figure 8).
There is a single annual variation in most of the average monthly total concentrations of ions and pH values. The correlation coefficient of this pair is 0.65, indicating that an increase in the total concentration of ions in wet depositions mostly entails an increase in the acid–base indicator. In annual terms, the pH value tended to decrease between 2000 and 2020.

3.3. Influx of Substances with Atmospheric Deposition (Aerosols and Precipitation) to the Underlying Surface of the Listvyanka Station

3.3.1. Influx with Aerosols

Long-term data (from 2000 to 2020) on the ionic composition of atmospheric aerosols sampled in the air at the Listvyanka station were used to assess the influx of dry deposition to the underlying surface. To calculate the dry deposition with aerosols, the following well-known formula was used [38]:
D = C V × Δt,
where D represents the substance fluxes, C is the average concentration over the time period (Δt), and V is the deposition rate. In the calculations, we used the deposition rates proposed in [38] for the temperate latitudes of Russia (Table 4).
Figure 9 presents the average annual influx of ions to the underlying surface of the Listvyanka station from 2000 to 2010, and from 2011 to 2020, in comparison with 2020. We calculated the annual flux of substances, which was averaged over the selected periods. Obviously, the bulk of pollutants was deposited by aerosols in the first decade of the 21st century. In 2020, the total influx of substances (34 mg·m−2·year−1) was on average 5.8 times lower than between 2000 and 2004 (196 mg·m−2·year−1). The fluxes of sulphates and nitrogen compounds (NH4+ and NO3) were predominant. In 2020, the fluxes of NH4+ and NO3 decreased, and the influx of Na+, K+, Ca2+, Cl, and SO42− became predominant.
Seasonal variability can be traced in the influx of substances to the underlying surface (Table 5). The fluxes of the sum of ions to the surface increase from April to June when, with intense solar irradiance, turbulent heat transfer and convection processes in the atmosphere intensify. Increased fluxes of substances persist throughout the entire warm season. They decrease in the cold autumn and winter seasons, when cyclogenesis processes are activated during the restructuring of the Earth’s baric field from the summer to winter. From January to April, Lake Baikal is covered with ice; thus, dust particles are easily transported over long distances, without deposition onto the water surface, which acts as a kind of filter during their transport [39]. In July and August 2020, the fluxes of substances increased. As noted above, during this period, smoke aerosols from wildfires entered the area of the southern basin of Lake Baikal.

3.3.2. Influx with Precipitation

Table 6 shows the values of monthly depositions of the investigated elements to the underlying surface in the area of the Listvyanka station via precipitation, based on the 2020 data. Analysis of the data in Table 7 indicates that the highest fluxes of the sum of ions were observed during periods of high precipitation from May to September, with the maximum in August, which coincides with the maximum value of precipitation in 2020 (Figure 6). As mentioned above, in July and August, there were smoke aerosols in the atmosphere above the southern basin of Lake Baikal. The origin of ions that made the greatest contribution to the total flux was mostly associated with gas-phase reactions in the atmosphere, and the washing-out of solid particles.
A study of year-long ion fluxes in 2020 and their comparison with previous years revealed a decrease in the bulk of ions in the depositions. For instance, compared to the data on the first decade of the 21st century, in 2020, a decrease in the deposition of Ca2+, NH4+, and NO3 was the most significant (35–42%). From 2011 to 2019, the decrease ranged from 21 to 29%. At the same time, the deposition of hydrogen, sodium, and potassium ions increased (by 16–45%) (Table 7). Over 20 years of monitoring, there has been a 1.4-fold decrease in the deposition of the sum of ions via precipitation.

3.3.3. Influx of Acid-Forming Elements

An important criterion of the ecological conditions is the assessment of the influx of sulphur and nitrogen to the underlying surface. Sulphur and nitrogen fluxes coming from the atmosphere with aerosols and precipitation were recalculated for nitrogen from nitrates and ammonium ions, as well as for sulphur from sulphates. The acidification of precipitation was the most likely adverse consequence of the influx of sulphur and nitrogen to Lake Baikal, leading to a shift in the balance of major ions in the waters of the tributaries in the southern basin of Lake Baikal [35].
The average interannual fluxes of sulphur and nitrogen via aerosols and precipitation were different; the sulphur fluxes were higher than the nitrogen fluxes (Table 8). From 2000 to 2020, the nitrogen influx with aerosol decreased by a factor of 35, and the sulphur influx decreased by a factor of 5. The decrease in the fluxes of nitrogen and sulphur with precipitation has been less significant: 1.3-fold for sulphate sulphur and 1.6-fold for mineral nitrogen. In 2020, the influx of nitrogen with aerosols accounted for ~1% of the total influx with precipitation, and that of sulphur was ~10%.

4. Conclusions

Based on the 2020 data compared to the data from previous years, we studied the chemical composition of atmospheric aerosols and precipitation at the Listvyanka station situated on the southwest coast of Lake Baikal. The station is located 200 m above the lake’s level, which excludes the influence of the activities in the settlement of the same name, and allows the tracing of high-altitude regional and global transport of air pollution. The chemical composition of aerosols and precipitation at the Listvyanka station testify to the impact of both natural and anthropogenic factors on their formation.
The average annual concentration of ions in the aerosol composition varied from 4.73 μg·m−3 between 2000 and 2004 to 1.45 μg·m−3 between 2010 and 2017, and currently (2020) accounts for 0.46 μg·m−3. A decrease in the total concentration resulted both from the changes in climate indicators in the southern part of the Irkutsk region, and from the improvement of the ecological conditions as a result of environmental protection measures. NH4+, Ca2+, and SO42− were the predominant ions in the composition of atmospheric aerosols at the station, the concentrations of which varied significantly throughout the observation period. In 2020, despite the low concentrations, the contributions of Ca2+, Na+, and Cl to the aerosol composition increased to 13%, 10%, and 7%, respectively. Although wildfires are episodic, the contribution of K+ ions—one of the markers of smoke aerosols—has increased since 2010.
In 2020, the total concentration of ions in precipitation at the station averaged 6.6 mg/L. Precipitation prevailed, with the sum of ions ranging from 5 to 10 mg/L. The seasonal variability—with the maximum in April and the minimum in September—was more obvious for the ionic concentrations in the precipitation composition than in the atmospheric aerosols, corresponding to the annual variation in the amount of precipitation. Mineralisation of wet depositions decreased by 10% in 2020 compared to the period from 2011 to 2019. Sulphates and calcium were major ions in precipitation. During the cold season, the contribution of nitrates increased, while in the warm season, ammonium and hydrogen increased. The average annual acid–base indicator in wet depositions near Listvyanka accounted for a pH value of 5.1. The most frequent pH values in precipitation ranged from 4.5 to 5.0. pH values tended to decrease from 2000 to 2020.
The fluxes of the sum of ions in aerosols increased from April to June and, as with the ion fluxes with precipitation, remained the highest during the warm season of the year. In the deposition of ions via precipitation, which prevailed in summer, ammonium, sulphates, and hydrogen were at their maximum in August. In comparison with the data from previous years, the deposition of most ions—especially calcium, ammonium, and nitrates—decreased in 2020. The deposition of hydrogen, sodium, and potassium ions increased. The influx of nitrogen and sulphur—the main elements affecting the acidification of the environment—decreased both in aerosols and in precipitation. In 2020, the influx of nitrogen with aerosols amounted to ~1% of the total influx with precipitation, and that of sulphur was ~10%. Research over the past 20 years has revealed that the ecological conditions at the Listvyanka station have generally improved. This research is of great importance, because the role of the atmosphere in assessing the state of the environment of Lake Baikal has been increasing in recent years.

Author Contributions

Conceptualization, L.G. and O.N.; organization of expeditionary measurements, T.K.; expeditionary measurements, V.O.; physicochemical analysis of samples, L.G., O.N. and O.K.; writing—original draft, L.G. and O.N.; writing—review and editing, T.K. All authors have read and agreed to the published version of the manuscript.

Funding

This research received no external funding.

Institutional Review Board Statement

Not applicable.

Informed Consent Statement

Not applicable.

Data Availability Statement

Not applicable.

Acknowledgments

The work was supported by the Ministry of Science and Higher Education of the Russian Federation (grant No. 075-15-2020-787 for implementation of the large scientific project “Fundamentals, methods and technologies for digital monitoring and forecasting of the environmental situation on the Baikal natural territory”. Direction 2).

Conflicts of Interest

The authors declare no conflict of interest.

References

  1. Yu, H.; Liu, S.C.; Dickinson, R. Radiative effects of aerosols on the evolution of the atmospheric boundary layer. J. Geophys. Res. 2002, 107, 4142. [Google Scholar] [CrossRef]
  2. Ramanathan, V.; Crutzen, P.J.; Kiehl, J.T.; Rosenfeld, D. Aerosols, Climate, and the Hydrological Cycle. Science 2001, 294, 2119–2124. [Google Scholar] [CrossRef] [Green Version]
  3. Bond, T.C.; Bergstrom, R.W. Light Absorption by Carbonaceous Particles: An Investigative Review. Aerosol Sci. Technol. 2006, 40, 27–67. [Google Scholar] [CrossRef]
  4. Berg, M.J.; Heinson, Y.W.; Kemppinen, O.; Holler, S. Solving the inverse problem for coarse-mode aerosol particle morphology with digital holography. Sci. Rep. 2017, 7, 9400. [Google Scholar] [CrossRef] [PubMed] [Green Version]
  5. Liu, L.; Mishchenko, M.I. Scattering and Radiative Properties of Morphologically Complex Carbonaceous Aerosols: A Systematic Modeling Study. Remote Sens. 2018, 10, 1634. [Google Scholar] [CrossRef] [Green Version]
  6. Shmirko, K.; Pavlov, A.; Zubko, E. Coating effect on light scattering by irregularly shaped particles. J. Quant. Spectrosc. Radiat. Transf. 2018, 215, 71–76. [Google Scholar] [CrossRef]
  7. Latysheva, I.V.; Loshchenko, K.A.; Shahaeva, E.V. The study dynamics of the Asian High and cold periods of circulation of on the territory of Irkutsk Range. Bull. Irkutsk. State Univ. Ser. Earth Sci. 2011, 2, 161–172. [Google Scholar]
  8. Zhamsueva, G.; Zayakhanov, A.; Tcydypov, V.; Dementeva, A.; Balzhanov, T. Spatial-Temporal Variability of Small Gas Impurities over Lake Baikal during the Forest Fires in the Summer of 2019. Atmosphere 2021, 12, 20. [Google Scholar] [CrossRef]
  9. Golobokova, L.; Khodzher, T.; Khuriganova, O.; Marinayte, I.; Onishchuk, N.; Rusanova, P.; Potemkin, V. Variability of Chemical Properties of the Atmospheric Aerosol above Lake Baikal during Large Wildfires in Siberia. Atmosphere 2020, 11, 1230. [Google Scholar] [CrossRef]
  10. Tatiana Petrovna, K. Territorial Complex Scheme of Nature Protection of the Lake Baikal Basin: Fundamentals. Part II; Publishing House Giprogor: Moscow, Russia, 1990; p. 403. [Google Scholar]
  11. Obolkin, V.A.; Potemkin, V.L.; Makukhin, V.L.; Khodzher, T.V.; Chipanina, E.V. Long-Range Transport of Plumes of Atmospheric Emissions from Regional Coal Power Plants to the South Baikal Water Basin. Atmos. Ocean. Opt. 2017, 30, 360–365. [Google Scholar] [CrossRef]
  12. Obolkin, V.A.; Shamansky, Y.V.; Khodzher, T.V.; Falits, A.V. Mesoscale processes of atmospheric pollution transfer in the area of South Baikal. Oceanol. Res. 2019, 47, 104–113. [Google Scholar] [CrossRef]
  13. Shikhovtsev, M.Y.; Molozhnikova, Y.V. Inter-annual dynamics of regional and transboundary transport of air masses of the Baikal region for 2010–2018. In Proceedings of the 26th International Symposium on Atmospheric and Ocean Optics, Atmospheric Physics, Moscow, Russian, 12 November 2020. № Art. 1156061. [Google Scholar] [CrossRef]
  14. Onishchuk, N.; Khodzher, T.; Netsvetaeva, O. Chemical Composition of Atmospheric Precipitation at Monitoring Sites in Pribaikalye (East Siberia, Russia). Am. J. Clim. Chang. 2017, 6, 374–384. [Google Scholar] [CrossRef] [Green Version]
  15. Liu, Y.; He, J.; Lai, X.; Zhang, C.; Zhang, L.; Gong, S.; Che, H. Influence of Atmospheric Circulation on Aerosol and its Optical Characteristics in the Pearl River Delta Region. Atmosphere 2020, 11, 288. [Google Scholar] [CrossRef] [Green Version]
  16. Zhang, B. The Effect of Aerosols to Climate Change and Society. J. Geosci. Environ. Prot. 2020, 8, 55–78. Available online: https://www.scirp.org/journal/gep (accessed on 16 October 2021). [CrossRef]
  17. Leonardi, A.; Ricker, H.M.; Gale, A.G.; Ball, B.T.; Odbadrakh, T.T.; Shields, G.C.; Navea, J.G. Particle formation and surface processes on atmospheric aerosols: A review of applied quantum chemical calculations. Int. J. Quantum Chem. 2020, 120, e26350. [Google Scholar] [CrossRef]
  18. Monod, A.; Liu, Y. Aerosol formation and heterogeneous chemistry in the atmosphere. EPJ Web Conf. 2011, 18, 21. [Google Scholar] [CrossRef]
  19. State Report on the State and Protection of the Environment in the Russian Federation. Available online: http://www.mnr.gov.ru/upload/iblock/880/Гoсдoклaд-2020.pdf (accessed on 2 October 2021). (In Russia)
  20. Ponomarev, E.; Yakimov, N.; Ponomareva, T.; Yakubailik, O.; Conard, S.G. Current Trend of Carbon Emissions from Wildfires in Siberia. Atmosphere 2021, 12, 559. [Google Scholar] [CrossRef]
  21. The Ministry of Natural Resources and Environment of the Irkutsk Region. Available online: http://irkobl.ru/sites/ecology/picture (accessed on 2 October 2021).
  22. Federal Forestry Agency. Available online: https://aviales.ru (accessed on 3 September 2021).
  23. Shimaraev, M.N.; Starygina, L.N. Zonal circulation of atmosphere, climate and hydrological processes at Lake Baikal (1968–2007). Geogr. Nat. Resour. 2010, 3, 62–68. [Google Scholar]
  24. Novo-Irkutsk CHP. Available online: https://ru.wikipedia.org/wiki/Hoвo-Иркутскaя_ТЭЦ (accessed on 7 October 2021). (In Russia).
  25. Potemkin, V.L.; Golobokova, L.P.; Khodzher, T.V. Climatology and Chemistry of Surface Ozone and Aerosol under Alpine Conditions in East Siberia. Aerosol Air Qual. Res. 2019, 19, 1214–1225. [Google Scholar] [CrossRef]
  26. Terpugova, S.A.; Panchenko, M.V.; Dokukina, T.A.; Yausheva, E.P.; Kozlov, V.S. Seasonal Variations in the Content of Species of Differing Volatility Degree in the Near-Ground Aerosol According to Thermooptical Measurement Data. Atmos. Ocean. Opt. 2010, 23, 494–499. [Google Scholar] [CrossRef]
  27. Kondrat’ev, I.I. Interannual and seasonal variability of the transboundary flow of technogenic pollutants in the Russian Far East. Vestn. Far East Branch Russ. Acad. Sci. 2018, 2, 110–118. [Google Scholar]
  28. Khodzher, T.V.; Zhamsueva, G.S.; Zayakhanov, A.S.; Dementeva, A.L.; Tsydypov, V.V.; Balin, Y.S.; Penner, I.E.; Kokhanenko, G.P.; Nasonov, S.V.; Klemasheva, M.G.; et al. Ship-Based Studies of Aerosol-Gas Admixtures over Lake Baikal Basin in Summer 2018. Atmos. Ocean. Opt. 2019, 32, 434–441. [Google Scholar] [CrossRef]
  29. ARL NOAA. Atmospheric Resource Laboratory NOAA. Available online: http://www.arl.noaa.gov (accessed on 2 October 2021).
  30. Reid, J.; Koppmann, R.; Eck, T.; Eleuterio, D. A review of biomass burning emissions. Part 2: Intensive physical properties of biomass burning particles. Atmos. Chem. Phys. 2005, 5, 799–825. [Google Scholar] [CrossRef] [Green Version]
  31. Urbanski, S.P.; Hao, W.M.; Baker, S. Chemical Composition of Wildland Fire Emissions. Dev. Environ. Sci. 2009, 8, 79–107. [Google Scholar] [CrossRef]
  32. Bodí, M.B.; Martin, D.A.; Balfour, V.N.; Santín, C.; Doerr, S.H.; Pereira, P.; Cerdà, A.; Mataix-Solera, J. Wildland fire ash: Production, composition and eco-hydro-geomorphic effects. Earth Sci. Rev. 2014, 130, 103–127. [Google Scholar] [CrossRef]
  33. Popovicheva, O.B.; Kozlov, V.S.; Rakhimov, R.F.; Shmargunov, V.P.; Kireeva, E.D.; Persiantseva, N.M.; Timofeev, M.A.; Engling, G.; Eleftheriadis, K.; Diapouli, E.; et al. Optical-Microphysical and Physical-Chemical Characteristics of Siberian Biomass Burning: Experiments in Aerosol Chamber. Atmos. Ocean. Opt. 2016, 29, 323–331. [Google Scholar] [CrossRef]
  34. Rudnick, R.L.; Gao, S. Composition of the continental crust. In Treatise on Geochemistry; Holland, H.D., Turekian, K.K., Eds.; Elsevier: Amsterdam, The Netherlands, 2003; Volume 3, pp. 1–64. [Google Scholar]
  35. Khodzher, T.V.; Sorokovikova, L.M. An assessment of the entry of soluble substances from the atmosphere and with the river runoff into Lake Baikal. Geogr. Nat. Resour. 2007, 3, 185–191. [Google Scholar]
  36. Weather in Listvyanka, Irkutsk Region. Available online: https://rp5.ru (accessed on 2 September 2020).
  37. Netsvetaeva, O.G.; Chipanina, E.V.; Obolkin, V.A.; Zimnik, E.A.; Sezko, N.P.; Lopatina, I.N.; Khodzher, T.V. Peculiarities of chemistry of atmospheric precipitation at station Listvyanka (Irkutsk region) and Primorskaya (Primorye territory). Atmos. Ocean. Opt. 2013, 26, 466–471. [Google Scholar]
  38. Paramonov, S.; Ryaboshapko, A.; Gromov, S.; Granat, L.; Rodhe, H. Sulfur and Nitrogen Compounds in Air and Precipitation over the Former Soviet Union in 1980–1995; Report CM-95; Department of Meteorology, Stockhol University: Stockgolm, Sweden, 1999; p. 42. [Google Scholar]
  39. Sizova, L.N.; Kuimova, L.N.; Shimaraev, M.N. Influence of the atmospheric circulation on ice-thermal processes on Baikal during 1950–2010. Geogr. Nat. Resour. 2017, 2, 74–83. [Google Scholar] [CrossRef]
Figure 1. Map of Lake Baikal and its ecological zones, and location of the Listvyanka station [10]. Photo by V.A. Obolkin.
Atmosphere 12 01357 g001
Figure 2. Interannual variability in gross emissions into the atmosphere in the Irkutsk region from stationary and mobile sources (thousand tons per year), the average area of one wildfire (ha), and the median values of the concentration of the sum of ions in the atmospheric aerosols at the Listvyanka station from 2000 to 2020 [19,21].
Atmosphere 12 01357 g002
Figure 3. Seasonal variability in the sum of ions at the Listvyanka station in 2020 compared to the mean monthly ionic concentrations in periods from 2000 to 2004, from 2005 to 2009, and from 2010 to 2017.
Atmosphere 12 01357 g003
Figure 4. Satellite images with smoke plumes from wildfires, 8 August 2020 [29].
Atmosphere 12 01357 g004
Figure 5. The fractional contribution of ions to the formation of the chemical composition of atmospheric aerosols at the Listvyanka station during different observation periods.
Atmosphere 12 01357 g005
Figure 6. Interannual variability of the average monthly sum of ions (mg/L) and the amount of precipitation (mm) at the Listvyanka station in 2020.
Atmosphere 12 01357 g006
Figure 7. Frequency of different pH values in precipitation at the Listvyanka station from 2005 to 2009 (A), and from 2014 to 2020 (B).
Atmosphere 12 01357 g007
Figure 8. Seasonal dynamics of precipitation: weighted average pH values in precipitation at the Listvyanka station.
Atmosphere 12 01357 g008
Figure 9. The average annual flux of ions entering the underlying surface of the Listvyanka station via atmospheric aerosols (mg·m−2year−1).
Atmosphere 12 01357 g009
Table 1. Mean monthly concentrations and standard deviations of the ionic concentrations in atmospheric aerosols at the Listvyanka station in 2020 (µg· m−3).
MonthNa+NH4+K+Mg2+Ca2+ClNO3SO42−
January0.04 ± 0.030.18 ± 0.160.012 ± 0.0140.003 ± 0.0040.05 ± 0.040.02 ± 0.020.014 ± 0.0170.63 ± 0.42
February0.04 ± 0.020.07 ± 0.060.008 ± 0.0100.002 ± 0.0010.06 ± 0.020.02 ± 0.010.011 ± 0.0210.44 ± 0.18
March0.03 ± 0.010.11 ± 0.070.005 ± 0.0090.002 ± 0.0020.09 ± 0.070.04 ± 0.040.043 ± 0.0860.35 ± 0.06
April0.05 ± 0.030.02 ± 0.030.015 ± 0.0270.003 ± 0.0030.04 ± 0.020.05 ± 0.010.024 ± 0.0460.22 ± 0.10
May0.02 ± 0.010.00 ± 0.000.000 ± 0.0000.002 ± 0.0010.03 ± 0.020.02 ± 0.010.012 ± 0.0170.20 ± 0.11
June0.03 ± 0.030.07 ± 0.050.003 ± 0.0060.001 ± 0.0000.03 ± 0.020.01 ± 0.010.000 ± 0.0000.14 ± 0.07
July0.14 ± 0.180.17 ± 0.110.216 ± 0.2660.002 ± 0.0030.09 ± 0.140.08 ± 0.080.000 ± 0.0000.52 ± 0.51
August0.09 ± 0.080.08 ± 0.040.032 ± 0.0720.004 ± 0.0060.05 ± 0.040.08 ± 0.050.000 ± 0.0000.42 ± 0.25
September0.03 ± 0.010.06 ± 0.060.007 ± 0.0130.002 ± 0.0010.04 ± 0.020.02 ± 0.010.000 ± 0.0000.17 ± 0.07
October0.02 ± 0.010.05 ± 0.030.000 ± 0.0000.001 ± 0.0000.02 ± 0.010.01 ± 0.010.000 ± 0.0000.11 ± 0.02
November0.01 ± 0.010.03 ± 0.020.045 ± 0.0940.001 ± 0.0010.02 ± 0.010.02 ± 0.020.005 ± 0.0060.13 ± 0.06
December0.21 ± 0.320.23 ± 0.450.379 ± 0.0920.001 ± 0.0000.03 ± 0.030.06 ± 0.040.047 ± 0.0410.44 ± 0.27
Table 2. Mean monthly volume-weighted ion concentrations in atmospheric precipitation, and their standard deviations, at the Listvyanka station in 2020.
MonthHCO3SO42−NO3ClNa+K+Ca2+Mg2+NH4+
January0 ± 01.68 ± 0.653.13 ± 0.920.42 ± 0.210.21 ± 0.040.15 ± 0.060.90 ± 0.180.12 ± 0.040.21 ± 0.10
February0 ± 02.57 ± 1.273.86 ± 0.980.19 ± 0.040.27 ± 0.030.16 ± 0.031.28 ± 0.550.17 ± 0.050.20 ± 0.09
March0.7 ± 1.03.39 ± 1.413.15 ± 1.320.36 ± 0.070.39 ± 0.170.35 ± 0.151.49 ± 0.770.21 ± 0.080.46 ± 0.25
April0.6 ± 0.45.96 ± 4.223.24 ± 3.340.44 ± 0.330.58 ± 0.530.27 ± 0.182.03 ± 1.130.37 ± 0.160.88 ± 1.00
May0.1 ± 0.31.37 ± 1.520.75 ± 1.660.22 ± 0.170.09 ± 0.070.16 ± 0.210.41 ± 0.750.09 ± 0.190.14 ± 0.32
June0.3 ± 0.43.10 ± 1.110.85 ± 0.380.14 ± 0.070.10 ± 0.050.70 ± 0.560.66 ± 0.370.18 ± 0.140.32 ± 0.17
July0 ± 01.21 ± 0.740.54 ± 0.820.14 ± 0.100.09 ± 0.070.13 ± 0.160.23 ± 0.220.04 ± 0.050.19 ± 0.25
August0.04 ± 1.271.09 ± 0.600.34 ± 0.260.07 ± 0.080.07 ± 0.070.06 ± 0.320.08 ± 0.190.02 ± 0.070.20 ± 0.27
September0 ± 00.74 ± 1.910.24 ± 0.740.04 ± 0.120.06 ± 0.070.05 ± 0.130.09 ± 0.410.02 ± 0.090.12 ± 0.34
October0.6 ± 0.01.04 ± 0.000.98 ± 0.000.15 ± 0.000.17 ± 0.000.17 ± 0.000.49 ± 0.000.08 ± 0.000.24 ± 0.00
November0.3 ± 0.82.31 ± 1.181.54 ± 0.340.27 ± 0.080.23 ± 0.030.35 ± 0.200.74 ± 0.130.22 ± 0.150.55 ± 0.42
December0.2 ± 0.32.21 ± 0.872.72 ± 1.320.41 ± 0.260.34 ± 0.170.11 ± 0.041.33 ± 0.530.16 ± 0.100.28 ± 0.07
Table 3. Interannual variability of the ionic concentrations in the composition of precipitation at the Listvyanka station (in the numerator—mg/L; in the denominator—%).
PeriodHCO3SO42−NO3ClNa+K+Ca2+Mg2+NH4+H+
2000–2010 0.43 2.4 2.49 28.1 1.85 16.0 0.25 3.1 0.16 3.2 0.16 1.6 0.80 19.1 0.11 4.4 0.42 10.8 0.008 10.9
2011–2019 0.32 1.7 2.92 28.4 2.04 14.3 0.23 3.4 0.16 3.2 0.19 2.2 0.96 19.1 0.13 4.4 0.42 11.4 0.008 10.6
2020 0.23 1.6 2.41 26.1 1.80 13.5 0.25 4.0 0.20 4.5 0.24 3.3 0.78 17.5 0.14 5.1 0.38 10.9 0.008 10.9
Table 4. Rates of deposition of substances on the surface [38].
MonthJanuaryFebruaryMarchAprilMayJuneJulyAugustSeptemberOctoberNovemberDecember
Rate, cm/s0.10.10.10.20.30.30.30.30.30.20.20.1
Table 5. The average monthly sum of ions entering the underlying surface of the Listvyanka station via atmospheric aerosols (mg·m−2·month−1).
PeriodJanuaryFebruaryMarchAprilMayJuneJuly AugustSeptemberOctoberNovemberDecember
2000–201010.510.010.328.727.025.917.421.014.714.48.08.3
2011–20196.05.35.210.18.510.19.99.05.46.04.04.6
20202.51.51.52.02.21.78.46.41.90.81.13.6
Table 6. Monthly wet depositions of ions and their sums (∑ions) at the Listvyanka station in 2020 (mg·m−2·month−1).
MonthionsHCO3SO42−NO3ClNa+K+Ca2+Mg2+NH4+H+
January74018.133.84.52.31.69.81.32.30.16
February47013.920.81.11.40.86.90.91.10.05
March916.129.527.43.13.43.112.91.84.00.05
April562.223.212.61.72.31.17.91.53.40.01
May1704.170.738.411.44.68.321.24.57.00.66
June1306.763.217.42.92.114.213.43.66.50.40
July175082.236.99.26.48.915.32.813.11.09
August2535.8140.143.18.98.48.110.22.625.72.66
September120065.821.83.55.64.27.61.410.31.27
October40.61.11.10.20.20.20.50.10.30.00
November311.611.17.41.31.11.73.61.02.70.02
December731.520.825.63.83.21.012.51.52.70.03
Table 7. Wet depositions of ions at the Listvyanka station during different periods (mg·m−2·year−1).
PeriodSO42−NO3ClNa+K+Ca2+Mg2+NH4+H+
2000–2010712 ± 151493 ± 20565 ± 2336 ± 2737 ± 20182 ± 16426 ± 11125 ± 376.2 ± 1.7
2011–2019629 ± 192387 ± 20853 ± 2631 ± 3235 ± 12153 ± 14921 ± 7117 ± 585.5 ± 1.9
202053728852415412023806.4
Table 8. Average interannual fluxes of sulphur and nitrogen entering the surface of the Listvyanka station via aerosols and precipitation (mg·m−2year−1).
PeriodAerosolPrecipitation
2000–20102011–201920202000–20102011–20192020
N31.511.10.9209179127
S34.116.46.5235207177
Publisher’s Note: MDPI stays neutral with regard to jurisdictional claims in published maps and institutional affiliations.

